Attached files
| file | filename |
|---|---|
| 8-K - FORM 8-K - General Motors Co | d8k.htm |
| EX-99.1 - NEWS RELEASE DATED AUGUST 9, 2011 - General Motors Co | dex991.htm |
Exhibit 99.2

 FORWARD LOOKING STATEMENTS
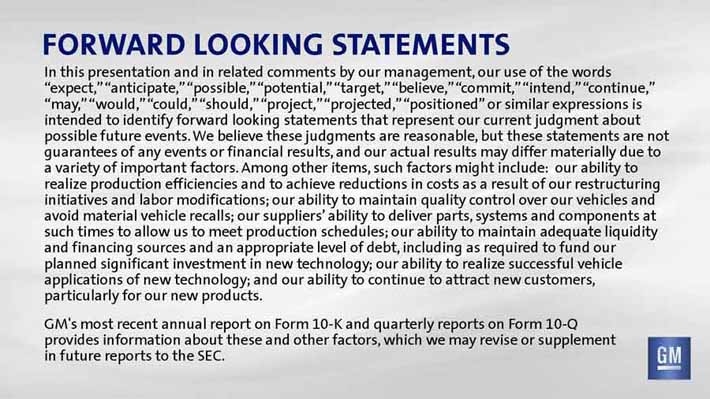
In this presentation and in related comments by our management, our use of the words
“expect,” “anticipate,” “possible,” “potential,” “may,” “would,” “could,” “should,” “project,” intended to identify forward looking statements that represent our current judgment about possible future events. We believe these judgments are reasonable, but these statements are not guarantees of any events or financial results, and our actual results may differ materially due to a variety of important factors. Among other items, such factors might include: our ability to realize production efficiencies and to achieve reductions in costs as a result of our restructuring initiatives and labor modifications; our ability to maintain quality control over our vehicles and avoid material vehicle recalls; our suppliers’ such times to allow us to meet production schedules; our ability to maintain adequate liquidity and financing sources and an appropriate level of debt, including as required to fund our planned significant investment in new technology; our ability to realize successful vehicle applications of new technology; and our ability to continue to attract new customers, particularly for our new products. GM’s most recent annual report on Form 10-K and quarterly reports on Form 10-Q provides information about these and other factors, which we may revise or supplement in future reports to the SEC.
 AGENDA
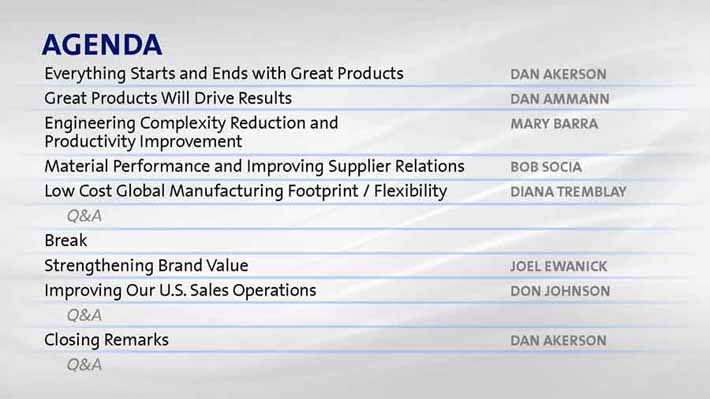
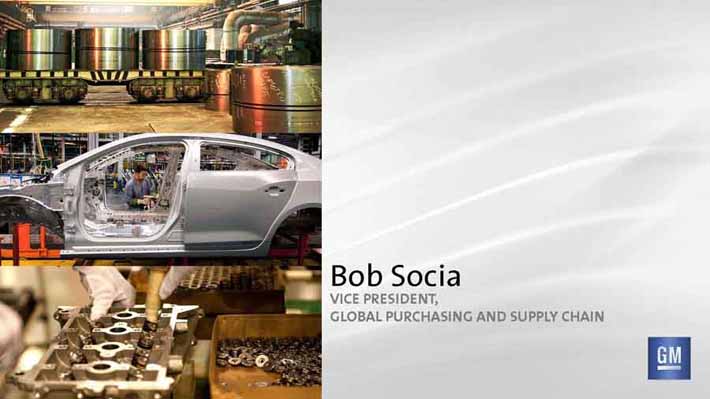
Everything Starts and Ends with Great Products DAN AKERSON Great Products Will Drive Results DAN AMMANN Engineering Complexity Reduction and MARY BARRA Productivity Improvement Material Performance and Improving Supplier Relations BOB SOCIA Low Cost Global Manufacturing Footprint / Flexibility DIANA TREMBLAY
Q&A
Break
Strengthening Brand Value JOEL EWANICK Improving Our U.S. Sales Operations DON JOHNSON
Q&A
Closing Remarks DAN AKERSON
Q&A
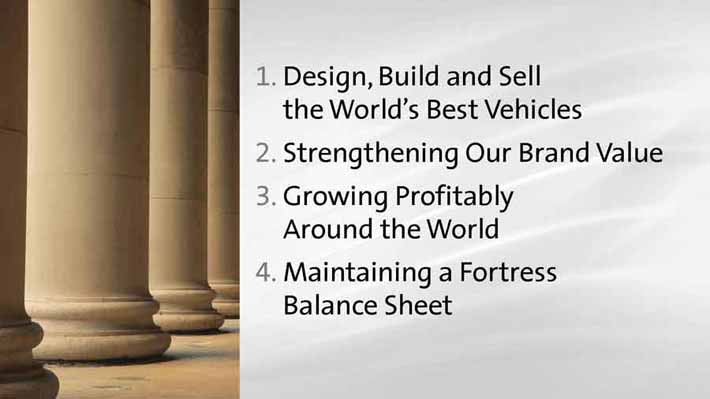 1. Design, Build and Sell the World’s
2. Strengthening Our Brand Value
3. Growing Profitably Around the World
4. Maintaining a Fortress Balance Sheet
 KEY MESSAGES
¶Long-term sustainable results
¶Path to achieve strong margins
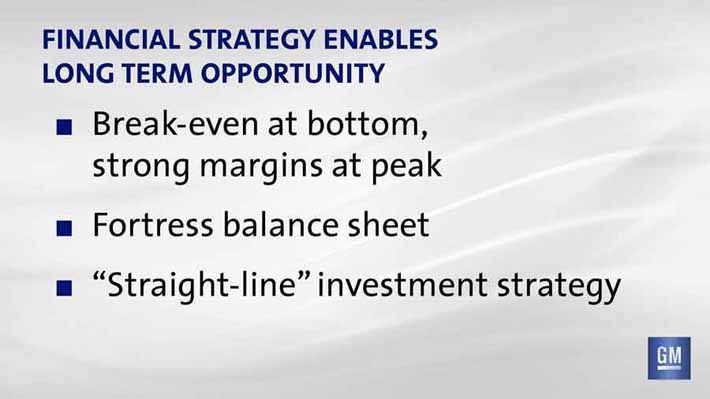 FINANCIAL STRATEGY ENABLES LONG TERM OPPORTUNITY
¶ Break-even at bottom, strong margins at peak
¶ Fortress balance sheet
¶ “Straight-line”
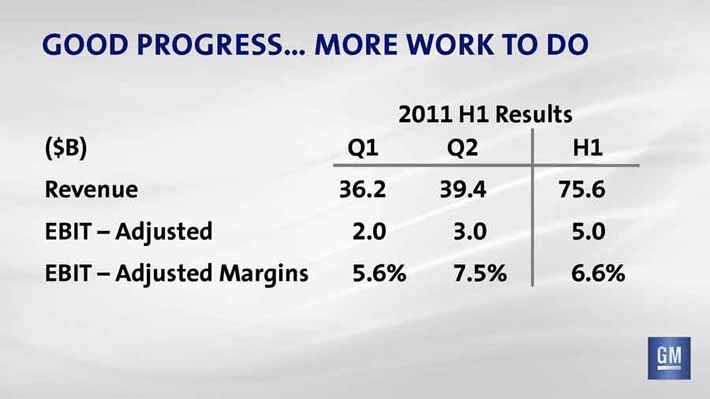 GOOD PROGRESS… MORE
2011 H1 Results
($B) Q1 Q2 H1 Revenue 36.2 39.4 75.6 EBIT – Adjusted 2.0 3.0 5.0 EBIT – Adjusted Margins 5.6% 7.5% 6.6%
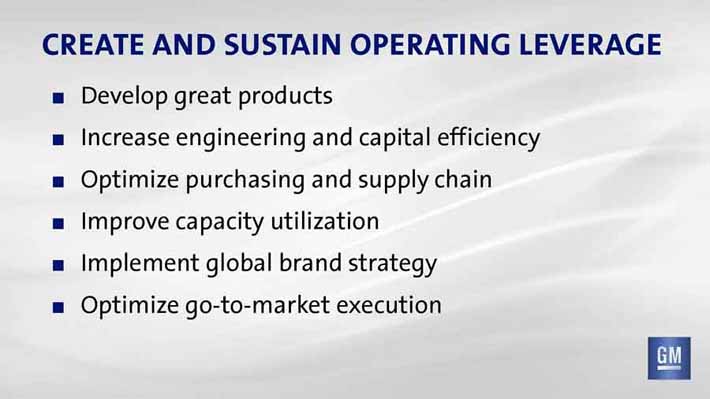 CREATE AND SUSTAIN OPERATING LEVERAGE
¶ Develop great products
¶ Increase engineering and capital efficiency
¶ Optimize purchasing and supply chain
¶ Improve capacity utilization
¶ Implement global brand strategy
¶ Optimize go-to-market execution
KEY MESSAGES
¶Long-term sustainable results
¶Path to achieve strong margins

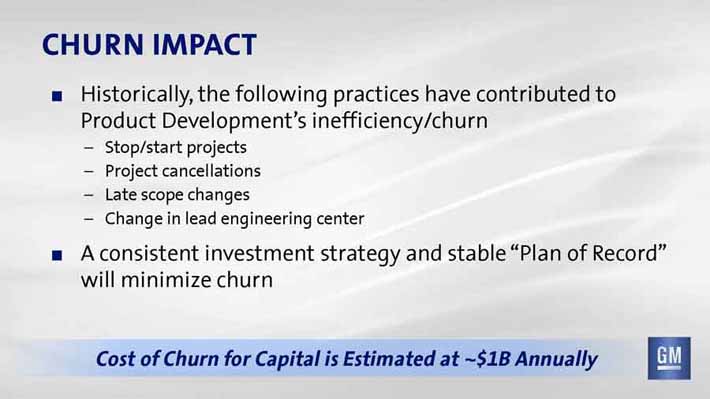 CHURN IMPACT
¶ Historically, the following practices have contributed to
Product Development’s
– Stop/start projects
– Project cancellations
– Late scope changes
– Change in lead engineering center
¶ A consistent investment will minimize churn
Cost of Churn for Capital is Estimated at ~$1B Annually
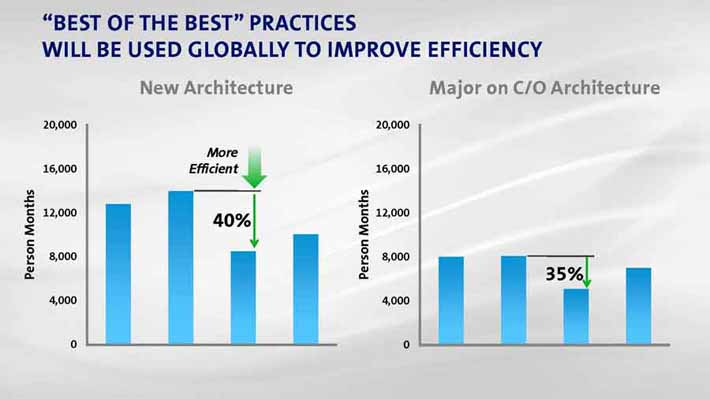
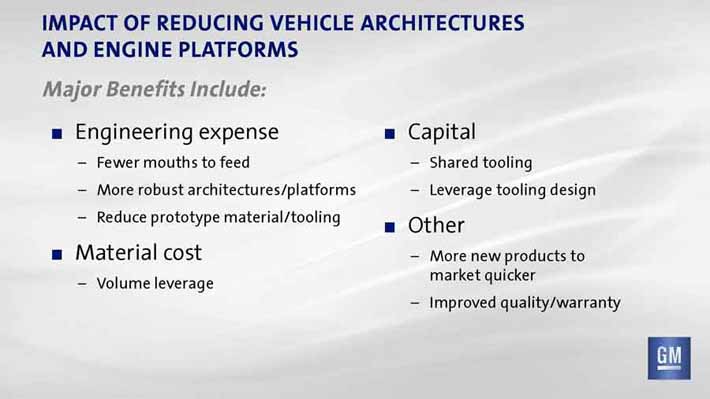 IMPACT OF REDUCING VEHICLE ARCHITECTURES AND ENGINE PLATFORMS
Major Benefits Include:
¶ Engineering expense ¶ Capital
– Fewer mouths to feed – Shared tooling
– More robust architectures/platforms – Leverage tooling design
– Reduce prototype material/tooling
¶ Other
¶ Material cost – More new products to market quicker
– Volume leverage
– Improved quality/warranty
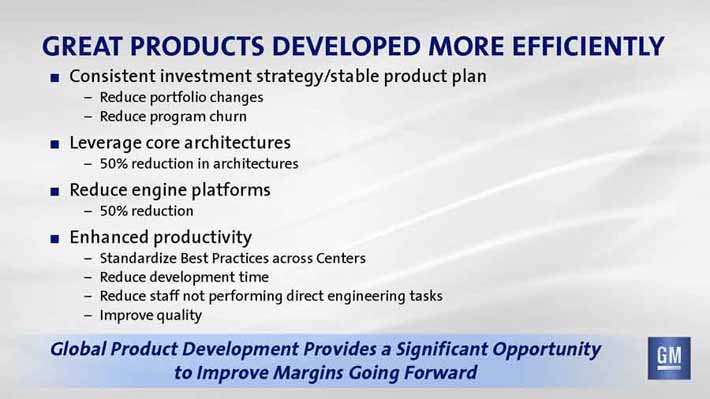 GREAT PRODUCTS DEVELOPED MORE EFFICIENTLY
¶ Consistent investment strategy/stable product plan
–Reduce portfolio changes
–Reduce program churn
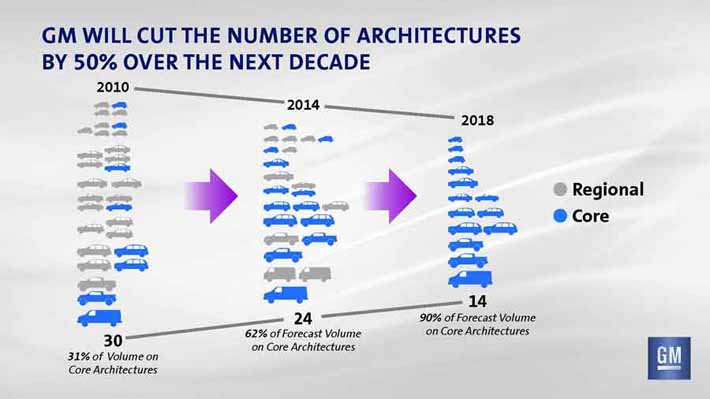
¶ Leverage core architectures
–50% reduction in architectures
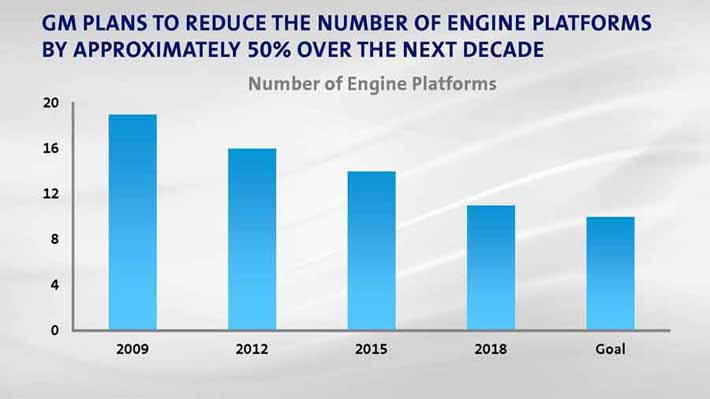
¶ Reduce engine platforms
–50% reduction
¶ Enhanced productivity
–Standardize Best Practices across Centers
–Reduce development time
–Reduce staff not performing direct engineering tasks
–Improve quality
Global Product Development Provides a Significant Opportunity to Improve Margins Going Forward
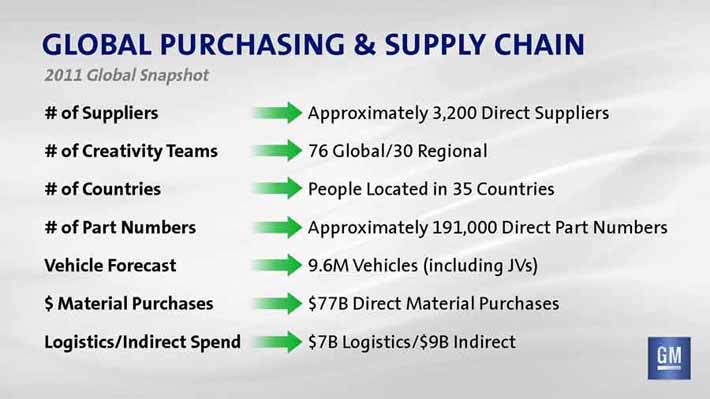 GLOBAL PURCHASING & SUPPLY CHAIN
2011 Global Snapshot
# of Suppliers Approximately 3,200 Direct Suppliers # of Creativity Teams 76 Global/30 Regional # of Countries People Located in 35 Countries
# of Part Numbers Approximately 191,000 Direct Part Numbers Vehicle Forecast 9.6M Vehicles (including JVs) $ Material Purchases $77B Direct Material Purchases Logistics/Indirect Spend $7B Logistics/$9B Indirect
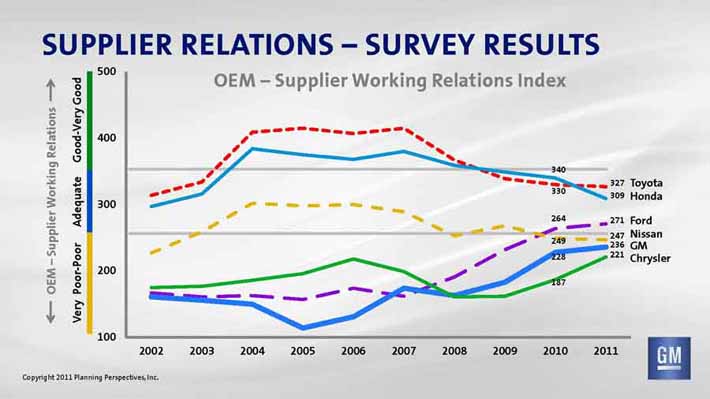
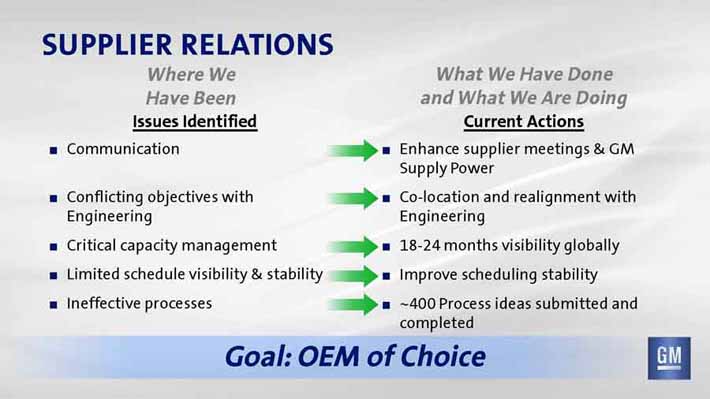 SUPPLIER RELATIONS
Where We What We Have Done Have Been and What We Are Doing
Issues Identified Current Actions
¶ Communication ¶ Enhance supplier meetings & GM
Supply Power
¶ Conflicting objectives with ¶ Co-location and realignment with Engineering Engineering
¶ Critical capacity management ¶ 18-24 months visibility globally
¶ Limited schedule visibility & stability ¶ Improve scheduling stability
¶ Ineffective processes ¶ ~400 Process ideas submitted and completed
Goal: OEM of Choice
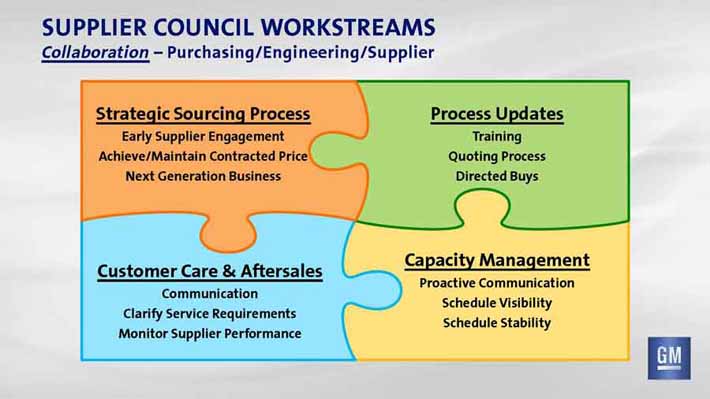 SUPPLIER COUNCIL WORKSTREAMS
Collaboration –Purchasing/Engineering/Supplier
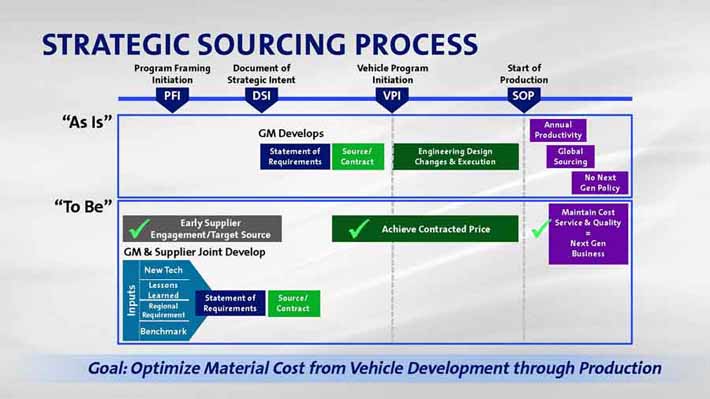
Strategic Sourcing Process Process Updates
Early Supplier Engagement Training Achieve/Maintain Contracted Price Quoting Process Next Generation Business Directed Buys
Capacity Management Customer Care & Aftersales
Proactive Communication Communication Schedule Visibility Clarify Service Requirements Schedule Stability Monitor Supplier Performance
 MANUFACTURING ENABLING
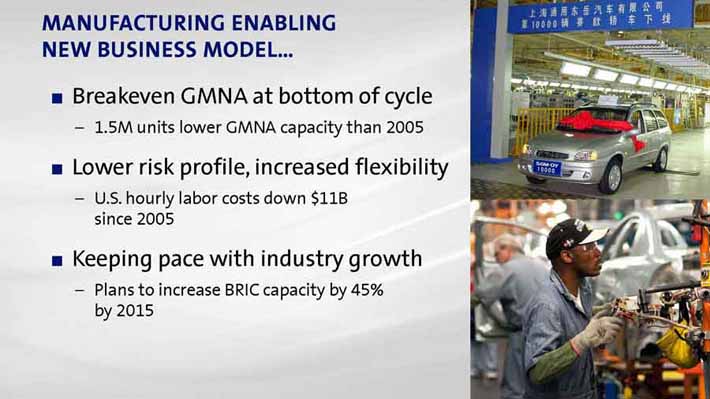
NEW BUSINESS MODEL…
¶Breakeven GMNA at bottom of cycle
– 1.5M units lower GMNA capacity than 2005
¶Lower risk profile, increased flexibility
– U.S. hourly labor costs down $11B since 2005
¶Keeping pace with industry growth
– Plans to increase BRIC capacity by 45% by 2015
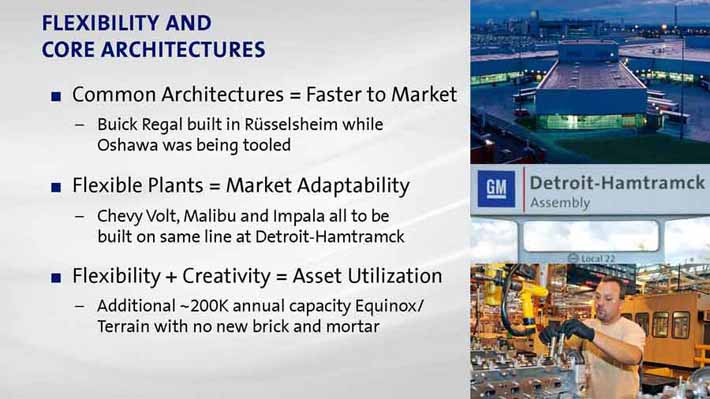 FLEXIBILITY AND CORE ARCHITECTURES
¶ Common Architectures = Faster to Market
– Buick Regal built in Rüsselsheim while Oshawa was being tooled
¶ Flexible Plants = Market Adaptability
– Chevy Volt, Malibu and Impala all to be built on same line at Detroit-Hamtramck
¶ Flexibility + Creativity = Asset Utilization
– Additional ~200K annual capacity Equinox/ Terrain with no new brick and mortar

Over 50% of 2015 production will be built in a
FLEXIBLE NETWORK of
plants that connects across
Core Architectures and Regions
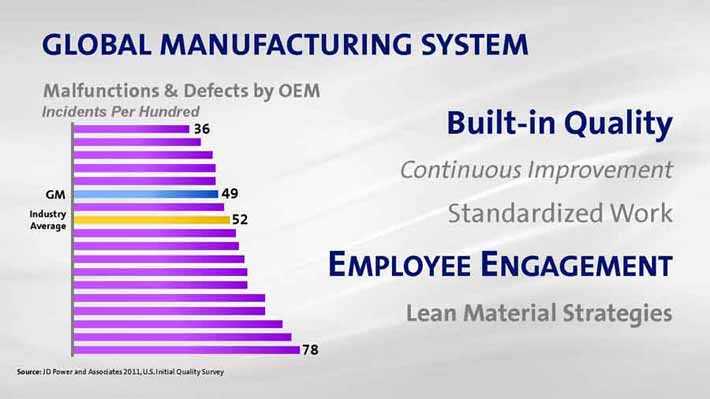 GLOBAL MANUFACTURING SYSTEM
Built-in Quality
Continuous Improvement
Standardized Work
EMPLOYEE ENGAGEMENT
Lean Material Strategies
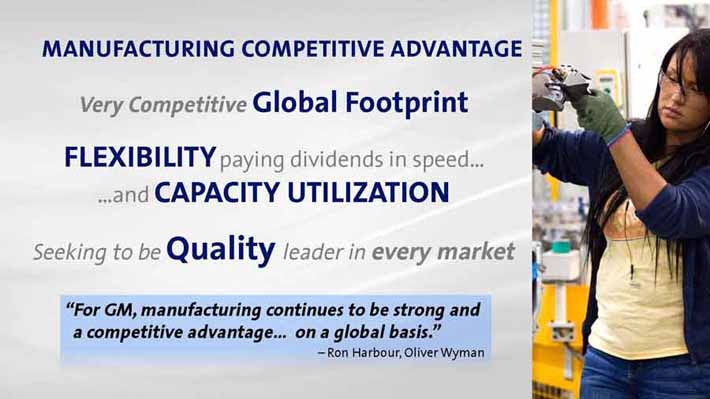 MANUFACTURING COMPETITIVE ADVANTAGE
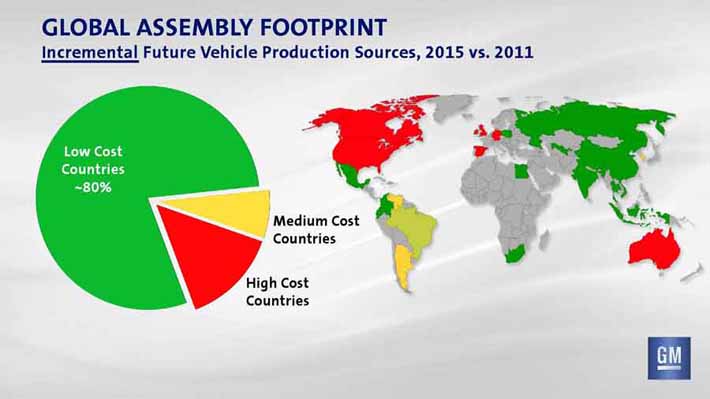
Very Competitive Global Footprint
FLEXIBILITYpaying dividends
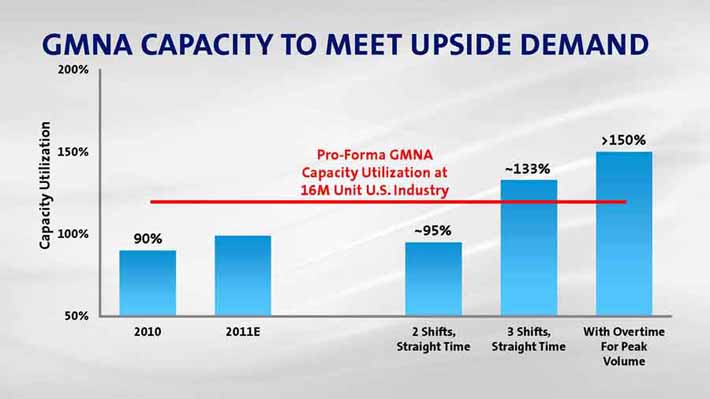
…andCAPACITY UTILIZATION
Seeking to be Quality leader in every market
“For GM, manufacturing a competitive advantage…
–Ron Harbour, Oliver Wyman
 GM GLOBAL BRAND STRATEGY
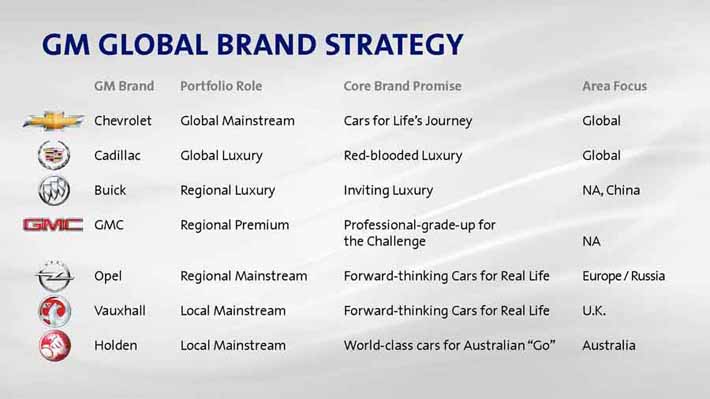
GM Brand Portfolio Role Core Brand Promise Area Focus
Chevrolet Global Mainstream Cars for Life’s JourneyGlobal
Cadillac Global Luxury Red-blooded Luxury Global
Buick Regional Luxury Inviting Luxury NA, China
GMC Regional Premium Professional-grade-up for the Challenge NA
Opel Regional Mainstream Forward-thinking Cars for Real Life Europe / Russia
Vauxhall Local Mainstream Forward-thinking Cars for Real Life U.K.
Holden Local Mainstream World-class cars for AustralianAustralia
 GLOBAL STRATEGY BUILT AROUND CHEVROLET & CADILLAC
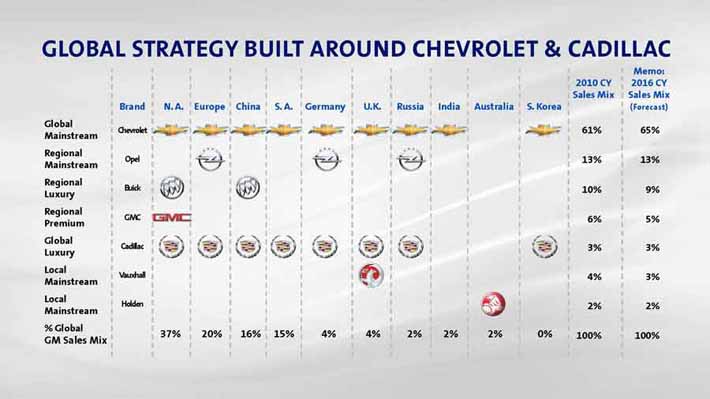
Memo: 2010 CY 2016 CY Sales Mix Sales Mix Brand N. A. Europe China S. A. Germany U.K. Russia India Australia S. Korea (Forecast) Global Chevrolet 61% 65% Mainstream Regional Opel 13% 13% Mainstream Regional Buick 10% 9% Luxury Regional GMC 6% 5% Premium Global Cadillac 3% 3% Luxury Local Vauxhall 4% 3% Mainstream Local Holden 2% 2% Mainstream
% Global
37% 20% 16% 15% 4% 4% 2% 2% 2% 0% 100% 100% GM Sales Mix
 U.S. LUXURY BRAND POSITIONING
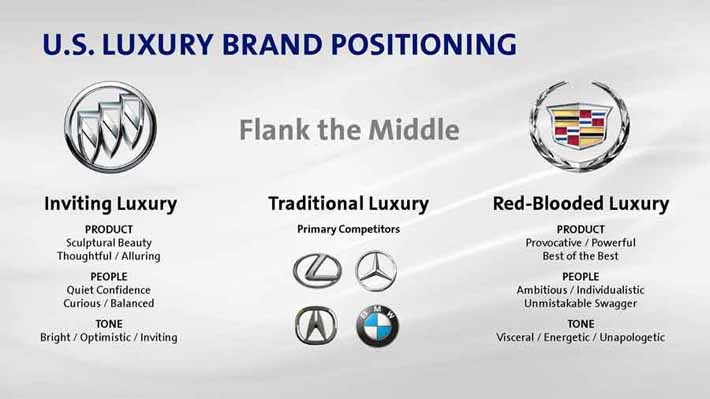
Flank the Middle
Inviting Luxury Traditional Luxury Red-Blooded Luxury
PRODUCT Primary Competitors PRODUCT
Sculptural Beauty Provocative / Powerful Thoughtful / Alluring Best of the Best
PEOPLE PEOPLE
Quiet Confidence Ambitious / Individualistic Curious / Balanced Unmistakable Swagger
TONE TONE
Bright / Optimistic / Inviting Visceral / Energetic / Unapologetic
 EUROPE BRAND POSITIONING
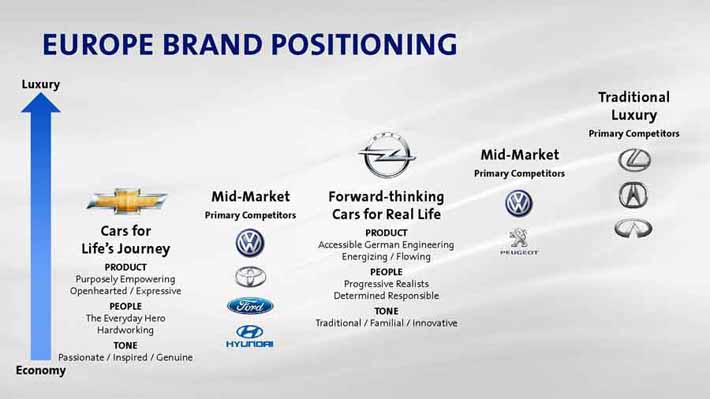
Luxury Traditional Luxury
Primary Competitors
Mid-Market
Primary Competitors
Mid-Market Forward-thinking
Primary Competitors Cars for Real Life
Cars for PRODUCT
Life’s Journey Accessible German Engineering Energizing / Flowing
PRODUCT
PEOPLE
Purposely Empowering
Progressive Realists Openhearted / Expressive Determined Responsible
PEOPLE
TONE
The Everyday Hero
Traditional / Familial / Innovative Hardworking
TONE
Passionate / Inspired / Genuine
Economy
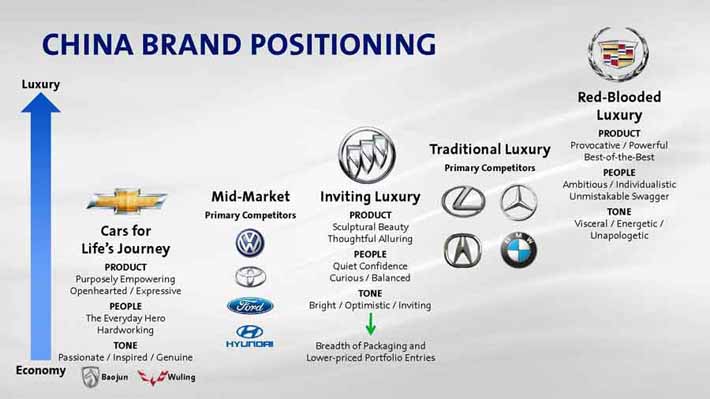 CHINA BRAND POSITIONING
Luxury Red-Blooded Luxury
PRODUCT Traditional Luxury Provocative / Powerful Best-of-the-Best
Primary Competitors
PEOPLE
Ambitious / Individualistic
Mid-Market Inviting Luxury Unmistakable Swagger
Primary Competitors PRODUCT TONE
Cars for Sculptural Beauty Visceral / Energetic / Thoughtful Alluring Unapologetic
Life’s Journey PEOPLE
PRODUCT Quiet Confidence Purposely Empowering Curious / Balanced Openhearted / Expressive TONE
PEOPLE Bright / Optimistic / Inviting The Everyday Hero Hardworking TONE Breadth of Packaging and Passionate / Inspired / Genuine Lower-priced Portfolio Entries
Economy
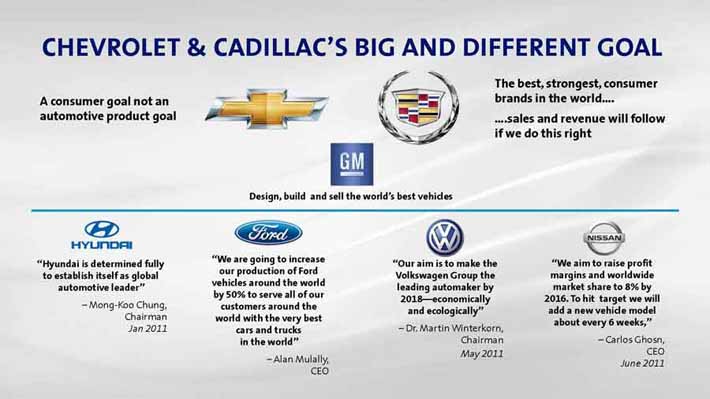 CHEVROLET & CADILLAC’S
The best, strongest, consumer A consumer goal not an brands in the world…. automotive product goal ….salesand revenue will follow if we do this right
Design, build and sell the world’s best
We are going to increase Our aim is to make We the aim to Hyundai is determined fully our production of Ford Volkswagen Group the margins and worldwide to establish itself as global vehicles around the world leading automaker by market share to 8% by automotive leader by 50% to serve all of our 2018—economically 2016. To hit target we will –Mong-Koo Chung, customers around the and ecologically add a new vehicle model Chairman world with the very best about every 6
Jan 2011 cars and trucks –Dr. Martin Winterkorn, in the world Chairman –Carlos Ghosn,
May 2011 CEO
–Alan Mulally, June 2011 CEO
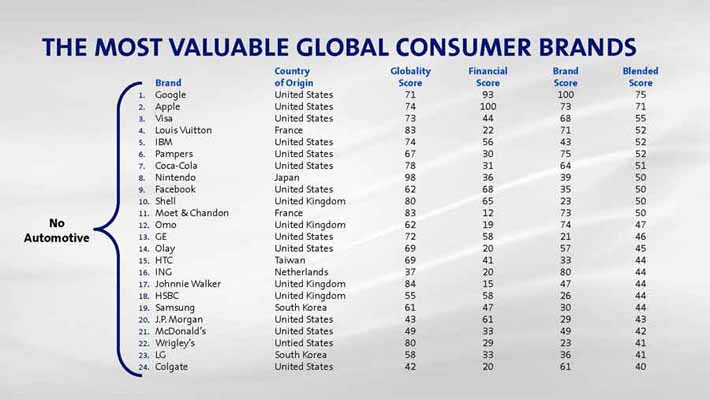 THE MOST VALUABLE GLOBAL CONSUMER BRANDS
Country Globality Financial Brand Blended Brand of Origin Score Score Score Score
| 1. |
Google United States 71 93 100 75 |
2. Apple United States 74 100 73 71
3. Visa United States 73 44 68 55
4. Louis Vuitton France 83 22 71 52
5. IBM United States 74 56 43 52
6. Pampers United States 67 30 75 52
7. Coca-Cola United States 78 31 64 51
8. Nintendo Japan 98 36 39 50
9. Facebook United States 62 68 35 50
10. Shell United Kingdom 80 65 23 50
11. Moet & Chandon France 83 12 73 50 No 12. Omo United Kingdom 62 19 74 47 Automotive 13. GE United States 72 58 21 46
14. Olay United States 69 20 57 45
15. HTC Taiwan 69 41 33 44
16. ING Netherlands 37 20 80 44
17. Johnnie Walker United Kingdom 84 15 47 44
18. HSBC United Kingdom 55 58 26 44
19. Samsung South Korea 61 47 30 44
20. J.P. Morgan United States 43 61 29 43
21. McDonald’s United States 49 33 49 42
22. Wrigley’s Untied States 80 29 23 41
23. LG South Korea 58 33 36 41
24. Colgate United States 42 20 61 40
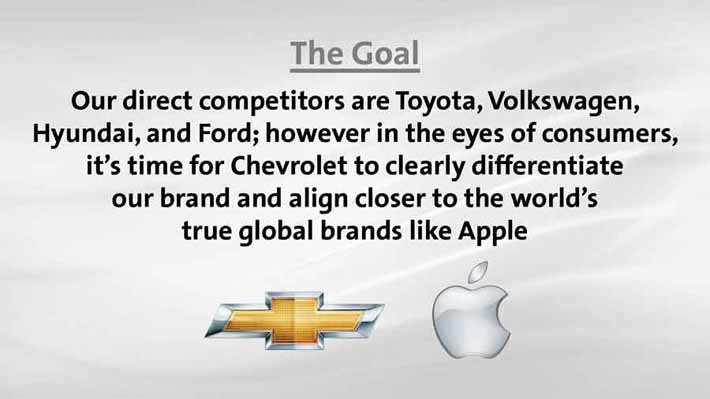
The GoalOur direct competitors are Toyota, Volkswagen, Hyundai, and Ford; however in the eyes of consumers, it’s time for Chevrolet our brand and align true global brands like Apple
 OVERALL IMPLICATIONS
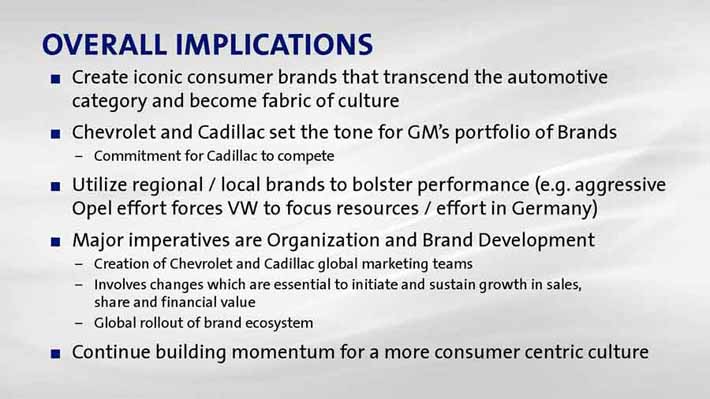
¶ Create iconic consumer brands that transcend the automotive category and become fabric of culture
¶ Chevrolet and Cadillac set the
– Commitment for Cadillac to compete
¶ Utilize regional / local brands to bolster performance (e.g. aggressive Opel effort forces VW to focus resources / effort in Germany)
¶ Major imperatives are Organization and Brand Development
– Creation of Chevrolet and Cadillac global marketing teams
– Involves changes which are essential to initiate and sustain growth in sales, share and financial value
– Global rollout of brand ecosystem
¶ Continue building momentum for a more consumer centric culture
 2011 INDUSTRY OUTLOOK
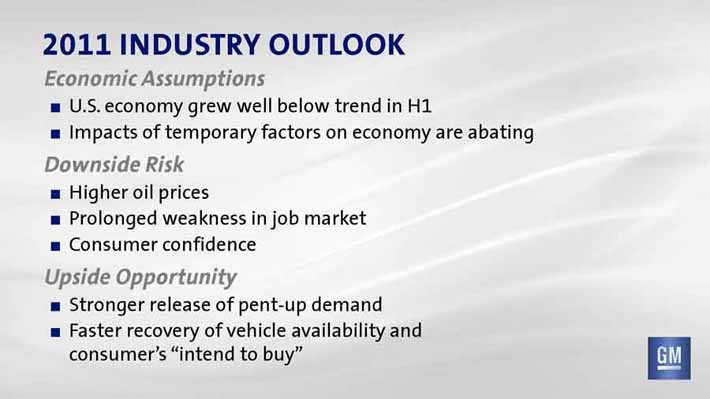
Economic Assumptions
¶ U.S. economy grew well below trend in H1
¶ Impacts of temporary factors on economy are abating
Downside Risk
¶ Higher oil prices
¶ Prolonged weakness in job market
¶ Consumer confidence
Upside Opportunity
¶ Stronger release of pent-up demand
¶ Faster recovery of vehicle availability and consumer’s “intend to
 KEY INITIATIVES
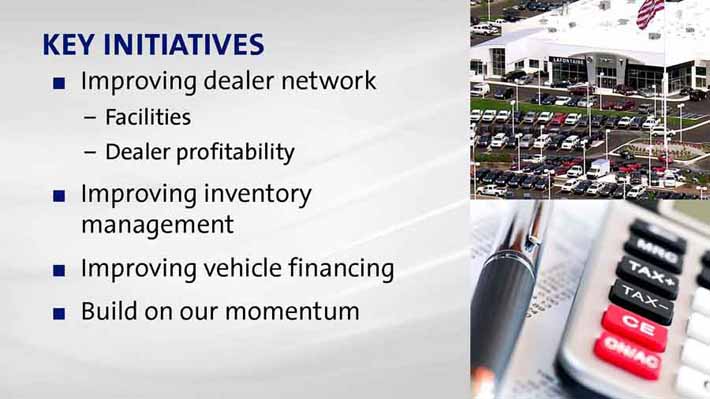
¶ Improving dealer network
–Facilities
–Dealer profitability
¶ Improving inventory management
¶ Improving vehicle financing
¶ Build on our momentum
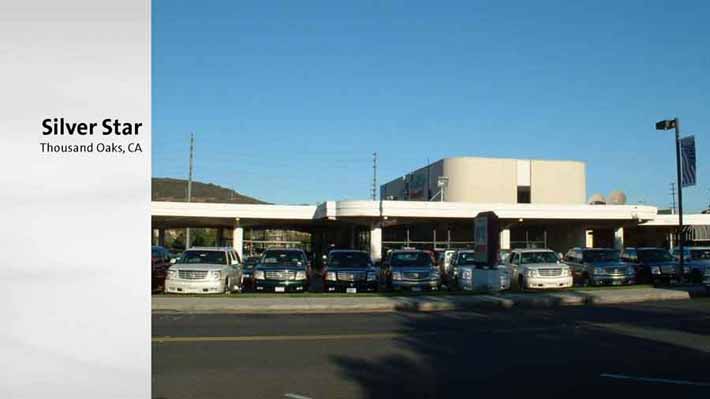
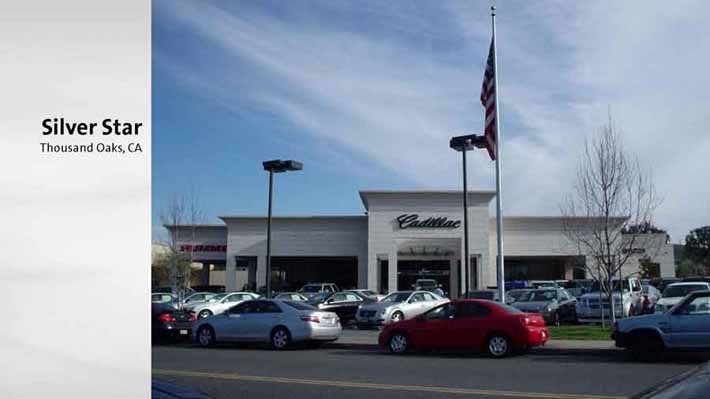
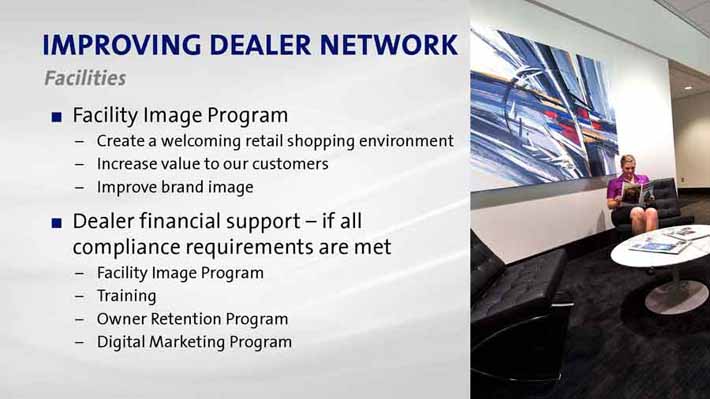 IMPROVING DEALER NETWORK
Facilities
¶ Facility Image Program
– Create a welcoming retail shopping environment
– Increase value to our customers
– Improve brand image
¶ Dealer financial support –if all compliance requirements are met
– Facility Image Program
– Training
– Owner Retention Program
– Digital Marketing Program
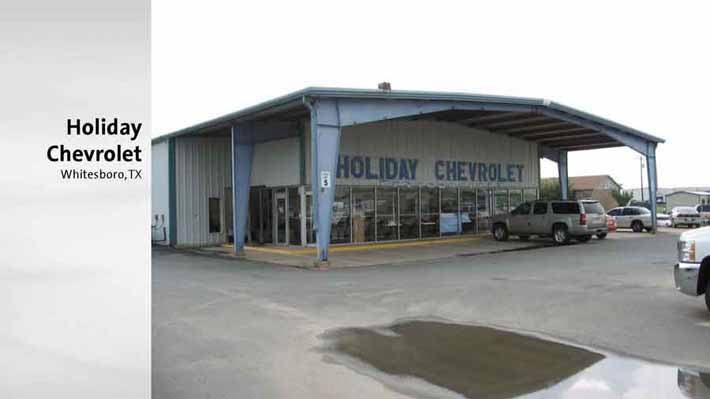
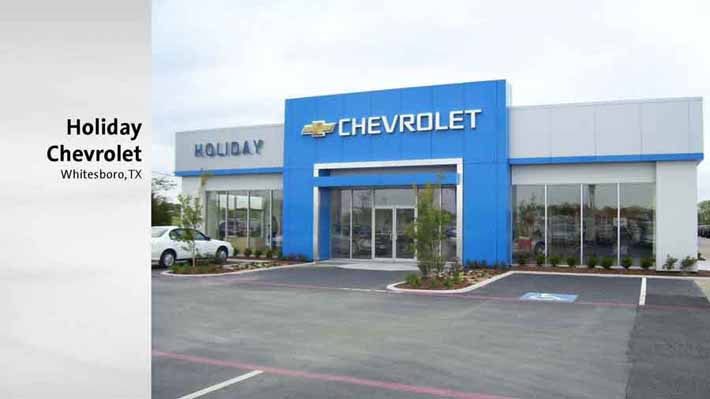

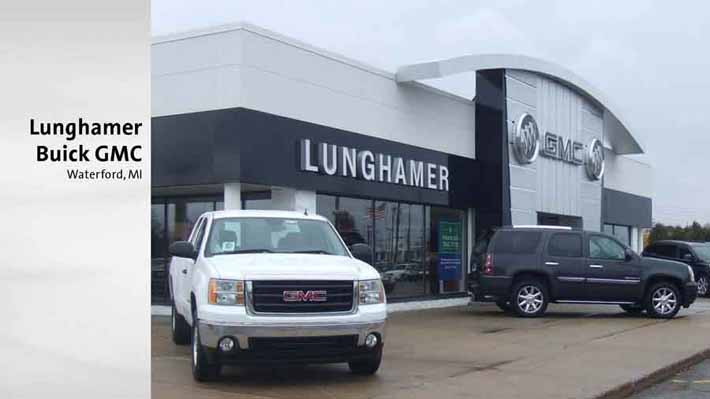
 IMPROVING DEALER NETWORK
Facility Image Timeline
¶ 460+ imaged facilities by CYE 2011
¶ 4,000+ completions projected by end of 2014
–96% of dealerships currently enrolled, representing 99% of retail volume
 IMPROVING DEALER NETWORK
Profitability
¶ New vehicle retail throughput ¶ Return on sales
–493 (2011 annualized) –Up 0.9 points since 2009
Up 49% since 2009 At industry average CYTD** Highest domestic OEM*
¶ Percent dealers profitable ¶ Return on assets
–92.8%, up 15 points –Up 2.2 points vs. 2009 since 2009
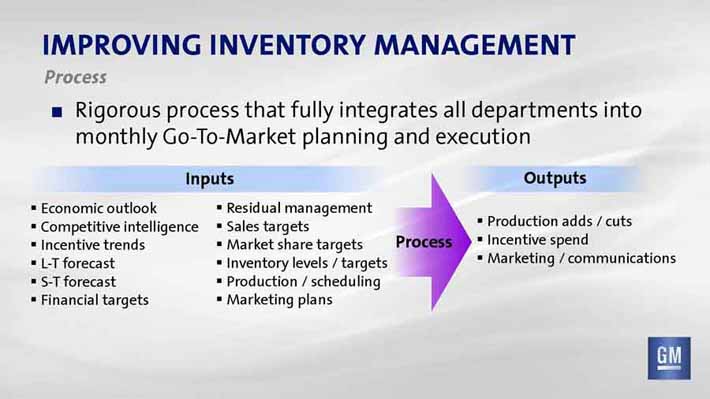 IMPROVING INVENTORY MANAGEMENT
Process
¶ Rigorous process that fully integrates all departments into monthly Go-To-Market planning and execution
Inputs Outputs
Economic outlook Residual management
Competitive intelligence Sales targets Production adds / cuts Incentive trends Market share targets Process Incentive spend L-T forecast Inventory levels / targets Marketing / communications S-T forecast Production / scheduling
Financial targets Marketing plans
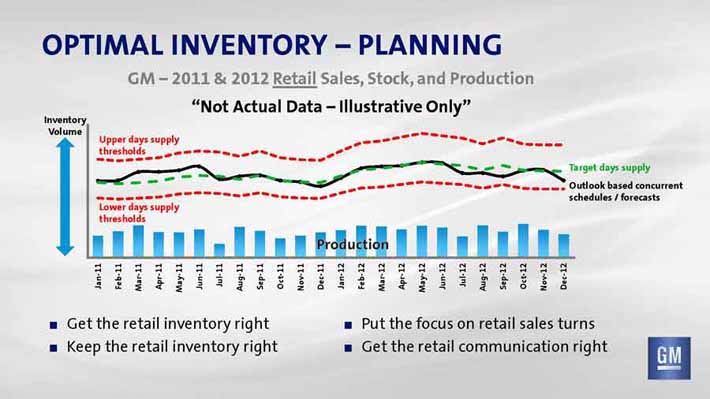 OPTIMAL INVENTORY – PLANNING
GM – 2011 & 2012 Retail Sales, Stock, and Production
Not Actual – Illustrative Data Only
¶ 
KeepGet Jan-11
the
Feb-11
the retail Mar-11
Apr-11
retail
May-11
Jun-11
inventory Jul-11 inventory Aug-11
right right Sep-11 Oct-11
Nov-11
Dec-11
¶ ¶ Jan-12 Feb-12 Get Put Mar-12 the the Apr-12 May-12
retail focus Jun-12
on Jul-12 Aug-12
retail Sep-12
Oct-12 sales Nov-12
communication Dec-12 right turns
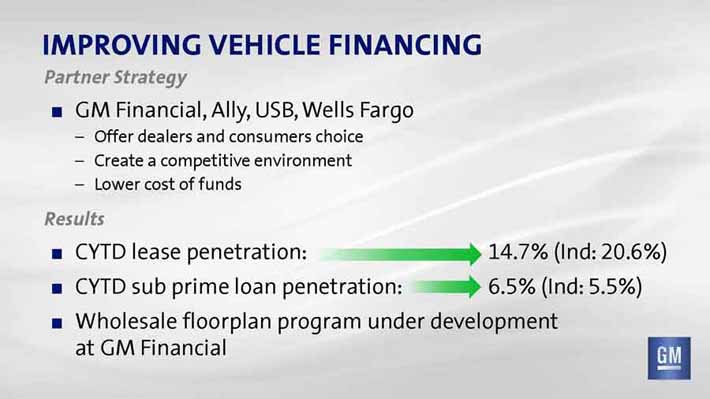 IMPROVING VEHICLE FINANCING
Partner Strategy
¶ GM Financial, Ally, USB, Wells Fargo
–Offer dealers and consumers choice
–Create a competitive environment
–Lower cost of funds
Results
¶ CYTD lease penetration: 14.7% (Ind: 20.6%)
¶ CYTD sub prime loan penetration: 6.5% (Ind: 5.5%)
¶ Wholesale floorplan program under development at GM Financial
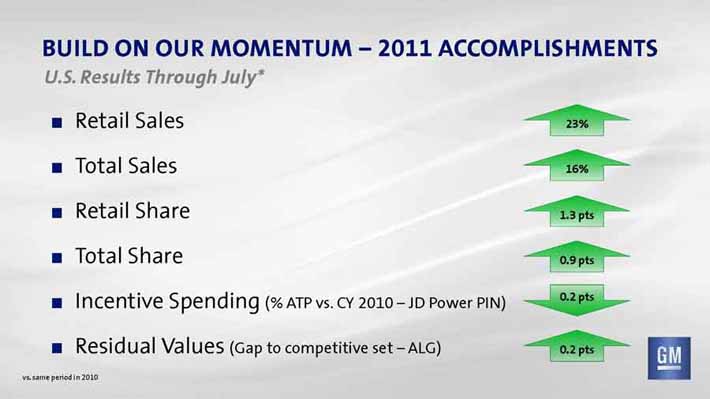 BUILD ON OUR MOMENTUM –2011 ACCOMPLISHMENTS
U.S. Results Through July*
¶ Retail Sales 23%
¶ Total Sales 16%
¶ Retail Share 1.3 pts
¶ Total Share 0.9 pts
¶ Incentive Spending (% ATP vs. CY 2010 –JD Power PIN) 0.2 pts
¶ Residual Values (Gap to competitive set –ALG) 0.2 pts
vs. same period in 2010