Attached files
| file | filename |
|---|---|
| 8-K - FORM 8-K - PEABODY ENERGY CORP | c65753e8vk.htm |
| 6th Annual Jefferies Global Industrial and A&D Conference Vic Svec Senior Vice President Investor Relations & Corporate Communications August 10, 2011 Exhibit 99.1 |

| Statement on Forward-Looking Information 2 Some of the following information contains forward-looking statements within the meaning of Section 27A of the Securities Act of 1933 and Section 21E of the Securities Exchange Act of 1934, as amended, and is intended to come within the safe-harbor protection provided by those sections. Our forward-looking statements are based on numerous assumptions that the company believes are reasonable, but they are open to a wide range of uncertainties and business risks that may cause actual results to differ materially from expectations as of July 19, 2011. These factors are difficult to accurately predict and may be beyond the company's control. The company does not undertake to update its forward-looking statements. Factors that could affect the company's results include, but are not limited to: demand for coal in the United States and the seaborne thermal and metallurgical coal markets; price volatility and demand, particularly in higher-margin products and in our trading and brokerage businesses; impact of weather and natural disasters on demand, production and transportation; reductions and/or deferrals of purchases by major customers and ability to renew sales contracts; credit and performance risks associated with customers, suppliers, co-shippers, trading, banks and other financial counterparties; geologic, equipment, permitting and operational risks related to mining; transportation availability, performance and costs; availability, timing of delivery and costs of key supplies, capital equipment or commodities such as diesel fuel, steel, explosives and tires; successful implementation of business strategies, including our Btu Conversion and generation development initiatives; negotiation of labor contracts, employee relations and workforce availability; changes in postretirement benefit and pension obligations and funding requirements; replacement and development of coal reserves; availability, access to and the related cost of capital and financial markets; effects of changes in interest rates and currency exchange rates (primarily the Australian dollar); effects of acquisitions or divestitures; economic strength and political stability of countries in which we have operations or serve customers; legislation, regulations and court decisions or other government actions, including new environmental requirements, changes in income tax regulations or other regulatory taxes; litigation, including claims not yet asserted; and other risks detailed in the company's reports filed with the Securities and Exchange Commission (SEC). The use of "Peabody," "the company," and "our" relate to Peabody, its subsidiaries and majority-owned affiliates. EBITDA or Adjusted EBITDA is defined as income from continuing operations before deducting net interest expense, income taxes, asset retirement obligation expense, and depreciation, depletion and amortization. EBITDA, which is not calculated identically by all companies, is not a substitute for operating income, net income or cash flow as determined in accordance with United States generally accepted accounting principles. Management uses EBITDA as a key measure of operating performance and also believes it is a useful indicator of the company's ability to meet debt service and capital expenditure requirements. Adjusted EPS is defined as diluted earnings per share excluding the impact of the remeasurement of foreign income tax accounts. Management has included this measurement because, in management's opinion, excluding such impact is a better indicator of the company's ongoing effective tax rate and diluted earnings per share, and is therefore more useful in comparing the company's results with prior and future periods. 07/19/11 |
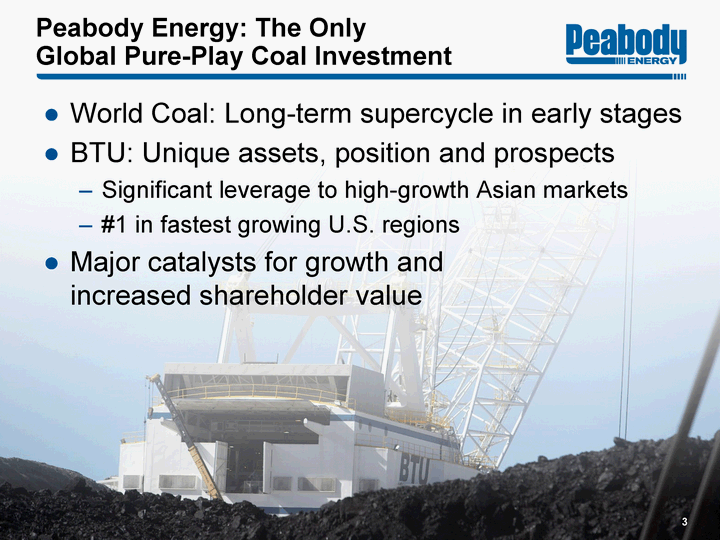
| Peabody Energy: The Only Global Pure-Play Coal Investment World Coal: Long-term supercycle in early stages BTU: Unique assets, position and prospects Significant leverage to high-growth Asian markets #1 in fastest growing U.S. regions Major catalysts for growth and increased shareholder value 3 |

| 2011: Targeting Significant Growth Second quarter 2011 increases: Revenues +21% EBITDA +32% EPS +61% Liquidity of $2.7 billion Targeting 2011 EBITDA of $2.3 - $2.5 billion Targeting 2011 EPS of $4.20 to $4.60 4 Peabody EBITDA $ in Millions EPS is adjusted diluted EPS from continuing operations. Liquidity as of June 30, 2011. $910 $1,815 2006 2007 2008 2009 2010 2011 Target $2,300 - $2,500 |

| Early Stages of Coal Supercycle |

| Coal: Entering the Early Stages of a Long-Term Supercycle 6 Coal: The World's Fastest Growing Fuel for Past Decade Source: BP Statistical Review of World Energy, June 2011. Coal +48% Growth in Major Energy Forms (2000 - 2010) Natural Gas +31% Oil +13% Hydro +29% Nuclear +7% |
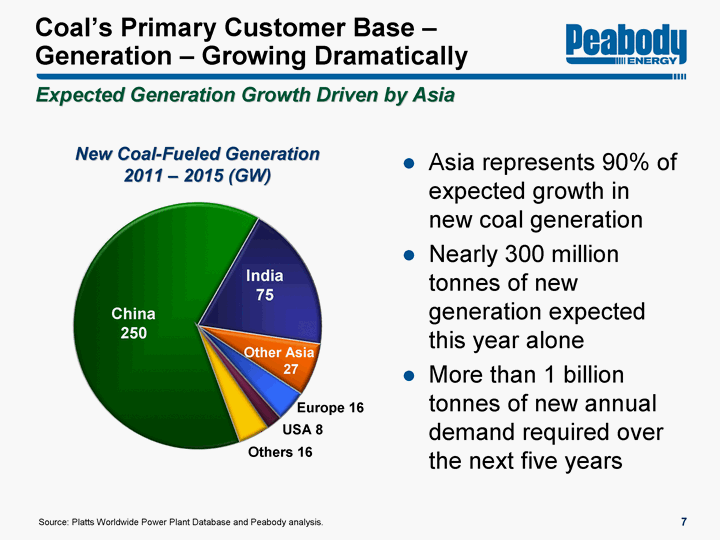
| Coal's Primary Customer Base - Generation - Growing Dramatically Source: Platts Worldwide Power Plant Database and Peabody analysis. Expected Generation Growth Driven by Asia New Coal-Fueled Generation 2011 - 2015 (GW) China 250 India 75 Other Asia 27 USA 8 Others 16 Asia represents 90% of expected growth in new coal generation Nearly 300 million tonnes of new generation expected this year alone More than 1 billion tonnes of new annual demand required over the next five years 7 Europe 16 |

| Seaborne Thermal Coal: Demand Expected to Outpace Supply 8 Expected Increase in Seaborne Thermal Demand 2010 - 2015 India China Other Pacific Atlantic Expected Increase in Seaborne Thermal Supply 2010 - 2015 Australia Indonesia Russia S. Africa Colombia Other Source: Peabody analysis. 2010 2015 2010 2015 50-75 Million Tonne Shortfall |
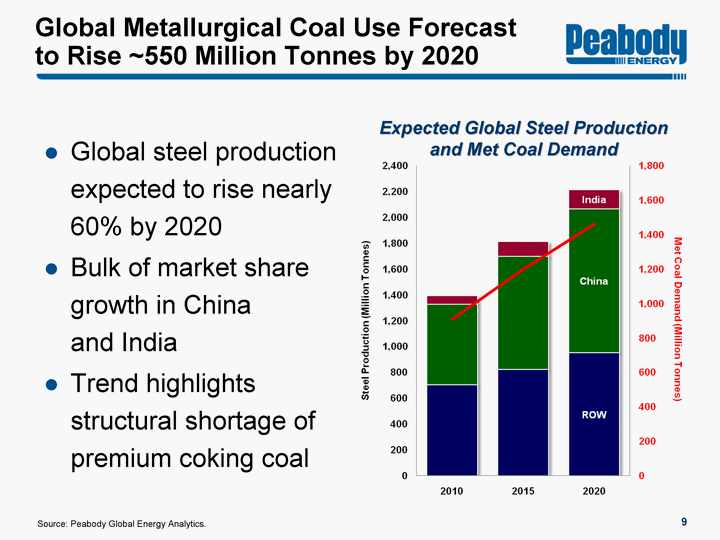
| Global Metallurgical Coal Use Forecast to Rise ~550 Million Tonnes by 2020 Global steel production expected to rise nearly 60% by 2020 Bulk of market share growth in China and India Trend highlights structural shortage of premium coking coal 9 Expected Global Steel Production and Met Coal Demand Source: Peabody Global Energy Analytics. |

| Atlantic Australia Expected to Supply Majority of Global Met Coal Increase 10 Expected Increase in Seaborne Met Demand 2010 - 2015 Expected Increase in Seaborne Met Supply 2010 - 2015 Source: Peabody analysis. 65 - 75 Brazil India China Europe South Korea Japan 85 - 95 Australia Mongolia Other Pacific Russia GAP |

| Expected U.S. Coal Demand Change 2010 - 2015 (Tons in Millions) 60-70 45-55 (45-55) Estimates based on Peabody analysis and industry reports. Includes exports. CAPP Challenged by Permitting, Geology, Safety, Cost Structure CAPP ILB SPRB ILB Fastest Growing Region; PRB Growing To East and Far East PRB and Illinois Basin Expected to Grow as Appalachia Declines 11 |

| Peabody Well Positioned to Serve High-Growth Markets |

| 13 Current Seaborne Market Fundamentals Remain Strong China Electricity generation up 14% YTD Steel production up 10% YTD Coal import increases for four consecutive months; June imports up 14% YOY Government encouraging imports, considering VAT tax removal India Electricity generation up 8% YTD Thermal imports up 45% YTD Domestic production below targeted levels Europe June coal generation increased 13% YOY on nuclear cutbacks and high gas prices Pacific Markets Robust, Atlantic Demand on the Rise "China's power supplies will remain tight in some regions for the rest of the summer... Thermal power plants should proactively purchase thermal coal and increase coal imports, and try to generate power as much as possible..." - National Development and Reform Commission of China July 2011 Year-to-date information as of June 2011. Source: Industry reports and Peabody analysis. |

| Seaborne Coal Pricing Trending Upward 14 Newcastle Thermal Coal Source: Third party pricing data as of August 2, 2011. Unpriced positions as of July 19, 2011 earnings release. Pricing shown in dollars per metric ton. Benchmark Met Coal Prices Unpriced Position 2011: 2 - 3 million tons 2012 and beyond: 100% open Unpriced Position 2011: 1 - 2 million tons 2012: 75% - 80% open Peabody Levered to Rising Prices Through Australia Platform |
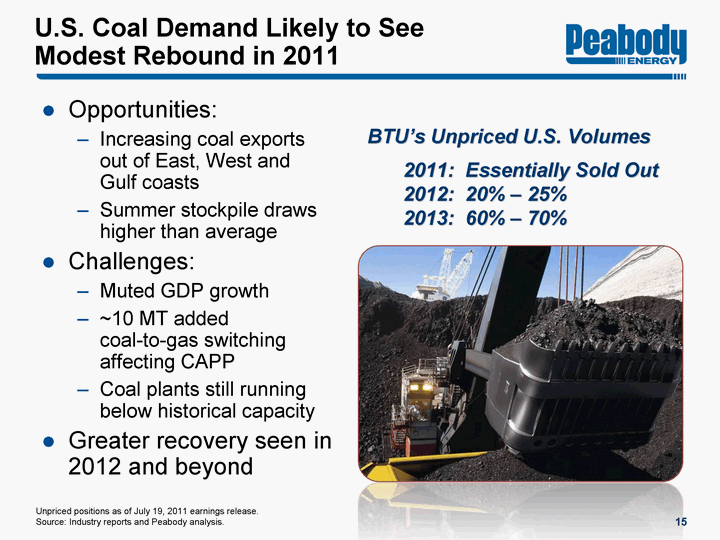
| U.S. Coal Demand Likely to See Modest Rebound in 2011 Opportunities: Increasing coal exports out of East, West and Gulf coasts Summer stockpile draws higher than average Challenges: Muted GDP growth ~10 MT added coal-to-gas switching affecting CAPP Coal plants still running below historical capacity Greater recovery seen in 2012 and beyond 15 BTU's Unpriced U.S. Volumes 2011: Essentially Sold Out 2012: 20% - 25% 2013: 60% - 70% Unpriced positions as of July 19, 2011 earnings release. Source: Industry reports and Peabody analysis. |
| BTU Targeting Multiple Growth Projects |
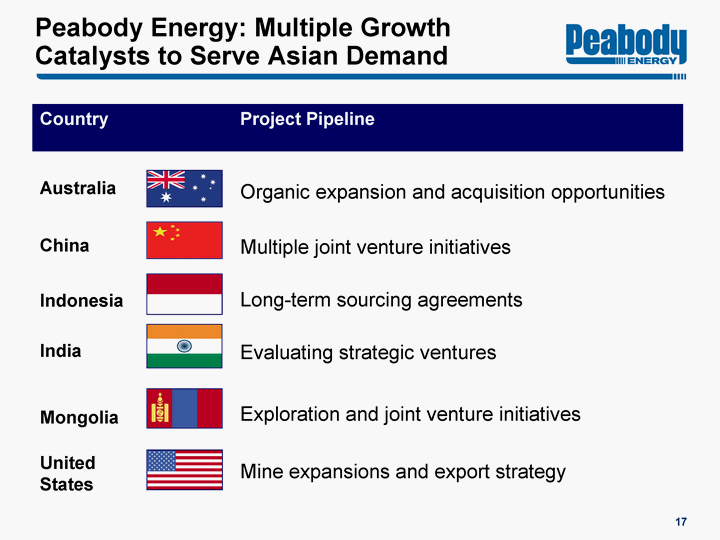
| Country Country Project Pipeline Australia Organic expansion and acquisition opportunities China Multiple joint venture initiatives Indonesia Long-term sourcing agreements India Evaluating strategic ventures Mongolia Exploration and joint venture initiatives United States Mine expansions and export strategy Peabody Energy: Multiple Growth Catalysts to Serve Asian Demand 17 |

| Peabody Expanding Australia Production to Serve Rising Demand 18 ~8.0 15.0 - 17.0 12.0 - 15.0 27.0 35.0 - 40.0 Tons in Millions Actual results may differ from forecast. Statement on forward-looking information detailed on slide 2. 8.3 Australia Platform Grows to 35 - 40 Million Tons Per Year by 2014 - 2015 Metallurgical Coal Seaborne Thermal Domestic Thermal 6.1 |

| Project S/U Quality Add'l Volume First Coal Full Production Metallurgical Coal Projects Metallurgical Coal Projects Metallurgical Coal Projects Metallurgical Coal Projects Metallurgical Coal Projects Metallurgical Coal Projects Burton S HCC 1 - 2 Late 2012 2014 Metropolitan U HCC 1 Late 2013 2014 - 2015 Millennium S SHCC/PCI 1 - 2 Late 2011 2012 Denham/ Goonyella Corridor S/U HQHCC 1 - 2 Late 2014 2015 5 - 6 Late 2015 Beyond 2015 Seaborne Thermal Coal Projects Seaborne Thermal Coal Projects Seaborne Thermal Coal Projects Seaborne Thermal Coal Projects Seaborne Thermal Coal Projects Seaborne Thermal Coal Projects Wilpinjong S Low Cost 2 - 3 Late 2011 2012 Wambo S/U Thermal/PCI ~3 Late 2011 2013 19 Major Expansions and Some Replacement Volumes Peabody's Australian Growth Projects Target Exports Short tons in millions. 'S' for surface, 'U' for underground. Additional volumes compared with 2010 sales offset by some depleting volumes. |

| Peabody Advancing Offer to Buy Macarthur Coal in Australia 20 World's Largest Seaborne Low-Vol PCI Producer Peabody and ArcelorMittal launch 60/40 joint venture to purchase Macarthur Coal (ASX: MCC) Offer of A$15.50 per share plus dividend of up to A$0.16 per share Takeover requires 50.01% Joint venture owns 16.1% interest through ArcelorMittal Actions: Proposal July 11 Due diligence granted July 14 Offer on August 1; MCC advises shareholders to take no action Bidder's statement filed August 4 Mailing to shareholders expected to begin within two weeks Peabody U Mine Peabody S Mine Macarthur S Mine Macarthur Development Port |

| Pursuing development of 50 million ton-per-year mine in Xinjiang Province Xinjiang: May be world's fastest growing coal region 100 million tons of production in 2010; may reach 1 billion tons per year by ~2025 Government supportive Committed to accelerate coal reserve allocations Urumqi Ulan Baataar Beijing Pursuing Development of Xinjiang Mine and Tavan Tolgoi Selected by Government of Mongolia Development of Western Block of TT ~1 billion tonnes of resources, most of which is expected to be met coal 21 Working to finalize structure and commercial terms Government approvals to follow Confirmation of rising global presence and high mining standards Xinjiang Mine Tavan Tolgoi |
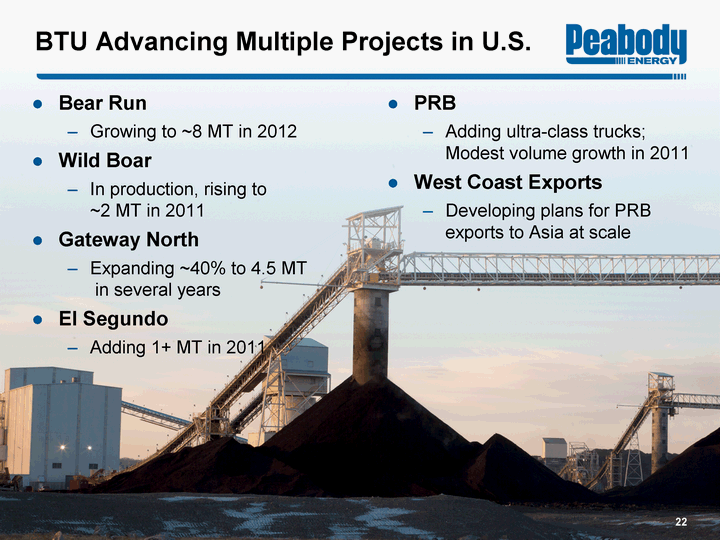
| BTU Advancing Multiple Projects in U.S. Bear Run Growing to ~8 MT in 2012 Wild Boar In production, rising to ~2 MT in 2011 Gateway North Expanding ~40% to 4.5 MT in several years El Segundo Adding 1+ MT in 2011 PRB Adding ultra-class trucks; Modest volume growth in 2011 West Coast Exports Developing plans for PRB exports to Asia at scale 22 |

| Peabody Secures Major Long-Term Agreement for PRB Exports to Asia Seaborne subbituminous volumes expected to rise 75% by 2015 Peabody access: Up to 24 MTPY Ultimate port capacity of 48 MTPY of coal; 54 MTPY of all commodities Permitting under way by SSA for deep-draft site in Cherry Point, Wash. Estimated cost of $500 million Projected 2015 startup Local business, labor and bipartisan support 23 Expands Opportunities for PRB to Serve Fastest Growing Markets MTPY represents million metric tons per year. |

| China GreenGen Mongolia Initiatives Wambo UG Exp. Wambo O/C Exp. New PRB Leases NARM Conveyor Indonesia Sourcing Denham/ Goonyella Corridor School Creek Sage Creek Millennium Expansion Burton Expansion Wilpinjong Prep Jakarta Beijing Twentymile Prep NARM Blending Facility Gateway North United States International 2006 Major Pipeline of Growth Projects 24 Wild Boar Bear Run Gateway El Segundo Excel Purchase London Singapore Metropolitan Expansion Acquisitions 2010 NARM Dragline West Coast Port Burton North Bear Run Expansion Global Exploration China Joint Ventures |

| BTU: Significant Upside to Shareholder Value A return to historical multiples represents significant upside Valuation growth driven by: Global expansion High-quality asset base Earnings leverage to rising seaborne prices Strong track record Current valuation ignores supercycle and prices BTU at late-cycle multiples 25 2010 Peabody One-Year Forward EV/EBITDA Multiple Five-Year Average Source: Forward multiples based on First Call data. Current range based on forward calendar year First Call data. |

| 6th Annual Jefferies Global Industrial and A&D Conference Vic Svec Senior Vice President Investor Relations & Corporate Communications August 10, 2011 |