Attached files
| file | filename |
|---|---|
| 8-K - FORM 8-K - NEWTEK BUSINESS SERVICES, INC. | d8k.htm |
| EX-99.1 - EXHIBIT 99.1 - NEWTEK BUSINESS SERVICES, INC. | dex991.htm |
| EX-99.2 - EXHIBIT 99.2 - NEWTEK BUSINESS SERVICES, INC. | dex992.htm |
 Newtek Business
Services, Inc. NASDAQ: NEWT
Second Quarter 2011
Financial Results Conference Call
August 10, 2011 4:15 PM
Hosted By:
Barry Sloane, CEO and Chairman
Jennifer C. Eddelson, CAO
Public Relations Contact:
Liz Petrova
Rubenstein Public Relations, Inc.
(212) 843-9335
lpetrova@rubensteinpr.com
Exhibit 99.3 |
 Safe Harbor
Statement The statements in this slide presentation including statements regarding anticipated
future financial performance, Newtek's beliefs, expectations, intentions or strategies for the
future, may be "forward-looking statements" under the Private Securities Litigation
Reform Act of 1995. All forward-looking statements involve a number of risks and
uncertainties that could cause actual results to differ materially from the plans, intentions
and expectations reflected in or suggested by the forward-looking statements. Such risks
and uncertainties include, among others, intensified competition,
operating
problems
and
their
impact
on
revenues
and
profit
margins,
anticipated
future business strategies and financial performance, anticipated future number of customers,
business prospects, legislative developments and similar matters. Risk factors, cautionary
statements and other conditions which could cause Newtek’s actual results to differ from
management's current expectations are contained in Newtek’s filings with the Securities and
Exchange
Commission
and
available
through
http://www.sec.gov
Our
Capcos
operate
under
a
different
set
of
rules
in
each
of
the
7
jurisdictions
and
these
place
varying requirements on the structure of our investments. In some cases, particularly in Louisiana
or in certain situations in New York, we do not control the equity or management of a qualified
business, but that cannot always be presented orally or in written presentations.
2 |
 Second Quarter 2011
Highlights Announce consolidated pretax income of $136 thousand for the quarter
ended June 30, 2011
Versus consolidated pretax income of $514 thousand for the quarter
ended June 30, 2010
•
The decline between quarters is primarily due to $466 thousand of non-
recurring expenses in the second quarter of 2011
Announce consolidated pretax income of $970 thousand for the six
months
ended June 30, 2011
Versus consolidated pretax loss of $(360) thousand for the six months
ended June 30, 2010
3 |
 Second Quarter 2011
Highlights Announce consolidated net loss of $(287) thousand for the quarter ended
June 30, 2011
Versus consolidated net income of $931 thousand for the quarter
ended June 30, 2010
•
The decrease to a net loss for the second quarter of 2011 was due to $466
thousand in non-recurring expense and a tax provision in 2011 as
compared to a tax benefit recorded in 2010
Announce consolidated net income of $222 thousand for the six months
ended June 30, 2011
Versus consolidated net income of $464 thousand for the six months
ended June 30, 2010
4 |
 Second Quarter 2011
Highlights Revised 2011 annual guidance range of:
$122.0 million to $124.8 million for consolidated revenue range
$1.5 million to $4.0 million for consolidated pretax income range
Announce 2012 annual guidance range of:
$121.9 million to $125.0 million for consolidated revenue range
$2.8 million to $6.1 million for consolidated pretax income range
Midpoint consolidated pretax income of $4.5 million
5 |
 Second Quarter 2011
Highlights Announce Q2 2011 consolidated revenue of $32.3 million
15% growth vs. Q2 2010 of $28.0 million
Primary Q2 2011 revenue trends in EPP and Managed Technology
Solutions exceed Q2 2010 comparisons
Combined EPP and Managed Technology Solutions revenue for Q2 2011 is
$25.5 million
•
Versus Q2 2010 of $25.2 million
•
1% growth
Small
Business
Finance
segment
posts
revenue
of
$6.3
million
for
Q2
2011
vs. $1.9 million for Q2 2010
Small Business Finance segment posts pretax income of $1.0 million for
Q2 2011 vs. pretax income of $557 thousand for Q2 2010
6 |
 Second Quarter 2011
Conference Call Agenda
Q2 2011 financial performance, cash position, balance sheet,
commentary, business trends, 2011 and 2012 guidance
Strategic mission as The Small Business Authority
New
website
launched:
www.thesba.com
(January
2011)
7 |
 Second Quarter
2011 Financial Results
Q2 2011 vs. Q2 2010 core operating segment revenue:
Electronic Payment Processing:
$20.7 million -
up 2% from Q2 2010
Managed Technology Solutions:
$4.8 million –
down 1% from Q2 2010
Small Business Finance:
$6.3 million –
up 224% from Q2 2010
Q2 2011 vs. Q2 2010 core operating segment pretax income:
Electronic Payment Processing:
$1.3 million -
down 2% from Q2 2010
Managed Technology Solutions:
$1.0 million -
down 16% from Q2 2010
Small Business Finance:
$1.0 million -
up 86% from Q2 2010
8 |
 Cash Position
$29.1
million
in
cash
and
cash
equivalents,
restricted
cash,
and
broker
receivable at June 30, 2011, down from $33.2 million at December
31,
2010.
Equates to $0.33 cash per share.
Equates to $0.82 cash per share when including restricted cash
and the broker receivable, which we received in July 2011.
$2.6 million of net cash provided by operating activities for the six
months ended June 30, 2011 versus $2.1 million of net cash used
in operating activities for the six months ended June 30, 2010.
•
Primarily reflects the operations of the SBA lender in 2011.
9 |
 Developments in EPP
Q2 2011 versus Q2 2010:
Revenue up 2%
Pretax income down 2%
EBITDA down 2%
Six months June 30, 2011 versus six months June 30, 2010:
Revenue up 4%
Pretax income up 4%
EBITDA up 1%
Cash flow positive business
Significant operating leverage
EPP segment does not have any debt
eCommerce : Single most important corporate initiative and identifier
NewtPay
“Meet or Beat”
campaign launch
10 |
 Managed Technology
Solutions Initiatives Q2 2011 versus Q2 2010:
Revenue down 1%
Pretax income down 16%
EBITDA down 18%
Six months June 30, 2011 versus six months June 30, 2010:
Revenue flat
Pretax income up 5%
EBITDA down 4%
Continue to evaluate expenditures versus productivity, particularly in marketing,
seeking additional cost savings where applicable
Continued growth despite challenging market
Continue to invest in segment to support future growth
Currently above 50% real estate capacity in our data center
Great
marketing
channel
to
target
IT
partners
and
web
developers
–
TechExec
Competitive at lower-end of the market
11 |
 Cloud
Computing
What is it?
Outsourcing of hardware, software, personnel, storage, data
security and responsibility and accountability for IT in whole or in
part.
Why is it relevant?
Cost containment and efficiencies
Better service and management of resources
More security
More functionality
12 |
 Cloud
Computing
Competition
Amazon
Microsoft
Other hosting companies and IT providers like Rackspace
Hosting (RAX)
Thesba has real U.S. based cloud authority personnel to service and
talk to the customer
Thesba has a pay for what you use at the Cloud Authority
Bandwith
Storage
CPU
13 |
 Cloud
Computing
Why is this market important and why are we
good at it?
14 |
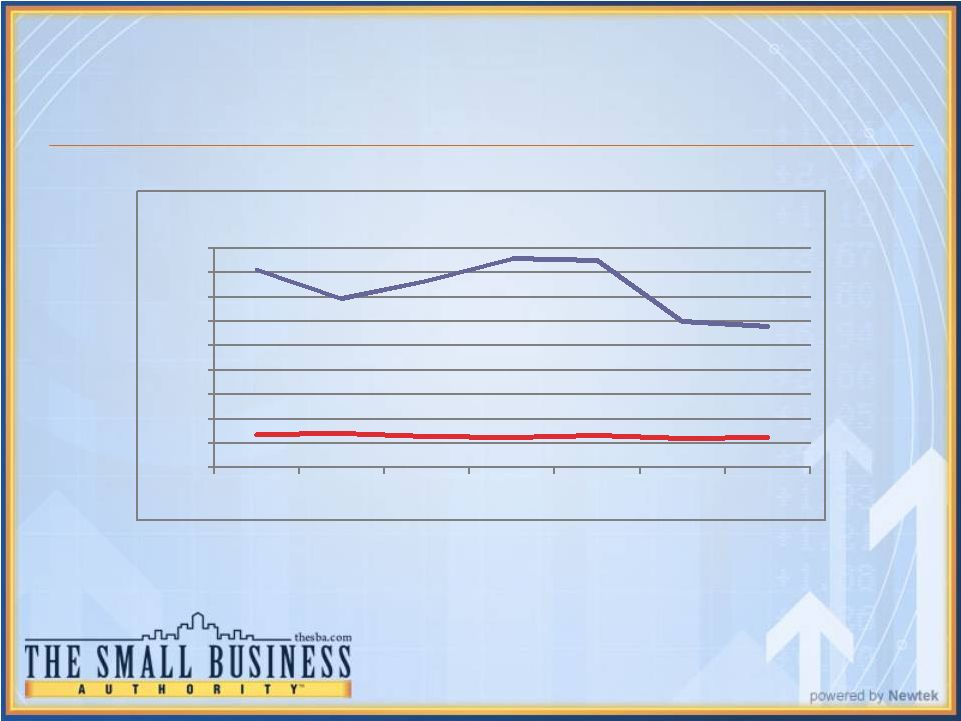
 Cloud
Computing
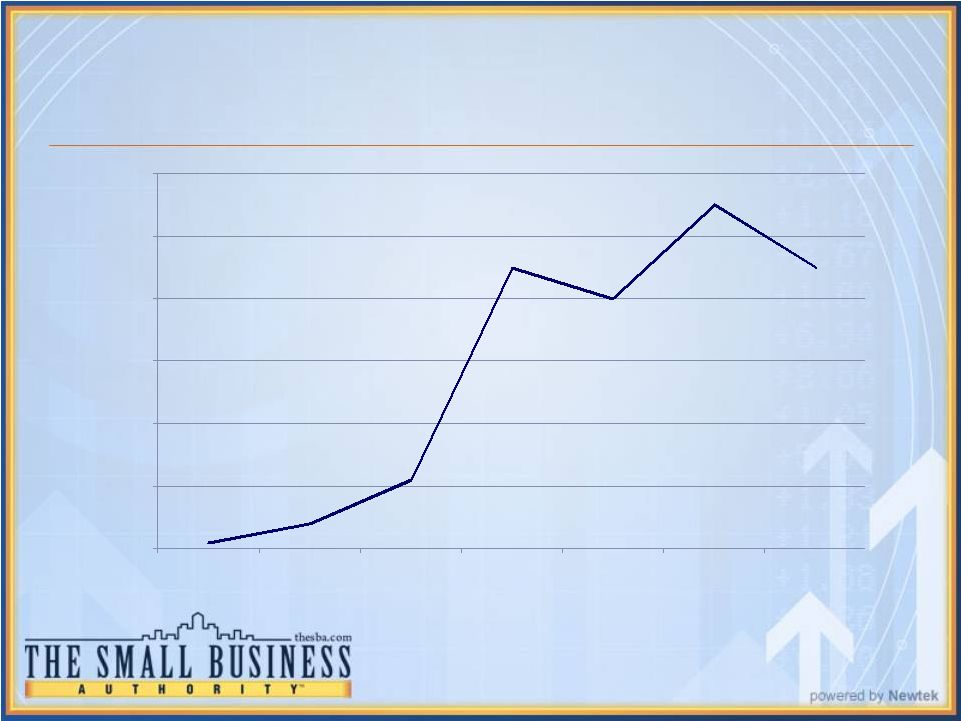
15
# of
instances
0
50
100
150
200
250
Dec-10
Jan-11
Feb-11
Mar-11
Apr-11
May-11
Jun-11
Cumulative Cloud VPS Instances Sold |
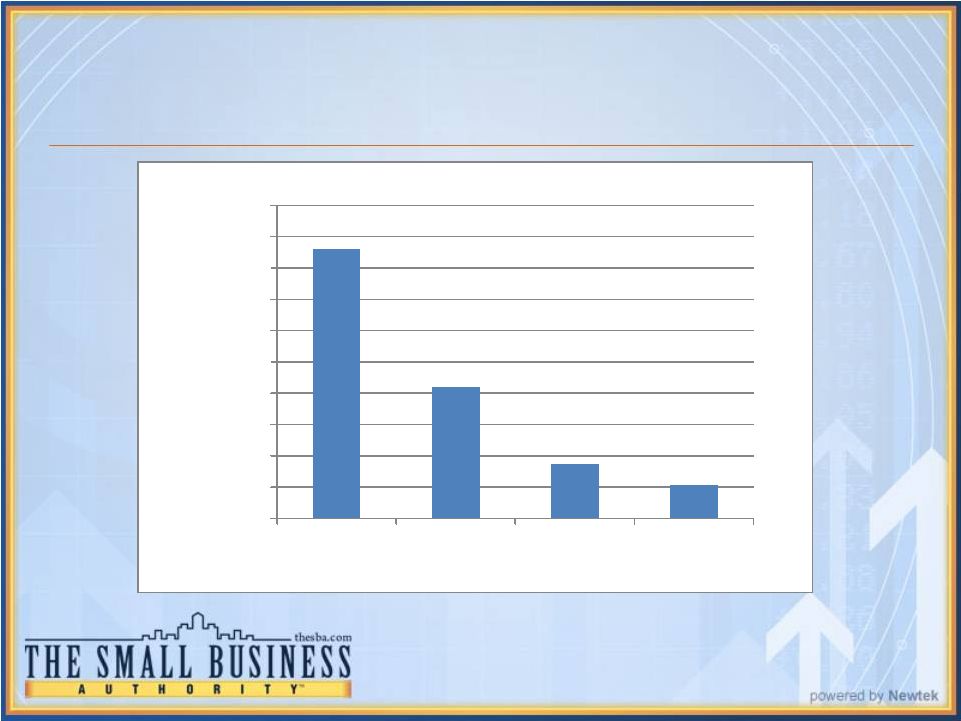
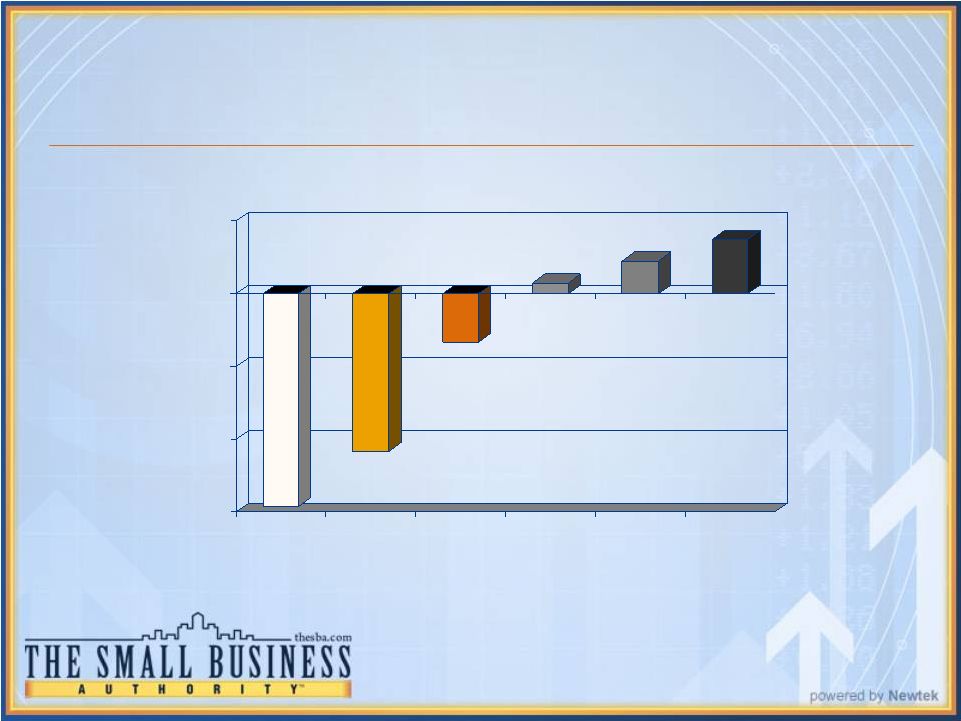
 Cloud
Computing
16
# of
instances
0
10
20
30
40
50
60
Dec-10
Jan-11
Feb-11
Mar-11
Apr-11
May-11
Jun-11
Cloud VPS Instances Sold Monthly |
 Small Business
Finance We have very good lending infrastructure (origination, underwriting, funding,
servicing, and collection)
This infrastructure is valuable more so today
This sector offers the best opportunity for Newtek shareholders
110 to 114 pricing on governments
FDIC contract
We are an S&P rated commercial servicer
Closed S&P AA rated securitization for note issuance of $16 million in December 2010
Closed Capital One Bank $27 million line of credit to fund portions of loans
guaranteed by the SBA (December 2010 and June 2011)
Closed a $10 million line with Sterling National Bank to fund accounts receivable
finance business in February 2011
17 |
 18
Small Business Finance
Servicing Portfolio (in thousands):
We expect future growth in this business area.
6/30/11
3/31/11
12/31/10
Servicing for loans we originated
$ 254,741
$ 236,363
$ 223,049
Servicing for others
75,087
75,365
73,062
Total servicing portfolio
$ 329,828
$ 311,728
$ 296,111 |
 Reduced Effect of Capco
on Consolidated Results
Balance sheet illusionary leverage
Management time
Accounting cost
Other miscellaneous costs
19 |
 Balance Sheet Items to
Discuss 20
(in millions of dollars)
6/30/2011
3/31/2011
12/31/2010
SBA loans transferred, subject to premium recourse
1.4
16.9
31.2
Credits in lieu of cash
25.1
29.0
35.5
Total assets
129.4
144.2
165.0
Liability on SBA loan transferred, subject to
premium recourse
1.4
16.5
30.8
Notes payable in credits in lieu of cash
25.1
29.0
35.5
Total liabilities
73.6
88.2
109.4 |
 Future Year End
Balance of Tax Credits 21
$-
$2
$4
$6
$8
$10
$12
$14
$16
$18
$20
2011
2012
2013
2014
(in millions) |
 Reduction of Capco
Effect Reduction of balance sheet
Credits in lieu of cash
Notes payable in credits in lieu of cash
Current percentage investment threshold and amounts needed to reach 100% for those Capcos
close to being able to voluntarily decertify.
Wilshire Louisiana Partners IV, LLC, Wilshire Alabama Partners, LLC, Wilshire Investors, LLC (WI),
Wilshire Advisers, LLC (NY) & Wilshire Partners, LLC (FL) have all fulfilled their maximum
obligations under the Capco programs as they existed and have been terminated or are in the
process of voluntary decertification.
Other
Capcos
(CO,
LA1,
LA3,
NY2,
NY3,
NY4
and
NY5)
have
invested
greater
than
50%
but
less
than 60% of their certified capital.
22
Capco
% Investment
threshold
$ Investments needed
to reach 100%
DC
60%
5,059,000
TX
74%
6,047,000
LA2
50%
1,808,457
LA4
100%
-
AL
100%
-
|
 What is our Growth
Strategy Going Forward?
The
Small
Business
Authority
brand
through
www.thesba.com
(launched
January
2011)
Emphasize cross-selling and cross-marketing into the customer base which
we are now doing
Continue to grow alliance channels as outsourcing of our services is
attractive to banks, credit unions and other affinity groups
Outbound campaign with direct focus on small businesses through television
and radio
23 |
 Our Strategy &
Mission We are a thought leader and destination for independent owner
operators of small businesses. The Small Business Authority
provides products, services, and data to small and medium size
businesses across the United States to grow their sales, reduce
their expenses, reduce their risk and offer state of the art efficient
business strategies, structures, and content to run their businesses.
24 |
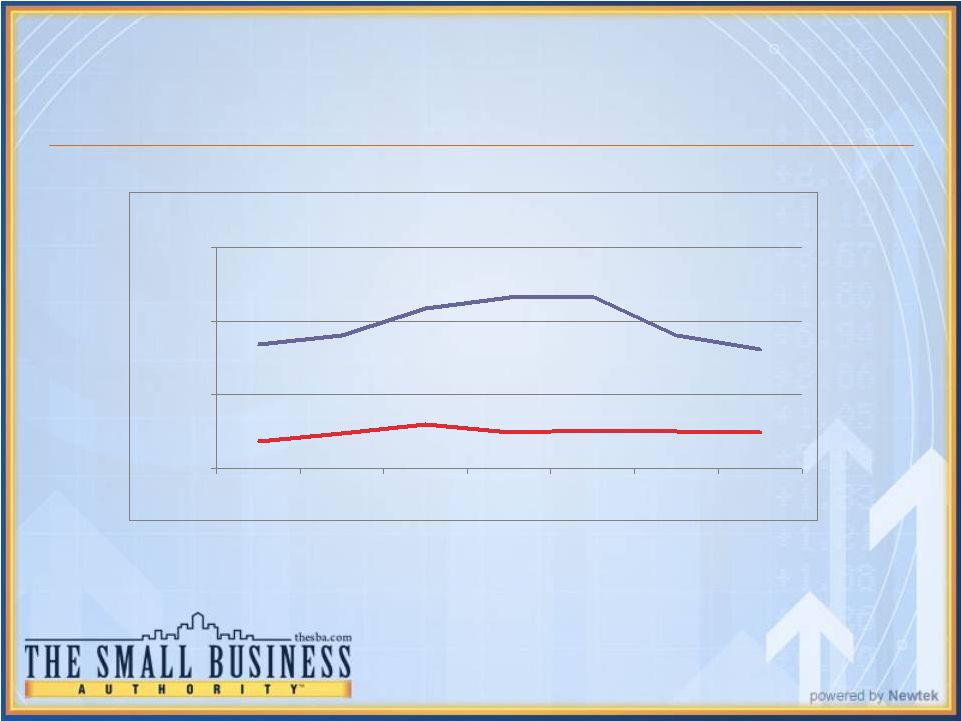 Traffic Statistics for
www.thesba.com 25
10,131
10,882
13,125
13,990
14,094
10,862
9,750
2,207
2,912
3,613
2,979
3,102
3,053
2,974
0
6,000
12,000
18,000
JAN
FEB
MAR
APR
MAY
JUN
JUL
Unique Visitors Per Month Since 2011 Launch
TheSBA
NBS |
 Traffic Statistics for
www.thesba.com 26
3,496
3,029
3,315
3,677
3,637
2,638
2,556
795
803
763
737
764
726
734
250
650
1,050
1,450
1,850
2,250
2,650
3,050
3,450
3,850
JAN
FEB
MAR
APR
MAY
JUN
JUL
Average Weekly Unique Visitors -
2011
TheSBA
NBS |
 Current General
Statistics 600 absolute unique visitors per day
Average time on site is 3 minutes and 2 seconds
54% Bounce Rate
27 |
 Small Business
Authority Branding Achievements
Forbes
publishes
The
Small
Business
Authority
Blog
daily
which
can
be viewed at http://blogs.forbes.com/thesba/
To date we have published 7 blogs since June 15, 2011 and we try
to
update the blog weekly
Our introductory post which explains what our blog will do can be viewed at
http://blogs.forbes.com/thesba/2011/06/15/your-authority-on-small-
business/
The
Small
Business
Authority
Index
is
published
by
Bloomberg
Newswire monthly
28 |
 Small Business
Authority Branding Achievements
Small Business Authority Hour
All of the following shows podcast on thesba.com and
wabcradio.com:
2/5/11 –
Business Entrepreneurship
3/5/11 –
Healthcare and Health Insurance effects on small
businesses
4/2/11 –
Small Business Lending
5/7/11 –
eCommerce
6/4/11 –
Cloud Computing
7/2/11 –
Cloud Computing
8/6/11 –
Tax issues affecting small businesses
29 |
 77 WABC Radio
“Reporting Live from The Small Business Authority Studios”
over 400 mentions per month
Over 250 sixty second radio commercials per month. Hear our
spots on www.thesba.com
click on community, then click on radio spots to hear our personalities, like
Imus, Hannity, Levin, Kudlow, Batchelor and McIntyre broadcast our spots
The Small Business Authority Hour
The first Saturday of every month on 77 WABC and WABCradio.com (click
listen live)
Our show for independent business owners and operators
Go
to
our
website
www.thesba.com,
click
on
community
and
then
radio
spots
to
listen
to the podcasts
30 |
 WABC Radio
“The Imus in the Morning Show”
–
broadcast Monday through
Friday, 6am EST to 9:20am EST on 77 WABC and Fox
Business News
See Warner Wolf broadcast sports from the SBAS several times
each morning
Backdrop
Microphone flags
See
Bernard
McGirk
broadcast
his
“Bernie
Briefing”
from
the
SB
AS several times each morning
Backdrop
Microphone flags
Testing for future growth for Thesba brand and direct-to-market
distribution
SBAS –
Small Business Authority Studios
31 |
 SB Authority
Index Financial barometer for small business economy
Made up of eight primary business and economic components
of the small business economy
SB Authority Index released at beginning of every month
Available in our newsletter with over 55,000 in distribution
Available
on
our
website
now
at
www.thesba.com
32 |
 SB Authority Market
Sentiment Survey On a monthly basis, delivers the pulse of the small business
economy by polling our client base on topical issues like health
care, the lending environment and other important issues
affecting small businesses
Usually poll in excess of 1,200 respondents
Released once per month
Results are available in our newsletter with over 55,000 in
distribution
Available to all to participate and view results on our website at
www.thesba.com
33 |
 Small Business
Authority Hour Live radio for small business on the first Saturday of every
month broadcasting from The Small Business Authority Studios
on 77 WABC or nationally at WABCRadio.com
Produced and directed by Newtek for independent business
owners and operators
Discussing key small business issues like health care and the
business lending environment
Special guests, small business news and call-ins each and
every month
34 |
 Marketing Focus
|
 Strategic Alliance
Partner Channel Still our workhorse for distribution, clientele and relationships
Driven by Newtracker™
which has a patent pending
Referral volume continues to grow on a consolidated basis
CUNA
Latino Coalition
Pershing
Morgan Stanley Smith Barney
Chartis
New York Community Bank
The Company Corporation
Humana Insurance Company
36 |
 Small Business
Authority Channel Grow internet web based direct business
through search
through branding on TV, radio, print and public relations
Increased recognition as the authority on business issues for
small businesses
Grow as the destination spot for independent owner/operator
businesses
Become recognized as best of breed in each area of:
Lending
Electronic payment processing
Insurance brokerage
Outsourced technology managed services
Business information
Payroll
Data storage
Health insurance
37 |
 In Conclusion
38 |
 Annual Pretax Income
Trend 39
Pretax Income
(Loss)
$(17.5)
$(13.1)
$(4.0)
$0.9
in millions
-$18
-$12
-$6
$0
$6
2007
Actual
2008
Actual
2009
Actual
2010
Actual
2011
Forecast
Midpoint
2012
Forecast
Midpoint
$2.7
$4.5 |
 2011 Revised Segment
Guidance 40
*Note: totals may not add due to rounding
In millions of dollars
Electronic
Managed
Small
Payment
Technology
Business
All
Corporate
Processing
Solutions
Finance
Other
Activities
Low
High
Low
High
Low
High
Low
High
Low
High
2011 Full Year
Revenue
80.5
81.5
19.2
19.6
20.1
21.1
1.4
1.6
1.0
1.0
Pretax Income (Loss)
5.9
6.3
4.6
5.0
3.8
4.7
(1.5)
(1.2)
(8.9)
(8.5)
Interest Expense
-
-
0.1
0.1
1.9
2.1
-
-
-
-
Depreciation and Amortization
1.4
1.4
1.5
1.5
0.9
0.9
0.1
0.1
0.2
0.2
EBITDA
7.3
7.7
6.2
6.6
6.6
7.7
(1.4)
(1.1)
(8.7)
(8.3)
Total
Business
CAPCO
Intercompany
Segments
Segment
Eliminations
Total
Low
High
Low
High
Low
High
2011 Full Year
Revenue
122.2
124.8
1.5
1.7
(1.7)
122.0
124.8
Pretax Income (Loss)
3.9
6.3
(2.4)
(2.2)
-
1.5
4.0 |
 2012 Segment
Guidance 41
*Note: totals may not add due to rounding
In millions of dollars
Electronic
Managed
Small
Payment
Technology
Business
All
Corporate
Processing
Solutions
Finance
Other
Activities
Low
High
Low
High
Low
High
Low
High
Low
High
2012 Full Year
Revenue
78.7
79.2
19.9
20.4
21.9
23.4
1.5
2.0
0.5
0.5
Pretax Income (Loss)
6.5
7.0
4.9
5.4
4.2
5.8
(1.5)
(1.2)
(9.2)
(8.9)
Interest Expense
-
-
0.1
0.1
2.1
2.1
-
-
-
-
Depreciation and Amortization
0.7
0.7
1.5
1.5
1.6
1.6
-
-
0.2
0.2
EBITDA
7.2
7.7
6.4
6.9
7.9
9.5
(1.5)
(1.1)
(9.0)
(8.7)
Total
Business
CAPCO
Intercompany
Segments
Segment
Eliminations
Total
Low
High
Low
High
Low
High
2012 Full Year
Revenue
122.4
125.5
0.7
0.7
(1.2)
121.9
125.0
Pretax Income (Loss)
4.8
8.0
(2.0)
(1.9)
-
2.8
6.1 |
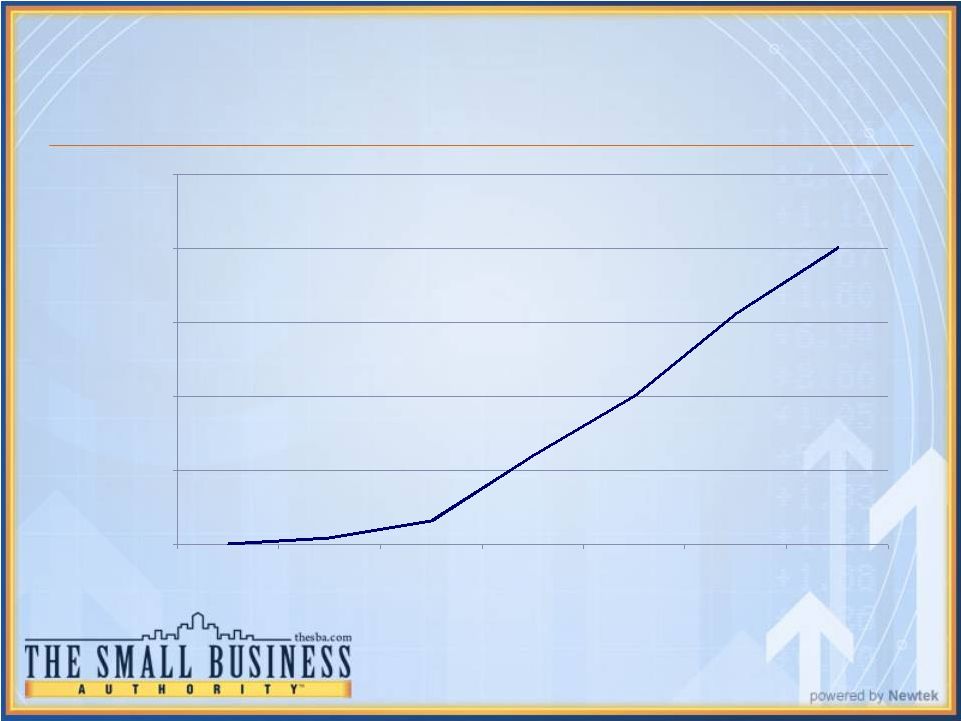
 Consolidated Annual
Pretax Income (Loss) Year
Amount (in millions)
2007
$(17.5)
2008
$(13.1)
2009
$(4.0)
2010
$0.9
2011 (Forecast range
midpoint)
$2.7
2012 (Forecast range
midpoint)
$4.5
42 |
 Financial Review
Jennifer C. Eddelson –
CAO |
 Non-GAAP Financial
Measures In evaluating its business, Newtek considers and uses EBITDA as a supplemental measure
of its operating performance. The Company defines EBITDA as earnings before interest
expense, taxes, depreciation and amortization. Newtek uses EBITDA as a supplemental
measure to review and
assess
its
operating
performance.
The
Company
also
presents
EBITDA
because
it
believes
it is frequently used by securities analysts, investors and other interested parties as a measure of
financial performance.
The term EBITDA is not defined under U.S. generally accepted accounting principles, or U.S.
GAAP, and is not a measure of operating income(loss), operating performance or liquidity
presented in accordance with U.S. GAAP. EBITDA has limitations as a analytical tool and, when
assessing the Company’s operating performance, investors should not consider EBITDA
in isolation, or as a substitute for net income (loss) or other consolidated income statement
data prepared in accordance with U.S. GAAP. Among other things, EBITDA does not reflect
the Company’s actual cash expenditures. Other companies may calculate similar
measures differently than Newtek, limiting their usefulness as comparative tools. Newtek
compensates for these limitations by relying primarily on its GAAP results and using EBITDA
only supplementally. 44 |
 Selected Balance Sheet
Items Balance at
June 30, 2011
Balance at
December 31, 2010
Cash and cash equivalents
$11,701
$10,382
Restricted cash
8,580
10,747
Broker receivable
8,796
12,058
SBA loans held for sale, at fair value
2,448
1,014
Total short term liquidity
$31,525
$34,201
Notes payable (includes $13,941 and $15,104,
respectively, related to securitization trust VIE)
$30,491
$28,053
45
In thousands of dollars |
 Q2 2011 Actual vs. Q2
2010 Actual 46
In millions of dollars
Revenue For
The Quarter
Ended
June 30, 2011
Actual
Revenue For
The Quarter
Ended
June 30, 2010
Actual
Pretax Income
(Loss) For The
Quarter Ended
June 30, 2011
Actual
Pretax Income
(Loss) For The
Quarter Ended
June 30, 2010
Actual
EBITDA For
The Quarter
Ended
June 30, 2011
Actual
EBITDA For
The Quarter
Ended
June 30, 2010
Actual
Electronic
Payment
Processing
20.717
20.407
1.344
1.368
1.724
1.765
Managed
Technology
Solutions
4.767
4.814
0.997
1.194
1.379
1.689
Small
Business
Finance
6.299
1.943
1.036
0.557
1.711
1.164
All Other
0.347
0.382
(0.342)
(0.215)
(0.322)
(0.182)
Corporate
Activities
0.304
0.532
(2.414)
(1.724)
(2.367)
(1.643)
CAPCO
0.324
0.596
(0.485)
(0.666)
Interco
Eliminations
(0.436)
(0.668)
Total
32.322
28.006
0.136
0.514 |
 2011 Revised Segment
Guidance 47
*Note: totals may not add due to rounding
In millions of dollars
Electronic
Managed
Small
Payment
Technology
Business
All
Corporate
Processing
Solutions
Finance
Other
Activities
Low
High
Low
High
Low
High
Low
High
Low
High
2011 Full Year
Revenue
80.5
81.5
19.2
19.6
20.1
21.1
1.4
1.6
1.0
1.0
Pretax Income (Loss)
5.9
6.3
4.6
5.0
3.8
4.7
(1.5)
(1.2)
(8.9)
(8.5)
Interest Expense
-
-
0.1
0.1
1.9
2.1
-
-
-
-
Depreciation and Amortization
1.4
1.4
1.5
1.5
0.9
0.9
0.1
0.1
0.2
0.2
EBITDA
7.3
7.7
6.2
6.6
6.6
7.7
(1.4)
(1.1)
(8.7)
(8.3)
Total
Business
CAPCO
Intercompany
Segments
Segment
Eliminations
Total
Low
High
Low
High
Low
High
2011 Full Year
Revenue
122.2
124.8
1.5
1.7
(1.7)
122.0
124.8
Pretax Income (Loss)
3.9
6.3
(2.4)
(2.2)
-
1.5
4.0 |
 2011 Previous Segment
Guidance 48
*Note: totals may not add due to rounding
In millions of dollars
Electronic
Managed
Small
Payment
Technology
Business
All
Corporate
Processing
Solutions
Finance
Other
Activities
Low
High
Low
High
Low
High
Low
High
Low
High
2011 Full Year
Revenue
79.1
82.5
19.9
20.7
17.1
18.5
1.6
1.8
1.0
1.0
Pretax Income (Loss)
5.8
6.3
4.7
5.3
3.4
4.8
(1.2)
(1.0)
(9.7)
(9.3)
Interest Expense
-
-
0.1
0.1
1.5
1.7
-
-
-
-
Depreciation and Amortization
1.4
1.4
1.7
1.7
1.0
1.0
0.1
0.1
0.3
0.3
EBITDA
7.2
7.7
6.5
7.1
5.9
7.5
(1.1)
(0.9)
(9.3)
(8.9)
Total
Business
CAPCO
Intercompany
Segments
Segment
Eliminations
Total
Low
High
Low
High
Low
High
2011 Full Year
Revenue
118.7
124.4
2.5
2.5
(1.6)
119.6
125.3
Pretax Income (Loss)
3.0
6.1
(1.8)
(1.8)
-
1.2
4.3 |
 2012 Segment
Guidance 49
*Note: totals may not add due to rounding
In millions of dollars
Electronic
Managed
Small
Payment
Technology
Business
All
Corporate
Processing
Solutions
Finance
Other
Activities
Low
High
Low
High
Low
High
Low
High
Low
High
2012 Full Year
Revenue
78.7
79.2
19.9
20.4
21.9
23.4
1.5
2.0
0.5
0.5
Pretax Income (Loss)
6.5
7.0
4.9
5.4
4.2
5.8
(1.5)
(1.2)
(9.2)
(8.9)
Interest Expense
-
-
0.1
0.1
2.1
2.1
-
-
-
-
Depreciation and Amortization
0.7
0.7
1.5
1.5
1.6
1.6
-
-
0.2
0.2
EBITDA
7.2
7.7
6.4
6.9
7.9
9.5
(1.5)
(1.1)
(9.0)
(8.7)
Total
Business
CAPCO
Intercompany
Segments
Segment
Eliminations
Total
Low
High
Low
High
Low
High
2012 Full Year
Revenue
122.4
125.5
0.7
0.7
(1.2)
121.9
125.0
Pretax Income (Loss)
4.8
8.0
(2.0)
(1.9)
-
2.8
6.1 |
 Going Forward:
2011 Barry Sloane -
CEO |
 Questions & Answers |
 Addendum |
 53
Pretax Income
(Loss) for Q2 2011
Interest Expense
for Q2 2011
Depreciation and
amortization for Q2 2011
Q2 2011
EBITDA
Electronic Payment Processing
1.344
-
0.380
1.724
Managed Technology Solutions
0.997
0.027
0.355
1.379
Small Business Finance
1.036
0.451
0.224
1.711
All Other
(0.342)
-
0.020
(0.322)
Corporate Activities
(2.414)
-
0.047
(2.367)
Pretax Income
(Loss) for Q2 2010
Interest Expense
for Q2 2010
Depreciation and
amortization for Q2 2010
Q2 2010
EBITDA
Electronic Payment Processing
1.368
-
0.397
1.765
Managed Technology Solutions
1.194
0.028
0.467
1.689
Small Business Finance
0.557
0.413
0.194
1.164
All Other
(0.215)
-
0.033
(0.182)
Corporate Activities
(1.724)
-
0.081
(1.643)
EBITDA Reconciliation
EBITDA Reconciliation from Pretax Income (Loss)
For the three months ended June 30, 2011
In millions of dollars
EBITDA Reconciliation from Pretax Income (Loss)
For the three months ended June 30, 2010
In millions of dollars |
 54
Pretax Income
(Loss) for YTD
June 30, 2011
Interest Expense
for YTD
June 30, 2011
Depreciation and
amortization for YTD
June 30, 2011
YTD
June 30, 2011
EBITDA
Electronic Payment Processing
2.547
-
0.762
3.309
Managed Technology Solutions
2.228
0.054
0.730
3.012
Small Business Finance
2.308
1.082
0.416
3.806
All Other
(0.638)
-
0.041
(0.597)
Corporate Activities
(4.379)
-
0.105
(4.274)
Pretax Income
(Loss) for YTD
June 30, 2010
Interest Expense
for YTD
June 30, 2010
Depreciation and
amortization for YTD
June 30, 2010
YTD
June 30, 2010
EBITDA
Electronic Payment Processing
2.452
-
0.813
3.265
Managed Technology Solutions
2.126
0.046
0.957
3.129
Small Business Finance
0.447
0.746
0.406
1.599
All Other
(0.563)
-
0.078
(0.485)
Corporate Activities
(3.255)
-
0.171
(3.084)
EBITDA Reconciliation
EBITDA Reconciliation from Pretax Income (Loss)
For the six months ended June 30, 2011
In millions of dollars
EBITDA Reconciliation from Pretax Income (Loss)
For the six months ended June 30, 2010
In millions of dollars |