Attached files
| file | filename |
|---|---|
| 8-K - ROSE2NDQ11PRES - NBL Texas, LLC | rose2ndq11pres.htm |

1
Rosetta Resources Inc.
Second Quarter 2011
Earnings Review
Earnings Review
August 9, 2011
High Asset Quality - Executing on Business Plan - Future Growth Catalysts - Financial Strength
Exhibit 99.1

2
– Overview Randy Limbacher
– Financial Review Michael Rosinski
– Operations Update Jim Craddock
– Asset Development Update John Clayton
Earnings Call Agenda

3
– Doubled proved reserves - 175% growth in two years
– Set two production records for total liquids and natural gas
equivalents
equivalents
– Began horizontal drilling program in Southern Alberta Basin
– Increased capital program to accelerate growth activities
– Continue to increase transportation and processing
capabilities from the Eagle Ford and diversify access to
service providers
capabilities from the Eagle Ford and diversify access to
service providers
– Exceptional quarter performance reflects continued
successful execution of growth strategy
successful execution of growth strategy
Overview - Randy Limbacher

4
– Quarterly financial performance exceeds expectations
– Strong second quarter and first-half production growth
driven by Eagle Ford
driven by Eagle Ford
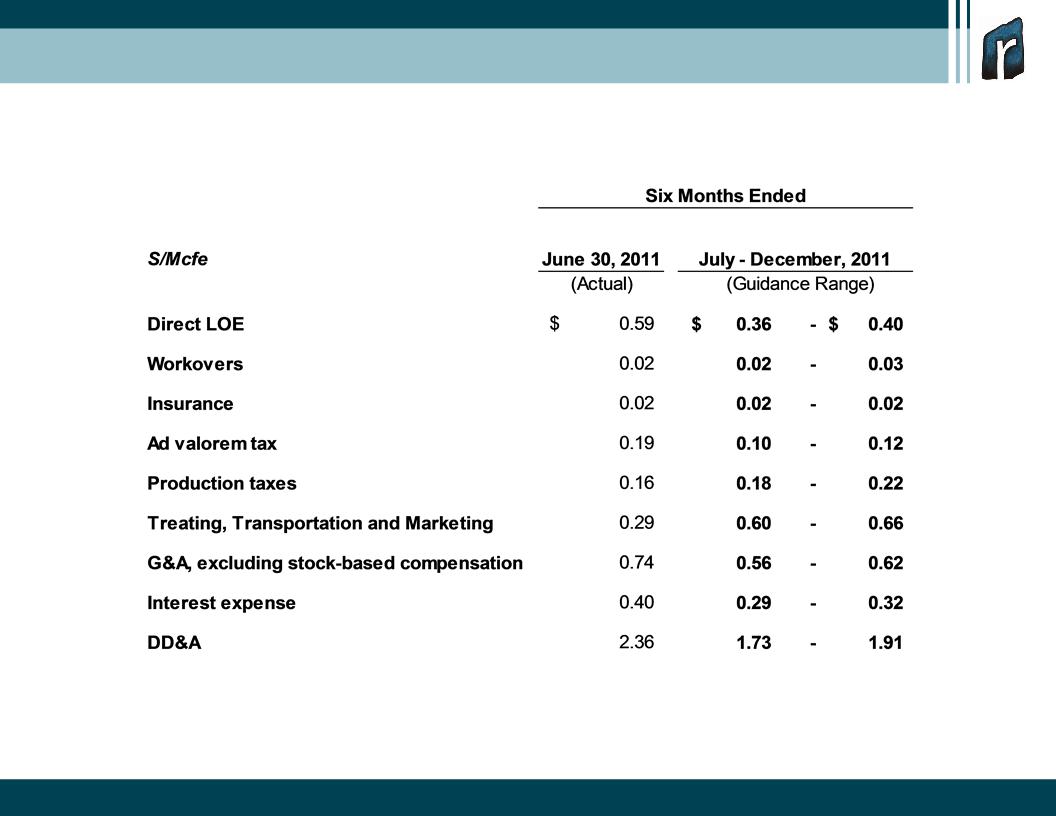
– Providing expense guidance to reflect improving cost
structure from growth in lower-cost production
structure from growth in lower-cost production
– Continue to pursue active hedging program with added
crude oil hedges for 2012 and 2013
crude oil hedges for 2012 and 2013
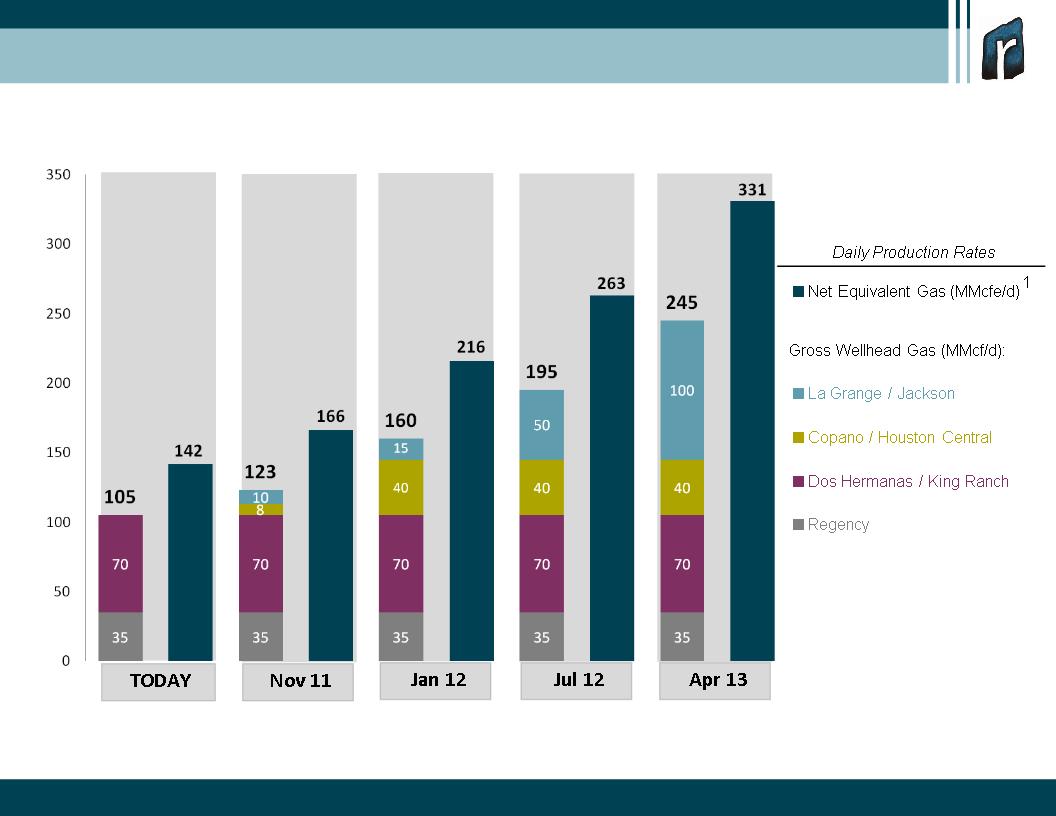
– Current capability to move net 142 MMcfe/d from Eagle
Ford increasing to 331 MMcfe/d over next 20 months
Ford increasing to 331 MMcfe/d over next 20 months
Financial Review - Michael Rosinski
5
Expense Guidance - 2011 Second Half
6
¹ Rosetta’s net equivalent gas production (MMcfe/d) equals 1.35 times gross wet wellhead gas (MMcf/d).
Eagle Ford: Firm Transportation Capacity

7
– Doubled proved reserves to 970 Bcfe; 53% liquids
– Spent $117.1 MM in capex, drilled 13 gross and 12 net
wells
wells
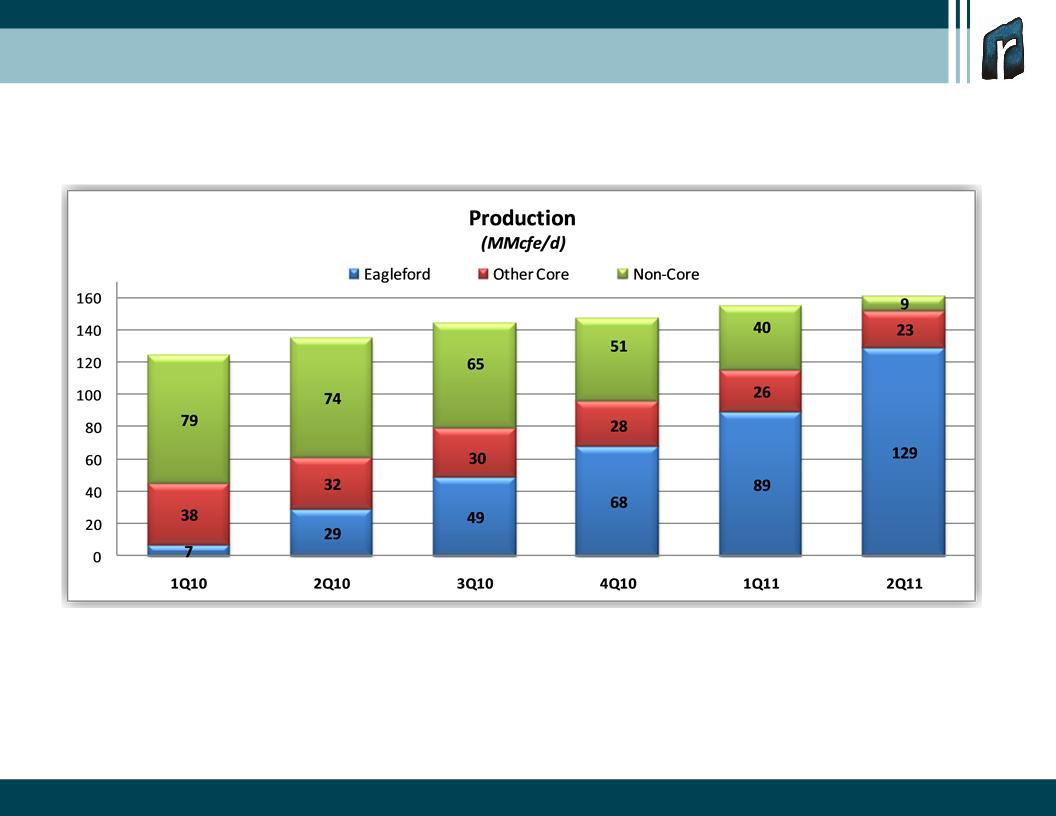
– Achieved all-time quarterly average production record of
161 MMcfe/d, up 20 percent from 2Q 2010
161 MMcfe/d, up 20 percent from 2Q 2010
– Produced average 129 MMcfe/d from Eagle Ford in 2Q
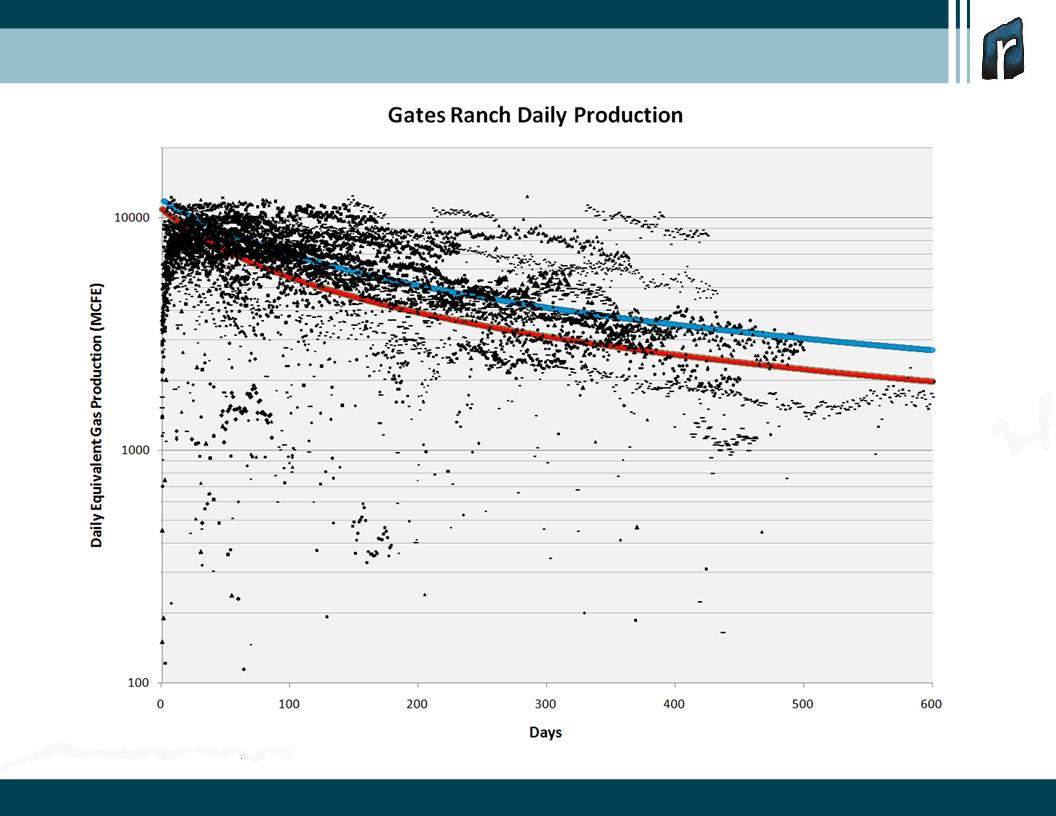
– Increased Gates Ranch gross EUR from 7.2 Bcfe per well to
10.0 Bcfe per well
10.0 Bcfe per well
– Spud first horizontal well in Southern Alberta Basin during
2Q; drilling underway on second and third horizontal wells
2Q; drilling underway on second and third horizontal wells
– Revised 2011 production guidance: 160 - 170 MMcfe/d
2012 preliminary estimate: 220 - 240 MMcfe/d
Operations Update - Jim Craddock
8
Significant Production Transformation
9
7.3 BCFE Composite Type Curve (PUD bookings)
10 BCFE Composite Type Curve
Gates Ranch: Well performance continues to outperform our models

10
– Infill Drilling at Gates Ranch
– 2 pilot programs
– 425 - 450 foot well spacing (50-acre effective spacing)
– 10 TCFE targeted for incremental recovery
– Non-Gates Ranch Testing
– 23,500 net acres in liquids-rich windows
– 4 unique acreage blocks to be tested before year-end
– 100% working interests / operated by Rosetta
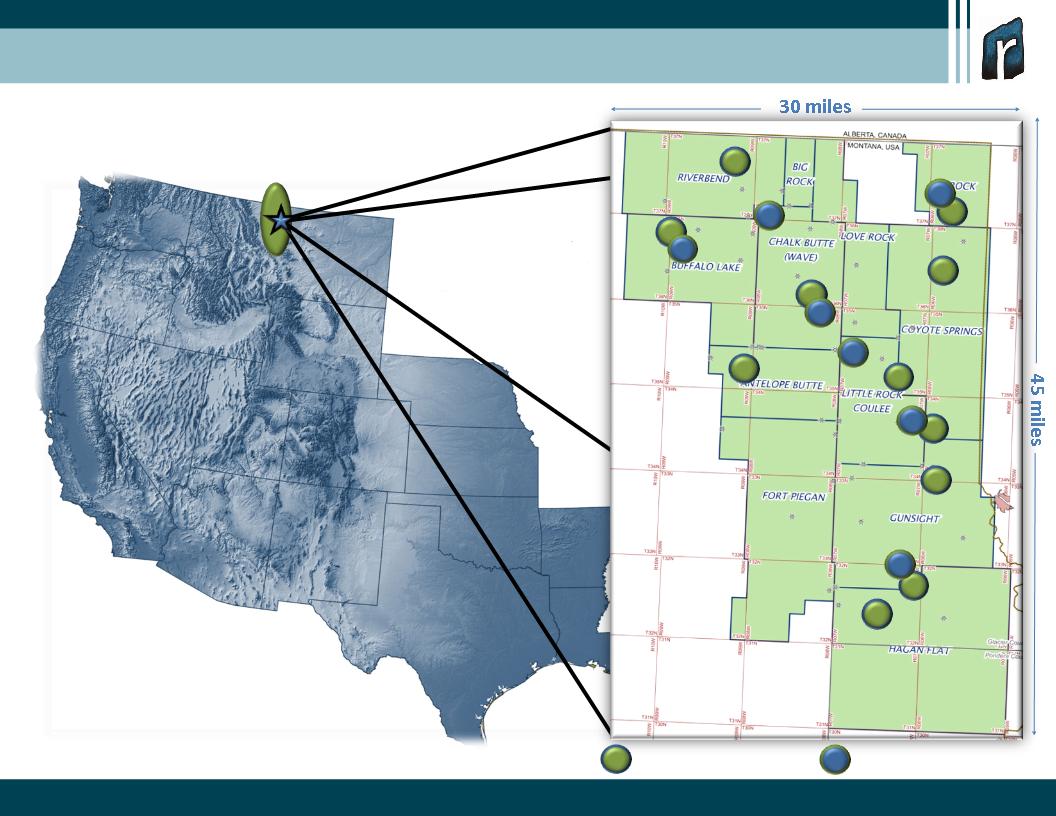
– Southern Alberta Basin Exploration
– 11 delineation wells drilled across position
– All wells have produced hydrocarbons
– Vertical “Bakken-only” single-stage completions averaged 22 Bopd for 7-day IP
– Increasing horizontal program from 3 to 7 wells before year-end
– 3 of the 7 horizontal wells to be tested by early 4th quarter
Asset Development Update - John Clayton
11
Delineation Wells (11)
Current 7-well HZ Program
Southern Alberta Basin: Well Location Map
12
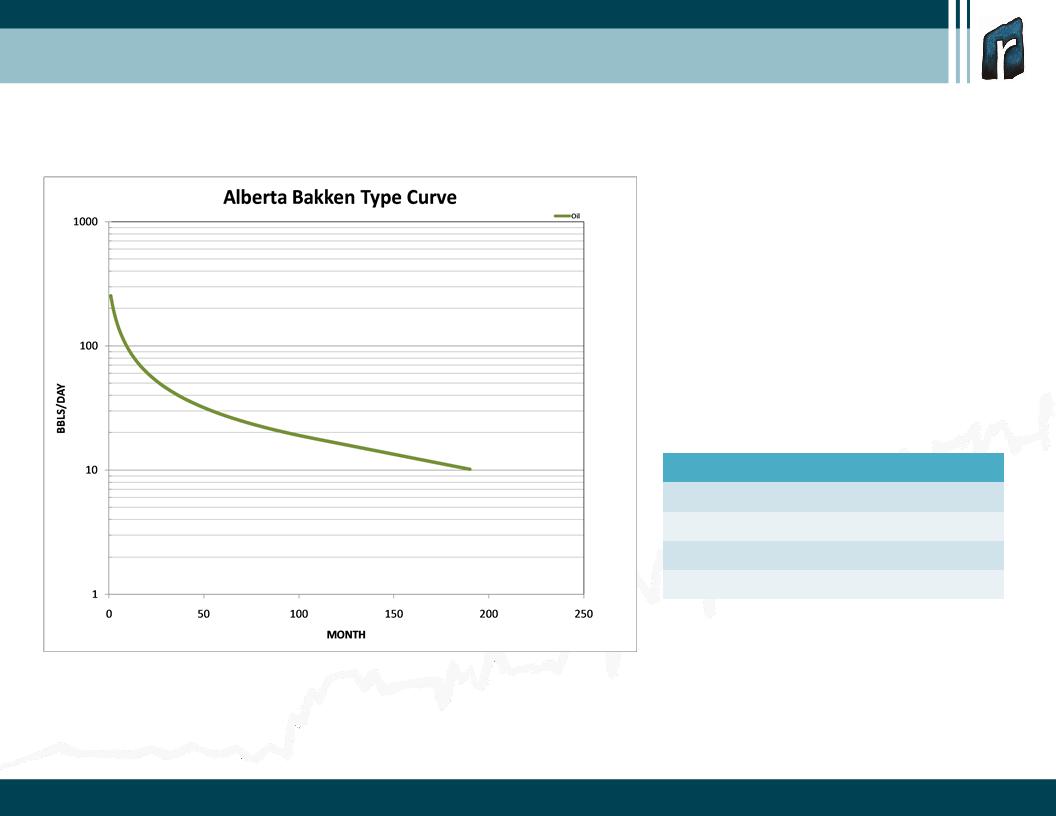
Southern Alberta Basin: Representative Base Case Economic Model
Well Performance Parameters
§ 250 IP boepd (gross)
§ 185,000 boe EUR (gross)
§ 160-acre spacing
§ $4 million well costs
|
Per Well Economics (BFIT)
|
||
|
Pricing ($/bbl WTI)
|
$85
|
$95
|
|
ROR (%)
|
21.3
|
35.1
|
|
NPV 10% ($M)
|
931
|
1,926
|
|
F/D ($/BOE)
|
27.46
|
27.46
|

13
This presentation includes forward-looking statements, which give the Company's current expectations or
forecasts of future events based on currently available information. Forward-looking statements are
statements that are not historical facts, such as expectations regarding drilling plans, including the
acceleration thereof, production rates and guidance, resource potential, incremental transportation capacity,
exit rate guidance, net present value, development plans, progress on infrastructure projects, exposures to
weak natural gas prices, changes in the Company's liquidity, changes in acreage positions, expected
expenses, expected capital expenditures, and projected debt balances. The assumptions of management and
the future performance of the Company are subject to a wide range of business risks and uncertainties and
there is no assurance that these statements and projections will be met. Factors that could affect the
Company's business include, but are not limited to: the risks associated with drilling of oil and natural gas
wells; the Company's ability to find, acquire, market, develop, and produce new reserves; the risk of drilling
dry holes; oil and natural gas price volatility; derivative transactions (including the costs associated therewith
and the abilities of counterparties to perform thereunder); uncertainties in the estimation of proved, probable,
and possible reserves and in the projection of future rates of production and reserve growth; inaccuracies in
the Company's assumptions regarding items of income and expense and the level of capital expenditures;
uncertainties in the timing of exploitation expenditures; operating hazards attendant to the oil and natural gas
business; drilling and completion losses that are generally not recoverable from third parties or insurance;
potential mechanical failure or underperformance of significant wells; availability and limitations of capacity in
midstream marketing facilities, including processing plant and pipeline construction difficulties and operational
upsets; climatic conditions; availability and cost of material, supplies, equipment and services; the risks
associated with operating in a limited number of geographic areas; actions or inactions of third-party operators
of the Company's properties; the Company's ability to retain skilled personnel; diversion of management's
attention from existing operations while pursuing acquisitions or dispositions; availability of capital; the
strength and financial resources of the Company's competitors; regulatory developments; environmental risks;
uncertainties in the capital markets; general economic and business conditions (including the effects of the
worldwide economic recession); industry trends; and other factors detailed in the Company's most recent
Form 10-K, Form 10Q and other filings with the Securities and Exchange Commission. If one or more of these
risks or uncertainties materialize (or the consequences of such a development changes), or should underlying
assumptions prove incorrect, actual outcomes may vary materially from those forecasted or expected. The
Company undertakes no obligation to publicly update or revise any forward-looking statements except as
required by law.
Forward-Looking Statements and Terminology Used

14
For filings reporting year-end 2010 reserves, the SEC permits the optional disclosure of probable and possible
reserves. The Company has elected not to report probable and possible reserves in its filings with the
SEC. We use the term “net risked resources” to describe the Company’s internal estimates of volumes of
natural gas and oil that are not classified as proved reserves but are potentially recoverable through
exploratory drilling or additional drilling or recovery techniques. Estimates of unproved resources are by their
nature more speculative than estimates of proved reserves and accordingly are subject to substantially greater
risk of actually being realized by the Company. Estimates of unproved resources may change significantly as
development provides additional data, and actual quantities that are ultimately recovered may differ
substantially from prior estimates. We use the term “BFIT NPV10” to describe the Company’s estimate of
before income tax net present value discounted at 10 percent resulting from project economic evaluation. The
net present value of a project is calculated by summing future cash flows generated by a project, both inflows
and outflows, and discounting those cash flows to arrive at a present value. Inflows primarily include revenues
generated from estimated production and commodity prices at the time of the analysis. Outflows include
drilling and completion capital and operating expenses. Net present value is used to analyze the profitability of
a project. Estimates of net present value may change significantly as additional data becomes available, and
with adjustments in prior estimates of actual quantities of production and recoverable reserves, commodity
prices, capital expenditures, and/or operating expenses.
Forward-Looking Statements and Terminology Used
15