Attached files
| file | filename |
|---|---|
| 8-K - FORM 8-K - NAVISTAR INTERNATIONAL CORP | d8k.htm |
 Jefferies Annual Global Industrials
August 10th, 2011
Exhibit 99.1
1
NYSE: NAV
For more than 175 years
we’ve been helping people from every corner of the world
move the goods that move the welfare of entire nations.
|
 2
2
Safe Harbor
Statement &
Other Cautionary Notes
Information provided and statements contained in this presentation that are not purely historical are
forward-looking statements within the meaning of Section 27A of the Securities Act of 1933,
as amended, Section 21E of the Securities Exchange Act of 1934, as amended, and the Private
Securities Litigation Reform Act of 1995. Such forward-looking statements only speak as of
the date of this presentation and the Company assumes no obligation to update the information
included in this presentation. Such forward-looking statements include information concerning our possible or
assumed future results of operations, including descriptions of our business strategy. These
statements often include words such as “believe,” “expect,”
“anticipate,” “intend,” “plan,” “estimate,” or similar expressions. These statements are
not guarantees of performance or results and they involve risks, uncertainties, and assumptions. For a
further description of these factors, see Item 1A,
Risk Factors
, included within our Form 10-K for the year ended October 31, 2010, which
was filed on December 21, 2010. Although we believe that these forward-looking statements
are based on reasonable assumptions, there are many factors that could affect our actual
financial results or results of operations and could cause actual results to differ materially
from those in the forward-looking statements. All future written and oral forward-looking
statements by us or persons acting on our behalf are expressly qualified in their entirety by the
cautionary statements contained or referred to above. Except for our ongoing obligations to
disclose material information as required by the federal securities laws, we do not have any
obligations or intention to release publicly any revisions to any forward-looking statements
to reflect events or circumstances in the future or to reflect the occurrence of unanticipated events.
The financial information herein contains audited and unaudited information and has been prepared by
management in good faith and based on data currently available to the Company.
Certain Non-GAAP measures are used in this presentation to assist the reader in understanding our
core manufacturing business. We believe this information is useful and relevant to assess and
measure the performance of our core manufacturing business as it illustrates manufacturing
performance without regard to selected historical legacy costs (i.e. pension and other
postretirement costs). It also excludes financial services and other expenses that may not be related to
the core manufacturing business or underlying results. Management often uses this information to
assess and measure the performance of our operating segments. A reconciliation to the most
appropriate GAAP number is included in the appendix of this presentation. |
 3
3
Agenda
•
Driving shareholder value
•
Three pillar strategy
–
Great products
–
Competitive cost structure
–
Profitable growth
•
2011 Update
–
Operations
–
Financial guidance |
 4
4
Driving Shareholder Value
Note: This slide contains non-GAAP information, please see the REG
G in appendix for a detailed reconciliation. 2011 FY Guidance
does not include the impact of Engineering Integration; Valuation
Allowance release; restructuring of Chatham, Workhorse and
Monaco and impairment charges. |
 5
5
Purchased Engines
9900
SCHOOL BUS
9200 / 9400
Global Powertrain
7.2L
9.3L
4.8L
Leader in Products, Technology and
Innovation
2007 Product Offerings
2011 Product Offerings –
Well Positioned For the Future |
 6
6
Leader in Products, Technology and
Innovation
2011 Product Offerings –
Well Positioned For the Future
What’s Next:
Global Class 8 Truck
Global Powertrain
7.2L
9.3L
4.8L |
 7
7
At $15 to $20+ Billion Company
(Normal Industry)
At $7 to $8 Billion Company
Competitive Cost Structure
Leveraging Assets/Controlling Destiny
Scale 1-2-3
13L/15L Cost
Total (‘01 –
’05)
$1,423M
Total (‘06 –
’10)
$1,103M
*Capital expenditures excluding equity investments |
   8
8
•
Moving from focused facilities to
flexible manufacturing to minimize
logistics cost
•
School bus: All assembly in Tulsa
•
Huntsville: Ability to produce
V8/I6/DT engines on same line
•
Labor agreement
Competitive Cost Structure
Completed Actions
Next Steps to increase Shareholder Value
•
Leveraging assets
•
Integrated Product Development
Center
•
Truck Plants: Chatham, Monaco &
Workhorse
NYSE: NAV
GAP
CAP
SAP
TBP
HEP
CBP
MPP
EAP |
 Medium
Truck
Great Products –
Market Share
Severe Service
Truck
Heavy
Truck
FY09
61%
FY10
59%
JuneYTD11
47%
FY09
35%
FY10
38%
JuneYTD11
39%
FY09
34%
FY10
33%
JuneYTD11
33%
FY09
25%
FY10
24%
JuneYTD11
16%
Combined Class 8
School
Bus
(U.S. & Canada)
Class 4-5
JuneYTD
11
Industry
23K
Navistar
900
Market Share
~4%
9
20% Market Share
JuneYTD11
NYSE: NAV
School Bus & Combined Class 6-8 Market Share –
FY09:
34%;
34%;
FY10:
33%;
33%;
JuneYTD11:
27%
27% |
 10
10
35%
43%
19%
22%
0%
10%
20%
30%
40%
50%
60%
Nov-Mar
Apr-Jun
Nov-Mar
Apr-Jun
Great Products –
Growing Market Share
with Increased Customer Experience
(U.S. & Canada)
Class 6-7
Combined Class 8
Class 8 Strategy
What We’ve Said
•
Convert to
proprietary U.S. and
Canada diesel
engine
•
Transition industry
from 15L to 13L
•
Customer
experience during
transition will drive
increased second
half momentum |
 11
11
U.S. and Canada Heavy Strategy –
Launch of Derivative Products
Severe Service
Heavy
ProStar
®
with
MaxxForce
®
15
Sloped Nose
WorkStar
®
PayStar
®
with
MaxxForce
®
15
LoneStar
®
with
500HP MaxxForce
®
13
9900 with
MaxxForce
®
15
CAT CT660
Available now
Expected Q1 2012
Continue to Broaden Product Offering
Combined
Class 8 |
 12
12
Navistar Defense
•
Era of efficiency
–
Government will look to industry
for:
•
Higher quality
•
Lower cost
•
Quicker development
•
Sustainment of existing vehicle
fleets will continue (increase)
2008
2009
2010
2011+
> $2B
> $2B
> $2B
~$1.9B |
 13
13
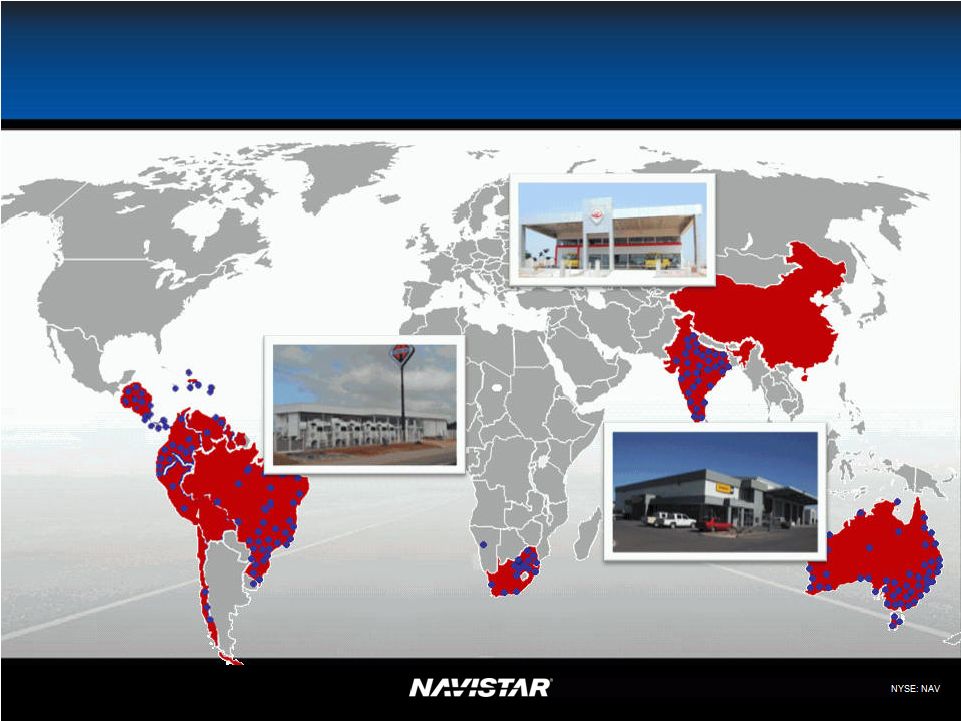
Differentiated Global Distribution
Currently 410 branded sales or service points |
 14
14
Results –
Vehicle Integration Drives
Profitable Growth
(U.S., Canada, Mexico, excludes Military)
North American Parts Sales
$0
$500
$1,000
$1,500
$2,000
2009
2010
2011 Fcst |
  15
15
Actual
Annualizing
Industry
YTD June
YTD June
School Bus
16,500
18,000
11,700
17,500
15,000
18,000
Class 6-7 - Medium
52,500
58,000
40,900
61,300
60,000
67,000
Combined Class 8 (Heavy & Severe Service)
171,000
184,000
108,300
162,400
165,000
175,000
Total Industry Demand
240,000
260,000
160,900
241,200
240,000
260,000
FY 11
FY 11
Historical Information
United States and Canadian Class 6-8 Truck Industry - Retail Sales Volume
Original Guidance
Revised Guidance
2011 Update
Position Us For When Market Returns:
Industry Landscape –
Investing in Our Future
100,000
200,000
300,000
400,000
500,000
1999
2000
2001
2002
2003
2004
2005
2006
2007
2008
2009
2010
2011
U.S. and Canada Class 6-8 Retail Industry
2011 Drivers:
•Differentiation and leadership
•Deliver customer value
Fuel economy with EGR
Convert 15L to 13L
Strength of dealer network
•Focus on cost structure
Flexible manufacturing
Integrated product development
•Invest in global growth |
 16
16
3,000
4,300
0
2,000
4,000
6,000
8,000
10,000
12,000
FY 2010
FY 2011 YTD June
FY 2011 FCST
Maximize Profit While Protecting Markets
Balance needs of customers with supplier capacity
As reported on 6/7/2011
in Q2 presentation:
Updated
Outlook:
Combined
Class 8
FY2011
Revised FY2011
Industry
171K -
184K
165K -
175K
Navistar
42K -
46K
38K -
40K
Market Share
~25%
~23% -
24%
Global Truck: Latin America & Caribbean
U.S. and Canada Combined Class 8 Retail Sales
ProStar
®
10,000 –
12,000
TranStar
®
WorkStar
®
Mixer
(This represents retail deliveries)
12.5%
18.0%
YTD FY2010
YTD FY2011
Market Share |
 17
2011 Analyst Day
2011 Analyst Day
Today
Today
2011 Business Drivers
2011 Business Drivers
•
Industry
recovering
(240K
–
260K)
•
Industry (240K –
260K) Heavy
, Class 6-7
•
Maintain
Market
Share
–
Back-end
loaded
•
Maintain Market Share –
Back-end loaded
•
Military
$1.5B
-
$2.0B Revenue
•
Military –
~$1.9B Revenue
•
Global
Investing to profitable
•
“Total”
Global
–
Profitable
•
15L Launch
•
15L
Launch
–
Launched
in
March
•
Engineering
Slightly up
•
Engineering
–
Slightly
up
•
Engine segment profitability -
~$100M
(back end loaded)
•
Engine segment profitability -
~$100M
(back end loaded)
•
Adjusted EPS
-
$5.00 to $6.00
•
Adjusted EPS
-
$5.50 to $6.00
•
Manufacturing
Cash
-
$1.2B
-
$1.4B
•
Manufacturing Cash
-
$1.2B
-
$1.4B
2011 One-Time Items
2011 One-Time Items
•
Engineering Integration
•
Engineering Integration
–
on track
•
Manufacturing
•
Manufacturing
–
Chatham,
Monaco
and
Workhorse
•
Valuation Allowance
•
Valuation Allowance
What We Said:
-
Convert 15L to 13L
-
Convert all
customers to
proprietary engine
-
Implement EGR
Note: This slide contains non-GAAP information, please see the REG
G in appendix for a detailed reconciliation. 2011 FY Guidance
does not include the impact of Engineering Integration; Valuation
Allowance release; restructuring of Chatham, Workhorse and
Monaco and impairment charges. |
 NYSE: NAV
18
18
2011 Financial Guidance
•
$5.50 –
$6.00 adjusted EPS with this
being heavily weighted towards Q4
•
Q4 2011 drivers
–
Truck
•
10% increase in operating days in Q4 vs. Q3
•
Worldwide production up at > 25% from Q4
to Q3
•
Military revenues at ~$700M Q4
vs. ~$330M Q3
•
>50% increase in Latin America units vs. Q3
•
Supply base -
balance needs of customers
with supplier capacity
–
Engine
•
Big Bore engine production currently at ~800
per week and will ramp up to ~1,200 per
week by year end
•
South America –
record year
•
Cost per unit reductions
Navistar Consolidated Revenues ($ in Billions)
Navistar Adjusted Diluted EPS
Note: This slide contains non-GAAP information, please see the REG
G in appendix for a detailed reconciliation. 2011 FY Guidance
does not include the impact of Engineering Integration; Valuation
Allowance release; restructuring of Chatham, Workhorse and
Monaco and impairment charges.
$0
$2
$4
$6
$8
$10
$12
$14
$16
1st Half
2nd Half
Full Year Guidance
$0.0
$1.0
$2.0
$3.0
$4.0
$5.0
$6.0
$7.0
1st Half
2nd Half
Full Year Guidance
Guidance
$13.6 –
$14.3
$1.22
Guidance
$5.50 –
$6.00
Expected 2nd Half
$4.30 -
$4.80
$6.1
Expected 2nd
Half
$7.5 -
$8.2 |
 19
19
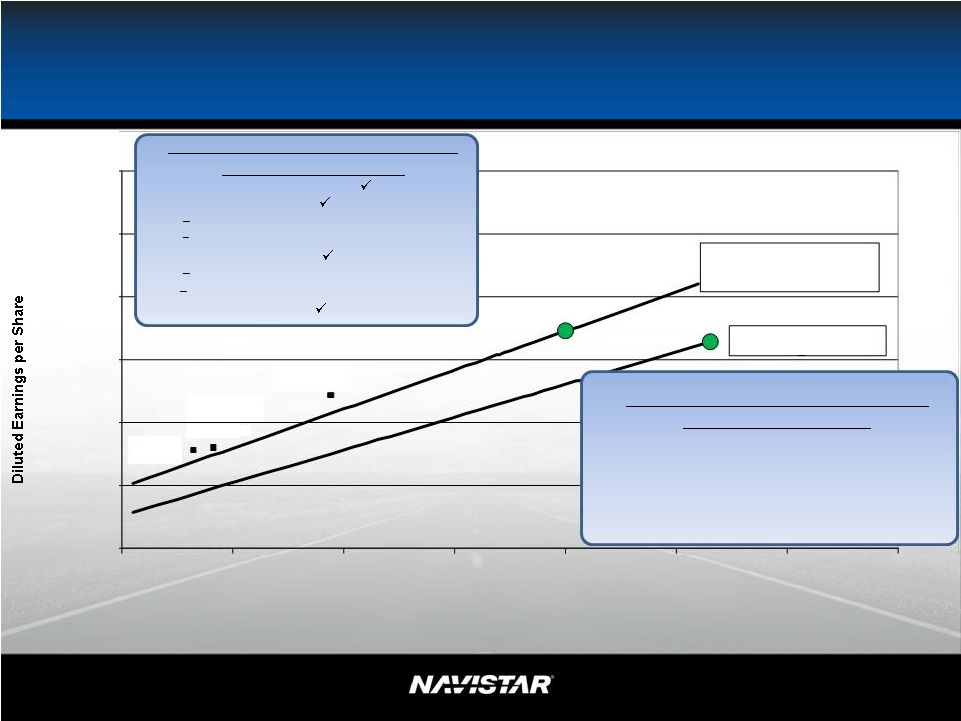
Driving Shareholder Value
Note: This slide contains non-GAAP information, please see the REG
G in appendix for a detailed reconciliation. 2011 FY Guidance
does not include the impact of Engineering Integration; Valuation
Allowance release; restructuring of Chatham, Workhorse and
Monaco and impairment charges.
$(5.00)
$-
$5.00
$10.00
$15.00
$20.00
$25.00
150
200
250
300
350
400
450
500
Traditional Industry Volume (Thousands of Units)
Original
segment
profit
goal
assumed
a
share
count
of
72.5M shares and a tax rate of 25% .
2009
Actual
2010
2008
Actual
Original $1.6B Segment
Profit Goal
@ 415k
units
$1.8B Segment Profit
Goal
@ 350k
units
2011
results
and
commitment
to
earnings unchanged
•
Differentiation and leadership
•
Deliver customer value
Fuel economy with EGR
Convert 15L to 13L
•
Focus on cost structure
Flexible manufacturing
Integrated product development
•
Invest in global growth
Actual
NYSE: NAV
2012
and
Future
–
commitment
to
earnings unchanged
•
Market recovery
•
Increased product offering
•
Product differentiation
•
Military
–
$1.5B
-
$2.0B
Revenue
•
Global
Truck
–
Move
from
investing
to
profitability
•
Protect shareholder value/Maximize profitability |
 NYSE: NAV
20
20
SEC Regulation G –
Non-GAAP
Reconciliation
Manufacturing
Segment
Results:
We
believe
manufacturing
segment
results,
which
includes
the
segment
results
of
our
Truck, Engine, and Parts reporting segments, provide meaningful information of our
core manufacturing business and therefore we use it to supplement our GAAP
reporting by identifying items that may not be related to the core manufacturing business.
Management often uses this information to assess and measure the
performance of our operating segments. We have chosen
to provide this supplemental information to investors, analysts and other
interested parties to enable them to perform additional analyses of
operating results, to illustrate the results of operations giving effect to the non-GAAP adjustments shown in the
below reconciliation, and to provide an additional measure of performance.
Adjusted Net Income and Diluted Earnings Per Share Attributable To Navistar
International Corporation and Adjusted Manufacturing
Segment
Profit:
We
believe
that
adjusted
net
income,
diluted
earnings
per
share
attributable
to
Navistar
International Corporation, and adjusted manufacturing segment profit excluding
engineering integration costs, certain restructuring costs, and certain
impairment charges, which are not considered to be part of our ongoing business, improve the
comparability of year to year results and are representative of our underlying
performance. We have chosen to provide this supplemental information to
investors, analysts, and other interested parties to enable them to perform additional analyses of
operating results, to illustrate the results of operations giving effect to the
non-GAAP adjustments shown in the below reconciliations, and to provide
an additional measure of performance. The financial measures presented below are unaudited and
not in accordance with, or an alternative for, financial measures presented in accordance with
U.S. generally accepted accounting principles (GAAP). The non-GAAP financial information
presented herein should be considered supplemental to, and not as a substitute for, or superior
to, financial measures calculated in accordance with GAAP. |
 21
21
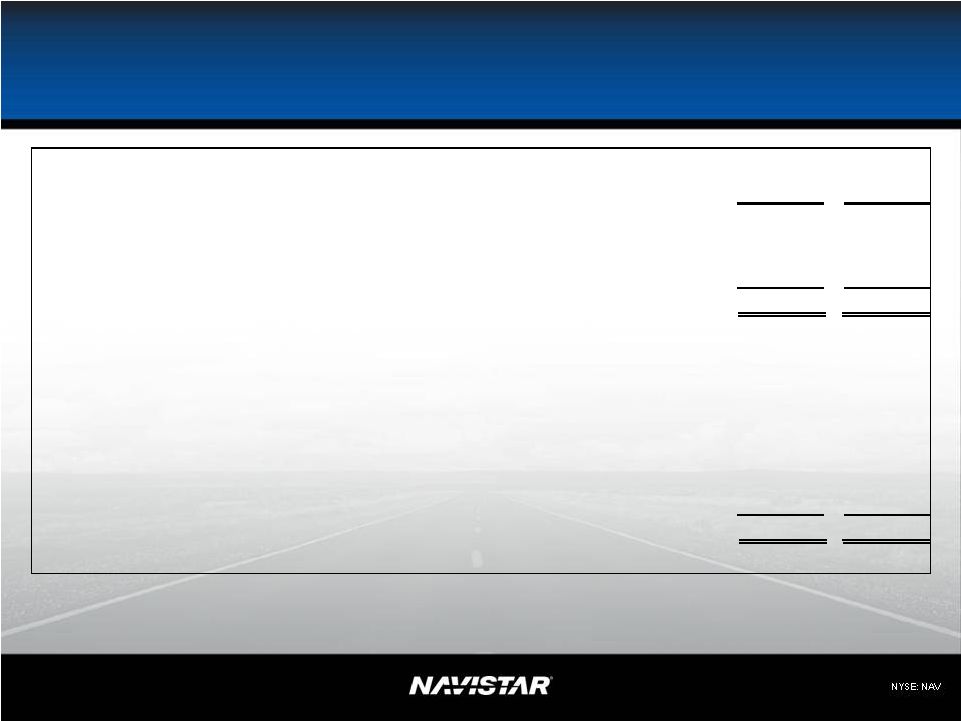
SEC Regulation G –
2011
Guidance
Lower
Upper
(Dollars in Millions, except per share data)
Net income attributable to Navistar International Corporation
$ 190
$ 288
Plus: Engineering integration costs
(A)
77
77
Impairments and restructuring and related charges
(B)
160
100
Adjusted net income attributable to Navistar International Corporation
$ 427
$ 465
Diluted earnings per share attributable to Navistar International Corporation
$ 2.45
$ 3.71
Effect
of
adjustments
on
diluted
earnings
per
share
attributable
to
Navistar
International
Corporation
2.29
Adjusted diluted earnings per share attributable to Navistar International Corporation
$ 5.50
$ 6.00
Approximate diluted weighted shares outstanding
(C)
77.6
77.6
Fiscal 2011 guidance: adjusted net income and diluted earnings per share attributable to Navistar
International Corporation reconciliation:
(A)
Engineering integration costs relate to the consolidation of our truck and engine engineering
operations as well as the move of our world headquarters. We continue to develop
plans for efficient transitions related to these activities and the optimization of our operations
and management structure.
(B)
Impairments and restructuring and related charges are charges relate to our plans to close our
Chatham, Ontario and Workhorse chassis plant in Union City, Indiana, and to significantly
scale back operations at its Monaco recreational vehicle headquarters and motor coach manufacturing plant in Coburg, Oregon. In addition, as a result of these
expected actions, as well as other factors, the Company concluded that there was a trigger event for
the review for impairment of various long-lived assets, including certain intangible
assets, related to these facilities. We expect most of these charges to be incurred during the third and fourth quarters of 2011, with the remainder taking place in 2012.
(C)
Approximate diluted weighted shares outstanding based on assumed average share price of
$65 per share during the period.
Note: Above reconciliation does not include the impact of the potential income tax valuation
allowance release.
3.05 |
 22
SEC Regulation G –
EPS vs.
Traditional Industry
(A) Revised Target sales and revenues, net –
Projections based on $17-18B of GAAP revenue and $2-3B of Non-GAAP revenue related to
Navistar's share of non-consolidated affiliates. Original
Target
Revised
Target
U.S. & Canada Industry
414,500
350,000
Sales and Revenues, Net
(A)
$15 +
$20 +
Diluted earnings per share attributable to Navistar International
Corporation $ 11.46
$ 12.31
Approximate diluted weighted shares outstanding
~ 72.5
~ 72.5
(Dollars in Millions)
Net income (loss) attributable to Navistar International Corporation
$ 825
$ 892
Less: Financial services segment profit, Corporate and eliminations,
and income taxes (775)
(888)
Manufacturing segment profit
$ 1,600
$ 1,780 |
 23
23
SEC Regulation G –
Fiscal Year
Comparison
2009
2008
(Dollars in Millions, except per share data)
Net income attributable to Navistar International Corporation
$ 320
$ 134
Plus:
Ford
settlement,
restructuring
and
related
charges
(benefits)
(A)
(157)
36
Impairment
of
property,
plant,
and
equipment
(B)
31
358
Write-off
of
debt
issuance
costs
(C)
11
-
Adjusted net income attributable to Navistar International Corporation
$ 205
$ 528
Adjusted diluted earnings per share attributable to Navistar International
Corporation $ 2.86
$ 7.21
Diluted weighted shares outstanding
71.8
73.2
Adjusted net income and diluted earnings per share attributable to Navistar
International Corporation reconciliation:
(A)
Ford settlement, restructuring and related charges (benefits) include the impact of our settlement
with Ford in 2009 as well as charges and benefits recognized related to restructuring activity
at our Indianapolis Casting Corporation and Indianapolis Engine Plant. The charges and benefits were recognized in our Engine segment with the
exception of $3 million of income tax expense and $1 million of income tax benefit related to the
settlement in 2009 and 2008 respectively. (B)
Impairment of property, plant, and equipment in 2008 are related to impairments to the asset groups
in the Engine segment’s VEE Business Unit. The 2009 impairments relate to charges
recognized by the Truck segment for impairments related to asset groups at our Chatham and Conway facilities
(C)
The write-off of debt issuance costs in 2009 relate to charges related to the Company’s
refinancing. |
 24
24
SEC Regulation G –
Six Months
Ended April 30, 2011
Six Months
Ended
April 30, 2011
(Dollars in Millions, except per share data)
Net income attributable to Navistar International Corporation
$ 68
Plus:
Engineering integration costs
(A)
26
Adjusted net income attributable to Navistar International Corporation
$ 94
Diluted earnings per share attributable to Navistar International Corporation
$ 0.87
Effect
of
adjustments
on
diluted
earnings
per
share
attributable
to
Navistar
International
Corporation
0.35
Adjusted diluted earnings per share attributable to Navistar International Corporation
$ 1.22
Diluted weighted shares outstanding
77.3
Adjusted net income and diluted earnings per share attributable to Navistar International Corporation
reconciliation: (A)
Engineering integration costs relate to the consolidation of our truck and engine engineering
operations as well as the move of our world headquarters. We continue to develop plans
for efficient transitions related to these activities and the optimization of our operations and management structure.
|