Attached files
| file | filename |
|---|---|
| 8-K - FORM 8-K - Encompass Health Corp | form8k_08092011.htm |
| EX-99.1 - EXHIBIT 99.1 - Encompass Health Corp | exhibit99-1.htm |

Exhibit 99.2
Budget Control Act of 2011 Conference Call
August 9, 2011
August 9, 2011
Jay Grinney, President and Chief Executive Officer
1

Exhibit 99.2
The information contained in this presentation includes certain estimates, projections and other
forward-looking information that reflect our current views with respect to future events and financial
performance. These estimates, projections and other forward-looking information are based on
assumptions that HealthSouth believes, as of the date hereof, are reasonable. Inevitably, there will
be differences between such estimates and actual results, and those differences may be material.
There can be no assurance that any estimates, projections or forward-looking information will be
realized.
realized.
All such estimates, projections and forward-looking information speak only as of the date hereof.
HealthSouth undertakes no duty to publicly update or revise the information contained herein.
HealthSouth undertakes no duty to publicly update or revise the information contained herein.
You are cautioned not to place undue reliance on the estimates, projections and other forward-
looking information in this presentation as they are based on current expectations and general
assumptions and are subject to various risks, uncertainties and other factors, including those set
forth in the Form 10-K for the year ended December 31, 2010, the Form 10-Q for the quarters ended
March 31, 2011, and June 30, 2011, and in other documents we previously filed with the SEC, many
of which are beyond our control, that may cause actual results to differ materially from the views,
beliefs and estimates expressed herein.
Note Regarding Presentation of Non-GAAP Financial Measures
The following presentation includes certain “non-GAAP financial measures” as defined in
Regulation G under the Securities Exchange Act of 1934. Schedules are attached that reconcile
the non-GAAP financial measures included in the following presentation to the most directly
comparable financial measures calculated and presented in accordance with Generally
Accepted Accounting Principles in the United States. Our Form 8-K, dated August 9, 2011, to which
the following supplemental slides are attached as Exhibit 99.2, provides further explanation and
disclosure regarding our use of non-GAAP financial measures and should be read in conjunction
with these supplemental slides.
Forward-Looking Statements
2
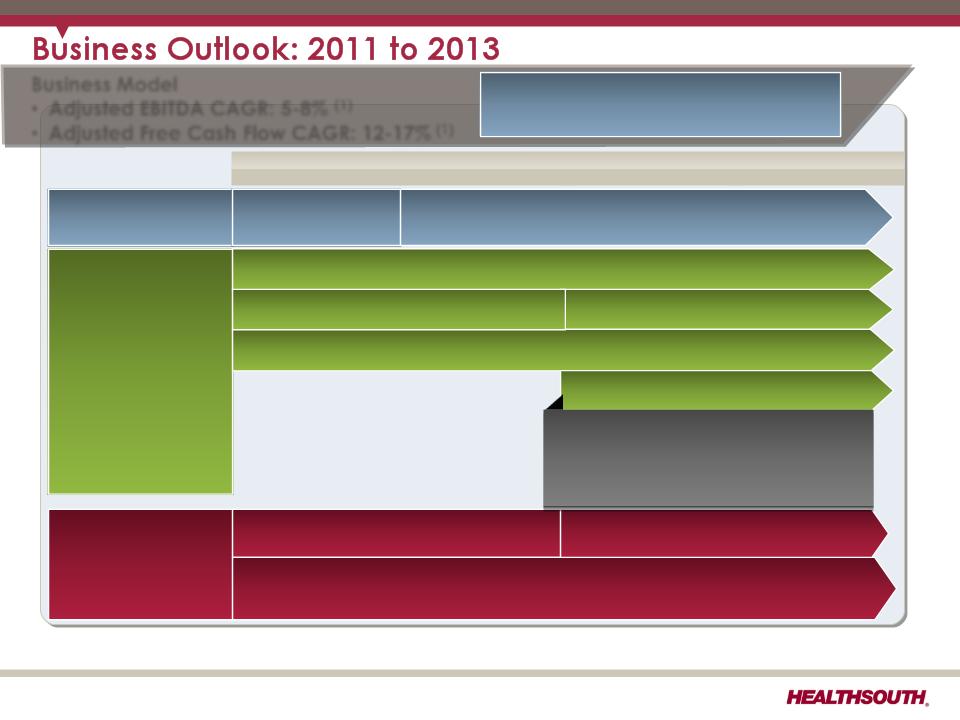
Exhibit 99.2
Business Model
• Adjusted EBITDA CAGR: 5-8% (1)
• Adjusted Free Cash Flow CAGR: 12-17% (1)
Strategy
2010
2011
2012
2013
Delevering (2)
Achieved 3.5x
debt to EBITDA
debt to EBITDA
Longer-Term Goal: ~ 3.0x debt to EBITDA
Growth
Same-store growth (Includes capacity expansions and unit consolidations)
De novos (minimum of 4/year)
IRF acquisitions (~ 2-3/year)
Opportunistic, disciplined acquisitions
of complementary post-acute services
of complementary post-acute services
(1) Reconciliation to GAAP provided on slides 19 - 26.
(2) Exclusive of any E&Y recovery.
3
De novos (~2-3/year)
• Clinical Information System (CIS)
Pilot and rollout
Pilot and rollout
Key
Operational
Initiatives
Operational
Initiatives
•Beacon (Management Reporting Software) = Labor / outcomes / quality optimization
•TeamWorks = Care Management
•“CPR” (Comfort, Professionalism, Respect) Initiative
• CIS Implementation
Key Criteria:
•Achieving delevering goal
•Regulatory clarity
•Market conditions
•Purchase price and terms and conditions
Reaffirmed Business Model

Strong and Sustainable Business Fundamentals
Growth Opportunities
Financial Strengths
Industry Leading Position
Attractive Healthcare Sector
4
Cost-Effectiveness
Real Estate Portfolio
(1) Inclusive of non-consolidated entities
Exhibit 99.2

Impact Analysis
5
Exhibit 99.2

6
Estimated Impact to HealthSouth
Scenario
Comments
Our assessment of potential Medicare reductions emanating from
the Budget Control Act
the Budget Control Act
1) Special
Committee actions
mirror President’s
Fiscal Commission
(Simpson Bowles)
Committee actions
mirror President’s
Fiscal Commission
(Simpson Bowles)
(million)
Net Operating Revenues ($4.0)
Adjusted EBITDA ($7.0)
• Impact is shown for 2012
• Areas impacted are provider tax
rebates and Medicare bad debt
recoveries
rebates and Medicare bad debt
recoveries
• Revision would be permanent
2) Special
Committee fails and
default mechanism
is triggered
Committee fails and
default mechanism
is triggered
(million)
Net Operating Revenues ($32.0)
Adjusted EBITDA ($32.0)
• Effective 10/1/12; impact is shown for 2013
• Assumes 2% sequestration (1) of Medicare
payments
payments
• Beyond 2013:
− Medicare reimbursement would be subject
to market basket updates less healthcare
reform adjustments.
to market basket updates less healthcare
reform adjustments.
− Medicare revenues may continue to be
subject to sequestration (1)
subject to sequestration (1)
Translates to an effective
price freeze for 2013
price freeze for 2013
Above estimates assume no mitigating actions by HealthSouth
(1) In any year for which there is sequestration, the reduction would be made from whatever level of payment would otherwise be provided
under Medicare law and regulations. If hospital prospective payments were scheduled to increase by 4 percent, then a 2 percent
reduction (that is, payment of 98 percent of the normal payment amount) would permit some increase to remain. (Source: Conference
Committee Report on the Balanced Budget and Emergency Deficit Control Act of 1985 as Applicable to Medicare and Medicaid
Programs. Congressional Record (H 11706-11707) December 10, 1985)
Exhibit 99.2

HealthSouth Track Record
7
Exhibit 99.2

HealthSouth has successfully managed through
Medicare payment cuts and an economic recession…
Medicare payment cuts and an economic recession…
8
Adjusted EBITDA ($million)
Discharges
Exhibit 99.2

HealthSouth differentiates itself by its quality….
FIM Gain
Change in
Functional
Independence
Measurement
(based on an 18
point assessment)
from admission to
discharge
Functional
Independence
Measurement
(based on an 18
point assessment)
from admission to
discharge
9
(1) Average = Expected, Risk-adjusted for UDS database
• Inpatient rehabilitation hospitals evaluate all patients at admission and upon
discharge to determine their functional status.
discharge to determine their functional status.
− The Functional Independence Measurement (“FIM”) patient assessment
instrument is used for these evaluations.
instrument is used for these evaluations.
• The difference between the FIM scores at admission and upon discharge is called
the “FIM Gain.”
the “FIM Gain.”
− The greater the FIM Gain, the greater the patient’s level of independence, the
better the patient outcome.
better the patient outcome.
Exhibit 99.2
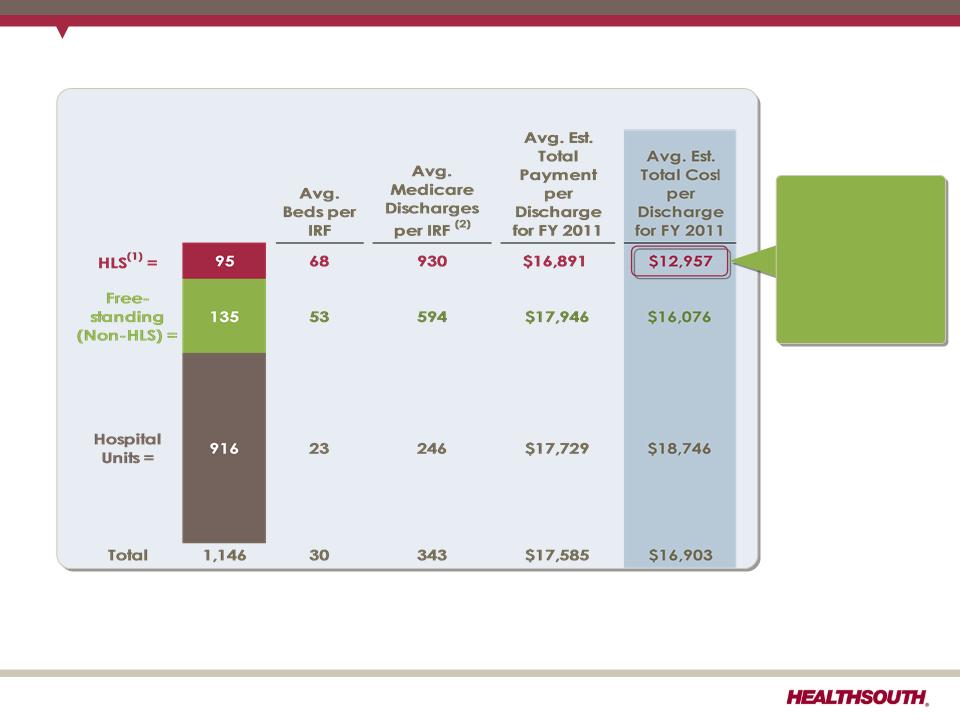
(1) The 1,146 total and the 95 for HLS do not include HealthSouth Rehabilitation Hospital of Fredericksburg, VA. Also, HealthSouth Sugar Land Rehabilitation
Hospital, purchased in September 2010, was included in the 135 non-HLS freestanding.
Hospital, purchased in September 2010, was included in the 135 non-HLS freestanding.
(2) In 2010, HealthSouth averaged 1,150 total Medicare and non-Medicare discharges in its 95 consolidated hospitals and 6 long-term acute care hospitals.
Sources: FY 2011 CMS Rate Setting File - see next page
10
Total Inpatient Rehabilitation Facilities (IRFs): 1,146 (1)
HealthSouth differentiates itself by its cost-effectiveness…
HealthSouth
differentiates
itself by
providing
superior quality
care at a
differentiates
itself by
providing
superior quality
care at a
lower cost.
Exhibit 99.2

CMS Fiscal Year 2012 IRF Rate Setting File Analysis
Notes:
(1) All data provided was filtered and compiled from the Centers for Medicare and
Medicaid Services (CMS) Fiscal Year 2012 IRF rate setting Final Rule file found at
http://www.cms.gov/InpatientRehabFacPPS/07_DataFiles.asp#TopOfPage. The
data presented was developed entirely by CMS and is based on its definitions
which are different in form and substance from the criteria HealthSouth uses for
external reporting purposes. Because CMS does not provide its detailed
methodology, HealthSouth is not able to reconstruct the CMS projections or the
calculation.
(2) The CMS file contains data for each of the 1,146 inpatient rehabilitation facilities
used to estimate the policy updates for the FY 2012 IRF-PPS Final Rule. Most of the
data represents historical information from the CMS fiscal year 2009 period and
does not reflect the same HealthSouth hospitals in operation today. The data
presented was separated into three categories: Freestanding, Units, and
HealthSouth. HealthSouth is a subset of Freestanding and the Total.
11
Exhibit 99.2

(1) Data provided by UDSMR, a data gathering and analysis organization for the rehabilitation industry; represents ~ 65-70% of industry,
including HealthSouth sites.
including HealthSouth sites.
(2) Includes consolidated HealthSouth inpatient rehabilitation hospitals classified as same store during that time period.
HealthSouth’s volume growth has consistently outpaced competitors…
4.7%
5.9%
5.9%
5.8%
5.9%
2.7%
2.5%
1.3%
12
2008 vs. 2009 vs. 2010 vs. Q110 vs. Q210 vs. Q310 vs. Q410 vs. Q111 vs. Q211 vs.
2007 2008 2009 Q109 Q209 Q309 Q409 Q110 Q211
Exhibit 99.2

HealthSouth has delevered its balance sheet and enhanced its
adjusted free cash flow…
adjusted free cash flow…
13
Leverage Ratio(1)
(billions)
(1) Reconciliation to GAAP provided on slides 19 - 26.
Interest Expense
$229
$135
Exhibit 99.2

(2) Does not include $387.4 million of convertible perpetual preferred stock and capital leases and other note payables.
HealthSouth is now positioned with a lower-cost, flexible capital
structure…
structure…
14
$500
Revolver
L+250
§Adequate undrawn capacity under the revolver
§The Company now expects interest expense(1) to be at a $24 million run rate in
Q4 2011
Q4 2011
§Additional debt pre-payment opportunities and flexible covenants
§No near-term maturities and well spaced debt maturities
§Limited exposure to higher interest rates
June 30 , 2011 proforma for Sept. 1, 2011 Retirement of the 10.75% Senior Notes(2)
$254
Undrawn
Undrawn
2016
10% of the principal is callable
each year at $103
each year at $103
Exhibit 99.2

Free Cash Flow Reinvestment
15
Exhibit 99.2

HealthSouth’s priorities for reinvesting free cash flow…
16
• Additional debt prepayment (revolver, term loan
and senior notes)
and senior notes)
• Growth in core business
• Bed expansions
• De novo hospitals
• Hospital acquisitions
• Acute care IRF unit acquisition/consolidation
• Purchase properties under operating leases
• Lower capital cost
• Greater control of property, CON and/or license
• Share repurchase
• Offset shares underlying convertible preferred shares
(13.1 million shares)
(13.1 million shares)
• Offset shares issued in settlement of securities litigation
(5.0 million shares)
(5.0 million shares)
• Cash dividends (one time or regular)
Business Model: Adjusted free cash flow CAGR: 12-17% (1)
(1) Reconciliation to GAAP provided on slide 19.
Exhibit 99.2

Strong and Sustainable Business Fundamentals
Growth Opportunities
Financial Strengths
Industry Leading Position
Attractive Healthcare Sector
17
Cost-Effectiveness
Real Estate Portfolio
(1) Inclusive of non-consolidated entities
Exhibit 99.2

Reconciliations to GAAP
18
Exhibit 99.2

Adjusted Free Cash Flow
(1) Maintenance capital expenditures are expected to be $60 million in 2011 and $75 million in 2012.
(2) Final swap payment of $10.9 million was made in March 2011.
19
Exhibit 99.2

Net Cash Provided by Operating Activities
20
Exhibit 99.2

Reconciliation of Net Income to Adjusted EBITDA (1)(3)
(1) (2) (3) - Notes on page 26.
21
Exhibit 99.2

Reconciliation of Net Income to Adjusted EBITDA (1)(3)
(1) (2) (3) - Notes on page 26.
22
Exhibit 99.2

Reconciliation of Net Income to Adjusted EBITDA (1) (3)
(1) (2) (3) - Notes on page 26.
23
Exhibit 99.2

Reconciliation of Net Income to Adjusted EBITDA (1) (3)
(1) (2) (3) - Notes on page 26.
24
Exhibit 99.2

Reconciliation of Net Income to Adjusted EBITDA (1) (3)
(1) (2) (3) - Notes on page 26.
25
Exhibit 99.2

Reconciliation Notes for Slides 21- 25
1. Adjusted EBITDA is a non-GAAP financial measure. The Company’s leverage ratio (total
consolidated debt to Adjusted EBITDA for the trailing four quarters) is, likewise, a non-
GAAP financial measure. Management and some members of the investment
community utilize Adjusted EBITDA as a financial measure and the leverage ratio as a
liquidity measure on an ongoing basis. These measures are not recognized in
accordance with GAAP and should not be viewed as an alternative to GAAP
measures of performance or liquidity. In evaluating Adjusted EBITDA, the reader should
be aware that in the future HealthSouth may incur expenses similar to the adjustments
set forth.
2. Per share amounts for each period presented are based on diluted weighted average
shares outstanding unless the amounts are antidilutive, in which case the per share
amount is calculated using the basic share count after subtracting the $6.5 million per
quarter dividend on the convertible perpetual preferred stock. The difference in shares
between the basic and diluted shares outstanding is primarily related to our
convertible perpetual preferred stock.
3. Adjusted EBITDA is a component of our guidance.
26
Exhibit 99.2