Attached files
| file | filename |
|---|---|
| 8-K - FORM 8-K - ENCORE CAPITAL GROUP INC | d8k.htm |
  Encore
Capital Group Investor Presentation August 2011
Exhibit 99.1 |
 CAUTIONARY NOTE ABOUT FORWARD-LOOKING STATEMENTS
2
FORWARD-LOOKING STATEMENTS
The statements in this presentation that are not historical facts, including, most
importantly, those statements preceded by, or that include, the words “may,”
“believe,” “projects,” “expects,” “anticipates” or the
negation thereof, or similar expressions, constitute “forward-looking statements”
within the meaning of the Private Securities Litigation Reform Act of 1995 (the “Reform
Act”). These statements may include, but are not limited to, statements regarding
our future operating results and growth. For all “forward-looking
statements,” the Company claims the protection of the safe harbor for forward-looking
statements contained in the Reform Act. Such forward-looking statements involve
risks, uncertainties and other factors which may cause actual results, performance or
achievements of the Company and its subsidiaries to be materially different from any future
results, performance or achievements expressed or implied by such forward-looking
statements. These risks, uncertainties and other factors are discussed in the reports
filed by the Company with the Securities and Exchange Commission, including the
most recent reports on Forms 10-K, 10-Q and 8-K, each as it may be amended from
time to time. The Company disclaims any intent or obligation to update these
forward-looking statements. |
 INVESTMENT HIGHLIGHTS
3
•
Favorable supply and demand dynamics have existed since
2008, with
a few credible, large buyers
•
Strong performance is expected to continue
•
Operational and financial leverage is increasing, largely due to
the
success of our operating center in India
•
Analytic insights inform our valuation and operating strategies
and allow for a closer partnership with consumers |
 ENCORE
IS A LEADING PLAYER IN THE CONSUMER DEBT BUYING AND RECOVERY INDUSTRY
4
Revenue Composition
As of June 30, 2011
Global Capabilities
Debt Purchasing & Collections
Bankruptcy Servicing
•
Purchase and collection
of
charged-off unsecured
consumer receivables
(primarily credit card)
•
Robust business model
emphasizing consumer
intelligence and
operational
specialization
•
Invested ~$2.0 billion to
acquire receivables with a face
value of ~$61 billion
•
Acquired ~36 million consumer
accounts since
inception
•
Process secured consumer bankruptcy accounts for leading
auto
lenders and other financial institutions
•
Proprietary software dedicated to bankruptcy servicing
•
Operational platform that integrates lenders, trustees,
and
consumers
Debt Purchasing & Collections
Bankruptcy Servicing
St Cloud, MN
Arlington, TX
Phoenix, AZ
Delhi, India
Call Center /
Technology Site
Call Center Site
Ascension
Call Center Site
San Diego, CA
Headquarters/
Call Center Site |
 STRATEGIC DECISIONS MADE OVER THE PAST DECADE
DEMONSTRATE OUR ABILITY TO FORESEE, AND ADAPT TO, CHANGES
5
•
Hired first statisticians
•
Created first and second generation
forecasting models
•
Created 1 generation operational
models
(mail channel and call center)
•
In late 2005, we established a call center in
India. We believe it is the only late-stage
collections platform in India, at
approximately 1/3 the cost of our U.S.
operations
•
Between 2005 and 2007 we remained
disciplined and avoided high priced
portfolios
that did not meet internal hurdle
rates
•
In 2008 we built and implemented the industry’s
first known ability-to-pay (capability) model
•
In 2009, we ramped up
purchasing
to take
advantage of the favorable
market environment
•
In February 2010, we entered
into a new $327.5 million
revolving credit facility which
was subsequently increased
to $410.5 million, and added
$75 million in two private
placement transactions with
Prudential
Emerging Market
2001
2003
Overconfidence and
Irrational Pricing
2005
2007
Attractive Opportunity
2011
2009
2002
2004
2006
2008
2010
Demand
Supply
st |
 THESE
DECISIONS ARE DRIVING STRONG RESULTS 6
2010
2009
YOY Growth
Annual Variance
$604,609
$116,817
24%
$487,792
Collections
$381,308
$64,889
21%
$316,419
Revenue
$346,656
$82,051
31%
$264,605
Adjusted EBITDA*
$361,957
$105,325
41%
$256,632
Purchases
$1.95
$0.58
42%
$1.37
EPS
($000s, except EPS and ratios)
* Adjusted EBITDA is a non-GAAP number. The Company considers Adjusted EBITDA
to be a meaningful indicator of operating performance and uses it as a measure to
assess the operating performance of the Company. See Reconciliation of Adjusted
EBITDA to GAAP Net Income at the end of this presentation. Q2 11
$195,081
$115,830
$116,484
$93,701
$0.58
Q2 10
$156,789
$96,231
$90,458
$83,337
$0.47 |
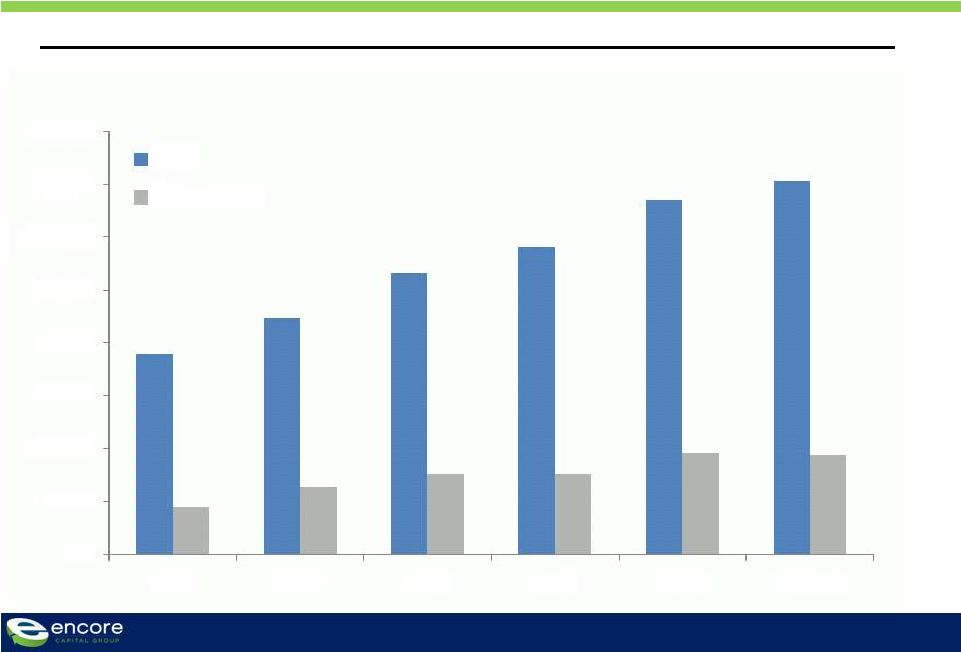
 WE HAVE
SIGNIFICANTLY INCREASED BOTH OPERATING CASH FLOW (ADJUSTED EBITDA) AND CASH
COLLECTIONS 7
($ millions)
*
Adjusted EBITDA is a non-GAAP number. The Company considers Adjusted EBITDA to
be a meaningful indicator of operating performance and uses it as a measure to
assess the operating performance of the Company. See Reconciliation of Adjusted
EBITDA to GAAP Net Income at the end of this presentation **
LTM data as of 06/30/2011
Adjusted EBITDA* and Gross Collections by year
$150
$250
$350
$450
$550
$650
2007
2008
2009
2010
LTM**
Gross Collections
Adjusted EBITDA |
 WHILE
ENHANCING THE FUTURE VALUE OF THE COMPANY 8
Annual Estimated Remaining Gross Collection (ERC) and Total Debt
($ millions, at end of period)
$0
$200
$400
$600
$800
$1,000
$1,200
$1,400
$1,600
2006
2007
2008
2009
2010
Q2 2011
ERC
Total Debt |
 WE
BELIEVE THAT OUR CURRENT ESTIMATE OF REMAINING COLLECTIONS IS CONSERVATIVE
GIVEN OUR HISTORY 9
Cumulative collections (initial expectation vs. actual)
($
millions,
March
01
–
June
11)
Actual cash
collections
Initial
projections
$-
$250
$500
$750
$1,000
$1,250
$1,500
$1,750
$2,000
$2,250
$2,500
$2,750
$3,000
$3,250
$3,500 |
 MARKET
DYNAMICS CONTINUE TO BE IN OUR FAVOR, WHILE THE REGULATORY ENVIRONMENT REMAINS
CHALLENGING 10
Charge-offs
remain
elevated
Consumer
credit continues
to experience
losses at near
record levels
Supply more
closely
managed by
the issuers
Demand
increasing, albeit
slowly
Few players with
access to
significant
amounts of capital
Continued exit of
large players, but
others starting to
gain traction
Consumer
performance
remains predictable
Our models continue
to predict consumer
behavior with a high
degree of accuracy
Significant
regulatory and
legislative scrutiny
Both in our industry
and in the financial
services sector at
large |
 OUR
CONSUMERS HAVE SHOWN THAT THEY ARE RESILIENT DESPITE THE MACROECONOMIC
ENVIRONMENT 11
Overall payer rate for all active inventory
2008
0.8%
0.9%
1.0%
1.1%
1.2%
1.3%
1.4%
1.5%
1.6%
Jan
Feb
Mar
Apr
May
Jun
Jul
Aug
Sep
Oct
Nov
Dec
2009
2010
2011 |
 AS A
RESULT, WE HAVE BEEN ABLE TO ACCELERATE OUR ABILITY TO HELP CONSUMERS MOVE
TOWARD FINANCIAL RECOVERY 12
Consumers with whom we have partnered to retire their debt (cumulative)
|
 WE
HAVE TAKEN A LEADERSHIP STANCE BY OUTLINING OUR CORE PRINCIPLES IN AN
INDUSTRY-FIRST CONSUMER BILL OF RIGHTS 13
Clearly states what our consumers
should expect during the collection
process
Gives consumers concrete
assurances about our conduct
No interest once payments are
established if maintained
No systematic messages left
Cessation of collections under
certain circumstances
Positions Encore as a company
that governmental entities should
consult with prior to enacting
regulations that impact the industry |
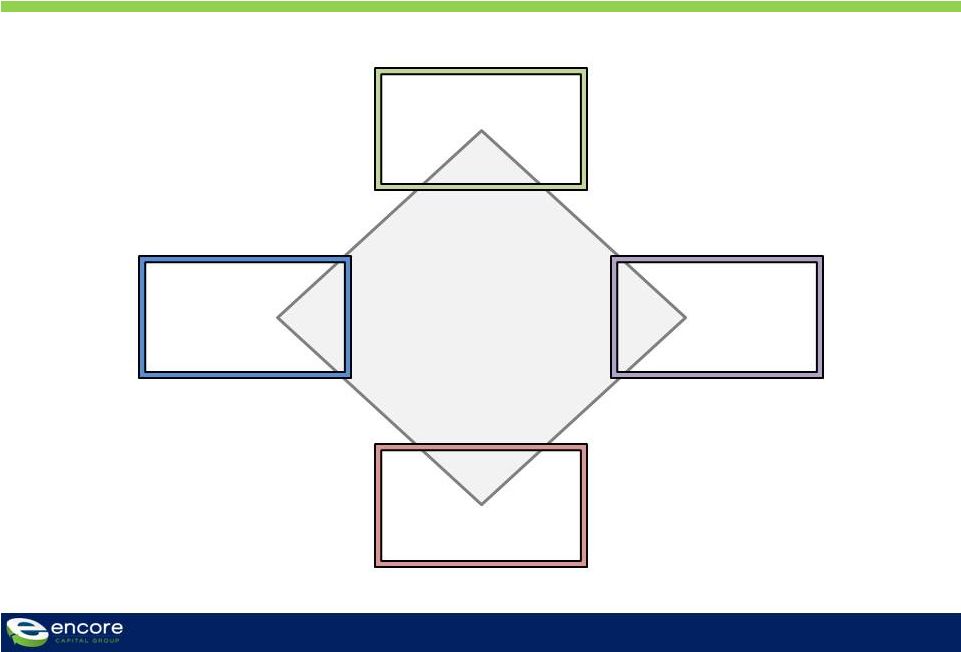 OUR
OPERATIONAL SUCCESS IS BASED UPON FOUR STRATEGIC PRIORITIES
14
ENCORE’S
STRATEGIC
PILLARS
ANALYTIC
STRENGTH
COST
LEADERSHIP
CONSUMER
INTELLIGENCE
PRINCIPLED
INTENT |
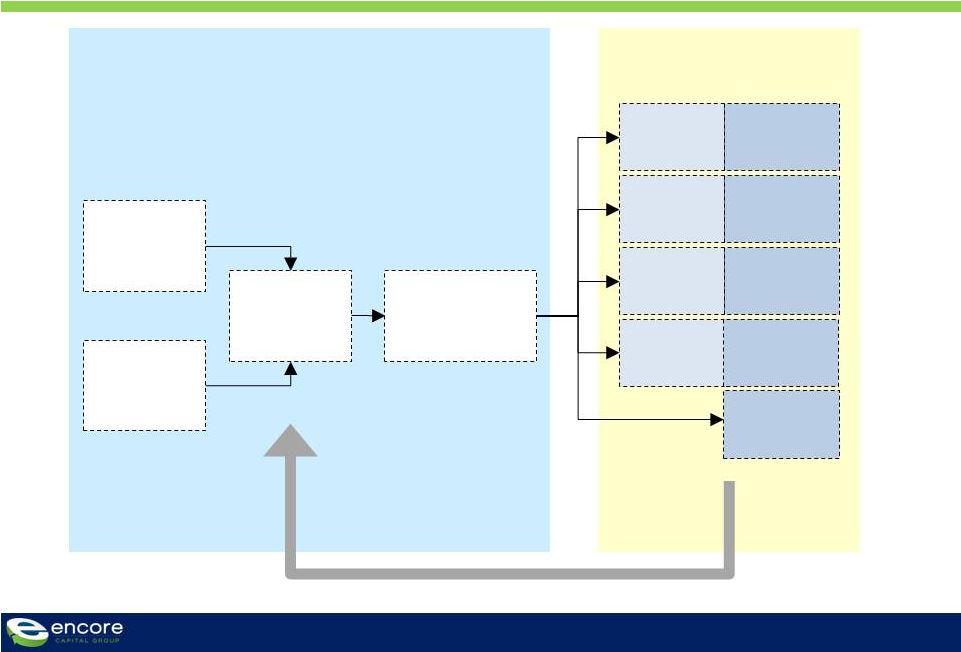 OUR
ANALYTIC REACH EXTENDS FROM PRE-PURCHASE THROUGHOUT OUR ENTIRE OWNERSHIP
PERIOD 15
No effort
Legal
Outsourcing
Legal effort
model with
Capability
Call
Centers
Call effort
model with
Capability
Direct
Mail
Letter effort
model with
Capability
Agency effort
model with
Capability
Collections operations that
optimize effort and profitability
Core competency in understanding the
payer behavior of distressed consumers
Cross-channel
coordination
and optimization
Consumer
behavior
research
Market data
and insight
Portfolio
valuation
Pre-purchase
model
Continuous feedback between
operations and valuation
Collection
Agency
Outsourcing |
 WE
HAVE FUNDAMENTALLY CHANGED THE COST STRUCTURE OF THE COMPANY OVER THE PAST FOUR
YEARS… 16
Variable cost to collect *
(%)
* Represents salaries, variable compensation and employee benefits
|
 DRIVEN
BY OUR ANALYTICS AND OUR INDIA CENTER, WITH THE LATTER PRODUCING HALF OF CALL
CENTER COLLECTIONS 17
Collections from all call centers
($ millions)
$126
$157
$186
$268
Percent
of Total:
10%
19%
30%
44%
~$340
50% |
 SUMMARY
18
•
Strong performance is expected to continue
•
Analytic insights inform our valuation and operating strategies
and allow for a closer partnership with consumers
•
Favorable supply and demand dynamics have existed since
2008, with a few credible, large buyers
•
Operational and financial leverage is increasing, largely due to
the
success of our operating center in India |
 APPENDIX: RECONCILIATION OF ADJUSTED EBITDA
19
Reconciliation of Adjusted EBITDA to GAAP Net Income
(Unaudited, In Thousands)
Three Months Ended
Note:
The
periods
3/31/07
through
12/31/08
have
been
adjusted
to
reflect
the
retrospective
application
of
ASC
470-20
3/31/07
6/30/07
9/30/07
12/31/07
3/31/08
6/30/08
9/30/08
12/31/08
3/31/09
6/30/09
9/30/09
12/31/09
3/31/10
6/30/10
9/30/10
12/31/10
3/31/11
6/30/11
GAAP net income, as reported
4,991
(1,515)
4,568
4,187
6,751
6,162
3,028
(2,095)
8,997
6,641
9,004
8,405
10,861
11,730
12,290
14,171
13,679
14,775
Interest expense
4,042
4,506
4,840
5,260
5,200
4,831
5,140
5,401
4,273
3,958
3,970
3,959
4,538
4,880
4,928
5,003
5,593
5,369
Contingent interest expense
3,235
888
-
-
-
-
-
-
-
-
-
-
-
-
-
-
-
-
Pay-off of future contingent interest
-
11,733
-
-
-
-
-
-
-
-
-
-
-
-
-
-
-
-
Provision for income taxes
3,437
(1,031)
1,315
2,777
4,509
4,225
2,408
(1,442)
5,973
4,166
5,948
4,609
6,490
6,749
6,632
9,075
8,601
9,486
Depreciation and amortization
869
840
833
810
722
766
674
652
623
620
652
697
673
752
816
958
1,053
1,105
Amount applied to principal on receivable portfolios
28,259
29,452
26,114
29,498
40,212
35,785
35,140
46,364
42,851
48,303
49,188
47,384
58,265
64,901
63,507
53,427
85,709
83,939
Stock-based compensation expense
801
1,204
1,281
1,001
1,094
1,228
860
382
1,080
994
1,261
1,049
1,761
1,446
1,549
1,254
1,765
1,810
Adjusted EBITDA
45,634
46,077
38,951
43,533
58,488
52,997
47,250
49,262
63,797
64,682
70,023
66,103
82,588
90,458
89,722
83,888
116,400
116,484 |