Attached files
| file | filename |
|---|---|
| EX-31.2 - Deer Consumer Products, Inc. | ex31-2.htm |
| EX-32.1 - Deer Consumer Products, Inc. | ex32-1.htm |
| EX-32.2 - Deer Consumer Products, Inc. | ex32-2.htm |
| EX-31.1 - Deer Consumer Products, Inc. | ex31-1.htm |
| EXCEL - IDEA: XBRL DOCUMENT - Deer Consumer Products, Inc. | Financial_Report.xls |
UNITED STATES
SECURITIES AND EXCHANGE COMMISSION
Washington, D.C. 20549
FORM 10-Q
|
x
|
QUARTERLY REPORT PURSUANT TO SECTION 13 OR 15(d) OF THE SECURITIES EXCHANGE ACT OF 1934
For the quarterly period ended June 30, 2011
|
|
OR
|
|
|
¨
|
TRANSITION REPORT PURSUANT TO SECTION 13 OR 15(d) OF THE SECURITIES EXCHANGE ACT OF 1934
|
Commission file number: 001-34407
DEER CONSUMER PRODUCTS, INC.
(Exact name of registrant as specified in its charter)
|
Nevada
|
20-5526104
|
|
|
(State or other jurisdiction of incorporation
or organization)
|
(IRS Employer Identification No.)
|
|
Area 2, 1/F, Building M-6,
Central High-Tech Industrial Park,
Nanshan, Shenzhen, China
|
518057
|
|
|
(Address of principal executive offices)
|
(Zip Code)
|
|
(86) 755-8602-8285
|
|
(Registrant’s telephone number, including area code)
|
Indicate by checkmark whether the registrant (1) has filed all reports required to be filed by Section 13 or 15(d) of the Securities Exchange Act of 1934 during the preceding 12 months (or for such shorter period that the registrant was required to file such reports), and (2) has been subject to such filing requirements for the last 90 days. YES x NO ¨
Indicate by check mark whether the registrant has submitted electronically and posted on its corporate web site, if any, every Interactive Data File required to be submitted and posted pursuant to Rule 405 of Regulation S-T (§232.405 of this chapter) during the preceding 12 months (or for such shorter period that the registrant was required to submit and post such files). YES x NO ¨
Indicate by check mark whether the registrant is a large accelerated filer, an accelerated filer, a non-accelerated filer, or a smaller reporting company. See the definitions of “large accelerated filer, “accelerated filer,” “non-accelerated filer,” and “smaller reporting company” in Rule 12b-2 of the Exchange Act.
|
Large accelerated filer ¨
|
Accelerated filer x
|
|
Non-accelerated filer ¨
|
Smaller reporting company ¨
|
|
(do not check if a smaller reporting company)
|
Indicate by check mark whether the registrant is a shell company (as defined in Rule 12b-2 of the Exchange Act). YES ¨ NO x
Indicate the number of shares outstanding of each of the issuer’s classes of common stock, as of the latest practicable date: 33,592,562 shares of common stock outstanding as of August 8, 2011.
Deer Consumer Products, Inc.
Table of Contents
|
Page
|
||
|
PART I. FINANCIAL INFORMATION
|
||
|
Item 1.
|
3
|
|
|
Item 2.
|
19
|
|
|
Item 3.
|
27
|
|
|
Item 4.
|
28
|
|
|
PART II. OTHER INFORMATION
|
||
|
Item 1.
|
29
|
|
|
Item 1A.
|
29
|
|
|
Item 2.
|
29
|
|
|
Item 3.
|
29
|
|
|
Item 5.
|
29
|
|
|
Item 6.
|
29
|
|
|
30
|
||
|
31
|
||
PART I. FINANCIAL INFORMATION
Item 1. Financial Statements
DEER CONSUMER PRODUCTS, INC. AND SUBSIDIARIES
CONSOLIDATED BALANCE SHEETS
|
JUNE 30, 2011
|
DECEMBER 31, 2010
|
|||||||
|
ASSETS
|
(UNAUDITED)
|
|||||||
|
CURRENT ASSETS
|
||||||||
|
Cash & equivalents
|
$ | 22,305,057 | $ | 33,956,591 | ||||
|
Restricted cash
|
6,603,895 | 1,347,385 | ||||||
|
Accounts receivable
|
52,268,056 | 52,686,494 | ||||||
|
Advances to suppliers
|
1,614,631 | 3,018,531 | ||||||
|
Other receivables
|
282,933 | 125,580 | ||||||
|
VAT receivable
|
5,405,713 | 2,839,718 | ||||||
|
Prepaid expenses
|
- | 159,583 | ||||||
|
Deposits
|
813,709 | 445,740 | ||||||
|
Inventories
|
33,863,410 | 23,015,850 | ||||||
|
Total current assets
|
123,157,404 | 117,595,472 | ||||||
|
NON-CURRENT ASSETS
|
||||||||
|
Property and equipment, net
|
20,722,837 | 20,453,404 | ||||||
|
Prepayment for land use rights
|
- | 3,367,207 | ||||||
|
Intangible assets, net
|
36,126,275 | 38,308,468 | ||||||
|
Construction in progress
|
11,514,354 | 8,913,181 | ||||||
|
Other assets
|
- | 4,570 | ||||||
|
Total noncurrent assets
|
68,363,466 | 71,046,830 | ||||||
|
TOTAL ASSETS
|
$ | 191,520,870 | $ | 188,642,302 | ||||
|
LIABILITIES AND STOCKHOLDERS' EQUITY
|
||||||||
|
CURRENT LIABILITIES
|
||||||||
|
Accounts payable
|
$ | 16,741,175 | $ | 26,247,453 | ||||
|
Advance from customers
|
3,403,110 | 1,759,792 | ||||||
|
Income tax payable
|
5,284,657 | 5,536,646 | ||||||
|
Other payables and accrued expenses
|
2,331,610 | 3,001,716 | ||||||
|
Dividend payable
|
1,679,628 | - | ||||||
|
Notes payable
|
5,031,637 | 8,361,698 | ||||||
|
Total current liabilities
|
34,471,817 | 44,907,305 | ||||||
|
COMMITMENTS AND CONTINGENCIES
|
||||||||
|
STOCKHOLDERS' EQUITY
|
||||||||
|
Common Stock, $0.001 par value; 75,000,000 shares
authorized; 33,592,562 shares issued and
outstanding as of June 30, 2011 and
December 31, 2010, respectively
|
33,593 | 33,593 | ||||||
|
Paid-in capital
|
91,136,274 | 91,084,958 | ||||||
|
Statutory reserve
|
7,577,047 | 6,127,639 | ||||||
|
Development fund
|
3,788,523 | 3,063,819 | ||||||
|
Accumulated other comprehensive income
|
9,797,344 | 6,315,475 | ||||||
|
Retained earnings
|
44,716,272 | 37,109,513 | ||||||
|
Total stockholders' equity
|
157,049,053 | 143,734,997 | ||||||
|
TOTAL LIABILITIES AND STOCKHOLDERS' EQUITY
|
$ | 191,520,870 | $ | 188,642,302 | ||||
The accompanying notes are an integral part of these financial statements.
DEER CONSUMER PRODUCTS, INC. AND SUBSIDIARIES
CONSOLIDATED STATEMENTS OF INCOME AND OTHER COMPREHENSIVE INCOME
(UNAUDITED)
|
Six Months Ended June 30,
|
Three Months Ended June 30,
|
|||||||||||||||
|
2011
|
2010
|
2011
|
2010
|
|||||||||||||
|
Revenue
|
$ | 79,803,830 | $ | 58,353,144 | $ | 45,127,684 | $ | 34,450,687 | ||||||||
|
Cost of revenue
|
56,697,985 | 41,593,643 | 31,978,784 | 24,569,034 | ||||||||||||
|
Gross profit
|
23,105,845 | 16,759,501 | 13,148,900 | 9,881,653 | ||||||||||||
|
Operating expenses
|
||||||||||||||||
|
Selling
|
5,529,852 | 3,248,420 | 2,912,415 | 1,820,456 | ||||||||||||
|
General and administrative
|
2,274,687 | 1,764,689 | 1,034,061 | 1,089,623 | ||||||||||||
|
Total operating expenses
|
7,804,539 | 5,013,109 | 3,946,476 | 2,910,079 | ||||||||||||
|
Income from operations
|
15,301,306 | 11,746,392 | 9,202,424 | 6,971,574 | ||||||||||||
|
Non-operating income (expenses)
|
||||||||||||||||
|
Interest income
|
108,700 | 331,060 | 46,165 | 239,139 | ||||||||||||
|
Interest expense
|
- | (49,461 | ) | - | (19,755 | ) | ||||||||||
|
Exchange loss
|
(266,855 | ) | (125,810 | ) | (150,732 | ) | (92,676 | ) | ||||||||
|
Subsidy income
|
1,007,192 | - | 7,960 | - | ||||||||||||
|
Other
|
(81,767 | ) | 8,223 | (43,469 | ) | 22,824 | ||||||||||
|
Total non-operating income (expenses), net
|
767,270 | 164,012 | (140,076 | ) | 149,532 | |||||||||||
|
Income before income tax
|
16,068,576 | 11,910,404 | 9,062,348 | 7,121,106 | ||||||||||||
|
Income tax expense
|
2,928,099 | 1,852,841 | 1,715,817 | 1,100,566 | ||||||||||||
|
Net income
|
13,140,477 | 10,057,563 | 7,346,531 | 6,020,540 | ||||||||||||
|
Other comprehensive item
|
||||||||||||||||
|
Foreign currency translation
|
3,481,869 | 398,436 | 2,005,459 | 363,071 | ||||||||||||
|
Comprehensive Income
|
$ | 16,622,346 | $ | 10,455,999 | $ | 9,351,990 | $ | 6,383,611 | ||||||||
|
Basic weighted average shares outstanding
|
33,592,562 | 32,826,777 | 33,592,562 | 33,019,662 | ||||||||||||
|
Diluted weighted average shares outstanding
|
33,592,562 | 33,729,852 | 33,592,562 | 33,703,876 | ||||||||||||
|
Basic earnings per share
|
$ | 0.39 | $ | 0.31 | $ | 0.22 | $ | 0.18 | ||||||||
|
Diluted earnings per share
|
$ | 0.39 | $ | 0.30 | $ | 0.22 | $ | 0.18 | ||||||||
The accompanying notes are an integral part of these financial statements.
DEER CONSUMER PRODUCTS, INC. AND SUBSIDIARIES
CONSOLIDATED STATEMENTS OF CASH FLOWS
SIX MONTHS ENDED JUNE 30, 2011 AND 2010
(UNAUDITED)
|
2011
|
2010
|
|||||||
|
CASH FLOWS FROM OPERATING ACTIVITIES:
|
||||||||
|
Net income
|
$ | 13,140,477 | $ | 10,057,563 | ||||
|
Adjustments to reconcile net income to net cash used in operating activities:
|
||||||||
|
Depreciation and amortization
|
1,438,861 | 716,576 | ||||||
|
Stock-based compensation
|
51,314 | 166,695 | ||||||
|
(Increase) decrease in current assets:
|
||||||||
|
Accounts receivable
|
1,631,055 | (5,742,579 | ) | |||||
|
Advances to suppliers
|
1,458,712 | (130,127 | ) | |||||
|
Other receivables, prepayments, and deposits
|
(346,960 | ) | (178,052 | ) | ||||
|
Other assets
|
4,628 | (84,155 | ) | |||||
|
Inventories
|
(10,200,635 | ) | (4,445,193 | ) | ||||
|
Increase (decrease) in current liabilities:
|
||||||||
|
Accounts payable
|
(9,998,292 | ) | 888,735 | |||||
|
Advance from customers
|
1,617,080 | (687,059 | ) | |||||
|
Taxes payable
|
(2,847,344 | ) | (296,630 | ) | ||||
|
Notes payable
|
(3,487,834 | ) | - | |||||
|
Other payables and accrued expenses
|
(742,220 | ) | (271,366 | ) | ||||
|
Net cash used in operating activities
|
(8,281,158 | ) | (5,592 | ) | ||||
|
CASH FLOWS FROM INVESTING ACTIVITIES:
|
||||||||
|
Changes in restricted cash
|
(5,169,534 | ) | (1,786,204 | ) | ||||
|
Acquisition of property & equipment
|
(889,945 | ) | (686,066 | ) | ||||
|
Acquisition of intangible asset
|
(4,270,594 | ) | (379,267 | ) | ||||
|
Refund of deposit on land use right
|
10,380,731 | - | ||||||
|
Construction in progress
|
(2,367,640 | ) | (2,008,746 | ) | ||||
|
Net cash used in investing activities
|
(2,316,982 | ) | (4,860,283 | ) | ||||
|
CASH FLOWS FROM FINANCING ACTIVITIES:
|
||||||||
|
Dividend paid
|
(1,679,978 | ) | - | |||||
|
Proceeds from exercise of warrants
|
- | 6,951,527 | ||||||
|
Purchase of treasury shares
|
- | (6,945,950 | ) | |||||
|
Offering costs paid
|
- | (320,000 | ) | |||||
|
Net cash used in financing activities
|
(1,679,978 | ) | (314,423 | ) | ||||
|
EFFECT OF EXCHANGE RATE CHANGE ON CASH & EQUIVALENTS
|
626,584 | 143,413 | ||||||
|
NET DECREASE IN CASH & EQUIVALENTS
|
(11,651,534 | ) | (5,036,885 | ) | ||||
|
CASH & EQUIVALENTS, BEGINNING OF PERIOD
|
33,956,591 | 79,333,729 | ||||||
|
CASH & EQUIVALENTS, END OF PERIOD
|
$ | 22,305,057 | $ | 74,296,844 | ||||
|
Supplemental Cash flow data:
|
||||||||
|
Income tax paid
|
$ | 3,213,565 | $ | 1,251,617 | ||||
|
Interest paid
|
$ | - | $ | - | ||||
The accompanying notes are an integral part of these financial statements.
DEER CONSUMER PRODUCTS, INC. AND SUBSIDIARIES
NOTES TO CONSOLIDATED FINANCIAL STATEMENTS
JUNE 30, 2011 (UNAUDITED) AND DECEMBER 31, 2010
Note 1 – Organization and Basis of Presentation
Organization and Line of Business
Deer Consumer Products, Inc., formerly known as Tag Events Corp., (hereinafter referred to as the “Company,” “Deer Consumer” or “Deer”) was incorporated in the State of Nevada on July 18, 2006.
On September 3, 2008, the Company entered into a share exchange agreement and plan of reorganization with Deer International Group Ltd. (“Deer International”), a corporation organized under the laws of the British Virgin Islands (“BVI”) on December 3, 2007. Deer International acquired 100% of the shares of Winder Electric Group Ltd. (“Winder”) on March 11, 2008, which has a 100% owned subsidiary, Delta International Limited (“Delta”). Winder and Delta were formed and incorporated in the Guangdong Province of the People’s Republic of China (“PRC”) on July 20, 2001, and February 23, 2006, respectively.
Pursuant to the share exchange agreement, the Company acquired from Deer International 50,000 ordinary shares, consisting of all of Deer International’s issued and outstanding capital stock, for 15,695,706 shares of the Company’s common stock. Concurrently with the closing of the transactions contemplated by the share exchange agreement and as a condition thereof, the Company entered into an agreement with its former Director and Chief Executive Officer pursuant to which he returned 5,173,914 shares of the Company’s common stock to the Company for cancellation. Upon completion of the foregoing transactions, the Company had 19,652,226 shares of common stock issued and outstanding. In connection with the above transaction, the Company changed its name to Deer Consumer Products, Inc. on September 3, 2008.
The share exchange with Deer International was recorded as a reverse acquisition because Deer International obtained control of the Company. Accordingly, the merger of Deer International into the Company was recorded as a recapitalization of Deer International, with Deer International being treated as the continuing entity. The share exchange agreement was treated as a recapitalization and not as a business combination. At the date of this transaction, the net liabilities of the legal acquirer were $0.
The Company is engaged in the manufacture, marketing, distribution and sale of a broad range of small home and kitchen electric appliances and personal care products. The Company provides consumer products to the China domestic market under its “DEER” and “德尔” brands. The Company is also a vertically integrated manufacturer of small household appliances for global consumer product customers which in turn offer products worldwide under numerous brand names and as store brands for retailers’ private label programs. The Company currently manufactures its products in Yangjiang, Guangdong Province, China and anticipates expanding its production and manufacturing capabilities by building new production and distribution facilities in the Wuhu area of central China, a region with access to a neighboring population of more than 400 million. The Company anticipates that the new facilities will improve the Company’s ability to deliver its products to customers located throughout China, which is part of the Company’s China domestic market expansion strategy. Once completed, the Company plans for the new facilities to serve primarily as a hub for its China domestic markets, while the Company’s current facilities in Yangjiang, Guangdong Province will serve as a hub for its export markets and as a supply center for markets in south China. The Company also sources products from third party manufacturers to supply certain products from time to time in order to rapidly expand new product offerings through its distribution channels across China. The Company’s corporate and administrative offices are located in Shenzhen, China.
The Company operates through its wholly owned subsidiaries in China. The Company’s U.S. holding company, Deer Consumer Products, Inc., owns a 100% of Deer International Group Ltd., a BVI entity, which owns the Company’s three wholly foreign owned enterprises, or WFOEs, Winder, Deer Technology (AnHui) Co., Ltd. and Anlin Technology (Anhui) Co., Ltd. Each of these wholly foreign owned enterprises are authorized by their respective business licenses to operate the Company’s electrical appliance manufacturing business. Delta, which transferred its material former operations to Winder in 2009 to improve the Company’s operating efficiency, is 100% owned by Winder. Currently, Delta only conducts marketing operations for the Company. Winder is located in Guangdong Province and is engaged in the research, production and delivery of our goods. Deer Technology and Anlin Technology were both incorporated in the AnHui Province on April 30, 2010. Deer Technology and Anlin Technology will also be engaged in the manufacture and sale of household electric appliances and were formed for the purpose of establishing production and distribution facilities located in the Wuhu area of Anhui Province.
The unaudited financial statements included herein were prepared by the Company, pursuant to the rules and regulations of the Securities and Exchange Commission (“SEC”). The information furnished herein reflects all adjustments (consisting of normal recurring accruals and adjustments) that are, in the opinion of management, necessary to fairly present the operating results for the respective periods. Certain information and footnote disclosures normally present in annual financial statements prepared in accordance with accounting principles generally accepted in the United States of America (“US GAAP”) were omitted pursuant to such rules and regulations. These financial statements should be read in conjunction with the audited financial statements and footnotes included in the Company’s Annual Report on Form 10-K. The results for the six and three months ended June 30, 2011, are not necessarily indicative of the results to be expected for the full year ending December 31, 2011.
DEER CONSUMER PRODUCTS, INC. AND SUBSIDIARIES
NOTES TO CONSOLIDATED FINANCIAL STATEMENTS
JUNE 30, 2011 (UNAUDITED) AND DECEMBER 31, 2010
Basis of Presentation
The accompanying consolidated financial statements include the accounts of the Company and its wholly owned subsidiary, Deer International, and Deer International’s wholly owned subsidiaries, Winder, Deer Technology and Anlin Technology, and Winder’s wholly owned subsidiary, Delta. All significant inter-company accounts and transactions were eliminated in consolidation. The Company incorporated and invested $29.8 million in Deer Technology and $10.2 million in Anlin Technology in 2010 as registered capital.
The accompanying consolidated financial statements were prepared in conformity with US GAAP. The functional currency of the Company’s China subsidiaries is the Chinese Yuan Renminbi (“RMB”); the functional currency of Deer International is United States Dollars (“$” or “USD”). The accompanying consolidated financial statements were translated and presented in USD.
Foreign Currency Translation
The accounts of the Company’s China subsidiaries are maintained in RMB, the accounts of the Company’s BVI subsidiary are maintained in USD and the accounts of the U.S. parent company are maintained in USD. The accounts of the China subsidiaries were translated into USD in accordance with Accounting Standards Codification (“ASC”) Topic 830 “Foreign Currency Matters,” with the RMB as the functional currency for the China subsidiaries. According to Topic 830, all assets and liabilities were translated at the exchange rate on the respective balance sheet date, stockholders’ equity is translated at the historical rates and statement of income items are translated at the weighted average exchange rate for the period. The resulting translation adjustments are reported under other comprehensive income in accordance with ASC Topic 220, “Comprehensive Income.” Gains and losses resulting from the translations of foreign currency transactions and balances are reflected in the statements of income.
Note 2 – Summary of Significant Accounting Policies
Use of Estimates
The preparation of financial statements in conformity with US GAAP requires management to make estimates and assumptions that affect the reported amounts of assets and liabilities and disclosure of contingent assets and liabilities at the date of the financial statements and the reported amounts of revenues and expenses during the reporting period. Actual results could differ from those estimates. Areas that require estimates and assumptions include valuation of accounts receivable and inventory, determination of useful lives of property and equipment, estimation of certain liabilities and sales returns.
Cash and Equivalents
Cash and equivalents include cash in hand and cash in time deposits, certificates of deposit and all highly liquid debt instruments with original maturities of three months or less.
Restricted Cash
Restricted cash consists of monies restricted by the Company’s lender and monies restricted under letter of credit and bank acceptances.
Accounts Receivable
The Company maintains reserves for potential credit losses on accounts receivable. Management reviews the composition of accounts receivable and analyzes historical bad debts, customer concentrations, customer credit worthiness, current economic trends and changes in customer payment patterns to evaluate the adequacy of these reserves. Our policy is to accrue the full amount of account receivables when their aging exceeds one year.
We sell our products in the China domestic market through a broad range of distribution outlets including regional and national wholesalers and third party distributors. Our standard terms for account receivables from several large and established China domestic retailers is 180 days from the close of the billing cycle, which is 30 – 45 days after products are delivered. The term for account receivables from other domestic customers is 30 – 90 days from the close of the billing cycle. These terms are customary for large and established retailers in China. Historically, we have not experienced late payments or bad debts under such terms from these select retailers. We sell our products to overseas customers in the export markets under letters of credit, prepaid arrangements, certain short credit terms or direct customer purchase orders. Our export sales-related account receivables typically are less than three months, depending on customer shipment schedules. Historically, we have not experienced significant bad debts from export sales. As we continue to focus on our expansion in the China domestic markets, our sales in the China domestic market may represent a larger percentage of our total revenue. We anticipate that our account receivables will remain in line with standard industry practice relating to account receivable schedules in China, which could be up to seven months. We provide our major customers with payment terms based on their payment history, amount they have purchased from us in the past, and upon on any strategic agreement we may have with them.
DEER CONSUMER PRODUCTS, INC. AND SUBSIDIARIES
NOTES TO CONSOLIDATED FINANCIAL STATEMENTS
JUNE 30, 2011 (UNAUDITED) AND DECEMBER 31, 2010
We believe that our accounts receivable will be collected in the ordinary course of business within a year as we have established relationships with many of our significant customers. In addition, our domestic customers typically pay according to our payment terms and we maintain insurance for our accounts receivables with respect to our international customers. The Company did not reserve any bad debt allowance at June 30, 2011, and December 31, 2010, as the Company has not incurred any bad debts to date.
Advances to Suppliers
The Company makes advances to certain vendors to purchase material and equipment. The advances are interest-free and unsecured.
Inventories
Inventories are valued at the lower of cost (determined on a weighted average basis) or market. The Company compares the cost of inventories with their market value and allowance is made to write down inventories to their market value, if lower.
Property and Equipment
Property and equipment are stated at cost. Expenditures for maintenance and repairs are charged to earnings as incurred; additions, renewals and betterments are capitalized. When property and equipment are retired or otherwise disposed of, the related cost and accumulated depreciation are removed from the respective accounts, and any gain or loss is included in operations. Depreciation of property and equipment is provided using the straight-line method for substantially all assets with estimated lives as follows:
|
Buildings
|
5-20 years
|
|
Equipment
|
5-10 years
|
|
Vehicles
|
5 years
|
|
Office equipment
|
5-10 years
|
The following are the details of property and equipment at June 30, 2011, and December 31, 2010:
|
2011
|
2010
|
|||||||
|
Building
|
$
|
9,491,461
|
$
|
9,274,909
|
||||
|
Equipment
|
19,999,244
|
18,928,495
|
||||||
|
Vehicle
|
442,285
|
485,421
|
||||||
|
Office equipment
|
551,124
|
220,800
|
||||||
|
Total
|
30,484,114
|
28,909,625
|
||||||
|
Less accumulated depreciation
|
(9,761,277
|
)
|
(8,456,221
|
)
|
||||
|
Property & equipment, net
|
$
|
20,722,837
|
$
|
20,453,404
|
||||
Depreciation for the six months ended June 30, 2011 and 2010, was $1,095,850 and $707,571, respectively; for the three months ended June 30, 2011 and 2010 was $555,537 and $353,608, respectively.
Construction in Progress
Construction in progress consists of costs for the Company's construction of a new plant, office building and power distribution station. The balance at June 30, 2011, was $11,514,354 and the Company was committed to pay an additional RMB 2 million ($0.31 million) to complete the construction.
DEER CONSUMER PRODUCTS, INC. AND SUBSIDIARIES
NOTES TO CONSOLIDATED FINANCIAL STATEMENTS
JUNE 30, 2011 (UNAUDITED) AND DECEMBER 31, 2010
Long-Lived Assets
The Company follows ASC Topic 360, “Property, Plant, and Equipment,” which addresses financial accounting and reporting for the impairment or disposal of long-lived assets. ASC 360 requires impairment losses to be recorded on long-lived assets used in operations when indicators of impairment are present and the undiscounted cash flows estimated to be generated by those assets are less than the assets’ carrying amounts. In that event, a loss is recognized based on the amount by which the carrying amount exceeds the fair value of the long-lived assets. Loss on long-lived assets to be disposed of is determined in a similar manner, except that fair values are reduced for the cost of disposal. Based on its review, the Company believes that as of June 30, 2011, and December 31, 2010, there was no significant impairment of its long-lived assets.
Intangible Assets
Intangible assets consist of rights to use land and computer software. The Company evaluates intangible assets for impairment at least annually and whenever events or changes in circumstances indicate that the carrying value may not be recoverable from its estimated future cash flows. Recoverability of intangible assets is measured by comparing their net book value to the related projected undiscounted cash flows from these assets, considering a number of factors including past operating results, budgets, economic projections, market trends and product development cycles. If the net book value of the asset exceeds the related undiscounted cash flows, the asset is considered impaired and a second test is performed to measure the amount of impairment loss.
The following are the details of intangible assets at June 30, 2011, and December 31, 2010:
|
2011
|
2010
|
|||||||
|
Right to use land
|
$
|
36,688,521
|
$
|
38,519,101
|
||||
|
Computer software
|
81,006
|
79,158
|
||||||
|
Total
|
36,769,527
|
38,598,259
|
||||||
|
Less accumulated amortization
|
(643,252
|
)
|
(289,791
|
)
|
||||
|
Intangibles, net
|
$
|
36,126,275
|
$
|
38,308,468
|
||||
Pursuant to PRC regulations, the PRC government owns all land. The Company recorded the amounts paid for the rights to use land as an intangible asset. The Company amortizes these rights over their respective periods, which range from 45 to 50 years and computer software is amortized over 1 to 2 years.
In 2010, Deer Technology acquired the use rights for two parcels of land with a total of 439,640 square meters (or 43.96 hectares) located in east central China in the city of Wuhu, AnHui Province. The purchase price of the use rights for these two parcels of land was approximately $35 million, a price of RMB 4.95 million per hectare and including a 4% PRC government land transfer tax and other government charges. The use right for the first parcel of land covering 289,415.79 square meters (or 28.94 hectares) was purchased for approximately RMB 149 million ($22.74 million). The use right for the second parcel of land covering 150,223.81 square meters (or 15.02 hectares) was purchased for RMB 77.37 million ($11.8 million). The Company has received the land use right certificates from the PRC government on these two parcels of land.
The deposit of $10,314,346 (RMB 67,901,400) that was previously paid in 2010 to acquire land use right was returned to the Company in the first quarter of 2011, as it failed to win the public auction for the land. The Company paid an additional $4,243,283 (RMB 27,934,381) in first quarter of 2011 to make payment in full for the land use rights they acquired in December 2010. As of December 31, 2010, the Company prepaid $3,367,207 for land use rights they acquired in December 2010; the prepayment was transferred into intangible assets in the first quarter of 2011 when the Company received the land use right certificate.
Amortization for the six months ended June 30, 2011 and 2010, was $343,011 and $9,005, respectively; for the three months ended June 30, 2011 and 2010 was $179,869 and $4,243, respectively.
The following table summarizes the expected amortization over the next five years as of June 30, 2011:
|
Year ended June 30,
|
Amount
|
|||
|
2012
|
$
|
726,427
|
||
|
2013
|
726,427
|
|||
|
2014
|
726,427
|
|||
|
2015
|
726,427
|
|||
|
2016
|
726,427
|
|||
|
Thereafter
|
32,494,140
|
|||
|
Total
|
$
|
36,126,275
|
||
DEER CONSUMER PRODUCTS, INC. AND SUBSIDIARIES
NOTES TO CONSOLIDATED FINANCIAL STATEMENTS
JUNE 30, 2011 (UNAUDITED) AND DECEMBER 31, 2010
A summary of Company’s land use right acquisitions follows:
|
Name
|
Site use right
Phase I
|
Site use right
Phase II
|
Site use right Phase III
|
Land use right
|
Land use right
|
|||||
|
Size
(In Square Meters)
|
33,728
|
52,597
|
60,900
|
289,416
|
150,224
|
|||||
|
Location
|
Yangjiang City
|
Yangjiang City
|
Yangjiang City
|
Wuhu City
|
Wuhu City
|
|||||
|
Owner
|
Winder
|
Winder
|
Winder
|
Deer Technology
|
Deer Technology
|
|||||
|
Useful life in months
|
600
|
600
|
600
|
600
|
600
|
|||||
|
Purpose
|
Plant and workshop
|
Plant and workshop
|
Plant and workshop
|
Plant and workshop
|
Plant and workshop
|
|||||
|
Purchase date
|
November 2002
|
June 2005 & March 2010
|
November 2010
|
September 2010
|
December 2010
|
|||||
|
Price in RMB/USD
|
RMB 1.7 million
($0.3 million)
|
RMB 3.9 million
($0.6 million)
|
RMB 21.3 million
($3.3 million) (a)
|
RMB 149.1 million
($23 million)
|
RMB 77.4 million
($12 million)
|
|||||
|
As of 6/30/2011
|
Paid in full
|
Paid in full
|
Not yet paid in full
|
Paid in full
|
Paid in full
|
|||||
|
Payment due date
|
2012
|
(a) As of June 30, 2011, the Company paid RMB5.3 million ($0.8 million) for the Site use right Phase III.
There are no regulatory deadlines or commitments to develop the land.
Fair Value of Financial Instruments
Certain of the Company’s financial instruments, including cash and equivalents, restricted cash, accounts receivable, accounts payable, accrued liabilities and short-term loans and notes payable, have carrying amounts that approximate their fair values due to their short maturities.
ASC Topic 820, “Fair Value Measurements and Disclosures,” requires disclosure of the fair value of financial instruments held by the Company. ASC Topic 825, “Financial Instruments,” defines fair value and establishes a three-level valuation hierarchy for disclosures of fair value measurement that enhances disclosure requirements for fair value measures. The carrying amounts reported in the consolidated balance sheets for receivables and current liabilities each qualify as financial instruments and are a reasonable estimate of their fair values because of the short period of time between the origination of such instruments and their expected realization and their current market rate of interest. The three levels of valuation hierarchy are defined as follows:
|
■
|
Level 1 inputs to the valuation methodology are quoted prices for identical assets or liabilities in active markets.
|
|
■
|
Level 2 inputs to the valuation methodology include quoted prices for similar assets and liabilities in active markets, and inputs that are observable for the asset or liability, either directly or indirectly, for substantially the full term of the financial instrument.
|
|
■
|
Level 3 inputs to the valuation methodology are unobservable and significant to the fair value measurement.
|
The Company analyzes all financial instruments with features of both liabilities and equity under ASC 480, “Distinguishing Liabilities from Equity,” and ASC 815.
As of June 30, 2011, and December 31, 2010, the Company did not identify any assets and liabilities that are required to be presented on the balance sheet at fair value.
DEER CONSUMER PRODUCTS, INC. AND SUBSIDIARIES
NOTES TO CONSOLIDATED FINANCIAL STATEMENTS
JUNE 30, 2011 (UNAUDITED) AND DECEMBER 31, 2010
Concentration of Credit Risk
Cash includes cash on hand and demand deposits in accounts maintained within China. Certain financial instruments, which subject the Company to concentration of credit risk, consist of cash. Balances at financial institutions within China are not covered by insurance. The Company has not experienced any losses in such accounts.
Revenue Recognition
The Company’s revenue recognition policies are in compliance with SEC Staff Accounting Bulletin (SAB) 104 (codified in FASB ASC Topic 480). Company recognizes revenue on its sales to two major local customers when acceptance is received and for other customers on shipment when the price is fixed or determinable, no other significant obligations of the Company exist and collectability is reasonably assured.
Value Added Taxes (VAT)
VAT receivables are VAT rebates which arise from our purchase of raw materials. VAT receivables are returned to the Company or offset against VAT payable. We anticipate collecting our VAT receivable within one year. We do not experience credit losses with respect to our VAT receivables because they are owed to us by the government. We classify our VAT receivable as a current asset because it is an asset that is reasonably expected to be realized (or sold or consumed) within one-year or within our normal operating cycle.
Advance from Customers
The Company records payments received from customers in advance of their future orders to advance account. Those orders are normally delivered within a reasonable period of time based upon contract terms with the customers.
Advertising Costs
The Company expenses the cost of advertising as incurred or, as appropriate, the first time the advertising takes place. Advertising costs for the six months ended June 30, 2011 and 2010, were $71,439 and $58,593, respectively. Advertising costs for the three months ended June 30, 2011 and 2010, were $48,360 and $10,106, respectively.
Research and Development
The Company expenses its research and development costs as incurred. Research and development costs for the six months ended June 30, 2011 and 2010, were $186,284 and $285,657, respectively; for the three months ended June 30, 2011 and 2010, were $2,442 and $232,594, respectively, which were included in general and administrative expenses.
Subsidy Income
The Company was awarded grants from the local government bureaus to encourage the development of its business. As a general policy across municipal governments in the PRC, local government bureaus commonly provide grants or subsidies to leading local companies to encourage greater economic development and greater employment based on certain standards which are reviewed periodically. As the exact amount of a grant is uncertain until the local government makes its final determination, the Company records grant income only when the subsidy is received or approved. The grants were without any conditions and restrictions, and were not required to be repaid.
Stock-Based Compensation
The Company records stock-based compensation in accordance with ASC Topic 718 & 505, “Compensation – Stock Compensation.” ASC 718 requires companies to measure compensation cost for stock-based employee compensation at fair value at the grant date and recognize the expense over the employee’s requisite service period. The Company recognizes in the statement of operations the grant-date fair value of stock options and other equity-based compensation issued to employees and non-employees. There were 50,000 options outstanding as of June 30, 2011.
DEER CONSUMER PRODUCTS, INC. AND SUBSIDIARIES
NOTES TO CONSOLIDATED FINANCIAL STATEMENTS
JUNE 30, 2011 (UNAUDITED) AND DECEMBER 31, 2010
Income Taxes
The Company utilizes Statement of Financial Accounting Standards ("SFAS") No. 109, “Accounting for Income Taxes” (codified in FASB ASC Topic 740), which requires recognition of deferred tax assets and liabilities for expected future tax consequences of events included in the financial statements or tax returns. Under this method, deferred income taxes are recognized for the tax consequences in future years of differences between the tax bases of assets and liabilities and their financial reporting amounts at each period end based on enacted tax laws and statutory tax rates applicable to the periods in which the differences are expected to affect taxable income. Valuation allowances are established, when necessary, to reduce deferred tax assets to the amount expected to be realized.
The Company follows FASB Interpretation No. 48, Accounting for Uncertainty in Income Taxes (codified in FASB ASC Topic 740). When tax returns are filed, it is highly likely that some positions taken would be sustained upon examination by the taxing authorities, while others are subject to uncertainty about the merits of the position taken or the amount of the position that would be ultimately sustained. The benefit of a tax position is recognized in the financial statements in the period during which, based on all available evidence, management believes it is more likely than not that the position will be sustained upon examination, including the resolution of appeals or litigation processes, if any. Tax positions taken are not offset or aggregated with other positions. Tax positions that meet the more-likely-than-not recognition threshold are measured as the largest amount of tax benefit that is more than 50 percent likely of being realized upon settlement with the applicable taxing authority. The portion of the benefits associated with tax positions taken that exceeds the amount measured as described above is reflected as a liability for unrecognized tax benefits in the accompanying balance sheets along with any associated interest and penalties that would be payable to the taxing authorities upon examination.
Interest associated with unrecognized tax benefits is classified as interest expense and penalties are classified as selling, general and administrative expense in the statements of income. At June 30, 2011, and December 31, 2010, the Company had not taken any significant uncertain tax position on its tax returns for 2009 or prior years or in computing its tax provision for 2009.
Foreign Currency Transactions and Comprehensive Income
The financial statements’ accounts of the China subsidiaries were translated into USD in accordance with SFAS No. 52, “Foreign Currency Translation” (codified in FASB ASC Topic 830), with the RMB as the functional currency for the China subsidiaries. According to the Statement, all assets and liabilities were translated at the exchange rate on the balance sheet date, stockholders’ equity are translated at the historical rates and statement of operations items are translated at the weighted average exchange rate for the year. The resulting translation adjustments are reported under other comprehensive income in accordance with SFAS No. 130, “Reporting Comprehensive Income” (codified in FASB ASC Topic 220).
Currency Hedging
The Company from time to time may enter into forward exchange agreements with the Bank of China, whereby the Company agrees to sell U.S. dollars to the Bank of China at certain rates. At June 30, 2011, and December 31, 2010, the Company had no outstanding forward exchange contracts.
Basic and Diluted Earnings Per Share
Earnings per share is calculated in accordance with the ASC Topic 260, “Earnings Per Share.” Basic earnings per share is based upon the weighted average number of common shares outstanding. Diluted earnings per share is based on the assumption that all dilutive convertible shares and stock options were converted or exercised. Dilution is computed by applying the treasury stock method. Under this method, options and warrants are assumed to be exercised at the beginning of the period (or at the time of issuance, if later), and as if funds obtained thereby were used to purchase common stock at the average market price during the period.
The following is a reconciliation of the number of shares (denominator) used in the basic and diluted earnings per share computations:
|
Three months ended June 30,
|
2011
|
2010
|
||||||||||||||
|
Per Share
|
Per Share
|
|||||||||||||||
|
Shares
|
Amount
|
Shares
|
Amount
|
|||||||||||||
|
Basic earnings per share
|
33,592,562
|
$
|
0.22
|
33,019,662
|
$
|
0.18
|
||||||||||
|
Effect of dilutive stock options and warrants
|
-
|
-
|
684,214
|
-
|
||||||||||||
|
Diluted earnings per share
|
33,592,562
|
$
|
0.22
|
33,703,876
|
$
|
0.18
|
||||||||||
|
Six months ended June 30,
|
2011
|
2010
|
||||||||||||||
|
Per Share
|
Per Share
|
|||||||||||||||
|
Shares
|
Amount
|
Shares
|
Amount
|
|||||||||||||
|
Basic earnings per share
|
33,592,562
|
$
|
0.39
|
32,826,777
|
$
|
0.31
|
||||||||||
|
Effect of dilutive stock options and warrants
|
-
|
-
|
903,075
|
(0.01
|
)
|
|||||||||||
|
Diluted earnings per share
|
33,592,562
|
$
|
0.39
|
33,729,852
|
$
|
0.30
|
||||||||||
DEER CONSUMER PRODUCTS, INC. AND SUBSIDIARIES
NOTES TO CONSOLIDATED FINANCIAL STATEMENTS
JUNE 30, 2011 (UNAUDITED) AND DECEMBER 31, 2010
Statement of Cash Flows
In accordance with ASC Topic 230, “Statement of Cash Flows,” cash flows from the Company’s operations are calculated based upon the local currencies using the average translation rates. As a result, amounts related to assets and liabilities reported on the consolidated statements of cash flows will not necessarily agree with changes in the corresponding balances on the consolidated balance sheets.
Registration Rights Agreement
The Company accounts for payment arrangements under a registration rights agreement in accordance with ASC Topic 825, “Financial Instruments,” which requires the contingent obligation to make future payments or otherwise transfer consideration under a registration payment arrangement, whether issued as a separate agreement or included as a provision of a financial instrument or other agreement, be recognized separately and measured in accordance with ASC Topic 450, “Contingencies.”
Segment Reporting
SFAS No. 131, “Disclosures about Segments of an Enterprise and Related Information” (codified in FASB ASC Topic 280) requires use of the “management approach” model for segment reporting. The management approach model is based on the way a company's management organizes segments within the company for making operating decisions and assessing performance. Reportable segments are based on products and services, geography, legal structure, management structure or any other manner in which management disaggregates a company.
SFAS 131 has no effect on the Company's financial statements as substantially all of the Company's operations are conducted in one industry segment. All of the Company's assets are located in the PRC.
Recent Pronouncements
In June 2011, FASB issued ASU 2011-05, Comprehensive Income (ASC Topic 220): Presentation of Comprehensive Income. Under the amendments in this update, an entity has the option to present the total of comprehensive income, the components of net income and the components of other comprehensive income either in a single continuous statement of comprehensive income or in two separate but consecutive statements. Under both options, an entity is required to present each component of net income along with total net income, each component of other comprehensive income along with a total for other comprehensive income and a total amount for comprehensive income. In a single continuous statement, the entity is required to present the components of net income and total net income, the components of other comprehensive income and a total for other comprehensive income, along with the total of comprehensive income in that statement. In the two-statement approach, an entity is required to present components of net income and total net income in the statement of net income. The statement of other comprehensive income should immediately follow the statement of net income and include the components of other comprehensive income and a total for other comprehensive income, along with a total for comprehensive income. In addition, the entity is required to present on the face of the financial statements reclassification adjustments for items that are reclassified from other comprehensive income to net income in the statement(s) where the components of net income and the components of other comprehensive income are presented. The amendments in this update should be applied retrospectively and are effective for fiscal years, and interim periods within those years, beginning after December 15, 2011. The Company is currently assessing the effect that the adoption of this pronouncement will have on its financial statements.
Note 3 – Inventories
Inventories consisted of the following at June 30, 2011, and December 31, 2010:
|
2011
|
2010
|
|||||||
|
Raw material
|
$
|
12,135,862
|
$
|
7,979,205
|
||||
|
Work in process
|
15.368.091
|
11,914,475
|
||||||
|
Finished goods
|
6,359,457
|
3,122,170
|
||||||
|
Total
|
$
|
33,863,410
|
$
|
23,015,850
|
||||
DEER CONSUMER PRODUCTS, INC. AND SUBSIDIARIES
NOTES TO CONSOLIDATED FINANCIAL STATEMENTS
JUNE 30, 2011 (UNAUDITED) AND DECEMBER 31, 2010
Note 4 – Other Payables and Accrued Expenses
Other payables and accrued expenses consisted of the following at June 30, 2011, and December 31, 2010:
|
2011
|
2010
|
|||||||
|
Accrued expenses
|
$
|
259,459
|
$
|
1,010,591
|
||||
|
Accrued wages
|
1,036,102
|
996,542
|
||||||
|
Welfare payable
|
22,192
|
21,303
|
||||||
|
Other payables
|
1,013,857
|
973,280
|
||||||
|
Total
|
$
|
2,331,610
|
$
|
3,001,716
|
||||
Accrued expenses represented accrued electricity and freight fee. Other payables were for government charges, payable to local construction management department and payable for employees’ education fund and labor union fund.
Note 5 – Notes Payable
Notes payable at June 30, 2011, and December 31, 2010, were for multiple bankers’ acceptances from the Bank of China. The terms of the notes range from 3-6 months, bear no interest and pay the bank 0.05% of the note balance as a fee. The Company deposits a certain percentage of the notes’ par value with the Bank of China, refundable when the notes are repaid and accounted for as restricted cash in the accompanied consolidated financial statements.
Note 6 – Dividend Payable
On March 9, 2011, the Company’s Board of Directors (“BOD”) declared a first quarter dividend payable from future earnings, of $0.05 per share which was paid on April 14, 2011. On May 9, 2011, the Company’s BOD declared a second quarter dividend of $0.05 per share, payable from future earnings on July 15, 2011, to the shareholders of record as of June 30, 2011. Dividend payable at June 30, 2011, was $1,679,628 and was paid on July 12, 2011. Declaration and payment of future quarterly dividends will be made at the discretion of the BOD.
Note 7 – Stockholders’ Equity
Stock Options
Following is a summary of the activity of options to independent directors:
|
Options
Outstanding
|
Weighted
Average
Exercise
Price
|
Weighted
Average
Remaining
Contractual Life
|
Aggregate
Intrinsic Value
|
|||||||||||||
|
Outstanding, December 31, 2010
|
50,000
|
$
|
10.96
|
3.98
|
$
|
14,000
|
||||||||||
|
Exercisable, December 31, 2010
|
33,332
|
$
|
10.96
|
3.98
|
$
|
9,333
|
||||||||||
|
Granted
|
-
|
-
|
||||||||||||||
|
Forfeited
|
-
|
-
|
||||||||||||||
|
Exercised
|
-
|
-
|
||||||||||||||
|
Outstanding, June 30, 2011
|
50,000
|
$
|
10.96
|
3.48
|
$
|
-
|
||||||||||
|
Exercisable, June 30, 2011
|
33,332
|
$
|
10.96
|
3.48
|
$
|
-
|
||||||||||
DEER CONSUMER PRODUCTS, INC. AND SUBSIDIARIES
NOTES TO CONSOLIDATED FINANCIAL STATEMENTS
JUNE 30, 2011 (UNAUDITED) AND DECEMBER 31, 2010
The exercise price for options outstanding at June 30, 2011, is as follows:
|
Number of Options
|
Exercise Price
|
|||||
|
50,000
|
$
|
10.96
|
||||
The assumptions used in calculating the fair value of options granted using the Black-Scholes option-pricing model are as follows:
|
Risk-free interest rate
|
2.25
|
%
|
||
|
Expected life of the options
|
3 to 3.5 years
|
|||
|
Expected volatility
|
80
|
%
|
||
|
Expected dividend yield
|
0
|
%
|
||
During six months ended June 30, 2011 and 2010, the Company recorded $51,314 and $166,694 as stock option expense, respectively. During three months ended June 30, 2011 and 2010, the Company recorded $25,657 and $83,348 as stock option expense, respectively.
Warrants
At the end of 2010, all warrants were exercised. No new warrants were granted during the six months ended June 30, 2011.
Note 8 – Employee Welfare Plan
Expense for the employee common welfare was $19,493 and $44,110 for the six months ended June 30, 2011 and 2010; $11,581 and $23,702 for the three months ended June 30, 2011 and 2010, respectively. The PRC government abolished the 14% welfare plan policy during 2007. The Company is not required to establish welfare and common welfare reserves.
Note 9 – Statutory Reserve and Development Fund
As stipulated by the Company Law of the PRC, net income after taxation can only be distributed as dividends after appropriation has been made for the following:
|
i.
|
Making up cumulative prior years’ losses, if any;
|
|
ii.
|
Allocations to the “statutory surplus reserve” of at least 10% of income after tax, as determined under PRC accounting rules and regulations, until the fund amounts to 50% of the Company’s registered capital;
|
|
iii.
|
Allocations of 5-10% of income after tax, as determined under PRC accounting rules and regulations, to the Company’s “statutory common welfare fund” (“SCWF”), which is established for the purpose of providing employee facilities and other collective benefits to the Company’s employees; and
|
|
iv.
|
Allocations to the discretionary surplus reserve, if approved in the stockholders’ general meeting. The Company allocates 5% of income after tax as development fund. The fund is for enlarging its business and increasing capital.
|
Pursuant to the new Corporate Law effective on January 1, 2006, there is now only one “statutory surplus reserve” requirement. The reserve is 10% of income after tax, not to exceed 50% of registered capital.
The Company appropriated $1,449,408 and $1,051,813 as reserve for the statutory surplus reserve, and $724,704 and $525,906 as reserve for development fund, for the six months ended June 30, 2011 and 2010, respectively.
Note 10 – Income Tax
The Company is subject to income taxes by entity on income arising in or derived from the tax jurisdiction in which each entity is domiciled.
Deer, the U.S. parent company, was incorporated in the U.S. and historically has net operating losses (NOL) for income tax purposes. During the six months period ended June 30, 2011, the U.S. parent company utilized 100% of its NOL against the dividend income received from Winder as earnings repatriation.
DEER CONSUMER PRODUCTS, INC. AND SUBSIDIARIES
NOTES TO CONSOLIDATED FINANCIAL STATEMENTS
JUNE 30, 2011 (UNAUDITED) AND DECEMBER 31, 2010
Local PRC Income Tax
Pursuant to the tax laws of China, general enterprises are subject to income tax at an effective rate of 25%. Winder enjoys a 15% preferential income tax effective as of 2009 until its expiration on December 31, 2011, as a result of its status as a high tech enterprise. A reconciliation of tax at U.S. federal statutory rate to the provision for income tax recorded in the financial statements for the six and three months ended June 30, 2011 and 2010, is as follows:
|
|
Six Months
|
Three Months
|
||||||||||||||
|
2011
|
2010
|
2011
|
2010
|
|||||||||||||
|
Tax provision at U.S. statutory rates
|
35.2
|
%
|
34.0
|
%
|
36.2
|
%
|
34.0
|
%
|
||||||||
|
Foreign tax rate difference
|
(9.3
|
)%
|
(9.3
|
)%
|
(9.3
|
)%
|
(9.3
|
)%
|
||||||||
|
Other
|
2.2
|
%
|
-
|
%
|
2.0
|
%
|
-
|
%
|
||||||||
|
Valuation allowance
|
0.7
|
%
|
1.2
|
%
|
0.6
|
%
|
(1.0
|
)%
|
||||||||
|
Effective tax holiday
|
(10.6
|
)%
|
(10.3
|
)%
|
(10.6
|
)%
|
(10.3
|
)%
|
||||||||
|
Tax per financial statements
|
18.2
|
%
|
15.6
|
%
|
18.9
|
%
|
15.5
|
%
|
||||||||
The effect of the change of tax status was recorded in accordance with ASC Topic 740-10, which states that the effect of a change in tax status is computed as of the date of change and is included in the tax provision for continuing operations. Management believes the local tax authorities would not have waived past taxes had it not been for the change in the tax status of the Company’s subsidiary.
If Winder had not been granted high tech enterprise status, income tax expense for the six and three months ended June 30, 2011, would have been increased by $1,704,601 and $957,919 and earnings per share would have been reduced by $0.05 and $0.03.
Note 11 – Geographical Sales
Geographical distribution of sales is as follows:
|
Six Months Ended
|
Three Months Ended
|
|||||||||||||||
|
June 30,
|
June 30,
|
|||||||||||||||
|
Geographical Areas
|
2011
|
2010
|
2011
|
2010
|
||||||||||||
|
China
|
$
|
44,581,539
|
$
|
17,771,412
|
$
|
29,174,799
|
$
|
11,376,532
|
||||||||
|
South America
|
9,523,576
|
11,427,425
|
4,296,996
|
6,886,774
|
||||||||||||
|
Asia
|
8.298.692
|
10,026,064
|
2,534,005
|
5,641,665
|
||||||||||||
|
Europe
|
4,937,251
|
7,296,407
|
2,218,883
|
4,723,182
|
||||||||||||
|
Middle East
|
8,325,845
|
6,651,291
|
5,137,179
|
4,359,474
|
||||||||||||
|
North America
|
3,474,092
|
4,585,720
|
1,328,163
|
1,033,543
|
||||||||||||
|
Africa
|
662,835
|
594,825
|
437,659
|
429,517
|
||||||||||||
|
$
|
79,803,830
|
$
|
58,353,144
|
$
|
45,127,684
|
$
|
34,450,687
|
|||||||||
Note 12 – Operating Risks
The Company’s operations in the PRC are subject to specific considerations and significant risks not typically associated with companies in North America and Western Europe. These include risks associated with, among others, the political, economic and legal environments and foreign currency exchange. The Company’s results may be adversely affected by changes in governmental policies with respect to laws and regulations, anti-inflationary measures, currency conversion and remittance abroad, and rates and methods of taxation, among other things.
The Company’s sales, purchases and expenses transactions are denominated in RMB and all of the Company’s assets and liabilities are also denominated in RMB. The RMB is not freely convertible into foreign currencies under current PRC law. In China, foreign exchange transactions are required by law to be transacted only by authorized financial institutions. Remittances in currencies other than RMB may require certain supporting documentation in order to affect the remittance.
DEER CONSUMER PRODUCTS, INC. AND SUBSIDIARIES
NOTES TO CONSOLIDATED FINANCIAL STATEMENTS
JUNE 30, 2011 (UNAUDITED) AND DECEMBER 31, 2010
Note 13 – Commitment
On September 1, 2010, the Company entered into a 2-year lease agreement, expiring on August 30, 2012, for a product show room in Panyu, Guangdong Province with monthly rent including property management fees of $5,500 (RMB 37,000). The Company has the option to renew this lease upon expiration. At June 30, 2011, the Company’s future minimum rental payments required under these operating leases were as follows by years:
|
2012
|
$
|
66,000
|
||
|
2013
|
11,500
|
|||
|
Total
|
$
|
77,500
|
Winder’s registered capital as of June 30, 2011, was $57.2 million and its contribution to capital was $36.7 million. The Company will need to contribute an additional $20.5 million to Winder by January 18, 2012.
Note 14 – Major Customers and Vendors
For the six and three months ended June 30, 2011, one customer accounted for approximately 26% and 33% of the sales, respectively. At June 30, 2011, the total receivable balance due from this customer was approximately $22,682,386.
For the six and three months ended June 30, 2011, one vendor accounted for 13% and 11% of the Company’s purchases of raw materials. At June 30, 2011, the total payable to this vendor was approximately $2,305,128.
Note 15 – Contingency
Acquisition of Winder
On April 1, 2008, Deer International acquired 100% of the equity interest in Winder from 50HZ Electric Limited. At the time of such acquisition, Deer International was an offshore enterprise controlled by some of the Company’s shareholders who are PRC residents. Certain of these shareholders also owned or controlled 50HZ Electric Limited at the time of such acquisition, which made Winder an affiliated PRC company of such shareholders. In October 2008, such shareholders transferred their ownership interests in 50HZ Electric Limited to an unrelated third party, after which 50HZ Electric Limited was no longer deemed a related party of the Company. The transaction was approved by the Economic Development Bureau of Yangjiang High-tech Industry Development Zone (the “Yangjiang Hi-Tech Zone”).
The acquisition of 100% of Winder’s equity interests by Deer International on April 1, 2008, was free of any considerations and conditions. Under applicable PRC tax rules, any transaction between related parties shall be priced on an arm’s length basis. The tax authority has the right to investigate any related party transaction and to make adjustment if it finds the price not on an arm’s length basis. The PRC tax authority would make adjustment by applying a deemed arm’s length price to the transaction. Given that 50HZ Electric Limited and Deer International had certain related parties at the time of the Winder acquisition, there is a possibility that the consideration-free transfer may be challenged and investigated by the PRC tax authority. If the deemed arm’s length price determined by the PRC tax authority during such investigation is higher than the original cost that 50HZ Electric Limited paid to get 100% equity interest of Winder, such excess amount would be subject to additional PRC income tax. Although the Company believes that 50HZ Electric Limited would be responsible for the possible PRC income tax, the Company understands that it is common practice for PRC tax authority to enforce the tax collection over the entity at issue, which in this case would be Winder, and the Company may be required to pay the possible PRC income tax on behalf of 50HZ Electric Limited. This transaction was approved by the Economic Development Bureau of Yangjiang High-tech Industry Development Zone; however, according to the M&A Regulations, the acquisition of Winder might require the approval of MOFCOM. As the interpretation and implementation of the M&A Regulations are unclear, if the approval of MOFCOM is required, the approval that 50HZ Electric Limited obtained from the Yangjiang Hi-Tech Zone may be deemed incomplete and the transferee, namely Deer International, may need to obtain further approval from MOFCOM.
DEER CONSUMER PRODUCTS, INC. AND SUBSIDIARIES
NOTES TO CONSOLIDATED FINANCIAL STATEMENTS
JUNE 30, 2011 (UNAUDITED) AND DECEMBER 31, 2010
Pending Litigation
On March 28, 2011, the Company filed suit in the Supreme Court of the State of New York against a certain blogger, “Alfred Little,” the website SeekingAlpha.com and others alleging the publishing of false and defamatory statements by the defendants as part of an orchestrated scheme to manipulate and depress the market for the Company’s common stock. The Company is claiming compensatory and punitive damages totaling at least $11 million, not including claims for attorneys’ fees, and other equitable remedies, including disgorgement of any illicit trading profits received by defendants in connection with the alleged market manipulation scheme. The Company has served document subpoenas on various non-parties to the suit to obtain information for the identification of “Alfred Little” and other persons responsible for the false and defamatory statements published by SeekingAlpha.com. In addition, defendant SeekingAlpha.com has filed a motion to dismiss the Company’s claim against it, and the Company has opposed that motion.
On April 29, 2011, in what appears to be a part of this attempted short seller-driven share manipulation, a purported securities class action lawsuit was filed against the Company and certain of its current and former officers and directors in the United States District Court for the Central District of California. This complaint is based expressly upon the false and defamatory reports concerning the Company that were authored by the fictitious character “Alfred Little” and published by Seeking Alpha Ltd., the defendants in the Company’s lawsuit. The complaint has not been certified as a class action by the court in California. The complaint seeks unspecified damages and other relief relating to the purported inflation in the price of the Company’s common stock during the class period. A consolidated amended complaint will be filed after the court rules on pending motions for the appointment of a lead plaintiff. The Company will respond in due course to any amended consolidated complaint, which the Company anticipates will largely reiterate the allegations of the current complaint. The Company strongly denies these allegations. The Company believes this lawsuit is frivolous and without merit and will contest it vigorously. The Company plans to pursue all legal remedies available to it if the operative complaint is not withdrawn in its entirety. The outcome of this litigation is currently uncertain. The Company has not recorded any liability for this litigation. The Company maintains directors and officers liability insurance, which provides the protection of certain insurance coverage for both the Company and its officers and directors.
Note 16 – Subsequent Event
On August 7, 2011, the Company’s Board of Directors declared a quarterly dividend, payable from future earnings only, in the amount of $0.05 per share payable on October 14, 2011, to the shareholders of record as of September 30, 2011. Declaration and payment of future quarterly dividends will be made at the discretion of the Board of Directors.
CAUTIONARY STATEMENT FOR FORWARD-LOOKING STATEMENTS
This Quarterly Report on Form 10-Q includes forward-looking statements within the meaning of Section 27A of the Securities Act of 1933, as amended, and Section 21E of the Securities Exchange Act of 1934, as amended. We based these forward-looking statements on our current expectations and projections about future events. These forward-looking statements are subject to known and unknown risks, uncertainties and assumptions about us that may cause our actual results, levels of activity, performance or achievements to be materially different from any future results, levels of activity, performance or achievements expressed or implied by such forward-looking statements. In some cases, you can identify forward-looking statements by terminology such as “may,” “will,” “should,” “could,” “would,” “expect,” “plan,” “anticipate,” “believe,” “estimate,” “continue,” or the negative of such terms or other similar expressions. Factors that might cause or contribute to such a discrepancy include, but are not limited to, those listed under the heading “Risk Factors” and those listed in our other Securities and Exchange Commission filings. The following discussion should be read in conjunction with our Financial Statements and related Notes thereto included elsewhere in this report. Throughout this Quarterly Report, we will refer to Deer Consumer Products, Inc. as "Deer," the "Company," "we," "us," and "our."
Item 2. Management’s Discussion and Analysis of Financial Condition and Results of Operations
Overview
On September 3, 2008, we entered into and consummated a series of agreements that resulted in the acquisition of all of the ordinary shares of Deer International Group Ltd., or Deer International, a corporation organized under the laws of the British Virgin Islands on December 3, 2007, parent of its wholly owned subsidiary Winder Electric Group Ltd., or Winder, since March 11, 2008, and Delta International Limited, or Delta, a wholly owned subsidiary of Winder. Winder and Delta were incorporated in the Guangdong Province of the People’s Republic of China, which we refer to as China or the PRC, on July 20, 2001, and February 23, 2006, respectively.
Pursuant to the share exchange agreement, we acquired from Deer International 50,000 ordinary shares, consisting of all of its issued and outstanding capital stock for 15,695,706 shares of our common stock.
Concurrently with the closing of the transactions contemplated by the share exchange agreement and as a condition thereof, we entered into an agreement with our former Director and Chief Executive Officer, pursuant to which he returned 5,173,914 shares of our common stock for cancellation. Upon completion of the foregoing transactions, we had 19,652,226 shares of common stock issued and outstanding. In connection with the above transaction, we changed our name to Deer Consumer Products, Inc. on September 3, 2008.
The exchange of shares with Deer International was recorded as a reverse acquisition under the purchase method of accounting because Deer International obtained control of our company. Accordingly, the merger of Deer International into us was recorded as a recapitalization of Deer International, with Deer International being treated as the continuing entity. The historical financial statements presented are the consolidated financial statements of Deer International. The share exchange agreement has been treated as a recapitalization and not as a business combination; therefore, no pro forma information is disclosed. At the date of this transaction, the net liabilities of the legal acquirer were $0.
We are engaged in the manufacture, marketing, distribution and sale of a broad range of small home and kitchen electric appliances and personal care products. Our products are designed to make today’s modern lifestyles simpler and healthier. We are a leading provider of consumer products to the China domestic market under our “DEER” and “德尔” brands, which we refer to as our Deer brands. We sell our Deer-branded products through some of the largest electronic retailers in the China domestic market as well as other distribution outlets. According to market analysis, the small household appliances market in China had, on average, more than 30% gross profit margins and revenue growth grew more than 45% in 2010. According to the 2010 China Small Electronics Market Research Report, approximately 78% of consumers in China purchase small household appliances from the two largest electronic retailers and approximately 60% of consumers in China learn about products from in-store promotions.
We are also a vertically integrated manufacturer of small household appliances serving as an original design manufacturer and original equipment manufacturer, or ODM and OEM, for global consumer product customers who in turn offer products worldwide under their own brand names. We have provided products to the global brand names Back to Basics, Arietta, Black & Decker®, Disney, Betty Crocker Kitchens and many others, who resold to retailers worldwide. We also supply products to numerous store brands for retailers’ private label programs.
We currently manufacture our products in Yangjiang, Guangdong Province, China and anticipate expanding our production and manufacturing capabilities by building new production and distribution facilities in the Wuhu area of central China, which will improve our ability to deliver our products to customers located throughout China. We also source products from third party manufacturers to supply certain products from time to time in order to rapidly expand new product offerings through our distribution channels across China. Our corporate and administrative offices are located in Shenzhen, China.
We operate through our wholly owned subsidiaries in China. Our U.S. holding company, Deer Consumer Products, Inc., owns a 100% of Deer International Group Ltd., a BVI entity, which owns our three wholly foreign owned enterprises, or WFOEs, Winder, Deer Technology (AnHui) Co., Ltd. and Anlin Technology (Anhui) Co., Ltd. Each of our wholly foreign owned enterprises are authorized by their respective business licenses to operate our electrical appliance manufacturing business. Delta, which transferred its material former operations to Winder in 2009 to improve the Company’s operating efficiency, is 100% owned by Winder. Currently, Delta only conducts marketing operations for the Company. Winder is located in Guangdong Province and is engaged in the research, production and delivery of our goods. Deer Technology and Anlin Technology were both incorporated in the AnHui Province on April 30, 2010. Deer Technology and Anlin Technology will also be engaged in the manufacture and sale of household electric appliances and were formed for the purpose of establishing production and distribution facilities located in the Wuhu area of Anhui Province.
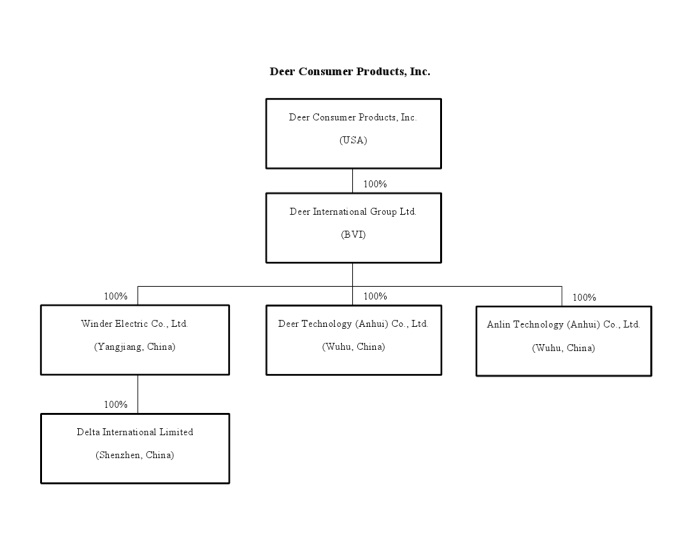
We plan to continue to target the China domestic market and its rising middle class by expanding our production and manufacturing facilities in the Wuhu area of central China. Wuhu is located on the banks of the Yangtze River, within hours from Shanghai and Nanjing, which are some of China’s most populous and economically developed regions. This central location will improve our ability to deliver our products to customers located throughout China. In 2010, we acquired 50-year land use rights for two parcels of land located in Wuhu, AnHui Province. We have received official land use right certificates issued by the PRC government for these land parcels and broke ground in 2011 for the initial phase of construction of our new production and distribution facilities. We anticipate that the new facilities will allow us to target the neighboring population of more than 400 million as we continue to grow our business in the China domestic market. We anticipate that the new facilities will be constructed in several phases, on pace with our growing China domestic product distribution footprint. Once completed, we plan for the new facilities to serve primarily as a hub for our China domestic markets, while our facilities in Yangjiang, Guangdong Province will serve as a hub for our export markets and as a supply center for markets in south China.
Critical Accounting Policies
In presenting our financial statements in conformity with accounting principles generally accepted in the United States (“US GAAP”), we are required to make estimates and assumptions that affect the amounts reported therein. Several of the estimates and assumptions we are required to make relate to matters that are inherently uncertain as they pertain to future events. However, events that are outside of our control cannot be predicted and, as such, they cannot be contemplated in evaluating such estimates and assumptions. If there is a significant unfavorable change to current conditions, it will likely result in a material adverse impact to our results of operations, financial position and our liquidity. We believe the estimates and assumptions we used when preparing our financial statements were the most appropriate at that time. Presented below are those accounting policies we believe require subjective and complex judgments that could potentially affect reported results.
Use of Estimates. Our discussion and analysis of our financial condition and results of operations are based upon our financial statements, which were prepared in accordance with US GAAP. The preparation of these financial statements requires us to make estimates and judgments that affect the reported amounts of assets, liabilities, revenues and expenses, and related disclosures of contingent assets and liabilities. On an ongoing basis, we evaluate our estimates, including those related to impairment of long-lived assets, and allowance for doubtful accounts. We base our estimates on historical experience and on various other assumptions that we believe to be reasonable under the circumstances, the results of which form the basis for making judgments about the carrying value of assets and liabilities that are not readily apparent from other sources. Actual results may differ from these estimates under different assumptions or conditions; however, we believe that our estimates, including those for the above-described items, are reasonable.
Areas that require estimates and assumptions include valuation of accounts receivable and inventory, determination of useful lives of property and equipment, estimation of certain liabilities and sales returns.
Accounts Receivable. We maintain reserves for potential credit losses on accounts receivable. Management reviews the composition of accounts receivable and analyzes historical bad debts, customer concentrations, customer credit worthiness, current economic trends and changes in customer payment patterns to evaluate the adequacy of these reserves.
Advances to Suppliers. We make advances to certain vendors for the purchase of material and equipment. The advances to suppliers are interest-free and unsecured.
Inventory. Inventory is valued at the lower of cost (determined on a weighted average basis) or market. We compare the cost of inventories with their market value. An allowance is made to write down inventories to their market value, if lower.
Long-Lived Assets. We periodically assess potential impairments to our long-lived assets. We perform an impairment review whenever events or changes in circumstances indicate that the carrying value may not be fully recoverable. Factors we considered include, but are not limited to: significant underperformance relative to expected historical or projected future operating results; significant changes in the manner of use of the acquired assets or the strategy for our overall business; and significant negative industry or economic trends. When we determine that the carrying value of a long-lived asset may not be recoverable based upon the existence of one or more of the above indicators of impairment, we estimate the future undiscounted cash flows expected to result from the use of the asset and its eventual disposition. If the sum of the expected future undiscounted cash flows and eventual disposition is less than the carrying amount of the asset, we recognize an impairment loss. An impairment loss is reflected as the amount by which the carrying amount of the asset exceeds the fair market value of the asset, based on the fair market value if available, or discounted cash flows. To date, there has been no impairment of long-lived assets.
Property and Equipment: Property and equipment are stated at cost. Expenditures for maintenance and repairs are expensed as incurred; additions, renewals and betterments are capitalized. When property and equipment are retired or otherwise disposed of, the related cost and accumulated depreciation are removed from the respective accounts, and any gain or loss is included in operations. Depreciation of property and equipment is provided using the straight-line method for substantially all assets with estimated lives as follows:
|
Buildings
|
5-20 years
|
|
Equipment
|
5-10 years
|
|
Vehicles
|
5 years
|
|
Office equipment
|
5-10 years
|
Revenue Recognition. The Company’s revenue recognition policies are in compliance with SEC Staff Accounting Bulletin (SAB) 104 (codified in FASB ASC Topic 480). Company recognizes revenue on its sales to two major local customers when acceptance is received and for other customers on shipment when the price is fixed or determinable, no other significant obligations of the Company exist and collectability is reasonably assured.
Foreign Currency Transactions and Comprehensive Income. US GAAP generally requires recognized revenue, expenses, gains and losses to be included in net income. Certain statements, however, require entities to report specific changes in assets and liabilities, such as gain or loss on foreign currency translation, as a separate component of the equity section of the balance sheet. Such items, along with net income, are components of comprehensive income. Our functional currency is the Chinese Renminbi. The unit of Renminbi is in Yuan. Translation gains are classified as an item of other comprehensive income in the stockholders’ equity section of the balance sheet. Other comprehensive income in the statements of income and other comprehensive income includes translation gains recognized each period.
Currency Hedging. From time to time, we may enter into forward exchange agreements with the Bank of China, whereby we agree to sell U.S. dollars to the Bank of China at certain rates. At June 30, 2011, we had no outstanding forward exchange contracts.
Recent Accounting Pronouncements
In June 2011, FASB issued ASU 2011-05, Comprehensive Income (ASC Topic 220): Presentation of Comprehensive Income. Under the amendments in this update, an entity has the option to present the total of comprehensive income, the components of net income and the components of other comprehensive income either in a single continuous statement of comprehensive income or in two separate but consecutive statements. Under both options, an entity is required to present each component of net income along with total net income, each component of other comprehensive income along with a total for other comprehensive income and a total amount for comprehensive income. In a single continuous statement, the entity is required to present the components of net income and total net income, the components of other comprehensive income and a total for other comprehensive income, along with the total of comprehensive income in that statement. In the two-statement approach, an entity is required to present components of net income and total net income in the statement of net income. The statement of other comprehensive income should immediately follow the statement of net income and include the components of other comprehensive income and a total for other comprehensive income, along with a total for comprehensive income. In addition, the entity is required to present on the face of the financial statements reclassification adjustments for items that are reclassified from other comprehensive income to net income in the statement(s) where the components of net income and the components of other comprehensive income are presented. The amendments in this update should be applied retrospectively and are effective for fiscal years, and interim periods within those years, beginning after December 15, 2011. The Company is currently assessing the effect that the adoption of this pronouncement will have on its financial statements.
Results of Operations
Three Months Ended June 30, 2011, Compared to the Three Months Ended June 30, 2010
|
$
|
%
|
|||||||||||||||
|
2011
|
2010
|
Change
|
Change
|
|||||||||||||
|
Revenue
|
$
|
45,127,684
|
$
|
34,450,687
|
$
|
10,676,997
|
31.0
|
|||||||||
|
Cost of revenue
|
31,978,784
|
24,569,034
|
7,409,750
|
30.2
|
||||||||||||
|
Gross profit
|
13,148,900
|
9,881,653
|
3,267,247
|
33.1
|
||||||||||||
|
Selling, general and administrative expenses
|
3,946,476
|
2,910,079
|
1,036,397
|
35.6
|
||||||||||||
|
Interest and financing costs, net
|
46,165
|
219,384
|
(173,219
|
)
|
(79.0
|
)
|
||||||||||
|
Other income (expense), net (including subsidy)
|
(35,509
|
)
|
22,824
|
(58,333
|
)
|
255.6
|
||||||||||
|
Foreign exchange transaction loss
|
(150,732
|
)
|
(92,676
|
)
|
(58,056
|
)
|
62.6
|
|||||||||
|
Income tax expense
|
1,715,817
|
1,100,566
|
615,251
|
55.9
|
||||||||||||
|
Net income
|
$
|
7,346,531
|
$
|
6,020,540
|
$
|
1,325,991
|
22.0
|
|||||||||
Revenues
Our revenue for three months ended June 30, 2011, was $45.1 million, an increase of $10.7 million or 31.0% from $34.5 million for the three months ended June 30, 2010. The increase in revenues was a result of our expansion of sales in the China domestic market and increasing our market share in the Middle East and Africa markets. The average selling prices of our products increased 12.2% in the second quarter of 2011 compared to the average selling prices in the same period of 2010, which conforms to our strategy of maintaining healthy profit margins across our product lines. We increased our China domestic market sales to $29.2 million in the three months ended June 30, 2011, from $11.4 million in the same period of 2010, a 156.4% increase. Our products currently are available in more than 3,000 stores as of June 2011. Our customers include SuNing, who together with its wholly-owned subsidiary Song Qiao, is a prominent national electric appliance retail chain in China with more than 1,000 stores, under a private label arrangement, and Gome, another prominent national electronic appliance retail chain in China with approximately 1,400 stores. We also added retail locations in other channels such as regional electric appliance retailers, wholesalers and department stores. We increased our product sales over internet portals, into hotels and restaurants, and via reward programs with large banks, telecommunication firms and postal offices in China. These results are in line with management’s plan to capture the fast growing China domestic small appliance market.
Our sales in South America were $4.3 million for the three months ended June 30, 2011, a $2.6 million or 37.6% decrease over the same period of 2010. Our sales in Asia were $2.5 million for the three months ended June 30, 2011, a $3.1 million or 55.1% decrease over the same period of 2010. Our sales in Europe were $2.2 million for the three months ended June 30, 2011, a $2.5 million or 53.0% decrease over the same period of 2010. The decrease in sales in South America, Asia and Europe were largely due to our changing marketing strategy. Specifically, we have reduced the amount of promotion and sales of products that carry low profit margins in these areas. These low profit margins are attributable to our inability to offset the increasing labor costs in China and the appreciation of the Chinese Yuan with higher prices in these areas.
Our sales in the Middle East were $5.1 million for the three months ended June 30, 2011, a $0.8 million or 17.8% increase over the same period of 2010. Our sales in the Africa were $0.44 million for the three months ended June 30, 2011, a $0.1 million or 1.9% increase over the same period of 2010. Our sales gains in Africa and the Middle East were largely due to the recognized quality of our products in these markets and our reputation for timely delivery. This enabled us to retain long-term cooperation with customers as well as to introduce new products to customers, helping us to gain market share in these areas following the financial crisis. Our sales in the U.S. were $1.3 million for the three months ended June 30, 2011, a $0.3 million or 28.5% increase over the same period of 2010, as we have, from time to time, turned away orders that may not meet our profit margin requirements. The economic recovery in the U.S. has been slower than anticipated and our U.S. customers placed orders, as expected, consistent with the slow recovery. During the three months ended June 30, 2011, the slight increase of sales in North America compared with the same period of 2010 were attributable to a new customer, a leading franchiser in the U.S., to whom we started shipments in April 2011. We expect our U.S. revenues to recover during 2011 as the economic recovery progresses and we continue to engage new large U.S. customers that meet our profit margin requirements.
Following the financial crisis, we believe that many smaller suppliers with limited capital resources went out of business, leading to further consolidation in the industry. In addition, we noticed that buyers increasingly favored companies with financial strength, higher quality products, sufficient plant capacity and a track record of prompt delivery. Buyers placed greater emphasis on being able to source quality supplies without delays or interruptions. We utilized this market opportunity to add new accounts and increase sales volume with our existing customers.
Cost of Revenue
Our cost of revenue for the three months ended June 30, 2011, was $31.98 million, an increase of $7.4 million or 30.2% from $24.6 million for the same period of 2010. The increased cost of revenue in 2011 was due to the increase in sales. Our cost of revenue as a percentage of revenue remained constant at about 71% for the same period of both years.
Gross Profit
Our gross margin increased slightly to 29.1% for the three months ended June 30, 2011, compared to 28.7% for the same period of 2010. Our gross margin is higher in the China domestic market compared to the export market because products generally sell at much higher prices at retail and wholesale in China. We continue to improve our manufacturing efficiency through in-house production of motors and other primary components of our products, thereby benefiting further from economies of scale.
Operating Expenses
Selling, general and administrative expenses for the three months ended June 30, 2011, were $3.9 million, an increase of $1.0 million or 35.6% from $2.9 million for the same period of 2010. Selling expenses for the three months ended June 30, 2011, increased by 60.0% or $1.1 million in comparison to the same period of 2010 due to our significant increase in sales. Associated selling costs include advertising to expand the market, increase brand awareness and generate the significant increase in sales. These expenses caused our promotion expense to increase $0.2 million or 1170%, compared to the same period of 2010. Our direct advertising costs remained minimal during the second quarter of 2011, as expected, because we hire factory representatives and in-store promoters to promote our products directly to consumers at retail locations. We believe this direct in-store promotion approach is a standard practice in the small household appliances industry and highly effective in marketing to consumers in the unique Chinese retail environment as compared to traditional mass media advertising channels, which would require us to incur significant television and other mass media advertising expense without knowing to whom these advertisements were targeted. According to a survey in the 2010 China Small Electronics Market Research Report, approximately 60% of Chinese consumers surveyed purchased small household appliances after being introduced to the product by in-store promoters. Our in-store promoters market our products exclusively and directly to in-store customer traffic. We anticipate having approximately 1,000 in-store promoters hired directly by us or through third party distributors by the end of 2011. The salary to these promoters increased $0.3 million or 94%, compared to the same period of 2010. As a result of increased sales, freight and related dock charges increased $0.2 million or 14% and $0.2 million or 558%, compared to the three months ended June 30, 2010. General and administrative expenses for the three months ended June 30, 2011, decreased by 5.1% or $55,562 in comparison to the 2010 period due to the decrease in research and development cost of $0.3 million. Nonetheless, our depreciation and amortization expense increased $0.2 million due to the purchase of new equipment and new land use rights.
Interest and Financing Costs, net
Interest and financing costs, net, for the three months ended June 30, 2011, was a net gain of $46,165, a decrease of $173,219 or 79.0% from a net gain of $219,384 for the same period of 2010. The change was principally due to interest income decreasing from $239,139 in the 2010 period to $46,165 in the 2011 period as our cash position decreased due to the expansion of our production capacity and working capital needs.
Other Income (Expense), net
Other expense for the three months ended June 30, 2011, was $35,509 compared to a $22,824 other income for the 2010 period, a decrease of income of $58,333. The decrease is due mainly to bank charges of $45,369 in the three months ended June 30, 2011.
Foreign Exchange Transaction Gain (Loss)
Foreign exchange transaction loss for three months ended June 30, 2011, was $150,732 compared to foreign exchange transaction loss of $92,676 for the same period of 2010, an increase of $58,056. The change was principally due to fluctuations in the foreign exchange rate.
Six Months Ended June 30, 2011, Compared to the Six Months Ended June 30, 2010:
|
Six Months Ended June 30,
|
$
|
%
|
||||||||||||||
|
2011
|
2010
|
Change
|
Change
|
|||||||||||||
|
Revenue
|
$
|
79,803,830
|
$
|
58,353,144
|
$
|
21,450,686
|
36.8
|
|||||||||
|
Cost of revenue
|
56,697,985
|
41,593,643
|
15,104,342
|
36.3
|
||||||||||||
|
Gross profit
|
23,105,845
|
16,759,501
|
6,346,344
|
37.9
|
||||||||||||
|
Selling, general and administrative expenses
|
7,804,539
|
5,013,109
|
2,791,430
|
55.7
|
||||||||||||
|
Interest and financing costs, net
|
108,700
|
281,599
|
(172,899
|
)
|
(61.4
|
)
|
||||||||||
|
Other income (including subsidy), net
|
925,425
|
8,223
|
917,202
|
11154.1
|
||||||||||||
|
Foreign exchange transaction loss
|
(266,855
|
)
|
(125,810
|
)
|
(141,045
|
)
|
(112.1
|
)
|
||||||||
|
Income tax expense
|
2,928,099
|
1,852,841
|
1,075,258
|
58.0
|
||||||||||||
|
Net income
|
13,140,477
|
10,057,563
|
3,082,914
|
30.7
|
||||||||||||
Revenues
Our revenue for the six months ended June 30, 2011, was $79.8 million, an increase of $21.5 million or 36.8% from $58.4 million for the six months ended June 30, 2010. The increase in revenues was a result of our aggressive sales expansion in the China domestic market and increasing our market share in the Middle East and Africa markets. The average selling prices of our products increased 8.1% in the six months ended June 30, 2011 compared to the average selling prices in the same period of 2010, which conforms to our strategy of maintaining healthy profit margins across our product lines. We increased our China domestic market sales to $44.6 million in the six months ended June 30, 2011, from $17.8 million in the same period of 2010, a 150.9% increase. Our products currently are available in more than 3,000 stores as of June 2011. Our customers include SuNing, who together with its wholly owned subsidiary Song Qiao, is a prominent national electric appliance retail chain in China with more than 1,000 stores, under a private label arrangement, and Gome, another prominent national electronic appliance retail chain in China with approximately 1,400 stores. We also added retail locations in other channels such as regional electric appliance retailers, wholesalers and department stores. We increased our product sales over internet portals, into hotels and restaurants, and via reward programs with large banks, telecommunication firms and postal offices in China. These results are in line with management’s plan to capture the fast growing China domestic small appliance market.
Our sales in South America were $9.5 million for the six months ended June 30, 2011, a $1.9 million or 16.7% decrease over the same period of 2010. Our sales in Asia were $8.3 million for the six months ended June 30, 2011, a $1.7 million or 17.2% decrease over the same period of 2010. Our sales in Europe were $4.9 million for the six months ended June 30, 2011, a $2.4 million or 32.3% decrease over the same period of 2010. The decrease in sales in South America, Asia and Europe were largely due to our changing marketing strategy. Specifically, we have reduced the amount of promotion and sales of products that carry low profit margins in these areas. These low profit margins are attributable to our inability to offset the increasing labor costs in China and the appreciation of the Chinese Yuan with higher prices in these areas.
Our sales in the Middle East were $8.3 million for the six months ended June 30, 2011, a $1.7 million or 25.2% increase over the same period of 2010. Our sales in Africa were $0.66 million for the six months ended June 30, 2011, a $0.06 million or 11.4% increase over the same period of 2010. Our sales gains in Africa and the Middle East were largely due to the recognized quality of our products in these markets and our reputation for timely delivery. This enabled us to retain long-term cooperation with customers as well as introduce new products to customers, helping us to gain market share in these areas following the financial crisis. Our sales in the U.S. were $3.5 million for the six months ended June 30, 2011, a $1.1 million or 24.2% decrease over the same period of 2010. We commenced sales to a new customer from April 2011, who is a leading franchiser in the U.S. However, the six months sales of 2011 were still lower than the same period of 2010 due to the slow recovery of the US economy. We expect the market in North America will expand gradually and our U.S. revenues to grow during 2011 with economic recovery as we continue to engage new large U.S. customers to meet our profit margin requirements.
Following the financial crisis, we believe that many smaller suppliers with limited capital resources went out of business, leading to further consolidation in the industry. In addition, we noticed that buyers increasingly favored companies with financial strength, higher quality products, sufficient plant capacity and a track record of prompt delivery. Buyers placed greater emphasis on being able to source quality supplies without delays or interruptions. We utilized this market opportunity to add new accounts and increase sales volume with our existing customers.
Cost of Revenue
Our cost of revenue for the six months ended June 30, 2011, increased by $15.1 million or 36.3% from $41.6 million for the six months ended June 30, 2010, to $56.7 million for the six months ended June 30, 2011. The increased cost of revenue in 2011 was due to the increase in sales. Our cost of revenue as a percentage of revenue remained constant at about 71% for the same period of both years.
Gross Profit
Our gross margin for the six months ended June 30, 2011, was 29.0% compared to 28.7% for the same period in 2010. The increase in gross margin for the six months ended June 30, 2011, compared to the same period in 2010, was due to increased sales in the China domestic market, which has higher margins of 34%. Our gross margin is substantially higher in the China domestic market because of the lower household penetration of small household products and trends of emerging wealth. In addition, our higher manufacturing efficiency as a result of higher revenue volume contributed to the increase in gross margin.
Operating Expenses
Selling, general and administrative expenses for the six months ended June 30, 2011, were $7.8 million, an increase of $2.8 million or 55.7% from $5.0 million for the same period of 2010. Selling expenses for the six months ended June 30, 2011, increased by 70.2% or $2.3 million in comparison to the same period of 2010 due to our significant increase in sales. Associated selling costs include advertising to expand the market, increase brand awareness and generate the significant increase in sales, which caused the promotion expense to increase $0.5 million or 2358%, compared to the same period of 2010. Our direct advertising costs remained minimal during the six months ended June 30, 2011, as expected, because we hire factory representatives and in-store promoters to promote our products directly to consumers at retail locations. We believe this direct in-store promotion approach is a standard practice in the small household appliances industry and highly effective in marketing to consumers in the unique Chinese retail environment as compared to traditional mass media advertising channels, which would require us to incur significant television and other mass media advertising expense without knowing to whom these advertisements were targeted. According to a survey in the 2010 China Small Electronics Market Research Report, approximately 60% of Chinese consumers surveyed purchased small household appliances after being introduced to the product by in-store promoters. Our in-store promoters market our products exclusively and directly to in-store customer traffic. We anticipate having approximately 1,000 in-store promoters hired directly by us or through third party distributors by the end of 2011. The salary to these promoters increased $0.6 million or 118%, compared to the same period of 2010. As a result of increased sales, freight and related dock charges increased $0.6 million or 30% and $0.3 million or 109%, compared to the six months ended June 30, 2010. General and administrative expenses for the six months ended June 30, 2011, increased by 28.9% or $0.5 million in comparison to the 2010 period mainly due to an increase in depreciation and amortization expense of $0.4 million due to purchase new equipment and new land use right.
Interest and Financing Costs, net
Interest and financing costs, net, for the six months ended June 30, 2011, was a net gain of $108,700, a decrease of $172,899 or 61.4% from a net gain of $281,599 for the same period of 2010. The change is due principally to interest income decreasing from $331,060 in the 2010 period to $108,700 in the 2011 period as our cash position decreased due to the expansion of our production capacity and working capital needs.
Other Income, net
Other income for the six months ended June 30, 2011, was $925,425 compared to $8,223 for the 2010 period, an increase of $917,202. The increase is due mainly to a grant of $1,007,192 received in the six months ended June 30, 2011, from the PRC government in recognition of our promoting the local economy and our expansion into overseas markets.
Foreign Exchange Transaction Gain (Loss)
Foreign exchange transaction loss for six months ended June 30, 2011, was $266,855 compared to foreign exchange transaction loss of $125,810 for the same period of 2010, an increase of $141,045. The change was principally due to fluctuations in the foreign exchange rate.
Off-Balance Sheet Arrangements
There were no off-balance sheet arrangements during the six and three months ended June 30, 2011, that have, or are reasonably likely to have, a current or future effect on our financial condition, revenues or expenses, results of operations, liquidity, capital expenditures or capital resources that are material to our interests.
Liquidity and Capital Resources
On December 17, 2009, we completed an underwritten public offering led by William Blair & Company and BMO Capital Markets of 6,900,000 shares of our common stock at a public offering price of $11.00 per share, including overallotment, for gross proceeds of $75,900,000.
During 2010, certain warrant holders exercised warrants to purchase 1,759,114 shares of our common stock that resulted in gross proceeds of $6,964,510.
In May 2010, we announced a $20 million share buyback program. We purchased 798,300 shares of our common stock on the open market during 2010 and returned such shares to the treasury for cancelation. We may purchase additional shares of our common stock on the open market pursuant to the buyback program from time to time.
Cash Flows
As of June 30, 2011, we had $22.3 million in cash and equivalents on hand. Our principal demands for liquidity are to increase sales in China, add capacity, purchase inventory and for sales distribution and general corporate purposes. We anticipate that the amount of cash we have on hand, as well as the cash that we will generate from operations, will satisfy these requirements.
Other current assets were $100.9 million and current liabilities were $34.5 million. Working capital was $88.7 million. The current ratio was 3.6:1 at June 30, 2011.
The following is a summary of cash provided by or used in each of the indicated types of activities during the six months ended June 30, 2011, and 2010:
|
2011
|
2010
|
|||||||
|
Cash provided by (used in):
|
||||||||
|
Operating activities
|
$
|
(8,281,158
|
)
|
$
|
(5,592
|
)
|
||
|
Investing activities
|
(2,316,982
|
)
|
(4,860,283
|
)
|
||||
|
Financing activities
|
(1,679,978
|
)
|
(314,423
|
)
|
||||
Net cash flows used in operating activities for the six months ended June 30, 2011, was $8.3 million compared to cash used in operating activities of $5,592 for the same period of 2010. The cash outflows from operating activities was attributed principally to increased inventory, payments for accounts payables, tax payable and bank acceptance outstanding, despite an increase in our net income, a decreased accounts receivable outstanding and advances to suppliers. The increase in inventory is within our expectations as we anticipate continued sales increase in the China domestic market.
Net cash flows used in investing activities for the six months ended June 30, 2011, was $2.3 million compared to net cash used of $4.9 million for the same period of 2010, which was mainly used for increase in the restricted cash of $5.17 million, payment for construction in progress of $2.37 million for our new building and workshop and purchase of property and equipment for $0.89 million, partially offset by the refund of a deposit for land use rights.
Net cash flows used in financing activities for the six months ended June 30, 2011, was $1.7 million compared to net cash used of $0.3 million for the same period of 2010, which was mainly due to $1.68 million dividend distribution to shareholders, while there was $320,000 payment on offering cost and $6.9 million purchase of treasury stock in the same period of 2010, partially offset by $7.0 million of proceeds from the exercise of warrants.
We sell our products in the China domestic market through a broad range of distribution outlets including regional and national wholesalers and third party distributors. Our standard terms for account receivables from several large and established China domestic retailers is 180 days from the close of the billing cycle, which is 30 – 45 days after products are delivered. The term for account receivables from other domestic customers is 30 – 90 days from the close of the billing cycle. These terms are customary for large and established retailers in China. Historically, we have not experienced late payments or bad debts under such terms from these select retailers. We sell our products to overseas customers in the export markets under letters of credit, prepaid arrangements, certain short credit terms or direct customer purchase orders. Our export sales-related account receivables typically are less than three months, depending on customer shipment schedules. Historically, we have not experienced significant bad debts from export sales. For the six months ended June 30, 2011, we had accounts receivable turnover of 3.04 on an annualized basis, with sales outstanding of 121 days. For the same period of 2010, we had accounts receivable turnover of 5.84 on an annualized basis, with sales outstanding of 63 days. The lower accounts receivable turnover and higher days outstanding in the six months ended in June 30, 2011, compared to the same period of 2010 was due to our rapid growth in sales in the China domestic market, which have much longer account receivable schedules than in the export markets. As we continue to focus on our expansion in the China domestic markets, our sales in the China domestic market may represent a larger percentage of our total revenue. We anticipate that our account receivables will remain in line with standard industry practice relating to account receivable schedules in China, which could be up to seven months.
Pending Litigation
On March 28, 2011, the Company filed suit in the Supreme Court of the State of New York against a certain blogger, “Alfred Little,” the website SeekingAlpha.com and others alleging the publishing of false and defamatory statements by the defendants as part of an orchestrated scheme to manipulate and depress the market for the Company’s common stock. The Company is claiming compensatory and punitive damages totaling at least $11 million, not including claims for attorneys’ fees, and other equitable remedies, including disgorgement of any illicit trading profits received by defendants in connection with the alleged market manipulation scheme. The Company has served document subpoenas on various non-parties to the suit to obtain information for the identification of “Alfred Little” and other persons responsible for the false and defamatory statements published by SeekingAlpha.com. In addition, defendant SeekingAlpha.com has filed a motion to dismiss the Company’s claim against it, and the Company has opposed that motion.
On April 29, 2011, in what appears to be a part of this attempted short seller-driven share manipulation, a purported securities class action lawsuit was filed against the Company and certain of its current and former officers and directors in the United States District Court for the Central District of California. This complaint is based expressly upon the false and defamatory reports concerning the Company that were authored by the fictitious character “Alfred Little” and published by Seeking Alpha Ltd., the defendants in the Company’s lawsuit. The complaint has not been certified as a class action by the court in California. The complaint seeks unspecified damages and other relief relating to the purported inflation in the price of the Company’s common stock during the class period. A consolidated amended complaint will be filed after the court rules on pending motions for the appointment of a lead plaintiff. The Company will respond in due course to any amended consolidated complaint, which the Company anticipates will largely reiterate the allegations of the current complaint. The Company strongly denies these allegations. The Company believes this lawsuit is frivolous and without merit and will contest it vigorously. The Company plans to pursue all legal remedies available to it if the operative complaint is not withdrawn in its entirety. The outcome of this litigation is currently uncertain. The Company has not recorded any liability for this litigation. The Company maintains directors and officers liability insurance, which provides the protection of certain insurance coverage for both the Company and its officers and directors.
Item 3. Quantitative and Qualitative Disclosures about Market Risk
We are exposed to market risks related to fluctuations in currency exchange rates and commodity prices for certain of our raw materials. We currently do not engage in forward foreign exchange agreements or other hedging transactions in an effort to reduce our exposure to foreign currency exchange risk. We do not engage in hedging transactions to protect against raw material pricing fluctuations; instead, we attempt to mitigate the short-term risks of price swings by purchasing raw materials in advance.
Our Annual Report on Form 10-K for the year ended December 31, 2010, contains information about our exposure to market risks under “Item 7A. Quantitative and Qualitative Disclosures about Market Risk.” There has been no material change in our exposure to market risks during the three months ended June 30, 2011.
Item 4. Controls and Procedures
Disclosure Controls and Procedures
Disclosure controls and procedures include, without limitation, controls and procedures designed to ensure that information required to be disclosed by us in the reports that we file or submit under the Exchange Act is recorded, processed, summarized and reported within the time periods specified in SEC rules and forms. We also accumulate and communicate this information to our management, including our principal executive and principal financial officers, or persons performing similar functions, as appropriate to allow timely decisions regarding required disclosure. An evaluation was conducted under the supervision and with the participation of our management, including the Chief Executive Officer (“CEO”), our principal executive officer, and Chief Financial Officer (“CFO”), our principal financial officer, of the effectiveness of the design and operation of our disclosure controls and procedures (as defined in Rule 13a-15(e) and Rule 15d-15(e) of the Exchange Act) as of June 30, 2011. Based on that evaluation, the CEO and CFO concluded that our disclosure controls and procedures were not effective as of such date because management had not completed remediation of the material weaknesses in our internal control over financial reporting identified during the fourth quarter of 2010, as described below and discussed in “Item 9A. Controls and Procedures” in our Annual Report on Form 10-K for the year ended December 31, 2010.
Notwithstanding these material weaknesses, our management has concluded that our consolidated financial statements for the periods covered by and included in this report are prepared in accordance with US GAAP and fairly present, in all material respects, our financial position, results of operations and cash flows for each of the periods presented herein.
Changes in Internal Control over Financial Reporting
As of June 30, 2011, we are in the process of remediating the following material weaknesses identified by management in our internal control over financial reporting (as such term is defined in Rules 13a-15(f) and 15d-15(f) of the Exchange Act). The material weaknesses identified during management’s assessment as of December 31, 2010, were: (i) ineffective documentation and testing of information technology (“IT”) related controls over financial reporting; and (ii) a lack of technical accounting expertise among our financial staff regarding the requirements of the PCAOB Accounting Standard No. 5 and Committee of Sponsoring Organizations of the Treadway Commission (“COSO”) in the assessment of internal control over financial reporting. In light of these material weaknesses, management concluded that we did not maintain effective internal control over financial reporting.
We have developed certain remediation steps to address these material weaknesses and to improve our internal control over financial reporting. Specifically, the following remediation steps are being implemented or are planned to be implemented:
|
·
|
adoption of an IT framework that documents key IT controls and addressing testing procedures that could potentially impact financial reporting;
|
|
·
|
hiring of additional credentialed professional staff and consulting professionals with greater knowledge of US GAAP in our domestic operations and the requirements of Section 404 of the Sarbanes-Oxley Act of 2002 to oversee our financial reporting process in order to ensure our compliance with US GAAP and the relevant securities laws; and
|
|
·
|
provide additional training to our accounting staff on US GAAP, the Sarbanes-Oxley Act of 2002 and the requirements of the PCAOB, and regarding the preparation of financial statements.
|
We believe the measures described above will facilitate remediation of the material weaknesses management identified and will continue to strengthen our internal control over financial reporting. As we continue to evaluate and work to improve our internal control over financial reporting, we may determine that additional measures are necessary to address control deficiencies.
Other than the changes discussed above, there were no changes in our internal control over financial reporting during the quarter ended June 30, 2011, that have materially affected, or are reasonably likely to materially affect, our internal control over financial reporting.
PART II. OTHER INFORMATION
Item 1. Legal Proceedings
We may become involved in various lawsuits and legal proceedings arising in the ordinary course of business. Litigation is subject to inherent uncertainties and an adverse result in these or other matters that may arise from time to time could have an adverse effect on our business, financial conditions or operating results. Other than the following pending suits, we are currently not aware of any such legal proceedings or claims that will have, individually or in the aggregate, a material adverse effect on our business, financial condition or operating results.
On March 28, 2011, we filed suit in the Supreme Court of the State of New York, captioned Deer Consumer Products, Inc. v. Alfred Little, et al., Index No. 650823/2011, against a certain blogger, “Alfred Little,” the website SeekingAlpha.com and others. Our claims in this action allege the publishing of false and defamatory statements by the defendants as part of an orchestrated scheme to manipulate and depress the market for our common stock. We are claiming compensatory and punitive damages totaling at least $11 million, not including claims for attorneys’ fees, and other equitable remedies, including disgorgement of any illicit trading profits received by defendants in connection with the alleged market manipulation scheme. We have served document subpoenas on various non-parties to the suit to obtain information for the identification of “Alfred Little” and other persons responsible for the false and defamatory statements published by SeekingAlpha.com. In addition, defendant SeekingAlpha.com has filed a motion to dismiss our claim against it, and we have opposed that motion.
On April 29, 2011, a purported securities class action lawsuit on behalf of the purchasers of our common stock between March 31, 2009, and March 21, 2011, James Rose v. Deer Consumer Products, Inc. et al, was filed against us and certain of our current and former officers and directors in the United States District Court for the Central District of California. The court has not yet certified the class action status. The complaint alleges violations of Section 10(b) and Rule 10b-5 of the Exchange Act, as well as, in the case of the individual defendants, the Section 20(a) control person provisions of the Exchange Act. The factual assertions in the complaint, based expressly on the published statements at issue in the Alfred Little suit described above, consist primarily of allegations that the defendants made materially false or misleading public statements concerning our financial condition in fiscal years 2010 and 2009 and our acquisition of Winder in 2008. The complaint seeks unspecified damages and other relief relating to the purported inflation in the price of our common stock during the class period. A consolidated amended complaint will be filed after the court rules on pending motions for the appointment of a lead plaintiff. We will respond in due course to any amended consolidated complaint, which we anticipate will largely reiterate the allegations of the current complaint. We strongly deny these allegations. We believe this lawsuit is frivolous and without merit and will contest it vigorously. We plan to pursue all legal remedies available to us if the operative complaint is not withdrawn in its entirety.
We maintain directors and officers liability insurance, which provides the protection of certain insurance coverage for both the company and our officers and directors. We can provide no assurance as to the outcome of these cases. Regardless of the outcomes, such litigation may require significant attention and resources of management.
Item 1A. Risk Factors
You should consider carefully the factors discussed in the “Risk Factors” in our Annual Report on Form 10-K for the year ended December 31, 2010, which could materially affect our business. There have been no material changes to the risk factors described previously in that Annual Report other than the risk factor discussed in our Quarterly Report on Form 10Q for the period ended March 31, 2011.
Item 2. Unregistered Sales of Equity Securities and Use of Proceeds
None.
Item 3. Defaults Upon Senior Securities
None.
Item 5. Other Information
None.
Item 6. Exhibits
See the Exhibit Index following the signature page to this Quarterly Report on Form 10-Q for a list of exhibits filed or furnished with this report, which Exhibit Index is incorporated herein by reference.
Pursuant to the requirements of the Securities Exchange Act of 1934, the registrant has duly caused this report to be signed on its behalf by the undersigned thereunto duly authorized.
|
DEER CONSUMER PRODUCTS, INC.
|
|||
|
(Registrant)
|
|||
|
Date: August 9, 2011
|
By:
|
/s/ Ying He
|
|
|
Ying He
Chief Executive Officer
(Principal Executive Officer)
|
|||
EXHIBIT INDEX
|
Exhibit No.
|
Description of Exhibit
|
|
31.1 †
|
|
|
31.2 †
|
|
|
32.1 ‡
|
|
|
32.2 ‡
|
|
|
101**
|
The following financial statements from the Company’s Quarterly Report on Form 10-Q for the quarter ended June 30, 2011, formatted in XBRL: (i) Consolidated Balance Sheets, (ii) Consolidated Statements of Income and Comprehensive Income, (iii) Consolidated Statements of Cash Flows, and (iv) Notes to Consolidated Financial Statements
|
† Filed herewith
‡ Furnished herewith
** XBRL (Extensible Business Reporting Language) information is furnished and not filed or a part of a registration statement or prospectus for purposes of sections 11 or 12 of the Securities Act of 1933, as amended, is deemed not filed for purposes of section 18 of the Securities Exchange Act of 1934, as amended, and otherwise is not subject to liability under these sections.