Attached files
| file | filename |
|---|---|
| 8-K/A - FORM8KA - PPL Corp | form8ka.htm |
© PPL Corporation 2011
14
Exhibit 99.1
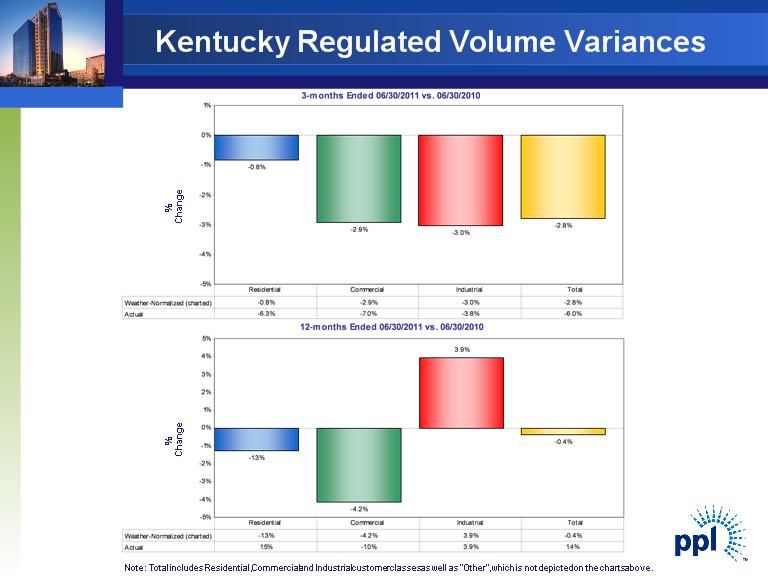
©PPL Corporation 2011 Kentucky Regulated Volume Variances % Change% Change Note: Total includes Residential, Commercial and Industrial customer classes as well as “Other” , which is not depicted on the charts above. 12- months Ended06/ 30/2011 vs. 06/ 30/2010 -1.3% -4.2% 3.9% -0.4% -5% -4% -3% -2% -1% 0% 1% 2% 3% 4% 5% Weather- Normalized ( charted) -1.3% - 4.2% 3.9% -0.4% Actual 1.5% - 1.0% 3.9% 1.4% Residential Commercial Industrial Total 3- months Ended 06/30/ 2011 vs. 06/30/ 2010 -0.8% -2.9% -3.0% -2.8% -5% -4% -3% -2% -1% 0% 1% Weather- Normalized ( charted)- 0.8% - 2.9% - 3.0% - 2.8% Actual - 6.3% - 7.0% - 3.8% - 6.0% Residential Commercial Industrial Total 14 Exhibit 99.1 © PPL Corporation 2011 Kentucky Regulated Volume Variances % Change% Change Note: Total includes Residential, Commercial and Industrial customer classes as well as “Other” , which is not depicted on the charts above. 12- months Ended 06/ 30/2011 vs. 06/ 30/2010 -1.3% -4.2% 3.9% -0.4% -5% -4% -3% -2% -1% 0% 1% 2% 3% 4% 5% Weather- Normalized( charted)-1.3%- 4.2% 3.9% -0.4% Actual 1.5% - 1.0% 3.9% 1.4% Residential Commercial Industrial Total 3- months Ended 06/30/ 2011 vs. 06/30/ 2010 -0.8% -2.9% -3.0% -2.8% -5% -4% -3% -2% -1% 0% 1% Weather- Normalized ( charted) - 0.8% - 2.9% - 3.0% - 2.8% Actual- 6.3%- 7.0% - 3.8% - 6.0% Residential Commercial Industrial Total 14 Exhibit 99.1
© PPL Corporation 2011 Kentucky Regulated Volume Variances % Change% Change Note: Total includes Residential, Commercial and Industrial customer classes as well as “Other” , which is not depicted on the charts above. 12- months Ended 06/ 30/2011 vs. 06/ 30/2010 -1.3% -4.2% 3.9% -0.4% -5% -4% -3% -2% -1% 0% 1% 2% 3% 4% 5% Weather- Normalized ( charted) -1.3% - 4.2% 3.9% -0.4% Actual 1.5% - 1.0% 3.9% 1.4% Residential Commercial Industrial Total 3- months Ended 06/30/ 2011 vs. 06/30/ 2010 -0.8% -2.9% -3.0% -2.8% -5% -4% -3% -2% -1% 0% 1% Weather- Normalized ( charted) - 0.8% - 2.9% - 3.0% - 2.8% Actual - 6.3% - 7.0% - 3.8% - 6.0% Residential Commercial Industrial Total 14 Exhibit 99.1 © PPL Corporation 2011 Kentucky Regulated Volume Variances % Change