Attached files
| file | filename |
|---|---|
| EX-23.3 - EX-23.3 - CPG INTERNATIONAL INC. | a2203483zex-23_3.htm |
| EX-23.4 - EX-23.4 - CPG INTERNATIONAL INC. | a2203483zex-23_4.htm |
| EX-23.2 - EX-23.2 - CPG INTERNATIONAL INC. | a2203483zex-23_2.htm |
Use these links to rapidly review the document
TABLE OF CONTENTS
INDEX TO CONSOLIDATED FINANCIAL STATEMENTS
As filed with the Securities and Exchange Commission on August 5, 2011
Registration No. 333-173678
SECURITIES AND EXCHANGE COMMISSION
WASHINGTON, D.C. 20549
AMENDMENT NO. 2
TO
FORM S-1
REGISTRATION STATEMENT
UNDER
THE SECURITIES ACT OF 1933
CPG INTERNATIONAL INC.
(Exact name of registrant as specified in its charter)
| Delaware (State or other jurisdiction of incorporation or organization) |
3080 (Primary Standard Industrial Classification Code Number) |
20-2779385 (I.R.S. Employer Identification Number) |
888 North Keyser Avenue
Scranton, Pennsylvania 18504
(570) 558-8000
(Address, including zip code, and telephone number, including
area code, of registrant's principal executive offices)
Scott C. Harrison
Chief Financial Officer
888 North Keyser Avenue
Scranton, Pennsylvania 18504
(570) 558-8000
(Name, address, including zip code,
and telephone number, including area code, of agent for service)
| Copies to: | ||
Andrew B. Barkan, Esq. Fried, Frank, Harris, Shriver & Jacobson LLP One New York Plaza New York, New York 10004 (212) 859-8000 |
Marc D. Jaffe, Esq. Ian D. Schuman, Esq. Latham & Watkins LLP 885 Third Avenue New York, New York 10022 (212) 906-1200 |
|
Approximate date of commencement of proposed sale to the public:
As soon as practicable after the effective date of this Registration Statement.
If any of the securities being registered on this form are to be offered on a delayed or continuous basis pursuant to Rule 415 under the Securities Act of 1933, check the following box. o
If this form is filed to register additional securities for an offering pursuant to Rule 462(b) under the Securities Act, check the following box and list the Securities Act registration statement number of the earlier effective registration statement for the same offering. o
If this form is a post-effective amendment filed pursuant to Rule 462(c) under the Securities Act, check the following box and list the Securities Act registration statement number of the earlier effective registration statement for the same offering. o
If this form is a post-effective amendment filed pursuant to Rule 462(d) under the Securities Act, check the following box and list the Securities Act registration statement number of the earlier effective registration statement for the same offering. o
Indicate by check mark whether the registrant is a large accelerated filer, an accelerated filer, a non-accelerated filer, or a smaller reporting company. See the definitions of "large accelerated filer," "accelerated filer" and "smaller reporting company" in Rule 12b-2 of the Exchange Act. (Check One):
| Large accelerated filer o | Accelerated filer o | Non-accelerated filer ý | Smaller reporting company o |
CALCULATION OF REGISTRATION FEE
|
||||
| Title of Each Class of Securities to be Registered |
Proposed Maximum Aggregate Offering Price(1)(2) |
Amount of Registration Fee(3) |
||
|---|---|---|---|---|
Common Stock, $0.01 par value |
$150,000,000 | $17,415 | ||
|
||||
- (1)
- Estimated
solely for the purpose of calculating the registration fee in accordance with Rule 457(o) under the Securities Act of 1933.
- (2)
- Including
additional shares of common stock that may be purchased pursuant to the underwriters' overallotment option.
- (3)
- Previously paid.
The Registrant hereby amends this Registration Statement on such date or dates as may be necessary to delay its effective date until the Registrant shall file a further amendment which specifically states that this Registration Statement shall thereafter become effective in accordance with Section 8(a) of the Securities Act of 1933 or until the Registration Statement shall become effective on such date as the Commission, acting pursuant to said Section 8(a), may determine.
Subject to Completion, dated August 5, 2011
The information in this prospectus is not complete and may be changed. We may not sell these securities until the registration statement filed with the Securities and Exchange Commission is effective. This prospectus is not an offer to sell these securities and it is not soliciting an offer to buy these securities in any state where the offer or sale is not permitted.
PROSPECTUS

CPG International Inc.
Common Stock
This is the initial public offering of our common stock. We are offering shares of our common stock and the selling stockholder is offering shares. We will not receive any proceeds from sale of shares held by the selling stockholder. No public market currently exists for our common stock. Certain members of our management and board of directors as well as entities affiliated with AEA Investors LP, our sponsor, have an equity interest in the selling stockholder.
We have applied to list our common stock on the New York Stock Exchange under the symbol "AZEK."
We anticipate that the initial public offering price will be between $ and $ per share.
Investing in our common stock involves risks. See "Risk Factors" beginning on page 19 of this prospectus.
| |
Per Share | Total | |||||
|---|---|---|---|---|---|---|---|
Price to the public |
$ | $ | |||||
Underwriting discounts and commissions |
$ | $ | |||||
Proceeds to us (before expenses) |
$ | $ | |||||
Proceeds to the selling stockholder (before expenses) |
$ | $ | |||||
We and the selling stockholder have granted the underwriters the option to purchase additional shares of common stock on the same terms and conditions set forth above if the underwriters sell more than shares of common stock in this offering.
Neither the Securities and Exchange Commission nor any state securities commission has approved or disapproved of these securities or passed on the adequacy or accuracy of this prospectus. Any representation to the contrary is a criminal offense.
The underwriters expect to deliver the shares on or about , 2011.
| Barclays Capital | Deutsche Bank Securities | Credit Suisse |
Prospectus dated , 2011

i
You should rely only on the information contained in this prospectus and any free writing prospectus prepared by or on behalf of us that we have referred to you. We have not, the selling stockholder has not and the underwriters have not authorized any other person to provide you with additional or different information. If anyone provides you with additional, different or inconsistent information, you should not rely on it. This prospectus does not constitute an offer to sell, or solicitation of an offer to buy, to any person in any jurisdiction in which such an offer to sell or solicitation would be unlawful. You should assume that the information appearing in this prospectus is accurate only as of the date on the front cover of this prospectus, regardless of its time of delivery or of any sales of shares of our common stock. Our business, financial condition, results of operations or cash flows may have changed since such date.
This prospectus includes market and industry data that we obtained from a market study by L.E.K. Consulting LLC, or L.E.K., which we commissioned in March 2011, as well as from publicly available industry sources, including studies and reports by Harvard University's Joint Center for Housing Studies, the U.S. Federal Reserve and the U.S. Census Bureau. In addition, this prospectus includes market and industry data that we prepared primarily based on our management's knowledge and experience in the markets in which we operate, together with information obtained from surveys, reports by market research firms, our customers, distributors, suppliers, trade and business organizations and other contacts in the markets in which we operate. Market share data is subject to change and may be limited by the availability of raw data, the voluntary nature of the data gathering process and other limitations inherent in any statistical survey of market shares. In addition, customer preferences are subject to change. References herein to our being a leader in a market or product category refer to our belief that we have a leading market share position in each specified market based on sales dollars, unless the context otherwise requires, and do not take into account non-synthetic competitive products. In addition, the discussions herein regarding our various markets are based on how we define the markets for our products, which products may be either part of larger overall markets or markets that include other types of products. When we use the term "North America" in this prospectus, we are referring to the United States and Canada.
Unless stated otherwise herein, all market share and market size data about the exterior trim market, deck market, rail market, bathroom partition market and locker market, and other markets for synthetic products, as well as our position and the positions of our competitors within these markets, including our products relative to our competitors, are based on the market study by L.E.K. that we commissioned, excluding those estimates that are qualified by our belief. In developing its market study, L.E.K. utilized primary research and analysis together with certain third party data. In those instances where L.E.K.'s market study contains ranges of market share, market size, growth rates and other data, we have presented in this prospectus the midpoint of such ranges.
For an overview of the industry sources that we cite in this prospectus, see "Business—Our Industry and End-Markets—Industry Sources."
This prospectus includes trademarks and service marks owned by us, including CPG International™, AZEK®, Scranton Products®, Vycom®, Celtec®, Corrtec™, Flametec®, Hiny Hiders®, Playboard®, Procell®, Resistall™, Sanatec®, Seaboard®, TuffTec Lockers®, Arbor Collection®, Harvest Collection®, Acacia®, Cobre®, Fawn®, Kona®, Morado®, Redland Rose®, Sedona®, Silver Oak™ and Tahoe®, as well as trademarks and service marks owned by third parties.
ii
This summary highlights selected information about our business and about this offering contained elsewhere in this prospectus. It does not contain all of the information that may be important to you. You should carefully read this entire prospectus, including the matters discussed in the section entitled "Risk Factors" and the consolidated financial statements and the related notes, before investing in our common stock. Unless the context otherwise requires, references in this prospectus to "our company," "we," "our" or "us" (or similar terms) refer to CPG International Inc. together with its consolidated subsidiaries. The term "Holdings" refers to CPG International Holdings LP, the owner of 100% of our common stock prior to the completion of this offering and the selling stockholder in this offering. Unless otherwise stated or the context otherwise requires, operating data in this prospectus relating to our business, including without limitation the number of distribution locations, distributors, dealers, retail outlets and registered contractors, are as of March 31, 2011. References herein to "conversion" refer to an increase in the use of low maintenance synthetic building products in replacement of or substitution for building products made of other materials, in particular wood, wood composites and metal.
We are a leading manufacturer and innovator of low maintenance, premium branded synthetic building products that are replacing wood, wood composites, metal and other materials in the residential, institutional, commercial and industrial end-markets. Across each of our three operating segments, AZEK® Building Products, Scranton Products® and Vycom®, we have market-leading brands and products that offer a compelling value proposition, including enhanced durability and quality, attractive aesthetics and lower installation, maintenance and life cycle costs. We offer exterior residential building solutions including trim, deck, rail, moulding and porch products through our AZEK Building Products, or AZEK, segment, interior institutional and commercial solutions including bathroom partitions and lockers through our Scranton Products, or Scranton, segment and highly-engineered industrial plastic sheet products through our Vycom segment. AZEK holds the #1 market share position in the North American polyvinyl chloride, or PVC, trim and deck markets, Scranton Products holds the #1 market share position in the plastic bathroom partition and plastic locker markets and Vycom is a recognized leader in several of its target markets.
Our products are currently in the early growth stage of their life cycles, and we believe we will continue to outperform our markets by taking advantage of the significant conversion, penetration and market expansion opportunities that exist. We continue to drive increased material conversion towards our products through product innovation, an extensive and growing sales and distribution network targeting and educating key influencers and decision makers, and selected acquisitions. Since 2001, we have grown our sales by a compound annual growth rate, or CAGR, of approximately 15.0% to $327.5 million for the year ended December 31, 2010.
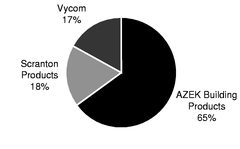
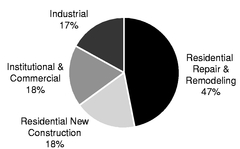
We operate on a national basis in all 50 states and in Canada. Our three operating segments are end-market focused and operate under the same philosophy of identifying market needs and being the first to provide impactful and innovative solutions for the most demanding applications. The following charts show our 2010 sales by segment and by estimated end-market.
2010 Sales by Segment |
2010 Sales by Estimated End-Market |
|
|
|
1
The following table provides an overview of our three operating segments:
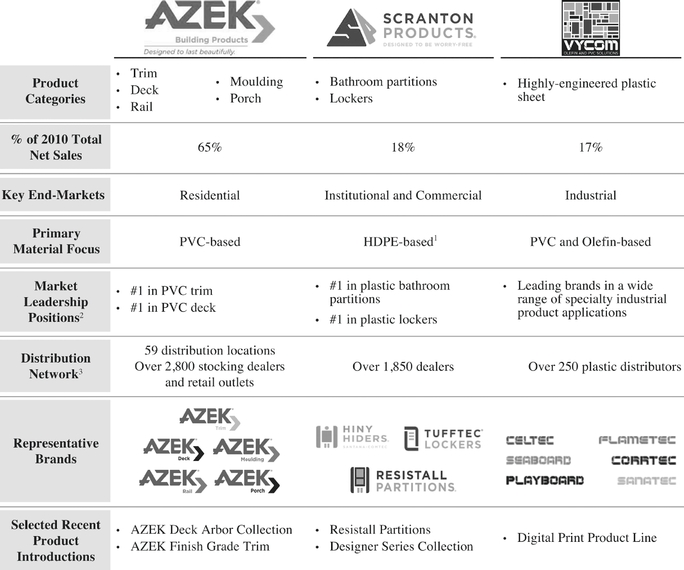
- 1
- In this prospectus, we refer to high-density polyethylene as "HDPE."
- 2
- According to L.E.K. See "Market and Industry Data."
- 3
- Numbers reflected are approximate as of March 31, 2011.
We sell our low maintenance synthetic products into a variety of large, attractive segments within the U.S. construction market, which includes residential, institutional, commercial and industrial end-markets. We also sell certain Vycom products into industrial original equipment manufacturer, or OEM, markets. Overall demand for building products is driven by a number of factors, including consumer confidence, availability of credit, trends in the construction cycle and general economic cycles. Examples of specific industry dynamics that we believe impact our company include increasing demand for low maintenance products and lower life cycle costs, greater focus on energy efficiency and homeowners' desire for increased use of outdoor living space. We believe these trends have and will continue to drive growth in our specific end-markets at a rate above the broader U.S. construction market. In addition, according to a market study by L.E.K. that we commissioned in March 2011, these
2
addressable end-markets, which collectively represented approximately $4.9 billion in 2010 sales, are in the midst of significant material conversion from wood, wood composites, metal and other materials to synthetic products made from materials including PVC and HDPE. Synthetic materials are increasingly being substituted for traditional building materials such as wood and metal, due to their aesthetics, lower life cycle costs and greater overall value proposition. Synthetic building products were first introduced decades ago in the residential window and siding markets and have the number one market share in those markets today. As a result of the successful penetration of these early applications and continued advances in material science and manufacturing, synthetic materials have more recently increased their share in other building product segments such as deck, trim and rail within the residential market, and bathroom partitions and lockers in the institutional and commercial markets.
We believe low maintenance synthetic products offer a compelling value proposition, including enhanced durability and quality, attractive aesthetics and lower installation, maintenance and life cycle costs relative to traditional and other materials, such as wood, wood composites and metal. For example, over a projected 20 year period, L.E.K. estimates that cellular PVC-based deck products will have approximately 50% lower life cycle costs than wood and wood composites. Cellular PVC-based products have continued to take market share from traditional materials and other synthetic materials, due to their superior product qualities. For example, according to L.E.K., penetration of low maintenance products, of which cellular PVC-based is the largest category, in the approximately $1.8 billion deck market has nearly tripled from 4% in 2008 to 11% in 2010 and is anticipated to continue to increase over the next several years.
The following table illustrates the size of the addressable market opportunity by sales dollars for select product categories and the anticipated increase in penetration of low maintenance products over the next several years. In addition, the following chart presents an illustrative penetration curve of our synthetic product categories compared to certain building products made of other materials.
Selected Addressable Market Opportunities
($ in millions)
| |
|
Low Maintenance Penetration |
||||
|---|---|---|---|---|---|---|
| |
2010 Total North American Market Size (All Materials) |
|||||
| |
2010 | 2015E | ||||
Trim |
$1,050-1,150 | 17-19% | 21-23% | |||
Deck |
$1,700-1,800 | 10-12% | 19-21% | |||
Rail |
$1,400-1,500 | 6-8% | 13-15% | |||
Partitions |
$250-270 | 33-38% | 35-40% | |||
Lockers |
$290-310 | 4-5% | 5-6% | |||
Source: L.E.K.
Building Products Illustrative Penetration Curve
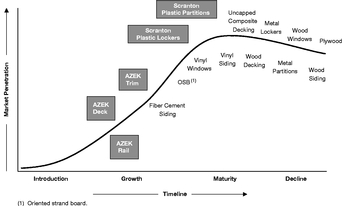
Source: L.E.K.
Over the last several years, the general economy, and particularly the U.S. construction market, experienced a significant downturn. However, we began to see recovery in many of our end-markets beginning in 2010. The outlook for the residential repair and remodeling market, which was more resilient through the recent economic downturn than the new construction market, is favorable, driven by positive demographic trends and a growing and aging housing stock. L.E.K. expects the residential repair and remodeling market to grow by a CAGR of approximately 4% between 2010 and 2015. The outlook for new residential construction in the United States also is favorable, supported by continued household formation, population growth, attractive mortgage rates and low new home inventory levels. Harvard University's Joint Center for Housing Studies expects that the number of households in the
3
United States will grow by approximately 1.3 million to 1.5 million per year on average between 2010 and 2020, or a total of approximately 12.5 million to 14.8 million additional households, over the same time period. L.E.K.'s housing starts forecast from 2010 to 2015 estimates a CAGR of approximately 19%, with new housing starts reaching approximately 1.4 million in 2015. While 2010 remained challenging in our institutional and commercial end-markets, these markets are late-cycle in nature and are expected to benefit from greater access to financing and a continued general economic recovery. L.E.K. forecasts that U.S. commercial construction markets will increase by a CAGR of approximately 8% and the education segment of the institutional construction market will increase by a CAGR of approximately 2%, in each case from 2010 to 2015. The industrial market is tied to the health of the industrial economy as commonly represented as growth in industrial production, which L.E.K. forecasts to grow at an annual rate of approximately 3% through 2015.
For an overview of the industry sources that we cite in this prospectus, see "Business—Our Industry and End-Markets—Industry Sources."
Market leader in large, attractive and high growth sectors. We maintain leading market positions in a number of highly attractive, large and underpenetrated markets in the early stages of material conversion. Our AZEK brand currently holds the #1 market share position in the North American PVC trim and deck markets. In 2010, the total market size for all materials in the trim, deck and rail markets was approximately $4.3 billion and, at AZEK, we are currently pursuing additional opportunities within the broader North American exterior residential building products market. In addition, Scranton Products currently holds the #1 market share position in plastic bathroom partitions and plastic lockers, and Vycom is a recognized leader in several of its target markets. Overall, at Scranton and Vycom, we are currently pursuing approximately $800 million of market opportunities.
Our high quality synthetic products are currently in the early growth stage of their life cycles, and we believe that we will continue to outperform our markets by taking advantage of the significant conversion, penetration and market expansion opportunities that exist. For example, according to L.E.K., PVC trim, low maintenance deck and premium rail products are expected to grow from approximately 18%, 11% and 7% of the total U.S. trim, deck and rail markets, respectively, based on 2010 sales to 22%, 20% and 14% by 2015. Additionally, we believe that the anticipated recovery in the residential, institutional, commercial and industrial construction markets will further provide an opportunity for growth.
Premium brands supported by unwavering commitment to product quality, innovation and service. Our flagship brands are recognized for high quality products within their respective residential, institutional, commercial and industrial end-markets. For example, ProSales magazine's most recent study of professional dealers found that AZEK Deck is the #1 deck brand "most likely to be stocked." At Scranton Products, we are the #1 specified brand by architects in bathroom partitions. Similarly, our various Vycom brands are highly recognized in their specific market categories. We have achieved our premium brand reputation because of our unwavering commitment to consistently provide high quality and innovative products, and a high level of customer service. We proactively work with and solicit feedback from distributors, dealers, architects, contractors, builders and consumers to better develop products that address unmet customer needs, reduce costs, increase ease of installation and improve aesthetics. These efforts are supported by our research and development, or R&D, process that has resulted in 28 successful new product introductions in the last two years. For the year ended December 31, 2010, our new products introduced in the last two years represented 15.3% of our total sales.
Broad and expanding product offering with superior performance characteristics. We believe our products provide a superior value proposition throughout our supply chain from distributors to dealers
4
and retailers, contractors, builders, architects and ultimately to consumers. The performance characteristics of our products relative to competing products result in lower installation, maintenance and life cycle costs. AZEK's trim, deck, rail, moulding and porch products are aesthetically similar to finished wood but are stain, split and scratch resistant, do not rot or warp, are impervious to water and insect infestation, do not require paint or stains for protection, are easier to mill and fabricate and hold paint longer if paint is desired. As a result, our AZEK trim and deck products have lower life cycle costs than traditional and other materials, such as wood and wood composites. For example, over a projected 20 year period, L.E.K. estimates that cellular PVC-based deck products will have approximately 50% lower life cycle costs than wood and wood composites. For contractors and builders, the performance and workability characteristics of our AZEK products contribute to lower installation costs and fewer call-backs from consumers. The products we offer through our Scranton Products and Vycom segments have similar attributes valued by our customers. As a result of our products' excellent performance characteristics, we have also developed high customer satisfaction and brand loyalty.
We believe the breadth and depth of our product offering gives us a significant competitive advantage in the marketplace. Through our strong manufacturing and technical capabilities and commitment to innovation, we focus on consistently expanding our product offering and the markets we serve. We have one of the broadest synthetic product offerings in our industry segment. Within the past five years we have expanded our AZEK product line from offering primarily trim products to currently offering a broad range of exterior residential building products including trim, deck, rail, moulding and porch. As a result of our product expansion, we believe we have tripled the average potential spend per home for our AZEK products over the past five years.
Comprehensive and growing sales and distribution network. We have developed a tailored sales and distribution strategy focused on educating key influencers and decision makers along the entire supply chain, which we believe will continue to drive further conversion, penetration and growth for our products. We sell our AZEK products through a two-step distribution system across the United States and in Canada, utilizing 59 independent distribution locations that cover over 2,800 stocking dealers and retail outlets supplying more than 2,850 AZEK-registered contractors. We recently expanded AZEK's presence in the retail channel and expect to significantly increase our presence in home centers for our AZEK Deck product. We sell Scranton Products through a national network of more than 1,850 dealers who sell to institutional and commercial customers across the United States and in Canada. Vycom is sold to a national network of more than 250 plastic distributors across the United States, Canada and Latin America, who sell primarily to OEMs.
We significantly invested in our sales force infrastructure across each operating segment through the recent economic downturn by increasing headcount, enhancing training, and implementing a highly integrated customer relationship management, or CRM, system to increase sales efficiency. We also recently realigned our entire sales force to maximize downstream pull-through demand. We supplement the efforts of our sales force with a variety of marketing strategies and tools that include more than 4,000 contractor sample kits and 1,150 display kiosks, product literature, print, TV and radio advertising, trade shows, internet marketing and social media initiatives, sales training and our AZEK University program to educate distributors, dealers, architects, contractors and builders on the advantages of our products. We believe that our distribution strategy, sales and education efforts, and strong customer relationships provide a strong competitive advantage and are difficult for our competitors to replicate.
Strong technical and manufacturing capabilities. Our disciplined, process-oriented operations are built on a foundation that includes deep technical expertise, proprietary material formulations, a broad range of extrusion capabilities, meaningful scale and capacity, and post-extrusion value-add capabilities that enable innovation and expansion into new markets. We are a low-cost, vertically integrated manufacturer focused on continuous improvement and critical-to-quality processes which allow us to obtain high throughput and lower unit production costs while maintaining product integrity. We
5
continued to make capital investments in our technical capabilities and manufacturing systems throughout the recent economic downturn, which we believe will drive operating leverage as we continue to grow our businesses.
Strength of operating model supports growth and overall financial profile. We believe that our operating model has driven our strong growth and market outperformance as well as the development of our industry-leading suite of high quality, innovative products. We believe we provide a superior value proposition throughout the supply chain through our focus on innovation, our technical manufacturing capabilities, our commitment to providing excellent customer service, and the quality of our products. Through our downstream focused sales force infrastructure, go-to-market strategy, and extensive and growing distribution network, we have successfully positioned our products as premium brands within their respective market categories.
Despite the challenging economic environment, our substantial indebtedness, which totaled $325.5 million as of March 31, 2011, and fluctuating raw material prices, we have continued to profitably grow our businesses over the past several years. In the year ended December 31, 2010, we achieved consolidated revenue growth of 23% over 2009, driven by strong gains at AZEK and Vycom of 30% and 53%, respectively. We have also maintained attractive margins, returns on capital and strong free cash flow generation, and we continue to invest in our businesses.
Committed and experienced management team. We have an experienced and committed management team led by our Chief Executive Officer, Eric Jungbluth. Mr. Jungbluth has significant experience in the building products industry including prior roles as President of The HON Company (division of HNI Corporation) and President of Allsteel Inc. as well as leadership positions at Moen Incorporated (division of Fortune Brands), Kirsh (division of Newell), and Warner Lambert. Our senior management team has extensive experience in branding, channel management, new product development, and creating world-class business processes. Collectively, our senior management team has over 120 years of cumulative industry or related industry experience, with certain members having held leadership positions at a number of leading industrial companies, including Sherwin Williams Paint Company, James Hardie Building Products, Silgan Plastics, Gunlocke Company, SI Handling Systems, Lutron Electronics, and Lockheed Martin Company.
Capitalize on continued material conversion and market penetration opportunities. We believe that we will continue to realize significant growth due to our focused efforts to drive material conversion and market penetration of our products, particularly in exterior residential applications for AZEK. We intend to increase conversion and penetration in our markets by educating key influencers and decision makers, which in turn creates pull-through demand for our products. Our integrated approach to understanding the needs and preferences throughout our supply chain enables us to drive conversion by customizing our products to address key shortcomings of alternative products. Our business strategy and marketing efforts are also focused on driving market penetration through a tailored regional market approach. Through these initiatives, we plan to continue to increase the size of the market for our products and enhance growth opportunities beyond our existing product portfolio.
Continue to introduce innovative new products in existing and adjacent markets. We have a history of being a first-to-market innovator focused on R&D and continued product innovation. We utilize a market-focused and solutions-driven approach to innovation by soliciting feedback from distributors, dealers, contractors, builders, architects and consumers in order to develop products that appropriately address their unmet needs. These efforts are supported by our in-house R&D process led by a dedicated staff committed to innovation and continuous improvement of our products. As a result of this strategy, we have developed a robust new product pipeline, which includes new trim, deck, rail, moulding and porch applications, and we are currently developing potential products in the siding
6
category. However, we will need to conduct testing of these products prior to any market introduction. Products that we have developed within the last two years represented 15.3% of our sales for the year ended December 31, 2010, and we believe this trend will continue to grow going forward. We believe that our downstream-focused approach allows us to anticipate market trends and needs, thereby creating additional conversion opportunities, expanding the size of our addressable market, enhancing our overall growth opportunities, and further differentiating us from our competition.
Expand and enhance awareness of our premium brands. The strength of our flagship brands is driven by our reputation for quality and innovation. We developed our strong brand identity by consistently offering a high quality product and by focusing on achieving a high level of customer satisfaction. We intend to continue to invest in our branding efforts through product literature, print, TV and radio advertising, tradeshows, internet marketing and social media initiatives, and sales training. We have also successfully extended our brand through strategic product acquisitions such as Procell (now AZEK Deck) and Composatron (now AZEK Rail) and believe this will continue to be an opportunity in the future. Our continued success is dependent on the strength of our AZEK brand and the performance of our AZEK products, which represent a significant portion of our net sales. We believe that the successful execution of our brand strategy will allow us to accelerate our conversion rate, increase market penetration and enter new end-markets.
Continue to expand our distribution network and sales force. We distribute our products through an extensive and growing multi-channel national distribution network. Since 2001, we have increased the number of AZEK stocking dealers and retail outlets from 150 to over 2,800, including a recent introduction and expansion of our big-box retail presence. While we have significantly expanded our distribution network over the past several years, there still remain sizeable geographic and market expansion opportunities going forward in all of our operating segments. For example, according to L.E.K., the use of low maintenance deck products, of which cellular PVC is the largest category, as a percentage of total deck purchases is expected to increase from approximately 11% in 2010 to 20% in 2015 based on sales. We have also realigned our sales force to enhance geographic and channel coverage and to increase downstream pull-through demand. By continuing to expand our distribution network and to invest in our sales force infrastructure, we seek to accelerate the penetration of our products and expand the size of our addressable markets.
Leverage and enhance our operational and technical capabilities. Our strong extrusion, materials science and overall technical capabilities provide an excellent opportunity to drive innovation and further expand our markets. We believe our process-driven and disciplined operational approach and focus on continuous improvement enables us to continue to innovate, improve product quality and further reduce costs. Through our scalable operating model, we plan to continue making investments that will enhance our extrusion and materials formulation expertise with a view to maintaining our market leading positions, stimulating growth and enhancing our overall financial profile.
Investing in our common stock involves a high degree of risk. You should consider carefully all of the information in this prospectus prior to investing in our common stock. The risks associated with our business include, among other things:
- •
- Our business could be materially and adversely affected by volatility and disruption to the economy;
- •
- Our financial performance is dependent on raw material prices, as well as the continued availability of raw materials;
- •
- Our continued success is dependent on the performance of our AZEK products, which represent a significant portion of our net sales;
7
- •
- We face competition in each of our businesses and our customers may not continue to purchase our products;
- •
- If we fail to successfully develop new and improved products, our business may be materially and adversely affected;
- •
- Our sales, cash flows from operations and results of operations may decrease if our relations with our key distributors
decline;
- •
- If we are unable to meet future capital requirements, our business may be adversely affected;
- •
- Our substantial indebtedness could adversely affect our financial condition;
- •
- Our credit agreements impose significant operating and financial restrictions, which may prevent us from capitalizing on
business opportunities and taking some actions; and
- •
- Because AEA Investors controls a significant percentage of our common stock, it may control all major corporate decisions and its interests may conflict with the interests of other holders of our common stock.
See "Risk Factors" for a description of these and other risks of investing in our common stock.
Our History and Corporate Information
With a focus on manufacturing excellence and quality over the past 27 years, we have been first to market with a number of low maintenance, premium branded synthetic building products that offer compelling value propositions. Our transition from a plastic sheet manufacturer to an advanced materials and solutions provider began in 1990, when we saw an opportunity to extend further into the value chain by targeting the bathroom partition market. In 1999, we entered the residential building products market with our Trimtec cellular PVC trim product that subsequently was rebranded to AZEK Trim in 2001. Since May 2005, AEA Investors LP and certain of its affiliates, or AEA Investors, have owned a majority interest in our company. Since that time, we have continued to innovate and expand our product offering and have continued to enhance our brands through selected strategic acquisitions, including:
- •
- Santana Products (April 2006): We combined Santana Products with our
existing partition business to form the basis of what is now our Hiny Hiders® plastic bathroom partition product line.
- •
- Procell Decking Systems (January 2007): The integration and rebranding of
Procell Decking Systems, or Procell, into our AZEK Deck brand and our extensive distribution network has been critical to our recent success in the deck market. We not only successfully integrated the
acquisition, but also leveraged AZEK's existing brand equity to bolster Procell's product profile and significantly increase its sales. We have also utilized our product development strength to
improve the color and aesthetics of the products.
- •
- Composatron (February 2008): Compos-A-Tron Manufacturing Inc., or Composatron, was a manufacturer of composite railing systems for the residential housing market, which we rebranded as AZEK Rail. In integrating the acquisition, we leveraged AZEK's existing brand equity to bolster the product profile and utilized our product development strength to improve the color and aesthetics of the railing systems and simplify the installation process.
CPG International Inc. is a Delaware corporation. Our principal executive offices are located at 888 North Keyser Avenue, Scranton, Pennsylvania 18504. Our telephone number is (570) 558-8000 and our website can be found at www.cpgint.com. Information on our website is not deemed to be a part of this prospectus. For charts illustrating our organizational structure both prior to and after giving effect to this offering, see "—Organizational Structure."
8
AEA Investors is one of the most experienced global private investment firms. Founded in 1968, AEA Investors currently manages over $4.2 billion of capital for an investor group that includes former and current CEOs of major multinational corporations, family groups, endowment funds and institutions from around the world. With a staff of more than 60 investment professionals and offices in New York, Stamford, London, Munich, Hong Kong and Shanghai, AEA Investors focuses on investing in companies in the industrial products, specialty chemicals, consumer products and services sectors. AEA Investors has particular expertise in the building products sector. In addition to CPG International, AEA Investors' current building products investments include Henry Company and SRS Roofing Supply. Past building products investments include Dal-Tile International, OSI Sealants (through the investment in Sovereign Specialty Chemicals) and TempRite (through the investment in Noveon).
9
Common stock offered by us |
shares. |
|
Common stock offered by the selling stockholder |
shares. |
|
Total offering |
shares. |
|
Common stock to be outstanding after this offering |
shares. |
|
Overallotment option |
The underwriters have an option to purchase a maximum of additional shares of common stock from us and the selling stockholder to cover overallotments. The underwriters can exercise this option at any time within 30 days from the date of this prospectus. |
|
Use of proceeds |
We estimate that the net proceeds to us from this offering, after deducting underwriting discounts and estimated offering expenses, will be approximately $ million, assuming the shares are offered at $ (the midpoint of the offering price range set forth on the front cover of this prospectus). We intend to use the net proceeds from shares that we sell to repay $ million of the outstanding principal amount of our indebtedness under and for general corporate purposes. We will not receive any proceeds from the sale of shares by the selling stockholder. Certain members of our management and board of directors as well as entities affiliated with AEA Investors, our sponsor, have an equity interest in the selling stockholder. See "Use of Proceeds." |
|
Dividend policy |
We do not intend to pay any dividends on our common stock in the foreseeable future. See "Dividend Policy." |
|
Proposed New York Stock Exchange symbol |
"AZEK." |
|
Risk factors |
Investing in our common stock involves a high degree of risk. See "Risk Factors" beginning on page 19 of this prospectus for a discussion of factors you should carefully consider before investing in our common stock. |
Unless otherwise indicated, the information in this prospectus:
- •
- assumes no exercise of the overallotment option by the underwriters;
- •
- assumes an initial public offering price of $ per share, the midpoint of the offering price range set forth
on the front cover of this prospectus; and
- •
- gives effect to our amended and restated certificate of incorporation and our amended and restated bylaws, which will be in effect prior to the consummation of this offering.
Prior to the effectiveness of the registration statement of which this prospectus forms a part, the number of authorized shares of our common stock will be increased to shares, and each share of common stock then outstanding will be split into shares of common stock by way of a stock split. Unless we specifically state otherwise, the share information in this prospectus reflects the
10
increase in the authorized number of shares of our common stock and the stock split. Following the completion of this offering (and following any exercise of the overallotment option by the underwriters or the expiration of such option), Holdings, the owner of 100% of our common stock prior to this offering, intends to distribute to all of the holders of its class A limited partnership interest units, or Class A Units, and class B limited partnership interest units, or Class B Units, in accordance with and as contemplated by the limited partnership agreement of Holdings (i) the cash proceeds it receives from this offering, less expenses and amounts used to repay outstanding indebtedness of Holdings, and (ii) all remaining shares of our common stock that it holds at such time. After that distribution, Holdings will be dissolved, and former holders of the Class A Units and the Class B Units will then directly hold shares of our common stock. We refer to the foregoing distribution by Holdings and subsequent dissolution of Holdings as the "Distribution."
11
The chart below summarizes our ownership and organizational structure as of the date of this prospectus, prior to giving effect to this offering.
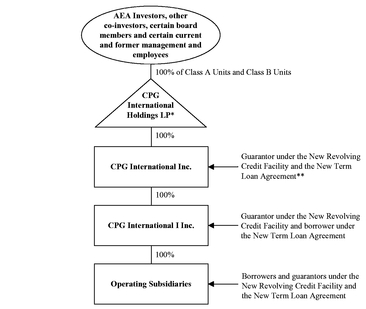
- *
- The general partner of CPG International Holdings LP is CPG Holding I LLC, which is an affiliate of AEA
Investors.
- **
- On February 18, 2011, we entered into a new secured revolving credit facility, which we refer to as the "New Revolving Credit Facility," and a new senior secured term loan agreement, which we refer to as the "New Term Loan Agreement." See "Description of Certain Indebtedness."
The chart below summarizes our ownership and organizational structure after giving effect to this offering, the stock split and the Distribution.
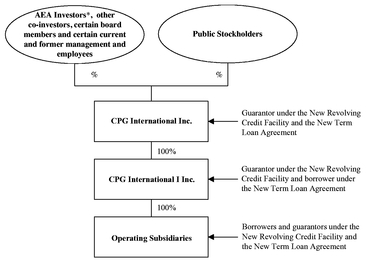
- *
- Upon completion of this offering, the stock split and the Distribution, AEA Investors will beneficially own approximately % of the voting power of our outstanding common stock. Through this beneficial ownership and a stockholders agreement, which provides voting control over additional shares of our common stock, AEA Investors will control approximately % of the voting power of our outstanding common stock.
12
The summary financial data presented below as of and for the years ended December 31, 2010, 2009 and 2008 have been derived from our audited consolidated financial statements. The audited consolidated financial statements as of December 31, 2010 and 2009 and for the years ended December 31, 2010, 2009 and 2008 are included elsewhere in this prospectus. The summary financial data presented below as of March 31, 2011 and for the three months ended March 31, 2011 and 2010 have been derived from our unaudited condensed consolidated financial statements, which are included elsewhere in this prospectus and have been prepared on the same basis as the audited consolidated financial statements included elsewhere herein. In our opinion, the interim data reflect all adjustments, consisting only of normal and recurring adjustments, necessary for a fair presentation of results for these periods. The operating results for any interim period are not necessarily indicative of the results that may be expected for any other interim period or for a full year.
You should read this data in conjunction with "Management's Discussion and Analysis of Financial Condition and Results of Operations" and our consolidated financial statements and the related notes included elsewhere in this prospectus.
| |
Three Months Ended March 31, |
Year Ended December 31, | |||||||||||||||
|---|---|---|---|---|---|---|---|---|---|---|---|---|---|---|---|---|---|
| (Dollars in thousands) |
2011 | 2010 | 2010 | 2009 | 2008 | ||||||||||||
| |
(unaudited) |
|
|
|
|||||||||||||
Statement of Operations Data: |
|||||||||||||||||
Net sales |
$ | 114,622 | $ | 94,667 | $ | 327,535 | $ | 266,875 | $ | 305,240 | |||||||
Cost of sales |
(81,276 | ) | (65,098 | ) | (226,670 | ) | (173,328 | ) | (235,099 | ) | |||||||
Gross profit |
33,346 | 29,569 | 100,865 | 93,547 | 70,141 | ||||||||||||
Selling, general and administrative expenses |
(15,529 | ) | (14,395 | ) | (56,489 | ) | (57,392 | ) | (50,644 | ) | |||||||
Lease termination expense |
— | — | — | (657 | ) | — | |||||||||||
(Loss) gain on sale of property |
(12 | ) | — | (336 | ) | (525 | ) | 21 | |||||||||
Impairment of goodwill and long-lived assets |
— | (599 | ) | (599 | ) | (14,408 | ) | (40,000 | ) | ||||||||
Operating income (loss) |
17,805 | 14,575 | 43,441 | 20,565 | (20,482 | ) | |||||||||||
Loss on debt extinguishment |
(7,339 | ) | — | — | — | — | |||||||||||
Interest expense, net |
(6,682 | ) | (7,471 | ) | (30,854 | ) | (31,347 | ) | (34,905 | ) | |||||||
Foreign currency gain (loss) |
14 | 78 | 92 | 336 | (215 | ) | |||||||||||
Miscellaneous, net |
— | 7 | 243 | 29 | 153 | ||||||||||||
Income (loss) before income taxes |
3,798 | 7,189 | 12,922 | (10,417 | ) | (55,449 | ) | ||||||||||
Income tax benefit (expense) |
734 | (3,998 | ) | (3,569 | ) | 111 | 7,095 | ||||||||||
Net income (loss) |
$ | 4,532 | $ | 3,191 | $ | 9,353 | $ | (10,306 | ) | $ | (48,354 | ) | |||||
Weighted average shares outstanding (basic and diluted)(1) |
10 | 10 | 10 | 10 | 10 | ||||||||||||
Net income (loss) per share (basic and diluted)(1) |
$ | 453 | $ | 319 | $ | 935.3 | $ | (1,030.6 | ) | $ | (4,835.4 | ) | |||||
13
| |
Three Months Ended March 31, |
Year Ended December 31, | |||||||||||||||
|---|---|---|---|---|---|---|---|---|---|---|---|---|---|---|---|---|---|
| (Dollars in thousands) |
2011 | 2010 | 2010 | 2009 | 2008 | ||||||||||||
| |
(unaudited) |
|
|
|
|||||||||||||
Pro Forma Statement of Operations Data: |
|||||||||||||||||
Pro forma interest expense, net(2) |
$ | $ | |||||||||||||||
Pro forma net income(2) |
$ | $ | |||||||||||||||
Pro forma weighted average shares outstanding(3) |
|||||||||||||||||
Basic |
|||||||||||||||||
Diluted |
|||||||||||||||||
Pro forma net income per share(2)(3) |
|||||||||||||||||
Basic |
$ | $ | |||||||||||||||
Diluted |
$ | $ | |||||||||||||||
Other Financial Data: |
|||||||||||||||||
Capital expenditures |
$ | 5,568 | $ | 3,490 | $ | 15,346 | $ | 6,258 | $ | 6,282 | |||||||
Adjusted EBITDA(4) |
$ | 24,584 | $ | 21,277 | $ | 67,519 | $ | 60,873 | $ | 46,339 | |||||||
Adjusted EBITDA margin(4) |
21.4 | % | 22.5 | % | 20.6 | % | 22.8 | % | 15.2 | % | |||||||
Statement of Cash Flows Data: |
|||||||||||||||||
Net cash (used in) provided by operating activities |
$ | (46,044 | ) | $ | (31,151 | ) | $ | 26,976 | $ | 37,441 | $ | 36,315 | |||||
Net cash used in investing activities |
$ | (5,568 | ) | $ | (3,490 | ) | $ | (15,346 | ) | $ | (7,179 | ) | $ | (47,887 | ) | ||
Net cash provided by (used in) financing activities |
$ | 14,862 | $ | 8,491 | $ | (7,097 | ) | $ | (8,602 | ) | $ | 24,123 | |||||
Balance Sheet Data (at end of period): |
|||||||||||||||||
Cash and cash equivalents |
$ | 12,339 | $ | 49,072 | $ | 44,501 | $ | 22,586 | |||||||||
Total assets |
$ | 574,611 | $ | 553,084 | $ | 539,404 | $ | 538,905 | |||||||||
Total debt(5) |
$ | 325,518 | $ | 305,578 | $ | 307,355 | $ | 314,253 | |||||||||
Total shareholder's equity |
$ | 148,442 | $ | 143,403 | $ | 138,009 | $ | 146,926 | |||||||||
- (1)
- Does
not give effect to the -for-one stock split which will occur prior to the effectiveness of the registration
statement of which this prospectus forms a part.
- (2)
- As
adjusted to give effect to the following transactions as if they had occurred as of the beginning of the period presented: (i) the payment in
full, and termination of, our old revolving credit facility, dated as of February 13, 2008, which we refer to as the "Old Revolving Credit Facility," and our old term loan agreement, dated as
of February 29, 2008, which we refer to as the "Old Term Loan Agreement," (ii) the repurchase and redemption in full of our Senior Floating Rate Notes due 2012, which we refer to as the
"Floating Rate Notes," and our 101/2% Senior Notes due 2013, which we refer to as the "Fixed Rate Notes" (we refer to the Floating Rate Notes and the Fixed Rate Notes collectively as
the "Old Notes"), (iii) the incurrence of $285.0 million of indebtedness under the New Term Loan Agreement, (iv) the incurrence of $40.0 million of indebtedness under the
New Revolving Credit Facility, (v) this offering, (vi) the repayment of $ million of the outstanding principal amount of our indebtedness
under from
the proceeds of this offering and (vii) each of the related adjustments mentioned below.
- Adjustments to net income for the three months ended March 31, 2011 reflect (i) a $ million decrease in interest expense (see the reconciliation of historical interest expense to pro forma interest expense below), (ii) a $ million increase in income tax expense due to higher income before taxes relating to our pro forma net income and (iii) the removal of $ million of AEA Investors management fees. Adjustments to net income for the year
14
ended December 31, 2010 reflect (i) a $ million decrease in interest expense (see the reconciliation of historical interest expense to pro forma interest expense below), (ii) a $ million increase in income tax expense due to higher income before taxes relating to our pro forma net income and (iii) the removal of $ million of AEA Investors management fees. Pro forma net income for the three months ended March 31, 2011 and the year ended December 31, 2010 does not give effect to the payment of management termination fees to AEA Investors of $ .
- The following is a reconciliation of historical net income to pro forma net income for the three months ended March 31, 2011 and the year ended December 31, 2010:
| (Dollars in thousands) |
Three Months Ended March 31, 2011 |
Year Ended December 31, 2010 |
|||||
|---|---|---|---|---|---|---|---|
Net income |
$ | 4,532 | $ | 9,353 | |||
Decrease in interest expense, net(a) |
|||||||
Increase in income tax expense(b) |
|||||||
Removal of management fee(c) |
|||||||
Pro forma net income |
$ | $ | |||||
- (a)
- See
the reconciliation of historical interest expense to pro forma interest expense below.
- (b)
- Reflects
an increase of $ million and $ in income tax expense for the three months ended March 31, 2011
and the
year ended December 31, 2010, respectively, for the related tax effects of the pro forma adjustments. The tax impact is based upon an increase of pro forma income before taxes of
$ million and $ million, respectively, and a statutory tax rate
of %.
- (c)
- Reflects the removal of $ million and $ million of AEA Investors management fees for the three months ended March 31, 2011 and the year ended December 31, 2010, respectively.
- The following is a reconciliation of historical interest expense to pro forma interest expense for the three months ended March 31, 2011 and the year ended December 31, 2010:
| (Dollars in thousands) |
Three Months Ended March 31, 2011 |
Year Ended December 31, 2010 |
|||||
|---|---|---|---|---|---|---|---|
Interest expense, net(a) |
$ | 6,682 | $ | 30,854 | |||
Decrease resulting from refinancing transactions effected prior to this offering(b) |
|||||||
Decrease resulting from use of proceeds of this offering(c) |
|||||||
Pro forma interest expense, net |
$ | $ | |||||
- (a)
- Includes
the amortization of approximately $0.5 million and $2.2 million of deferred financing costs classified as interest expense for the
three months ended March 31, 2011 and the year ended December 31, 2010, respectively.
- (b)
- Reflects (i) the payment in full, and termination of, the Old Term Loan Agreement and the Old Revolving Credit Facility, (ii) the repurchase and redemption in full of the Old Notes, (iii) the incurrence of $285.0 million of indebtedness under the New Term Loan Agreement and (iv) the incurrence of $40.0 million of indebtedness under the New Revolving Credit Facility, in each case, as if it had occurred as of the beginning of the period presented. The
15
calculated reductions in interest expense are based upon the assumed reduction in our average cost of debt by percentage points throughout the periods presented, as well as the assumed reduction in our total indebtedness of $ million as a result of these transactions. The New Term Loan Agreement and the New Revolving Credit Facility have variable interest rates based on (i) the base rate (prime rate) plus a spread, or (ii) adjusted LIBOR plus a spread or (iii) a combination thereof. Each 0.125 percentage points change in the assumed interest rate used in the calculation of pro forma interest expense would change our interest expense on the indebtedness under the New Term Loan Agreement and the New Revolving Credit Facility by $0.4 million for the year ended December 31, 2010 and by $0.1 million for the quarter ended March 31, 2011.
- (c)
- Assumes repayment of $ million of the outstanding principal amount of our indebtedness under , which bears interest at a rate of % per annum, from the proceeds of this offering, as if it had occurred as of the beginning of the period presented.
- (3)
- Gives
effect to (i) the -for-one stock split which will occur prior to the effectiveness of the registration
statement of which this prospectus forms a part and (ii) the shares of our common stock to be issued by us in this offering. Pro forma basic net income per share consists of pro forma
net income divided by the pro forma basic weighted average common shares outstanding. Pro forma diluted net income per share consists of pro forma net income divided by the pro forma diluted weighted
average common shares outstanding.
- (4)
- We
present Adjusted EBITDA because we believe it assists investors and analysts in comparing our operating performance across reporting periods on a
consistent basis by excluding items that we do not believe are indicative of our core operating performance. In addition, we utilize Adjusted EBITDA in the calculation of financial covenants under our
New Revolving Credit Facility and our New Term Loan Agreement, as well as in the determination of compensation for members of our senior management team. "Adjusted EBITDA," which is defined as
"Consolidated EBITDA" under our credit agreements, represents net income (loss) before interest expense, income tax expense and depreciation and amortization, or EBITDA, as further adjusted to exclude
certain other items as set forth in the reconciliation presented below. "Adjusted EBITDA margin" is our Adjusted EBITDA as a representative percentage of net sales, and we believe our Adjusted EBITDA
margin is useful in measuring our profitability. You are encouraged to evaluate each adjustment and whether you consider each to be appropriate. In addition, in evaluating Adjusted EBITDA, you should
be aware that in the future, we may incur expenses similar to the adjustments in the presentation of Adjusted EBITDA. Our presentation of Adjusted EBITDA should not be construed as an inference that
our future results will be unaffected by unusual or non-recurring items.
- Adjusted
EBITDA and Adjusted EBITDA margin are not recognized financial measures under generally accepted accounting principles in the United
States, or GAAP, and may not be comparable to similarly titled measures used by other companies in our industry or across different industries. Adjusted EBITDA and, as a result, Adjusted EBITDA
margin, have limitations as analytical tools and you should not consider them in isolation, or as a substitute for analysis of our results as reported under GAAP. Some of these limitations
include:
- •
- Adjusted EBITDA does not reflect our cash expenditures, or future requirements, for capital expenditures or contractual
commitments;
- •
- Adjusted EBITDA does not reflect changes in, or cash requirements for, our working capital needs;
16
- •
- Adjusted EBITDA does not reflect the significant interest expense, or the cash requirements necessary to service interest
or principal payments, on our outstanding debt;
- •
- Adjusted EBITDA does not reflect depreciation and amortization, which are non-cash charges, although the
assets being depreciated and amortized will likely have to be replaced in the future, nor does Adjusted EBITDA reflect any cash requirements for such replacements;
- •
- non-cash compensation is and will remain a key element of our overall long-term incentive
compensation package, although we exclude it as an expense when evaluating our ongoing operating performance for a particular period; and
- •
- Adjusted EBITDA does not reflect the impact of certain cash charges resulting from matters we consider not to be
indicative of our ongoing operations.
- We
compensate for these limitations by relying primarily on our GAAP results and using Adjusted EBITDA only as supplemental information.
- The following is a reconciliation of our net income (loss) to Adjusted EBITDA and a calculation of Adjusted EBITDA margin:
| |
Three Months Ended March 31, |
Year Ended December 31, | ||||||||||||||
|---|---|---|---|---|---|---|---|---|---|---|---|---|---|---|---|---|
| (Dollars in thousands) |
2011 | 2010 | 2010 | 2009 | 2008 | |||||||||||
| |
(unaudited) |
|
|
|
||||||||||||
Net income (loss)(a) |
$ | 4,532 | $ | 3,191 | $ | 9,353 | $ | (10,306 | ) | $ | (48,354 | ) | ||||
Interest expense, net(a) |
6,682 | 7,471 | 30,854 | 31,347 | 34,905 | |||||||||||
Income tax (benefit) expense |
(734 | ) | 3,998 | 3,569 | (111 | ) | (7,095 | ) | ||||||||
Depreciation and amortization |
5,403 | 5,509 | 21,339 | 21,604 | 21,491 | |||||||||||
EBITDA |
15,883 | 20,169 | 65,115 | 42,534 | 947 | |||||||||||
Impairment of goodwill and long-lived assets(b) |
— | 599 | 599 | 14,408 | 40,000 | |||||||||||
Disposal of fixed assets(c) |
12 | 11 | 336 | 525 | — | |||||||||||
Relocation and severance costs(d) |
169 | 62 | 63 | 886 | 973 | |||||||||||
Facility charges(e) |
— | 18 | 19 | 657 | 26 | |||||||||||
Management fee and expenses(f) |
383 | 391 | 1,561 | 1,740 | 1,855 | |||||||||||
Fees associated with debt extinguishment(g) |
7,886 | — | — | — | — | |||||||||||
Fees related to market study(h) |
306 | — | — | — | — | |||||||||||
Registration expenses related to Old Notes(i) |
(64 | ) | 13 | 38 | 26 | 309 | ||||||||||
Non-cash compensation charge(j) |
9 | 14 | 36 | 97 | 118 | |||||||||||
Acquisition-related items(k) |
— | — | (248 | ) | — | 2,111 | ||||||||||
Adjusted EBITDA |
$ | 24,584 | $ | 21,277 | $ | 67,519 | $ | 60,873 | $ | 46,339 | ||||||
Net sales |
$ | 114,622 | $ | 94,667 | $ | 327,535 | $ | 266,875 | $ | 305,240 | ||||||
Adjusted EBITDA margin |
21.4 | % | 22.5 | % | 20.6 | % | 22.8 | % | 15.2 | % | ||||||
- (a)
- Net income (loss) and interest expense each includes the amortization of deferred financing costs classified as interest expense in the amount of approximately $0.5 million for each of the three month periods ended March 31, 2011 and 2010 and approximately $2.2 million, $2.3 million and $2.1 million for each of the years ended December 31, 2010, 2009 and 2008, respectively.
17
- (b)
- For
the three months ended March 31, 2010 and the year ended December 31, 2010, this represents the write-down of manufacturing
equipment related to the consolidation of our two Canadian manufacturing facilities into one facility. For the year ended December 31, 2009, this represents the write-down of our
goodwill related to the completion of our impairment analysis for 2008 during the first quarter of 2009. For the year ended December 31, 2008, this represents the write-down of our
goodwill and trademarks.
- (c)
- Represents
the disposal of various fixed assets.
- (d)
- For
the three months ended March 31, 2011, this represents $0.2 million of severance costs. For the three months ended March 31, 2010,
this represents $13,000 of severance costs and $49,000 of relocation costs for members of our management team. For the year ended December 31, 2010, this represents $42,000 of severance costs
and $20,000 of relocation costs for members of our management team. For the year ended December 31, 2009, this represents $0.3 million of severance costs attributable to our former AZEK
president and $0.5 million of costs related to relocation for members of our management team. For the year ended December 31, 2008, $0.8 million represents relocation related to
the hiring of members of our management team.
- (e)
- For
the three months ended March 31, 2010 and the year ended December 31, 2010, this represents expenses related to the consolidation of our
two Canadian manufacturing facilities into one facility. For the year ended December 31, 2009, this represents termination costs of $0.2 million related to the consolidation of our
administrative offices into one of our manufacturing facilities in Pennsylvania and $0.4 million related to the consolidation of our two Canadian manufacturing facilities into one facility. For
the year ended December 31, 2008, this represents the $26,000 settlement expense related to the closing costs of the sale of the Winfield Avenue facility.
- (f)
- Represents
the AEA Investors management fee and expenses that were charged during the periods presented. Upon consummation of this offering, the AEA
Investors management fee is expected to be terminated and we will be required to pay management termination fees of $ . See "Certain Relationships and Related Party Transactions."
- (g)
- For
the three months ended March 31, 2011, this represents $7.4 million of debt refinancing fees associated with the loss on debt
extinguishment and $0.5 million of third party fees associated with the debt refinancing.
- (h)
- For
the three months ended March 31, 2011, this represents costs of $0.3 million related to a market study completed in preparation of this
offering.
- (i)
- Represents
financing charges related to the market making registration statement for the Old Notes.
- (j)
- Represents
non-cash compensation charges related to our Class B Unit Equity Program.
- (k)
- For the year ended December 31, 2010, this represents a settlement related to the share purchase agreement for the acquisition of Composatron, which we acquired on February 29, 2008. For the year ended December 31, 2008, this represents (i) $0.6 million of integration costs from the Composatron acquisition and (ii) $1.5 million of a non-cash fair value adjustment to increase inventory to its estimated selling price at February 29, 2008, in connection with the Composatron acquisition, which increase was then recognized as an increase to cost of sales during the period from March 1, 2008 to December 31, 2008 as the related inventory was sold.
- (5)
- Includes capital lease obligations.
18
Investing in our common stock involves a high degree of risk. You should carefully consider the risk factors set forth below as well as the other information contained in this prospectus, including "Management's Discussion and Analysis of Financial Condition and Results of Operations" and our consolidated financial statements and related notes, before deciding to buy shares of our common stock. Any of the following risks could materially adversely affect our business, financial condition, results of operations or cash flows. In such case, the market price of our common stock could decline, and you may lose all or part of your investment in our common stock. Information contained in this section may be considered "forward-looking statements." See "Cautionary Note Regarding Forward-Looking Statements" for a discussion of certain qualifications regarding such statements.
Our business could be materially and adversely affected by volatility and disruption to the economy.
Our business is affected by a number of economic factors, including the level of economic activity in the markets in which we operate. The demand for our products by our customers depends, in part, on general economic conditions and business confidence levels. The capital and credit markets have in recent times been experiencing significant volatility and disruption. These conditions, combined with volatile oil and natural gas prices, declining business and consumer confidence and increased unemployment, precipitated an economic slowdown and severe recession in recent years. The difficult conditions in these markets and the overall economy affect our business in a number of ways. For example:
- •
- Sales in the residential, institutional and commercial construction markets correlate closely to the number of homes,
buildings and schools that are built or renovated, which in turn is influenced by factors such as interest rates, inflation, the strength or weakness of the U.S. dollar, gross domestic product levels,
consumer confidence and spending habits, demographic trends, unemployment rates, state and local government revenues and spending on schools and other macroeconomic factors over which we have no
control. Sales in our industrial OEM markets are also affected by macroeconomic factors, in particular gross domestic product levels and industrial production. Any decline in economic activity as a
result of these factors could result in a decreased demand for our products, which would materially adversely impact our sales and profitability.
- •
- In general, demand for new home construction as well as institutional and commercial construction may be materially
adversely affected by increases in interest rates or the reduced availability of financing. Although interest rates have been low during the past few years, as interest rates rise, the ability of
prospective buyers to finance purchases of new homes may be materially adversely affected. As a result, our business, financial condition and results of operations may also be materially adversely
impacted. The residential repair and remodeling market, in which we make a large portion of our sales, tends to be less sensitive to changes in interest rates. However, reduced availability of
financing or any changes in tax laws related to mortgages and home equity financings could materially adversely affect sales in the residential new construction and repair and remodeling markets. For
example, beginning in 2007, the mortgage finance market was negatively impacted by the fallout in the subprime mortgage market, reducing the amounts residential home lenders were willing to finance as
a result of tighter lending practices. This condition continues to exist in the market today.
- •
- Our bathroom partition and locker systems are sold primarily in the institutional segment, which includes universities, K-12 schools, government and municipal buildings and facilities, parks, military bases, hospitals and prisons, as well as commercial establishments, such as restaurants,
19
- •
- Dry petrochemical resin prices and the prices of other raw materials we use may continue to fluctuate as a result of
volatility in natural gas and crude oil prices and demand in the broader economy. Due to the uncertainty of oil and natural gas prices, we cannot reasonably estimate our ability to successfully
recover any price increases. See "—Our financial performance is dependent on raw material prices, as well as the continued availability of raw materials."
- •
- Market conditions could result in our key distributors experiencing financial difficulties and/or electing to limit
spending, which in turn could result in decreased sales and earnings for us. See "—Our sales, cash flows from operations and results of operations may decrease if our relations with our
key distributors decline."
- •
- Although we believe we have sufficient liquidity under the New Revolving Credit Facility, under extreme market conditions there can be no assurance that such funds will continue to be available or sufficient. In such a case, we may not be able to successfully obtain additional financing on favorable terms, or at all. If we are unable to obtain the required capital or if our costs become prohibitively high, our business would be materially adversely affected.
retailers and stadiums. The demand for these products, whether in connection with replacement orders or new construction, is impacted by the economy, and in particular gross domestic product levels. As a result of institutional budgeting, we may experience a decrease in sales up to a year or more after a decline in gross domestic product levels. Decline in demand in the institutional construction market can be attributed to increased operational costs such as pension and healthcare costs that may reduce amounts available for school construction costs. Furthermore, sales to schools and other public institutions may be impacted by budget cuts by state and local governments, including as a result of lower than anticipated tax revenues.
We cannot predict market conditions or the state of the overall economy, and difficult economic conditions may materially and adversely affect our financial results. In addition, there can be no assurance that any U.S. government actions taken for the purpose of stabilizing the financial markets will have a beneficial impact on the economy. For example, in 2009, the U.S. government provided eligible home buyers a tax credit that was extended until April 30, 2010. As a result of the home buyers' tax credit, the residential construction market improved during the first and second quarters of 2010, but experienced a decline in the third and fourth quarters of 2010, following expiration of the credits. There is no evidence that the residential construction market will improve during 2011.
Our financial performance is dependent on raw material prices, as well as the continued availability of raw materials.
The primary raw materials we use in the manufacture of our products are various petrochemical resins, primarily PVC and olefins, including HDPE and polypropylene, or PP. In addition, we utilize a variety of other additives including modifiers, titanium dioxide, or TiO2, and pigments. Our financial performance therefore is dependent to a substantial extent on the markets for these various materials.
The capacity, supply and demand for resins, additives and the petrochemical intermediates from which they are produced are subject to cyclical price fluctuations and other market disturbances, including supply shortages. Throughout the course of previous supply shortages we were able to maintain necessary raw material supplies. However, in the event of another industry-wide general shortage of resins and other additives we use, a shortage or discontinuation of certain types or grades of materials purchased from one or more of our suppliers or a supplier's declaration of force majeure, we may not be able to arrange for alternative sources of materials. Any such shortage may materially negatively impact our production process as well as our competitive position versus companies that are able to better or more cheaply source materials.
20
We purchase our raw materials directly from major petrochemical and chemical suppliers. We have long-standing relationships as well as guaranteed supply with some of these suppliers but we have no fixed-price contracts with any of our major vendors. Material purchases are made in accordance with our manufacturing specifications, and are based primarily on price and quality. Prices are negotiated on a continuous basis and we have not entered into hedges with respect to our raw material costs. We generally buy resin and other materials on an as-needed basis but have occasionally made strategic purchases of larger quantities.
Prices of our key materials may continue to fluctuate, including as a result of changes in natural gas, crude oil, ethylene, methyl methacrylate, or MMA, and TiO2 prices, among other factors. The instability in the world market for petroleum and TiO2 and in the North American ethylene, MMA and natural gas markets could materially adversely affect the prices and general availability of raw materials. Over the past several years, we have at times experienced rapidly increasing material prices primarily due to the increased cost of oil, natural gas, ethylene, MMA and TiO2. Due to the uncertainty of these prices, we cannot reasonably estimate our ability to successfully recover any price increases. Even if we are able to pass these price increases on to our customers, we may not be able to do so on a timely basis, our gross margins could decline and we may not be able to implement other price increases for our products. To the extent that increases in the cost of materials cannot be passed on to our customers, or the duration of time lags associated with a pass through becomes significant, such increases may have a material adverse effect on our profitability and cash flow. Also, increases in material prices could negatively impact our competitive position as compared to products made of other materials, such as wood and metal, that are not affected by changes in the price of our raw materials.
Additionally, we may be subject to significant increases in prices that may materially and adversely impact our financial condition. Resin prices increased in 2010, after a decline in 2009 due to lower demand in the broader economy. Based on market indices, the weighted average market cost for the types of resin that we use increased by approximately 18.2% for the year ended December 31, 2010 compared to the prior year, following a decrease by approximately 7.2% for the year ended December 31, 2009 compared to the year ended December 31, 2008.
Our continued success is dependent on the performance of our AZEK products, which represent a significant portion of our net sales.
In 2010, 2009 and 2008, AZEK products accounted for approximately 65%, 61% and 59%, respectively, of our net sales. Therefore, our future prospects are largely dependent on the continued success of our AZEK products, which have been on the market for ten years, and continued growth in the residential repair and remodeling and new construction markets. These markets were materially and adversely impacted by the recent recession and any future decline in these markets could materially and adversely affect the demand of our AZEK products. Furthermore, if we should experience any problems, real or perceived, with product quality, relative value and use as compared to competitive materials, distribution, delivery or consumer acceptance of AZEK products, our sales and profitability could materially decline. In particular, the success of AZEK depends on our customers continuing to be willing to pay more for AZEK on the basis of relative value and use as compared to wood, wood composites and other products that AZEK is intended to replace. We are also subject to the risk that third parties develop new products that compete favorably with AZEK on a price-to-value relationship.
We face competition in each of our businesses and our customers may not continue to purchase our products.
We face competition in the sale of our products. We compete with multiple companies with respect to each of our products, including divisions or subsidiaries of larger companies and foreign competitors. Our products also compete with the wood, wood composite and metal products that our low maintenance synthetic products are designed to replace. For example, AZEK Trim competes primarily
21
with wood, aluminum, engineered wood, wood composites and other synthetic building materials, such as fiber-cement and celuka-processed products. The deck market in which AZEK Deck operates is competitive with numerous competitors who manufacture wood, wood composite and synthetic deck. Metal is currently the most used material in the bathroom partition market, which is highly fragmented and consists of manufacturers typically producing partitions in several different materials and price ranges. With respect to Vycom's basic non-fabricated products, the market is highly fragmented, with manufacturers generally focused on a few core materials, including dry petrochemical resins and other key materials, that are sold through distributors into end-market applications. Our competitors for other non-fabricated products include global, national and regional manufacturers.
We compete on the basis of a number of considerations, including product characteristics, brand recognition and loyalty, marketing, product development, sales and distribution, price (on a price-to-value basis), service, quality, performance and ability to supply products to customers in a timely manner. Increases in our prices as compared to those of our competitors could materially adversely affect us. In particular, many of the products that we compete with on a price-to-value basis, such as wood and metal products, are not affected by the fluctuating cost of resin.
The competition we face involves the following key risks:
- •
- loss of market share;
- •
- failure to anticipate and respond to changing consumer preferences and demographics;
- •
- failure to develop new and improved products;
- •
- failure of consumers to accept our brands and exhibit brand loyalty and pay premium prices on the basis of relative value
and use as compared to competitive materials;
- •
- aggressive pricing by competitors, which may force us to decrease prices or increase marketing and promotional spending in
order to maintain market share; and
- •
- failure of our marketing and promotional spending to increase, or even maintain, sales volume and market share.
Our ability to grow will depend largely on our success in converting the current demand for wood and wood composites in trim, deck and rail applications into a demand for our AZEK products. To increase our market share, we must overcome the consumer lack of awareness of the value of non-wood trim, deck and rail alternatives in general and AZEK brand products in particular; the resistance of many consumers and contractors to change from well-established wood products; the greater initial expense of AZEK trim, deck and rail compared to wood and wood composites; the established relationships existing between suppliers of wood and wood composite trim, deck and rail products and contractors and homebuilders; and the competition from other manufacturers that offer alternatives to wood and wood composite products.
Certain of our competitors have financial and other resources that are greater than ours and may be better able to withstand price competition. In addition, consolidation by industry participants could result in competitors with increased market share, larger customer bases, greater diversified product offerings and greater technological and marketing expertise, which would allow them to compete more effectively against us. Moreover, our competitors may develop products that are superior to our products or may adapt more quickly to new technologies or evolving customer requirements. Technological advances by our competitors may lead to new manufacturing techniques and make it more difficult for us to compete. In addition, because we do not have long-term arrangements with many of our customers, these competitive factors could cause our customers to cease purchasing our products.
22
If we fail to successfully develop new and improved products, our business may be materially and adversely affected.
For the year ended December 31, 2010, our new products introduced in the last two years represented 15.3% of our total sales. Our continued success depends on our ability to continue to innovate, manufacture and introduce new and improved products in our existing product lines and in new product categories. We may not be successful in developing new products, or new products we develop may fail to be profitable. For example, while we are currently developing potential products in the siding category, we will need to complete rigorous testing of these products prior to any market introduction. There can be no assurance that we will successfully complete the development and testing of these potential products. In addition, even if we do introduce these products in the market, there can be no assurance that consumers will choose these products over existing products or competing new introductions.
Some of our products experience seasonality.
We typically experience moderately increased sales of our AZEK products in the first quarter of the year during which we conduct an "early buy" sales program, which encourages dealers to stock our AZEK products through the use of incentive discounts. We also have experienced decreased sales during the fourth quarter due to adverse weather conditions in certain markets during the winter season. Although our AZEK products can be installed year-round, unusually adverse weather conditions can negatively impact the timing of the sales of certain of our products, causing reduced profitability when such conditions exist. In addition, we have experienced increased sales of our synthetic bathroom partition products during the summer months during which schools are typically closed and therefore more likely to be undergoing remodeling activities.
If we are unable to meet future capital requirements, our business may be adversely affected.
We have made significant capital expenditures in our businesses in recent years to expand our facilities, increase our capacity and enhance our production processes. We spent approximately $15.3 million, $6.3 million and $6.3 million in capital expenditures in fiscal years 2010, 2009 and 2008, respectively. We estimate that capital expenditures for 2011 will be $16 million to $21 million. As we grow our businesses, we may have to incur additional capital expenditures, including for the expansion of our existing facilities or for new facilities. We cannot assure you that we will have, or be able to obtain, adequate funds to make all necessary capital expenditures when required, or that the amount of future capital expenditures will not be materially in excess of our anticipated or current expenditures. If we are unable to make necessary capital expenditures, our product offerings may become dated, our productivity may decrease and the quality of our products may be adversely affected, which, in turn, could reduce our sales and profitability. In addition, even if we are able to invest sufficient resources, these investments may not generate net sales that exceed our expenses, generate any net sales at all or result in any commercially acceptable products.
We may incur goodwill impairment charges that adversely affect our operating results.
We review our goodwill and other intangibles not subject to amortization for impairment annually, or when events or circumstances indicate that it is more likely than not that the fair value of a reporting unit could be lower than its carrying value. Changes in economic or operating conditions impacting our estimates and assumptions could result in the impairment of our goodwill or long-lived assets. In the event that we determine our goodwill or long-lived assets are impaired, we may be required to record a significant charge to earnings in our financial statements that could have a material adverse effect on our results of operations. As of December 31, 2008, we determined that it was more likely than not that the fair value of each of our reporting units was below their respective carrying amounts. As of the time we filed our annual report in 2008, we had not completed the analysis
23
required under the Financial Accounting Standards Board Accounting Standards Codification, or FASB ASC, 350 due to the complexities involved in determining the fair value of the assets and liabilities of each reporting unit. However, based on the work performed to date and the continued depressed market conditions at the time, we had concluded that an impairment loss was probable and could be reasonably estimated. Accordingly, we recorded a non-cash goodwill impairment charge of $36.0 million for the year ended December 31, 2008, representing our best estimate of the impairment charge at that time. In addition, we recorded a non-cash trademark impairment charge of $4.0 million for the year ended December 31, 2008. We finalized the goodwill impairment analysis during the first quarter of 2009, at which time an additional non-cash goodwill impairment charge of $14.4 million was required, which we recorded in our condensed consolidated financial statements for the quarter ended March 31, 2009. The additional impairment was not a result of further deterioration of the business, but the completion of the required analysis. See "Management's Discussion and Analysis of Financial Condition and Results of Operations—Critical Accounting Policies—Goodwill, Long-Lived Assets and Other Intangible Assets." We continue to evaluate goodwill annually or if events or circumstances indicate that an impairment loss may have been incurred. Although we concluded that there was no impairment for the years ended December 31, 2010 and 2009, other impairment charges in the future may have a material adverse effect on our financial condition and results of operations.
Our business is subject to risks associated with manufacturing processes.
We internally manufacture our own products at our production facilities. We produce all of our products in our manufacturing facilities in the Scranton, Pennsylvania area, with the exception of our AZEK Rail products, which are manufactured at our production facility in Toronto, Canada. In addition, the majority of our AZEK Deck products are manufactured at our production facility in Foley, Alabama. While we maintain insurance covering our manufacturing and production facilities, including business interruption insurance, a catastrophic loss of the use of all or a portion of our facilities due to accident, fire, explosion, labor issues, weather conditions, other natural disaster or otherwise, whether short or long-term, could have a material adverse effect on us.
Unexpected failures of our equipment and machinery may result in production delays, revenue loss and significant repair costs, as well as injuries to our employees. Any interruption in production capability may require us to make large capital expenditures to remedy the situation, which could have a negative impact on our profitability and cash flows. Our business interruption insurance may not be sufficient to offset the lost revenues or increased costs that we may experience during a disruption of our operations. Moreover, there are a limited number of manufacturers that make the machines we use in our business. Because we supply our products to OEMs, a temporary or long-term business disruption could result in a permanent loss of customers that will seek out alternate suppliers. If this were to occur, our future sales levels, and therefore our profitability, could be materially adversely affected.
Our sales, cash flows from operations and results of operations may decrease if our relations with our key distributors decline.
Our top ten distributors, through more than 40 independent branches, collectively accounted for more than half of our net sales for the year ended December 31, 2010. Our largest distributors, The Parksite Group, through eleven branches, Boston Cedar and Wolf Distributing, each accounted for more than 15% of AZEK Building Product segment sales for the year ended December 31, 2010, and collectively accounted for approximately 49% of total consolidated net sales for the year ended December 31, 2010. In the last quarter of 2010, Wolf Distributing ceased to be a distributor of our products, and subsequently announced plans to source its own private-label building products, including deck, rail and/or porch plank products, in direct competition with AZEK. Subsequently, a substantial portion of the distribution of our products previously handled through Wolf Distributing has been
24
taken over by The Parksite Group. As a result, The Parksite Group currently accounts for a larger share of our net sales compared to the year ended December 31, 2010. We expect our relationship with The Parksite Group, Boston Cedar and our other key distributors to continue; however, the loss of or a significant adverse change in our relationships with The Parksite Group, Boston Cedar or any other significant distributor could temporarily disrupt our net sales. Our operations depend upon our ability to maintain our relations with our network of distributors and dealers. If our key distributors and dealers are unwilling to continue to sell our products or desire to sell competing products alongside our products, if we do not provide product offerings and price points that meet the needs of our key distributors and dealers, or if our key distributors and dealers merge with or are purchased by a competitor, we could experience a decline in sales. The loss of, or a reduction in orders from, any significant distributor or dealer, losses arising from disputes regarding shipments, fees, merchandise condition or related matters, or our inability to collect accounts receivable from any significant distributor or dealer could cause a decrease in our net income and our cash flow. In addition, revenue from distributors that have accounted for significant revenue in past periods, individually or as a group, may not continue, or if continued, may not reach or exceed historical levels in any period. If we are unable to replace such distributors or dealers, or otherwise replace the resulting loss of sales, our business and results of operations could be materially adversely affected.
Acquisitions we may pursue in the future may be unsuccessful.
We may opportunistically consider the acquisition of other manufacturers or product lines of other businesses that either complement or expand our existing business. We cannot assure you that we will be able to consummate any such acquisitions or that any future acquisitions will be able to be consummated at acceptable prices and terms. Any future acquisitions we pursue may involve a number of special risks, including some or all of the following:
- •
- the diversion of management's attention from our core businesses;
- •
- the disruption of our ongoing business;
- •
- entry into markets in which we have limited or no experience;
- •
- the ability to integrate our acquisitions without substantial costs, delays or other problems;
- •
- inaccurate assessment of undisclosed liabilities;
- •
- the incorporation of acquired products into our business;
- •
- the failure to realize expected synergies and cost savings;
- •
- the loss of key employees or customers of the acquired business;
- •
- increasing demands on our operational systems;
- •
- possible adverse effects on our reported operating results, particularly during the first several reporting periods after
the acquisition is completed; and
- •
- the amortization of acquired intangible assets.
Additionally, any acquisitions we may make could result in significant increases in our outstanding indebtedness and debt service requirements. The terms of our credit agreements may limit the acquisitions we can pursue.
Our insurance coverage may be inadequate to protect against the potential hazards incident to our business.
We maintain property, business interruption, product liability and casualty insurance coverage, but such insurance may not provide adequate coverage against potential claims, including losses resulting from war risks, terrorist acts or product liability claims relating to products we manufacture. Consistent
25
with market conditions in the insurance industry, premiums and deductibles for some of our insurance policies have been increasing and can in the future increase substantially. In some instances, some types of insurance may become available only for reduced amounts of coverage, if at all. In addition, there can be no assurance that our insurers would not challenge coverage for certain claims. If we were to incur a significant liability for which we were not fully insured or that our insurers disputed, it could have a material adverse effect on our financial position.
We provide product warranties that could expose us to claims, which could in turn damage our reputation and adversely affect our business.
We provide warranty guarantees on our Scranton products against breakage, corrosion and delamination. Prior to June 1, 2009, Scranton products had a 15-year limited warranty. Beginning June 1, 2009, the warranty on most Scranton products was extended to 25 years for purchases after that date. Scranton Products' new Resistall product line has a 5-year limited warranty. AZEK Trim products have a 25-year limited warranty and AZEK Deck and AZEK Porch products sold for residential use have a lifetime limited warranty. The limited warranty period for all other uses of AZEK Deck and AZEK Porch, including commercial use, is 20 years. The AZEK Deck and AZEK Porch warranties guarantee against manufacturing defects in material and workmanship that result in blistering, peeling, flaking, cracking, splitting, cupping, rotting or structural defects from termites or fungal decay. AZEK Trim products are guaranteed against manufacturing defects that cause the products to rot, corrode, delaminate, or excessively swell from moisture. AZEK Rail products have a 20-year limited warranty for white rail and a 10-year limited warranty for AZEK Premier colored rail. The AZEK Rail warranty also guarantees against rotting, cracking, peeling, blistering, or structural defects from fungal decay.
Estimating the required warranty reserves requires a high level of judgment as AZEK Trim and AZEK Rail products have only been on the market for ten years and AZEK Deck has only been on the market for six years. Each of these product lines are early in their product life cycles. Management estimates warranty reserves, based in part upon historical warranty costs, as a proportion of sales by product line. Management also considers various relevant factors, including its stated warranty policies and procedures, as part of its evaluation of its liability. Because warranty issues may surface later in the product life cycle, management continues to review these estimates on a regular basis and considers adjustments to these estimates based on actual experience compared to historical estimates. Although management believes that our warranty reserves at March 31, 2011 are adequate, actual results may vary from these estimates.
Our business operations could be significantly disrupted if members of our management team were to leave.
Our success depends to a significant degree upon the continued contributions of our senior management. Our senior operating management members have extensive sales and marketing, engineering, manufacturing and finance backgrounds and collectively have over 120 years of cumulative industry or related experience. We believe that the depth of our management team is instrumental to our continued success. The loss of any member of our senior management team in the future could significantly impede our ability to successfully implement our business strategy, financial plans, expansion of services, marketing and other objectives. We do not carry key man insurance to mitigate the financial effect of losing the services of any member of our management team.
A portion of our business is derived from Canada, which exposes us to foreign exchange risks.
Fluctuations between U.S. and Canadian currency values may adversely affect our results of operations and financial position. Our AZEK Rail products are internally manufactured at production facilities located in Toronto, Canada, and we have established an extensive network of distributors and dealers throughout the United States and Canada. Because the Canadian dollar is the functional currency for our Canadian operations, any change in the exchange rate will affect our reported
26
expenses and net income for any period affected. For example, for the year ended December 31, 2010, we experienced unrealized foreign currency gains of $92,000. A decrease in the value of Canadian currency relative to the U.S. dollar could adversely affect the financial results from our Canadian operations and the value of the net assets of our Canadian operations when reported in U.S. dollars in our consolidated financial statements. There can be no assurance that fluctuations in foreign currency exchange rates will not have a materially adverse effect on our business, financial condition or results of operations.
Our business operations could be negatively impacted if we fail to adequately protect our intellectual property rights or if third parties claim that we are in violation of their intellectual property rights.
As a company that manufactures and markets branded products, we rely heavily on trademark and service mark protection to protect our brands, and we have registered or applied to register many of these trademarks and service marks. We cannot assure you that our pending trademark and service mark applications will be granted or not challenged or opposed by third parties. In the event that our trademarks or service marks are successfully challenged and we lose all rights to use such trademarks or service marks, we could be forced to rebrand our products, requiring us to devote resources advertising and marketing new brands. In particular, the value of the AZEK brand is significant to the success of our business. We generally rely on a combination of unpatented proprietary know-how and trade secrets, and to a lesser extent, patents, in order to preserve our position in the market. Because of the importance of our proprietary know-how and trade secrets, we employ various methods to protect our intellectual property, such as entering into confidentiality agreements with third parties, and controlling access to and distribution of our proprietary information.
There is no assurance that these protections are adequate to prevent competitors from copying, imitating or reverse engineering our products or from developing and marketing products that are substantially equivalent to or superior to our own. Further, we may not be able to deter current and former employees, contractors and other parties from breaching confidentiality obligations and misappropriating proprietary information. Due to the nature of our products and technology, it is difficult for us to monitor unauthorized uses of our products and technology. The steps we have taken may not prevent unauthorized use of technology, particularly in foreign countries where the laws may not protect our proprietary rights as fully as in the United States.
In addition, we have applied for patent protection relating to certain existing and proposed products, processes and services or aspects thereof. We cannot assure you that any of our pending patent applications will be granted. We also cannot assure you that the patents issued as a result of our foreign patent applications will have the same scope of coverage as our United States patents. The patents we own could be challenged, invalidated or circumvented by others and may not be of sufficient scope or strength to provide us with any meaningful protection or commercial advantage.
If third parties take actions that affect our rights or the value of our intellectual property, similar proprietary rights or reputation, or we are unable to protect our intellectual property from infringement or misappropriation, other companies may be able to use our intellectual property to offer competitive products at lower prices and we may not be able to effectively compete against these companies. In addition, if any third party copies or imitates our products, including our AZEK products, in a manner that projects a lesser quality or carries a negative connotation, this could have a material adverse effect on our goodwill in the marketplace because it would damage the reputation of synthetic products generally, whether or not it violates our intellectual property rights.
In addition, we face the risk of claims that we are infringing third parties' intellectual property rights. We believe that our intellectual property rights are sufficient to allow us to conduct our business without incurring liability to third parties. We have received, and from time to time, may receive in the future, claims from third parties by which such third parties assert infringement claims against us in
27
connection with the manufacture and sale of our products and we can give no assurance that claims or litigation asserting infringement by us of third parties' intellectual property rights will not be initiated in the future. Any such claim, even if it is without merit, could be expensive and time-consuming; could cause us to cease making, using or selling certain products that incorporate the disputed intellectual property; could require us to redesign our products, if feasible; could divert management time and attention; and could require us to enter into costly royalty or licensing arrangements, to the extent such arrangements are available. In the future, we may also rely on litigation to enforce our intellectual property rights and contractual rights, and, if such enforcement measures are not successful, we may not be able to protect the value of our intellectual property. Regardless of its outcome, any litigation could be protracted and costly and could have a material adverse effect on our business and results of operations.
The cost of complying with laws and regulations relating to the protection of human health and the environment may be significant.
Our products and operations are subject to extensive and frequently changing federal, state, municipal, local and foreign laws and regulations relating to the protection of human health and the environment, including those limiting the discharge and release of pollutants into the environment and those regulating the transport, use, treatment, storage, disposal and remediation of, and exposure to, solid and hazardous wastes and hazardous materials. Certain environmental laws and regulations can impose joint and several liability without regard to fault on responsible parties, including past and present owners and operators of sites, to clean up, or contribute to the cost of cleaning up, sites at which hazardous wastes or materials were disposed or released. Failure to comply with environmental laws and regulations could result in severe fines and penalties. In addition, various current and potential future federal and state laws and regulations could regulate the emission of greenhouse gases, particularly carbon dioxide and methane. Accordingly, we may be required either to limit greenhouse gas emissions from our operations or to purchase allowances for such emissions. We cannot predict the impact that this regulation may have on our business in the future.
While we believe that the future cost of compliance with environmental laws and regulations and liabilities associated with our operations or known environmental conditions will not have a material adverse effect on our business, we cannot assure you that future events, such as new or more stringent environmental laws and regulations, any related damage claims, the discovery of previously unknown environmental conditions requiring response action, or more vigorous enforcement or a new interpretation of existing environmental laws and regulations would not require us to incur additional costs that would be material and increase the cost of producing, or otherwise adversely affect the demand for, our products.
We depend on our information technology systems to conduct our business.
Our ability to effectively monitor and control our operations and conduct our business depends on the proper functioning of our information technology systems. Any disruption in our information technology systems or the failure of these systems to operate as expected could, depending on the magnitude and duration of the problem, adversely affect our business, financial condition and operating results.
If we fail to maintain an effective system of internal controls, we may not be able to accurately report our financial results or prevent fraud.
Effective internal controls are necessary for us to provide reliable financial reports and effectively prevent fraud. Any inability to provide reliable financial reports or prevent fraud could harm our business. We are continuing to evaluate and, where appropriate, enhance our policies, procedures and internal controls. If we fail to maintain the adequacy of our internal controls, as such standards are
28
modified, supplemented or amended from time to time, our financial statements may not accurately reflect our financial condition.
We identified a material weakness in our internal control over financial reporting as of December 31, 2008, because we failed to maintain effective controls over the accounting for income taxes. An error resulted from an ineffective review process for the provision and balance sheet presentation of deferred income taxes, related to the methodology used to establish our valuation allowance, which was corrected prior to the issuance of our consolidated financial statements as of and for the year ended December 31, 2008 and had no impact on previously reported periods. This material weakness was remediated in 2009.
As a public company, our management will be required to conduct an annual evaluation of our internal control over financial reporting and include a report of management on our internal control over financial reporting beginning with our Annual Report on Form 10-K for the year ending December 31, 2012. In addition, we expect to be required to have our independent registered public accounting firm report on the effectiveness of our internal control over financial reporting beginning with our Annual Report on Form 10-K for the year ending December 31, 2012. If we are unable to conclude that we have effective internal control over financial reporting, or if our independent registered public accounting firm is unable to provide us with an unqualified report as to the effectiveness of our internal control over financial reporting, investors could lose confidence in the reliability of our financial statements, which could result in a decrease in the value of our common stock. In addition, even if we were to conclude, and our auditors were to concur, that our internal control over financial reporting provided reasonable assurance regarding the reliability of financial reporting and the preparation of financial statements for external purposes in accordance with generally accepted accounting principles, because of its inherent limitations, internal control over financial reporting may not prevent or detect fraud or misstatements. This, in turn, could have an adverse impact on trading prices for our shares of common stock, and could adversely affect our ability to access the capital markets.
Our substantial indebtedness could adversely affect our financial condition.
We have a significant amount of indebtedness. As of March 31, 2011, we had total indebtedness of $325.5 million, excluding up to an additional $23.6 million that was available for borrowing under the New Revolving Credit Facility. See "Description of Certain Indebtedness."
Our substantial indebtedness could have important consequences to you. For example, it could:
- •
- increase our vulnerability to general adverse economic and industry conditions, including the recent volatility and
disruptions in the credit markets;
- •
- require us to dedicate a substantial portion of our cash flow from operations to payments on our indebtedness, thereby
reducing the availability of our cash flow to fund working capital, capital expenditures, research and development efforts and other general corporate purposes;
- •
- limit our flexibility in planning for, or reacting to, changes in our business and the industry in which we operate;
- •
- place us at a competitive disadvantage compared to our competitors that have less debt; and
- •
- limit our ability to borrow additional funds for capital expenditures, acquisitions, working capital or other purposes.
In addition, substantially all of our debt bears interest at variable rates. If market interest rates increase, such variable-rate debt will create higher debt service requirements, which could adversely affect our cash flow. Each 0.25% increase or decrease in the applicable interest rates on our
29
variable-rate debt outstanding at March 31, 2011 would correspondingly change our interest expense by approximately $0.8 million per year.
Our credit agreements contain financial and other restrictive covenants that limit our ability to engage in activities that may be in our long-term best interests. Our failure to comply with those covenants could result in an event of default which, if not cured or waived, could result in the acceleration of all of our debts. The New Revolving Credit Facility matures in 2016, and the New Term Loan Agreement matures in 2017. We may need to refinance all or a portion of our indebtedness on or before the maturity thereof. We may not be able to obtain such financing on commercially reasonable terms or at all. Failure to refinance our indebtedness could have a material adverse effect on us and could require us to dispose of assets. See "Management's Discussion and Analysis of Financial Condition and Results of Operations—Liquidity and Capital Resources."
Despite current indebtedness levels, we and our subsidiaries may still be able to incur substantially more debt. This could further exacerbate the risks associated with our substantial leverage.
We and our subsidiaries may be able to incur substantial additional indebtedness in the future. The terms of our credit agreements do not fully prohibit us or our subsidiaries from doing so. The New Revolving Credit Facility permits borrowings of up to $65 million. In addition, the New Term Loan Agreement provides for additional uncommitted term loans of up to $70 million. If new indebtedness is added to our and our subsidiaries' current debt levels, the related risks that we and they now face could intensify and we may not be able to meet all our debt obligations.
To service our indebtedness, we will require a significant amount of cash. Our ability to generate cash depends on many factors beyond our control.
Our ability to make payments on and to refinance our indebtedness and to fund planned capital expenditures and research and development efforts will depend on our ability to generate cash in the future. This, to a certain extent, is subject to general economic, financial, competitive, legislative, regulatory and other factors that are beyond our control, including the recent economic downturn and disruptions in the financial markets. We cannot assure you that our business will generate sufficient cash flow from operations or that future borrowings will be available to us under the New Revolving Credit Facility, or otherwise in an amount sufficient to enable us to pay our indebtedness or to fund our other liquidity needs. See "Management's Discussion and Analysis of Financial Condition and Results of Operations—Liquidity and Capital Resources."
If for any reason we are unable to meet our debt service obligations, we would be in default under the terms of our agreements governing our outstanding debt. If such a default were to occur, the lenders under the New Revolving Credit Facility could elect to declare all amounts outstanding under that facility immediately due and payable, and the lenders would not be obligated to continue to advance funds under the New Revolving Credit Facility. In addition, if such a default were to occur, our term loans would become immediately due and payable. If the amounts outstanding under these debt agreements are accelerated our assets may not be sufficient to repay in full the money owed to our lenders and other creditors.
Our credit agreements impose significant operating and financial restrictions, which may prevent us from capitalizing on business opportunities and taking some actions.
Our credit agreements contain customary restrictions on our activities, including covenants that limit the ability of us and our restricted subsidiaries to:
- •
- incur additional indebtedness or issue guarantees;
- •
- grant liens;
30
- •
- make fundamental changes in our business, corporate structure or capital structure, including, among other things,
entering into mergers, acquisitions and other business combinations;
- •
- make loans and investments;
- •
- pay dividends, make distributions and repurchase equity;
- •
- enter into sale and leaseback transactions;
- •
- enter into transactions with affiliates;
- •
- modify or waive certain material agreements in a manner that is adverse in any material respect to the lenders; and
- •
- prepay or repurchase certain indebtedness.
The New Revolving Credit Facility also requires us to maintain a minimum fixed charge coverage ratio in certain circumstances. We may not be able to maintain this ratio, and any failure to be in compliance with this test when we are required to be in compliance could result in a default under the New Revolving Credit Facility. In the case of a default, we would, among other things, not be able to borrow funds under the New Revolving Credit Facility, which could make it difficult for us to operate our business. In addition, the New Term Loan Agreement requires us to maintain a maximum total leverage ratio and a minimum interest coverage ratio. We may not be able to maintain one or both of these ratios, and any failure to be in compliance with either of these tests could result in a default under the New Term Loan Agreement.
The restrictions in our credit agreements may prevent us from taking actions that we believe would be in the best interest of our business, and may make it difficult for us to successfully execute our business strategy or effectively compete with companies that are not similarly restricted. We may also incur future debt obligations that might subject us to additional restrictive covenants that could affect our financial and operational flexibility. We may not be granted waivers or amendments to these agreements if for any reason we are unable to comply with these agreements, and we may not be able to refinance our debt on terms acceptable to us, or at all.
The breach of any of these covenants and restrictions could result in a default under our credit agreements. An event of default under our debt agreements would permit some of our lenders to declare all amounts borrowed from them to be due and payable. If we are unable to repay debt, lenders having secured obligations, such as the lenders under our credit agreements, could proceed against the collateral securing the debt. Because our credit agreements have customary cross-default provisions, if the indebtedness under any of our other facilities is accelerated, we may be unable to repay or finance the amounts due.
Risks Related to Our Common Stock and this Offering
There is no existing market for our common stock, and we do not know if one will develop to provide you with adequate liquidity to sell our common stock at prices equal to or greater than the price you paid in this offering.
Prior to this offering, there has not been a public market for our common stock. We cannot predict the extent to which investor interest in our company will lead to the development of an active trading market on the New York Stock Exchange, or NYSE, or otherwise or how liquid that market might become. If an active trading market does not develop, you may have difficulty selling any shares of our common stock that you buy. The initial public offering price for the common stock will be determined by negotiations between us and the representatives of the underwriters and may not be indicative of prices that will prevail in the open market following this offering. Consequently, you may
31
not be able to sell our common stock at prices equal to or greater than the price you paid in this offering, or at all.
The price of our common stock may fluctuate significantly, and you could lose all or part of your investment.
Volatility in the market price of our common stock may prevent you from being able to sell your common stock at or above the price you paid for your common stock. The market price of our common stock could fluctuate significantly for various reasons, including:
- •
- actual or anticipated fluctuations in our operating and financial performance and prospects;
- •
- our quarterly or annual earnings or those of other companies in our industry or related industries;
- •
- the public's reaction to our press releases, our other public announcements and our filings with the Securities and
Exchange Commission, or SEC;
- •
- changes in, or failure to meet, earnings estimates or recommendations by research analysts who track our common stock or
the stock of other companies in our industry;
- •
- the failure of analysts to cover our common stock;
- •
- the introduction of new products by us or our competitors;
- •
- strategic actions by us or our competitors, such as acquisitions or restructurings;
- •
- new laws or regulations or new interpretations of existing laws or regulations applicable to our business;
- •
- political developments;
- •
- changes in accounting standards, policies, guidance, interpretations or principles;
- •
- material litigations or government investigations;
- •
- changes in market conditions in the broader stock market;
- •
- changes in general conditions in the United States and global economies or financial markets, including those resulting
from war, incidents of terrorism, acts of god or responses to such events;
- •
- changes in key personnel;
- •
- sales of our common stock by us or, members of our management team or our controlling stockholder;
- •
- sales, or anticipated sales, of large blocks of our common stock;
- •
- the granting or exercise of employee stock options;
- •
- volume of trading in our common stock; and
- •
- the realization of any risks described under "Risk Factors."
These and other factors may cause the market price and demand for our common stock to fluctuate substantially, which may limit or prevent investors from readily selling their shares of common stock and may otherwise negatively affect the liquidity of our common stock. In addition, in recent years, the stock market has experienced significant price and volume fluctuations. This volatility has had a significant impact on the market price of securities issued by many companies, including companies in our industry. The changes frequently appear to occur without regard to the operating performance of the affected companies. Hence, the price of our common stock could fluctuate based
32
upon factors that have little or nothing to do with our company, and these fluctuations could materially reduce our share price and cause you to lose all or part of your investment. Further, in the past, market fluctuations and price declines in a company's stock have sometimes led to securities class action litigations against the company that issued the stock. If such a suit against us were to arise, it could have a substantial cost and divert our resources regardless of the outcome.
If securities or industry analysts do not publish research or reports about our business or if they downgrade recommendations regarding our stock, the price of our stock could decline.
The research and reports that securities or industry analysts publish about us or our business may vary widely and may not predict accurate results, but will likely have an effect on the trading price of our common stock. If one or more of these analysts decide not to cover our company or fail to publish reports on us regularly, or if one or more of these analysts decide to cease covering our company at some point in the future, we could lose visibility in the market, which in turn could cause our stock price to decline. We may be subject to greater risk of losing analyst coverage as a result of the size of this offering and the relative number of shares which will be available for trading in the public market. If one or more of the analysts that cover us downgrade recommendations regarding our stock, or if our results of operations do not meet their expectations, our stock price could decline rapidly and such decline could be material.
We have no plans to pay any dividends on our common stock for the foreseeable future, so you may not receive funds without selling your common stock.
We have no plans to pay regular dividends on our common stock. We generally intend to invest our future earnings, if any, to fund our growth. Any payment of future dividends will be at the discretion of our board of directors and will depend upon our results of operations, cash requirements, financial condition, contractual restrictions, restrictions imposed by applicable laws and other factors that our board of directors may deem relevant. The terms of our credit agreements also effectively limit our ability to pay dividends. Our business is conducted through our subsidiaries. Dividends from, and cash generated by our subsidiaries will be our principal sources of cash to repay indebtedness, fund operations and pay dividends. Accordingly, our ability to pay dividends to our stockholders is dependent on the earnings and distributions of funds from our subsidiaries. If we do not pay dividends, you may have to sell some or all of your common stock in order to generate cash flow from your investment. You may not receive a gain on your investment when you sell your common stock and you may lose the entire amount of the investment.
Because AEA Investors controls a significant percentage of our common stock, it may control all major corporate decisions and its interests may conflict with the interests of other holders of our common stock.
Upon completion of this offering and the Distribution, AEA Investors will beneficially own approximately % of the voting power of our outstanding common stock (or % if the underwriters exercise their overallotment option in full). Through this beneficial ownership and a stockholders agreement, which provides voting control over additional shares of our common stock, AEA Investors will control approximately % of the voting power of our outstanding common stock (or % if the underwriters exercise their overallotment option in full). As a result of this ownership, AEA Investors will be able to influence or control matters requiring approval by our stockholders and/or our board of directors, including the election of directors and the approval of business combinations or dispositions and other extraordinary transactions. They may also have interests that differ from yours and may vote in a way with which you disagree and which may be adverse to your interests. The concentration of ownership may have the effect of delaying, preventing or deterring a change of control of our company, could deprive our stockholders of an opportunity to receive a premium for their common stock as part of a sale of our company and may materially and adversely
33
affect the market price of our common stock. In addition, AEA Investors may in the future own businesses that directly compete with ours. See "Summary—Our Sponsor" and "Certain Relationships and Related Party Transactions."
We are a "controlled company" within the meaning of the NYSE rules and, as a result, expect to qualify for, and intend to rely on, exemptions from certain corporate governance requirements. You will not have the same protections afforded to shareholders of companies that are subject to such requirements.
Following the consummation of this offering, we expect that AEA Investors will continue to control a majority of the voting power of our outstanding common stock. As a result, we expect to be a "controlled company" within the meaning of the NYSE corporate governance standards. Under these rules, a company of which more than 50% of the voting power is held by an individual, group or another company is a "controlled company" and may elect not to comply with certain corporate governance requirements, including:
- •
- the requirement that a majority of our board of directors consist of independent directors;
- •
- the requirement that we have a nominating/corporate governance committee that is composed entirely of independent
directors with a written charter addressing the committee's purpose and responsibilities;
- •
- the requirement that we have a compensation committee that is composed entirely of independent directors with a written
charter addressing the committee's purpose and responsibilities; and
- •
- the requirement for an annual performance evaluation of the nominating/corporate governance and compensation committees.
Following this offering, we intend to utilize these exemptions if we continue to qualify as a "controlled company." If we do utilize the exemptions, we will not have a majority of independent directors and our nominating and corporate governance and compensation committees will not consist entirely of independent directors and such committees will not be subject to annual performance evaluations. As a result, our board of directors and those committees may have more directors who do not meet the NYSE independence standards than they would if those standards were to apply. The independence standards are intended to ensure that directors who meet those standards are free of any conflicting interest that could influence their actions as directors. Accordingly, you will not have the same protections afforded to stockholders of companies that are subject to all of the corporate governance requirements of the NYSE.
Our management will have broad discretion over the use of the proceeds from this offering and might not apply the proceeds of this offering in ways that increase the value of your investment.
Our management will have broad discretion to use the net proceeds from this offering. The net proceeds may be applied in ways with which you and other investors in the offering may not agree or which do not increase the value of your investment. We intend to use a portion of the net proceeds from shares that we sell to repay $ million of the outstanding principal amount of our indebtedness under . We have not allocated the remainder of the net proceeds for any specific purposes. We may fail to use these funds effectively to yield a significant return, or any return, on any investment of these net proceeds and we cannot assure you the proceeds will be used in a manner which you would approve. We will not receive any of the proceeds from the sale of the shares of our common stock by the selling stockholder.
34
You will suffer immediate and substantial dilution as a result of this offering.
The initial public offering price per share of our common stock is substantially higher than our net tangible book value per common share immediately after the offering. As a result, if you purchase shares in this offering, you will pay a price per share that substantially exceeds the book value of our assets after subtracting our liabilities. At an offering price of $ per share, which is the midpoint of the offering price range set forth on the front cover of this prospectus, you will incur immediate and substantial dilution of your investment in the amount of $ per share. See "Dilution."
Provisions of our amended and restated certificate of incorporation and amended and restated bylaws and Delaware law might discourage, delay or prevent a change of control of our company or changes in our management and, as a result, depress the trading price of our common stock.
Following this offering, we anticipate that our amended and restated certificate of incorporation and amended and restated bylaws will contain provisions that could discourage, delay or prevent a change in control of our company or changes in our management that the stockholders of our company may deem advantageous. These provisions will:
- •
- authorize the issuance of blank check preferred stock that our board could issue to increase the number of outstanding
shares and to discourage a takeover attempt;
- •
- the absence of cumulative voting in the election of directors, which may limit the ability of minority stockholders to
elect directors;
- •
- limit the ability of stockholders to remove directors without cause if a "group," as defined under Section 13(d)(3)
of the Exchange Act, ceases to own more than 50% of our common stock;
- •
- establish a classified board of directors so that not all members of our board are elected at one time;
- •
- prohibit our stockholders from calling a special meeting of stockholders;
- •
- prohibit stockholder action by written consent, which requires all stockholder actions to be taken at a meeting of our
stockholders, if a "group" ceases to own more than 50% of our common stock;
- •
- provide that our board of directors is expressly authorized to adopt, or to alter or repeal, our bylaws;
- •
- establish advance notice requirements for nominations for election to our board or for proposing matters that can be acted
upon by stockholders at stockholder meetings; and
- •
- grant to our board the sole power to set the number of directors and to fill any vacancy on the board.
In addition, until affiliates of AEA Investors no longer own more than 50% of our common stock, we expect to opt out of Section 203 of the Delaware General Corporation Law, or DGCL, which, subject to some exceptions, prohibits business combinations between a Delaware corporation and an interested stockholder, which is generally defined as a stockholder who becomes a beneficial owner of 15% or more of a Delaware corporation's voting stock for a three-year period following the date that the stockholder became an interested stockholder. After such time, we will be governed by Section 203. Section 203 could have the effect of delaying, deferring or preventing a change in control that our stockholders might consider to be in their best interests. See "Description of Capital Stock."
These anti-takeover defenses could discourage, delay or prevent a transaction involving a change in control of our company. These provisions could also discourage proxy contests and make it more
35
difficult for you and other stockholders to elect directors of your choosing and cause us to take corporate actions other than those you desire.
Future sales of our common stock in the public market could lower our share price, and any additional capital raised by us through the sale of equity or convertible debt securities may dilute your ownership in us and may adversely affect the market price of our common stock.
We and substantially all of our stockholders may sell additional shares of common stock in subsequent public offerings. We may also issue additional shares of common stock or convertible debt securities to finance future acquisitions. After the consummation of this offering, we will have shares of common stock authorized and shares of common stock outstanding. This number includes shares that we are selling in this offering, which may be resold immediately in the public market. Of the remaining shares, , or % of our total outstanding shares, are restricted from immediate resale under the lock-up agreements between our current stockholders and the underwriters described in "Underwriting," but may be sold into the market in the near future. These shares will become available for sale following the expiration of the lock-up agreements, which, without the prior consent of the representatives of the underwriters, is 180 days after the date of this prospectus, subject to compliance with the applicable requirements under Rule 144 of the Securities Act of 1933, or the Securities Act, or registration under the Securities Act. The market price of shares of our common stock may drop significantly when the restrictions on resale by our existing stockholders lapse.
We cannot predict the size of future issuances of our common stock or the effect, if any, that future issuances and sales of our common stock will have on the market price of our common stock. Any additional capital raised by us through the sale of equity or convertible debt securities (including shares issued in connection with an acquisition or otherwise) may dilute your ownership in us and may adversely affect the market price of our common stock. Sales of substantial amounts of our common stock by our existing stockholders (including sales pursuant to the registration rights of our principal stockholders), or the perception that such sales could occur, may adversely affect prevailing market prices for our common stock. See "Certain Relationships and Related Party Transactions" and "Shares Eligible for Future Sale."
Because we are a holding company with no operations of our own, we are financially dependent on receiving distributions from our subsidiaries and we could be harmed if such distributions could not be made in the future.
We are a holding company and all of our operations are conducted through subsidiaries. Consequently, we rely on dividends or advances from our subsidiaries, all of which are directly or indirectly wholly owned. We do not currently expect to declare or pay dividends on our common stock for the foreseeable future; however, to the extent that we determine in the future to pay dividends on our common stock, none of our subsidiaries will be obligated to make funds available to us for the payment of dividends. The ability of such subsidiaries to pay dividends to us is subject to applicable local law. Such laws and restrictions could limit the payment of dividends and distributions to us, which would restrict our ability to continue operations. In addition, Delaware law may impose requirements that may restrict our ability to pay dividends to holders of our common stock.
We will incur increased costs and our management will face increased demands as a result of operating as a company with public equity.
As a company with public equity, we will incur significant legal, accounting and other expenses. In addition, the Sarbanes-Oxley Act, as well as related rules implemented by the SEC, the NYSE and the
36
Financial Industry Regulatory Authority, or FINRA, impose various requirements on companies with public equity. As a public company, we will be required to:
- •
- prepare and distribute periodic public reports and other stockholder communications in compliance with our obligations
under the federal securities laws and NYSE and FINRA rules;
- •
- create or expand the roles and duties of our board of directors and committees of the board;
- •
- institute more comprehensive financial reporting and disclosure compliance functions;
- •
- supplement our internal accounting and auditing function;
- •
- enhance and formalize closing procedures at the end of our accounting periods;
- •
- enhance our investor relations function;
- •
- establish new or enhanced internal policies, including those relating to disclosure controls and procedures; and
- •
- involve and retain to a greater degree outside counsel and accountants in the activities listed above.
Our management and other personnel will need to devote a substantial amount of time to these compliance matters. Also, these rules and regulations will increase our legal and financial compliance costs and will make some activities more time-consuming and costly than would be the case for a private company. For example, we expect these rules and regulations to make it more expensive for us to maintain director and officer liability insurance. As a result, it may be more difficult for us to attract and retain qualified individuals to serve on our board of directors or as our executive officers.
In addition, as a result of becoming a public company, we will be subject to financial reporting and other requirements that will be burdensome and costly. We may not timely complete our analysis of these reporting requirements, which could adversely affect investor confidence in our company and, as a result, the value of our common stock. If we fail to implement these reporting requirements, our ability to report our results of operations on a timely and accurate basis could be impaired.
37
CAUTIONARY NOTE REGARDING FORWARD-LOOKING STATEMENTS
This prospectus contains forward-looking statements. You can generally identify forward-looking statements by our use of forward-looking terminology such as "anticipate," "believe," "continue," "could," "estimate," "expect," "intend," "may," "might," "plan," "potential," "predict," "seek," "should," or "will," or the negative thereof or other variations thereon or comparable terminology. In particular, statements about the markets in which we operate, including growth of our various markets and growth in the use of synthetic products, statements about potential new products and product innovation and our expectations, beliefs, plans, strategies, objectives, prospects, assumptions or future events or performance contained in this prospectus under the headings "Prospectus Summary," "Risk Factors," "Management's Discussion and Analysis of Financial Condition and Results of Operations," and "Business" are forward-looking statements. As described under "Market and Industry Data," the forward-looking statements contained herein regarding market share, market sizes and changes in markets are subject to various estimations and uncertainties.
We have based these forward-looking statements on our current expectations, assumptions, estimates and projections. While we believe these expectations, assumptions, estimates and projections are reasonable, such forward-looking statements are only predictions and involve known and unknown risks and uncertainties, many of which are beyond our control. These and other important factors, including those discussed in this prospectus under the headings "Prospectus Summary," "Risk Factors," "Management's Discussion and Analysis of Financial Condition and Results of Operations," and "Business," may cause our actual results, performance or achievements to differ materially from any future results, performance or achievements expressed or implied by these forward-looking statements. Some of the factors that could cause actual results to differ materially from those expressed or implied by the forward-looking statements include:
- •
- general economic or business conditions, either nationally, regionally or in the individual markets in which we conduct
business may deteriorate and have an adverse impact on our business strategy, including without limitation, factors relating to interest rates, gross domestic product levels and activity in the
residential, institutional and commercial construction market;
- •
- volatility in the financial markets;
- •
- risks of increasing competition in our existing and future markets, including competition from new products introduced by
competitors;
- •
- risk that projections of increased market size do not materialize as expected;
- •
- increases in prices and lack of availability of resin and other raw materials and our ability to pass any increased costs
on to our customers in a timely manner;
- •
- risks related to our dependence on the performance of our AZEK products;
- •
- changes in laws and regulations, including environmental laws and regulations;
- •
- continued increased acceptance of synthetic products as an alternative to wood, wood composite and metal products;
- •
- risks related to acquisitions we may pursue;
- •
- our ability to retain management;
- •
- our ability to continue to innovate and introduce new products;
- •
- our ability to meet future capital requirements and fund our liquidity needs;
- •
- risks associated with our substantial indebtedness and debt service;
- •
- our ability to protect our intellectual property rights;
38
- •
- risks related to our relations with our key distributors;
- •
- downgrades in our credit ratings; and
- •
- other risks and uncertainties, including those listed under "Risk Factors."
Given these risks and uncertainties, you are cautioned not to place undue reliance on such forward-looking statements. The forward-looking statements included in this prospectus are made only as of the date hereof. We do not undertake any obligation to update any such statements or to publicly announce the results of any revisions to any of such statements to reflect future events or developments, except as otherwise required by law.
In addition, the L.E.K. market study referred to in this prospectus contains certain forward-looking statements, and actual results could differ materially from those projected or estimated in the L.E.K. market study. Such forward-looking statements may be subject to certain risks and uncertainties including, but not limited to general economic or business conditions, including without limitation, factors relating to interest rates, gross domestic product levels and activity in the residential, institutional and commercial construction markets, and risks that projections of increased penetration of products do not materialize as expected. See "Market and Industry Data."
39
We estimate that the net proceeds to us from our sale of shares of common stock in this offering will be $ million, after deducting underwriting discounts and commissions and estimated expenses payable by us in connection with this offering. This assumes a public offering price of $ per share, which is the midpoint of the offering price range set forth on the front cover of this prospectus. We intend to use the net proceeds from shares that we sell to repay $ million of the outstanding principal amount of our indebtedness under and for general corporate purposes.
The interest rate on the indebtedness that we intend to repay from proceeds of this offering is and the maturity date is .
A $1.00 increase (decrease) in the assumed initial public offering price of $ per share would increase (decrease) the net proceeds to us from this offering by $ million, assuming the number of shares offered by us, as set forth on the front cover of this prospectus, remains the same and after deducting underwriting discounts and commissions and estimated expenses payable by us. If the underwriters' overallotment option is exercised in full, we estimate that we will receive additional net proceeds of $ million, which we will use for general corporate purposes.
We will not receive any proceeds from the sale of shares by the selling stockholder. Certain members of our management and board of directors as well as entities affiliated with AEA investors, our sponsor, have an equity interest in the selling stockholder. See "Principal and Selling Stockholders."
40
We have not declared or paid any cash dividends on our common stock since the acquisition of our company by AEA Investors in May 2005. We do not intend to pay any cash dividends for the foreseeable future. We intend to retain earnings, if any, for the future operation and expansion of our business and the repayment of debt. Any determination to pay dividends in the future will be at the discretion of our board of directors and will depend upon our results of operations, cash requirements, financial condition, contractual restrictions, restrictions imposed by applicable laws and other factors that our board of directors may deem relevant. In addition, covenants of any of our existing or future indebtedness, including our credit agreements, may limit our ability to pay dividends and make distributions to our stockholders. Our business is conducted through our subsidiaries. Dividends from, and cash generated by our subsidiaries will be our principal sources of cash to repay indebtedness, fund operations and pay dividends. Accordingly, our ability to pay dividends to our stockholders is dependent on the earnings and distributions of funds from our subsidiaries. See "Description of Certain Indebtedness."
41
The following table sets forth our cash and cash equivalents and consolidated capitalization as of March 31, 2011:
- •
- on an actual basis; and
- •
- on a pro forma basis to give effect to the sale of shares of our common stock in this offering by us at an assumed initial public offering price of $ per share (the midpoint of the offering price range set forth on the front cover of this prospectus) after deducting underwriting discounts and commissions and estimated offering expenses payable by us, and the application of the net proceeds from this offering as described in "Use of Proceeds."
This table should be read in conjunction with the consolidated financial statements and the related notes included elsewhere in this prospectus and "Selected Historical Consolidated Financial Data" and "Management's Discussion and Analysis of Financial Condition and Results of Operations."
| |
As of March 31, 2011 | ||||||||
|---|---|---|---|---|---|---|---|---|---|
| |
Actual | Pro Forma(1) | |||||||
| |
(in thousands, except share data) |
||||||||
Cash and cash equivalents |
$ | 12,339 | $ | ||||||
Long-term debt, including current portion: |
|||||||||
Capital lease obligations |
$ | 2,945 | $ | ||||||
New Revolving Credit Facility(2) |
39,683 | ||||||||
New Term Loan Agreement |
282,890 | ||||||||
Total long-term debt, including current portion |
325,518 | ||||||||
Shareholder's equity: |
|||||||||
Common stock, $0.01 par value; 1,000 shares authorized and 10 shares issued and outstanding, actual; shares authorized and shares issued and outstanding, pro forma |
— | ||||||||
Additional paid in capital |
212,315 | ||||||||
Accumulated deficit |
(49,014 | ) | |||||||
Note receivable—Holdings |
(14,012 | ) | |||||||
Accumulated other comprehensive loss |
(847 | ) | |||||||
Total shareholder's equity |
148,442 | ||||||||
Total capitalization |
$ | 473,960 | $ | ||||||
- (1)
- A
$1.00 increase (decrease) in the assumed initial public offering price of $ per share, the midpoint of the offering price range set forth
on the front cover of this prospectus, would increase (decrease) each of cash and cash equivalents, additional paid in capital, total shareholders' equity and total capitalization by
$ ,
assuming that the number of shares offered by us, as set forth on the front cover of this prospectus, remains the same. The pro forma information discussed above is illustrative only and will be
adjusted based on the actual public offering price and terms of this offering determined at pricing.
- (2)
- The New Revolving Credit Facility, which we entered into on February 18, 2011, permits borrowings of up to $65.0 million. As of March 31, 2011, the New Revolving Credit Facility had a balance of $40.0 million outstanding and a letter of credit of $1.4 million held against it, and approximately $23.6 million remained available for future borrowings. See "Description of Certain Indebtedness."
42
If you invest in our common stock, your interest will be diluted to the extent of the difference between the initial public offering price per share and the net tangible book value per share after this offering.
As of March 31, 2011, we had net tangible book value of approximately $ million, or $ per share. Net tangible book value per share represents total tangible assets less total liabilities and divided by the number of shares of common stock outstanding. After giving effect to (i) our -for-one stock split and (ii) the issuance and sale of shares of our common stock in this offering at an assumed initial public offering price of $ per share, the midpoint of the offering price range on the front cover of this prospectus, deducting the underwriting discounts and estimated offering expenses that we will pay and the application of the proceeds therefrom as described under "Use of Proceeds," our net tangible book value as of March 31, 2011 would have been approximately $ million, or $ per share. This represents an immediate increase in net tangible book value of $ per share to existing shareholders and an immediate dilution of $ per share to new investors purchasing common stock in this offering. The following table illustrates this dilution on a per share basis:
| |
Per Share | ||||||
|---|---|---|---|---|---|---|---|
Assumed initial public offering price per share |
$ | ||||||
Net tangible book value per share as of March 31, 2011 |
$ | ||||||
Increase in net tangible book value per share attributable to this offering |
|||||||
Net tangible book value per share after this offering |
|||||||
Dilution per share to new investors |
$ | ||||||
A $1.00 increase (decrease) in the assumed initial offering price of $ per share, the midpoint of the offering price range set forth on the front cover of this prospectus, would affect our net tangible book value after this offering by $ million, the net tangible book value per share after this offering by $ per share, and the dilution per common share to new investors by $ per share, assuming the number of shares offered by us, as set forth on the front cover of this prospectus, remains the same and after deducting the commissions and discounts and estimated offering expenses payable by us.
The following table sets forth, as of March 31, 2011, the total number of shares of common stock owned by existing stockholders and to be owned by new investors, the total consideration paid, and the average price per share paid by our existing stockholders and to be paid by new investors purchasing shares of common stock in this offering. The calculation below is based on an assumed initial public offering price of $ per share, the midpoint of the offering price range set forth on the front cover of this prospectus, before deducting the underwriting discounts and estimated offering expenses that we will pay.
| |
Shares Purchased | Total Consideration | |
||||||||||||||
|---|---|---|---|---|---|---|---|---|---|---|---|---|---|---|---|---|---|
| |
Average Price Per Share |
||||||||||||||||
| |
Number | Percent | Amount | Percent | |||||||||||||
| |
(in thousands, except shares and percentages) |
||||||||||||||||
Existing stockholders |
% | $ | % | $ | |||||||||||||
New investors |
|||||||||||||||||
Total |
% | $ | % | $ | |||||||||||||
A $1.00 increase (decrease) in the assumed initial offering price of $ per share would increase (decrease) total consideration paid by new investors, total consideration paid by all
43
stockholders and average price per share paid by all stockholders by $ million, $ million and $ per share.
If the underwriters exercise in full their option to purchase additional shares of our common stock in this offering, the as adjusted net tangible book value per share would be $ per share and the dilution to new investors in this offering would be $ per share. If the underwriters exercise such option in full, the number of shares held by new investors will increase to approximately shares of our common stock, or approximately % of the total number of shares of our common stock outstanding after this offering.
In addition, we may choose to raise additional capital due to market conditions or strategic considerations even if we believe we have sufficient funds for our current or future operating plans. To the extent that additional capital is raised through sale of equity or convertible debt securities, the issuance of such securities could result in further dilution to our stockholders.
44
SELECTED HISTORICAL CONSOLIDATED FINANCIAL DATA
The selected historical financial data presented below as of December 31, 2010 and 2009 and for the years ended December 31, 2010, 2009 and 2008 have been derived from our audited consolidated financial statements included elsewhere in this prospectus. The selected historical financial data presented below as of December 31, 2008, 2007 and 2006 and for the years ended December 31, 2007 and 2006 have been derived from our audited consolidated financial statements which are not included in this prospectus. The selected historical financial data presented below as of March 31, 2011 and for the three months ended March 31, 2011 and 2010 have been derived from our unaudited condensed consolidated financial statements, which are included elsewhere in this prospectus and have been prepared on the same basis as the audited consolidated financial statements included elsewhere herein. In our opinion, the interim data reflect all adjustments, consisting only of normal and recurring adjustments, necessary for a fair presentation of results for these periods. The operating results for any interim period are not necessarily indicative of the results that may be expected for any other interim period or for a full year.
The results indicated below and elsewhere in this prospectus are not necessarily indicative of our future performance. You should read this data in conjunction with "Management's Discussion and Analysis of Financial Condition and Results of Operations" and our consolidated financial statements and the related notes included elsewhere in this prospectus.
| |
Three Months Ended March 31, |
Year Ended December 31, | ||||||||||||||||||||
|---|---|---|---|---|---|---|---|---|---|---|---|---|---|---|---|---|---|---|---|---|---|---|
| (Dollars in thousands) |
2011 | 2010 | 2010 | 2009 | 2008 | 2007 | 2006 | |||||||||||||||
| |
(unaudited) |
|
|
|
|
|
||||||||||||||||
Statement of Operations Data: |
||||||||||||||||||||||
Net sales |
$ | 114,622 | $ | 94,667 | $ | 327,535 | $ | 266,875 | $ | 305,240 | $ | 313,703 | $ | 261,790 | ||||||||
Cost of sales |
(81,276 | ) | (65,098 | ) | (226,670 | ) | (173,328 | ) | (235,099 | ) | (225,436 | ) | (193,417 | ) | ||||||||
Gross profit |
33,346 | 29,569 | 100,865 | 93,547 | 70,141 | 88,267 | 68,373 | |||||||||||||||
Selling, general and administrative expenses |
(15,529 | ) | (14,395 | ) | (56,489 | ) | (57,392 | ) | (50,644 | ) | (47,242 | ) | (40,521 | ) | ||||||||
Lease termination expense |
— | — | — | (657 | ) | — | — | — | ||||||||||||||
(Loss) gain on sale of property |
(12 | ) | — | (336 | ) | (525 | ) | 21 | 422 | — | ||||||||||||
Impairment of goodwill and long-lived assets |
— | (599 | ) | (599 | ) | (14,408 | ) | (40,000 | ) | — | — | |||||||||||
Operating income (loss) |
17,805 | 14,575 | 43,441 | 20,565 | (20,482 | ) | 41,447 | 27,852 | ||||||||||||||
Loss on debt extinguishment |
(7,339 | ) | — | — | — | — | — | — | ||||||||||||||
Interest expense, net |
(6,682 | ) | (7,471 | ) | (30,854 | ) | (31,347 | ) | (34,905 | ) | (33,698 | ) | (28,685 | ) | ||||||||
Foreign currency gain (loss) |
14 | 78 | 92 | 336 | (215 | ) | — | — | ||||||||||||||
Miscellaneous, net |
— | 7 | 243 | 29 | 153 | 240 | 306 | |||||||||||||||
Income (loss) before income taxes |
3,798 | 7,189 | 12,922 | (10,417 | ) | (55,449 | ) | 7,989 | (527 | ) | ||||||||||||
Income tax benefit (expense) |
734 | (3,998 | ) | (3,569 | ) | 111 | 7,095 | (3,760 | ) | (230 | ) | |||||||||||
Net income (loss) |
$ | 4,532 | $ | 3,191 | $ | 9,353 | $ | (10,306 | ) | $ | (48,354 | ) | $ | 4,229 | $ | (757 | ) | |||||
Per Share Data: |
||||||||||||||||||||||
Weighted average shares outstanding (basic and diluted)(1) |
10 | 10 | 10 | 10 | 10 | 10 | 10 | |||||||||||||||
Net income (loss) per share (basic and diluted)(1) |
$ | 453 | $ | 319 | $ | 935.3 | $ | (1,030.6 | ) | $ | (4,835.4 | ) | $ | 422.9 | $ | 75.7 | ||||||
45
| |
Three Months Ended March 31, |
Year Ended December 31, | ||||||||||||||||||||
|---|---|---|---|---|---|---|---|---|---|---|---|---|---|---|---|---|---|---|---|---|---|---|
| (Dollars in thousands) |
2011 | 2010 | 2010 | 2009 | 2008 | 2007 | 2006 | |||||||||||||||
| |
(unaudited) |
|
|
|
|
|
||||||||||||||||
Other Financial Data: |
||||||||||||||||||||||
Capital expenditures |
$ | 5,568 | $ | 3,490 | $ | 15,346 | $ | 6,258 | $ | 6,282 | $ | 14,386 | $ | 16,995 | ||||||||
Adjusted EBITDA(2) |
$ | 24,584 | $ | 21,277 | $ | 67,519 | $ | 60,873 | $ | 46,339 | $ | 63,135 | $ | 44,275 | ||||||||
Adjusted EBITDA margin(2) |
21.4 | % | 22.5 | % | 20.6 | % | 22.8 | % | 15.2 | % | 20.1 | % | 16.9 | % | ||||||||
Statement of Cash Flows Data: |
||||||||||||||||||||||
Net cash (used in) provided by operating activities |
$ | (46,044 | ) | $ | (31,151 | ) | $ | 26,976 | $ | 37,441 | $ | 36,315 | $ | 21,259 | $ | 1,912 | ||||||
Net cash used in investing activities |
$ | (5,568 | ) | $ | (3,490 | ) | $ | (15,346 | ) | $ | (7,179 | ) | $ | (47,887 | ) | $ | (70,570 | ) | $ | (51,966 | ) | |
Net cash provided by (used in) financing activities |
$ | 14,862 | $ | 8,491 | $ | (7,097 | ) | $ | (8,602 | ) | $ | 24,123 | $ | 56,746 | $ | 37,442 | ||||||
Balance Sheet Data (at end of period): |
||||||||||||||||||||||
Cash and cash equivalents |
$ | 12,339 | $ | 49,072 | $ | 44,501 | $ | 22,586 | $ | 9,608 | $ | 2,173 | ||||||||||
Total assets |
$ | 574,611 | $ | 553,084 | $ | 539,404 | $ | 538,905 | $ | 600,496 | $ | 507,796 | ||||||||||
Total debt(3) |
$ | 325,518 | $ | 305,578 | $ | 307,355 | $ | 314,253 | $ | 284,933 | $ | 258,297 | ||||||||||
Total shareholder's equity |
$ | 148,442 | $ | 143,403 | $ | 138,009 | $ | 146,926 | $ | 196,494 | $ | 156,972 | ||||||||||
- (1)
- Does
not give effect to the -for-one stock split which will occur prior to the effectiveness of the registration
statement of which this prospectus forms a part.
- (2)
- We
present Adjusted EBITDA because we believe it assists investors and analysts in comparing our operating performance across reporting periods on a
consistent basis by excluding items that we do not believe are indicative of our core operating performance. In addition, we utilize Adjusted EBITDA in the calculation of financial covenants under our
New Revolving Credit Facility and our New Term Loan Agreement, as well as in the determination of compensation for members of our senior management team. "Adjusted EBITDA," which is defined as
"Consolidated EBITDA" under our credit agreements, represents net income (loss) before interest expense, income tax expense and depreciation and amortization, or EBITDA, as further adjusted to exclude
certain other items as set forth in the reconciliation presented below. "Adjusted EBITDA margin" is our Adjusted EBITDA as a representative percentage of net sales, and we believe our Adjusted EBITDA
margin is useful in measuring our profitability. You are encouraged to evaluate each adjustment and whether you consider each to be appropriate. In addition, in evaluating Adjusted EBITDA, you should
be aware that in the future, we may incur expenses similar to the adjustments in the presentation of Adjusted EBITDA. Our presentation of Adjusted EBITDA should not be construed as an inference that
our future results will be unaffected by unusual or non-recurring items.
Adjusted EBITDA and Adjusted EBITDA margin are not recognized financial measures under GAAP and may not be comparable to similarly titled measures used by other companies in our industry or across different industries. Adjusted EBITDA and, as a result, Adjusted EBITDA margin, have limitations as analytical tools and you should not consider them in isolation, or as a substitute for analysis of our results as reported under GAAP. Some of these limitations include:
- •
- Adjusted EBITDA does not reflect our cash expenditures, or future requirements, for
capital expenditures or contractual commitments;
- •
- Adjusted EBITDA does not reflect changes in, or cash requirements for, our working
capital needs;
- •
- Adjusted EBITDA does not reflect the significant interest expense, or the cash
requirements necessary to service interest or principal payments, on our outstanding debt;
- •
- Adjusted EBITDA does not reflect depreciation and amortization, which are
non-cash charges, although the assets being depreciated and amortized will likely have to be replaced in the future, nor does Adjusted EBITDA reflect any cash requirements for such
replacements;
- •
- non-cash compensation is and will remain a key element of our overall
long-term incentive compensation package, although we exclude it as an expense when evaluating our ongoing operating performance for a particular period; and
- •
- Adjusted EBITDA does not reflect the impact of certain cash charges resulting from
matters we consider not to be indicative of our ongoing operations.
We compensate for these limitations by relying primarily on our GAAP results and using Adjusted EBITDA only as supplemental information.
46
The following is a reconciliation of our net income (loss) to Adjusted EBITDA and a calculation of Adjusted EBITDA margin:
| |
Three Months Ended March 31, |
Year Ended December 31, | ||||||||||||||||||||
|---|---|---|---|---|---|---|---|---|---|---|---|---|---|---|---|---|---|---|---|---|---|---|
| (Dollars in thousands) |
2011 | 2010 | 2010 | 2009 | 2008 | 2007 | 2006 | |||||||||||||||
| |
(unaudited) |
|
|
|
|
|
||||||||||||||||
Net income (loss)(a) |
$ | 4,532 | $ | 3,191 | $ | 9,353 | $ | (10,306 | ) | $ | (48,354 | ) | $ | 4,229 | $ | (757 | ) | |||||
Interest expense, net(a) |
6,682 | 7,471 | 30,854 | 31,347 | 34,905 | 33,698 | 28,685 | |||||||||||||||
Income tax (benefit) expense |
(734 | ) | 3,998 | 3,569 | (111 | ) | (7,095 | ) | 3,760 | 230 | ||||||||||||
Depreciation and amortization |
5,403 | 5,509 | 21,339 | 21,604 | 21,491 | 18,157 | 13,813 | |||||||||||||||
EBITDA |
15,883 | 20,169 | 65,115 | 42,534 | 947 | 59,844 | 41,971 | |||||||||||||||
Impairment of goodwill and long-lived assets(b) |
— | 599 | 599 | 14,408 | 40,000 | — | — | |||||||||||||||
Disposal of fixed assets(c) |
12 | 11 | 336 | 525 | — | 22 | — | |||||||||||||||
Relocation and severance costs(d) |
169 | 62 | 63 | 886 | 973 | 1,009 | 466 | |||||||||||||||
Facility charges(e) |
— | 18 | 19 | 657 | 26 | (444 | ) | — | ||||||||||||||
Settlement charges(f) |
— | — | — | — | — | 500 | — | |||||||||||||||
Management fee and expenses(g) |
383 | 391 | 1,561 | 1,740 | 1,855 | 1,733 | 1,021 | |||||||||||||||
Fees associated with debt extinguishment(h) |
7,886 | — | — | — | — | — | — | |||||||||||||||
Fees related to market study(i) |
306 | — | — | — | — | — | — | |||||||||||||||
Registration expenses related to Old Notes(j) |
(64 | ) | 13 | 38 | 26 | 309 | — | — | ||||||||||||||
Non-cash compensation charge(k) |
9 | 14 | 36 | 97 | 118 | 398 | 272 | |||||||||||||||
Acquisition-related items(l) |
— | — | (248 | ) | — | 2,111 | 73 | 545 | ||||||||||||||
Adjusted EBITDA |
$ | 24,584 | $ | 21,277 | $ | 67,519 | $ | 60,873 | $ | 46,339 | $ | 63,135 | $ | 44,275 | ||||||||
Net sales |
$ | 114,622 | $ | 94,667 | $ | 327,535 | $ | 266,875 | $ | 305,240 | $ | 313,703 | $ | 261,790 | ||||||||
Adjusted EBITDA margin |
21.4 | % | 22.5 | % | 20.6 | % | 22.8 | % | 15.2 | % | 20.1 | % | 16.9 | % | ||||||||
- (a)
- Net
income (loss) and interest expense each includes the amortization of deferred financing costs classified as interest expense in the amount of
approximately $0.5 million for each of the three month periods ended March 31, 2011 and 2010 and approximately $2.2 million, $2.3 million, $2.1 million,
$1.9 million and $1.7 million for each of the years ended December 31, 2010, 2009, 2008, 2007 and 2006, respectively.
- (b)
- For
the three months ended March 31, 2010 and the year ended December 31, 2010, this represents the write-down of manufacturing
equipment related to the consolidation of our two Canadian manufacturing facilities into one facility. For the year ended December 31, 2009, this represents the write-down of our
goodwill related to the completion of our impairment analysis for 2008 during the first quarter of 2009. For the year ended December 31, 2008, this represents the write-down of our
goodwill and trademarks.
- (c)
- Represents
the disposal of various fixed assets.
- (d)
- For
the three months ended March 31, 2011, this represents $0.2 million of severance costs. For the three months ended March 31, 2010,
this represents $13,000 of severance costs and $49,000 of relocation costs for members of our management team. For the year ended December 31, 2010, this represents $42,000 of severance costs
and $20,000 of relocation costs for members of our management team. For the year ended December 31, 2009, this represents $0.3 million of severance costs attributable to our former AZEK
president and $0.5 million of costs related to relocation for members of our management team. For the year ended December 31, 2008, $0.8 million represents relocation related to
the hiring of certain members of our management team. For the year ended December 31, 2007, $1.0 million represents severance costs related to our former chief executive officer. For the
year ended December 31, 2006, $0.4 million represents the elimination of salary and benefits of three co-founders of the business.
- (e)
- For
the three months ended March 31, 2010 and the year ended December 31, 2010, this represents expenses related to the consolidation of our
two Canadian manufacturing facilities into one facility. For the year ended December 31, 2009, this represents termination costs of $0.2 million related to the consolidation of our
administrative offices into one of our manufacturing facilities in Pennsylvania and $0.4 million related to the consolidation of our two Canadian manufacturing facilities into one facility. For
the year ended December 31, 2008, this represents the $26,000 settlement expense related to the closing costs of the sale of the Winfield Avenue facility. For the year ended December 31,
2007, this represents the gain we recorded related to the sale of the Winfield Avenue facility.
- (f)
- For the year ended December 31, 2007, this represents the one-time settlement expense we incurred over our patent infringement settlement.
47
- (g)
- Represents
the AEA Investors management fee and expenses that were charged during the periods presented. Upon consummation of this offering, the AEA
Investors management fee is expected to be terminated and we will be required to pay management termination fees of $ . See "Certain Relationships and Related Party Transactions."
- (h)
- For
the three months ended March 31, 2011, this represents $7.4 million of debt refinancing fees associated with the loss on debt
extinguishment and $0.5 million of third party fees associated with the debt refinancing.
- (i)
- For
the three months ended March 31, 2011, this represents costs of $0.3 million related to a market study completed in preparation of this
offering.
- (j)
- Represents
financing charges related to the market making registration statement for the Old Notes.
- (k)
- Represents
non-cash compensation charges related to our Class B Unit Equity Program.
- (l)
- For the year ended December 31, 2010, this represents a settlement related to the share purchase agreement for the acquisition of Composatron, which we acquired on February 29, 2008. For the year ended December 31, 2008, this represents (i) $0.6 million of integration costs from the Composatron acquisition and (ii) $1.5 million of a non-cash fair value adjustment to increase inventory to its estimated selling price at February 29, 2008, in connection with the Composatron acquisition, which increase was then recognized as an increase to cost of sales during the period from March 1, 2008 to December 31, 2008 as the related inventory was sold. For the year ended December 31, 2007, this represents (i) $60,000 of integration costs from the acquisition of Procell, which we acquired on January 31, 2007 and (ii) $13,000 of integration and moving expenses from the acquisition of Santana Products, which we acquired on April 28, 2006. For the year ended December 31, 2006, this represents (i) $0.5 million of integration and moving expenses from the Santana Products acquisition and (ii) $26,000 of charges related to the Procell acquisition that were incurred after the signing of the initial purchase agreement on December 13, 2006.
- (3)
- Includes capital lease obligations.
48
MANAGEMENT'S DISCUSSION AND ANALYSIS OF FINANCIAL CONDITION
AND RESULTS OF OPERATIONS
The following discussion and analysis should be read in conjunction with and is qualified in its entirety by reference to our audited and unaudited consolidated financial statements and accompanying notes included elsewhere in this prospectus. Except for historical information, the discussions in this section contain forward-looking statements that involve risks and uncertainties, including, but not limited to, those described in the "Risk Factors" section of this prospectus. Future results could differ materially from those discussed below. See "Cautionary Note Regarding Forward-Looking Statements."
The following discussion is provided to supplement the audited and unaudited consolidated financial statements and the related notes included elsewhere in this prospectus to help provide an understanding of our financial condition, changes in financial condition and results of our operations, and is organized as follows:
- •
- Overview and Executive Summary provides a general description of our
business and the key factors that affect our results of operations.
- •
- Acquisitions provides a summary of our acquisitions during the periods
presented.
- •
- Critical Accounting Policies provides a discussion of our accounting
policies that require critical judgment, assumptions and estimates.
- •
- Results of Operations provides an analysis of our financial performance
and results of operations for the three months ended March 31, 2011 compared to the three months ended March 31, 2010, the year ended December 31, 2010 compared to the year ended
December 31, 2009, and the year ended December 31, 2009 compared to the year ended December 31, 2008.
- •
- Liquidity and Capital Resources provides an overview of our financing,
capital expenditures, cash flows and contractual obligations.
- •
- Recently Issued Accounting Pronouncements provides a brief description of
significant accounting standards which were issued during the periods presented.
- •
- Quantitative and Qualitative Disclosures About Market Risk discusses market risks we face from changes in interest rates, currency exchange rates and commodity prices.
Overview and Executive Summary
We are a leading manufacturer and innovator of low maintenance, premium branded synthetic building products that are replacing wood, wood composites, metal and other materials in the residential, institutional, commercial and industrial end-markets. We operate the following three operating segments:
- •
- AZEK Building Products manufactures exterior building solutions including trim, deck, rail, moulding and porch products
for the residential market;
- •
- Scranton Products produces interior building solutions including bathroom partitions and lockers under the Hiny Hiders,
Resistall and TuffTec labels for the institutional and commercial markets; and
- •
- Vycom manufactures a comprehensive offering of highly-engineered plastic sheet products including Celtec, Seaboard, Playboard, Sanatec, Corrtec and Flametec for special applications in industrial markets.
With a focus on manufacturing excellence and quality over the past 27 years, we have been first to market with a number of high quality synthetic building products that offer a compelling value proposition to our entire supply chain. With the first mover advantage, we have established leading
49
brands and an extensive and growing sales and distribution network targeted towards large markets increasingly converting to low maintenance products that are replacing materials such as wood, wood composites and metal. Through product development initiatives and selected acquisitions, we have increased our product offerings and leveraged our distribution channels to further our penetration of the residential, institutional, commercial and industrial end-markets that we serve. Within the past five years we have expanded our AZEK product line from offering primarily trim to currently offering a broad range of exterior residential building products including trim, deck, rail, moulding and porch. We believe many of our products are still in the early stages of their product life cycles as the material conversion opportunity expands and, for that reason, we invest in downstream marketing initiatives focused on educating key influencers and decision makers on the advantages of our products.
Through our various product offerings, we have exposure to residential new construction and repair and remodeling markets, institutional and commercial construction markets, and various industrial markets. AZEK products are sold into both the residential repair and remodeling market and the residential new construction market. Scranton's fabricated products are sold into various institutional and commercial markets which are impacted by general construction trends that can be influenced by tax receipts of municipalities. Vycom products are sold into several industrial sectors, thereby diversifying sales across sectors sensitive to differing economic factors. In 2010, approximately 47% of our products were sold into the residential repair and remodeling market, 18% into the residential new construction market, 18% into the institutional and commercial construction markets, with the remaining 17% sold into various industrial end-markets. Over 97% of our sales in 2010 were in the United States.
Adverse economic conditions significantly impacted our growth in 2008 and 2009 across all of our end-markets. These conditions, combined with volatile oil and natural gas prices, declining business and consumer confidence, increased unemployment rates and volatile capital and credit markets, had precipitated an economic downturn and severe recession. The downturn adversely affected the demand for our products in our end-markets. This negative effect on demand was exacerbated by a general lowering of inventory levels throughout the supply chain for our products. In 2010 and the first quarter of 2011, our residential and industrial markets saw a modest recovery, while our institutional and commercial markets continued to decline.
Throughout the economic downturn, we have taken a disciplined approach to investing in our business to generate long-term growth while achieving strong profit margins and cash flows. Over the last three years, we strategically invested in a new product development infrastructure to support product launches and bolstered our premium brands through marketing initiatives such as contractor sample kits, display kiosks, product literature, print, TV and radio advertising, tradeshows, internet marketing and social media initiatives, sales training and AZEK University to educate distributors, dealers, architects, contractors and builders on the advantages of our products. In 2008 and 2009, our capital investment primarily consisted of maintenance capital expenditures, while in 2010 and the first quarter of 2011, we expanded our manufacturing capacity to support the volume growth resulting from our successful product launches and marketing initiatives. In addition, our active management of working capital accounts, particularly inventory, has supported our initiative to drive cash flow and maintain ample liquidity for future growth. As a result of these initiatives, our net sales in 2010 increased by 22.7% and, over the last three years, we maintained on average an Adjusted EBITDA margin of approximately 19.5%. See note 2 of "Selected Historical Consolidated Financial Data" for the calculation of Adjusted EBITDA margin and a reconciliation of Adjusted EBITDA to net income (loss).
50
Key Factors Affecting Our Results of Operations
Our results of operations and financial condition are affected by the following factors, which reflect our operating philosophy and continued focus on driving material conversion to our high quality, low maintenance products in each of our end-markets.
Volume of Products Sold. Our net sales are directly impacted by the volume of products sold during any given period, and volume is affected by the following items:
- •
- Economic Conditions: The demand for our products depends, in part, on general economic conditions and
business confidence levels, including the level of economic activity in the end-markets in which we operate.
- •
- Material Conversion: We have continued to increase the sales volume of our products through our focused
efforts to drive material conversion and market penetration of our products. We compete with products made of wood, wood composite, metal and other materials that our low maintenance synthetic
products are designed to replace. We intend to increase conversion and penetration in our markets by educating key influencers and decision makers on the advantages of our products, which in turn
creates pull-through demand for our products.
- •
- Product Innovation: Our sales volume in any particular period may benefit from new product introductions. We
utilize a market-focused and solutions-driven approach to innovation by soliciting feedback from distributors, dealers, contractors, builders, architects and consumers in order to develop products
that appropriately address unmet needs.
- •
- Marketing and Distribution: Demand for our products is influenced by our efforts to expand and enhance awareness of our premium brands. We distribute our products through an extensive and growing multi-channel national distribution network and have developed a tailored sales and distribution strategy focused on educating key influencers and decision makers along the entire supply chain. We supplement the efforts of our sales force with a variety of marketing strategies that include contractor sample kits and display kiosks, product literature, print, TV and radio advertising, tradeshows, internet marketing and social media initiatives, sales training and AZEK University to educate distributors, dealers, architects, contractors and builders on the advantages of our products.
Pricing. In general, our pricing strategy is to price our products at a premium relative to competing materials based on the value proposition they provide, including lower installation, maintenance and life cycle costs. While we believe that our premium brands and leading market positions generally provide us with the ability to raise our prices in response to increases in our cost of sales, during certain of the periods presented herein, we have made strategic decisions not to alter the pricing of our products in reaction to short term fluctuations in our raw material costs. However, our pricing strategy does take into consideration the broader market dynamics within each of our businesses, and we have chosen to offer prices for each of our operating segments as follows:
- •
- AZEK: Prices for our AZEK products are typically set annually, taking into account anticipated changes in
input costs, market dynamics and new product introductions.
- •
- Scranton Products: Because many of our Scranton Products sales are customized by order, these products are
typically priced based on the nature of the particular specifications ordered.
- •
- Vycom: We maintain standard pricing lists for our Vycom products that we review and change periodically.
Given the potential variability in material costs and supply availability, we continually monitor the pricing of our products and may make adjustments accordingly.
51
Cost of Materials. Raw material costs, including resins and other additives, represent a majority of our cost of sales. Over the past five years, material price fluctuations have become increasingly significant due to a variety of issues including constrained supply resulting from natural disasters and foreign demand and domestic economic conditions. We seek to mitigate the effects of fluctuations in our raw material costs by broadening our supplier base, including off-shore suppliers, exploring options for material substitution without sacrificing quality and increasing manufacturing efficiencies. Because we have not generally adjusted the sales price of our products in direct response to fluctuations in raw material costs in the short term, these fluctuations have impacted our results of operations in certain of the periods presented. For additional information, see "—Quantitative and Qualitative Disclosures About Market Risk—Raw Material; Commodity Price Risk."
Product Mix. We offer a wide variety of products across numerous product lines within our three operating segments, and these products are sold at different prices, are composed of different materials and require varying levels of manufacturing complexity. In any particular period, changes in the number of units sold, the amount of pounds sold and the prices and costs of those products, in each case relative to other products, will impact our average selling price per pound and our cost of goods on a per pound basis.
Seasonality. Although we generally have demand for our products throughout the year, our sales have historically been moderately seasonal. We have typically experienced increased sales of our AZEK products in the first quarter of the year as a result of our "early buy" sales program, which encourages dealers to stock our AZEK products through the use of incentive discounts. We have generally experienced decreased sales in the fourth quarter due to adverse weather conditions in certain markets during the winter season. In addition, we have experienced increased sales of our Scranton products in the summer months during which schools are typically closed and therefore are more likely to undergo remodeling activities. With respect to our Vycom products, we have experienced very limited seasonality.
Acquisitions
Throughout our history, we have made selected strategic acquisitions. On February 29, 2008, we acquired 100% of the outstanding stock of Composatron. The former Composatron products were rebranded as AZEK Rail and are manufactured and sold by our AZEK Building Products operating segment.
Basis of Presentation
The consolidated financial statements included elsewhere in this prospectus have been prepared in accordance with GAAP and the rules of the SEC. Our consolidated financial statements include the accounts of CPG International Inc. and its wholly owned subsidiaries. All significant intercompany accounts and transactions have been eliminated in consolidation. Certain reclassifications have been made to conform prior period financial statements to current period financial statement presentation.
Critical Accounting Policies
The preparation of consolidated financial statements in conformity with GAAP requires management to make estimates and judgments that affect the amounts reported in the financial statements. On an ongoing basis, management evaluates its estimates, including those related to revenue recognition, allowance for doubtful accounts, inventories, vendor rebates, product warranties and goodwill and intangible assets. We base our estimates on historical experience and various other assumptions that are believed to be reasonable under the circumstances. Actual results may differ from these estimates under different assumptions or conditions. The following are our major critical accounting policies.
52
Revenue Recognition
We recognize revenue at the time product is shipped to the customer and title transfers if all of the four following conditions are satisfied: (1) persuasive evidence of an arrangement exists; (2) delivery has occurred; (3) the fee is fixed or determinable; and (4) collectability is reasonably assured.
We recognize revenue, net of estimated credits and rebates at the time of delivery. We also estimate the liability for allowance for doubtful accounts based on a current evaluation of experience determined by the stated collection terms and the creditworthiness of account holder. We estimate rebates based on volumes and historical trends. We believe that our estimate for credits, rebates and allowance for doubtful accounts is an accurate reflection of future events. Should actual experience differ from estimates, revisions to the reserves or allowances recorded would be required. However, if these estimates are significantly below the actual amounts, our sales could be adversely impacted.
Allowance for Doubtful Accounts
We extend credit to commercial, institutional, residential and industrial construction customers based on an evaluation of their financial condition, and collateral is generally not required. The evaluation of the customer's financial condition is performed to reduce the risk of loss. We maintain allowances for doubtful accounts for estimated losses resulting from the inability of our customers to make required payments. Our allowance for doubtful accounts is based on management's assessment of the business environment, customers' financial condition, historical collection experience, accounts receivable aging and customer disputes. Past due and delinquent accounts are measured based on the terms specified in the agreements. Any amount that is not paid within the agreed upon terms is considered past due and delinquent. When circumstances arise or a significant event occurs that comes to the attention of management, the allowance is reviewed for adequacy and adjusted to reflect the change in the estimated amount to be received from the customer. Changes in the allowance for doubtful accounts between December 31, 2010 and December 31, 2009 reflect management's assessment of the factors noted above, including past due accounts, disputed balances with customers, and the financial condition of customers. The allowance for doubtful accounts is decreased when uncollectible accounts receivable balances are actually written off. Uncollectable accounts are charged off based on the age of the receivables past due, and management's assessment of the creditworthiness of the account holder.
Inventories
Inventories (mainly, petrochemical resin), are valued at the lower of cost or market, determined on a first-in, first-out basis, or FIFO, and reduced for slow-moving and obsolete inventory.
Inventory obsolescence write-downs are recorded for damaged, obsolete, excess and slow-moving inventory. At the end of each quarter, management within each operating segment performs a detailed review of its inventory on an item by item basis and identifies which products are believed to be obsolete or slow-moving. Management assesses the need for, and the amount of, obsolescence write-down based on customer demand of the item, the quantity of the item on hand and the length of time the item has been in inventory. Write-downs of obsolete inventory are mainly driven by discontinued products and regrind that can no longer be used back into the manufacturing process. The amount of write-downs of obsolete inventory for each of the three years ended December 31, 2010, 2009 and 2008, along with any changes in write-downs from year to year, were less than 1% of cost of sales.
53
Vendor Rebates
Certain vendor rebates and incentives are earned by us only when a specified level of annual purchases is achieved. These vendor rebates are recognized on a systematic and rational allocation of the cash consideration offered to each of the underlying transactions provided the amounts are probable and reasonably estimable. We record the incentives as a reduction to the cost of inventory. Upon sale of inventory, the incentives are recognized as a reduction to cost of sales. We record such incentives during interim periods based on actual results achieved on a year-to-date basis and our expectation that purchase levels will be obtained to earn the rebate.
Product Warranties
We provide warranty guarantees on our Scranton products against breakage, corrosion and delamination. Prior to June 1, 2009, we had provided a 15-year limited warranty on our Scranton products. Beginning June 1, 2009, the warranty on most Scranton products was extended to 25 years for purchases after that date. Scranton Products' new Resistall product line has a 5-year limited warranty. We also provide a 25-year limited warranty on AZEK Trim and AZEK Moulding products, and a lifetime limited warranty on AZEK Deck and AZEK Porch products sold for residential use. The warranty period for all other uses of AZEK Deck and AZEK Porch, including commercial use, is 20 years. AZEK Trim products are guaranteed against manufacturing defects that cause the products to rot, corrode, delaminate, or excessively swell from moisture. The AZEK Deck and AZEK Porch warranties guarantee against manufacturing defects in material and workmanship that result in blistering, peeling, flaking, cracking, splitting, cupping, rotting or structural defects from termites or fungal decay. AZEK Rail products have a 20-year limited warranty for white rail and a 10-year limited warranty for AZEK Premier colored rail. The AZEK Rail warranty also guarantees against rotting, cracking, peeling, blistering or structural defects from fungal decay.
Estimating the required warranty reserves requires a high level of judgment as AZEK Trim products have only been on the market for ten years, AZEK Deck has only been on the market for six years and AZEK Rail has only been on the market for ten years, each of which are early in their product life cycles. Management estimates warranty reserves, based in part upon historical warranty costs, as a proportion of sales by product line. Management also considers various relevant factors, including its stated warranty policies and procedures, as part of its evaluation of its liability. Because warranty issues may surface later in the product life cycle, management continues to review these estimates on a regular basis and considers adjustment to these estimates based on actual experience compared to historical estimates. Although management believes that the warranty reserves at December 31, 2010 are adequate, actual results may vary from these estimates. We currently classify a portion of the warranty reserve as a current liability which appears on the consolidated balance sheet in accrued expenses. The warranty reserve is affected by any additions arising from outstanding claims that will more likely than not be recognized during the period, and actual warranty claims that occurred during the period.
Goodwill, Long-Lived Assets and Other Intangible Assets
We evaluate costs of acquired assets in excess of fair value, or goodwill, and other intangible assets not subject to amortization in accordance with FASB ASC 350. In accordance with the guidance, goodwill and other intangibles not subject to amortization are tested for impairment annually, or when events or circumstances indicate that it is more likely than not that the fair value of a reporting unit is lower than its carrying value. Testing of goodwill to identify potential impairment and calculate the amount of impairment, if any, is performed for three reporting units using a two step process. The first step, which involves estimating the fair value of each reporting unit, is performed by comparing the fair value of the reporting unit to the unit's carrying values, including goodwill allocated to that reporting unit. If the carrying value of the reporting unit exceeds its fair value, the second step of the goodwill
54
impairment test shall be performed to measure the amount of impairment loss, if any. Under step two, the implied fair value of goodwill, calculated as the difference between the fair value of the reporting unit and the fair value of the net assets of the reporting unit, is compared to the carrying value of goodwill. The excess of the carrying value of goodwill over the implied fair value of goodwill represents the amount impaired.
We evaluate goodwill for impairment annually at December 31. The significant estimates and assumptions used by management in assessing each reporting unit's fair value and the recoverability of goodwill is based on the estimated discounted future cash flows of that unit. Our approach is based on each reporting unit's projection of operating results and cash flows that are discounted using our weighted average cost of capital. The basis of our cash flow assumptions includes historical and forecasted revenue, operating costs, and other relevant factors including estimated cash expenditures. Assumptions under this method included a discount rate of approximately 11.8%, and annual revenue growth rates consistent with historical trends, with consideration of current economic trends, ranging from 5.5% to 34.6%, relative to specific products lines, as well as increases in operating costs relative to the increases in revenues over five years. We further assume a terminal growth rate after five years of approximately 3.5% to 4%, based upon the estimated growth of individual products and their projected growth cycles.
As of December 31, 2010 and 2009, we completed our annual evaluation of potential impairment of goodwill and determined that no impairment of goodwill existed. We believe that the fair value of each reporting unit substantially exceeded its carrying value. In addition, we were not aware of any events or circumstances that would indicate an impairment loss. Factors that were considered included: adverse change in operating results, decline in strategic business plans, and significantly lower future cash flows.
As of December 31, 2008, we determined that the fair value of each of our reporting units was below their respective carrying amounts. Accordingly, we recorded a non-cash goodwill impairment charge of $36.0 million for the year ended December 31, 2008, representing our best estimate of the impairment charge at the time. Approximately $11.0 million, $15.4 million and $9.6 million of the estimate was allocated to the AZEK Building Products, Scranton Products and Vycom operating segments, respectively. We finalized our goodwill impairment analysis during the first quarter of 2009 and an additional non-cash goodwill impairment charge of $14.4 million was recorded in our condensed consolidated financial statements for the three months ended March 31, 2009. Approximately $14.9 million of the additional impairment was recorded to AZEK Building Products, a reduction of $3.3 million was recorded to the Scranton Products operating segment and $2.8 million of the additional impairment was recorded to Vycom. The additional impairment was not a result of further deterioration in the business, but the completion of the required analysis.
We consider our trademark intangible, or Trademark, assets as indefinite-life intangible assets that do not require amortization. Rather, these intangible assets are tested at least annually for impairment, or more frequently if events or circumstances indicate that the asset might be impaired, by comparing the fair value of the Trademark assets to their carrying amount. If the carrying amounts of the Trademark assets were to exceed their fair value, an impairment loss would be recognized. As of December 31, 2010 and 2009, the fair value of the Trademark assets exceeded its carrying amount, and no impairment was recognized. As of December 31, 2008, the carrying amount of the Trademark assets exceeded their fair value and a $4.0 million impairment charge was recorded to our Scranton Products operating segment for the year ended December 31, 2008. The annual evaluation of indefinite-life intangible assets requires the use of estimates about future operating revenues and an avoided royalty rate for each reporting unit in determination of the estimated fair values. Changes in forecasted revenues could materially affect these estimates.
We evaluate potential impairment of amortizable intangible assets and long-lived tangible assets whenever events or circumstances indicate that the carrying value of the assets may not be recoverable.
55
Amortizable intangible assets and long-lived tangible assets include customer relationships, non-compete agreements, proprietary knowledge and fixed assets. In the event that these assets are impaired, which we would determine based on undiscounted cash flows, losses would be recognized to the extent the carrying value exceeds the fair value. Such an impairment loss would be calculated based upon the discounted future cash flows expected to result from the use of the asset, and would be recognized as a non-cash component of operating income.
We amortize the following intangible assets over the time periods indicated: customer relationships (over 10 years); non-compete agreements (over 5 years) and proprietary knowledge (over 15 years). Certain of our intangible assets are amortized on an accelerated basis over the useful lives of those assets. See Note 6 to our audited consolidated financial statements included elsewhere in this prospectus for more detail regarding goodwill and intangible assets.
Share-Based Compensation
Holdings, the owner of 100% of our common stock prior to the completion of this offering, established a Class B Unit equity program, which offers our executive officers and certain of our key managers and employees the opportunity to purchase limited partnership units in Holdings. These equity units in Holdings are intended to allow each employee participant to share in the value created at the time the current owners sell or otherwise exit the business based upon the number of limited partnership units held in Holdings by the participants when the sale or exit transaction is completed.
The chosen valuation methodology used to determine the fair value of the Class B Unit equity program is the probability-weighted expected return method, or PWERM, as detailed by the American Institute of Certified Public Accountants. Under the PWERM method, the value of Class B Units is estimated based upon an analysis of future values for the enterprise assuming various future outcomes. Accordingly, Class B Unit value is based upon the probability-weighted present value of expected future investment returns, considering each of the estimated potential future outcomes, as well as the rights of each unit class. The future outcomes we considered were: an initial public offering, or IPO; a merger or sale to a strategic acquirer; a sale to a financial buyer; distressed sale in a housing downturn; and a longer-term hold period. In arriving at the value of the Class B Units, management considered many factors and assumptions including: our current and historical financial performance; our expected future financial performance; our financial condition at the grant date; the liquidation rights of our equity holders; the illiquidity of our equity units; the condition of and outlook for our industry; the business risks inherent in our business; and risks of comparable publicly-traded companies.
The PWERM method was applied for the years ended December 31, 2010 and 2009, and due to the increasing enterprise value and the resulting impact of the Class B Units, in accordance with the terms of the limited partnership agreement of Holdings, the Class B Units significantly increased in value in 2010 as compared to 2009. Class B Units are highly sensitive to changes in enterprise value, due to the preferential return on Class A Units, as provided by the limited partnership agreement. The inputs that can significantly impact the value of the Class B Units are as follows:
- •
- Increased earnings of our company;
- •
- Increase in the multiples of public comparables used to determine the valuation in the various exit scenarios;
- •
- Changes in the probability of various scenarios towards higher valuation outcomes; and
- •
- Discount and illiquidity rates.
The probability of occurrence for the different exit scenarios was 25% and 15% for an IPO for the years ended December 31, 2010 and 2009, respectively; 25% each for the merger or sale to a strategic acquirer and sale to a financial buyer for each of the years ended December 31, 2010 and 2009; 15% and 25% for a distressed sale in a housing downturn for the years ended December 31, 2010 and 2009,
56
respectively; and 10% for the longer-term hold period for each of the years ended December 31, 2010 and 2009. From December 31, 2009 to December 31, 2010, the illiquidity discount rate and the discount rate decreased from 35% to 25% and from 25% to 16%, respectively, due to the proximity of the valuation date associated with the anticipated exit scenarios.
Following the completion of this offering, Holdings intends to distribute to all of the holders of the Class A Units and the Class B Units all the remaining shares of our common stock that it holds at such time, in accordance with and as contemplated by the limited partnership agreement of Holdings. After that distribution, Holdings will be dissolved, and former holders of the Class A Units and the Class B Units will then directly hold shares of our common stock. See "Prospectus Summary—The Offering." In connection with this offering, we intend to adopt an equity incentive plan in respect of our common stock. We expect to grant equity-based compensation awards under that plan after this offering. See "Compensation Discussion and Analysis—Elements of Compensation."
Income Taxes
We account for income taxes using the asset and liability method. Under this method, deferred tax assets and liabilities are determined based upon differences between the financial reporting and the tax basis of assets and liabilities and are measured using the enacted tax rates expected to apply to taxable income in the periods in which the deferred tax assets or liabilities are expected to be realized or settled. A valuation allowance is established when it is more likely than not that all or a portion of a deferred tax asset will not be realized.
At December 31, 2010, the valuation allowance represents a full valuation allowance against U.S. federal net deferred tax assets, and certain net state deferred tax assets other than deferred tax liabilities related to indefinite-lived assets, which cannot be used to support the realization of the existing deferred tax assets. We consider all sources of taxable income in estimating its valuation allowances, including taxable income in any available carry back period; the reversal of taxable temporary differences; tax-planning strategies; and taxable income expected to be generated in the future other than reversing temporary differences. While we have concluded that it is more likely than not that the majority of our net deferred tax assets will not be utilized, if we are able to demonstrate continued profitability combined with the favorable impact of the February 2011 refinancing, then we may reverse our valuation allowance in the future.
Results of Operations
Three Months Ended March 31, 2011 Compared with Three Months Ended March 31, 2010
The following table summarizes certain financial information relating to our operating results that have been derived from our consolidated financial statements for the three months ended March 31, 2011 and 2010. Also included is certain information relating to the operating results as a percentage of
57
net sales. We believe this presentation is useful to investors in comparing historical results. Certain percentages in the table may not add up to 100.0% due to the rounding of individual components.
| |
Three Months Ended March 31, | ||||||||||||||||||
|---|---|---|---|---|---|---|---|---|---|---|---|---|---|---|---|---|---|---|---|
| (Dollars in thousands) |
2011 | % Of Net Sales |
2010 | % Of Net Sales |
$ Variance |
% Variance |
|||||||||||||
Net sales |
$ | 114,622 | 100.0 | % | $ | 94,667 | 100.0 | % | $ | 19,955 | 21.1 | % | |||||||
Cost of sales |
81,276 | 70.9 | 65,098 | 68.8 | 16,178 | 24.9 | |||||||||||||
Gross profit |
33,346 | 29.1 | 29,569 | 31.2 | 3,777 | 12.8 | |||||||||||||
Selling, general and administrative expenses |
15,529 | 13.5 | 14,395 | 15.2 | 1,134 | 7.9 | |||||||||||||
Loss on disposal of property |
12 | — | — | — | 12 | 100.0 | |||||||||||||
Impairment of long-lived assets |
— | — | 599 | 0.6 | (599 | ) | (100.0 | ) | |||||||||||
Loss on debt extinguishment |
7,339 | 6.4 | — | — | 7,339 | 100.0 | |||||||||||||
Interest expense, net |
6,682 | 5.8 | 7,471 | 7.9 | (789 | ) | (10.6 | ) | |||||||||||
Foreign currency gain |
14 | — | 78 | 0.1 | (64 | ) | (82.1 | ) | |||||||||||
Miscellaneous—income |
— | — | 7 | — | (7 | ) | (100.0 | ) | |||||||||||
Income tax benefit (expense) |
734 | 0.6 | (3,998 | ) | (4.2 | ) | 4,732 | 118.4 | |||||||||||
Net income |
$ | 4,532 | 4.0 | % | $ | 3,191 | 3.4 | % | $ | 1,341 | 42.0 | % | |||||||
Net Sales. Net sales were $114.6 million for the three month ended March 31, 2011, an increase of $19.9 million, or 21.1%, from $94.7 million for the three months ended March 31, 2010. The increase was largely attributable to an increase in net sales at AZEK Building Products and Vycom of 24.0% and 39.4% respectively, offset by a decrease in Scranton Products net sales of 11.7%. The residential repair and remodeling market and the industrial market modestly improved relative to the prior year, while the institutional and commercial construction markets continued to decline. In addition to the moderately recovering end-markets, new product launches and our sales and marketing initiatives also contributed to increased sales. Overall, we sold 80.9 million pounds of product during the three months ended March 31, 2011, which was a 21.9% increase from the 66.4 million pounds sold during the three months ended March 31, 2010. Volume growth in AZEK and Vycom more than offset volume declines at Scranton Products. Average selling price per pound across our company for the three months ended March 31, 2011 decreased to $1.42 from $1.43 for the same period of 2010, primarily due to changes in product mix, which more than offset price increases.
Cost of Sales. Cost of sales increased by $16.2 million, or 24.9%, to $81.3 million for the three months ended March 31, 2011 from $65.1 million for the same period in 2010. The increase was primarily attributable to the increase in volume and higher average material costs, and was only partially offset by increased operational efficiencies. Based on market indices, the weighted average market cost for the types of resin that we use increased by approximately 5.5% for the three months ended March 31, 2011 compared to the same period of 2010.
Gross Profit. Gross profit increased by $3.7 million, or 12.8%, to $33.3 million for the three months ended March 31, 2011 from $29.6 million for the same period of 2010. Gross profit as a percent of net sales decreased to 29.1% for the three months ended March 31, 2011 from 31.2% for the same period in 2010. This decrease was mainly attributable to an increase in material costs.
Selling, General and Administrative Expenses. Selling, general and administrative expenses increased by $1.1 million, or 7.9%, to $15.5 million, or 13.5% of net sales for the three months ended March 31, 2011 from $14.4 million or 15.2% of net sales for the same period in 2010. The increase in selling, general and administrative expenses was primarily attributable to an increase in expenses related to our debt refinancing and legal and professional fees, partially offset by a decrease in bad debt expense.
58
Impairment of Long-Lived Assets. Impairment of long-lived assets was $0.6 million for the three months ended March 31, 2010, resulting from the planned disposition of manufacturing equipment related to our Canadian manufacturing facility consolidation. No impairment existed for the three months ended March 31, 2011.
Loss on Debt Extinguishment. Loss on debt extinguishment was $7.3 million for the three months ended March 31, 2011, which resulted from the debt refinancing that occurred on February 18, 2011.
Interest Expense, net. Interest expense, net, decreased by $0.8 million, or 10.6%, to $6.7 million for the three months ended March 31, 2011 from $7.5 million for the same period in 2010. Interest expense declined primarily due to lower variable interest rates in the first quarter of 2011 as compared to the same period in 2010, as a result of the debt refinancing.
Income Taxes. Income tax expense decreased by $4.7 million to a benefit of $0.7 million for the three months ended March 31, 2011 from $4.0 million for the same period in 2010. Income tax expense decreased primarily due to the impact of a discrete tax benefit of $2.9 million related to the charges associated with the debt extinguishment recorded in the first quarter 2011 and due to a discrete tax benefit of $1.6 million resulting from the reversal of the valuation allowance associated with federal deferred tax assets, offset by a discrete charge of $0.8 million associated with a tax rate adjustment with respect to net federal temporary differences. Income tax expense for the first quarter of 2010 was primarily attributable to deferred tax expense associated with indefinite-lived assets.
Net Income. Net income increased by $1.3 million to net income of $4.5 million for the three months ended March 31, 2011 from $3.2 million for the comparable period in 2010, as a result of reasons described above, offset by the loss on debt extinguishment.
Year Ended December 31, 2010 Compared with Year Ended December 31, 2009
The following table summarizes certain financial information relating to our operating results that have been derived from our consolidated financial statements for the years ended December 31, 2010 and 2009. Also included is certain information relating to the operating results as a percentage of net sales. We believe this presentation is useful to investors in comparing historical results. Certain percentages in the table may not add up to 100.0% due to the rounding of individual components.
| (Dollars in thousands) |
Year Ended December 31, 2010 |
% Of 2010 Net Sales |
Year Ended December 31, 2009 |
% Of 2009 Net Sales |
$ Variance |
% Variance |
|||||||||||||
|---|---|---|---|---|---|---|---|---|---|---|---|---|---|---|---|---|---|---|---|
Net sales |
$ | 327,535 | 100.0 | % | $ | 266,875 | 100.0 | % | $ | 60,660 | 22.7 | % | |||||||
Cost of sales |
226,670 | 69.2 | 173,328 | 64.9 | 53,342 | 30.8 | % | ||||||||||||
Gross profit |
100,865 | 30.8 | 93,547 | 35.1 | 7,318 | 7.8 | % | ||||||||||||
Selling, general and administrative expenses |
56,489 | 17.2 | 57,392 | 21.5 | (903 | ) | (1.6 | )% | |||||||||||
Lease termination expense |
— | — | 657 | 0.2 | (657 | ) | (100.0 | )% | |||||||||||
Loss on disposal of property |
336 | 0.1 | 525 | 0.2 | (189 | ) | (36.0 | )% | |||||||||||
Impairment of goodwill and long-lived assets |
599 | 0.2 | 14,408 | 5.4 | (13,809 | ) | (95.8 | )% | |||||||||||
Interest expense, net |
30,854 | 9.4 | 31,347 | 11.7 | (493 | ) | (1.6 | )% | |||||||||||
Foreign currency gain |
92 | — | 336 | 0.1 | (244 | ) | (72.6 | )% | |||||||||||
Miscellaneous—income |
243 | 0.1 | 29 | — | 214 | 737.9 | % | ||||||||||||
Income tax (expense) benefit |
(3,569 | ) | (1.1 | ) | 111 | — | (3,680 | ) | (3,315.3 | )% | |||||||||
Net income (loss) |
$ | 9,353 | 2.9 | % | $ | (10,306 | ) | (3.9 | )% | $ | 19,659 | 190.8 | % | ||||||
Net Sales. Net sales were $327.5 million for the year ended December 31, 2010, an increase of $60.7 million, or 22.7%, from $266.9 million for the year ended December 31, 2009, largely attributable
59
to an increase in net sales at AZEK Building Products and Vycom of 30.3% and 52.9% respectively, offset by a decrease in Scranton Products net sales of 12.9%. The residential and industrial markets modestly improved relative to the prior year, while the institutional and commercial construction markets continued to decline. In addition to the moderately recovering end-markets, new product launches and our sales and marketing initiatives also contributed to increased sales. Overall, we sold 220.6 million pounds of product during the year ended December 31, 2010, which was a 23.6% increase from the 178.5 million pounds sold during the year ended December 31, 2009. Volume growth in AZEK and Vycom more than offset volume declines at Scranton Products. Average selling price per pound across our company for the year ended December 31, 2010 decreased to $1.49 from $1.50 for the same period of 2009, primarily due to changes in product mix.
Cost of Sales. Cost of sales increased by $53.3 million, or 30.8%, to $226.7 million for the year ended December 31, 2010 from $173.3 million for the same period in 2009. The increase was primarily attributable to the increase in volume as well as higher average material costs and was only partially offset by increased operational efficiencies. Based on market indices, the weighted average market cost for the types of resin that we use increased by approximately 18.2% for the year ended December 31, 2010 compared to the same period of 2009.
Gross Profit. Gross profit increased by $7.3 million, or 7.8%, to $100.9 million for the year ended December 31, 2010 from $93.5 million for the same period of 2009. Gross profit as a percent of net sales decreased to 30.8% for the year ended December 31, 2010 from 35.1% for the same period in 2009. This decrease was mainly attributable to an increase in material costs.
Selling, General and Administrative Expenses. Selling, general and administrative expenses decreased by $0.9 million, or 1.6%, to $56.5 million, or 17.2% of net sales, for the year ended December 31, 2010 from $57.4 million, or 21.5% of net sales, for the same period in 2009. The decrease in selling, general and administrative expenses was primarily attributable to a decrease in marketing expenses of $1.7 million, offset by an increase in salary expense.
Lease Termination Expense. Lease termination expense was $0.7 million, or 0.2% of net sales, for the year ended December 31, 2009. This represented the required termination costs to consolidate our administrative offices into one of our manufacturing facilities in Pennsylvania as well as to consolidate our Canadian manufacturing facilities. There was no such expense during 2010.
Impairment of Goodwill and Long-Lived Assets. Impairment of long-lived assets was $0.6 million for the year ended December 31, 2010, resulting from the planned disposition of manufacturing equipment related to our Canadian manufacturing facility consolidation. Impairment of goodwill was $14.4 million for the year ended December 31, 2009, resulting from the finalization of our step 2 goodwill impairment analysis for 2008, during the first quarter of 2009. There was no impairment of goodwill during 2010.
Interest Expense, net. Interest expense, net, decreased by $0.5 million, or 1.6%, to $30.9 million for the year ended December 31, 2010 from $31.3 million for the same period in 2009. Interest expense declined primarily due to lower variable interest rates in 2010 from 2009.
Income Taxes. Income tax expense increased by $3.7 million to $3.6 million for the year ended December 31, 2010 from a benefit of $0.1 million for the same period in 2009. Income tax expense increased primarily due to an increase in deferred tax expense associated with indefinite-lived assets. Deferred tax liabilities associated with such indefinite-lived assets cannot be used to support the realization of existing deferred tax assets, for which valuation allowances have been provided. The deferred tax expense associated with such indefinite-lived assets is the primary component of deferred tax expense, and was favorably impacted in 2009 due to the impairment charge recorded in 2009, and favorable deferred tax rate adjustments due to legislation enacted in 2009. Income tax expense also increased as a result of the increase in pretax income in 2010.
60
Net Income. Net income increased by $19.7 million to net income of $9.4 million for the year ended December 31, 2010 from a net loss of $10.3 million for the comparable period in 2009, as a result of reasons described above, most notably from the goodwill impairment expense that did not recur in 2010.
Year Ended December 31, 2009 Compared with Year Ended December 31, 2008
The following table summarizes certain financial information relating to our operating results that have been derived from our consolidated financial statements for the years ended December 31, 2009 and 2008. Also included is certain information relating to the operating results as a percentage of net sales. We believe this presentation is useful to investors in comparing historical results. Certain percentages in the table may not add up to 100.0% due to the rounding of individual components.
| (Dollars in thousands) |
Year Ended December 31, 2009 |
% Of 2009 Net Sales |
Year Ended December 31, 2008 |
% Of 2008 Net Sales |
$ Variance |
% Variance |
|||||||||||||
|---|---|---|---|---|---|---|---|---|---|---|---|---|---|---|---|---|---|---|---|
Net sales |
$ | 266,875 | 100.0 | % | $ | 305,240 | 100.0 | % | $ | (38,365 | ) | (12.6 | )% | ||||||
Cost of sales |
173,328 | 64.9 | 235,099 | 77.0 | (61,771 | ) | (26.3 | )% | |||||||||||
Gross profit |
93,547 | 35.1 | 70,141 | 23.0 | 23,406 | 33.4 | % | ||||||||||||
Selling, general and administrative expenses |
57,392 | 21.5 | 50,644 | 16.6 | 6,748 | 13.3 | % | ||||||||||||
Lease termination expense |
657 | 0.2 | — | — | 657 | 100.0 | % | ||||||||||||
(Loss) gain on disposal of property |
(525 | ) | (0.2 | ) | 21 | — | (546 | ) | (2,600.0 | )% | |||||||||
Impairment of goodwill and long-lived assets |
14,408 | 5.4 | 40,000 | 13.1 | (25,592 | ) | (64.0 | )% | |||||||||||
Interest expense, net |
31,347 | 11.7 | 34,905 | 11.4 | (3,558 | ) | (10.2 | )% | |||||||||||
Foreign currency gain (loss) |
336 | 0.1 | (215 | ) | (0.1 | ) | 551 | 256.3 | % | ||||||||||
Miscellaneous—income |
29 | — | 153 | 0.1 | (124 | ) | (81.0 | )% | |||||||||||
Income tax benefit |
111 | — | 7,095 | 2.3 | (6,984 | ) | (98.4 | )% | |||||||||||
Net loss |
$ | (10,306 | ) | (3.9 | )% | $ | (48,354 | ) | (15.8 | )% | $ | 38,048 | 78.7 | % | |||||
Net Sales. Net sales were $266.9 million for the year ended December 31, 2009, a decrease of $38.4 million, or 12.6%, from $305.2 million for the year ended December 31, 2008. For the year ended December 31, 2009, AZEK Building Products net sales decreased 9.3%, Scranton Products net sales decreased 11.6% and Vycom net sales decreased 25.9% compared to the year ended December 31, 2008. Average selling price per pound across our company for the year ended December 31, 2009 increased to $1.50 from $1.46 for the same period of 2008, primarily due to changes in product mix. Overall, we sold 178.5 million pounds of product during the year ended December 31, 2009, which was a 14.6% decrease from the 209.1 million pounds sold during the year ended December 31, 2008. The slowdown in our end-markets continued throughout 2009.
Cost of Sales. Cost of sales decreased by $61.8 million, or 26.3%, to $173.3 million for the year ended December 31, 2009 from $235.1 million for the same period in 2008. The decrease was primarily attributable to the decline in volume as well as lower average material costs for the year ended December 31, 2009 compared to the same period in 2008. Based on market indices, the weighted average market cost for the types of resin that we use decreased by approximately 7.2% for the year ended December 31, 2009 compared to the same period in 2008.
Gross Profit. Gross profit increased by $23.4 million, or 33.4%, to $93.5 million for the year ended December 31, 2009 from $70.1 million for the same period of 2008. Gross profit as a percent of
61
net sales increased to 35.1% for the year ended December 31, 2009 from 23.0% for the same period in 2008. This increase was mainly attributable to the decrease in material costs.
Selling, General and Administrative Expenses. Selling, general and administrative expenses increased by $6.8 million, or 13.3%, to $57.4 million, or 21.5% of net sales, for the year ended December 31, 2009 from $50.6 million, or 16.6% of net sales, for the same period in 2008. The increase in selling, general and administrative expenses was primarily attributable to increased selling and marketing costs of $2.8 million and higher incentive compensation of $2.0 million.
Lease Termination Expense. Lease termination expense was $0.7 million, or 0.2% of net sales, for the year ended December 31, 2009. This represents the required termination costs to consolidate our administrative offices into one of our manufacturing facilities in Pennsylvania as well as to consolidate our Canadian manufacturing facilities.
Loss on Sale of Property. Loss on sale of property was $0.5 million, or 0.2% of net sales, for the year ended December 31, 2009. This loss resulted from disposal of fixed assets.
Impairment of Goodwill and Long-Lived Assets. Impairment of goodwill was $14.4 million, or 5.4% of net sales, for the year ended December 31, 2009, which resulted from the finalization of our step 2 impairment analysis for 2008, during the first quarter of 2009. This is compared to $40.0 million, or 13.1% of net sales, for the year ended December 31, 2008, resulting from the write-down of goodwill and trademarks in the fourth quarter as a result of depressed market conditions. The additional impairment loss was not a result of further deterioration of the business, but the completion of the required analysis.
Interest Expense, net. Interest expense, net, decreased by $3.6 million, or 10.2%, to $31.3 million for the year ended December 31, 2009 from $34.9 million for the same period in 2008. Interest expense declined due to lower variable interest in 2009 from 2008, and the write-off of approximately $469,000 of deferred financing costs attributable to our previous credit facility that were included in interest expense for the year ended December 31, 2008.
Income Taxes. Income tax benefit decreased by $7.0 million, or 98.4%, to a benefit of $0.1 million for the year ended December 31, 2009 from a benefit of $7.1 million for the same period in 2008. Income tax benefit decreased primarily due to a reduction in the year over year pretax loss, offset in part by a decrease in nondeductible impairment charges, and a lower net increase in the valuation allowance against net deferred tax assets other than deferred tax liabilities related to indefinite-lived assets (which cannot be used to support the realization of existing deferred tax assets).
Net Loss. Net loss decreased by $38.0 million to a net loss of $10.3 million for the year ended December 31, 2009 from a net loss of $48.4 million for the comparable period in 2008 as a result of reasons described above, particularly from the lower average resin costs as well as from decreased impairment expense.
Segment Results of Operations
Beginning in the third quarter of 2009, we realigned our industrial business, previously included in the AZEK Building Products and Scranton Products segments, into a third segment referred to as Vycom to reinforce it as a single, standalone entity, providing non-fabricated branded sheet to national distributors. Segment results for the year ended December 31, 2008, have been updated to conform to this organizational change.
62
AZEK Building Products—Three Months Ended March 31, 2011 Compared with Three Months Ended March 31, 2010
The following table summarizes certain financial information relating to the AZEK Building Products segment results that have been derived from our consolidated financial statements for the three months ended March 31, 2011 and 2010:
| |
Three Months Ended March 31, | |
|
||||||||||
|---|---|---|---|---|---|---|---|---|---|---|---|---|---|
| |
$ Variance |
% Variance |
|||||||||||
| (Dollars in thousands) |
2011 | 2010 | |||||||||||
Net sales |
$ | 85,415 | $ | 68,892 | $ | 16,523 | 24.0 | % | |||||
Cost of sales |
59,976 | 47,082 | 12,894 | 27.4 | |||||||||
Gross profit |
25,439 | 21,810 | 3,629 | 16.6 | |||||||||
Selling, general and administrative expenses |
7,829 | 7,546 | 283 | 3.8 | |||||||||
Impairment of long-lived assets |
— | 599 | (599 | ) | (100.0 | ) | |||||||
Loss on disposal of property |
12 | — | 12 | 100.0 | |||||||||
Segment operating income |
$ | 17,598 | $ | 13,665 | $ | 3,933 | 28.8 | % | |||||
Net Sales. Net sales increased by $16.5 million, or 24.0%, to $85.4 million for the three months ended March 31, 2011 from $68.9 million for the same period in 2010. The increase in net sales was driven by modest recovery in the repair and renovation market, new product introductions and our sales and marketing initiatives, all of which favorably impacted demand for our AZEK products. Average selling price per pound for the three months ended March 31, 2011 was $1.35 as compared to $1.36 for the same period of 2010, primarily due to increased rebate incentives and changes in product mix. We sold 63.3 million pounds of product during the three months ended March 31, 2011, which was a 25.4% increase from the 50.5 million pounds sold during the comparable period in 2010.
Cost of Sales. Cost of sales increased by $12.9 million, or 27.4%, to $60.0 million for the three months ended March 31, 2011 from $47.1 million for the same period of 2010. The increase was primarily attributable to higher volumes as well as an increase in average resin costs, partially offset by increased operational efficiencies. Based on market indices, the market cost for PVC resin increased by approximately 4.7% for the three months ended March 31, 2011 compared to the same period in 2010.
Gross Profit. Gross profit increased by $3.6 million, or 16.6%, to $25.4 million for the three months ended March 31, 2011 from $21.8 million for the same period in 2010. Gross profit as a percent of net sales was 29.8% for the three months ended March 31, 2011 compared to 31.7% for the same period in 2010. This decrease was primarily attributable to increased material costs.
Selling, General and Administrative Expenses. Selling, general and administrative expenses increased by $0.3 million, or 3.8%, to $7.8 million for the three months ended March 31, 2011 from $7.5 million for the same period in 2010. As a percentage of net sales, selling, general and administrative expenses decreased to 9.2% for the three months ended March 31, 2011 from 11.0% for the same period in 2010. The increase in selling, general and administrative expenses was primarily attributable to an increase in marketing expense as a result of new product launches and marketing initiatives, an increase in selling expense and professional fees partially offset by a decrease in bad debt expense.
Impairment of Long-Lived Assets. Impairment of long-lived assets was $0.6 million for the three months ended March 31, 2010, resulting from the planned disposition of manufacturing equipment related to our Canadian manufacturing facility consolidation. There was no impairment for the three months ended March 31, 2011.
63
Operating Income. Operating income increased by $3.9 million to $17.6 million for the three months ended March 31, 2011 from $13.7 million for the comparable period in 2010, primarily due to an increase in sales.
AZEK Building Products—Year Ended December 31, 2010 Compared with Year Ended December 31, 2009
The following table summarizes certain financial information relating to the AZEK Building Products segment results that have been derived from our consolidated financial statements for the years ended December 31, 2010 and 2009:
| |
Year Ended December 31, | |
|
||||||||||
|---|---|---|---|---|---|---|---|---|---|---|---|---|---|
| |
$ Variance |
% Variance |
|||||||||||
| (Dollars in thousands) |
2010 | 2009 | |||||||||||
Net sales |
$ | 213,413 | $ | 163,775 | $ | 49,638 | 30.3 | % | |||||
Cost of sales |
145,780 | 107,703 | 38,077 | 35.4 | % | ||||||||
Gross profit |
67,633 | 56,072 | 11,561 | 20.6 | % | ||||||||
Selling, general and administrative expenses |
28,908 | 28,384 | 524 | 1.8 | % | ||||||||
Lease termination expense |
— | 413 | (413 | ) | (100.0 | )% | |||||||
Impairment of goodwill and long-lived assets |
599 | 14,912 | (14,313 | ) | (96.0 | )% | |||||||
Loss on disposal of property |
254 | 282 | (28 | ) | (9.9 | )% | |||||||
Segment operating income |
$ | 37,872 | $ | 12,081 | $ | 25,791 | 213.5 | % | |||||
Net Sales. Net sales increased by $49.6 million, or 30.3%, to $213.4 million for the year ended December 31, 2010 from $163.8 million for the same period in 2009. The increase in net sales was driven by a general improvement in the overall economic environment, new product introductions and our sales and marketing initiatives, all of which favorably impacted demand for our AZEK products. Average selling price per pound for the year ended December 31, 2010 was $1.41 as compared to $1.34 for the same period of 2009 primarily due to changes in product mix. We sold 151.2 million pounds of product during the year ended December 31, 2010, which was a 23.3% increase from the 122.6 million pounds sold during the comparable period in 2009.
Cost of Sales. Cost of sales increased by $38.1 million, or 35.4%, to $145.8 million for the year ended December 31, 2010 from $107.7 million for the same period of 2009. The increase was primarily attributable to higher volumes as well as an increase in average resin costs, partially offset by increased operational efficiencies. Based on market indices, the market cost for PVC resin increased by approximately 24.0% for the year ended December 31, 2010 compared to the same period in 2009.
Gross Profit. Gross profit increased by $11.6 million, or 20.6%, to $67.6 million for the year ended December 31, 2010 from $56.1 million for the same period in 2009. Gross profit as a percent of net sales was 31.7% for the year ended December 31, 2010 compared to 34.2% for the same period in 2009. This decrease was primarily attributable to increased material costs.
Selling, General and Administrative Expenses. Selling, general and administrative expenses increased by $0.5 million, or 1.8%, to $28.9 million, or 13.5% of net sales, for the year ended December 31, 2010 from $28.4 million, or 17.3% of net sales, for the same period in 2009. The increase in selling, general and administrative expenses was primarily attributable to higher compensation, legal and bad debt expense offset by lower marketing expenses.
Lease Termination Expense. Lease termination expense was $0.4 million for the year ended December 31, 2009, which represented the termination costs to consolidate our Canadian manufacturing facilities. There was no such expense during 2010.
Impairment of Goodwill and Long-Lived Assets. Impairment of long-lived assets was $0.6 million for the year ended December 31, 2010, resulting from the planned disposition of manufacturing
64
equipment related to our Canadian manufacturing facility consolidation. Impairment of goodwill was $14.9 million, or 9.1% of net sales, for the year ended December 31, 2009 which resulted from the finalization of our step 2 impairment analysis for 2008, in the first quarter of 2009. The additional impairment loss was not a result of further deterioration of the business, but the completion of the required analysis of 2008. There was no impairment of goodwill during 2010.
Operating Income. Operating income increased by $25.8 million to $37.9 million for the year ended December 31, 2010 from $12.1 million for the comparable period in 2009, primarily due to the goodwill impairment expense that did not occur in 2010 and the increase in sales.
AZEK Building Products—Year Ended December 31, 2009 Compared with Year Ended December 31, 2008
The following table summarizes certain financial information relating to the AZEK Building Products segment results that have been derived from our consolidated financial statements for the years ended December 31, 2009 and 2008:
| |
Year Ended December 31, | |
|
||||||||||
|---|---|---|---|---|---|---|---|---|---|---|---|---|---|
| |
$ Variance |
% Variance |
|||||||||||
| (Dollars in thousands) |
2009 | 2008 | |||||||||||
Net sales |
$ | 163,775 | $ | 180,536 | $ | (16,761 | ) | (9.3 | )% | ||||
Cost of sales |
107,703 | 140,909 | (33,206 | ) | (23.6 | )% | |||||||
Gross profit |
56,072 | 39,627 | 16,445 | 41.5 | % | ||||||||
Selling, general and administrative expenses |
28,384 | 24,128 | 4,256 | 17.6 | % | ||||||||
Lease termination expense |
413 | — | 413 | 100.0 | % | ||||||||
Impairment of goodwill and long-lived assets |
14,912 | 10,946 | 3,966 | 36.2 | % | ||||||||
(Loss) gain on disposal of property |
(282 | ) | 21 | (303 | ) | (1,442.9 | )% | ||||||
Segment operating income |
$ | 12,081 | $ | 4,574 | $ | 7,507 | 164.1 | % | |||||
Net Sales. Net sales decreased by $16.8 million, or 9.3%, to $163.8 million for the year ended December 31, 2009 from $180.5 million for the same period in 2008. During 2009, there was a slowdown in the residential end-markets and general economic activities. Average selling price per pound for the year ended December 31, 2009 was $1.34 as compared to $1.26 for the same period of 2008 primarily due to changes in product mix. We sold 122.6 million pounds of product during the year ended December 31, 2009, which was a 14.6% decrease from the 143.6 million pounds sold during the comparable period in 2008.
Cost of Sales. Cost of sales decreased by $33.2 million, or 23.6%, to $107.7 million for the year ended December 31, 2009 from $140.9 million for the same period of 2008. The decrease was primarily attributable to lower volumes as well as a decrease in average material costs for the year ended December 31, 2009 compared to the same period in 2008. Based on market indices, the market cost for PVC resin decreased by approximately 8.1% for the year ended December 31, 2009 compared to the same period in 2008.
Gross Profit. Gross profit increased by $16.4 million, or 41.5%, to $56.1 million for the year ended December 31, 2009 from $39.6 million for the same period in 2008. Gross profit as a percent of net sales was 34.2% for the year ended December 31, 2009 compared to 21.9% for the same period in 2008. This increase was primarily attributable to decreased material costs.
Selling, General and Administrative Expenses. Selling, general and administrative expenses increased by $4.3 million, or 17.6%, to $28.4 million, or 17.3% of net sales, for the year ended December 31, 2009 from $24.1 million, or 13.4% of net sales, for the same period in 2008. The increase in selling, general and administrative expenses was primarily due to $3.5 million for new marketing programs driven by new products and $1.3 million of higher incentive compensation. These
65
increases were partially offset by $0.4 million received related to the settlement on a portion of escrowed purchase price related to the Composatron acquisition.
Lease Termination Expense. Lease termination expense was $0.4 million for the year ended December 31, 2009, which represents the termination costs to consolidate our Canadian manufacturing facilities.
Impairment of Goodwill. Impairment of goodwill was $14.9 million, or 9.1% of net sales, for the year ended December 31, 2009 resulting from the finalization of our step 2 impairment analysis for 2008, in the first quarter of 2009. Impairment of goodwill was $10.9 million, or 6.1% of net sales, for the year ended December 31, 2008 resulting from the write-down of goodwill based on our best estimate at the time in the fourth quarter of 2008. The additional impairment loss was not a result of further deterioration of the business, but the completion of the required analysis.
Operating Income. Operating income increased by $7.5 million to $12.1 million for the year ended December 31, 2009 from $4.6 million from the comparable period of 2008 primarily due to the reasons described above, primarily the decrease in average material costs for the year ended December 31, 2009.
Scranton Products—Three Months Ended March 31, 2011 Compared with Three Months Ended March 31, 2010
The following table summarizes certain financial information relating to the Scranton Products segment results that have been derived from our consolidated financial statements for the three months ended March 31, 2011 and 2010:
| |
Three Months Ended March 31, | |
|
||||||||||
|---|---|---|---|---|---|---|---|---|---|---|---|---|---|
| |
$ Variance |
% Variance |
|||||||||||
| (Dollars in thousands) |
2011 | 2010 | |||||||||||
Net sales |
$ | 11,599 | $ | 13,143 | $ | (1,544 | ) | (11.7 | )% | ||||
Cost of sales |
7,310 | 7,649 | (339 | ) | (4.4 | ) | |||||||
Gross profit |
4,289 | 5,494 | (1,205 | ) | (21.9 | ) | |||||||
Selling, general and administrative expenses |
2,076 | 2,253 | (177 | ) | (7.9 | ) | |||||||
Segment operating income |
$ | 2,213 | $ | 3,241 | $ | (1,028 | ) | (31.7 | )% | ||||
Net Sales. Net sales decreased by $1.5 million, or 11.7%, to $11.6 million for the three months ended March 31, 2011 from $13.1 million for the same period in 2010. The decrease in net sales was largely attributable to decreased demand for our products due to the continued slowdown in the institutional and commercial markets and was only partially offset by new product introductions. Overall, we sold 4.6 million pounds of product in the three months ended March 31, 2011, which was a decrease of 7.1% from the 4.9 million pounds sold during the comparable period in 2010. Softness in the commercial construction market impacted volumes in the first quarter of 2011. Average selling price per pound for the three months ended March 31, 2011 was $2.52 compared to $2.66 for the same period of 2010, due to lower pricing attributed to higher competition in the commercial market.
Cost of Sales. Cost of sales decreased by $0.3 million, or 4.4%, to $7.3 million for the three months ended March 31, 2011 from $7.6 million for the same period of 2010. The decrease was primarily attributable to a decrease in volumes for the three months ended March 31, 2011 compared to the same period in 2010.
Gross Profit. Gross profit decreased by $1.2 million, or 21.9%, to $4.3 million for the three months ended March 31, 2011 from $5.5 million for the same period in 2010. Gross profit as a percent of net sales decreased to 37.0% for the three months ended March 31, 2011 from 41.8% for the same period in 2010 due to higher material costs and lower pricing.
66
Selling, General and Administrative Expenses. Selling, general and administrative expenses decreased by $0.2 million, or 7.9%, to $2.1 million, or 17.9% of net sales, for the three months ended March 31, 2011 from $2.3 million, or 17.1% of net sales, for the same period in 2010. The decrease in selling, general and administrative expenses was primarily related to a decrease in sales commissions due to lower sales volume.
Operating Income. Operating income decreased by $1.0 million to $2.2 million for the three months ended March 31, 2011 from $3.2 million for the comparable period of 2010, primarily due to the decrease in sales.
Scranton Products—Year Ended December 31, 2010 Compared with Year Ended December 31, 2009
The following table summarizes certain financial information relating to the Scranton Products segment results that have been derived from our consolidated financial statements for the years ended December 31, 2010 and 2009:
| |
Year Ended December 31, | |
|
||||||||||
|---|---|---|---|---|---|---|---|---|---|---|---|---|---|
| |
$ Variance |
% Variance |
|||||||||||
| (Dollars in thousands) |
2010 | 2009 | |||||||||||
Net sales |
$ | 57,560 | $ | 66,103 | $ | (8,543 | ) | (12.9 | )% | ||||
Cost of sales |
34,315 | 36,694 | (2,379 | ) | (6.5 | )% | |||||||
Gross profit |
23,245 | 29,409 | (6,164 | ) | (21.0 | )% | |||||||
Selling, general and administrative expenses |
8,885 | 9,847 | (962 | ) | (9.8 | )% | |||||||
Impairment of goodwill and long-lived assets |
— | (3,273 | ) | 3,273 | 100.0 | % | |||||||
Loss on disposal of property |
49 | 129 | (80 | ) | (62.0 | )% | |||||||
Segment operating income |
$ | 14,311 | $ | 22,706 | $ | (8,395 | ) | (37.0 | )% | ||||
Net Sales. Net sales decreased by $8.5 million, or 12.9%, to $57.6 million for the year ended December 31, 2010 from $66.1 million for the same period in 2009. The decrease in net sales was largely attributable to decreased demand for our products due to the continued slowdown in the institutional and commercial markets and was only partially offset by new product introductions. Overall, we sold 21.8 million pounds of product in the year ended December 31, 2010, which was a decrease of 15.5% from the 25.8 million pounds sold during the comparable period in 2009. Softness in the commercial construction market impacted volumes in 2010. Average selling price per pound for the year ended December 31, 2010 was $2.64 compared to $2.56 for the same period of 2009 due to product mix.
Cost of Sales. Cost of sales decreased by $2.4 million, or 6.5%, to $34.3 million for the year ended December 31, 2010 from $36.7 million for the same period of 2009. The decrease was primarily attributable to a decrease in volumes for the year ended December 31, 2010 compared to the same period in 2009.
Gross Profit. Gross profit decreased by $6.2 million, or 21.0%, to $23.2 million for the year ended December 31, 2010 from $29.4 million for the same period in 2009. Gross profit as a percent of net sales decreased to 40.4% for the year ended December 31, 2010 from 44.5% for the same period in 2009 due to higher material costs.
Selling, General and Administrative Expenses. Selling, general and administrative expenses decreased by $1.0 million, or 9.8%, to $8.9 million, or 15.4% of net sales, for the year ended December 31, 2010 from $9.8 million, or 14.9% of net sales, for the same period in 2009. The decrease in selling, general and administrative expenses was primarily related to a decrease in bad debt, marketing and compensation expense.
67
Impairment of Goodwill. The reversal of the impairment charge of $3.3 million, or 5.0% of net sales, for the year ended December 31, 2009, resulted from the finalization of our step 2 impairment analysis for 2008, in the first quarter of 2009. There was no impairment of goodwill during 2010.
Operating Income. Operating income decreased by $8.4 million to $14.3 million for the year ended December 31, 2010 from $22.7 million for the comparable period of 2009 due to the decrease in sales.
Scranton Products—Year Ended December 31, 2009 Compared with Year Ended December 31, 2008
The following table summarizes certain financial information relating to the Scranton Products segment results that have been derived from our consolidated financial statements for the years ended December 31, 2009 and 2008:
| |
Year Ended December 31, | |
|
||||||||||
|---|---|---|---|---|---|---|---|---|---|---|---|---|---|
| |
$ Variance |
% Variance |
|||||||||||
| (Dollars in thousands) |
2009 | 2008 | |||||||||||
Net sales |
$ | 66,103 | $ | 74,807 | $ | (8,704 | ) | (11.6 | )% | ||||
Cost of sales |
36,694 | 52,607 | (15,913 | ) | (30.2 | )% | |||||||
Gross profit |
29,409 | 22,200 | 7,209 | 32.5 | % | ||||||||
Selling, general and administrative expenses |
9,847 | 9,145 | 702 | 7.7 | % | ||||||||
Impairment of goodwill and long-lived assets |
(3,273 | ) | 19,437 | (22,710 | ) | (116.8 | )% | ||||||
Loss on disposal of property |
129 | — | 129 | 100.0 | % | ||||||||
Segment operating income (loss) |
$ | 22,706 | $ | (6,382 | ) | $ | 29,088 | 455.8 | % | ||||
Net Sales. Net sales decreased by $8.7 million, or 11.6%, to $66.1 million for the year ended December 31, 2009 from $74.8 million for the same period in 2008. The decrease in net sales was largely attributable to the decline in institutional and commercial market activities in the second half of 2009. Overall, we sold 25.8 million pounds of product in the year ended December 31, 2009, which was a decrease of 14.3% from the 30.1 million pounds sold during the comparable period in 2008. Average selling price per pound for the year ended December 31, 2009 was $2.56 compared to $2.49 for the same period of 2008 due to changes in product mix. Adverse economic conditions across our markets significantly impacted our growth in 2008 and 2009.
Cost of Sales. Cost of sales decreased by $15.9 million, or 30.2%, to $36.7 million for the year ended December 31, 2009 from $52.6 million for the same period of 2008. The decrease was primarily attributable to a decrease in volumes as well as a decrease in average material costs for the year ended December 31, 2009 compared to the same period in 2008. Based on market indices, the market cost for HDPE resin decreased by approximately 5.0% for the year ended December 31, 2009 compared to the same period in 2008.
Gross Profit. Gross profit increased by $7.2 million, or 32.5%, to $29.4 million for the year ended December 31, 2009 from $22.2 million for the same period in 2008. Gross profit as a percent of net sales increased to 44.5% for the year ended December 31, 2009 from 29.7% for the same period in 2008. This increase was primarily attributable to lower material costs.
Selling, General and Administrative Expenses. Selling, general and administrative expenses increased by $0.7 million, or 7.7%, to $9.8 million, or 14.9% of net sales, for the year ended December 31, 2009 from $9.1 million, or 12.2% of net sales, for the same period in 2008. The increase in selling, general and administrative expenses was primarily due to higher marketing expense of $0.6 million and higher incentive compensation of $0.4 million. A decrease in commission expense due to lower sales volumes was offset by our transition to a direct sales force.
68
Impairment of Goodwill. The revision of the 2008 impairment of goodwill was a $3.3 million reduction, or 5.0% of net sales, for the year ended December 31, 2009, resulting from the finalization of our step 2 impairment analysis in the first quarter of 2009. Impairment of goodwill was $19.4 million, or 26.0% of net sales, for the year ended December 31, 2008, resulting from the write-down of goodwill based on our best estimate at the time in the fourth quarter of 2008.
Operating Income. Operating income increased by $29.1 million to $22.7 million for the year ended December 31, 2009 from a loss of $6.4 million for the comparable period in 2008 due to revision of impairment of goodwill conducted in 2008, and lower resin costs.
Vycom—Three Months Ended March 31, 2011 Compared with Three Months Ended March 31, 2010
The following table summarizes certain financial information relating to the Vycom segment results that have been derived from our consolidated financial statements for the three months ended March 31, 2011 and 2010:
| |
Three Months Ended March 31, | |
|
||||||||||
|---|---|---|---|---|---|---|---|---|---|---|---|---|---|
| |
$ Variance |
% Variance |
|||||||||||
| (Dollars in thousands) |
2011 | 2010 | |||||||||||
Net sales |
$ | 17,608 | $ | 12,632 | $ | 4,976 | 39.4 | % | |||||
Cost of sales |
13,990 | 10,367 | 3,623 | 34.9 | |||||||||
Gross profit |
3,618 | 2,265 | 1,353 | 59.7 | |||||||||
Selling, general and administrative expenses |
1,487 | 1,520 | (33 | ) | (2.2 | ) | |||||||
Segment operating income (loss) |
$ | 2,131 | $ | 745 | $ | 1,386 | 186.0 | % | |||||
Net Sales. Net sales increased by $5.0 million, or 39.4%, to $17.6 million for the three months ended March 31, 2011 from $12.6 million for the same period in 2010, largely attributable to a rebound in industrial production and the benefit of our sales and marketing initiatives, all of which favorably impacted demand for our products. Overall, we sold 13.0 million pounds of product in the three months ended March 31, 2011, which was an increase of 18.5% from the 11.0 million pounds sold during the comparable period in 2010. Average selling price per pound for the three months ended March 31, 2011 was $1.35 compared to $1.15 for the same period of 2010, due to an increase in selling prices resulting from the pass through of higher material costs.
Cost of Sales. Cost of sales increased by $3.6 million, or 34.9%, to $14.0 million for the three months ended March 31, 2011 from $10.4 million for the same period of 2010. The increase was primarily attributable to an increase in volumes as well as an increase in average material costs for the three months ended March 31, 2011 compared to the same period in 2010. Based on market indices, the weighted average market cost for the type of resin that we use increased by approximately 5.7% for the three months ended March 31, 2011 compared to the same period in 2010.
Gross Profit. Gross profit increased by $1.3 million, or 59.7%, to $3.6 million for the three months ended March 31, 2011 from $2.3 million for the same period in 2010. Gross profit as a percent of net sales increased to 20.5% for the three months ended March 31, 2011 from 17.9% for the same period in 2010. This increase was primarily attributable to increased pricing and sales volume, partially offset by higher material costs.
Selling, General and Administrative Expenses. Selling, general and administrative expenses remained relatively flat for the three months ended March 31, 2011 compared to March 31, 2010.
Operating Income. Operating income increased by $1.4 million to $2.1 million for the three months ended March 31, 2011 from $0.7 million for the comparable period in 2010, primarily due to increased sales.
69
Vycom—Year Ended December 31, 2010 Compared with Year Ended December 31, 2009
The following table summarizes certain financial information relating to the Vycom segment results that have been derived from our consolidated financial statements for the years ended December 31, 2010 and 2009:
| |
Year Ended December 31, | |
|
||||||||||
|---|---|---|---|---|---|---|---|---|---|---|---|---|---|
| |
$ Variance |
% Variance |
|||||||||||
| (Dollars in thousands) |
2010 | 2009 | |||||||||||
Net sales |
$ | 56,562 | $ | 36,997 | $ | 19,565 | 52.9 | % | |||||
Cost of sales |
46,575 | 28,931 | 17,644 | 61.0 | % | ||||||||
Gross profit |
9,987 | 8,066 | 1,921 | 23.8 | % | ||||||||
Selling, general and administrative expenses |
6,372 | 5,540 | 832 | 15.0 | % | ||||||||
Impairment of goodwill and long-lived assets |
— | 2,769 | (2,769 | ) | (100.0 | )% | |||||||
Loss on disposal of property |
33 | 89 | (56 | ) | (62.9 | )% | |||||||
Segment operating income (loss) |
$ | 3,582 | $ | (332 | ) | $ | 3,914 | 1,178.9 | % | ||||
Net Sales. Net sales increased by $19.6 million, or 52.9%, to $56.6 million for the year ended December 31, 2010 from $37.0 million for the same period in 2009, largely attributable to a rebound in industrial production and the benefit of our sales and marketing initiatives, all of which favorably impacted demand for our products. Overall, we sold 47.5 million pounds of product in the year ended December 31, 2010, which was an increase of 58.0% from the 30.1 million pounds sold during the comparable period in 2009. Average selling price per pound for the year ended December 31, 2010 was $1.19 compared to $1.23 for the same period of 2009 due to an increase in customer rebates attributed to higher volume of sales in 2010.
Cost of Sales. Cost of sales increased by $17.7 million, or 61.0%, to $46.6 million for the year ended December 31, 2010 from $28.9 million for the same period of 2009. The increase was primarily attributable to an increase in volumes as well as an increase in average material costs for the year ended December 31, 2010 compared to the same period in 2009. Based on market indices, the weighted average market cost for the types of resin that we use increased by approximately 11.4% for the year ended December 31, 2010 compared to the same period in 2009.
Gross Profit. Gross profit increased by $1.9 million, or 23.8%, to $10.0 million for the year ended December 31, 2010 from $8.1 million for the same period in 2009. Gross profit as a percent of net sales decreased to 17.7% for the year ended December 31, 2010 from 21.8% for the same period in 2009. This decrease was primarily attributable to increased material costs.
Selling, General and Administrative Expenses. Selling, general and administrative expenses increased by $0.8 million, or 15.0%, to $6.4 million, or 11.3% of net sales, for the year ended December 31, 2010 from $5.5 million, or 15.0% of net sales, for the same period in 2009. The increase in selling, general and administrative expenses was primarily related to higher compensation and commission expense related to higher sales volumes.
Impairment of Goodwill. The impairment of goodwill was $2.8 million, or 7.5% of net sales, for the year ended December 31, 2009 resulted from the finalization of our step 2 impairment analysis of 2008 in the first quarter of 2009.
Operating Income. Operating income increased by $3.9 million to $3.6 million for the year ended December 31, 2010 from a loss of $0.3 million for the comparable period in 2009, primarily due to the goodwill impairment expense that did not occur in 2010 and increased sales.
70
Vycom—Year Ended December 31, 2009 Compared with Year Ended December 31, 2008
The following table summarizes certain financial information relating to the Vycom segment results that have been derived from our consolidated financial statements for the years ended December 31, 2009 and 2008:
| |
Year Ended December 31, | |
|
||||||||||
|---|---|---|---|---|---|---|---|---|---|---|---|---|---|
| |
$ Variance |
% Variance |
|||||||||||
| (Dollars in thousands) |
2009 | 2008 | |||||||||||
Net sales |
$ | 36,997 | $ | 49,897 | $ | (12,900 | ) | (25.9 | )% | ||||
Cost of sales |
28,931 | 41,583 | (12,652 | ) | (30.4 | )% | |||||||
Gross profit |
8,066 | 8,314 | (248 | ) | (3.0 | )% | |||||||
Selling, general and administrative expenses |
5,540 | 5,263 | 277 | 5.3 | % | ||||||||
Impairment of goodwill and long-lived assets |
2,769 | 9,617 | (6,848 | ) | (71.2 | )% | |||||||
Loss on disposal of property |
89 | — | 89 | 100.0 | % | ||||||||
Segment operating (loss) |
$ | (332 | ) | $ | (6,566 | ) | $ | 6,234 | 94.9 | % | |||
Net Sales. Net sales decreased by $12.9 million, or 25.9%, to $37.0 million for the year ended December 31, 2009 from $49.9 million for the same period in 2008, largely attributable to general decline in the overall economic environment and a drop in industrial production, all of which negatively impacted demand for our products. Overall, we sold 30.1 million pounds of product in the year ended December 31, 2009, which was a decrease of 15.2% from the 35.5 million pounds sold during the comparable period in 2008, resulting from the economic slowdown. Average selling price per pound for the year ended December 31, 2009 was $1.23 compared to $1.41 for the same period of 2008 due to lower prices and changes in product mix.
Cost of Sales. Cost of sales decreased by $12.7 million, or 30.4%, to $28.9 million for the year ended December 31, 2009 from $41.6 million for the same period of 2008. The decrease was primarily attributable to a decrease in volumes as well as a decrease in average material costs for the year ended December 31, 2009 compared to the same period in 2008. Based on market indices, the weighted average market cost for the types of resin that we use decreased by approximately 6.6% for the year ended December 31, 2009 compared to the same period in 2008.
Gross Profit. Gross profit decreased by $0.2 million, or 3.0%, to $8.1 million for the year ended December 31, 2009 from $8.3 million for the same period in 2008. Gross profit as a percent of net sales increased to 21.8% for the year ended December 31, 2009 from 16.7% for the same period in 2008.
Selling, General and Administrative Expenses. Selling, general and administrative expenses increased by $0.3 million, or 5.3%, to $5.5 million, or 15.0% of net sales, for the year ended December 31, 2009 from $5.3 million, or 10.5% of net sales, for the same period in 2008. The increase in selling, general and administrative expenses was primarily due to $0.4 million for new marketing programs primarily due to the promotion of the Vycom segment and $0.3 million of higher incentive compensation. These increases were partially offset by lower commissions of $0.3 million due to lower sales.
Impairment of Goodwill. The impairment of goodwill was $2.8 million, or 7.5% of net sales, for the year ended December 31, 2009 resulted from the finalization of our step 2 impairment analysis for 2008, in the first quarter of 2009. Impairment of goodwill was $9.6 million, or 19.3% of net sales, for the year ended December 31, 2008, resulting from the write-down of goodwill based on our best estimate at the time in the fourth quarter of 2008. The additional impairment loss was not a result of further deterioration of the business, but the completion of the required analysis.
71
Operating Loss. Operating loss decreased by $6.2 million, or 94.9%, to a loss of $0.3 million for the year ended December 31, 2009 from loss of $6.6 million for the comparable period in 2008, due to the impairment of goodwill offset by lower volumes as well as a decrease in average material costs.
Corporate Costs—Three Months Ended March 31, 2011 Compared with Three Months Ended March 31, 2010
The following table summarizes certain information relating to our corporate costs, which include corporate payroll costs, as well as corporate-related professional fees.
| |
Three Months Ended March 31, | |
|
||||||||||
|---|---|---|---|---|---|---|---|---|---|---|---|---|---|
| |
$ Variance |
% Variance |
|||||||||||
| (Dollars in thousands) |
2011 | 2010 | |||||||||||
Net sales |
$ | — | $ | — | $ | — | — | ||||||
Cost of sales |
— | — | — | — | |||||||||
Gross profit |
— | — | — | — | |||||||||
General and administrative expenses |
4,137 | 3,076 | 1,061 | 34.5 | % | ||||||||
Segment operating loss |
$ | (4,137 | ) | $ | (3,076 | ) | $ | 1,061 | 34.5 | % | |||
General and Administrative Expenses. Corporate general and administrative expenses increased by $1.0 million, or 34.5%, to $4.1 million for the three months ended March 31, 2011 from $3.1 million for the three months ended March 31, 2010. The increase in general and administrative expenses was primarily attributable to expenses related to the debt refinancing and an increase in legal fees and professional services.
Corporate Costs—Year Ended December 31, 2010 Compared with Year Ended December 31, 2009
The following table summarizes certain information relating to our corporate costs, which include corporate payroll costs, as well as corporate-related professional fees.
| |
Year Ended December 31, | |
|
||||||||||
|---|---|---|---|---|---|---|---|---|---|---|---|---|---|
| |
$ Variance |
% Variance |
|||||||||||
| (Dollars in thousands) |
2010 | 2009 | |||||||||||
Net sales |
$ | — | $ | — | $ | — | — | ||||||
Cost of sales |
— | — | — | — | |||||||||
Gross profit |
— | — | — | — | |||||||||
General and administrative expenses |
12,324 | 13,621 | (1,297 | ) | (9.5 | )% | |||||||
Lease termination expense |
— | 244 | (244 | ) | (100.0 | )% | |||||||
Loss on disposal of property |
— | 25 | (25 | ) | (100.0 | )% | |||||||
Segment operating loss |
$ | (12,324 | ) | $ | (13,890 | ) | $ | (1,566 | ) | (11.3 | )% | ||
General and Administrative Expenses. Corporate general and administrative expenses decreased by $1.3 million, or 9.5%, to $12.3 million for the year ended December 31, 2010 from $13.6 million for the year ended December 31, 2009. The decrease in general and administrative expenses was primarily attributable to lower professional fees.
Lease Termination Expense. Lease termination expense was $0.2 million for the year ended December 31, 2009, which represented the required termination costs to consolidate our administrative offices into one of our manufacturing facilities in Pennsylvania. There was no such expense during 2010.
72
Corporate Costs—Year Ended December 31, 2009 Compared with Year Ended December 31, 2008
The following table summarizes certain information relating to our corporate costs, which include corporate payroll costs, as well as corporate-related professional fees.
| |
Year Ended December 31, | |
|
||||||||||
|---|---|---|---|---|---|---|---|---|---|---|---|---|---|
| |
$ Variance |
% Variance |
|||||||||||
| (Dollars in thousands) |
2009 | 2008 | |||||||||||
Net sales |
$ | — | $ | — | $ | — | — | ||||||
Cost of sales |
— | — | — | — | |||||||||
Gross profit |
— | — | — | — | |||||||||
General and administrative expenses |
13,621 | 12,108 | 1,513 | 12.5 | % | ||||||||
Lease termination expense |
244 | — | 244 | 100.0 | % | ||||||||
Loss on disposal of property |
25 | — | 25 | 100.0 | % | ||||||||
Segment operating loss |
$ | (13,890 | ) | $ | (12,108 | ) | $ | (1,782 | ) | (14.7 | )% | ||
General and Administrative Expenses. Corporate general and administrative expenses increased by $1.5 million, or 12.5%, to $13.6 million for the year ended December 31, 2009 from $12.1 million for the year ended December 31, 2008. The increase in general and administrative expenses was primarily attributable to approximately $1.3 million of higher incentive compensation.
Lease Termination Expense. Lease termination expense was $0.2 million for the year ended December 31, 2009, which represents the required termination costs to consolidate our administrative offices into one of our manufacturing facilities in Pennsylvania.
Liquidity and Capital Resources
Our primary cash needs are working capital, capital expenditures and debt service. We have historically financed these cash requirements through internally generated cash flow and debt financings. We also have a senior secured revolving credit facility which provides additional liquidity to support our growth. In addition, we may also issue additional equity and/or debt to finance acquisitions in the future.
Net cash used in operating activities was $46.0 million and $31.2 million for the three months ended March 31, 2011 and 2010, respectively. Cash used in operating activities for 2011 increased by approximately $14.9 million, due to an increase in trade accounts receivable attributed to higher sales, partially offset by an increase in accounts payable due to increased volume. We continuously monitor our accounts receivable and inventory levels in order to efficiently manage our working capital. The key indicators that we use to monitor these levels are accounts receivable turnover and inventory turnover days. Accounts receivable days were 61 as of March 31, 2011 compared to 56 at March 31, 2010. Our inventory turnover days were 52 at March 31, 2011 compared to 48 at March 31, 2010.
Net cash provided by operating activities was $26.9 million, $37.4 million and $36.3 million for the years ended December 31, 2010, 2009 and 2008, respectively. Cash provided by operating activities for 2010 decreased by approximately $10.5 million, due to an increase in accrued expenses and interest and an increase in accounts receivable due to higher sales volumes, partially offset by an increase in accounts payable. Cash provided by operating activities for 2009 increased slightly over 2008 due to lower net loss offset by lower impairment charges, and increased accounts payable being offset by higher inventory levels. Accounts receivable days were 28 at December 31, 2010 compared to 29 at December 31, 2009 and 35 at December 31, 2008. Our inventory turnover days were 151 at December 31, 2010 compared to 142 at December 31, 2009 and 77 at December 31, 2008 attributed to higher purchases of raw materials due to higher sales, and the build-up of finished goods in the fourth quarter for the "early buy" program at AZEK Building Products in both 2009 and 2010.
73
Net cash used in investing activities was $5.6 million and $3.5 million for the three months ended March 31, 2011 and 2010, respectively. During the first quarter of 2011, cash used in investing activities was primarily related to additional manufacturing capacity at our Scranton Corey location and building improvements at our Keyser facility, as well as normal capital expenditures. During the same period in 2010, cash used in investing activities related to $3.5 million in capital expenditure primarily related to building improvements at our Keyser facility and additional manufacturing capacity at our Foley location, as well as normal maintenance capital expenditures.
Net cash used in investing activities was $15.3 million, $7.2 million and $47.9 million for the years ended December 31, 2010, 2009 and 2008, respectively. In 2010, cash used in investing activities related to $15.3 million in capital expenditures primarily related to additional manufacturing capacity at our Foley and Scranton locations and building and land improvements at our Keyser facility, as well as normal maintenance capital expenditures. In 2009, cash used in investing activities of $7.2 million consisted of $6.3 million in capital expenditures and $0.9 million related to the Composatron acquisition. In 2008, cash used in investing activities of $31.2 million related to the Composatron acquisition completed on February 29, 2008. In addition, there was a $12.3 million earn-out payment in 2008 to the former owners of Procell, related to the contingent purchase price for Procell, which we acquired on January 31, 2007. The remaining cash used in investing activities related to $6.3 million in capital expenditures and $1.9 million in proceeds from the sale of equipment. We estimate that our capital expenditures for 2011 will be $16 million to $21 million.
Net cash provided by financing activities was $14.9 million and $8.5 million for the three months ended March 31, 2011 and 2010, respectively. During the first quarter of 2011, we refinanced our debt by paying the outstanding balance of $299.5 million, and issuing new debt of $325.0 million, which consists of $285.0 million under the New Term Loan Agreement, which included an original issue discount of $1.4 million, and $40.0 million under the New Revolving Credit Facility, which included an original issue discount of $0.3 million. As part of the debt refinancing, we paid approximately $7.8 million of financing fees. During the first quarter of 2011, we also paid approximately $1.0 million in long-term obligations. During the first quarter of 2010, we paid approximately $0.5 million in long-term obligations, made payments of $1.0 million on behalf of Holdings and borrowed $10.0 million under the Old Revolving Credit Facility.
Net cash (used in) provided by financing activities was $(7.1) million, $(8.6) million and $24.1 million for the years ended December 31, 2010, 2009 and 2008, respectively. In 2010, we paid $2.0 million in long-term obligations and made payments of $5.0 million on behalf of Holdings. In 2009, we repaid $5.0 million of borrowings under the Old Revolving Credit Facility. We also repaid $2.2 million in long-term obligations, primarily towards our capital leases. In 2008, we received proceeds of $24.3 million from borrowings under our Old Term Loan Agreement in order to finance a portion of the Composatron acquisition. We incurred an additional $1.3 million in financing fees related to the additional 2008 funding. We also borrowed approximately $25.0 million under the Old Revolving Credit Facility and paid down approximately $20.0 million during 2008.
Debt Refinancing Transactions
During the quarter ended March 31, 2011, we refinanced substantially all of our long-term indebtedness. On February 18, 2011, we entered into (i) the New Revolving Credit Facility by and among Scranton Products Inc. ("Scranton Inc."), AZEK Building Products, Inc. ("AZEK Inc.") and Procell Decking Inc. ("Procell Inc."), as borrowers, our company, CPG International I Inc. ("CPG I"), Santana Products Inc. ("Santana"), CPG Sub I Corporation ("CPG Sub"), Vycom Corp. and Sanatec Sub I Corporation ("Sanatec"), as guarantors, Credit Suisse AG, Cayman Islands Branch ("Credit Suisse AG"), as administrative agent, Wells Fargo Capital Finance, LLC ("Wells Fargo Capital"), as collateral agent, and the lenders from time to time party thereto, (ii) the New Term Loan Agreement by and among CPG I, Scranton Inc., AZEK Inc. and Procell Inc., as borrowers, our company, Santana,
74
CPG Sub, Vycom Corp. and Sanatec, as guarantors, Credit Suisse AG, as administrative agent and collateral agent, and the lenders from time to time party thereto and (iii) an intercreditor agreement by and among the respective borrowers and guarantors under the New Revolving Credit Facility and the New Term Loan Agreement, Wells Fargo Capital, as the ABL agent thereunder, and Credit Suisse AG, as the term loan agent and control agent thereunder (the "Intercreditor Agreement"). See "Description of Certain Indebtedness."
On February 18, 2011, we used proceeds from borrowings under the New Term Loan Agreement and New Revolving Credit Facility to repay all amounts outstanding under the Old Revolving Credit Facility and Old Term Loan Agreement. In aggregate, we repaid approximately $24.5 million under the Old Revolving Credit Facility and Old Term Loan Agreement.
Also on February 18, 2011, CPG I repurchased $123.4 million aggregate principal amount of the Floating Rate Notes and $122.1 million aggregate principal amount of the Fixed Rate Notes pursuant to a tender offer. The $32.5 million aggregate principal amount of the Old Notes that remained outstanding after the tender offer was redeemed in full on March 21, 2011. The repurchase and redemption of the Old Notes was funded with the proceeds of borrowings under the New Term Loan Agreement and New Revolving Credit Facility.
As of March 31, 2011, $284.3 million was outstanding under the New Term Loan Agreement and $40.0 million was outstanding under the New Revolving Credit Facility with a letter of credit of $1.4 million held against it, and approximately $23.6 million remained available under the New Revolving Credit Facility for future borrowings. In connection with our debt refinancing transactions, we incurred $7.4 million in consent payments, $0.7 million in prepayment premiums and $8.4 million of creditor and third party fees. Approximately $8.2 million of the fees we incurred during the three months ended March 31, 2011 were expensed as a loss on extinguishment of debt. As of March 31, 2011, we had unamortized debt issuance costs of $8.3 million related to the New Term Loan Agreement and the New Revolving Credit Facility. The New Term Loan Agreement and the New Revolving Credit Facility had an original issue discount of $1.4 million and $0.3 million, respectively. See Notes 6 and 7 to our condensed consolidated financial statements as of and for the three months ended March 31, 2011 included elsewhere in this prospectus.
Old Notes
At December 31, 2010, CPG I, our wholly owned subsidiary, had approximately $128.0 million aggregate principal amount of the Floating Rate Notes and $150.0 million aggregate principal amount of the Fixed Rate Notes outstanding. The Old Notes were guaranteed by our company and all of the domestic subsidiaries of CPG I.
Old Revolving Credit Facility
The Old Revolving Credit Facility provided for an aggregate maximum credit of $65.0 million, of which $32.7 million was available for borrowing as of December 31, 2010. The Old Revolving Credit Facility provided for interest on outstanding principal thereunder at a fluctuating rate, at our option, at (i) the base rate (prime rate) plus a spread of up to 0.5%, or (ii) adjusted LIBOR plus a spread of 1.5% to 2.25% or (iii) a combination thereof.
Old Term Loan Agreement
The Old Term Loan Agreement provided for a term loan of $25.0 million, which was drawn in order to fund a part of the financing for the Composatron acquisition. The Old Term Loan Agreement provided for interest on outstanding principal thereunder at a fluctuating rate, at our option, at (i) the base rate (prime rate) plus a spread of 4.0%, or (ii) adjusted LIBOR plus a spread of 5.0%, subject to a LIBOR floor of 3.25%, or (iii) a combination thereof.
75
New Revolving Credit Facility
The New Revolving Credit Facility matures on February 18, 2016 and provides for maximum aggregate borrowings of up to $65.0 million. The borrowers under the New Revolving Credit Facility are AZEK Inc., Procell Inc. and Scranton Inc. (AZEK Inc. and Procell Inc. on one hand and Scranton Inc. on the other hand, each a "group"). The borrowing capacity available to each group is limited by a borrowing base. For each group, the borrowing base is limited to a percentage of eligible accounts receivable and inventory, less reserves that may be established by the administrative agent in the exercise of its reasonable business judgment. As of March 31, 2011, $40.0 million was outstanding under the New Revolving Credit Facility with a letter of credit of $1.4 million held against it, and approximately $23.6 million remained available under the borrowing base for future borrowings.
The New Revolving Credit Facility provides for interest on outstanding principal thereunder at a fluctuating rate, at our option, at (i) the base rate (prime rate) plus a spread of 1.25% to 1.75%, or (ii) adjusted LIBOR plus a spread of 2.25% to 2.75% or (iii) a combination thereof.
The obligations under the New Revolving Credit Facility are secured by substantially all of the present and future assets of the borrowers and guarantors including equity interests of their domestic subsidiaries and 65% of the equity interests of their first-tier foreign subsidiaries, subject to certain exceptions. The obligations under the New Revolving Credit Facility are guaranteed by our company and our wholly owned domestic subsidiaries other than certain immaterial subsidiaries.
The New Revolving Credit Facility contains negative covenants that are customary for financings of this type. The New Revolving Credit Facility also includes a financial covenant that requires us to maintain, when the average excess availability falls below $7.5 million, a minimum fixed charge coverage ratio (generally defined as the ratio of (a) the amount of (i) our consolidated EBITDA for the 12-month period ended prior to the relevant month end, less (ii) capital expenditures made during such period, less (iii) cash taxes paid during such period and less (iv) cash dividend and equity redemption payments to (b) the sum of all cash interest expense and certain regularly scheduled prepayments of debt made during such period) equal to at least 1.0 to 1.0, for each month until such time as the average excess availability over 90 days or 120 days (as applicable) exceeds $7.5 million.
Any failure to be in compliance with this financial covenant when we are required to be in compliance, or any failure to be in compliance with any of the other covenants under the New Revolving Credit Facility, could result in a default under the New Revolving Credit Facility. A default could constitute or lead to an event of default, which could have the consequences described below, and could also cause a cross-default under the New Term Loan Agreement. In addition, in the case of a default, we would not be able to borrow funds under the New Revolving Credit Facility, which could make it difficult for us to operate our business.
In addition, if the average excess availability falls below $7.5 million for three consecutive business days or if an event of default exists under the New Revolving Credit Facility, then the administrative agent will have the right to sweep all cash in certain of our accounts into an agent payment account under the agent's full dominion and control.
The New Revolving Credit Facility contains events of default that are customary for financings of this type. If an event of default under the New Revolving Credit Facility occurs, the administrative agent acting at the direction of required lenders may, among other things, declare the principal amount of all obligations under the New Revolving Credit Facility immediately due and payable (and all such obligations automatically become due and payable in the case of certain events of bankruptcy or insolvency) and take other actions permitted to be taken by a secured creditor.
For a further discussion of the New Revolving Credit Facility, see "Description of Certain Indebtedness—New Revolving Credit Facility."
76
New Term Loan Agreement
The New Term Loan Agreement provides for a term loan of $285.0 million, which was drawn on February 18, 2011 in order to fund: (a) the repayment of the amounts outstanding under our Old Revolving Credit Facility and Old Term Loan Agreement, (b) the redemption and/or repurchase of our Old Notes, (c) costs, expenses and fees in connection with the preparation, negotiation and execution of the refinancing transactions and (d) working capital and other general corporate needs. CPG I, AZEK Inc., Procell Inc. and Scranton Inc. are the borrowers under the New Term Loan Agreement. In addition, the New Term Loan Agreement provides for additional uncommitted term loans of up to $70.0 million.
The New Term Loan Agreement provides for interest on outstanding principal thereunder at a fluctuating rate, at our option, at (i) the base rate (prime rate) plus a spread of 3.50%, or (ii) adjusted LIBOR plus a spread of 4.50%, subject to a LIBOR floor of 1.50%, or (iii) a combination thereof.
The obligations under the New Term Loan Agreement are secured by substantially all of the present and future assets of the borrowers and guarantors including equity interests of their domestic subsidiaries and 65% of the equity interests of their first-tier foreign subsidiaries, subject to certain exceptions. The obligations under the New Term Loan Agreement are guaranteed by our company and our wholly owned domestic subsidiaries other than certain immaterial subsidiaries.
The New Term Loan Agreement requires mandatory prepayments of the term loans thereunder from certain debt issuances, a percentage of certain equity issuances (subject to step-downs upon our company achieving certain leverage ratios), certain asset dispositions (subject to certain reinvestment rights) and a percentage of excess cash flow (subject to step-downs upon our company achieving certain leverage ratios). The borrowers are required to repay the outstanding principal under the New Term Loan Agreement in quarterly installments of $712,500 from March 31, 2011 through December 31, 2016, with the remaining outstanding principal balance under the New Term Loan Agreement due on the maturity date, February 18, 2017.
The New Term Loan Agreement contains negative covenants that are customary for financings of this type. The New Term Loan Agreement also includes financial covenants that require us to maintain quarterly (i) a maximum total leverage ratio ranging from 5.75 to 1.0 for the fiscal quarter ending June 30, 2011 to 3.00 to 1.0 for the fiscal quarter ending June 30, 2016 and thereafter and (ii) a minimum interest coverage ratio of 2.50 to 1.0 for the fiscal quarters ending June 30, September 30 and December 31, 2011 and 2.75 to 1.0 for the fiscal quarter ending March 31, 2012 and thereafter.
Any failure to be in compliance with either of these financial covenants, or with any of the other covenants under the New Term Loan Agreement, could result in a default under the New Term Loan Agreement. A default could constitute or lead to an event of default, which could have the consequences described below, and could also cause a cross-default under the New Revolving Credit Facility.
The New Term Loan Agreement contains events of default that are customary for financings of this type. If an event of default under the New Term Loan Agreement occurs, the administrative agent acting at the direction of required lenders may, among other things, declare the principal amount of all obligations under the New Term Loan Agreement immediately due and payable (and all such obligations automatically become due and payable in the case of certain events of bankruptcy or insolvency) and take other actions permitted to be taken by a secured creditor.
For a further discussion of the New Term Loan Agreement, see "Description of Certain Indebtedness—New Term Loan Agreement."
77
Long-Term Liquidity
As of March 31, 2011, $40.0 million was outstanding under the New Revolving Credit Facility with a letter of credit of $1.4 million held against it, and approximately $23.6 million remained available under the borrowing base for future borrowings. We anticipate that the funds generated by our operations, as well as funds available under our New Revolving Credit Facility, will be sufficient to meet working capital requirements and to finance capital expenditures over the next several years. There can be no assurance, however, that our business will generate sufficient cash flow from operations, that anticipated net sales growth and operating improvements will be realized or that future borrowings will be available under our New Revolving Credit Facility in an amount sufficient to enable us to service our indebtedness or to fund our other liquidity needs. Our ability to meet our debt service obligations and other capital requirements, including capital expenditures and acquisitions, will depend upon our future performance and our ability to stay in compliance with our financial covenants, which, in turn, will be subject to general economic, financial, business, competitive, legislative, regulatory and other conditions, many of which are beyond our control. We may also need to obtain additional funds to finance acquisitions, which may be in the form of additional debt or equity. Some other risks that could materially adversely affect our ability to meet our debt service obligations include, but are not limited to, risks related to increases in the cost and lack of availability of resin and our ability to pass through costs or price increases to cover such costs on a timely basis, our ability to protect our intellectual property, rising interest rates, a decline in gross domestic product levels, weakening of the residential, institutional and commercial construction markets, the loss of key personnel, our ability to continue to invest in equipment, and a decline in relations with our key distributors and dealers. Although we believe we have sufficient liquidity under our New Revolving Credit Facility, as discussed above, under extreme market conditions there can be no assurance that such funds would be available or sufficient, and in such a case, we may not be able to successfully obtain additional financing on favorable terms, or at all. During February and March 2011, we refinanced our Old Revolving Credit Facility, Old Term Loan Agreement and Old Notes with the $285.0 million New Term Loan Agreement and the $65.0 million New Revolving Credit Facility. The refinancing provides us with significant financial flexibility by lowering our cost of capital and reducing our interest expense thereby enabling us to continue investing in our key growth initiatives. Additionally, we have reduced our refinancing risk by extending our debt maturities until 2016 and 2017.
Contractual Obligations
The following table summarizes our contractual cash obligations as of December 31, 2010. This table does not include information on our recurring purchases of materials for use in production, as our raw materials purchase contracts do not require fixed or minimum quantities. This table also excludes payments relating to uncertain income tax due to the fact that, at this time, we cannot
78
determine either the timing or the amounts of payments for all periods beyond December 31, 2010 for certain of these liabilities.
| (Dollars in thousands) |
Total | Due in Less than 1 Year |
Due in 1-3 years |
Due in 3-5 years |
Due after 5 years |
|||||||||||
|---|---|---|---|---|---|---|---|---|---|---|---|---|---|---|---|---|
Old Term Loan Agreement |
$ | 24,250 | $ | 250 | $ | 24,000 | $ | — | $ | — | ||||||
Interest on Old Term Loan Agreement(a) |
2,331 | 1,751 | 580 | — | — | |||||||||||
Old Notes |
277,996 | — | 277,996 | — | — | |||||||||||
Interest on Old Notes(b) |
53,212 | 24,975 | 28,237 | — | — | |||||||||||
Capital lease obligations |
12,264 | 1,904 | 1,506 | 1,080 | 7,774 | |||||||||||
Operating lease obligations |
5,026 | 1,390 | 1,831 | 1,229 | 576 | |||||||||||
Raw materials in transit |
895 | 895 | — | — | — | |||||||||||
Total(c)(d) |
$ | 375,974 | $ | 31,165 | $ | 334,150 | $ | 2,309 | $ | 8,350 | ||||||
- (a)
- The
interest rate used in the calculation of our interest payments was 7.25% related to the Old Term Loan Agreement.
- (b)
- The
interest rates used in the calculation of our interest payments were 10.5% related to the Fixed Rate Notes and 7.20656% related to the Floating Rate
Notes.
- (c)
- As
of December 31, 2010, the Old Revolving Credit Facility had a balance of nil outstanding and a letter of credit of $1.4 million held
against it, and the availability under the Old Revolving Credit Facility was $32.7 million.
- (d)
- During the quarter ended March 31, 2011, we refinanced our then outstanding long-term debt with the New Revolving Credit Facility and the New Term Loan Agreement. See the Contractual Obligations table as of March 31, 2011 below.
The following table summarizes our contractual cash obligations as of March 31, 2011. This table does not include information on our recurring purchases of materials for use in production, as our raw materials purchase contracts do not require fixed or minimum quantities. This table also excludes payments relating to uncertain income tax due to the fact that, at this time, we cannot determine either the timing or the amounts of payments for all periods beyond March 31, 2011 for certain of these liabilities.
| (Dollars in thousands) |
Total | Due in Less than 1 Year |
Due in 1-3 years |
Due in 3-5 years |
Due after 5 years |
|||||||||||
|---|---|---|---|---|---|---|---|---|---|---|---|---|---|---|---|---|
New Term Loan Agreement |
$ | 284,288 | $ | 2,850 | $ | 5,700 | $ | 5,700 | $ | 270,038 | ||||||
Interest on New Term Loan Agreement(a) |
97,563 | 16,993 | 33,473 | 32,789 | 14,308 | |||||||||||
New Revolving Credit Facility(b) |
40,000 | 40,000 | — | — | — | |||||||||||
Interest on New Revolving Credit Facility(c) |
462 | 462 | — | — | — | |||||||||||
Capital lease obligations |
11,716 | 1,689 | 1,306 | 1,083 | 7,638 | |||||||||||
Operating lease obligations |
5,681 | 1,241 | 2,353 | 1,511 | 576 | |||||||||||
Raw materials in transit |
1,674 | 1,674 | — | — | — | |||||||||||
Total |
$ | 441,384 | $ | 64,909 | $ | 42,832 | $ | 41,083 | $ | 292,560 | ||||||
- (a)
- The
interest rate used in the calculation of our interest payments was 6.0% related to the New Term Loan Agreement.
- (b)
- As of March 31, 2011, the New Revolving Credit Facility had a balance of $40.0 million outstanding and a letter of credit of $1.4 million held against it. The availability under the New Revolving Credit Facility was $23.6 million. The $40.0 million outstanding on the New Revolving
79
Credit Facility is not due within one year; however, we intend to retire it during the year ending December 31, 2011.
- (c)
- The interest rate used in the calculation of interest payments was 2.97% related to the New Revolving Credit Facility.
Off-Balance Sheet Arrangements
None.
Recently Issued Accounting Pronouncements
In May 2011, the Financial Accounting Standards Board, or FASB, issued Accounting Standards Update, or ASU, No. 2011-04 "Amendments to Achieve Common Fair Value Measurement and Disclosure Requirements in U.S. GAAP and IFRSs." The amendments in this update generally represent clarifications of Topic 820, but also include some instances where a particular principle or requirement for measuring fair value or disclosing information about fair value measurements has changed. This update results in common principles and requirements for measuring fair value and for disclosing information about fair value measurements in accordance with GAAP and International Financial Reporting Standards, or IFRSs. The amendments in this update apply to all reporting entities that are required or permitted to measure or disclose the fair value of an asset, a liability, or an instrument classified in a reporting entity's shareholders' equity in the financial statements. The amendments in this update are to be applied prospectively and are effective during interim and annual periods beginning after December 15, 2011. Early application is not permitted. We will monitor any impact the amendment may have after the adoption date.
In January 2010, the FASB issued ASU 2010-06 "Improving Disclosures about Fair Value Measurements" which requires new disclosures and clarifies existing disclosure requirements. The purpose of these amendments is to provide a greater level of disaggregated information as well as more disclosure around valuation techniques and inputs to fair value measurements. The provisions of this guidance were effective as of January 1, 2010, and the adoption of this guidance is limited to disclosures in our consolidated financial statements. Certain provisions of this guidance are required for annual reporting periods beginning after December 15, 2010 and for interim periods. The amendment did not have any impact on our consolidated financial statement disclosures for the periods beginning after December 15, 2010.
In December 2010, the FASB issued ASU 2010-29 "Disclosure of Supplementary Pro Forma Information for Business Combinations" which requires a public entity to disclose pro forma information for business combinations that occurred in the current reporting period. The disclosures include pro forma revenue and earnings of the combined entity for the current reporting period as though the acquisition date for all business combinations that occurred during the year had been as of the beginning of the comparable prior annual reporting period only. The amendments in this update also expand the supplemental pro forma disclosures under Topic 805 to include a description of the nature and amount of material, nonrecurring pro forma adjustments directly attributable to the business combination included in the reported pro forma revenue and earnings. The amendments in this update are effective prospectively after the beginning of the first annual reporting period of December 15, 2010. The amendment did not have an impact on our consolidated financial statement disclosures for the periods beginning after December 15, 2010. We continue to monitor changes that would trigger the application of this update.
In December 2010, the FASB issued ASU 2010-28 "When to Perform Step 2 of the Goodwill Impairment Test for Reporting Units with Zero or Negative Carrying Amounts" which affects all entities that have recognized goodwill and have one or more reporting units whose carrying amount for purposes of performing Step 1 of the goodwill impairment test is zero or negative. As of December 31,
80
2010 none of our reporting units had a zero or negative carrying amount. We will monitor any changes in the goodwill of our reporting units that will trigger the application of this amendment.
In December 2009, the FASB issued ASU 2009-17 "Improvements to Financial Reporting by Enterprises Involved with Variable Interest Entities" which require companies to perform an analysis to determine whether the enterprise's variable interest or interests give it a controlling financial interest in a Variable Interest Entity (VIE). The guidance requires ongoing assessments of whether an enterprise is the primary beneficiary of a VIE, requires enhanced disclosures and eliminates the scope exclusion for qualifying special-purpose entities. The provisions of this guidance were effective as of January 1, 2010, and the guidance did not have any impact on our consolidated financial statements.
Changes in and Disagreements with Accountants on Accounting and Financial Disclosure
Prior Independent Registered Public Accounting Firm
On March 26, 2010, the audit committee of our board of directors voted to dismiss Deloitte and Touche LLP, or Deloitte, as our independent registered public accounting firm, effective as of March 26, 2010. We informed Deloitte of the decision on March 26, 2010.
Deloitte's report on our consolidated financial statements as of and for the years ended December 31, 2009 and December 31, 2008 contained no adverse opinion or disclaimer of opinion, and was not qualified or modified as to uncertainty, audit scope or accounting principles. The audit report of Deloitte on the effectiveness of our internal control over financial reporting as of December 31, 2009 did not contain an adverse opinion, nor was it qualified or modified as to uncertainty, audit scope or accounting principles. During the fiscal years ended December 31, 2009 and December 31, 2008 and through March 26, 2010, there were no disagreements with Deloitte on any matter of accounting principles or practices, financial statement disclosure or auditing scope or procedure, which disagreements, if not resolved to the satisfaction of Deloitte, would have caused it to make reference to the subject matter of the disagreements in its reports for such years. During the fiscal years ended December 31, 2009 and December 31, 2008 and through March 26, 2010, there were no reportable events as defined in Item 304(a)(1)(v) of Regulation S-K, except that, as described in Item 9A(T) of our Annual Report on Form 10-K for the year ended December 31, 2008, we reported a material weakness in our internal controls over financial reporting related to income taxes as of December 31, 2008, which was remediated as of December 31, 2009.
We provided Deloitte with a copy of the above disclosure and requested that Deloitte provide us with a letter addressed to the SEC stating whether or not Deloitte agrees with the above disclosures and, if not, stating the respects in which it does not agree. A copy of that letter, dated April 1, 2010, was filed as Exhibit 16.1 to our Form 8-K filed with the SEC on April 1, 2010.
New Independent Registered Public Accounting Firm
On March 26, 2010, the audit committee of our board of directors engaged PricewaterhouseCoopers LLP, or PwC, to serve as our independent registered public accounting firm to audit our consolidated financial statements for the year ended December 31, 2010. During the years ended December 31, 2009 and 2008, and the subsequent interim period through March 26, 2010 (the date of engagement of PwC), neither we, nor any person acting on our behalf, consulted PwC regarding the application of accounting principles to a specific completed or proposed transaction, the type of audit opinion that might be rendered on our financial statements, or any matter that was either the subject of a disagreement as defined in Item 304(a)(1)(iv) of Regulation S-K or a reportable event as described in Item 304(a)(1)(v) of Regulation S-K.
81
Quantitative and Qualitative Disclosures About Market Risk
Interest Rate Risk
We are subject to interest rate market risk in connection with our long-term debt. As of December 31, 2010, our principal interest rate exposure related to the Floating Rate Notes, the amounts outstanding under the Old Term Loan Agreement and any outstanding amounts under the Old Revolving Credit Facility. In addition, the market value of the Fixed Rate Notes would fluctuate with interest rates. On February 18, 2011, we entered into the New Term Loan Agreement and the New Revolving Credit Facility and used some of the proceeds to refinance the Floating Rate Notes, the Old Term Loan Agreement and the Old Revolving Credit Facility.
Borrowings under the New Term Loan Agreement bear interest at a fluctuating rate, and each quarter point increase or decrease in the interest rate would change our interest expense by approximately $0.7 million per year. Borrowings under our Old Term Loan Agreement bore interest at a fluctuating rate, and each quarter point increase or decrease in the interest rate would change our interest expense by approximately $0.1 million per year. Our New Revolving Credit Facility provides, and our Old Revolving Credit Facility provided, for borrowings of up to $65.0 million, which also bear interest at variable rates. Assuming the New Revolving Credit Facility is fully drawn, each quarter point increase or decrease in the applicable interest rate would change our interest expense by approximately $0.2 million per year. Our Floating Rate Notes bore interest at variable rates based on LIBOR. Each quarter point increase or decrease in the interest rate would change our interest expense by approximately $0.3 million per year. In the future, we may enter into interest rate swaps, involving the exchange of floating for fixed rate interest payments, to reduce interest rate volatility.
Inflation
Our cost of sales is subject to inflationary pressures and price fluctuations of the raw materials we use, particularly, the cost of petrochemical resin. Historically, we have generally been able over time to recover the effects of inflation and price fluctuations through sales price increases and production efficiencies associated with technological enhancements and volume growth; however, we cannot reasonably estimate our ability to successfully recover any price increases.
Raw Material; Commodity Price Risk
We rely upon the supply of certain raw materials and commodities in our production processes; however, we do not typically enter into fixed price contracts with our suppliers. The primary raw materials we use in the manufacture of our products are various petrochemical resins, primarily PVC and olefins, including HDPE and PP. In addition, we utilize a variety of other additives including modifiers, TiO2 and pigments. The exposures associated with these costs are primarily managed through terms of the sales and by maintaining relationships with multiple vendors. Prices are negotiated on a continuous basis and we have not entered into hedges with respect to our raw material costs. We generally buy resin and other materials on an as-needed basis but have occasionally made strategic purchases of larger quantities.
Prices of our key materials may continue to fluctuate as a result of changes in natural gas, crude oil, ethylene, MMA and TiO2 prices. The instability in the world market for petroleum and TiO2 and in the North American ethylene, MMA and natural gas markets could materially adversely affect the prices and general availability of raw materials. Over the past several years, we have at times experienced rapidly increasing material prices primarily due to the increased cost of oil, natural gas, ethylene, MMA and TiO2. Due to the uncertainty of these prices, we cannot reasonably estimate our ability to successfully recover any price increases. Even if we are able to pass these price increases on to our customers, we may not be able to do so on a timely basis, our gross margins could decline and we may not be able to implement other price increases for our products. To the extent that increases in
82
the cost of materials cannot be passed on to our customers, or the duration of time lags associated with a pass through becomes significant, such increases may have a material adverse effect on our profitability and cash flow. Also, increases in material prices could negatively impact our competitive position as compared to products made of other materials, such as wood and metal, that are not affected by changes in the price of our raw materials.
Our raw material supplies are subject to not only price fluctuations but also other market disturbances including supply shortages and natural disasters. In the event of another industry-wide general shortage of resins and other additives we use, or a shortage or discontinuation of certain types or grades of materials purchased from one or more of our suppliers, we may not be able to arrange for alternative sources of materials. In the past, we have been able to maintain necessary raw material supplies, but such shortage may negatively impact our production process as well as our competitive position versus companies that are able to better or more cheaply source materials.
83
Our Company
We are a leading manufacturer and innovator of low maintenance, premium branded synthetic building products that are replacing wood, wood composites, metal and other materials in the residential, institutional, commercial and industrial end-markets. Across each of our three operating segments, AZEK Building Products, Scranton Products and Vycom, we have market-leading brands and products that offer a compelling value proposition, including enhanced durability and quality, attractive aesthetics and lower installation, maintenance and life cycle costs. We offer exterior residential building solutions including trim, deck, rail, moulding and porch products through our AZEK Building Products segment, interior institutional and commercial solutions including bathroom partitions and lockers through our Scranton Products segment and highly-engineered industrial plastic sheet products through our Vycom segment. AZEK holds the #1 market share position in the North American PVC trim and deck markets, Scranton Products holds the #1 market share position in the plastic bathroom partition and plastic locker markets and Vycom is a recognized leader in several of its target markets.
Our products are currently in the early growth stage of their life cycles, and we believe we will continue to outperform our markets by taking advantage of the significant conversion, penetration and market expansion opportunities that exist. We continue to drive increased material conversion towards our products through product innovation, an extensive and growing sales and distribution network targeting and educating key influencers and decision makers, and selected acquisitions. Since 2001, we have grown our sales by a CAGR of 15.0% to $327.5 million for the year ended December 31, 2010.
We operate on a national basis in all 50 states and in Canada. Over 97%, 96% and 97% of our sales in 2010, 2009 and 2008, respectively, were in the United States. In 2010, approximately 47% of our products were sold into the residential repair and remodeling market, 18% into the residential new construction market, 18% into the institutional and commercial construction markets, with the remaining 17% sold into various industrial end-markets. For certain financial information about our segments and geographic areas, see Note 2 to our audited consolidated financial statements included elsewhere in this prospectus.
Our Operating Segments
We operate the following three operating segments:
- •
- AZEK Building Products manufactures exterior building solutions including trim, deck, rail, moulding and porch products
for residential markets;
- •
- Scranton Products produces interior institutional and commercial solutions including bathroom partitions and lockers under
the Hiny Hiders, Resistall and TuffTec labels for institutional and commercial markets; and
- •
- Vycom manufactures a comprehensive offering of highly-engineered plastic sheet products including Celtec, Seaboard, Playboard, Sanatec, Corrtec and Flametec for special applications in industrial markets.
Our operating segments are end-market focused and operate under the same philosophy of identifying market needs and being the first to provide relevant and innovative solutions for the most demanding applications across the United States and in Canada. Our AZEK Building Products, Scranton Products and Vycom operating segments represented approximately 65%, 18% and 17%, respectively, of our net sales in the year ended December 31, 2010.
Our History and Corporate Information
With a focus on manufacturing excellence and quality over the past 27 years, we have been first to market with a number of low maintenance, premium branded synthetic building products that offer
84
compelling value propositions. Our transition from a plastic sheet manufacturer to an advanced materials and solutions provider began in 1990, when we saw an opportunity to extend further into the value chain by targeting the bathroom partition market. In 1999, we entered the residential building products market with our Trimtec cellular PVC trim product that subsequently was rebranded to AZEK Trim in 2001. Since May 2005, AEA Investors has owned a majority interest in our company. Since that time, we have continued to innovate and expand our product offering and have continued to enhance our brands through selected strategic acquisitions, including:
- •
- Santana Products (April 2006): We combined Santana Products with our
existing partition business to form the basis of what is now our Hiny Hiders plastic bathroom partition product line.
- •
- Procell Decking Systems (January 2007): The integration and rebranding of
Procell into our AZEK Deck brand and our extensive distribution network has been critical to our recent success in the deck market. We not only successfully integrated the acquisition, but also
leveraged AZEK's existing brand equity to bolster Procell's product profile and significantly increase its sales. We have also utilized our product development strength to improve the color and
aesthetics of the products.
- •
- Composatron (February 2008): Composatron was a manufacturer of composite railing systems for the residential housing market, which we rebranded as AZEK Rail. In integrating the acquisition, we leveraged AZEK's existing brand equity to bolster the product profile and utilized our product development strength to improve the color and aesthetics of the railing systems and simplify the installation process.
CPG International Inc. is a Delaware corporation and was initially formed in March 2005 as a Delaware limited partnership under the name Compression Polymers Holding II LP. It was converted into a corporation in May 2005 under the name Compression Polymers Holding II Corporation and changed its name to CPG International Inc. in June 2006. In May 2005, CPG International Inc. acquired all the equity interests of the operating subsidiaries of Compression Polymers Holdings LLC, a Delaware limited liability company. References to our company prior to May 2005 are to Compression Polymers Holdings LLC as our predecessor.
Our Industry and End-Markets
We sell our low maintenance synthetic products into a variety of large, attractive segments within the U.S. construction market, which includes residential, institutional, commercial and industrial end-markets. We also sell certain Vycom products into industrial OEM markets. Overall demand for building products is driven by a number of factors, including consumer confidence, availability of credit, trends in the construction cycle and general economic cycles. Examples of specific industry dynamics that we believe impact our company include increasing demand for low maintenance products and lower life cycle costs, greater focus on energy efficiency and homeowners' desire for increased use of outdoor living space. We believe these trends have and will continue to drive growth in our specific end-markets at a rate above the broader U.S. construction market. In addition, according to a market study by L.E.K. that we commissioned in March 2011, these addressable end-markets, which collectively represented approximately $4.9 billion in 2010 sales, are in the midst of significant material conversion from wood, wood composites, metal and other materials to synthetic products made from materials including PVC and HDPE. Synthetic materials are increasingly being substituted for traditional building materials such as wood and metal, due to their aesthetics, lower life cycle costs and greater overall value proposition. Synthetic building products were first introduced decades ago in the residential window and siding markets and have the number one market share in those markets today. As a result of the successful penetration of these early applications and continued advances in material science and manufacturing, synthetic materials have more recently increased their share in other building product
85
segments such as deck, trim and rail within the residential market, and bathroom partitions and lockers in the institutional and commercial markets.
We believe low maintenance synthetic products offer a compelling value proposition, including enhanced durability and quality, attractive aesthetics and lower installation, maintenance and life cycle costs relative to traditional and other materials, such as wood, wood composites and metal. For example, over a projected 20 year period, L.E.K. estimates that cellular PVC-based deck products will have approximately 50% lower life cycle costs than wood and wood composites. Cellular PVC-based products have continued to take market share from traditional materials and other synthetic materials, due to their superior product qualities. For example, according to L.E.K., penetration of low maintenance products, of which cellular PVC-based is the largest category, in the $1.8 billion deck market has nearly tripled from 4% in 2008 to 11% in 2010 and is anticipated to continue to increase over the next several years.
The following table illustrates the size of the addressable market opportunity by sales dollars for select product categories and the anticipated increase in penetration of low maintenance products over the next several years. In addition, the following chart presents an illustrative penetration curve of our synthetic product categories compared to certain building products made of other materials.
Selected Addressable Market Opportunities
($ in millions)
| |
|
Low Maintenance Penetration |
||||
|---|---|---|---|---|---|---|
| |
2010 Total North American Market Size (All Materials) |
|||||
| |
2010 | 2015E | ||||
Trim |
$1,050-1,150 | 17-19% | 21-23% | |||
Deck |
$1,700-1,800 | 10-12% | 19-21% | |||
Rail |
$1,400-1,500 | 6-8% | 13-15% | |||
Partitions |
$250-270 | 33-38% | 35-40% | |||
Lockers |
$290-310 | 4-5% | 5-6% | |||
Source: L.E.K.
Building Products Illustrative Penetration Curve
Source: L.E.K.
Exterior Residential Building Products (AZEK)
Trim. The size of the trim market was approximately $1.1 billion in 2010 as measured in sales. Within this market, wood, wood composites and PVC are the most commonly used materials and represented approximately 64%, 15% and 18% of the market based on 2010 sales, respectively. PVC trim offers key advantages to contractors and installers that include superior product characteristics and ease of installation, with substantially less wasted material and typically greater profitability. The PVC trim market is expected to represent approximately 22% of the trim market by 2015.
Deck. The size of the deck market was approximately $1.8 billion in 2010 as measured in sales. Wood, wood composites and low maintenance, of which cellular PVC is the largest category, are the three largest segments of the deck market and represented approximately 62%, 27% and 11% of the market based on 2010 sales, respectively. The deck market in the United States has grown considerably over the past few decades due to homeowners' desire for increased use of outdoor living space. Low maintenance deck, including cellular PVC deck, has been an especially attractive alternative, having nearly tripled its penetration of the overall deck market from 4% in 2008 to 11% in 2010. As customers continue to recognize the benefits of cellular PVC relative to other traditional and wood
86
composite deck materials, the low maintenance deck market is expected to represent approximately 20% of the deck market by 2015.
Rail. The size of the rail market was approximately $1.5 billion in 2010 as measured in sales. Wood rail products held the largest share with 69% of the market based on 2010 sales, while vinyl, wood composites and premium (e.g., capped composites) represented approximately 16%, 4%, 7% of the market based on 2010 sales, respectively. Premium rail products have high durability and low maintenance characteristics, which appeal to contractors, installers and homeowners. The premium rail market is expected to represent approximately 14% of the rail market by 2015.
Institutional and Commercial Partitions and Locker Products (Scranton Products)
Key customers of bathroom partitions and lockers include schools, hospitals, prisons, restaurants, retailers, stadiums and other commercial establishments. Historically, these customers have selected metal products due to their lower upfront cost and fire safety attributes. Synthetic materials, including HDPE, have been gaining market share due to their low maintenance and durability benefits as well as an extensive array of aesthetically pleasing colors, textures and finishes.
The bathroom partition market was approximately $260 million in 2010. Metal and HDPE are currently the most commonly used bathroom partition materials, representing approximately 34% and 36% of the market based on 2010 sales, respectively. Due to its superior product attributes and customer-specified designs, HDPE typically has a higher upfront cost than metal but provides a better lifetime solution relative to metal. HDPE bathroom partitions are expected to gain market share and represent approximately 38% of the bathroom partition market by 2015.
The locker market was approximately $300 million in 2010 and is currently dominated by metal, which represented approximately 88% of the market based on 2010 sales. HDPE accounted for approximately 5% of the overall locker market in 2010 sales. This segment is expected to represent approximately 6% of the market in 2015.
Olefin and PVC Sheet Products (Vycom)
Vycom operates in the olefin and PVC plastic sheet segments of the broader industrial OEM market. Plastic sheet products are used in a variety of specific applications where their high durability and low maintenance characteristics are critical. The olefin plastic sheet market was approximately $120 million in 2010 and is expected to grow, driven by increased material conversion. The PVC sheet market was approximately $140 million in 2010 and is expected to grow, driven by increased penetration in a wide array of segments including display boards, semiconductor factory investment and other industrial applications.
End-Market Trends
Our products are sold into residential new construction and repair and remodeling, institutional, commercial and industrial end-markets. Over the last several years, the general economy, and particularly the U.S. construction market, experienced a significant downturn. However, we began to see recovery in many of our end-markets beginning in 2010.
The outlook for the residential repair and remodeling market, which was more resilient through the recent economic downturn than the new construction market, is favorable. The residential repair and remodeling market began to recover in 2010 and is poised for significant growth, driven by positive demographic trends, the recent underinvestment in home repair and remodeling, and a growing and aging housing stock. L.E.K. expects the residential repair and remodeling market to grow by a CAGR of approximately 4% between 2010 and 2015.
87
The outlook for new residential construction in the United States also is favorable. During 2009 and 2010, average new housing starts grew modestly to approximately 554,000 and 587,000, respectively, according to statistics from the U.S. Census Bureau. L.E.K.'s housing starts forecast from 2010 to 2015 estimates a CAGR of approximately 19%, with new housing starts reaching approximately 1.4 million in 2015. This forecasted growth in new home construction is supported by strong demographic trends, continued household formation, population growth, attractive mortgage rates and low new home inventory levels. Harvard University's Joint Center for Housing Studies expects that the number of households in the United States will grow by approximately 1.3 million to 1.5 million per year on average between 2010 and 2020, or a total of approximately 12.5 million to 14.8 million additional households, over the same period.
While 2010 remained challenging in our institutional and commercial end-markets, these markets are late-cycle in nature and are expected to benefit from greater access to financing and a continued general economic recovery. L.E.K. forecasts that U.S. commercial construction markets will increase by a CAGR of approximately 8% and the education segment of the institutional construction market will increase by a CAGR of approximately 2%, in each case from 2010 to 2015.
The industrial market is tied to the health of the industrial economy as commonly represented as growth in industrial production. Coming out of the recent recession, U.S. industrial production began to increase in the second half of 2009, and grew 5.3% in 2010, according to data from the U.S. Federal Reserve. L.E.K. forecasts U.S. industrial production to grow at an annual rate of approximately 3% through 2015.
Industry Sources
Below is an overview of the industry sources that we cite in this prospectus:
- •
- L.E.K. Consulting: L.E.K. is a global strategy consulting
firm with offices across Europe, the Americas and Asia-Pacific, which advises and supports global companies, providing strategic guidance covering a variety of different market segments.
The L.E.K. data used in this prospectus was obtained from a market study that we commissioned in March 2011. In developing its market study, L.E.K. utilized primary research and analysis
together with certain third party data.
- •
- Harvard University's Joint Center for Housing Studies: The
Joint Center for Housing Studies is Harvard University's center for information and research on housing in the United States. The Joint Center analyzes the dynamic relationships between housing
markets and economic, demographic, and social trends, providing leaders in government, business, and the non-profit sector with the knowledge needed to develop effective policies and
strategies. The data used in this prospectus was obtained from the public website of the Joint Center for Housing Studies and not through a subscription.
- •
- U.S. Census Bureau's New Residential Construction
Statistics: The U.S. Census Bureau issues statistics on new residential construction on a monthly basis, jointly with the Department of
Housing and Urban Development. The data used in this prospectus was obtained from the public website of the U.S. Census Bureau and not through a subscription.
- •
- U.S. Federal Reserve's Monthly Index of Industrial Production: The U.S. Federal Reserve prepares a monthly index of industrial production and related capacity indexes and capacity utilization rates, which cover manufacturing, mining, and electric and gas utilities. The data used in this prospectus was obtained from the public website of the U.S. Federal Reserve and not through a subscription.
88
Our Competitive Strengths
Market leader in large, attractive and high growth sectors. We maintain leading market positions in a number of highly attractive, large and underpenetrated markets in the early stages of material conversion. Our market-leading products are designed to replace materials such as wood, wood composites, metal and other materials. Our AZEK brand currently holds the #1 market share position in the North American PVC trim and deck markets. In 2010, the total market size for all materials in the trim, deck and rail markets was approximately $4.3 billion and, at AZEK, we are currently pursuing additional opportunities within the broader North American exterior residential building products market. In addition, Scranton Products currently holds the #1 market share position in plastic bathroom partitions and plastic lockers, and Vycom is a recognized leader in several of its target markets. Overall, at Scranton and Vycom, we are currently pursuing approximately $800 million of market opportunities.
Our high quality synthetic products are currently in the early growth stage of their life cycles, and we believe that we will continue to outperform our markets by taking advantage of the significant conversion, penetration and market expansion opportunities that exist. For example, according to L.E.K., PVC trim, low maintenance deck and premium rail products are expected to grow from approximately 18%, 11% and 7% of the total U.S. trim, deck and rail markets, respectively, based on 2010 sales to 22%, 20% and 14% by 2015. We believe that our first-to-market and innovation focused strategy continues to expand the size of the market opportunity beyond traditional products. Additionally, we believe that the anticipated recovery in the residential, institutional, commercial and industrial construction markets will further provide an opportunity for growth.
Premium brands supported by unwavering commitment to product quality, innovation and service. Our flagship brands are recognized for high quality products within their respective residential, institutional, commercial and industrial end-markets. For example, ProSales magazine's most recent study of professional dealers found that AZEK Deck is the #1 deck brand "most likely to be stocked." At Scranton Products, we are the #1 specified brand by architects in bathroom partitions. Similarly, our various Vycom brands are highly recognized in their specific market categories. We have achieved our premium brand reputation because of our unwavering commitment to consistently provide high quality and innovative products, and a high level of customer service. We proactively work with and solicit feedback from distributors, dealers, architects, contractors, builders and consumers to better develop products that address unmet customer needs, reduce costs, increase ease of installation and improve aesthetics. These efforts are supported by our R&D process that has resulted in 28 successful new product introductions in the last two years, including AZEK Deck Arbor Collection® and Scranton's Resistall Partitions. For the year ended December 31, 2010, our new products introduced in the last two years represented 15.3% of our total sales.
Broad and expanding product offering with superior performance characteristics. We believe our products provide a superior value proposition throughout our supply chain from distributors to dealers and retailers, contractors, builders, architects and ultimately to consumers. The performance characteristics of our products relative to competing products result in lower installation, maintenance and life cycle costs. AZEK's trim, deck, rail, moulding and porch products are aesthetically similar to finished wood but are stain, split and scratch resistant, do not rot or warp, are impervious to water and insect infestation, do not require paint or stains for protection, are easier to mill and fabricate and hold paint longer if paint is desired. As a result, our AZEK trim and deck products have lower life cycle costs than traditional and other materials, such as wood and wood composites. For example, over a projected 20 year period, L.E.K. estimates that cellular PVC-based deck products will have approximately 50% lower life cycle costs than wood and wood composites. For contractors and builders, the performance and workability characteristics of our AZEK products contribute to lower installation costs and fewer call-backs from consumers. The products we offer through our Scranton Products and
89
Vycom segments have similar attributes valued by our customers. As a result of our products' excellent performance characteristics, we have also developed high customer satisfaction and brand loyalty.
We believe the breadth and depth of our product offering gives us a significant competitive advantage in the marketplace. Through our strong manufacturing and technical capabilities and commitment to innovation, we focus on consistently expanding our product offering and the markets we serve. We have one of the broadest synthetic product offerings in our industry segment. Within the past five years we have expanded our AZEK product line from offering primarily trim products to currently offering a broad range of exterior residential building products including trim, deck, rail, moulding and porch. As a result of our product expansion, we believe we have tripled the average potential spend per home for our AZEK products over the past five years.
Comprehensive and growing sales and distribution network. We have developed a tailored sales and distribution strategy focused on educating key influencers and decision makers along the entire supply chain, which we believe will continue to drive further conversion, penetration and growth for our products. We sell our AZEK products through a two-step distribution system across the United States and in Canada, utilizing 59 independent distribution locations that cover over 2,800 stocking dealers and retail outlets supplying more than 2,850 AZEK-registered contractors. We recently expanded AZEK's presence in the retail channel and expect to significantly increase our presence in home centers for our AZEK Deck product. We sell Scranton Products through a national network of more than 1,850 dealers who sell to institutional and commercial customers across the United States and in Canada. Vycom is sold to a national network of more than 250 plastic distributors across the United States, Canada and Latin America, who sell primarily to OEMs.
We significantly invested in our sales force infrastructure across each operating segment through the recent economic downturn by increasing headcount, enhancing training, and implementing a highly integrated CRM system to increase sales efficiency. We also recently realigned our entire sales force to maximize downstream pull-through demand. We supplement the efforts of our sales force with a variety of marketing strategies and tools that include more than 4,000 contractor sample kits and 1,150 display kiosks, product literature, print, TV and radio advertising, tradeshows, internet marketing and social media initiatives, sales training and our AZEK University program to educate distributors, dealers, architects, contractors and builders on the advantages of our products. We believe that our distribution strategy, sales and education efforts, and strong customer relationships provide a strong competitive advantage and are difficult for our competitors to replicate.
Strong technical and manufacturing capabilities. Our disciplined, process-oriented operations are built on a foundation that includes deep technical expertise, proprietary material formulations, a broad range of extrusion capabilities, meaningful scale and capacity, and post-extrusion value-add capabilities that enable innovation and expansion into new markets. We are a low-cost, vertically integrated manufacturer focused on continuous improvement and critical-to-quality processes which allow us to obtain high throughput and lower unit production costs while maintaining product integrity. We believe our manufacturing processes are environmentally sustainable and we grind and reuse nearly all of our scrap. We continued to make capital investments in our technical capabilities and manufacturing systems throughout the recent economic downturn, which we believe will drive operating leverage as we continue to grow our businesses.
Strength of operating model supports growth and overall financial profile. We believe that our operating model has driven our strong growth and market outperformance as well as the development of our industry-leading suite of high quality, innovative products. We believe we provide a superior value proposition throughout the supply chain through our focus on innovation, our technical manufacturing capabilities, our commitment to providing excellent customer service, and the quality of our products. Through our downstream focused sales force infrastructure, go-to-market strategy, and
90
extensive and growing distribution network, we have successfully positioned our products as premium brands within their respective market categories.
Despite the challenging economic environment, our substantial indebtedness, which totaled $325.5 million as of March 31, 2011, and fluctuating raw material prices, we have continued to profitably grow our businesses over the past several years. In the year ended December 31, 2010, we achieved consolidated revenue growth of 23% over 2009, driven by strong gains at AZEK and Vycom of 30% and 53%, respectively. We have also maintained attractive margins, returns on capital and strong free cash flow generation, and we continue to invest in our businesses.
Committed and experienced management team. We have an experienced and committed management team led by our Chief Executive Officer Eric Jungbluth. Mr. Jungbluth has significant experience in the building products industry including prior roles as President of The HON Company (division of HNI Corporation) and President of Allsteel Inc. as well as leadership positions at Moen Incorporated (division of Fortune Brands), Kirsh (division of Newell), and Warner Lambert.
Collectively, our senior management team has over 120 years of cumulative industry or related industry experience, with certain members having held leadership positions at a number of leading industrial companies, including Sherwin Williams Paint Company, James Hardie Building Products, Silgan Plastics, Gunlocke Company, SI Handling Systems, Lutron Electronics, and Lockheed Martin Company.
Senior management has extensive experience in branding, channel management, new product development, and creating world-class business processes. Of particular note are the improvements made to the new product development processes and our sales force effectiveness led by Mr. Jungbluth and Donald Wharton. Other examples include the implementation of SAP Business 1 ERP system as well as Sarbanes-Oxley controls led by Scott Harrison, the improvement in manufacturing systems and safety processes led by Jason Grommon, and the implementation of employee feedback and succession planning processes led by Ken Buck.
Our Business Strategy
Capitalize on continued material conversion and market penetration opportunities. We believe that we will continue to realize significant growth due to our focused efforts to drive material conversion and market penetration of our products, particularly in exterior residential applications for AZEK. We intend to increase conversion and penetration in our markets by educating key influencers and decision makers, which in turn creates pull-through demand for our products. Our integrated approach to understanding the needs and preferences throughout our supply chain enables us to drive conversion by customizing our products to address key shortcomings of alternative products. Our business strategy and marketing efforts are also focused on driving market penetration through a tailored regional market approach. Through these initiatives, we plan to continue to increase the size of the market for our products and enhance growth opportunities beyond our existing product portfolio.
Continue to introduce innovative new products in existing and adjacent markets. We have a history of being a first-to-market innovator focused on R&D and continued product innovation. We utilize a market-focused and solutions-driven approach to innovation by soliciting feedback from distributors, dealers, contractors, builders, architects and consumers in order to develop products that appropriately address their unmet needs. These efforts are supported by our in-house R&D process led by a dedicated staff committed to innovation and continuous improvement of our products. As a result of this strategy, we have developed a robust new product pipeline, which includes new trim, deck, rail, moulding and porch applications, and we are currently developing potential products in the siding category. However, we will need to conduct testing of these products prior to any market introduction. Products that we have developed within the last two years represented 15.3% of our sales for the year ended December 31, 2010, and we believe this trend will continue to grow going forward. We believe
91
that our downstream-focused approach allows us to anticipate market trends and needs, thereby creating additional conversion opportunities, expanding the size of our addressable market, enhancing our overall growth opportunities, and further differentiating us from our competition.
Expand and enhance awareness of our premium brands. The strength of our flagship brands is driven by our reputation for quality and innovation. We developed our strong brand identity by consistently offering a high quality product and by focusing on achieving a high level of customer satisfaction. We intend to continue to invest in our branding efforts through product literature, print, TV and radio advertising, tradeshows, internet marketing and social media initiatives, and sales training. We have also successfully extended our brand through strategic product acquisitions such as Procell (now AZEK Deck) and Composatron (now AZEK Rail) and believe this will continue to be an opportunity in the future. Our continued success is dependent on the strength of our AZEK brand and the performance of our AZEK products, which represent a significant portion of our net sales. We believe that the successful execution of our brand strategy will allow us to accelerate our conversion rate, increase market penetration and enter new end-markets.
Continue to expand our distribution network and sales force. We distribute our products through an extensive and growing multi-channel national distribution network. Since 2001, we have increased the number of AZEK stocking dealers and retail outlets from 150 to over 2,800, including a recent introduction and expansion of our big-box retail presence. While we have significantly expanded our distribution network over the past several years, there still remain sizeable geographic and market expansion opportunities going forward in all of our operating segments. For example, according to L.E.K., the use of low maintenance deck products, of which cellular PVC is the largest category, as a percentage of total deck purchases is expected to increase from approximately 11% in 2010 to 20% in 2015 based on sales. We have also realigned our sales force to enhance geographic and channel coverage and to increase downstream pull-through demand. By continuing to expand our distribution network and to invest in our sales force infrastructure, we seek to accelerate the penetration of our products and expand the size of our addressable markets.
Leverage and enhance our operational and technical capabilities. Our strong extrusion, materials science and overall technical capabilities provide an excellent opportunity to drive innovation and further expand our markets. We believe our process-driven and disciplined operational approach and focus on continuous improvement enables us to continue to innovate, improve product quality and further reduce costs. Through our scalable operating model, we plan to continue making investments that will enhance our extrusion and materials formulation expertise with a view to maintaining our market leading positions, stimulating growth and enhancing our overall financial profile.
Our Products
Our products offer a compelling value proposition, including enhanced durability and quality, attractive aesthetics and lower installation, maintenance and life cycle costs.
AZEK Building Products
AZEK Buildings Products provides low-maintenance exterior residential building solutions designed to reduce installation costs for contractors and builders and life-cycle ownership costs for homeowners without sacrificing aesthetics. AZEK products are aesthetically similar to finished wood but require less upkeep and offer many functional advantages, as they do not rot or warp, are impervious to water and insect infestation and do not require paints or stains for protection. The AZEK Trim and AZEK Moulding product lines offer a variety of cellular PVC products for exterior housing applications such as trim, fascia, soffit, cornerboards, millwork, mouldings and window and door casements. AZEK Deck and AZEK Porch products include cellular PVC decking systems and porch boards for exterior living spaces. AZEK Rail offers a variety of exterior railing systems that complement other AZEK products. AZEK's products include:
92
- •
- AZEK Trim: AZEK Trim was the first non-wood
trim product to be listed with the ICC Evaluation Service, a non-profit company that does technical evaluations of building products, components, methods and materials. Our free foam
cellular PVC technology produces a product that has a high degree of uniformity, durability, workability and beauty, and the availability of a matte finish is a key aesthetic differentiator against
other vinyl or PVC products. Product offerings under AZEK Trim include (i) AZEK Traditional and Frontier trim, (ii) AZEK Sheet, intended for pop-out bay windows, raised
panels and dormers and easily used for applications over 4'x20', (iii) AZEK to Mill (ATM), which represents the first free foam PVC product to be manufactured at a full 1.25" thickness, making
it easier to fabricate thicker profiles such as window sills and custom millwork, (iv) AZEK Beadboard, which can be used for wainscoting, porch ceilings, soffits and hot tub surrounds, and
(v) AZEK Cornerboard, which is pre-formed for easy installation, has a seam that resists opening, ensuring a long-term solution.
- •
- AZEK Deck: AZEK Deck offers superior performance
attributes for long-life, low maintenance decking that resists stains, moisture, mold, mildew, scuffs and scratching, and can be used in covered or uncovered areas. AZEK Deck is in the
early stages of a material conversion process from wood and wood composites and other synthetic materials. Unlike wood or composite deck materials, AZEK Deck is a cellular PVC product that does not
contain wood fillers. Our proprietary technology allows our boards to resist stains and scratches, yet be workable like wood, with excellent screw and fastener retention. While the original four
colors offered in AZEK Deck's Harvest Collection®—Brownstone, Clay, Slate Gray and White—have long been popular choices to complement vinyl siding, aesthetic trends
were demanding the development of darker, richer shades of low maintenance PVC deck. To meet that market need, AZEK Deck introduced Fawn® and Kona® of the Terra Collection in
May 2009. These were followed by the 2010 launch of two more color options in the Terra Collection—Sedona® and Tahoe®. Both of these products offer warm, earthy
tones with an enhanced grain texture. Additionally in 2010, AZEK Deck introduced the first three shades in the Arbor Collection—Acacia®, Morado® and Redland
Rose®. These three shades were designed to emulate the rich, vibrant looks of exotic hardwoods with a soft grain texture and unique color variations within each board. In 2011, two
additional colors were added to the Arbor Collection—Cobre® and Silver Oak™—which also mimic the natural aesthetics of exotic wood.
- •
- AZEK Rail: AZEK Rail offers the aesthetics and texture of
real wood coupled with the high durability and low maintenance offered by all of our AZEK products. With three versatile styles, AZEK Premier, Trademark and Reserve, and with expanded color
selections, our customers can find a railing system to complement our deck and porch products.
- •
- AZEK Moulding: AZEK Moulding has the aesthetics and
texture of AZEK Trim and is available in the bestselling moulding profiles. It features the same crisp detail found in authentic wood mouldings, while possessing the longevity and durability that AZEK
Trim products provide.
- •
- AZEK Porch: AZEK Porch offers superior performance attributes similar to AZEK Deck for low maintenance and durability that resists stains, scratching, mold, moisture and splitting, and can be used in covered and uncovered applications. AZEK Porch is made with cellular PVC. Our technology allows our product to resist stains and scratches, yet be workable like wood.
Scranton Products
Scranton Products fabricates bathroom partitions and lockers from synthetic sheet manufactured internally and sells these products under our Hiny Hiders, Resistall and TuffTec brands for the institutional and commercial markets. At Scranton Products, we are the #1 specified brand by architects in bathroom partitions. Unlike competing metal products, our synthetic alternatives are impervious to rust, dents and scratches, are longer-lasting, graffiti and odor resistant, easily cleaned,
93
and require minimal maintenance once installed. We offer an extensive array of aesthetically pleasing colors, textures, and finishes that replicate more traditional materials. As compared to metal alternatives, our partitions and locker products sell at premium prices but deliver significantly reduced life-cycle costs through increased durability and lower maintenance expenses. We recently developed Resistall, a new thermoformed product designed for applications in which product performance, price point and availability are the key purchasing criteria. Additionally, we launched an expanded line of colors and textures in 2010 in an effort to expand into markets with a greater focus on design and aesthetics.
Vycom
Vycom markets a comprehensive line of olefin and PVC sheet solutions to OEMs seeking high performance materials for challenging applications in a variety of industrial end-markets. Vycom products are durable, high strength and lightweight, and can be ordered in a wide range of sizes, thicknesses and colors. We believe the products provide superior performance relative to traditional materials by being more resistant to corrosive chemicals, scratches, flames, odors, moisture, bacteria, rotting, delaminating, chipping and swelling. The products are also easier to fabricate, paint, laminate, weld, machine or thermoform and are frequently lighter weight. Our products are sold under six product families:
| Celtec® | • Graphic and display materials used in point of purchase
displays, store signage, exhibits and other display settings |
|
Seaboard® |
• Marine, RV and outdoor material where water, UV exposure
and other harsh elements exist |
|
Playboard® |
• Playground and recreational material used in modular playground systems, ice rinks and skate parks |
|
Flametec® |
• Proprietary family of fire safe materials, specially
formulated to meet fire compliance requirements, ideal for semiconductor, clean room and chemical processing applications |
|
Sanatec® |
• Specially designed materials for food processing applications that will not absorb moisture or bacteria and meet FDA and the National Sanitation Foundation (NSF) requirements |
|
Corrtec™ |
• Chemical and corrosion resistant polymer options
including PVC, chlorinated polyvinyl chloride, or CPVC, HDPE, PP and copolymer polypropylene, or CoPP, formulations |
Product Development
We have a long history of being a first-to-market innovator focused on R&D and continued product innovation which has created additional conversion opportunities and expanded the size of our addressable market opportunity beyond traditional products. We utilize a market-focused and solutions-driven approach to innovation by soliciting feedback from dealers, distributors, contractors, builders and consumers in order to develop products that appropriately address their unmet needs. As a result, we
94
are able to develop products that maximize the consumer's desire for beauty and durability while simultaneously meeting the contractor's workability and quality requirements and creating value for everyone along the supply chain for our products. These efforts are supported by our five-step in-house R&D process consisting of the following stages, as well as extensive post-delivery follow-up:
- •
- Definition: We define the business opportunity in the
context of influencer and decision maker needs. Based upon extensive research and identification of those unmet needs, we define specific products that would fit strategically within our brand. We
begin to evaluate the financial feasibility of the new product concept and the financial implications for our business.
- •
- Design: We evaluate alternate design concepts against both
the business opportunity and the technical feasibility and put our design concept through extensive influencer and decision maker testing. We determine our patent and legal strategy and devise a
preliminary commercialization plan.
- •
- Development: We engineer our selected concept into a
technically viable product that satisfies business requirements. We finalize our prototype, conduct extensive testing on the product, and finalize our commercialization plan.
- •
- Deployment: We execute all of the functional activities
necessary to produce, market, sell and deliver the product. We complete our pilot runs and finalize our marketing launch materials.
- •
- Delivery: We transition the product from the product development team to our manufacturing and operations team. These teams ensure that end-user, customer, competitive and cost targets are all met according to plan. We launch our extensive pre-planned marketing program, educating consumers, contractors, homebuilders, architects, dealers and distributors on the benefits of our new product.
At each stage of our new product development process, our dedicated product management and engineering team works in conjunction with our sales operations and finance organizations in order to make informed decisions on the merits of continuing with a particular product extension or new product idea. Our emphasis on innovation has allowed us to develop a robust new product pipeline, which includes new trim, deck, rail, moulding and porch applications, and we are currently developing potential products in the siding category. We have introduced 17 new products thus far in 2011 and 5 new deck colors in 2010 within AZEK as well as additional products in our Scranton and Vycom segments. In Scranton, we recently introduced Resistall, our newest partition brand, designed to compete in price-sensitive segments of the bathroom partition market and additionally launched new colors and textures to expand our addressable market. Over the years, Vycom has served as an incubator for new products and categories with both Hiny Hiders partitions and AZEK Trim developed from innovations at Vycom.
Distribution
Our products are distributed throughout an extensive network consisting of distributors, dealers and retailers. We have experienced extensive growth in our expanding nationwide, multi-channel distribution network with more than 4,900 total ultimate stocking points of sale, consisting of lumberyards, retail outlets, distributors and dealers. Through the introduction of distributor councils, dealer councils and other special relationships with key decision makers such as contractors, builders and architects, we have experienced loyalty and low turnover within our sales channels. Our top ten distributors, through more than 40 independent branches, collectively accounted for more than half of our net sales for the year ended December 31, 2010. Our largest distributors, The Parksite Group, through eleven branches, Boston Cedar and Wolf Distributing, each accounted for more than 15% of AZEK Building Product segment sales for the year ended December 31, 2010, and collectively accounted for approximately 49% of total consolidated net sales for the year ended December 31, 2010.
95
In the last quarter of 2010, Wolf Distributing ceased to be a distributor of our products, and subsequently announced plans to source its own private-label building products, including deck, rail and/or porch plank products, in direct competition with AZEK. Subsequently, a substantial portion of the distribution of our products previously handled through Wolf Distributing has been taken over by The Parksite Group. As a result, The Parksite Group currently accounts for a larger share of our net sales compared to the year ended December 31, 2010.
AZEK Building Products dealer network overview
Through a two-step distribution system, AZEK products are sold through an expanding nationwide network of specialty building product distributors with multiple locations who in turn sell to lumberyards and retail outlets. The 59 AZEK distribution locations are equipped to service every region of the United States and service regions of Canada. We have placed significant focus on partnering with distribution to drive incremental downstream demand in the channel. Through initiatives like the introduction of AZEK University, a two-day training program for distributors, dealers, architects, contractors and builders consisting of product knowledge sessions, workshops, plant tours and relationship building, AZEK Building Products has developed the largest and most extensively trained stocking dealer network of any non-wood trim manufacturer in the industry. Our distributors are selling our products to approximately 2,040 local stocking dealers and over 770 stocking big-box retail outlets. In addition, our products can be special ordered through a further 2,500 big-box retail outlets.
Scranton Products dealer network overview
Scranton Products bathroom partition and locker systems are sold through a national distribution network of over 1,850 local dealers who sell to institutional, commercial and industrial customers across the United States and in Canada. We market the benefits of our bathroom partition and locker systems directly to architects and facilities managers, who frequently specify building products by name and material in their designs, enabling us to service the resulting demand through local dealer networks.
Vycom dealer network overview
Vycom products are sold to a national network of over 250 plastic distributors, who in turn sell full sheet and/or fabricated products into a wide variety of components or items for various industrial uses. We are a primary source for several key OEM customers due to the breadth of our non-fabricated product offering.
Sales and Marketing
We have focused on increasing our salaried sales organization across all of our operating segments in order to greater control our go-to-market strategy. This strengthened sales organization is tasked with developing new business, maintaining relationships, and educating influencers and key decision makers, as well as sharing best practices across our company. Over the past several years, we have augmented our advertising efforts by developing instructive, educational and visually appealing product brochures, marketing tools and kits to market our products. We have also invested in print, TV and radio advertising and display kiosks which assist our retail channel in presenting our products in the most effective and compelling fashion. In 2010, we increased our internet marketing efforts by re-designing our website to be more aesthetically pleasing and navigation friendly as well as engaging in search engine optimization efforts and social media campaigns. In conjunction, we have established an integrated CRM software system to facilitate customer management and feedback, product development, customer segmentation and campaign targeting.
96
AZEK sales and marketing
The AZEK sales organization is organized by geographic region. The sales force focuses on actively promoting product awareness and educating the distributor and dealer base on the attractive product characteristics of AZEK products. In regional markets where we have deeply penetrated, the sales organization is composed of Field Sales Representatives, or FSRs, and Channel Managers, or CMs. FSRs focus on generating end-market demand, primarily calling on contractors, builders and architects. CMs focus on high-quality service and product availability and maintain close communication with distributors and dealers (lumberyards). Both FSRs and CMs report to regional managers. For regions that are early in their development stage, Territory Managers will straddle the FSR and CM responsibilities. For larger, named accounts, AZEK also has created a national sales organization with directors that support national or large regional dealers with multiple locations / buying groups, including big-box retailers. The national sales organization is focused on increased penetration at these accounts by working at local levels and with corporate influencers. AZEK has a comprehensive marketing campaign using various media in support of the AZEK brand, targeted towards its growing dealer base as well as architects, custom builders, remodelers, installers and consumers.
We have significantly invested in our sales force platform and infrastructure by increasing headcount during the recent economic downturn, implementing an advanced CRM system to increase sales efficiency, and improving training. This past year, we invested in AZEK Trim and AZEK Deck display kits, contractor kits and sample boxes in order to equip our FSRs with the right tools to educate our customers on the benefits of our product. The goal is to raise the visibility of the AZEK brand and the awareness of the value proposition of AZEK Trim, AZEK Deck, AZEK Rail, AZEK Moulding and AZEK Porch.
Scranton Products sales and marketing
We seek to leverage Scranton Products' sales force, market-leading position, promotional materials and proprietary products to develop close relationships with architects and Scranton's Pinnacle preferred dealer network. We utilize direct sales and regional manufacturers' sales representatives to provide coverage to over 1,850 local dealers who sell to institutional, commercial and industrial customers across the United States and in Canada. The Scranton Products sales force and agents call on architects in order to promote innovative products in traditional institutional markets, such as schools, universities and stadium arenas, as well as targeted new markets, such as retail stores, industrial facilities and food processing plants.
Vycom sales and marketing
The Vycom sales organization focuses on providing PVC and olefin solutions for a wide variety of industries including the graphics and display, semiconductor, marine, chemical and corrosion, playground, and food processing markets. Our products are sold to plastic distributors in the United States, Canada and Latin America who sell primarily to OEMs. The Vycom sales force is made up of a combination of direct territory managers and manufacturing representatives focused on increasing market penetration by working with printers, fabricators, OEMs, and end users to generate pull through opportunities and create specifications for our materials. We have invested in a number of sales tools including an advanced CRM system, new website, sales training programs, web portal, sales kits and sales literature to help promote these efforts.
Manufacturing Operations
In the Scranton, Pennsylvania area, we operate five owned facilities and one leased property that are organized by material type for manufacturing purposes for AZEK Building Products, Scranton
97
Products and Vycom. We also operate one manufacturing facility in Foley, Alabama and one in Toronto, Canada. The chart below summarizes our facilities:
Facility
|
Square Feet | Ownership | Use | ||||
|---|---|---|---|---|---|---|---|
Scranton Buildings #1-5 |
641,171 | Owned | Office and Manufacturing Facilities for all segments | ||||
Scranton / Keyser Avenue |
286,458 | Leased | Office and Manufacturing Facility for AZEK | ||||
Foley, Alabama |
108,000 | Leased | Office and Manufacturing Facility for AZEK | ||||
Toronto Facility |
82,097 | Leased | Office and Manufacturing Facility for AZEK | ||||
With material blending systems available in all of our state-of-the-art manufacturing facilities, we have positioned our company as a low-cost vertically integrated manufacturer. We have some of the largest dedicated synthetic polymer processing facilities in the industry which drive a higher throughput and lower unit production cost relative to our competition. Our disciplined, process-oriented manufacturing systems are built on a foundation consisting of:
- •
- Technical Expertise: Large and dedicated engineering team
focused on polymer formulations, mechanical efficiencies and product developments and enhancements.
- •
- Proprietary Material Formulations: Vertically integrated
in-house blending capabilities to ensure high quality products and low unit production cost.
- •
- Broad Range of Extrusion Capabilities: Expanding
technologies to provide solutions to new and challenging applications.
- •
- Large Capacity: Large installed capacity of high output
machines designed to provide the most competitive cost structure.
- •
- Post-Extrusion Value Add Capability: Focus on providing the appropriate aesthetics and functional advantages to ensure premium product offering.
During the manufacturing process, our proprietary products are blended, heated and then extruded through a rigorous process. For our end use building products, further steps are taken to fabricate and assemble our products through internally designed, proprietary processes. Developing the correct mixture of raw materials and blends and determining the proper speed and calibrations of machines require highly specialized technical skills, and we have developed significant internal expertise in these processes through years of experience. Each of our machines is optimized by our technicians according to internal proprietary specifications in order to establish the correct mixing, speed and extrusion processes. Throughout the manufacturing process, we seek to act in an environmentally sustainable manner by recycling nearly all of our scrap into the final product. Our manufacturing systems have enabled innovation and expansion into new markets throughout the history of our company.
Raw Materials and Suppliers
The primary raw materials we use in the manufacture of our products are various petrochemical resins, primarily PVC and olefins, including HDPE and PP. In addition, we utilize a variety of other additives including modifiers, TiO2 and pigments. Our financial performance therefore is dependent to a substantial extent on the markets for these various materials. We purchase our raw materials directly from major petrochemical and chemical suppliers. We have long-standing relationships as well as guaranteed supply with some of these suppliers but we have no fixed-price contracts with any of our majors vendors. Prices are negotiated on a continuous basis and we have not entered into hedges with respect to our raw material costs. We generally buy resin and other materials on an as-needed basis but have occasionally made strategic purchases of larger quantities. Historically, we have not bought resin from a sole source and believe raw materials are available from alternative sources on similar terms. We seek to mitigate the effects of fluctuations in our raw material costs by broadening our supplier
98
base, including off-shore suppliers, and exploring options for material substitution without sacrificing quality.
Competition
We compete with multiple companies with respect to each of our products, including divisions or subsidiaries of larger companies and foreign competitors. We compete on the basis of a number of considerations, including service, quality, performance, product characteristics, brand recognition and loyalty, marketing, product development, sales and distribution, ability to supply products to customers in a timely manner and price (on a price-to-value basis). We also compete with products made of wood, wood composite, metal and other materials that our synthetic products are designed to replace. For example, AZEK Trim competes primarily with wood, aluminum, engineered wood and vinyl coil wrap. In the cellular PVC trim market, there are few other competitors of scale. The deck market in which AZEK Deck operates is similarly competitive, with numerous significantly larger competitors manufacturing both wood and wood composite deck. The bathroom partition market is highly fragmented and consists of manufacturers typically producing products in several different materials and price ranges. Metal currently represents the majority of the overall bathroom partition market. With respect to our Vycom products, the market is highly fragmented, with manufacturers generally focusing on a few core materials that are sold through similar distribution channels. Our competitors for other non-fabricated products include other national and regional manufacturers.
Intellectual Property
We rely on a combination of trademarks, trade secrets, patents, licenses, unpatented know-how and other intellectual property rights, including registered and unregistered copyrights and protection under state and federal laws for distinctive trade dress and proprietary data, to the extent applicable, to protect our proprietary rights. Currently, we own 46 trademark registrations and 8 issued patents in the United States, as well as a number of granted trademark registrations and issued patents in other countries. We also have pending trademark applications and patent applications in the United States and other countries. Our issued patents have expiration dates ranging from 2014 to 2026. With respect to patents that may issue from our currently pending patent applications, if any such patents should issue at all, the expiration dates will be determined upon issuance. Our trademark registrations have expiration dates ranging from 2011 to 2026; however, under applicable trademark laws, these registrations can be renewed. With respect to trademark registrations that may be granted from our currently pending trademark applications, if any such registrations should be granted at all, the expiration dates will be determined upon grant. Our only license, apart from standard licenses associated with the purchase of off-the-shelf software, is a technology license that expires in 2014.
We employ various methods, including confidentiality and nondisclosure agreements with third parties and employees who have access to trade secrets, to protect our trade secrets and know-how. We consider our AZEK and Scranton Products families of trademarks to be material to our business. Although we use a variety of intellectual property in the marketing, development and manufacturing of various products, we believe that no other individual or specific groups of patents or other intellectual property rights are critical to our current operations. Taken as a whole, however, our intellectual property rights are significant. Business operations could be negatively impacted if we fail to adequately protect intellectual property rights or if third parties claim that we are in violation of their intellectual property rights.
Seasonality
Although we generally have demand for our products throughout the year, our sales have historically been moderately seasonal. We have typically experienced increased sales of our AZEK products in the first quarter of the year as a result of our "early buy" sales program, which encourages dealers to stock our AZEK products through the use of incentive discounts. We have generally
99
experienced decreased sales in the fourth quarter due to adverse weather conditions in certain markets during the winter season. In addition, we have experienced increased sales of our Scranton products in the summer months during which schools are typically closed and therefore are more likely to undergo remodeling activities. With respect to our Vycom products, we have experienced very limited seasonality.
Employees
As of March 31, 2011, all of our workforce was non-union and totaled 718 employees, comprised of 419 production employees, 195 office employees and 104 temporary employees. We are not a party to any collective bargaining agreements. We believe our relationship with our employees is good.
Legal Proceedings
From time to time, we are subject to litigation in the ordinary course of business. Currently, there are no claims or proceedings against us that we believe would be expected to have a material adverse effect on our business or financial condition, results of operations or cash flows.
Environmental
Our products and operations are subject to extensive and frequently changing federal, state, municipal, local and foreign laws and regulations relating to the protection of human health and the environment, including those limiting the discharge and release of pollutants into the environment and those regulating the transport, use, treatment, storage, disposal and remediation of, and exposure to, solid and hazardous wastes and hazardous materials. Certain environmental laws and regulations impose joint and several liability without regard to fault on responsible parties, including past and present owners and operators of sites, to clean up, or contribute to the cost of cleaning up, sites at which hazardous wastes or materials were disposed or released. Failure to comply with environmental laws or regulations could result in severe fines and penalties. We are not aware of any environmental liabilities that would be expected to have a material adverse effect on our business or financial condition, results of operations or cash flows. We believe we are in compliance with all environmental laws and regulations in all material respects and possess all necessary governmental authorizations to operate our manufacturing and other facilities.
Various current and potential future federal and state laws and regulations could regulate the emission of greenhouse gases, particularly carbon dioxide and methane. Accordingly, we may be required either to limit greenhouse gas emissions from our operations or to purchase allowances for such emissions. We cannot predict the impact that this regulation may have on our business in the future. See "Risk Factors—Risks Related to Our Business—The cost of complying with laws and regulations relating to the protection of the environment may be significant."
Health and Safety Matters
Underlying our operational performance are robust health and safety policies and practices and strong technical capabilities, which processes we have recently improved under the leadership of Jason Grommon. We believe that a technically proficient work force that operates safely allows us to focus on maintaining reliable and efficient manufacturing systems. Our health and safety policies and practices include an internal audit system intended to provide transparency in our health and safety compliance efforts and an employee training and competency development program to train, verify and encourage compliance with health and safety procedures and regulations. We employ a safety director whose responsibilities include managing and executing a unified, company-wide safety program. In addition, improving environmental, health and safety systems is among the key individualized performance goals for annual cash incentive awards payable to our named executive officers.
100
The following table provides information about our directors and executive officers. With respect to our directors, each biography contains information regarding the person's service as a director, business experience, director positions held currently or at any time during the past five years, information regarding involvement in certain legal or administrative proceedings, and the experience, qualifications, attributes or skills that caused our board of directors to determine that the person should serve as a director of our company.
Name
|
Age | Position with Our Company | |||
|---|---|---|---|---|---|
Eric K. Jungbluth |
50 | Chief Executive Officer and Director | |||
Scott Harrison |
38 | Executive Vice President, Chief Financial Officer and Treasurer | |||
Ken Buck |
59 | Senior Vice President, Human Resources | |||
Jason Grommon |
37 | Senior Vice President, Operations | |||
Donald Wharton |
43 | President, Scranton Products and Vycom | |||
James Andersen |
48 | Director | |||
Vincent A. Calarco |
69 | Director | |||
Stuart M. Christhilf, IV |
37 | Director | |||
John L. Garcia |
55 | Director | |||
Brian R. Hoesterey |
43 | Chairman of the Board | |||
Vincent A. Sarni |
83 | Director | |||
Julian M. Steinberg |
56 | Director | |||
Eric K. Jungbluth, our Chief Executive Officer, joined us in April 2008 and also became a director at that time. Prior to joining us, Mr. Jungbluth served as an Executive Vice President and was the President of The HON Company, an operating company of HNI Corporation, for 2 years. Mr. Jungbluth joined HNI Corporation in 2003 as President of Allsteel Inc. Prior to joining Allsteel, Mr. Jungbluth held several senior roles at Moen Incorporated (a division of Fortune Brands) including Vice President of National Accounts, Vice President of Business Development, and VP/General Manager of CSI Accessories. Mr. Jungbluth also spent two years at Kirsch (a division of Newell) as Vice President of Sales, and ten years at Warner Lambert in sales, marketing, and brand management roles. Mr. Jungbluth has extensive experience in sales and marketing and strategic planning in the consumer and industrial product sectors. Throughout his career Mr. Jungbluth has held positions of increasing responsibility with companies that are similarly situated to our company, where he has gained extensive management, sales and operational experience. In addition, Mr. Jungbluth's strategic vision, institutional knowledge and understanding of risk management in respect of our operations and business has proven invaluable to our board of directors. Mr. Jungbluth received a B.S. in finance from the University of Wisconsin.
Scott Harrison, our Executive Vice President and Chief Financial Officer, joined us in November 2005 as our Vice President of Finance. Mr. Harrison was appointed our Senior Vice President and Chief Financial Officer in February 2006. Prior to joining us, Mr. Harrison was director of business development at Silgan Plastics Corporation since 2003. Prior to joining Silgan Plastics, Mr. Harrison held various positions in finance with First Union Capital Partners and Bowles Hollowell Conner & Co. Mr. Harrison received a B.A. in economics from Duke University and an M.B.A. from The Tuck School of Business at Dartmouth.
Ken Buck, our Senior Vice President, Human Resources, joined us in 2008. Prior to joining us, Mr. Buck held various positions in Human Resource Management at SI Handling Systems, Lutron Electronics, Sytex Inc. and Lockheed Martin. Mr. Buck received a B.A. in psychology from Kutztown University and an M.S. in human resources from American University.
Jason Grommon, our Senior Vice President, Operations, joined us in August 2008 as Vice President Operations and was promoted to Senior Vice President in November 2008. Prior to joining us, Mr. Grommon served as Vice President of Operations and General Manager for the Gunlocke
101
Company, an operating company of HNI Corporation. Mr. Grommon began his career as a Process Engineer, and has held positions of increasing responsibility in the manufacturing field such as Production Manager, Manufacturing Manager and Vice President Manufacturing. Mr. Grommon received a B.S. in industrial engineering from the University of Iowa.
Donald Wharton, our President, Scranton Products and Vycom, joined us in August 2008 as Vice President and General Manager and was promoted to President of Scranton Products and Vycom in October 2008. Mr. Wharton previously served as President of the Gunlocke Company, an operating company of HNI Corporation. Prior to Gunlocke, Mr. Wharton held senior leadership positions in finance and sales analysis for Allsteel and Moen companies along with strategic business roles for Chase Manhattan Banking Corporation of New York. Mr. Wharton holds a B.A. in business from the University of North Dakota and an M.B.A. from Cleveland State University.
James Andersen became a director in May 2005 and was a director of our predecessor company since 2001. Mr. Andersen is the Managing Partner and co-founder of Clearview Capital, a buyout firm which he formed in 1999. Prior to joining Clearview Capital, Mr. Andersen worked for Capital Partners from 1996 to 1999. Prior to that time, Mr. Andersen was a project manager at Mars and Company, an international strategy consulting firm and an international staff field engineer with Schlumberger. Mr. Andersen received a B.S.E. in Civil Engineering, cum laude, from Princeton University and received an M.B.A. from the Wharton School of the University of Pennsylvania in 1989. Mr. Andersen currently serves as a director of Senior Care Centers of America, Inc., Hillsdale Furniture LLC, Rowmark, LLC, Hettinger Welding, LLC, EN Engineering, LLC and Air-Cooled Exchangers LLC and has previously during the past five years served as a director of Twinco-Romax LLC and M.H. Zeigler and Sons, LLC. Mr. Andersen has extensive experience in investment management and strategic planning in the consumer and industrial product industries. As a result of his service on various boards of directors, Mr. Andersen has extensive knowledge and experience with respect to corporate governance and executive compensation issues. In addition, due to his tenure on our board of directors, Mr. Andersen has deep institutional knowledge with respect to our management and operations.
Vincent A. Calarco became a director in June 2006. Mr. Calarco was Chairman, President and Chief Executive Officer of Crompton Corporation (now known as Chemtura Corporation), a producer of specialty chemicals and polymer products, from 1999 to 2004. Prior to that time, he was President and Chief Executive Officer of Crompton & Knowles Corporation, a predecessor of Crompton Corporation, from 1985 to 1999, and Chairman from 1986 to 1999. Mr. Calarco received a B.S. in chemical engineering from Polytechnic University and an M.B.A. with distinction from The Harvard Business School. He is currently a director of Consolidated Edison, Inc. and a Trustee of Saint Raphael Healthcare System. In addition, Mr. Calarco is the Chairman of the board of directors of Newmont Mining Corporation. Mr. Calarco has extensive experience in the polymer product industry, as well as strong leadership skills resulting from his career experience. During his tenure on our board of directors, Mr. Calarco has demonstrated a strong strategic vision due to his in-depth understanding of our business. Mr. Calarco's current and former board memberships at other companies also provide him with extensive corporate governance knowledge and experience.
Stuart M. Christhilf, IV became a director in December 2008. Mr. Christhilf is a principal with Pamlico Capital, which he joined in 2002, and is focused on investments across the business services, consumer, industrial, and financial services sectors. Prior to joining Pamlico Capital, Mr. Christhilf worked in the investment banking, leveraged finance, and merchant banking groups of Wachovia Securities, Inc. and its predecessor, First Union Securities, Inc. He received a B.S. with special attainments in commerce, cum laude, from Washington & Lee University and is certified as a Chartered Financial Analyst. Mr. Christhilf serves or previously served as a director of Bell Sports, Inc., Crosman Group, LLC, ATX Networks Holdings, LLC, and GreatAmerica Leasing Corporation. Mr. Christhilf has extensive experience in investment banking, corporate finance and financial analysis in the consumer and industrial product sectors. In addition, Mr. Christhilf's private equity experience and position on several boards provides us with considerable insights regarding acquisitions, debt and equity financings.
102
John L. Garcia became a director in April 2011. Mr. Garcia has been Chief Executive Officer of AEA Investors since 2006 and President of AEA Investors since 2002 and was a Managing Director of AEA Investors from 1999 through 2002. From 1994 to 1999, Mr. Garcia was a Managing Director with Credit Suisse First Boston LLC, formerly known as Credit Suisse First Boston Corporation, where he served as Global Head of the Chemicals Investment Banking Group and Head of the European Acquisition and Leveraged Finance and Financial Sponsor Groups. Before joining Credit Suisse First Boston, Mr. Garcia worked at Wertheim Schroder in New York as an investment banker and at ARCO Chemical Company in research, strategic planning and commercial development. Mr. Garcia received a Ph.D. and an M.A. in chemistry from Princeton University, an M.B.A. from the Wharton School of the University of Pennsylvania, and a B.Sc. from the University of Kent in Canterbury, England. Mr. Garcia is currently a director of AEA Investors, Pregis Holding II Corporation and BOA Luxembourg Investment S.a.r.l. In addition, Mr. Garcia is the Chairman of the investment committee of the AEA Mezzanine funds, which own an equity interest in Holdings. Mr. Garcia has extensive experience in private equity, investment banking, corporate finance and strategic planning, including in the value-added industrial and specialty chemical products industries.
Brian R. Hoesterey became a director in May 2005 and Chairman of the Board in 2008. Mr. Hoesterey is a Partner with AEA Investors, which he joined in 1999. Prior to joining AEA Investors, Mr. Hoesterey was with BT Capital Partners, the private equity investment vehicle of Bankers Trust. Mr. Hoesterey has also previously worked for McKinsey & Co. and the investment banking division of Morgan Stanley. Mr. Hoesterey received a B.B.A. in accounting, summa cum laude, from Texas Christian University and received an M.B.A. with honors from The Harvard Business School. Mr. Hoesterey is currently a director of Henry Company, Pregis Holding II Corporation, Unifrax Corporation, Houghton International and Suncoast Roofers. Mr. Hoesterey has extensive experience with industrial manufacturing and distribution operations, corporate finance and strategic planning. In addition, Mr. Hoesterey's experience in the private equity investment field provides us with valuable insight regarding acquisitions, debt and equity financings. Mr. Hoesterey's experience with growing portfolio companies similar to our company also provides valuable industry insights and management expertise.
Vincent A. Sarni became a director in August 2005. Mr. Sarni was Chairman of the board of directors and Chief Executive Officer of PPG Industries, a global supplier of coatings, glass, fiber glass and chemicals, from 1984 to 1993. Mr. Sarni joined PPG as a Marketing Vice President of the former Industrial Chemical Department in 1968, after 12 years with Olin Corporation. He is a former director of Mueller Holding Co., Noveon Inc., Amtrol Inc., Brockway Inc., Hershey Foods Corp., Honeywell Inc., Mellon Bank Inc., PNC Financial Corp. and PPG Industries. Mr. Sarni is also the former Chairman of the board of directors for the Pittsburgh Pirates and Allegheny General Hospital. Mr. Sarni has extensive executive experience in corporate governance and strategic planning as well as strong leadership skills due to his experience as an executive as well as a member of various boards of directors. Mr. Sarni's industry experience has provided valuable insight to our board of directors regarding strategic decisions. Mr. Sarni's extensive executive experience and leadership skills provide the board with insight in establishing corporate governance and evaluating strategic alternatives.
Julian M. Steinberg became a director in August 2005. Mr. Steinberg is Chief Executive Officer of Vantage Specialty Chemicals, a private equity owned specialty chemicals company focusing on oleochemicals and their derivatives, which he joined in July 2009. Prior to joining Vantage Specialty Chemicals, Mr. Steinberg was Senior Vice President and Chief Operating Officer of Lubrizol Advanced Materials, a business segment of the Lubrizol Corporation. Prior to this position, he was General Manager of Performance Coatings at Noveon, Inc. He was also Senior Vice President and General Manager of Estane® TPU, as well as Global Marketing and Business Development and General Manager of Estane® Americas. Mr. Steinberg spent twenty-two years with the BFGoodrich Company in various Business Management, Marketing and Financial roles. Mr. Steinberg has served on the board of directors for the Society of Plastics Industries and the Plastic Pipe and Fittings Association. Mr. Steinberg received a B.S. in business administration and an M.B.A. from Washington University.
103
Mr. Steinberg has extensive executive experience in corporate operations, and strong skills as an experienced leader within major organizations. Mr. Steinberg also has significant polymer and building products experience with similar companies. In addition, Mr. Steinberg's experience in branding and downstream selling for similar companies is valuable when evaluating alternatives and making strategic decisions.
Leadership Structure of the Board of Directors
Our board of directors currently separates the roles of Chief Executive Officer and Chairman of the Board. These positions are currently held by Eric K. Jungbluth, as Chief Executive Officer, and Brian Hoesterey, as Chairman. We believe this leadership structure is appropriate for our company due to the differences between the two roles. The Chief Executive Officer is responsible for setting our strategic direction, providing day-to-day leadership and managing our business, while the Chairman of the Board provides guidance to the Chief Executive Officer, chairs board meetings, sets the agendas for the board meetings as well as provides information to the board members in advance of meetings. In addition, separating the roles of Chief Executive Officer and Chairman of the Board allows the Chairman to provide oversight of our management.
Director Independence and Controlled Company Exception
Our board of directors has affirmatively determined that Messrs. , and are independent directors under the rules of the NYSE and independent directors as such term is defined in Rule 10A-3(b)(1) under the Exchange Act. Mr. Jungbluth, our Chief Executive Officer, is not independent because of his position as an executive officer. Our remaining directors are not independent because of their affiliations with private equity funds that indirectly hold approximately 5% or more of our common stock: Messrs. Garcia and Hoesterey (audit committee member) are partners of AEA Investors; Mr. Andersen is the managing partner and co-founder of Clearview; and Mr. Christhilf (audit committee member) is a member of the general partner of Pamlico Capital I, L.P.
After completion of this offering and the Distribution, we expect that AEA Investors will continue to control a majority of the voting power of our outstanding common stock. As a result, we expect to be a "controlled company" within the meaning of the NYSE corporate governance standards. Under these rules, a "controlled company" may elect not to comply with certain corporate governance standards, including:
- •
- the requirement that a majority of our board of directors consist of independent directors;
- •
- the requirement that we have a nominating and corporate governance committee that is composed entirely of independent
directors with a written charter addressing the committee's purpose and responsibilities;
- •
- the requirement that we have a compensation committee that is composed entirely of independent directors with a written
charter addressing the committee's purpose and responsibilities; and
- •
- the requirement for an annual performance evaluation of the nominating and corporate governance committee and compensation committee.
Following this offering, we intend to utilize certain of these exemptions. As a result, we will not have a majority of independent directors, our nominating and corporate governance committee and compensation committee will not consist entirely of independent directors and such committees will not be subject to annual performance evaluations. Accordingly, you will not have the same protections afforded to stockholders of companies that are subject to all of the NYSE corporate governance requirements. See "Risk Factors—Risks Related to Our Common Stock and this Offering—We are a "controlled company" within the meaning of the NYSE rules and, as a result, expect to qualify for, and intend to rely on, exemptions from certain corporate governance requirements. You will not have the same protections afforded to shareholders of companies that are subject to such requirements."
104
Committees of the Board of Directors
Upon the consummation of this offering, our board of directors will have three committees: the audit committee, the compensation committee, and the nominating and corporate governance committee. From time to time, our board of directors may contemplate establishing other committees.
Audit Committee. The members of the audit committee are Brian Hoesterey as Chairman, Stuart Christhilf and Vincent Sarni. Mr. Sarni qualifies as our "audit committee financial expert" within the meaning of regulations adopted by the SEC. The audit committee recommends the annual appointment and reviews independence of auditors and reviews the scope of audit and non-audit assignments and related fees, the results of the annual audit, accounting principles used in financial reporting, internal auditing procedures, the adequacy of our internal control procedures, related party transactions, and investigations into matters related to audit functions. The audit committee is also responsible for overseeing risk management on behalf of our board of directors. See "—Risk Oversight."
Compensation Committee. The members of the compensation committee are Brian Hoesterey as Chairman, James Andersen and John Garcia. The principal responsibilities of the compensation committee are to review and approve matters involving executive and director compensation, recommend changes in employee benefit programs, authorize equity and other incentive arrangements, and authorize our company to enter into employment and other employee related agreements.
Nominating and Corporate Governance Committee. Upon the consummation of this offering, the members of the nominating and corporate governance committee will be as Chairman, and . The nominating and corporate governance committee assists our board of directors in identifying individuals qualified to become board members, makes recommendations for nominees for committees and develops, recommends to the board and reviews our corporate governance principles.
Risk Oversight
Our board of directors administers its risk oversight function primarily through the audit committee. To that end, our audit committee meets at least quarterly with our Chief Financial Officer and our independent auditors where it receives regular updates regarding our management's assessment of risk exposures including liquidity, credit and operational risks and the process in place to monitor such risks and review results of operations, financial reporting and assessments of internal controls over financial reporting. Our board of directors believes that its administration of risk management has not affected the board's leadership structure, as described above.
In addition, we have a Project Management Office and a Steering Committee that conduct routine risk assessment and monitor compliance with our risk management policies and procedures. The Project Management Office is responsible for our ongoing internal control compliance activities, monitoring risks, coordinating project resources and developing and initiating internal control resolutions. The Project Management Office reports to the Steering Committee, which is chaired by our Chief Financial Officer who raises issues, as appropriate, with the audit committee. The Steering Committee provides strategic leadership for all compliance maintenance and supports the implementation of internal control resolutions and risk management policies and procedures.
Code of Ethics
We have adopted a code of ethics applicable to all of our directors, officers (including our principal executive officer, principal financial officer and principal accounting officer) and employees, known as the Code of Business Conduct & Ethics. The Code of Business Conduct & Ethics is available on our website at www.cpgint.com under Investor Relations. In the event that we amend or waive certain provisions of the Code of Business Conduct & Ethics applicable to our principal executive officer, principal financial officer or principal accounting officer that requires disclosure under applicable SEC rules, we intend to disclose the same on our website.
105
COMPENSATION DISCUSSION AND ANALYSIS
Background
Since May 2005, we have been privately owned. The overriding objective of our owners and management has been to increase the economic value and size of our company during the period of ownership to assist us in achieving our owners' goals. Accordingly, our compensation philosophy is designed to directly support the achievement of those goals and objectives.
In this Compensation Discussion and Analysis and the tables and narrative that follow, we discuss the purchase of Class B Units in Holdings by our named executive officers because Holdings is currently the owner of 100% of our company's equity interests. As a result, we believe that disclosure of this equity-based compensation is useful to investors. However, following the completion of this offering, Holdings intends to distribute to all of the holders of the Class A Units and the Class B Units all the remaining shares of our common stock that it holds at such time, in accordance with and as contemplated by the CPG International Holdings LP Agreement of Limited Partnership dated as of May 10, 2005, as amended, or the LP Agreement. After that distribution, Holdings will be dissolved, and former holders of the Class A Units and the Class B Units will then directly hold shares of our common stock. See "Prospectus Summary—The Offering." The number of Class B Units, and related disclosure, included in this Compensation Discussion and Analysis do not give effect to the Distribution.
Introduction
Our named executive officers for 2010 were Eric K. Jungbluth, our President and Chief Executive Officer, Scott Harrison, our Executive Vice President and Chief Financial Officer, Donald Wharton, President of Scranton Products and Vycom, Jason Grommon, Senior Vice President, Operations, and Ken Buck, Senior Vice President, Human Resources.
During 2010, the compensation committee of our board of directors, or the Committee, was comprised of three members: Christopher Mahan as Chairman, Brian Hoesterey and James Andersen. Due to the nature of our ownership, the members of the Committee hold significant ownership positions in the business. Therefore, they are not independent directors under the SEC rules. The Committee met three times in 2010. Generally, the Committee oversees company-wide compensation practices, reviews, develops and administers compensation programs and approves or makes recommendations to our board of directors regarding certain compensation matters, as determined appropriate by the Committee.
More specifically, our board of directors has delegated the direct responsibility for compensation matters to the compensation committee, including:
- •
- reviewing, adopting and amending all employee benefit plans and programs and overseeing the administration of such plans
and programs;
- •
- subject to the terms of existing employment agreements, approving the compensation of our executive officers;
- •
- approving company and individual performance goals with respect to annual cash incentive awards;
and
- •
- approving purchases of equity interests in Holdings by employees.
In April 2011, Mr. Mahan resigned from our board of directors and the Committee, and John Garcia was appointed to serve on the board and the Committee. The Committee is currently comprised of Brian Hoesterey as Chairman, James Andersen and John Garcia. In connection with this offering,
106
the Committee plans to adopt an amended compensation committee charter which will set forth its duties and responsibilities in detail.
Compensation Philosophy and Objectives
Our goal is to create executive compensation programs designed to attract executives with true entrepreneurial spirit and strong ability to manage a rapidly growing business. In addition, we aim to create a reward system that focuses our executive team on increasing profitability and growing our company through expanding markets, introducing new products, identifying and successfully implementing strategic acquisitions, improving the productivity of business processes and operations, technological innovation and de-leveraging the business over time with an end goal of increasing our company's overall economic value. As a result, our executive compensation programs are focused on aligning the interests of our executives with the long-term goal of creating a profitable, high growth building products company with market leading brands. We maintain an executive compensation program that includes at-risk, performance based awards whereby executive officers who demonstrate exceptional performance realize appropriate economic rewards. To that end, a significant amount of our executive compensation is in the form of equity incentives in Holdings and annual cash incentive awards, each of which is directly tied to Company performance.
Setting Executive Compensation
The Committee conducts a review of our executive compensation plans and programs as well as the compensation of each named executive officer on an annual basis. During the course of that review, the Committee considers our compensation philosophy and objectives, the impact of each executive officer on our results and success and the executives' respective levels of responsibility. In making determinations regarding executive compensation, members of the Committee also rely on their relevant business experience, which, for members of the Committee who are partners with AEA Investors, includes a consideration of the executive compensation paid to executive officers of other portfolio companies of AEA Investors. In addition, members of the Committee review publicly available compensation information of similarly situated companies as well as general compensation reports and surveys produced by market compensation specialists and recruiters. We expect that following this offering, the Committee will continue to review compensation elements and amounts for our named executive officers on an annual basis and at the time of a promotion or other change in level of responsibilities, as well as when competitive circumstances or business needs may require.
Eric K. Jungbluth, our Chief Executive Officer, has been actively involved in providing recommendations to the Committee regarding the evaluation and design of the compensation programs for our executive officers since he assumed the role of Chief Executive Officer in April 2008. Mr. Jungbluth also provides recommendations with respect to individual compensation levels for executive officers other than himself. In making recommendations, Mr. Jungbluth relies on his personal evaluations of those named executive officers' performance and reviews publicly available compensation information of similarly situated companies as well as general compensation reports and surveys produced by market compensation specialists and recruiters. The Committee gives significant weight to Mr. Jungbluth's judgment when assessing the performance of the executive officers and determining their appropriate compensation levels and incentive awards. Ultimately, the Committee will approve or recommend to our board of directors to approve, as the Committee deems appropriate, an annual compensation package that is consistent with our compensation philosophy, consistent with performance of the relevant executive and competitive with other organizations similar to ours. The Committee determines Mr. Jungbluth's compensation as Chief Executive Officer, with no input from our executive officers.
The Committee is authorized at the expense of our company to retain the services of an independent compensation consultant. However, due to the nature of our current ownership and the
107
fact that our named executive officers are covered by arms-length, negotiated employment agreements, the Committee has not retained the services of a compensation consultant, including with respect to executive compensation for 2010. We expect that following this offering the Committee will retain the services of an independent compensation consultant to formulate a report and make recommendations to the Committee regarding executive compensation, based on peer group and other market data, as well as industry trends and current practices.
Elements of Compensation
We believe that various elements of our executive compensation program reward our named executive officers and also provide an effective way to reward short-term performance while ensuring that long-term business strategy is being implemented successfully and value creation is occurring. This is accomplished by incorporating both annual cash and long-term equity incentive award components into the program. The elements of compensation for our named executive officers are as follows:
- •
- base salary;
- •
- annual cash incentive awards;
- •
- long-term equity incentives; and
- •
- certain other benefits.
Base Salary. We believe that base salaries are an essential element of a competitive compensation program, which directly affects our ability to attract and retain qualified executives. Our named executive officers are covered by employment agreements and, accordingly, we pay annual base salaries initially as set forth in these agreements, which are determined based on each named executive officer's position and responsibility and on available market data. These salaries are subject to annual review. During its annual review of base salaries for executive officers, the Committee primarily considers each executive officer's level of responsibility, performance and contribution to creating value for our owners. This includes an internal review of the executive officer's compensation both individually and as compared to that of other executive officers.
Annual Cash Incentive Awards. We provide annual cash incentives to our named executive officers to align the compensation of our named executive officers with overall company financial performance and to promote achievement of both corporate and individualized performance goals. These cash bonuses are granted pursuant to the Key Manager Bonus Plan, or Bonus Plan, which provides that bonuses are to be paid based on the attainment of corporate and individual goals and objectives during the respective performance period. Target bonuses under the Bonus Plan are expressed as a percentage of annual base salary. The Committee determines target annual bonus percentages for participants in the Bonus Plan, including our named executive officers, during the first quarter of each fiscal year. In the case of Messrs. Jungbluth and Harrison, the Committee's determinations are guided by the terms of their employment agreements, which provide that the target annual bonus percentages for Messrs. Jungbluth and Harrison shall not be less than 100% and 60%, respectively, of their base salaries for the relevant year. The target annual bonus percentages for Messrs. Wharton, Grommon and Buck are not set forth in any agreement and the Committee has complete discretion in determining these targets.
In 2010, the target annual bonus percentages for our named executive officers were 100% for Mr. Jungbluth, 60% for Mr. Harrison, 60% for Mr. Wharton, 60% for Mr. Grommon and 30% and for Mr. Buck. We believe the payment of annual cash incentives based upon specific performance criteria is consistent with our goal of aligning the interests of our named executive officers with the goals of our owners. Bonuses paid to our named executive officers under the Bonus Plan in respect of 2010 were determinable based, in part, on our Adjusted EBITDA or on a particular segment's Adjusted EBITDA (depending on the particular executive's position) and, in part, on individualized performance
108
goals. For all participants in the Bonus Plan, including our named executive officers, the portion of the 2010 annual incentive payable based on Adjusted EBITDA was 75%, and the portion payable based on individualized performance goals was 25%. Based on the level of achievement of Adjusted EBITDA and individualized performance goals, our named executive officers were paid the following percentages of their target annual cash incentive awards for 2010: Mr. Jungbluth, 126.5%; Mr. Harrison, 128.0%; Mr. Wharton, 104.8%; Mr. Grommon, 127.0%; and Mr. Buck, 127.2%.
The Adjusted EBITDA target goals for 2010 were set by the Committee during the first quarter of 2010. For our total company, the target Adjusted EBITDA amount was $62.5 million, with $47.9 million attributable to our AZEK Building Products operating segment, $17.0 million attributable to our Scranton Products operating segment and $8.9 million attributable to our Vycom operating segment. Our Adjusted EBITDA result for 2010 was approximately $67.5 million, with $53.2 million attributable to our AZEK Buildings Products operating segment, $15.1 million attributable to our Scranton Products operating segment and $9.3 million attributable to our Vycom operating segment. Vycom's target Adjusted EBITDA amount was $8.9 million, with an actual Adjusted EBITDA result of $9.3 million. Scranton Products' target Adjusted EBITDA amount was $17.0 million, with an actual Adjusted EBITDA result of $15.1 million. Messrs. Jungbluth, Harrison, Grommon and Buck were each compensated based on our total Adjusted EBITDA performance, whereas Mr. Wharton received a payout based on 50% of our total Adjusted EBITDA as well as 25% of Scranton Products Adjusted EBITDA and 25% of Vycom Adjusted EBITDA. See also note 1 to the table "2010 Grants of Plan Based Awards."
Each named executive officer's individualized performance goals were determined during the first quarter of 2010. These goals are determined by the eligible individuals, in conjunction with their direct superior. In the case of our named executive officers (other than our Chief Executive Officer), these goals are formulated by each respective executive in conjunction with our Chief Executive Officer, and for our Chief Executive Officer they are formulated by the executive in conjunction with the Committee. The individual performance objectives for all of the senior leadership team members, including our named executive officers, are reviewed and approved by the Committee. For 2010, the following were the key individualized performance goals for each of our named executive officers, which were designed to reward achievements by the executives that contributed to our achievement of our overall financial goals:
- •
- Eric K. Jungbluth: (i) contributing to organizational
development through training initiatives, filling key positions and emphasizing a positive and open culture; (ii) contributing to key AZEK initiatives such as new product development, sales and
marketing goals; (iii) overseeing operations initiatives relating to efficiency targets and safety; (iv) overseeing key Scranton Products and Vycom growth initiatives; and
(v) overseeing key finance, procurement and technology initiatives.
- •
- Scott Harrison: (i) contributing to organizational
development through training initiatives and filling key positions; (ii) accomplishing key information technology projects relating to improved infrastructure projects and application support
of our company; (iii) executing on key strategic purchasing initiatives; and (iv) achieving key finance group objectives.
- •
- Donald Wharton: With respect to both commercial and
industrial initiatives: (i) contributing to revenue growth; (ii) contributing to product development; and (iii) introduction of operations initiatives relating to efficiency
targets and safety.
- •
- Jason Grommon: (i) enhancing existing products and developing new products; (ii) achieving various metrics related to efficiencies; (iii) improving sales and production planning tools; (iv) improving and standardizing manufacturing processes and procedures; (v) leveraging existing capacity and capability in operations; (vi) improving environmental health and safety systems; and (vii) contributing to recruitment efforts.
109
- •
- Ken Buck: (i) implementing enhanced training and development initiatives; (ii) expanding recruitment initiatives and improving retention and process strategies; (iii) implementing initiatives with an emphasis on a positive and open culture; and (iv) implementing key cost reduction and competitiveness processes relating to human resources initiatives.
The Adjusted EBITDA component of the annual incentive bonus for our named executive officers comprises 75% of their total annual incentive bonus amount. As mentioned above, we exceeded our 2010 Adjusted EBITDA target of $62.5 million by achieving Adjusted EBITDA of $67.5 million. Taking into account our above-target Adjusted EBITDA achievement, each of our named executive officers, other than Mr. Wharton, was paid 140.3% of their target amounts for the Adjusted EBITDA component of their bonuses. This calculation is not done on a one-for-one basis. Rather, the multiplier applicable to the Adjusted EBITDA portion of the annual incentive bonus is calculated based on a scale, which is set forth in the table below. Upon application of this scale to our total company Adjusted EBITDA for 2010 (which was 8% above target), the target amounts with respect to the Adjusted EBITDA portion of the bonuses of our named executive officers (other than Mr. Wharton) were multiplied by 140.3%.
| Achievement of Adjusted EBITDA Goals (Expressed as Percentage of Target) |
Multiplier for Adjusted EBITDA Portion of Annual Bonus |
|
|---|---|---|
| £80% | 0% | |
| 85% | 25% | |
| 90% | 50% | |
| 95% | 75% | |
| 100% | 100% | |
| 105% | 125% | |
| 110% | 150% | |
| 115% | 175% | |
| 120% | 200% | |
| 125% | 235% | |
| 130% | 270% |
With respect to Mr. Wharton, of the 75% of his annual incentive that is based on Adjusted EBITDA, 50% is based on total company Adjusted EBITDA, 25% is based on Vycom Adjusted EBITDA and 25% is based on Scranton Products Adjusted EBITDA. The 2010 Adjusted EBITDA targets for Vycom and Scranton Products were $8.9 million and $17.0 million, respectively. Vycom achieved 104.0% of its target by achieving an Adjusted EBITDA of $9.3 million. Scranton Products achieved 88.8% of its target by achieving an Adjusted EBITDA of $15.1 million. Taking into account the level of Adjusted EBITDA achievement for our total company, Vycom and Scranton Products, the relative weighting of these components for Mr. Wharton, and the scale pursuant to which the Adjusted EBITDA portion of the bonus was calculated (as described earlier in this paragraph), Mr. Wharton was paid 111.1% of his target amount for the Adjusted EBITDA portion of his bonus.
The annual incentive awards payable to our named executive officers pursuant to the Bonus Plan with respect to performance during 2010 is set forth in the "Non-Equity Incentive Plan Compensation" column of the Summary Compensation Table.
Long-Term Equity Incentives. We believe the most critical component of compensation for an entrepreneurial business such as ours is appropriate long-term equity incentives. We believe that long-term equity ownership directly aligns the interests of our executive officers with our other equity owners. We also believe that increasing the personal equity stake of our executive officers in our continued success and growth can potentially materially increase shareholder value. Equity-based compensation awards also enable us to attract and retain the services of an outstanding management
110
team, upon which the success of our operations are largely dependent. All of our named executive officers own an equity interest in Holdings.
In 2005, Holdings established an equity compensation program for executive officers and other key managers under which they are awarded the right to purchase Class B Units in Holdings. These equity interests are intended to allow each participant to share in the value created at the time the current owners sell or otherwise exit the business based upon the number of Class B Units held by the executive officer or key manager when the sale or exit transaction is completed. Class B Units are purchased pursuant to subscription agreements, which, together with the LP Agreement, govern the Class B Units. With respect to purchases approved by the Committee prior to 2010, Class B Units were purchased for $10 per unit, which was generally below the fair market value of the Class B Units at the time of purchase. In connection with such purchases, we have recorded a compensation expense equal to the difference between the aggregate fair market value of the Class B Units purchased and the aggregate price paid for such Class B Units. With respect to purchases of Class B Units approved by the Committee since the beginning of 2010, such units have been purchased by employees for their current fair market value. Class B Units are subject to an optional right of repurchase by Holdings for a specified time following the termination of the purchaser's employment.
If Holdings exercises its right to repurchase, a certain percentage of Class B Units may be repurchased by Holdings at the lower of cost and fair market value, and the remaining percentage may be repurchased at their fair market value (fair market value is determined in accordance with the LP Agreement). The percentage of the Class B Units sold that are subject to an optional right of repurchase by Holdings at the lower of cost and fair market value following a termination of the purchaser's employment decreases over a three year period beginning with the vesting commencement date (which is between 5 months and 1 year from the issuance date for the named executive officers). If termination of the purchaser's employment occurs prior to or on the vesting commencement date, 100% of the Class B Units sold are subject to an optional right of repurchase by Holdings at the lower of cost and fair market value. The percentage of Class B Units sold that is subject to purchase by Holdings at the lower of cost and fair market value decreases over time as follows: 75% if termination of the purchaser's employment occurs following the vesting commencement date but prior to or on the first anniversary of the vesting commencement date; 50% if termination of the purchaser's employment occurs following the first anniversary of the vesting commencement date but prior to or on the second anniversary of the vesting commencement; 25% if termination of the purchaser's employment occurs following the second anniversary of the vesting commencement date but prior to or on the third anniversary of the vesting commencement date; and 0% if termination of the purchaser's employment occurs after the third anniversary of the vesting commencement date. One award to the named executive officers did not follow this vesting schedule, a June 2009 purchase by Eric Jungbluth of 40 Class B Units. 100% of such units became subject to repurchase at fair market value on January 1, 2010. If a purchaser's employment is terminated for cause (as defined in the LP Agreement) at any time, Holdings may repurchase all of the Class B Units at the lower of cost and fair market value. Throughout this prospectus, we refer to Class B Units that may be repurchased at the lower of cost and fair market value (upon a termination without cause) as "unvested" and Class B Units that may be repurchased at fair market value as "vested." Distributions are made in respect of the Class B Units in accordance with the LP Agreement.
In May 2005, Class B Units were purchased by several of our executive officers and key managers who were employed by us at that time. Since 2005, certain of our executive officers (including certain named executive officers) and certain key managers have been given the opportunity to purchase Class B Units upon the commencement of their employment. In addition, the Committee has discretion to grant executive officers and key managers the opportunity to purchase Class B Units at any time. At the recommendation of the Chief Executive Officer, the Committee approves the granting of Class B Units to new senior executives, including those who are deemed very important to the growth and
111
development of our company, and to existing senior executives who are taking on greater responsibility and advancing through the organization. In determining the number of Class B Units that executive officers and key managers are permitted to purchase, the Committee considers various factors such as (i) the aggregate number of Class B Units that the Committee believes should be purchased by employees, (ii) the number of Class B Units that have previously been purchased by employees, (iii) the potential value on a long-term basis of all Class B Units that have been purchased by employees compared to how much long-term value the Committee believes is appropriate in the aggregate in respect of Class B Units held by employees, (iv) achievements of the particular employee that have contributed to our company's accomplishment of its financial goals and/or strategic plans (as applicable), or, in the case of new hires, the duties assigned to the particular employee that, when accomplished as expected, will contribute to our accomplishment of such goals and/or plans (as applicable), and (v) the relative level of responsibility of the employee's position. Class B Unit purchases are intended to be a motivational and retention tool designed to align employees' and shareholders' interests and to establish clear goals for the employees. In 2010, 250 Class B Units were purchased by each of Mr. Wharton and Mr. Grommon, which purchases were approved by the Committee in December 2009. These purchases were approved by the Committee in recognition of the achievements of Messrs. Wharton and Grommon since the time they joined our company and their continued advancement in the organization. For further detail regarding executive officer ownership, see "Principal and Selling Stockholders."
In connection with this offering, we intend to adopt an equity incentive plan in respect of our common stock.
Other Benefits. All named executive officers are entitled to receive company matching contributions to their 401(k) retirement plans as long as they are eligible to participate in the plan, as are all of our employees. In 2010, Messrs. Jungbluth, Harrison, Wharton, Grommon and Buck each received a matching contribution to their respective accounts and Mr. Buck received reimbursement of certain health insurance costs (each as set forth in the summary compensation table). Our named executive officers do not receive any other perquisites or personal benefits.
Compensation Committee Interlocks and Insider Participation
During 2010, the Committee consisted of Christopher Mahan as Chairman, Brian Hoesterey and James Andersen. No member of the Committee was an officer or employee of our company or any of our subsidiaries during 2010 and no member of the Committee was formerly an officer of our company or any of our subsidiaries. In addition, during 2010, none of our executive officers served as a member of a compensation committee or board of directors of any other entity one of whose executive officers served as a member of our board.
Risk in Relation to Compensation Programs
We have performed an internal review of all of our material compensation programs and have concluded that there are no plans that provide meaningful incentives for employees, including our named executive officers and additional executive officers, to take risks that would be reasonably likely to have a material adverse effect on us.
112
2010 SUMMARY COMPENSATION TABLE
The following table sets forth information regarding compensation earned during 2008, 2009 and 2010 by our named executive officers:
Name and Principal Position
|
Year | Salary($)(1) | Bonus($)(2) | Class B Units($)(3) |
Non-Equity Incentive Plan Compensation ($)(4) |
All Other Compensation ($)(5) |
Total($) | |||||||||||||||||
|---|---|---|---|---|---|---|---|---|---|---|---|---|---|---|---|---|---|---|---|---|---|---|---|---|
Eric K. Jungbluth |
||||||||||||||||||||||||
President and Chief Executive Officer |
2010 | 415,000 | — | — | 524,895 | 11,000 | 950,895 | |||||||||||||||||
|
2009 | 400,000 | — | 9,579 | 822,139 | 102,101 | 1,333,819 | |||||||||||||||||
|
2008 | 292,308 | 100,000 | 75,420 | 100,000 | 62,846 | 630,574 | |||||||||||||||||
Scott Harrison |
||||||||||||||||||||||||
Executive Vice President and |
2010 | 285,000 | — | — | 218,848 | 7,980 | 511,828 | |||||||||||||||||
Chief Financial Officer |
2009 | 235,000 | — | 1,866 | 289,805 | 7,537 | 534,208 | |||||||||||||||||
|
2008 | 235,000 | — | 6,290 | 66,488 | 7,121 | 314,899 | |||||||||||||||||
Donald Wharton |
||||||||||||||||||||||||
President, Scranton Products |
2010 | 240,000 | — | — | 150,967 | 7,790 | 398,757 | |||||||||||||||||
and Vycom |
2009 | 230,000 | — | 4,224 | 296,207 | 4,202 | 534,633 | |||||||||||||||||
|
2008 | 74,308 | 150,000 | 12,570 | 9,775 | 82,666 | 329,319 | |||||||||||||||||
Jason Grommon |
||||||||||||||||||||||||
Senior Vice President, Operations |
2010 | 220,000 | — | — | 167,615 | 3,204 | 390,819 | |||||||||||||||||
|
2009 | 200,000 | — | 4,846 | 246,942 | 3,654 | 455,442 | |||||||||||||||||
|
2008 | 76,923 | 100,000 | 10,056 | 11,250 | 69,730 | 267,959 | |||||||||||||||||
Ken Buck |
||||||||||||||||||||||||
Senior Vice President, |
2010 | 170,000 | — | — | 64,888 | 6,724 | 241,612 | |||||||||||||||||
Human Resources |
2009 | 160,000 | — | 1,415 | 98,417 | 5,485 | 265,317 | |||||||||||||||||
|
2008 | 152,000 | — | 2,514 | 10,200 | 2,084 | 166,798 | |||||||||||||||||
- (1)
- The
annual base salaries of our named executive officers have been increased since December 31, 2010. Their current base salaries are as follows:
Mr. Jungbluth—$450,000; Mr. Harrison—$293,550; Mr. Wharton—$247,000; Mr. Grommon—$235,000; and
Mr. Buck—$175,000.
- (2)
- Amounts
in this column reflect one-time signing bonuses paid in 2008 to Messrs. Jungbluth, Wharton and Grommon.
- (3)
- Represents
the aggregate grant date fair value for Class B Units purchased in accordance with FASB ASC Topic 718. For further detail regarding
Class B Units, see "—Elements of Compensation—Long Term Equity Incentives" and note 1 to the table "Outstanding Equity Awards." Although the issuance of 250
Class B Units to each of Messrs. Wharton and Grommon is reflected as occurring in 2009 when the Committee approved such issuances, those issuances did not occur until 2010 on the date
that Messrs. Wharton and Grommon executed a subscription agreement and paid for such units. Assumptions used in the calculation of these amounts are included in Note 13 to our audited
consolidated financial statements included elsewhere in this prospectus.
- (4)
- Represents
the annual incentive awards payable to our named executive officers pursuant to the Bonus Plan. For a discussion of the performance goals with
respect to 2010, see "—Elements of Compensation—Annual Cash Incentive Awards at Fiscal Year-End."
- (5)
- The amounts in this column for 2010 include: (i) company matching contributions to our 401(k) defined contribution retirement plan which were made in the amounts of $11,000, $7,980, $7,790, $3,204 and $5,524 on behalf of Messrs. Jungbluth, Harrison, Wharton, Grommon and Buck, respectively, and (ii) health insurance reimbursement of $1,200 for Mr. Buck.
113
2010 GRANTS OF PLAN BASED AWARDS
| |
Estimated Future Payouts Under Non-Equity Incentive Plan Awards(1) |
|||||||||
|---|---|---|---|---|---|---|---|---|---|---|
Name
|
Threshold ($) | Target ($) | Maximum ($) | |||||||
Eric K. Jungbluth |
182,600 | 415,000 | 946,200 | |||||||
Scott Harrison |
75,240 | 171,000 | 389,880 | |||||||
Donald Wharton |
63,360 | 144,000 | 328,320 | |||||||
Jason Grommon |
58,080 | 132,000 | 300,960 | |||||||
Ken Buck |
22,440 | 51,000 | 116,280 | |||||||
- (1)
- Represents the threshold, target and maximum amounts that could have been earned by our named executive officers under the Bonus Plan in respect of performance during 2010 (as discussed under "—Elements of Compensation—Annual Cash Incentive Awards"). The threshold bonus payable in respect of 2010 was 44% of the target annual bonus, and the maximum bonus payable in respect of 2010 was 228% of the target annual bonus. For our total company, the threshold Adjusted EBITDA amount was $53.1 million, the target Adjusted EBITDA amount was $62.5 million and the maximum Adjusted EBITDA amount was $81.2 million. With respect to Vycom, the threshold Adjusted EBITDA amount was $7.6 million, the target Adjusted EBITDA amount was $8.9 million and the maximum Adjusted EBITDA amount was $11.6 million. With respect to Scranton Products, the threshold Adjusted EBITDA amount was $14.4 million, the target Adjusted EBITDA amount was $17.0 million and the maximum Adjusted EBITDA amount was $22.1 million. With respect to AZEK Building Products, the threshold Adjusted EBITDA amount was $40.7 million, the target Adjusted EBITDA amount was $47.9 million and the maximum Adjusted EBITDA amount was $62.3 million. As discussed under "—Elements of Compensation—Annual Cash Incentive Awards," the annual incentive payable is based 75% on Adjusted EBITDA and 25% on individualized performance measures. These amounts assume that the individualized performance component of the bonus is earned at 100% of target. Participants cannot receive in excess of 100% of target with respect to the individualized performance component of the bonus.
Employment Agreements
Our named executive officers have each entered into an employment agreement with us, which were negotiated between each respective executive and us at arms-length. Certain elements of the compensation payable to our named executive officers are set forth in these employment agreements, including initial base salary and target annual bonus percentage. The employment agreements typically reflect our judgment regarding an executive's impact on the business and our subjective assessment of the relative importance of the particular executive to the overall success of the business. Although these employment agreements require us to pay severance if an executive officer is terminated under certain circumstances and limits, to some extent, the flexibility to adjust the compensation paid to the officer, we believe we derive substantial value from these employment agreements and the related noncompetition agreements entered into by our named executive officers.
Eric K. Jungbluth. On March 3, 2008, we entered into an employment agreement with Mr. Jungbluth, our President and Chief Executive Officer. The initial term of the agreement expired on March 3, 2011, and the term has been automatically renewed for one year and will be automatically renewed for successive one year terms thereafter unless 30 days' written notice of non-renewal is delivered by either party. Mr. Jungbluth's current annual base salary is $450,000, and he received a one-time signing bonus of $100,000 in 2008. Mr. Jungbluth is eligible to receive an annual target bonus of 100% of his annual base salary, based upon the achievement of corporate budgeted performance goals of our company. Mr. Jungbluth was also eligible to receive an additional bonus if within 36 months following April 7, 2008 all of the businesses of Holdings and its subsidiaries had been sold to a strategic buyer (as defined in the employment agreement). The employment agreement provides
114
that, upon the termination of Mr. Jungbluth's employment (i) without cause (as defined in the employment agreement), (ii) by reason of the non-renewal of the term by us, or (iii) by Mr. Jungbluth's resignation for good reason (as defined in the employment agreement), Mr. Jungbluth will (x) continue to be paid his base salary for 18 months following termination, and (y) be paid a pro-rata bonus for the year of termination based on actual performance, in each case provided that Mr. Jungbluth executes a release in favor of us and our affiliates and he does not violate the terms of his Noncompetition Agreement, which provides for standard non-competition and non-solicitation covenants that apply during his employment and following the termination of his employment for 18 months and a confidentiality covenant of indefinite duration.
Scott Harrison. On July 1, 2008, we entered into an amended and restated employment agreement with Mr. Harrison, our Executive Vice President and Chief Financial Officer. This amended and restated agreement supersedes Mr. Harrison's previous employment agreement, which was entered into on October 4, 2005. The initial term of the agreement expires on May 30, 2011, and the term will be automatically renewed for successive one year terms thereafter unless 30 days' written notice of non-renewal is delivered by either party. Mr. Harrison's current annual base salary is $293,550 and he is entitled to receive an annual incentive bonus with a target of not less than 60% of his annual base salary, based upon the achievement of certain personal and corporate performance goals. The agreement provides that, upon the termination of Mr. Harrison's employment (i) without cause (as defined in the employment agreement), or (ii) by Mr. Harrison's resignation for good reason (as defined in the employment agreement), Mr. Harrison will (x) continue to be paid his base salary for 12 months following termination, and (y) be paid a pro-rata bonus for the year of termination based on actual performance. Mr. Harrison is also party to a Noncompetition Agreement, which provides for standard non-competition and non-solicitation covenants that apply during his employment and following the termination of his employment for 24 months and a confidentiality covenant of indefinite duration.
Donald Wharton. On April 20, 2011, we entered into an amended and restated employment agreement with Mr. Wharton, the President of Scranton Products and Vycom. This amended and restated agreement supersedes Mr. Wharton's previous employment agreement, which was entered into on March 26, 2009, and amended on August 12, 2010. The initial term of the agreement expires on April 15, 2014, and the term will be automatically renewed for successive one year terms thereafter unless 30 days' written notice of non-renewal is delivered by either party. Mr. Wharton's current annual base salary is $247,000 and he is eligible to participate in the annual cash bonus plan. The agreement provides that, upon the termination of Mr. Wharton's employment without cause (as defined in the employment agreement), Mr. Wharton will continue to be paid his base salary for 12 months following termination, subject to the execution, delivery and non-revocation of a release in favor of us and our affiliates and compliance with the terms of his Noncompetition Agreement, which provides for certain standard non-competition and non-solicitation covenants that apply during his employment and following the termination of his employment for 24 months and a confidentiality covenant of indefinite duration.
Jason Grommon. On April 20, 2011, we entered into an amended and restated employment agreement with Mr. Grommon, our Senior Vice President, Operations. This amended and restated agreement supersedes Mr. Grommon's previous employment agreement, which was entered into on March 26, 2009, and amended on August 12, 2010. The initial term of the agreement expires on April 15, 2014, and the term will be automatically renewed for successive one year terms thereafter unless 30 days' written notice of non-renewal is delivered by either party. Mr. Grommon's current annual base salary is $235,000 and he is eligible to participate in the annual cash bonus plan. The agreement provides that, upon the termination of Mr. Grommon's employment without cause (as defined in the employment agreement), Mr. Grommon will continue to be paid his base salary for 12 months following termination, subject to the execution, delivery and non-revocation of a release in
115
favor of us and our affiliates and compliance with the terms of his Noncompetition Agreement, which provides for certain standard non-competition and non-solicitation covenants that apply during his employment and following the termination of his employment for 24 months and a confidentiality covenant of indefinite duration.
Ken Buck. On April 20, 2011, we entered into an amended and restated employment agreement with Mr. Buck, our Senior Vice President, Human Resources. This amended and restated agreement supersedes Mr. Buck's previous employment agreement, which was entered into on March 26, 2009. The initial term of the agreement expires on April 15, 2014, and the term will be automatically renewed for successive one year terms thereafter unless 30 days' written notice of non-renewal is delivered by either party. Mr. Buck's current annual base salary is $175,000 and he is eligible to participate in the annual cash bonus plan. The agreement provides that, upon the termination of Mr. Buck's employment without cause (as defined in the employment agreement), Mr. Buck will continue to be paid his base salary for six months following termination, subject to the execution, delivery and non-revocation of a release in favor of us and our affiliates and compliance with the terms of his Noncompetition Agreement, which provides for certain standard non-competition and non-solicitation covenants that apply during his employment and following the termination of his employment for 24 months and a confidentiality covenant of indefinite duration.
OUTSTANDING EQUITY AWARDS AT FISCAL YEAR-END
| |
Class B Units(3) | ||||||
|---|---|---|---|---|---|---|---|
Name
|
Number of Unvested Class B Units (#)(1) |
Market Value of Unvested Class B Units ($)(2) |
|||||
Eric K. Jungbluth |
2,625 | 1,698,270 | |||||
Scott Harrison |
458 | 296,308 | |||||
Donald Wharton |
662 | 428,288 | |||||
Jason Grommon |
687 | 444,462 | |||||
Ken Buck |
162 | 104,808 | |||||
- (1)
- The percentage of the Class B Units sold that are subject to an optional right of repurchase by Holdings at the lower of cost and fair market value following a termination of the purchaser's employment decreases over a three year period beginning with the vesting commencement date (which is between 5 months and 1 year from the issuance date for the named executive officers). If termination of the purchaser's employment occurs prior to or on the vesting commencement date, 100% of the Class B Units sold are subject to an optional right of repurchase by Holdings at the lower of cost and fair market value. The percentage of Class B Units sold that is subject to purchase by Holdings at the lower of cost and fair market value decreases over time as follows: 75% if termination of the purchaser's employment occurs following the vesting commencement date but prior to or on the first anniversary of the vesting commencement date; 50% if termination of the purchaser's employment occurs following the first anniversary of the vesting commencement date but prior to or on the second anniversary of the vesting commencement; 25% if termination of the purchaser's employment occurs following the second anniversary of the vesting commencement date but prior to or on the third anniversary of the vesting commencement date; and 0% if termination of the purchaser's employment occurs after the third anniversary of the vesting commencement date. If a purchaser's employment is terminated for cause (as defined in the LP Agreement) at any time, Holdings may repurchase all of the Class B Units at the lower of cost and fair market value. Throughout this prospectus, we refer to Class B Units that may be repurchased at the lower of cost and fair market value as "unvested" and Class B Units that may be repurchased at fair market value as "vested." Distributions are made in respect of the Class B Units in accordance with the LP Agreement.
116
- (2)
- The
market value of unvested Class B Units subject to repurchase at the lower of cost and fair market value is determined based on the value of the
units on December 31, 2010.
- (3)
- The following reflects the vesting commencement dates of the Class B Units purchased by the named executive officers that were partially unvested as of December 31, 2010. All of these Class B Units follow the vesting schedule described in note 1 above.
Name
|
Number of Class B Units |
Vesting Commencement Date |
|||||
|---|---|---|---|---|---|---|---|
Eric K. Jungbluth |
3,000 | 4/7/09 | |||||
|
1,500 | 2/10/10 | |||||
Scott Harrison |
133 |
2/1/08 |
|||||
|
133 | 7/1/08 | |||||
|
134 | 12/31/08 | |||||
|
200 | 4/1/09 | |||||
|
300 | 2/10/10 | |||||
Donald Wharton |
500 |
9/2/09 |
|||||
|
300 | 2/10/10 | |||||
|
250 | 12/9/10 | |||||
Jason Grommon |
400 |
8/18/09 |
|||||
|
400 | 2/10/10 | |||||
|
250 | 12/9/10 | |||||
Ken Buck |
100 |
2/1/09 |
|||||
|
150 | 12/9/10 | |||||
| |
Class B Units | ||||||
|---|---|---|---|---|---|---|---|
Name
|
Number of Class B Units That Became Vested in 2010 (#) |
Value Realized on Vesting ($)(1) |
|||||
Eric K. Jungbluth |
1,165 | 22,240 | |||||
Scott Harrison |
324 | 59,230 | |||||
Donald Wharton |
263 | 51,050 | |||||
Jason Grommon |
263 | 49,588 | |||||
Ken Buck |
63 | 24,656 | |||||
- (1)
- This amount represents the potential value to the named executive officer realized upon the vesting of these units based on the difference between the value of the units on the applicable vesting dates during the relevant quarter in 2010, less the price paid for the units by the executives, which was $10 per unit.
Potential Payments upon Termination or Change in Control
In the event of a termination of the employment of Messrs. Jungbluth, Harrison, Wharton, Grommon or Buck without cause (as defined in their respective employment agreements), each of them would be entitled to the continuation of base salary for a specified period following termination (Mr. Jungbluth, 18 months; Messrs. Harrison, Wharton and Grommon, 12 months; Mr. Buck, 6 months). In addition, Messrs. Jungbluth and Harrison would be entitled to receive a pro rata annual bonus for the year in which termination occurs, based on actual performance of our company during
117
the relevant year. Except in the case of Mr. Harrison, receipt of the severance described herein would be contingent upon the execution of a release in favor of us and our affiliates and subsidiaries and compliance with the noncompetition agreements entered into by our named executive officers, which provide for certain standard non-competition and non-solicitation covenants that apply during employment and following the termination of employment for 18 months for Mr. Jungbluth and 24 months for Messrs. Wharton, Grommon and Buck, and a confidentiality covenant of indefinite duration. Mr. Harrison is also party to a noncompetition agreement, which provides for certain standard non-competition and non-solicitation covenants that apply during his employment and following the termination of his employment for 24 months and a confidentiality covenant of indefinite duration.
In addition, if Messrs. Jungbluth or Harrison resign for good reason (as defined in their respective employment agreements), or if we choose not to renew the term of Mr. Jungbluth's agreement, the severance to which they will be entitled will be the same severance they will receive in the event of a termination of their employment without cause. Messrs. Wharton, Grommon and Buck, however, are not entitled to severance in the event of their resignation under any circumstances.
As described above, following the termination of our named executive officers' employment, Holdings may repurchase the Class B Units held by our named executive officers. Depending on the date of termination, a portion of the Class B Units may be repurchased at their fair market value and a portion may be purchased at the lower of fair market value and cost. See "—Elements of Compensation—Long-Term Equity Incentives" for a more detailed discussion of the terms of the Class B Units.
The severance to which our named executive officers would be entitled, assuming a termination of employment on December 31, 2010, is reflected in the below chart.
| |
Termination without Cause | Resignation with Good Reason |
Non-Renewal of the Term by Our Company |
||||||||||||||||
|---|---|---|---|---|---|---|---|---|---|---|---|---|---|---|---|---|---|---|---|
| |
Salary Continuation |
Bonus(1) | Salary Continuation |
Bonus(1) | Salary Continuation |
Bonus(1) | |||||||||||||
Eric K. Jungbluth |
$ | 622,500 | $ | 524,895 | $ | 622,500 | $ | 524,895 | $ | 622,500 | $ | 524,895 | |||||||
Scott Harrison |
$ | 285,000 | $ | 218,848 | $ | 285,000 | $ | 218,848 | — | — | |||||||||
Donald Wharton |
$ | 240,000 | — | — | — | — | — | ||||||||||||
Jason Grommon |
$ | 220,000 | — | — | — | — | — | ||||||||||||
Ken Buck |
$ | 85,000 | — | — | — | — | — | ||||||||||||
- (1)
- Each of Mr. Jungbluth and Mr. Harrison is entitled to a pro rata bonus for the year in which termination occurs, based on actual performance. Based on a termination date of December 31, 2010, each of Messrs. Jungbluth and Harrison would be entitled to a bonus for the full 2010 year.
Our named executive officers are not entitled to severance in the event of change in control of our company or Holdings without the occurrence of a qualifying termination of employment, and are not entitled to increased severance in the event of a termination of employment following a change in control. In addition, our named executive officers are not entitled to severance in the event of termination of employment under any circumstances other than those described herein.
Director Compensation
Our directors did not receive any cash compensation for services performed in 2010, although they did receive reimbursement of travel expenses in connection with their services to us. None of our directors purchased Class B Units during 2010. As of December 31, 2010, Vincent A. Calarco and Julian M. Steinberg held 300 Class B Units each and Vincent A. Sarni held 400 Class B Units. All of these units are subject to repurchase in the same manner as those held by our named executive officers.
118
PRINCIPAL AND SELLING STOCKHOLDERS
The following table shows information regarding the beneficial ownership of our common stock as of the date of this prospectus (i) immediately prior to and (ii) as adjusted to give effect to this offering by:
- •
- each person or group who is known by us to own beneficially more than 5% of our common stock;
- •
- each of our directors and named executive officers;
- •
- all of our directors and executive officers as a group; and
- •
- the selling stockholder.
The amounts and percentages of our common stock beneficially owned are reported on the basis of rules of the SEC governing the determination of beneficial ownership of securities. Under these rules, a person is deemed to be a "beneficial owner" of a security if that person has or shares "voting power," which includes the power to vote or direct the voting of such security, or "investment power," which includes the power to dispose of or to direct the disposition of such security. A person is also deemed to be a beneficial owner of any securities of which that person has a right to acquire beneficial ownership within 60 days, including any shares of our common stock subject to an option that is exercisable within 60 days. More than one person may be deemed to be a beneficial owner of the same securities.
Following the completion of this offering (and following any exercise of the overallotment option by the underwriters or the expiration of such option), Holdings, the owner of 100% of our common stock prior to this offering, intends to distribute to all of the holders of the Class A Units and the Class B Units in accordance with and as contemplated by the limited partnership agreement of Holdings (i) the cash proceeds it receives in this offering, less expenses and amounts used to repay the outstanding indebtedness of Holdings, and (ii) all remaining shares of our common stock that it holds at such time. After that distribution, Holdings will be dissolved, and former holders of the Class A Units and the Class B Units will then directly hold shares of our common stock.
Percentage of beneficial ownership prior to this offering is based on shares of common stock outstanding, after giving effect to the -for-one stock split. Percentage of beneficial ownership after this offering and the Distribution is based on shares of common stock outstanding (assuming no exercise of the overallotment option), or shares of common stock outstanding (assuming full exercise of the overallotment option), in each case, after giving effect to the -for-one stock split and the sale by us of the shares of common stock offered hereby. For a discussion of our stock split and the Distribution, see "Prospectus Summary—The Offering" and "Description of Capital Stock."
Unless otherwise indicated, the address for each holder listed below is c/o CPG International Inc., 888 North Keyser Avenue, Scranton, Pennsylvania 18504.
119
| |
Shares Beneficially Owned Before this Offering(1) |
|
Shares Beneficially Owned After this Offering and the Distribution(3) |
Shares Beneficially Owned After this Offering and the Distribution Assuming Full Exercise of Overallotment Option(4) |
||||||||||||||||||
|---|---|---|---|---|---|---|---|---|---|---|---|---|---|---|---|---|---|---|---|---|---|---|
Name of Beneficial Owner:
|
Number of Shares |
Percentage of Shares |
Number of Shares Being Offered(2) |
Number of Shares |
Percentage of Shares |
Number of Shares |
Percentage of Shares |
|||||||||||||||
CPG International Holdings LP(1) |
10 | 100 | % | — | — | |||||||||||||||||
AEA Investors(5) |
— | |||||||||||||||||||||
Pamlico Capital I, L.P.(6) |
— | |||||||||||||||||||||
KF Equities(7) |
— | |||||||||||||||||||||
Clearview/CP/Vycom Acquisition, LLC(8) |
— | |||||||||||||||||||||
AEA Mezzanine(9) |
— | |||||||||||||||||||||
Eric K. Jungbluth(10) |
— | |||||||||||||||||||||
Scott Harrison(11) |
— | |||||||||||||||||||||
Donald Wharton(12) |
— | |||||||||||||||||||||
Jason Grommon(13) |
— | |||||||||||||||||||||
Ken Buck(14) |
— | |||||||||||||||||||||
James Andersen(15) |
— | |||||||||||||||||||||
Vincent A. Calarco(16) |
— | |||||||||||||||||||||
Stuart M. Christhilf, IV(17) |
— | |||||||||||||||||||||
John L. Garcia(18) |
— | |||||||||||||||||||||
Brian R. Hoesterey(19) |
— | |||||||||||||||||||||
Vincent A. Sarni(20) |
— | |||||||||||||||||||||
Julian M. Steinberg(21) |
— | |||||||||||||||||||||
All directors and executive officers as a group (12 persons)(22) |
— | |||||||||||||||||||||
- *
- Represents
beneficial ownership of less than 1%.
- (1)
- Prior
to the completion of this offering, all of our issued and outstanding common stock is held by Holdings. Holdings is a limited partnership and the
general partner of Holdings is CPG Holding I LLC. The business and affairs of Holdings is managed exclusively by the general partner. The general partner has full and complete authority, power
and discretion to act on behalf of Holdings in all matters respecting the partnership and its operations, business and properties, to manage and control the business, affairs and properties (including
the disposition of all or part thereof) of the partnership, to make all decisions regarding those matters and to perform any and all other acts or activities customary or incident to the management of
the partnership's business. The general partner is an affiliate of AEA Investors. John L. Garcia, the Chief Executive Officer and President of AEA Investors, may be deemed to have voting power,
and together with Vincent A. Mai, the Chairman of AEA Investors, may be deemed to share dispositive power, with respect to shares of our common stock that are beneficially owned by Holdings,
but Mr. Garcia and Mr. Mai each disclaims beneficial ownership of such shares.
Other than with respect to Holdings, solely for illustrative purposes, these columns represent the number and percentage of shares of our common stock that the respective holders would receive in the Distribution if Holdings were to distribute all of the shares of our common stock to the holders of its Class A Units and Class B Units prior to the completion of this offering based on a valuation of $ per share, which is the midpoint of the offering price range set forth on the front cover of this prospectus.
- (2)
- Assumes
no exercise of the overallotment option. Holdings is the sole selling stockholder in this offering. In connection with the Distribution, Holdings
intends to distribute to all of the holders of its Class A Units and Class B Units the cash proceeds it receives in this offering, less expenses and amounts used to repay the outstanding
indebtedness of Holdings.
- (3)
- Gives
effect to the Distribution following the completion of this offering and assuming no exercise of the overallotment option.
- (4)
- Gives effect to the Distribution following the completion of this offering and assuming full exercise of the overallotment option.
120
- (5)
- Represents
investment vehicles managed by AEA Investors LP or AEA Management (Cayman) Ltd. Prior to the completion of this offering, AEA
Investors does not directly hold any shares of our common stock, but holds 75,019 Class A Units in Holdings. See note 1 above.
The address for AEA Investors LP is 55 East 52nd Street, 35th Floor, New York, NY 10055. The address for AEA Management (Cayman) Ltd. is c/o Walkers SPV Limited, P.O. Box 908GT, George Town, Grand Cayman, Cayman Islands.
- (6)
- Prior
to the completion of this offering, Pamlico Capital I, L.P. does not directly hold any shares of our common stock, but holds 16,126
Class A Units in Holdings. See note 1 above. The address for Pamlico Capital I, L.P. is 150 North College Street, Suite 2400, Charlotte, NC 28202.
- (7)
- Prior
to the completion of this offering, KF Equities does not directly hold any shares of our common stock, but holds 4,636 Class A Units in
Holdings. See note 1 above. KF Equities is a partnership whose members include James Keisling, our former Chairman of the Board and other members of the Keisling family. The address for KF
Equities is 5 Bucknell Drive, Clarks Green, PA 18411.
- (8)
- Prior
to the completion of this offering, Clearview/CP/Vycom Acquisition, LLC does not directly hold any shares of our common stock, but holds 5,006
Class A Units in Holdings. See note 1 above. The address for Clearview/CP/Vycom Acquisition, LLC is 1445 East Putnam Avenue, Old Greenwich, CT 06870.
- (9)
- Represents
AEA Mezzanine Fund L.P. and AEA Mezzanine (Unleveraged) Fund L.P., which are affiliated with AEA Investors. Prior to the completion
of this offering, AEA Mezzanine does not directly hold any shares of our common stock, but holds 1,146 Class A Units in Holdings. See note 1 above. The address for AEA Mezzanine
Fund L.P. and AEA Mezzanine (Unleveraged) Fund L.P. is 263 Tresser Boulevard, Stamford, CT 06901.
- (10)
- Prior
to the completion of this offering, Mr. Jungbluth does not directly hold any shares of our common stock, but holds 162 Class A Units
and 4,540 Class B Units in Holdings. See note 1 above.
- (11)
- Prior
to the completion of this offering, Mr. Harrison does not directly hold any shares of our common stock, but holds 240 Class A Units and
1,500 Class B Units in Holdings. See note 1 above.
- (12)
- Prior
to the completion of this offering, Mr. Wharton does not directly hold any shares of our common stock, but holds 1,050 Class B Units in
Holdings. See note 1 above.
- (13)
- Prior
to the completion of this offering, Mr. Grommon does not directly hold any shares of our common stock, but holds 1,050 Class B Units in
Holdings. See note 1 above.
- (14)
- Prior
to the completion of this offering, Mr. Buck does not directly hold any shares of our common stock, but holds 250 Class B Units in
Holdings. See note 1 above.
- (15)
- Does
not include shares of common stock beneficially owned by Clearview/CP/Vycom Acquisition, LLC. Mr. Andersen serves on our board of
directors as a representative of Clearview/CP/Vycom Acquisition, LLC. Mr. Andersen is the Managing Partner and co-founder of Clearview Capital, an indirect parent of
Clearview/CP/Vycom Acquisition, LLC. Mr. Andersen disclaims beneficial ownership of the shares of common stock owned by Clearview/CP/Vycom Acquisition, LLC, except to the extent
of his pecuniary interest therein.
- (16)
- Prior
to the completion of this offering, Mr. Calarco does not directly hold any shares of our common stock, but holds 300 Class B Units in
Holdings. See note 1 above. Mr. Calarco serves on our board of directors as a representative of AEA Investors.
- (17)
- Does
not include shares of common stock beneficially owned by Pamlico Capital I, L.P. Mr. Christhilf serves on our board of directors and is
a member of Pamlico Capital GP I, LLC, the general partner of Pamlico Capital I, L.P. Mr. Christhilf disclaims beneficial ownership of the shares of common stock owned by
Pamlico Capital I, L.P., except to the extent of his pecuniary interest therein.
- (18)
- Mr. Garcia
serves on our board of directors as a representative of AEA Investors. Mr. Garcia is a Partner and the Chief Executive Officer and
President of AEA Investors. Mr. Garcia disclaims beneficial ownership of the shares of common stock owned by investment vehicles managed by AEA Investors LP and AEA Management
(Cayman) Ltd., except to the extent of his pecuniary interests therein.
- (19)
- Mr. Hoesterey serves on our board of directors as a representative of AEA Investors. Mr. Hoesterey is a Partner of AEA Investors. Mr. Hoesterey disclaims beneficial ownership of the shares of common stock owned by investment vehicles managed by AEA Investors LP and AEA Management (Cayman) Ltd., except to the extent of his pecuniary interests therein.
121
- (20)
- Prior
to the completion of this offering, Mr. Sarni does not directly hold any shares of our common stock, but holds 400 Class B Units in
Holdings. See note 1 above. Mr. Sarni serves on our board of directors as a representative of AEA Investors.
- (21)
- Prior
to the completion of this offering, Mr. Steinberg does not directly hold any shares of our common stock, but holds 219 Class A Units
and 300 Class B Units in Holdings. See note 1 above. Mr. Steinberg serves on our board of directors as a representative of AEA Investors.
- (22)
- Prior to the completion of this offering, our directors and executive officers as a group do not directly hold any shares of our common stock, but collectively hold 621 Class A Units and 9,390 Class B Units in Holdings. See note 1 above.
122
CERTAIN RELATIONSHIPS AND RELATED PARTY TRANSACTIONS
Related Party Transaction Policy
Upon completion of this offering, we intend to adopt a written policy for the review, approval and ratification of related party transactions. Pursuant to this policy, our directors, executive officers and holders of more than five percent of our common stock, including their immediate family members, will not be permitted to enter into a related party transaction with us, as discussed below, without the consent of our audit committee, another independent committee of our board of directors, or the full board. Any request for us to enter into a transaction in which any such party has a direct or indirect material interest and the amount involved exceeds $120,000, will be required to be presented to our audit committee for review, consideration and approval. All of our directors, executive officers and employees will be required to report to our audit committee any such related party transaction. In approving or rejecting the proposed transaction, our audit committee will take into account (i) whether the transaction is on terms no less favorable to us than terms generally available to an unaffiliated third party under similar circumstances; (ii) the nature and extent of the related party's interest in the transaction; (iii) the material terms of the transaction, including the amount involved and the type of transaction; (iv) if applicable, the impact of the transaction on a director's independence; and (v) any other matters our audit committee deems appropriate. Under the policy, if we should become aware of a related party transaction that has not been approved, our audit committee will be notified and will determine the appropriate action, including ratification, rescission or amendment of the transaction.
AEA Investors
We have entered into a management agreement with AEA Investors relating to the provision of their advisory and consulting services. Commencing as of May 1, 2006, AEA Investors received a $1.5 million annual fee, subject to the limitations under the covenants in our credit agreements. In addition, in consideration of services performed in connection with the Composatron acquisition and the related financings, we paid a $0.5 million fee to AEA Investors upon the closing of the Composatron acquisition. We believe that the management agreement and the services mentioned above are or were on terms at least as favorable to us as we would expect to negotiate with unrelated third parties. Following this offering, the AEA Investors management fee is expected to be terminated and we will be required to pay management termination fees of $ .
Management Equity Participation
Following the completion of this offering and the Distribution, members of our current management team will hold approximately % of our common stock (or % if the underwriters exercise their overallotment option in full). See "Principal and Selling Stockholders."
Pamlico Capital I, L.P.
Pamlico Capital I, L.P. (formerly known as WCP Fund I, L.P.), or Pamlico Capital I, is a co-investor in our company. See "Principal and Selling Stockholders." As described below, Pamlico Capital I has one representative on our board of directors as well as one representative on the advisory board of Holdings. Subsidiaries of Wells Fargo & Company, a former affiliate of Pamlico Capital I, are agents and lenders under our New Revolving Credit Facility and New Term Loan Agreement.
Partnership Agreement, Stockholders Agreement and Registration Rights Agreement
A partnership agreement with respect to Holdings has been entered into among AEA Investors, Pamlico Capital I, Clearview/CP/Vycom Acquisition, LLC, or Clearview, and certain members of management. The partnership agreement contains, among other things, preemptive rights and certain restrictions on the ability of the parties thereto to freely transfer the partnership units in Holdings or
123
shares of our stock, which may be distributed by Holdings to the partners. Holdings has an advisory board whose role is to advise and make recommendations to the general partner of Holdings (which is an affiliate of AEA Investors) with respect to the business of Holdings. The advisory board consists of seven members, which includes five members (Messrs. Calarco, Garcia, Hoesterey, Sarni and Steinberg) who are representatives of AEA Investors, one member (Mr. Christhilf) who is a representative of Pamlico Capital I and one member (Mr. Andersen) who is a representative of Clearview. The parties to the partnership agreement have agreed to enter into a stockholders agreement and a registration rights agreement upon the Distribution to the partners of shares of our common stock following the completion of this offering. Following the Distribution, the former holders of the Class A Units and the Class B Units will become party to a stockholders agreement pursuant to which they will agree for a period not to exceed 18 months from the date of Distribution to vote their shares of our common stock on matters presented to the stockholders in the same manner as AEA Investors. In particular, each party will agree to vote all of their shares to elect to our board of directors such individuals as may be designated by AEA Investors from time to time. Messrs. Calarco, Garcia, Hoesterey, Sarni and Steinberg have been designated to serve on our board of directors by AEA Investors. See "—Board of Directors" below. In addition, each party to the stockholders agreement will also agree not to transfer shares of our common stock during such 18 month period without the prior written approval of . The registration rights agreement will provide that, upon certain conditions, certain parties will have the ability to cause us to register shares of our common stock under the Securities Act, and other parties to the registration rights agreement may participate in such registrations.
Board of Directors
Our board of directors consists of eight members, which includes five members (Messrs. Calarco, Garcia, Hoesterey, Sarni and Steinberg) who are representatives of AEA Investors, one member (Mr. Christhilf) who is a representative of Pamlico Capital I, one member (Mr. Andersen) who is a representative of Clearview and Mr. Jungbluth, our Chief Executive Officer.
On December 19, 2008, Mr. James Keisling (our former Chairman of the Board), KF Equities, Holdings, CPG I, Scranton Inc. and AZEK Inc. entered into a Separation Agreement and Release, pursuant to which Mr. Keisling ceased to serve as chairman of the boards of directors of our company, CPG I, Scranton Inc. and AZEK Inc. as of December 19, 2008. Also pursuant to this agreement, Holdings purchased 1,636 Class A Units in Holdings from KF Equities, and 2,000 Class B Units in Holdings from Mr. Keisling, for an aggregate purchase price of $3,000,000. Holdings agreed to pay the purchase price in three installments, with the last payment to occur no later than August 15, 2010. Installments of approximately $1.0 million were made in December 2008, August 2009 and February 2010. The agreement contains a release of claims by each of Mr. Keisling and KF Equities in favor of Holdings, CPG I and their subsidiaries and affiliates. Mr. Keisling also agreed to remain subject to the restrictions in the Noncompetition Agreement, dated as of May 10, 2005, among Mr. Keisling, our company, CPG I, Scranton Inc. and AZEK Inc. until December 19, 2010.
We also have long-term notes in the amount of $13.9 million due from Holdings for the payment made on behalf of Holdings related to repurchase of ownership units in Holdings. Included in the $13.9 million is approximately $3.0 million related to the repurchase of Class A Units and Class B Units pursuant to the separation agreement discussed above with Mr. James Keisling, our former Chairman of the Board. Also included in the $13.9 million is approximately $4.0 million related to the repurchase of Class A Units pursuant to the contribution agreement with Mr. Larry Sloan, one of the sellers of Procell. The notes have been classified in shareholder's equity. Notes in an aggregate principal amount of $0.7 million bear interest at a fixed rate of 4.11%. Interest on the remainder of the notes is accrued based upon the short-term U.S. Treasury bill rate. During the last three fiscal years, the rates ranged from 0.32% to 3.14%. Currently, no repayment schedule has been established for
124
these notes. However, following completion of this offering, Holdings intends to use a portion of the cash proceeds it receives in this offering to repay these outstanding notes in full.
Other Relationships and Transactions
In 2005, AZEK Inc., our wholly owned subsidiary, entered into a lease with respect to the 286,458 square foot property located in Scranton, Pennsylvania (Keyser Avenue). The lessor and owner of the property is an entity whose owners include affiliates of Clearview, a co-investor in our company. The initial term of the lease was four years, and AZEK Inc. has options to extend the lease term for five additional four-year periods. Rent for the lease is paid monthly at a rate of $0.5 million per year as of December 31, 2010, increasing by 1% each year thereafter.
Upon completion of the Procell acquisition, we entered into an amended lease agreement related to Procell's office and manufacturing facilities location, with North Alabama Property Leasing, Inc. The lessor of the property is an entity whose sole shareholder is an equity holder in Holdings. Total lease payments for each of the years ended December 31, 2010, 2009 and 2008 were approximately $0.6 million. We also paid storage and other fees in the amount of approximately $0.03 million for each of the years ended December 31, 2010, 2009 and 2008.
Tide Transport, Inc., a freight company owned by two equity holders of Holdings, has in the past provided certain freight services to our Foley, Alabama facility. These services included shipping finished product and for the transportation of resin purchases. Total freight costs for this arrangement were approximately $0.4 million for the year ended December 31, 2008.
The former owners of Composatron conducted business for finished goods as well as machinery repairs and parts with various companies that are affiliated with the former owners of Composatron. Total costs paid after the acquisition to these affiliated companies were approximately $1,000, $10,000 and $221,000 for the years ended December 31, 2010, 2009 and 2008, respectively.
125
The following is a description of our capital stock and the material provisions of our amended and restated certificate of incorporation and amended and restated bylaws, as each is anticipated to be in effect immediately prior to the completion of this offering, and other agreements to which we and our stockholders are parties. The following is a summary of applicable law and of certain provisions of our amended and restated certificate of incorporation and amended and restated bylaws and other agreements, copies of which are available as set forth under "Where You Can Find More Information."
General
Upon the completion of this offering, our authorized capital stock will consist of shares of common stock, par value $0.01 per share and shares of preferred stock, par value $0.01 per share. The rights and privileges of holders of our common stock are subject to any series of preferred stock that we may issue in the future.
As of March 31, 2011, 10 shares of our common stock were issued and outstanding, all of which were owned by Holdings.
Common Stock
The holders of our common stock are entitled to the following rights:
Following the consummation of this offering and the Distribution, we expect that AEA Investors will continue to control a majority of the voting power of our outstanding common stock. Holders of our common stock are entitled to one vote for each share held of record on all matters submitted to a vote of the stockholders, including the election of directors. There will be no cumulative voting in the election of directors, which means that holders of a majority of the outstanding shares of common stock will be able to elect all of the directors, and holders of less than a majority of such shares will be unable to elect any director. Under our amended and restated certificate of incorporation, subject to preferences that may be applicable to any outstanding shares of preferred stock, holders of common stock are entitled to receive ratably such dividends, if any, as may be declared from time to time by our board of directors out of funds legally available for dividend payments. All outstanding shares of common stock are fully paid and non-assessable, and the shares of common stock to be issued upon completion of this offering will be fully paid and non-assessable. The holders of common stock have no preferences or rights of conversion, exchange, pre-emption or other subscription rights. There are no redemption or sinking fund provisions applicable to the common stock. In the event of any liquidation, dissolution or winding-up of our affairs, holders of common stock will be entitled to share ratably in our assets that are remaining after payment or provision for payment of all of our debts and obligations and after liquidation payments to holders of outstanding shares of preferred stock, if any.
Preferred Stock
Our preferred stock, if issued, would have priority over our common stock with respect to dividends and other distributions, including the distribution of our assets upon liquidation. Unless required by law or by any stock exchange on which our common stock may be listed, our board of directors will have the authority without further stockholder authorization to issue from time to time shares of preferred stock in one or more series and to fix the terms, limitations, relative rights and preferences and variations of each series. Although we have no present plans to issue any shares of preferred stock, the issuance of shares of preferred stock, or the issuance of rights to purchase such shares, could adversely affect the rights and powers, including voting rights, of the common stock, and could have the effect of delaying, deterring or preventing a change in control of us or an unsolicited acquisition proposal.
126
Stockholders Agreement
Following the Distribution, the former holders of the Class A Units and the Class B Units will become party to a stockholders agreement pursuant to which they will agree, for a period not to exceed 18 months from the date of the Distribution, to vote their shares of our common stock on matters presented to the stockholders in the same manner as AEA Investors. In particular, each party will agree to vote all of their shares to elect to our board of directors such individuals as may be designated by AEA Investors from time to time. In addition, each party to the stockholders agreement will also agree not to transfer shares of our common stock during such 18 month period without the prior written approval of .
Limitations on Directors' Liability
Our amended and restated certificate of incorporation and amended and restated bylaws contain provisions indemnifying our directors and officers to the fullest extent permitted by law. Prior to the completion of this offering, we intend to enter into indemnification agreements with each of our directors which may, in certain cases, be broader than the specific indemnification provisions contained under Delaware law.
In addition, as permitted by Delaware law, our certificate of incorporation provides that no director will be liable to us or our stockholders for monetary damages for breach of fiduciary duty as a director. The effect of this provision is to restrict our rights and the rights of our stockholders in derivative suits to recover monetary damages against a director for breach of fiduciary duty as a director, except that a director will be personally liable for:
- •
- any breach of his or her duty of loyalty to us or our stockholders;
- •
- acts or omissions not in good faith which involve intentional misconduct or a knowing violation of law;
- •
- the payment of dividends or the redemption or purchase of stock in violation of Delaware law; or
- •
- any transaction from which the director derived an improper personal benefit.
This provision does not affect a director's liability under the federal securities laws.
To the extent that our directors, officers and controlling persons are indemnified under the provisions contained in our amended and restated certificate of incorporation, Delaware law or contractual arrangements against liabilities arising under the Securities Act, we have been advised that in the opinion of the SEC such indemnification is against public policy as expressed in the Securities Act and is therefore unenforceable.
Provisions of Our Amended and Restated Certificate of Incorporation, Amended and Restated Bylaws and Delaware Law that May Have an Anti-Takeover Effect
Amended and Restated Certificate of Incorporation and Amended and Restated Bylaws
Certain provisions in our amended and restated certificate of incorporation and amended and restated bylaws summarized below may be deemed to have an anti-takeover effect and may delay, deter or prevent a tender offer or takeover attempt that a stockholder might consider to be in its best interests, including attempts that might result in a premium being paid over the market price for the shares held by stockholders.
127
Among other things, our amended and restated certificate of incorporation and amended and restated bylaws:
- •
- authorize the issuance of blank check preferred stock that our board could issue to increase the number of outstanding
shares and to discourage a takeover attempt;
- •
- limit the ability of stockholders to remove directors without cause if a "group," as defined under Section 13(d)(3)
of the Exchange Act, ceases to own more than 50% of our common stock;
- •
- establish a classified board of directors so that not all members of our board are elected at one time;
- •
- prohibit our stockholders from calling a special meeting of stockholders;
- •
- prohibit stockholder action by written consent, which requires all stockholder actions to be taken at a meeting of our
stockholders, if a "group" ceases to own more than 50% of our common stock;
- •
- provide that our board of directors is expressly authorized to adopt, alter or repeal our bylaws;
- •
- establish advance notice requirements for nominations for election to our board of directors or for proposing matters that
can be acted upon by stockholders at stockholder meetings; and
- •
- grant to our board of directors the sole power to set the number of directors and to fill any vacancy on the board.
The foregoing provisions of our amended and restated certificate of incorporation and amended and restated bylaws could discourage potential acquisition proposals and could delay or prevent a change in control. These provisions are intended to enhance the likelihood of continuity and stability in the composition of our board of directors and in the policies formulated by our board of directors and to discourage certain types of transactions that may involve an actual or threatened change in control. These provisions are designed to reduce our vulnerability to an unsolicited acquisition proposal. The provisions also are intended to discourage certain tactics that may be used in proxy fights. However, such provisions could have the effect of discouraging others from making tender offers for our shares and, as a consequence, they also may inhibit fluctuations in the market price of our common stock that could result from actual or rumored takeover attempts. Such provisions also may have the effect of preventing changes in our management.
Delaware Takeover Statute
In our amended and restated certificate of incorporation, we elect not to be governed by Section 203 of the DGCL, as permitted under and pursuant to subsection (b)(3) of Section 203, until the first date that affiliates of AEA Investors no longer beneficially own more than 50% of our common stock. After such date, we will be governed by Section 203. Subject to certain exceptions, Section 203 prohibits a Delaware corporation from engaging in any "business combination" (as defined below) with any "interested stockholder" (as defined below) for a period of three years following the date that such stockholder became an interested stockholder, unless: (1) prior to such date, the board of directors of the corporation approved either the business combination or the transaction that resulted in the stockholder becoming an interested stockholder; (2) on consummation of the transaction that resulted in the stockholder becoming an interested stockholder, the interested stockholder owned at least 85% of the voting stock of the corporation outstanding at the time the transaction commenced, excluding for purposes of determining the number of shares outstanding those shares owned (x) by persons who are directors and also officers and (y) by employee stock plans in which employee participants do not have the right to determine confidentially whether shares held subject to the plan will be tendered in a tender or exchange offer; or (3) on or subsequent to such date, the business combination is approved by the board of directors and authorized at an annual or special meeting of
128
stockholders, and not by written consent, by the affirmative vote of at least 662/3% of the outstanding voting stock that is not owned by the interested stockholder.
Section 203 of the DGCL defines "business combination" to include: (1) any merger or consolidation involving the corporation and the interested stockholder; (2) any sale, transfer, pledge or other disposition of 10% or more of the assets of the corporation involving the interested stockholder; (3) subject to certain exceptions, any transaction that results in the issuance or transfer by the corporation of any stock of the corporation to the interested stockholder; (4) any transaction involving the corporation that has the effect of increasing the proportionate share of the stock of any class or series of the corporation beneficially owned by the interested stockholder; or (5) the receipt by the interested stockholder of the benefit of any loans, advances, guarantees, pledges or other financial benefits provided by or through the corporation. In general, Section 203 defines an "interested stockholder" as any entity or person beneficially owning 15% or more of the outstanding voting stock of the corporation and any entity or person affiliated with or controlling or controlled by such entity or person.
New York Stock Exchange Listing
We have applied to list our common stock on the NYSE under the symbol "AZEK."
Transfer Agent and Registrar
We have appointed as the transfer agent and registrar for our common stock.
129
DESCRIPTION OF CERTAIN INDEBTEDNESS
On February 18, 2011, we entered into the New Revolving Credit Facility, the New Term Loan Agreement and the Intercreditor Agreement. We used the proceeds of borrowings under the New Revolving Credit Facility and the New Term Loan Agreement to refinance substantially all of our then outstanding long-term indebtedness. See "Management's Discussion and Analysis of Financial Condition and Results of Operations—Liquidity and Capital Resources."
New Revolving Credit Facility
The New Revolving Credit Facility matures on February 18, 2016 and provides for maximum aggregate borrowings of up to $65.0 million. The borrowers under the New Revolving Credit Facility are AZEK Inc., Procell Inc. and Scranton Inc. (AZEK Inc. and Procell Inc. on one hand and Scranton Inc. on the other hand, each a "group"). The borrowing capacity available to each group is limited by a borrowing base. For each group, the borrowing base is limited to a percentage of eligible accounts receivable and inventory, less reserves that may be established by the administrative agent in the exercise of its reasonable business judgment. As of March 31, 2011, the available borrowing base was approximately $23.6 million.
The New Revolving Credit Facility provides for interest on outstanding principal thereunder at a fluctuating rate, at our option, at (i) the base rate (prime rate) plus a spread of 1.25% to 1.75%, or (ii) adjusted LIBOR plus a spread of 2.25% to 2.75% or (iii) a combination thereof.
The obligations under the New Revolving Credit Facility are secured by substantially all of the present and future assets of the borrowers and guarantors including equity interests of their domestic subsidiaries and 65% of the equity interests of their first-tier foreign subsidiaries, subject to certain exceptions. The obligations under the New Revolving Credit Facility are guaranteed by our company and our wholly owned domestic subsidiaries other than certain immaterial subsidiaries.
The New Revolving Credit Facility contains negative covenants that limit our ability to, among other things:
- •
- incur additional indebtedness or issue guarantees;
- •
- grant liens;
- •
- make fundamental changes in our business, corporate structure or capital structure, including, among other things,
entering into mergers, acquisitions and other business combinations;
- •
- make loans and investments;
- •
- pay dividends, make distributions and repurchase equity;
- •
- enter into sale and leaseback transactions;
- •
- enter into transactions with affiliates;
- •
- modify or waive certain material agreements in a manner that is adverse in any material respect to the lenders; and
- •
- prepay or repurchase certain indebtedness.
These covenants under the New Revolving Credit Facility are subject to qualifications and exceptions, including without limitation our ability to generally make acquisitions, incur and prepay indebtedness and pay dividends so long as the average excess availability under the New Revolving Credit Facility is at least $10.0 million and our pro forma fixed charge coverage ratio is not less than 1.0 to 1.0.
130
The New Revolving Credit Facility also includes a financial covenant that requires us to maintain, when the average excess availability falls below $7.5 million, a minimum fixed charge coverage ratio (generally defined as the ratio of (a) the amount of (i) our consolidated EBITDA for the 12-month period ended prior to the relevant month end, less (ii) capital expenditures made during such period, less (iii) cash taxes paid during such period, and less (iv) cash dividend and equity redemption payments to (b) the sum of all cash interest expense and certain regularly scheduled prepayments of debt made during such period) equal to at least 1.0 to 1.0, for each month until such time as the average excess availability over 90 days or 120 days (as applicable) exceeds $7.5 million.
Any failure to be in compliance with this financial covenant when we are required to be in compliance, or any failure to be in compliance with any of the other covenants under the New Revolving Credit Facility, could result in a default under the New Revolving Credit Facility. A default could constitute or lead to an event of default, which could have the consequences described below, and could also cause a cross-default under the New Term Loan Agreement. In addition, in the case of a default, we would not be able to borrow funds under the New Revolving Credit Facility, which could make it difficult for us to operate our business.
In addition, if the average excess availability falls below $7.5 million for three consecutive business days or if an event of default exists under the New Revolving Credit Facility, then the administrative agent will have the right to sweep all cash in certain of our accounts into an agent payment account under the agent's full dominion and control.
The New Revolving Credit Facility contains events of default that are customary for financings of this type, subject to certain exceptions, including those related to:
- •
- default in payment of principal and interest;
- •
- materially incorrect representations or warranties;
- •
- default in observance or performance of affirmative or negative covenants;
- •
- cross default in the payment of specified other indebtedness;
- •
- specified events of bankruptcy;
- •
- specified ERISA events;
- •
- specified judgments or decrees;
- •
- any assignment for the benefit of creditors or notice of a bulk transfer;
- •
- failure of the applicable financing documents or any material provisions hereof, the guarantees, security documents or any
related documents to be enforceable and in full force and effect;
- •
- certain subordinated indebtedness failing to be validly subordinated; and
- •
- certain change of control events.
If an event of default under the New Revolving Credit Facility occurs, the administrative agent acting at the direction of required lenders may, among other things, declare the principal amount of all obligations under the New Revolving Credit Facility immediately due and payable (and all such obligations automatically become due and payable in the case of certain events of bankruptcy or insolvency) and take other actions permitted to be taken by a secured creditor.
New Term Loan Agreement
The New Term Loan Agreement provides for a term loan of $285.0 million, which was drawn on February 18, 2011 in order to fund: (a) the repayment of the amounts outstanding under our Old Revolving Credit Facility and Old Term Loan Agreement, (b) the redemption and/or repurchase of our
131
Old Notes, (c) costs, expenses and fees in connection with the preparation, negotiation and execution of the refinancing transactions and (d) working capital and other general corporate needs. CPG I, AZEK Inc., Procell Inc. and Scranton Inc. are the borrowers under the New Term Loan Agreement. In addition, the New Term Loan Agreement provides for additional uncommitted term loans of up to $70.0 million.
The New Term Loan Agreement provides for interest on outstanding principal thereunder at a fluctuating rate, at our option, at (i) the base rate (prime rate) plus a spread of 3.50% or (ii) adjusted LIBOR plus a spread of 4.50%, subject to a LIBOR floor of 1.50% or (iii) a combination thereof.
The obligations under the New Term Loan Agreement are secured by substantially all of the present and future assets of the borrowers and guarantors including equity interests of their domestic subsidiaries and 65% of the equity interests of their first-tier foreign subsidiaries, subject to certain exceptions. The obligations under the New Term Loan Agreement are guaranteed by our company and our wholly owned domestic subsidiaries other than certain immaterial subsidiaries.
The New Term Loan Agreement requires mandatory prepayments of the term loans thereunder from certain debt issuances, a percentage of certain equity issuances (subject to step-downs upon our company achieving certain leverage ratios), certain asset dispositions (subject to certain reinvestment rights) and a percentage of excess cash flow (subject to step-downs upon our company achieving certain leverage ratios). The borrowers are required to repay the outstanding principal under the New Term Loan Agreement in quarterly installments of $712,500 from March 31, 2011 through December 31, 2016, with the remaining outstanding principal balance under the New Term Loan Agreement due on the maturity date, February 18, 2017.
The New Term Loan Agreement contains negative covenants that limit our ability to, among other things:
- •
- incur additional indebtedness or issue guarantees;
- •
- grant liens;
- •
- make fundamental changes in our business, corporate structure or capital structure, including, among other things,
entering into mergers, acquisitions and other business combinations;
- •
- make loans and investments;
- •
- pay dividends, make distributions and repurchase equity;
- •
- enter into sale and leaseback transactions;
- •
- enter into transactions with affiliates;
- •
- modify or waive certain material agreements in a manner that is adverse in any material respect to the lenders; and
- •
- prepay or repurchase certain indebtedness.
These covenants under the New Term Loan Agreement are subject to certain qualifications and exceptions.
The New Term Loan Agreement also includes financial covenants that require us to maintain quarterly (i) a maximum total leverage ratio ranging from 5.75 to 1.0 for the fiscal quarter ending June 30, 2011 to 3.00 to 1.0 for the fiscal quarter ending June 30, 2016 and thereafter and (ii) a minimum interest coverage ratio of 2.50 to 1.0 for the fiscal quarters ending June 30, September 30 and December 31, 2011 and 2.75 to 1.0 for the fiscal quarter ending March 31, 2012 and thereafter.
Any failure to be in compliance with either of these financial covenants, or with any of the other covenants under the New Term Loan Agreement, could result in a default under the New Term Loan
132
Agreement. A default could constitute or lead to an event of default, which could have the consequences described below, and could also cause a cross-default under the New Revolving Credit Facility.
The New Term Loan Agreement contains events of default that are customary for financings of this type, subject to certain exceptions, including those related to:
- •
- default in payment of principal and interest;
- •
- materially incorrect representations or warranties;
- •
- default in observance or performance of affirmative or negative covenants;
- •
- cross default in the payment of specified other indebtedness;
- •
- specified events of bankruptcy;
- •
- specified ERISA events;
- •
- specified judgments or decrees;
- •
- any assignment for the benefit of creditors or notice of a bulk transfer;
- •
- failure of the applicable financing documents or any material provisions hereof, the guarantees, security documents or any
related documents to be enforceable and in full force and effect;
- •
- certain subordinated indebtedness failing to be validly subordinated; and
- •
- certain change of control events.
If an event of default under the New Term Loan Agreement occurs, the administrative agent acting at the direction of required lenders may, among other things, declare the principal amount of all obligations under the New Term Loan Agreement immediately due and payable (and all such obligations automatically become due and payable in the case of certain events of bankruptcy or insolvency) and take other actions permitted to be taken by a secured creditor.
Intercreditor Agreement
The priority of liens on our assets created pursuant to the New Term Loan Agreement and the New Revolving Credit Facility are governed by and subject to the Intercreditor Agreement. Pursuant to the Intercreditor Agreement, the liens securing the obligations under the New Revolving Credit Facility are subordinate to the liens in that portion of the collateral that secures the obligations under the New Term Loan Agreement on a first priority basis, or the Term Priority Collateral, and the liens securing the obligations under the New Term Loan Agreement are subordinate to the liens in that portion of the collateral that secures the obligations under the New Revolving Credit Facility on a first priority basis, or the Revolving Priority Collateral. The Revolving Priority Collateral generally consists of existing and after-acquired current assets, including all accounts receivable, inventory, cash, deposit and securities accounts and related intangibles of the respective borrowers and guarantors and all products and proceeds of the foregoing, and the Term Priority Collateral generally consists of substantially all other existing and after-acquired assets of the respective borrowers and guarantors included in the collateral, including plant, property and equipment and a pledge of the equity interests of each existing and subsequently acquired or organized direct or indirect domestic and first-tier foreign subsidiaries (65% in the case of a first-tier foreign subsidiary).
133
SHARES ELIGIBLE FOR FUTURE SALE
Upon the completion of this offering, we will have outstanding shares of common stock, assuming no exercise of outstanding options and assuming that the underwriters have not exercised their overallotment option. Of these shares, shares of common stock will be freely transferable without restriction or further registration under the Securities Act by persons other than "affiliates," as that term is defined in Rule 144 under the Securities Act. Generally, the balance of our outstanding common stock are "restricted securities" within the meaning of Rule 144 under the Securities Act, subject to the limitations and restrictions that are described below. Common stock purchased by our affiliates will be "restricted securities" under Rule 144. Restricted securities may be sold in the public market only if registered or if they qualify for an exemption from registration under Rule 144 or Rule 701 under the Securities Act.
Lock-Up Agreements
In connection with this offering, we, our executive officers and directors, holders of more than % of our outstanding stock and the selling stockholder will agree with the underwriters to enter into lock-up agreements described in "Underwriting," pursuant to which shares of our common stock outstanding after this offering will be restricted from immediate resale in accordance with the terms of such lock-up agreements. In addition, following the Distribution, all of the former holders of Class A Units and Class B Units of Holdings will agree to restrictions on the transfer of shares of our common stock until 18 months after the Distribution without the approval of pursuant to the stockholders agreement and the registration rights agreement. See "Certain Relationships and Related Party Transactions."
Rule 144
In general, under Rule 144 as in effect on the date of this prospectus, beginning 90 days after the consummation of this offering, a person (or persons whose common stock is required to be aggregated), who is an affiliate, and who has beneficially owned our common stock for at least six months is entitled to sell in any three-month period a number of shares that does not exceed the greater of:
- •
- 1% of the number of shares then outstanding, which will equal
approximately shares immediately after
consummation of this offering; or
- •
- the average weekly trading volume in our shares on the NYSE during the four calendar weeks preceding the filing of a notice on Form 144 with respect to such a sale.
Sales by our affiliates under Rule 144 are also subject to manner of sale provisions and notice requirements and to the availability of current public information about us. An "affiliate" is a person that directly, or indirectly through one or more intermediaries, controls or is controlled by, or is under common control with an issuer.
Under Rule 144, a person (or persons whose shares are aggregated) who is not deemed to have been an affiliate of ours at any time during the 90 days preceding a sale, and who has beneficially owned the shares proposed to be sold for at least six months (including the holding period of any prior owner other than an affiliate), would be entitled to sell those shares subject only to availability of current public information about us, and after beneficially owning such shares for at least 12 months, would be entitled to sell an unlimited number of shares without restriction. To the extent that our affiliates sell their common stock, other than pursuant to Rule 144 or a registration statement, the purchaser's holding period for the purpose of effecting a sale under Rule 144 commences on the date of transfer from the affiliate.
134
Rule 701
In general, under Rule 701 as in effect on the date of this prospectus, any of our employees, directors, officers, consultants or advisors who purchased shares from us in reliance on Rule 701 in connection with a compensatory stock or option plan or other written agreement before the effective date of this offering, or who purchased shares from us after that date upon the exercise of options granted before that date, are eligible to resell such shares 90 days after the effective date of this offering in reliance upon Rule 144. If such person is not an affiliate, such sale may be made subject only to the manner of sale provisions of Rule 144. If such a person is an affiliate, such sale may be made under Rule 144 without compliance with the holding period requirement, but subject to the other Rule 144 restrictions described above.
Equity Incentive Plan
We intend to file one or more registration statements on Form S-8 under the Securities Act to register shares of our common stock issued or reserved for issuance under the equity incentive plan we intend to adopt in connection with this offering. The first such registration statement is expected to be filed soon after the date of this prospectus and will automatically become effective upon filing with the SEC. Accordingly, shares registered under such registration statement will be available for sale in the open market, unless such shares are subject to vesting restrictions with us or the lock-up restrictions described above.
Registration Rights
The parties to the partnership agreement with respect to Holdings have agreed to enter into a registration rights agreement upon the Distribution to the partners of shares of our common stock following completion of this offering. The registration rights agreement will provide that, upon certain conditions, certain parties will have the ability to cause us to register shares of our common stock under the Securities Act, and other parties to the registration rights agreement may participate in such registrations. See "Certain Relationships and Related Party Transactions."
135
MATERIAL U.S. FEDERAL INCOME AND ESTATE TAX CONSIDERATIONS FOR
NON-U.S. HOLDERS
The following is a summary of the material U.S. federal income and estate tax consequences of the acquisition, ownership and disposition of our common stock by a non-U.S. holder. As used in this summary, the term "non-U.S. holder" means a beneficial owner of our common stock that is not, for United States federal income tax purposes:
- •
- an individual who is a citizen or resident of the United States or a former citizen or resident of the United States
subject to taxation as an expatriate;
- •
- a corporation (or other entity classified as a corporation) created or organized in or under the laws of the United States
or of any political subdivision of the United States;
- •
- a partnership (including any entity or arrangement classified as a partnership);
- •
- an estate whose income is includible in gross income for U.S. federal income tax purposes regardless of its source; or
- •
- a trust, if (1) a U.S. court is able to exercise primary supervision over the trust's administration and one or more "United States persons" (within the meaning of the U.S. Internal Revenue Code of 1986, as amended, or the Code) has the authority to control all of the trust's substantial decisions, or (2) the trust has a valid election in effect under applicable U.S. Treasury regulations to be treated as a "United States person."
If a partnership or other pass-through entity (including an entity or arrangement treated as a partnership or other type of pass-through entity for U.S. federal income tax purposes) owns our common stock, the tax treatment of a partner or beneficial owner of the partnership or other pass-through entity may depend upon the status of the partner or beneficial owner, the activities of the partnership or other pass-through entity and certain determinations made at the partner or beneficial owner level. Partners and beneficial owners in partnerships or other pass-through entities that own our common stock should consult their own tax advisors as to the particular U.S. federal income and estate tax consequences applicable to them.
This summary does not discuss all of the aspects of U.S. federal income and estate taxation that may be relevant to a non-U.S. holder in light of the non-U.S. holder's particular investment or other circumstances. In addition, this summary only addresses a non-U.S. holder that holds our common stock as a capital asset (generally, investment property) and does not address:
- •
- special U.S. federal income tax rules that may apply to particular non-U.S. holders, such as financial
institutions, insurance companies, tax-exempt organizations, and dealers and traders in stocks, securities or currencies;
- •
- non-U.S. holders holding our common stock as part of a conversion, constructive sale, wash sale or other
integrated transaction or a hedge, straddle or synthetic security;
- •
- any U.S. state and local or non-U.S. or other tax consequences; or
- •
- the U.S. federal income or estate tax consequences for the beneficial owners of a non-U.S. holder.
This summary is based on provisions of the Code, applicable U.S. Treasury regulations and administrative and judicial interpretations, all as in effect or in existence on the date of this prospectus. Subsequent developments in U.S. federal income or estate tax law, including changes in law or differing interpretations, which may be applied retroactively, could have a material effect on the U.S. federal income and estate tax consequences of purchasing, owning and disposing of our common stock as set forth in this summary. Each non-U.S. holder should consult a tax advisor regarding the U.S. federal,
136
state, local and non-U.S. income and other tax consequences of acquiring, holding and disposing of our common stock.
Dividends
We do not intend to pay any cash distributions for the foreseeable future. See "Dividend Policy." If distributions are paid by us in respect of our common stock to non-U.S. holders, such distribution will constitute a dividend for U.S. federal income tax purposes to the extent the distribution is paid out of our current or accumulated earnings and profits, as determined under U.S. federal income tax principles.
In the event that we pay dividends on our common stock that are not effectively connected with a non-U.S. holder's conduct of a trade or business in the United States, a U.S. federal withholding tax at a rate of 30%, or a lower rate under an applicable income tax treaty, will be withheld from the gross amount of the dividends paid to such non-U.S. holder. Non-U.S. holders should consult their own tax advisors regarding their entitlement to benefits under a relevant income tax treaty.
In order to claim the benefit of an applicable income tax treaty, a non-U.S. holder will be required to provide a properly executed U.S. Internal Revenue Service Form W-8BEN (or other applicable form) in accordance with the applicable certification and disclosure requirements. Special rules apply to partnerships and other pass-through entities and these certification and disclosure requirements also may apply to beneficial owners of partnerships and other pass-through entities that hold our common stock. A non-U.S. holder that is eligible for a reduced rate of U.S. federal withholding tax under an income tax treaty may obtain a refund of any excess amounts withheld by timely filing an appropriate claim for a refund with the U.S. Internal Revenue Service. Non-U.S. holders should consult their own tax advisors regarding their entitlement to benefits under a relevant income tax treaty and the manner of claiming the benefits.
Dividends that are effectively connected with a non-U.S. holder's conduct of a trade or business in the United States and, if required by an applicable income tax treaty, are attributable to a permanent establishment maintained by the non-U.S. holder in the United States, will generally be taxed on a net income basis at the regular graduated rates and in the manner applicable to United States persons. In that case, the U.S. federal withholding tax discussed above will not apply if the non-U.S. holder provides a properly executed U.S. Internal Revenue Service Form W-8ECI (or other applicable form) in accordance with the applicable certification and disclosure requirements. In addition, a "branch profits tax" may be imposed at a 30% rate, or a lower rate under an applicable income tax treaty, on dividends received by a foreign corporation that are effectively connected with the conduct of a trade or business in the United States.
In general, distributions to a non-U.S. holder in excess of our current and accumulated earnings and profits will not be subject to U.S. federal income or withholding tax to the extent the amounts paid do not exceed the non-U.S. holder's adjusted basis in the shares of our common stock with respect to which the distributions are made. Such distributions will reduce the non-U.S. holder's adjusted basis in the applicable shares of common stock (but not below zero).
Distributions to a non-U.S. holder in excess of our current and accumulated earnings and profits will generally be treated in the same manner as gain described below in "—Gain on Disposition of Our Common Stock" to the extent the amounts paid exceed the non-U.S. holder's adjusted basis in the shares of our common stock with respect to which the distributions are made.
137
Gain on Disposition of Our Common Stock
A non-U.S. holder generally will not be taxed on any gain recognized on a disposition of our common stock unless:
- •
- the gain is effectively connected with the non-U.S. holder's conduct of a trade or business in the United
States and, if required by an applicable income tax treaty, is attributable to a permanent establishment maintained by the non-U.S. holder in the United States; in these cases, the gain
will be capital gain subject to U.S. federal income tax (but not withholding tax) on a net basis at the rates applicable to United States persons (unless an applicable income tax treaty provides
otherwise) and, if the non-U.S. holder is a foreign corporation, the "branch profits tax" described above may also apply;
- •
- the non-U.S. holder is an individual who holds our common stock as a capital asset, is present in the United
States for more than 182 days in the taxable year of the disposition and meets other requirements (in which case, except as otherwise provided by an applicable income tax treaty, the gain,
which may be offset by U.S. source capital losses recognized in the same taxable year, generally will be subject to a flat 30% U.S. federal income tax, even though the non-U.S. holder is
not considered a resident alien under the Code); or
- •
- we are or have been a "U.S. real property holding corporation" for U.S. federal income tax purposes at any time during the shorter of the five-year period ending on the date of disposition or the period that the non-U.S. holder held our common stock.
Generally, a corporation is a "U.S. real property holding corporation" if the fair market value of its "U.S. real property interests" equals or exceeds 50% of the sum of the fair market value of its worldwide real property interests plus its other assets used or held for use in a trade or business. The tax relating to stock in a U.S. real property holding corporation generally will not apply to a non-U.S. holder whose holdings, direct and indirect, at all times during the applicable period, constituted 5% or less of our common stock, provided that our common stock was regularly traded on an established securities market. We believe that we are not currently, and we do not anticipate becoming in the future, a U.S. real property holding corporation.
Federal Estate Tax
Our common stock that is owned or treated as owned by an individual who is not a U.S. citizen or resident of the United States (as specially defined for U.S. federal estate tax purposes) at the time of death will be included in the individual's gross estate for U.S. federal estate tax purposes, unless an applicable estate tax or other treaty provides otherwise and, therefore, may be subject to U.S. federal estate tax.
Information Reporting and Backup Withholding
Dividends paid to a non-U.S. holder may be subject to U.S. information reporting and backup withholding. A non-U.S. holder will be exempt from backup withholding if the non-U.S. holder provides a properly executed U.S. Internal Revenue Service Form W-8BEN or otherwise meets documentary evidence requirements for establishing its status as a non-U.S. holder or otherwise establishes an exemption.
The gross proceeds from the disposition of our common stock may be subject to U.S. information reporting and backup withholding. If a non-U.S. holder sells our common stock outside the United States through a non-U.S. office of a non-U.S. broker and the sales proceeds are paid to the non-U.S. holder outside the United States, then the U.S. backup withholding and information reporting requirements generally will not apply to that payment. However, U.S. information reporting, but not U.S. backup withholding, will apply to a payment of sales proceeds, even if that payment is made
138
outside the United States, if a non-U.S. holder sells our common stock through a non-U.S. office of a broker that is a United States person or has certain enumerated connections with the United States, unless the broker has documentary evidence in its files that the non-U.S. holder is not a United States person and certain other conditions are met or the non-U.S. holder otherwise establishes an exemption.
If a non-U.S. holder receives payments of the proceeds of a sale of our common stock to or through a U.S. office of a broker, the payment is subject to both U.S. backup withholding and information reporting unless the non-U.S. holder provides a properly executed U.S. Internal Revenue Service Form W-8BEN certifying that the non-U.S. holder is not a "United States person" or the non-U.S. holder otherwise establishes an exemption. The amount of any backup withholding from a payment to a non-U.S. holder will be allowed as a credit against the non-U.S. holder's U.S. federal income tax liability and may entitle the non-U.S. holder to a refund, provided that the required information is timely furnished to the Internal Revenue Service.
Recent Legislation
Recent legislation generally imposes withholding at a rate of 30% on payments to certain foreign entities (including financial intermediaries), after December 31, 2012, of dividends on and the gross proceeds of dispositions of U.S. common stock, unless various U.S. information reporting and due diligence requirements (generally relating to ownership by U.S. persons of interests in or accounts with those entities) have been satisfied. Non-U.S. holders should consult their tax advisers regarding the possible implications of this legislation on their investment in our common stock.
139
Barclays Capital Inc., Deutsche Bank Securities Inc. and Credit Suisse Securities (USA) LLC are acting as the representatives of the underwriters and joint book-running managers of this offering. Under the terms of an underwriting agreement, which will be filed as an exhibit to the registration statement of which this prospectus forms a part, each of the underwriters named below has severally agreed to purchase from us and the selling stockholder the respective number of common stock shown opposite its name below:
Underwriters
|
Number of Shares |
||
|---|---|---|---|
Barclays Capital Inc. |
|||
Deutsche Bank Securities Inc. |
|||
Credit Suisse Securities (USA) LLC |
|||
Total |
|||
The underwriting agreement provides that the underwriters' obligation to purchase shares of common stock depends on the satisfaction of the conditions contained in the underwriting agreement including:
- •
- the obligation to purchase all of the shares of common stock offered hereby (other than those shares of common stock
covered by their option to purchase additional shares as described below), if any of the shares are purchased;
- •
- the representations and warranties made by us and the selling stockholder to the underwriters are true;
- •
- there is no material change in our business or the financial markets; and
- •
- we deliver customary closing documents to the underwriters.
The selling stockholder may be deemed to be an "underwriter" within the meaning of the Securities Act.
Commissions and Expenses
The following tables summarize the underwriting discounts and commissions we and the selling stockholder will pay to the underwriters. These amounts are shown assuming both no exercise and full exercise of the underwriters' option to purchase additional shares. The underwriting fee is the difference between the initial price to the public and the amount the underwriters pay to us and the selling stockholder for the shares.
| |
No Exercise | Full Exercise | |||||
|---|---|---|---|---|---|---|---|
Per share |
$ | $ | |||||
Total |
$ | $ | |||||
Paid by the Selling Stockholder
| |
No Exercise | Full Exercise | |||||
|---|---|---|---|---|---|---|---|
Per share |
$ | $ | |||||
Total |
$ | $ | |||||
The representatives of the underwriters have advised us that the underwriters propose to offer the shares of common stock directly to the public at the public offering price on the front cover of this
140
prospectus and to selected dealers, which may include the underwriters, at such offering price less a selling concession not in excess of $ per share. After the offering, the representatives may change the offering price and other selling terms. Sales of shares made outside of the United States may be made by affiliates of the underwriters.
The expenses of the offering that are payable by us and the selling stockholder are estimated to be $ (excluding underwriting discounts and commissions).
Option to Purchase Additional Shares
We and the selling stockholder have granted the underwriters an option exercisable for 30 days after the date of this prospectus, to purchase, from time to time, in whole or in part, up to an aggregate of shares at the public offering price less underwriting discounts and commissions. This option may be exercised if the underwriters sell more than shares in connection with this offering. To the extent that this option is exercised, each underwriter will be obligated, subject to certain conditions, to purchase its pro rata portion of these additional shares based on the underwriter's underwriting commitment in the offering as indicated in the table at the beginning of this "Underwriting" section.
Lock-Up Agreements
We, all of our directors and executive officers, holders of more than % of our outstanding stock and the selling stockholder have agreed that, without the prior written consent of each of Barclays Capital Inc., Deutsche Bank Securities Inc. and Credit Suisse Securities (USA) LLC, we and they will not directly or indirectly, (1) offer for sale, sell, pledge, or otherwise dispose of (or enter into any transaction or device that is designed to, or could be expected to, result in the disposition by any person at any time in the future of) any shares of common stock (including, without limitation, shares of common stock that may be deemed to be beneficially owned by us or them in accordance with the rules and regulations of the SEC and shares of common stock that may be issued upon exercise of any options or warrants) or securities convertible into or exercisable or exchangeable for common stock, (2) enter into any swap or other derivatives transaction that transfers to another, in whole or in part, any of the economic consequences of ownership of the common stock, (3) make any demand for or exercise any right or file or cause to be filed a registration statement, including any amendments thereto, with respect to the registration of any shares of common stock or securities convertible, exercisable or exchangeable into common stock or any of our other securities, or (4) publicly disclose the intention to do any of the foregoing for a period of 180 days after the date of this prospectus, subject to certain limited exceptions.
The 180-day restricted period described in the preceding paragraph will be extended if:
- •
- during the last 17 days of the 180-day restricted period we issue an earnings release or material news
or a material event relating to us occurs; or
- •
- prior to the expiration of the 180-day restricted period, we announce that we will release earnings results during the 16-day period beginning on the last day of the 180-day period,
in which case the restrictions described in the preceding paragraph will continue to apply until the expiration of the 18-day period beginning on the issuance of the earnings release or the announcement of the material news or occurrence of a material event, unless such extension is waived in writing by Barclays Capital Inc., Deutsche Bank Securities Inc. and Credit Suisse Securities (USA) LLC.
Barclays Capital Inc., Deutsche Bank Securities Inc. and Credit Suisse Securities (USA) LLC, in their sole discretion, may release the common stock and other securities subject to the lock-up agreements described above in whole or in part at any time with or without notice. When determining whether or not to release common stock and other securities from lock-up agreements, Barclays Capital Inc., Deutsche Bank Securities Inc. and Credit Suisse Securities (USA) LLC will consider,
141
among other factors, the holder's reasons for requesting the release, the number of shares of common stock and other securities for which the release is being requested and market conditions at the time.
Offering Price Determination
Prior to this offering, there has been no public market for our common stock. The initial public offering price will be negotiated between the representatives and us. In determining the initial public offering price of our common stock, the representatives will consider:
- •
- the history and prospects for the industry in which we compete;
- •
- our financial information;
- •
- the ability of our management and our business potential and earning prospects;
- •
- the prevailing securities markets at the time of this offering; and
- •
- the recent market prices of, and the demand for, publicly traded shares of generally comparable companies.
Indemnification
We and the selling stockholder have agreed to indemnify the underwriters against certain liabilities, including liabilities under the Securities Act, and to contribute to payments that the underwriters may be required to make for these liabilities.
Stabilization, Short Positions and Penalty Bids
The representatives may engage in stabilizing transactions, short sales and purchases to cover positions created by short sales, and penalty bids or purchases for the purpose of pegging, fixing or maintaining the price of the common stock, in accordance with Regulation M under the Securities Exchange Act of 1934:
- •
- Stabilizing transactions permit bids to purchase the underlying security so long as the stabilizing bids do not exceed a
specified maximum.
- •
- A short position involves a sale by the underwriters of shares in excess of the number of shares the underwriters are
obligated to purchase in the offering, which creates the syndicate short position. This short position may be either a covered short position or a naked short position. In a covered short position,
the number of shares involved in the sales made by the underwriters in excess of the number of shares they are obligated to purchase is not greater than the number of shares that they may purchase by
exercising their option to purchase additional shares. In a naked short position, the number of shares involved is greater than the number of shares in their option to purchase additional shares. The
underwriters may close out any short position by either exercising their option to purchase additional shares and/or purchasing shares in the open market. In determining the source of shares to close
out the short position, the underwriters will consider, among other things, the price of shares available for purchase in the open market as compared to the price at which they may purchase shares
through their option to purchase additional shares. A naked short position is more likely to be created if the underwriters are concerned that there could be downward pressure on the price of the
shares in the open market after pricing that could adversely affect investors who purchase in the offering.
- •
- Syndicate covering transactions involve purchases of the common stock in the open market after the distribution has been
completed in order to cover syndicate short positions.
- •
- Penalty bids permit the representatives to reclaim a selling concession from a syndicate member when the common stock originally sold by the syndicate member is purchased in a stabilizing or syndicate covering transaction to cover syndicate short positions.
142
These stabilizing transactions, syndicate covering transactions and penalty bids may have the effect of raising or maintaining the market price of our common stock or preventing or retarding a decline in the market price of the common stock. As a result, the price of the common stock may be higher than the price that might otherwise exist in the open market. These transactions may be effected on the NYSE or otherwise and, if commenced, may be discontinued at any time.
Neither we, the selling stockholder, nor any of the underwriters make any representation or prediction as to the direction or magnitude of any effect that the transactions described above may have on the price of the common stock. In addition, neither we, the selling stockholder, nor any of the underwriters make representation that the representatives will engage in these stabilizing transactions or that any transaction, once commenced, will not be discontinued without notice.
Electronic Distribution
A prospectus in electronic format may be made available on the Internet sites or through other online services maintained by one or more of the underwriters and/or selling group members participating in this offering, or by their affiliates. In those cases, prospective investors may view offering terms online and, depending upon the particular underwriter or selling group member, prospective investors may be allowed to place orders online. The underwriters may agree with us to allocate a specific number of shares for sale to online brokerage account holders. Any such allocation for online distributions will be made by the representatives on the same basis as other allocations.
Other than the prospectus in electronic format, the information on any underwriter's or selling group member's web site and any information contained in any other web site maintained by an underwriter or selling group member is not part of the prospectus or the registration statement of which this prospectus forms a part, has not been approved and/or endorsed by us, the selling stockholder, or any underwriter or selling group member in its capacity as underwriter or selling group member and should not be relied upon by investors.
New York Stock Exchange Listing
We have applied to list our shares of common stock on the NYSE under the symbol "AZEK."
Discretionary Sales
The underwriters have informed us that they do not intend to confirm sales to discretionary accounts that exceed 5% of the total number of shares offered by them.
Stamp Taxes
If you purchase shares of common stock offered in this prospectus, you may be required to pay stamp taxes and other similar charges under the laws and practices of the country of purchase, in addition to the offering price listed on the front cover of this prospectus.
Relationships
The underwriters and their respective affiliates are full service financial institutions engaged in various activities, which may include securities trading, commercial and investment banking, financial advisory, investment management, principal investment, hedging, financing and brokerage activities. Certain of the underwriters and their respective affiliates have, from time to time, performed, and may in the future perform, various financial advisory, corporate and investment banking services for us, for which they received or will receive customary fees and expenses. In addition, Credit Suisse Securities (USA) LLC, an underwriter for this offering, is a joint lead arranger and joint lead bookrunner under the New Revolving Credit Facility and the New Term Loan Agreement. Credit Suisse AG, Cayman Islands Branch, an affiliate of Credit Suisse Securities (USA) LLC, is the administrative agent under
143
the New Revolving Credit Facility and the administrative agent and collateral agent under the New Term Loan Agreement.
Selling Restrictions
European Economic Area
In relation to each Member State of the European Economic Area (the "EEA") which has implemented the Prospectus Directive (each, a "Relevant Member State") an offer to the public of any securities which are the subject of the offering contemplated by this prospectus supplement (the "Securities") may not be made in that Relevant Member State except that an offer to the public in that Relevant Member State of any Securities may be made at any time under the following exemptions under the Prospectus Directive, if they have been implemented in that Relevant Member State:
(a) at any time to any legal entity which is a qualified investor as defined in the Prospectus Directive;
(b) by the underwriters to fewer than 100 or, if the Relevant Member State has implemented the relevant provisions of the 2010 PD Amending Directive, 150 natural or legal persons (other than qualified investors as defined in the Prospectus Directive) as permitted under the Prospective Directive subject to obtaining the prior consent of the representatives for any such offer; or
(c) in any other circumstances falling within Article 3(2) of the Prospectus Directive, provided that no such offer of Securities shall result in a requirement for the publication by Noble Energy or any underwriter of a prospectus pursuant to Article 3 of the Prospectus Directive. Any person making or intending to make any offer of Securities within the EEA should only do so in circumstances in which no obligation arises for us or any of the underwriters to produce a prospectus for such offer. Neither we nor the underwriters have authorized, nor do they authorize, the making of any offer of Securities through any financial intermediary, other than offers made by the underwriters which constitute the final offering of Securities contemplated in this prospectus supplement. For the purposes of this provision and the buyer's representation below, the expression an "offer to the public" in relation to any Securities in any Relevant Member State means the communication in any form and by any means of sufficient information on the terms of the offer and any Securities to be offered so as to enable an investor to decide to purchase any Securities, as the same may be varied in that Member State by any measure implementing the Prospectus Directive in that Member State, the expression "Prospectus Directive" means Directive 2003/71/EC (and amendments thereto, including the 2010 PD Amending Directive to the extent implemented in the Relevant Member State) and includes any relevant implementing measure in each Relevant Member State and the expression "2010 PD Amending Directive" means Directive 2010/73/EU.
Each person in a Relevant Member State who receives any communication in respect of, or who acquires, any Securities will be deemed to have represented, warranted and agreed to and with us and each underwriter that:
(i) it is a "qualified investor" within the meaning of the law in that Relevant Member State implementing Article 2(1)(e) of the Prospectus Directive; and
(ii) in the case of any Securities acquired by it as a financial intermediary, as that term is used in Article 3(2) of the Prospectus Directive, (A) the Securities acquired by it in the offering have not been acquired on behalf of, nor have they been acquired with a view to their offer or resale to, persons in any Relevant Member State other than "qualified investors" (as defined in the Prospectus Directive), or in circumstances in which the prior consent of the representatives have been given to the offer or resale; or (B) where Securities have been acquired by it on behalf of persons in any Relevant Member State other than qualified investors, the offer of those Securities to it is not treated under the Prospectus Directive as having been made to such persons.
144
United Kingdom
This prospectus is only being distributed to, and is only directed at, persons in the United Kingdom that are qualified investors within the meaning of Article 2(1)(e) of the Prospectus Directive ("Qualified Investors") that are also (i) investment professionals falling within Article 19(5) of the Financial Services and Markets Act 2000 (Financial Promotion) Order 2005 (the "Order") or (ii) high net worth entities, and other persons to whom it may lawfully be communicated, falling within Article 49(2)(a) to (d) of the Order (all such persons together being referred to as "relevant persons"). This prospectus and its contents are confidential and should not be distributed, published or reproduced (in whole or in part) or disclosed by recipients to any other persons in the United Kingdom. Any person in the United Kingdom that is not a relevant persons should not act or rely on this document or any of its contents.
Australia
No prospectus or other disclosure document (as defined in the Corporations Act 2001 (Cth) of Australia ("Corporations Act")) in relation to the securities has been or will be lodged with the Australian Securities & Investments Commission ("ASIC"). This document has not been lodged with ASIC and is only directed to certain categories of exempt persons. Accordingly, if you receive this document in Australia:
(a) you confirm and warrant that you are either:
(i) a "sophisticated investor" under section 708(8)(a) or (b) of the Corporations Act;
(ii) a "sophisticated investor" under section 708(8)(c) or (d) of the Corporations Act and that you have provided an accountant's certificate to us which complies with the requirements of section 708(8)(c)(i) or (ii) of the Corporations Act and related regulations before the offer has been made;
(iii) a person associated with the company under section 708(12) of the Corporations Act; or
(iv) a "professional investor" within the meaning of section 708(11)(a) or (b) of the Corporations Act,
and to the extent that you are unable to confirm or warrant that you are an exempt sophisticated investor, associated person or professional investor under the Corporations Act any offer made to you under this document is void and incapable of acceptance; and
(b) you warrant and agree that you will not offer any of the securities for resale in Australia within 12 months of those securities being issued unless any such resale offer is exempt from the requirement to issue a disclosure document under section 708 of the Corporations Act.
Hong Kong
The securities may not be offered or sold in Hong Kong, by means of any document, other than (a) to "professional investors" as defined in the Securities and Futures Ordinance (Cap. 571, Laws of Hong Kong) and any rules made under that Ordinance or (b) in other circumstances which do not result in the document being a "prospectus" as defined in the Companies Ordinance (Cap. 32, Laws of Hong Kong) or which do not constitute an offer to the public within the meaning of that Ordinance. No advertisement, invitation or document relating to the securities may be issued or may be in the possession of any person for the purpose of the issue, whether in Hong Kong or elsewhere, which is directed at, or the contents of which are likely to be read by, the public in Hong Kong (except if permitted to do so under the laws of Hong Kong) other than with respect to the securities which are intended to be disposed of only to persons outside Hong Kong or only to "professional investors" as defined in the Securities and Futures Ordinance (Cap. 571, Laws of Hong Kong) or any rules made under that Ordinance.
145
India
This prospectus has not been and will not be registered as a prospectus with the Registrar of Companies in India or with the Securities and Exchange Board of India. This prospectus or any other material relating to these securities is for information purposes only and may not be circulated or distributed, directly or indirectly, to the public or any members of the public in India and in any event to not more than 50 persons in India. Further, persons into whose possession this prospectus comes are required to inform themselves about and to observe any such restrictions. Each prospective investor is advised to consult its advisors about the particular consequences to it of an investment in these securities. Each prospective investor is also advised that any investment in these securities by it is subject to the regulations prescribed by the Reserve Bank of India and the Foreign Exchange Management Act and any regulations framed thereunder.
Japan
No securities registration statement ("SRS") has been filed under Article 4, Paragraph 1 of the Financial Instruments and Exchange Law of Japan (Law No. 25 of 1948, as amended) ("FIEL") in relation to the securities. The securities are being offered in a private placement to "qualified institutional investors" (tekikaku-kikan-toshika) under Article 10 of the Cabinet Office Ordinance concerning Definitions provided in Article 2 of the FIEL (the Ministry of Finance Ordinance No. 14, as amended) ("QIIs"), under Article 2, Paragraph 3, Item 2 i of the FIEL. Any QII acquiring the securities in this offer may not transfer or resell those shares except to other QIIs.
Korea
The securities may not be offered, sold and delivered directly or indirectly, or offered or sold to any person for reoffering or resale, directly or indirectly, in Korea or to any resident of Korea except pursuant to the applicable laws and regulations of Korea, including the Korea Securities and Exchange Act and the Foreign Exchange Transaction Law and the decrees and regulations thereunder. The securities have not been registered with the Financial Services Commission of Korea for public offering in Korea. Furthermore, the securities may not be resold to Korean residents unless the purchaser of the securities complies with all applicable regulatory requirements (including but not limited to government approval requirements under the Foreign Exchange Transaction Law and its subordinate decrees and regulations) in connection with the purchase of the securities.
Singapore
This prospectus has not been registered as a prospectus with the Monetary Authority of Singapore. Accordingly, this prospectus and any other document or material in connection with the offer or sale, or invitation for subscription or purchase, of the securities may not be circulated or distributed, nor may the securities be offered or sold, or be made the subject of an invitation for subscription or purchase, whether directly or indirectly, to persons in Singapore other than (i) to an institutional investor under Section 274 of the Securities and Future Act, Chapter 289 of Singapore (the "SFA"), (ii) to a "relevant person" as defined in Section 275(2) of the SFA, or any person pursuant to Section 275 (1A), and in accordance with the conditions, specified in Section 275 of the SFA or (iii) otherwise pursuant to, and in accordance with the conditions of, any other applicable provision of the SFA.
146
Where the securities are subscribed and purchased under Section 275 of the SFA by a relevant person which is:
(a) a corporation (which is not an accredited investor as defined in Section 4A of the SFA) the sole business of which is to hold investments and the entire share capital of which is owned by one or more individuals, each of whom is an accredited investor; or
(b) a trust (where the trustee is not an accredited investor (as defined in Section 4A of the SFA)) whose sole whole purpose is to hold investments and each beneficiary is an accredited investor,
shares, debentures and units of shares and debentures of that corporation or the beneficiaries' rights and interest (howsoever described) in that trust shall not be transferable within six months after that corporation or that trust has acquired the securities under Section 275 of the SFA except:
(i) to an institutional investor under Section 274 of the SFA or to a relevant person (as defined in Section 275(2) of the SFA) and in accordance with the conditions, specified in Section 275 of the SFA;
(ii) in the case of a corporation) where the transfer arises from an offer referred to in Section 275(1A) of the SFA, or (in the case of a trust) where the transfer arises from an offer that is made on terms that such rights or interests are acquired at a consideration of not less than S$200,000 (or its equivalent in a foreign currency) for each transaction, whether such amount is to be paid for in cash or by exchange of securities or other assets;
(iii) where no consideration is or will be given for the transfer; or
(iv) where the transfer is by operation of law.
By accepting this prospectus, the recipient hereof represents and warrants that he is entitled to receive it in accordance with the restrictions set forth above and agrees to be bound by limitations contained herein. Any failure to comply with these limitations may constitute a violation of law.
147
The validity of the shares of common stock offered hereby will be passed upon for us by Fried, Frank, Harris, Shriver & Jacobson LLP, New York, New York. Certain legal matters relating to this offering will be passed upon for the underwriters by Latham & Watkins LLP, New York, New York.
The consolidated financial statements of CPG International Inc. and its subsidiaries as of December 31, 2010 and for the year ended December 31, 2010, and the retrospective inclusion of the disclosures related to earnings per share to the 2009 and 2008 consolidated financial statements, included in this prospectus have been so included in reliance on the report of PricewaterhouseCoopers LLP, an independent registered public accounting firm, given on the authority of said firm as experts in auditing and accounting.
The consolidated financial statements as of December 31, 2009 and for the years ended December 31, 2009 and 2008, before the effects of the retrospective inclusion of the disclosures related to earnings per share to the consolidated financial statements (not presented herein), have been audited by Deloitte & Touche LLP, an independent registered public accounting firm, as stated in their report appearing in this prospectus. The retrospective inclusion of earnings per share to the 2009 and 2008 consolidated financial statements has been audited by PricewaterhouseCoopers LLP. The 2009 and 2008 consolidated financial statements included in this prospectus have been so included in reliance upon the reports of Deloitte & Touche LLP and PricewaterhouseCoopers LLP given upon their authority as experts in accounting and auditing.
WHERE YOU CAN FIND MORE INFORMATION
We have filed with the SEC a registration statement on Form S-1 under the Securities Act with respect to the common stock offered hereby. As allowed by SEC rules, this prospectus, which is a part of the registration statement, omits certain information included in that registration statement and the exhibits thereto. For further information with respect to us and our common stock, we refer you to the registration statement, including all amendments, supplements, schedules and exhibits thereto.
Statements contained in this prospectus regarding the contents of any contract or any other document that is filed as an exhibit to the registration statement are not necessarily complete, and each such statement is qualified in all respects by reference to the full text of such contract or other document filed as an exhibit to the registration statement.
You may read and copy the registration statement, any exhibits and schedules thereto, and any reports, statements or other information we file or furnish with the SEC at the SEC's Public Reference Room at 100 F Street, N.E., Washington, DC 20549. You may also obtain copies of the documents at prescribed rates by writing to the Public Reference Section of the SEC. Please call the SEC at 1-800-SEC-0330 to obtain information on the operation of the Public Reference Room. In addition, the SEC maintains an internet site that contains reports, proxy and information statements, and other information regarding issuers that file electronically with the SEC. You can review the registration statement, as well as our future SEC filings, by accessing the SEC's website at www.sec.gov. You may also request copies of those documents, at no cost to you, by contacting us at the following address:
CPG
International Inc.
888 North Keyser Avenue
Scranton, Pennsylvania 18504
Attention: Chief Financial Officer
(570) 558-8000
148
INDEX TO CONSOLIDATED FINANCIAL STATEMENTS
F-1
REPORT OF INDEPENDENT REGISTERED PUBLIC ACCOUNTING FIRM
To
the Board of Directors and Shareholder of
CPG International Inc.
In our opinion, the accompanying consolidated balance sheet as of December 31, 2010 and the related consolidated statements of operation, shareholder's equity and cash flows for the year then ended present fairly, in all material respects, the financial position of CPG International Inc. and its subsidiaries (the "Company") at December 31, 2010, and the results of their operations and their cash flows for the year then ended in conformity with accounting principles generally accepted in the United States of America. These financial statements are the responsibility of the Company's management. Our responsibility is to express an opinion on these financial statements based on our audit. We conducted our audit of these statements in accordance with the standards of the Public Company Accounting Oversight Board (United States). Those standards require that we plan and perform the audit to obtain reasonable assurance about whether the financial statements are free of material misstatement. An audit includes examining, on a test basis, evidence supporting the amounts and disclosures in the financial statements, assessing the accounting principles used and significant estimates made by management, and evaluating the overall financial statement presentation. We believe that our audit provides a reasonable basis for our opinion.
We also have audited the adjustments to the 2009 and 2008 financial statements to retrospectively present earnings per share information as described in Note 1. In our opinion, such adjustments are appropriate and have been properly applied. We were not engaged to audit, review, or apply any procedures to the 2009 and 2008 financial statements of the Company other than with respect to the adjustments and, accordingly, we do not express an opinion or any other form of assurance on the 2009 and 2008 financial statements taken as a whole.
/s/ PricewaterhouseCoopers LLP
PricewaterhouseCoopers LLP
Philadelphia, Pennsylvania
March 10, 2011, except for the earnings per share information as described in Note 1 to the consolidated financial statements, as to which the date is April 22, 2011.
F-2
REPORT OF INDEPENDENT REGISTERED PUBLIC ACCOUNTING FIRM
To
the Board of Directors and Shareholder of
CPG International Inc.
Scranton, Pennsylvania
We have audited, before the effects of the retrospective inclusion of the disclosures of earnings per share as included on the consolidated statements of operations and as discussed in Note 1 to the consolidated financial statements, the accompanying consolidated balance sheet of CPG International Inc. and subsidiaries (the "Company") as of December 31, 2009, and the related consolidated statements of operations, shareholder's equity, and cash flows for each of the two years in the period ended December 31, 2009 (the 2009 and 2008 consolidated financial statements before the effects of the inclusion of the disclosure of earnings per share as discussed in Note 1 to the consolidated financial statements are not presented herein). These financial statements are the responsibility of the Company's management. Our responsibility is to express an opinion on the financial statements based on our audits.
We conducted our audits in accordance with the standards of the Public Company Accounting Oversight Board (United States). Those standards require that we plan and perform the audit to obtain reasonable assurance about whether the financial statements are free of material misstatement. An audit includes examining, on a test basis, evidence supporting the amounts and disclosures in the financial statements. An audit also includes assessing the accounting principles used and significant estimates made by management, as well as evaluating the overall financial statement presentation. We believe that our audits provide a reasonable basis for our opinion.
In our opinion, such 2009 and 2008 consolidated financial statements, before the effects of the retrospective inclusion of the disclosure of earnings per share as discussed in Note 1 to the consolidated financial statements, present fairly, in all material respects, the financial position of CPG International Inc. and subsidiaries as of December 31, 2009, and the results of their operations and their cash flows for each of the two years in the period ended December 31, 2009, in conformity with accounting principles generally accepted in the United States of America.
We were not engaged to audit, review, or apply any procedures to the retrospective inclusion of the disclosure of earnings per share as discussed in Note 1 to the consolidated financial statements and, accordingly, we do not express an opinion or any other form of assurance about whether such retrospective inclusion of the disclosure is appropriate and has been properly applied. This retrospective inclusion of the disclosure was audited by other auditors.
/s/ DELOITTE & TOUCHE LLP
Philadelphia,
Pennsylvania
March 25, 2010
F-3
CPG INTERNATIONAL INC. AND SUBSIDIARIES
CONSOLIDATED BALANCE SHEETS
December 31, 2010 and December 31, 2009
(dollars in
thousands, except share amounts)
| |
December 31, | |||||||||
|---|---|---|---|---|---|---|---|---|---|---|
| |
2010 | 2009 | ||||||||
ASSETS: |
||||||||||
Current assets: |
||||||||||
Cash and cash equivalents |
$ | 49,072 | $ | 44,501 | ||||||
Receivables: |
||||||||||
Trade, less allowance for doubtful accounts of $1,201 and $964 in 2010 and 2009, respectively |
15,762 | 14,219 | ||||||||
Inventories |
59,414 | 45,922 | ||||||||
Deferred income taxes—current |
5,335 | 2,414 | ||||||||
Prepaid expenses and other |
2,648 | 3,097 | ||||||||
Total current assets |
132,231 | 110,153 | ||||||||
Property and equipment—net |
82,018 | 84,332 | ||||||||
Goodwill |
247,337 | 246,842 | ||||||||
Intangible assets—net |
88,245 | 92,699 | ||||||||
Deferred financing costs—net |
2,991 | 5,079 | ||||||||
Other assets |
262 | 299 | ||||||||
Total assets |
$ | 553,084 | $ | 539,404 | ||||||
LIABILITIES AND SHAREHOLDER'S EQUITY: |
||||||||||
Current liabilities: |
||||||||||
Accounts payable |
$ | 29,413 | $ | 24,263 | ||||||
Current portion of capital lease |
1,311 | 1,747 | ||||||||
Current portion of long-term debt obligations |
— | 250 | ||||||||
Accrued interest |
12,705 | 13,049 | ||||||||
Accrued rebates |
4,595 | 3,916 | ||||||||
Accrued expenses |
13,218 | 14,527 | ||||||||
Total current liabilities |
61,242 | 57,752 | ||||||||
Deferred income taxes |
41,241 | 35,067 | ||||||||
Capital lease obligation—less current portion |
2,021 | 3,316 | ||||||||
Long-term debt—less current portion |
302,246 | 302,042 | ||||||||
Accrued warranty |
2,843 | 3,183 | ||||||||
Other liabilities |
88 | 35 | ||||||||
Commitments and contingencies |
||||||||||
Shareholder's equity: |
||||||||||
Common shares, $0.01 par value: 1,000 shares authorized; 10 issued and outstanding at December 31, 2010 and 2009 |
— | — | ||||||||
Additional paid-in capital |
212,282 | 212,152 | ||||||||
Accumulated deficit |
(53,546 | ) | (62,899 | ) | ||||||
Note receivable—CPG Holdings |
(13,947 | ) | (8,872 | ) | ||||||
Accumulated other comprehensive loss |
(1,386 | ) | (2,372 | ) | ||||||
Total shareholder's equity |
143,403 | 138,009 | ||||||||
Total liabilities and shareholder's equity |
$ | 553,084 | $ | 539,404 | ||||||
The accompanying notes are an integral part of the consolidated financial statements.
F-4
CPG INTERNATIONAL INC. AND SUBSIDIARIES
CONSOLIDATED STATEMENTS OF OPERATIONS
Years Ended December 31, 2010, 2009 and 2008
(dollars in thousands, except share and per share amounts)
| |
Year Ended December 31, | |||||||||||
|---|---|---|---|---|---|---|---|---|---|---|---|---|
| |
2010 | 2009 | 2008 | |||||||||
Net sales |
$ | 327,535 | $ | 266,875 | $ | 305,240 | ||||||
Cost of sales |
(226,670 | ) | (173,328 | ) | (235,099 | ) | ||||||
Gross profit |
100,865 | 93,547 | 70,141 | |||||||||
Selling, general and administrative expenses |
(56,489 | ) | (57,392 | ) | (50,644 | ) | ||||||
Lease termination expense |
— | (657 | ) | — | ||||||||
(Loss) gain on disposal of property |
(336 | ) | (525 | ) | 21 | |||||||
Impairment of goodwill and long-lived assets |
(599 | ) | (14,408 | ) | (40,000 | ) | ||||||
Operating income (loss) |
43,441 | 20,565 | (20,482 | ) | ||||||||
Other income (expenses): |
||||||||||||
Interest expense |
(30,854 | ) | (31,462 | ) | (35,405 | ) | ||||||
Interest income |
— | 115 | 500 | |||||||||
Foreign currency gain (loss) |
92 | 336 | (215 | ) | ||||||||
Miscellaneous—net |
243 | 29 | 153 | |||||||||
Total other expenses—net |
(30,519 | ) | (30,982 | ) | (34,967 | ) | ||||||
Income (loss) before income taxes |
12,922 | (10,417 | ) | (55,449 | ) | |||||||
Income tax (expense) benefit |
(3,569 | ) | 111 | 7,095 | ||||||||
Net income (loss) |
$ | 9,353 | $ | (10,306 | ) | $ | (48,354 | ) | ||||
Earnings (loss) per common share: |
||||||||||||
Weighted-average common shares outstanding (basic and diluted) |
10 | 10 | 10 | |||||||||
Net income (loss) per common share (basic and diluted) |
$ | 935 | $ | (1,031 | ) | $ | (4,835 | ) | ||||
The accompanying notes are an integral part of the consolidated financial statements.
F-5
CPG INTERNATIONAL INC. AND SUBSIDIARIES
CONSOLIDATED STATEMENTS OF SHAREHOLDER'S EQUITY
Years Ended December 31, 2010, 2009 and 2008
(dollars in thousands, except share amounts)
| |
Common Units | |
|
|
|
|
||||||||||||||||||
|---|---|---|---|---|---|---|---|---|---|---|---|---|---|---|---|---|---|---|---|---|---|---|---|---|
| |
|
|
Accumulated Other Comprehensive Loss |
|
|
|||||||||||||||||||
| |
Shares Outstanding |
No Par Value |
Additional Paid-in Capital |
Note Receivable CPG Holdings |
Accumulated Deficit |
Total Shareholder's Equity |
||||||||||||||||||
Balance—December 31, 2007 |
10 | $ | — | $ | 200,733 | $ | — | $ | — | $ | (4,239 | ) | $ | 196,494 | ||||||||||
Share-based compensation |
— | — | 118 | — | — | — | 118 | |||||||||||||||||
Additional contributed capital—Procell Acquisition |
— | — | 11,090 | — | — | — | 11,090 | |||||||||||||||||
Cash paid on behalf of CPG Holdings—Procell Acquisition |
— | — | — | (5,357 | ) | — | — | (5,357 | ) | |||||||||||||||
Payments made on behalf of CPG Holdings |
— | — | — | (1,992 | ) | — | — | (1,992 | ) | |||||||||||||||
Comprehensive loss: |
||||||||||||||||||||||||
Net loss |
— | — | — | — | — | (48,354 | ) | (48,354 | ) | |||||||||||||||
Cumulative translation adjustment |
— | — | — | — | (5,073 | ) | — | (5,073 | ) | |||||||||||||||
Comprehensive loss |
— | — | — | — | — | — | (53,427 | ) | ||||||||||||||||
Balance—December 31, 2008 |
10 | — | 211,941 | (7,349 | ) | (5,073 | ) | (52,593 | ) | 146,926 | ||||||||||||||
Share-based compensation |
— | — | 97 | — | — | — | 97 | |||||||||||||||||
Payments made on behalf of CPG Holdings |
— | — | — | (1,409 | ) | — | — | (1,409 | ) | |||||||||||||||
Interest on CPG Holdings note receivable |
— | — | 114 | (114 | ) | — | — | — | ||||||||||||||||
Comprehensive loss: |
||||||||||||||||||||||||
Net loss |
— | — | — | — | — | (10,306 | ) | (10,306 | ) | |||||||||||||||
Cumulative translation adjustment |
— | — | — | — | 2,701 | — | 2,701 | |||||||||||||||||
Comprehensive loss |
— | — | — | — | — | — | (7,605 | ) | ||||||||||||||||
Balance—December 31, 2009 |
10 | — | 212,152 | (8,872 | ) | (2,372 | ) | (62,899 | ) | 138,009 | ||||||||||||||
Share-based compensation |
— | — | 36 | — | — | — | 36 | |||||||||||||||||
Payments made on behalf of CPG Holdings |
— | — | — | (4,981 | ) | — | — | (4,981 | ) | |||||||||||||||
Interest on CPG Holdings note receivable |
— | — | 94 | (94 | ) | — | — | — | ||||||||||||||||
Comprehensive income: |
||||||||||||||||||||||||
Net income |
— | — | — | — | — | 9,353 | 9,353 | |||||||||||||||||
Cumulative translation adjustment |
— | — | — | — | 986 | — | 986 | |||||||||||||||||
Comprehensive income |
— | — | — | — | — | — | 10,339 | |||||||||||||||||
Balance—December 31, 2010 |
10 | $ | — | $ | 212,282 | $ | (13,947 | ) | $ | (1,386 | ) | $ | (53,546 | ) | $ | 143,403 | ||||||||
The accompanying notes are an integral part of the consolidated financial statements.
F-6
CPG INTERNATIONAL INC. AND SUBSIDIARIES
CONSOLIDATED STATEMENTS OF CASH FLOWS
Years Ended December 31, 2010, 2009 and 2008
(dollars in
thousands)
| |
Year Ended December 31, | ||||||||||||
|---|---|---|---|---|---|---|---|---|---|---|---|---|---|
| |
2010 | 2009 | 2008 | ||||||||||
Cash flows from operating activities: |
|||||||||||||
Net (loss) income |
$ | 9,353 | $ | (10,306 | ) | $ | (48,354 | ) | |||||
Adjustments to reconcile net (loss) income to net cash flows provided by operating activities: |
|||||||||||||
Interest accretion on capital lease |
16 | 12 | 13 | ||||||||||
Depreciation and amortization |
21,339 | 21,604 | 21,491 | ||||||||||
Amortization of deferred financing fees classified as interest |
2,207 | 2,266 | 2,540 | ||||||||||
Amortization of debt discount/ premium |
205 | 282 | 91 | ||||||||||
Deferred income tax (benefit) provision |
3,191 | (250 | ) | (6,982 | ) | ||||||||
Bad debt provision |
496 | 541 | 876 | ||||||||||
Write-off of obsolete inventory |
871 | 1,644 | 488 | ||||||||||
Impairment charge |
599 | 14,408 | 40,000 | ||||||||||
Unrealized (gain) loss on currency exchange |
(96 | ) | (409 | ) | 215 | ||||||||
Loss (gain) on disposition of fixed asset |
336 | 525 | (21 | ) | |||||||||
Share-based compensation from vesting of restricted units |
36 | 97 | 118 | ||||||||||
Changes in certain assets and liabilities: |
|||||||||||||
Trade receivables |
(2,028 | ) | 2,691 | 17,190 | |||||||||
Inventories |
(14,363 | ) | (13,901 | ) | 23,087 | ||||||||
Prepaid expenses and other currents assets |
456 | 2,005 | 4,669 | ||||||||||
Accounts payable |
5,607 | 11,356 | (19,479 | ) | |||||||||
Accrued expenses and interest |
(1,298 | ) | 5,201 | (664 | ) | ||||||||
Other assets and liabilities |
49 | (325 | ) | 1,037 | |||||||||
Net cash provided by operating activities |
26,976 | 37,441 | 36,315 | ||||||||||
Cash flows used in investing activities: |
|||||||||||||
Acquisition of Composatron, net of cash received |
— | (921 | ) | (31,159 | ) | ||||||||
Acquisition of Procell, net of cash received |
— | — | (12,333 | ) | |||||||||
Cash paid for property and equipment |
(15,346 | ) | (6,258 | ) | (6,282 | ) | |||||||
Proceeds from disposition of fixed assets |
— | — | 1,887 | ||||||||||
Net cash used in investing activities |
(15,346 | ) | (7,179 | ) | (47,887 | ) | |||||||
Cash flows from financing activities: |
|||||||||||||
Proceeds from long-term debt |
— | — | 24,313 | ||||||||||
Borrowings under revolving credit facility |
10,000 | — | 25,000 | ||||||||||
Repayments under revolving credit facility |
(10,000 | ) | (5,000 | ) | (20,000 | ) | |||||||
Payments on long-term obligations |
(1,997 | ) | (2,193 | ) | (2,035 | ) | |||||||
Payments of financing fees |
(119 | ) | — | (1,281 | ) | ||||||||
Payments on behalf of CPG Holdings equity |
(4,981 | ) | (1,409 | ) | (1,874 | ) | |||||||
Net cash (used in) provided by financing activities |
(7,097 | ) | (8,602 | ) | 24,123 | ||||||||
Impact of foreign currency on cash and cash equivalents |
38 | 255 | 427 | ||||||||||
Net increase in cash and cash equivalents |
4,571 | 21,915 | 12,978 | ||||||||||
Cash and cash equivalents—Beginning of period |
44,501 | 22,586 | 9,608 | ||||||||||
Cash and cash equivalents—End of period |
$ | 49,072 | $ | 44,501 | $ | 22,586 | |||||||
Supplemental disclosures: |
|||||||||||||
Cash paid for interest |
$ | 28,770 | $ | 30,266 | $ | 34,044 | |||||||
Capital expenditures in accounts payable at end of period |
$ | 1,420 | $ | 1,879 | $ | 962 | |||||||
Federal, state and local taxes paid (refunded), net |
$ | 45 | $ | 126 | $ | (1,091 | ) | ||||||
Property/equipment acquired by execution of a capital lease obligation |
$ | — | $ | — | $ | 1,939 | |||||||
Accrued costs—Composatron Acquisition and Procell Acquisition |
$ | — | $ | — | $ | 817 | |||||||
In Increase in notes receivable—CPG Holdings and additional paid-in capital related to interest |
$ | 94 | $ | 114 | $ | — | |||||||
The accompanying notes are an integral part of the consolidated financial statements.
F-7
CPG INTERNATIONAL INC. AND SUBSIDIARIES
NOTES TO CONSOLIDATED FINANCIAL STATEMENTS
1. ORGANIZATION AND SUMMARY OF SIGNIFICANT ACCOUNTING POLICIES
a. Organization
CPG International Inc. and Subsidiaries (the "Company") is a leading manufacturer of premium, low maintenance building products for residential (AZEK Building Products); commercial (Scranton Products); and industrial (Vycom) markets. The Company's products include AZEK Trim, AZEK Deck, AZEK Porch, AZEK Moulding, and AZEK Rail for residential housing markets; bathroom and locker systems sold under the brand names Resistall, Hiny Hiders and TuffTec, used in commercial building markets; and Vycom which extrudes plastic sheet products under the names of Celtec, Seaboard and Flametec and other non-fabricated products for special applications in industrial markets. The Company operates in various locations throughout the United States and Canada.
b. Summary of Significant Accounting Policies
Basis of Presentation
The consolidated financial statements and the accompanying notes are prepared in accordance with accounting principles generally accepted in the United States of America and the rules of the Securities and Exchange Commission (the "SEC"). They include the accounts of the Company on a consolidated basis. In the opinion of management, all adjustments (consisting of normal recurring accruals) considered necessary for a fair presentation have been included. All intercompany transactions have been eliminated in consolidation.
On May 10, 2005, CPG International Inc., a Delaware corporation consummated the acquisition of all the equity interests of the operating subsidiaries of Compression Polymers Holdings LLC, a Delaware limited liability company. The Company is a wholly-owned subsidiary of CPG International Holdings LP ("Holdings"). These financial statements represent the operations of the Company from the acquisition date of May 10, 2005. Compression Polymers Holdings LLC sold all of the equity interests of its operating subsidiaries in connection with the acquisition.
Revenue Recognition
The Company recognizes revenue at the time product is shipped to the customer and title transfers if all of the four following conditions are satisfied: (1) persuasive evidence of an arrangement exists; (2) delivery has occurred; (3) the fee is fixed or determinable; and (4) collectability is reasonably assured.
The Company accrues for credits, rebates, and allowance for doubtful accounts based on a combination of factors including a current evaluation of experience determined by the stated collection terms, volumes and historical trends. Should actual experience differ from estimates, revisions to the reserves or allowances recorded would be required.
Advertising Costs
Advertising costs primarily relate to trade publication advertisements, cooperative advertising and product brochures. Such costs are expensed as incurred and are included in selling, general and administrative expenses. Total advertising expenses were approximately $8.4 million, $9.2 million and $6.4 million for the years ended December 31, 2010, 2009 and 2008, respectively.
F-8
CPG INTERNATIONAL INC. AND SUBSIDIARIES
NOTES TO CONSOLIDATED FINANCIAL STATEMENTS (Continued)
1. ORGANIZATION AND SUMMARY OF SIGNIFICANT ACCOUNTING POLICIES (Continued)
Shipping and Handling Costs
The Company includes all shipping and handling costs as cost of sales. Shipping and handling costs billed to customers are recorded in net sales.
Allowance for Doubtful Accounts
Credit is extended to commercial, institutional, residential and industrial construction customers based on an evaluation of their financial condition, and collateral is generally not required. The evaluation of the customer's financial condition is performed to reduce the risk of loss. The Company maintains allowances for doubtful accounts for estimated losses resulting from the inability of its customers to make required payments. Amounts are written-off when they are determined to be uncollectible. The Company determines its allowances for doubtful accounts based on a review performed on customer accounts using several factors including the length of time individual receivables are past due, historical collection experience, the economic and competitive environment and changes in the creditworthiness of its customers. The Company is not able to predict with certainty the changes in the financial stability of its customers.
Changes in the Company's allowance for doubtful accounts are as follows:
| |
Year Ended December 31, | |||||||||
|---|---|---|---|---|---|---|---|---|---|---|
| (Dollars in thousands) |
2010 | 2009 | 2008 | |||||||
Beginning balance |
$ | 964 | $ | 1,660 | $ | 1,243 | ||||
Increase for bad debt expense |
496 | 541 | 876 | |||||||
Decrease for accounts written off |
(259 | ) | (1,237 | ) | (459 | ) | ||||
Ending balance |
$ | 1,201 | $ | 964 | $ | 1,660 | ||||
Cash and Cash Equivalents
All liquid investments with maturities of three months or less at the date of purchase are considered cash equivalents.
Inventories
Inventories (mainly, petrochemical resin), are valued at the lower of cost or market, determined on a first-in, first-out basis ("FIFO"), and reduced for slow-moving and obsolete inventory.
Inventory obsolescence write-downs are recorded for damaged, obsolete, excess and slow-moving inventory. At the end of each quarter, management within each business segment performs a detailed review of its inventory on an item by item basis and identifies which products are believed to be obsolete or slow-moving. Management assesses the need for, and the amount of, obsolescence write-down based on customer demand of the item, the quantity of the item on hand and the length of time the item has been in inventory.
F-9
CPG INTERNATIONAL INC. AND SUBSIDIARIES
NOTES TO CONSOLIDATED FINANCIAL STATEMENTS (Continued)
1. ORGANIZATION AND SUMMARY OF SIGNIFICANT ACCOUNTING POLICIES (Continued)
Vendor Rebates
Certain vendor rebates and incentives are earned by the Company only when a specified level of annual purchases is achieved. These vendor rebates are recognized on a systematic and rational allocation of the cash consideration offered to each of the underlying transactions provided the amounts are probable and reasonably estimable. The Company records the incentives as a reduction to the cost of inventory. Upon sale of inventory, the incentive is recognized as a reduction to cost of sales. The Company records such incentives during interim periods based on actual results achieved on a year-to-date basis and its expectation that purchase levels will be obtained to earn the rebate.
Product Warranties
The Company provides warranty guarantees on its Scranton Products against breakage, corrosion and delamination. Prior to June 1, 2009, the Company had provided a 15-year limited warranty on Scranton Products. Beginning June 1, 2009, the warranty on Scranton Products was extended to 25 years for purchases after that date. The Company provides a 25-year limited warranty on AZEK Trim products and a lifetime limited warranty on AZEK Deck and AZEK Porch products sold for residential use. The warranty period for all other uses of AZEK Deck and AZEK Porch, including commercial use, is 20 years. AZEK Trim products are guaranteed against manufacturing defects that cause the products to rot, corrode, delaminate, or excessively swell from moisture. The AZEK Deck and AZEK Porch warranties guarantee against manufacturing defects in material and workmanship that result in blistering, peeling, flaking, cracking, splitting, cupping, rotting or structural defects from termites or fungal decay. AZEK Rail products have a 20-year limited warranty for white railing and a 10-year limited warranty for AZEK Premier colored railing. The AZEK Rail warranty also guarantees against rotting, cracking, peeling, blistering or structural defects from fungal decay.
Estimating the required warranty reserves requires a high level of judgment as AZEK Trim products have only been on the market for ten years, AZEK Deck has only been on the market for six years and AZEK Rail has only been on the market for ten years, each of which are early in their product life cycles. Management estimates warranty reserves, based in part upon historical warranty costs, as a proportion of sales by product line. Management also considers various relevant factors, including its stated warranty policies and procedures, as part of its evaluation of its liability. Because warranty issues may surface later in the product life cycle, management continues to review these estimates on a regular basis and considers adjustment to these estimates based on actual experience compared to historical estimates. Although management believes that the warranty reserves at December 31, 2010 are adequate, actual results may vary from these estimates. The Company currently classifies a portion of the warranty reserve as a current liability which appears on the consolidated balance sheet in accrued expenses.
F-10
CPG INTERNATIONAL INC. AND SUBSIDIARIES
NOTES TO CONSOLIDATED FINANCIAL STATEMENTS (Continued)
1. ORGANIZATION AND SUMMARY OF SIGNIFICANT ACCOUNTING POLICIES (Continued)
Components of the reserve for warranty costs are as follows:
| |
Year Ended December 31, | ||||||||||
|---|---|---|---|---|---|---|---|---|---|---|---|
| (Dollars in thousands) |
2010 | 2009 | 2008 | ||||||||
Beginning balance |
$ | 3,596 | $ | 3,853 | $ | 3,107 | |||||
Additions(1) |
828 | 836 | 931 | ||||||||
Warranty claims |
(424 | ) | (615 | ) | (176 | ) | |||||
Adjustment to reserve |
(456 | ) | (478 | ) | — | ||||||
Effect of foreign currency translation |
— | — | (9 | ) | |||||||
Ending balance |
3,544 | 3,596 | 3,853 | ||||||||
Current portion of accrued warranty |
(701 | ) | (413 | ) | (621 | ) | |||||
Total accrued warranty—less current portion |
$ | 2,843 | $ | 3,183 | $ | 3,232 | |||||
- (1)
- Approximately $750 added as a reserve related to the Composatron Acquisition in 2008 (See Note 3).
Property and Equipment
Property and equipment are recorded at cost, net of accumulated depreciation. Construction in progress is also recorded at cost and includes capitalized interest, if material, and capitalized payroll costs and related costs such as taxes, retirement costs and other fringe benefits. The cost and related accumulated depreciation of assets sold or otherwise disposed of are removed from the asset accounts and any resulting gain or loss is included in the Consolidated Statements of Operations. Major additions and betterments are capitalized and depreciated over their estimated useful lives. Repair and/or maintenance costs are charged to operations when incurred. Depreciation for financial reporting purposes is computed using the straight-line method over the estimated useful lives of the assets, when they are available for use. The estimated useful lives of property and equipment are as follows:
Land improvements |
10 years | |||
Building and improvements |
20-40 years | |||
Manufacturing equipment |
2-7 years | |||
Office furniture and equipment |
3-5 years |
Equipment held under capital leases are stated at the lower of the fair value of the asset or the net present value of the future minimum lease payments at the inception of the lease. For equipment held under capital leases, depreciation is computed using the straight-line method over the shorter of the estimated useful lives of the leased assets or the related lease term.
The Company regularly assesses the recoverability of its long-lived assets used in operations whenever events or changes in circumstances indicate that the assets may be impaired and the undiscounted future cash flows estimated to be generated by these assets are less than the assets' net book value. If impairment occurs, the loss is measured by comparing the fair value of the asset to its carrying amount. For the year ended December 31, 2010, there was an impairment charge of $0.6 million that was recorded to the statement of operations. For the years ended December 31, 2009
F-11
CPG INTERNATIONAL INC. AND SUBSIDIARIES
NOTES TO CONSOLIDATED FINANCIAL STATEMENTS (Continued)
1. ORGANIZATION AND SUMMARY OF SIGNIFICANT ACCOUNTING POLICIES (Continued)
and 2008, the Company concluded that there was no impairment to the carrying value of its long-lived tangible assets.
Foreign Currency Translation
The translation of the financial statements of the Company's Canadian subsidiary whose functional currency is other than U.S. Dollar ("USD") into USD is performed for balance sheet accounts using closing exchange rates in effect at the balance sheet date. Translation for the revenue and expense accounts is based on an average exchange rate during each reporting period. The gains or losses resulting from translation are included in shareholder's equity separately as accumulated other comprehensive income (loss).
Deferred Financing Costs
The Company had recorded deferred financing costs incurred in conjunction with its debt obligations. These costs are capitalized and then amortized over the lives of the associated debt to interest expense. Total deferred financing costs, net of accumulated amortization at December 31, 2010 and 2009 were $3.0 million and $5.1 million, respectively.
Goodwill and Other Intangible Assets
The Company accounts for costs of acquired assets in excess of fair value ("Goodwill") and other intangible assets not subject to amortization in accordance with FASB ASC 350. In accordance with the guidance, Goodwill and other intangibles not subject to amortization are tested for impairment annually, or when events or circumstances indicate that it is more likely than not that the fair value of a reporting unit is lower than its carrying value. Testing of Goodwill to identify potential impairment and calculate the amount of impairment, if any, is performed using a two step process. The first step, which involves estimating the fair value of each reporting unit, is performed by comparing the fair value of the reporting unit to the unit's carrying values, including Goodwill allocated to that reporting unit. If the carrying value of the reporting unit exceeds its fair value, the second step of Goodwill impairment test shall be performed to measure the amount of impairment loss, if any. Under step two, the implied fair value of Goodwill, calculated as the difference between the fair value of the reporting unit and the fair value of the net assets of the reporting unit, is compared to the carrying value of Goodwill. The excess of the carrying value of Goodwill over the implied fair value of Goodwill represents the amount impaired.
The Company evaluates Goodwill for impairment annually at December 31. The significant estimates and assumptions used by management in assessing each reporting unit's fair value and the recoverability of Goodwill is based on the estimated discounted future cash flows of that unit. Its approach is based on each reporting unit's projection of operating results and cash flows that are discounted using the Company's weighted average cost of capital. The basis of its cash flow assumptions includes historical and forecasted revenue, operating costs, and other relevant factors including estimated cash expenditures. Assumptions under this method included a discount rate of approximately 11.8%, and annual revenue growth rates consistent with historical trends, with consideration of current economic trends, ranging from 5.5% to 34.6%, relative to specific products lines, as well as increases in operating costs relative to the increases in revenues over five years. The
F-12
CPG INTERNATIONAL INC. AND SUBSIDIARIES
NOTES TO CONSOLIDATED FINANCIAL STATEMENTS (Continued)
1. ORGANIZATION AND SUMMARY OF SIGNIFICANT ACCOUNTING POLICIES (Continued)
Company further assumes a terminal growth rate after five years of approximately 3.5% to 4%, based upon the estimated growth of individual products and their projected growth cycles.
As of December 31, 2010, the Company completed its annual evaluation of potential impairment of Goodwill and determined that no impairment of Goodwill existed. The Company believes that the fair value of each reporting unit substantially exceeded their carrying values. In addition, the Company is not aware of any events or circumstances that would indicate an impairment loss. Factors that were considered included: adverse change in operating results, decline in strategic business plans, and significantly lower future cash flows.
As of December 31, 2008, the Company determined that it was more likely than not that the fair value of each of its reporting units was below their respective carrying amounts. The Company recorded a non-cash Goodwill impairment charge of $36.0 million for the year ended December 31, 2008, representing its best estimate of the impairment charge at that time. Approximately $11.0 million, $15.4 million and $9.6 million of the estimate was allocated to the AZEK Building Products, Scranton Products and Vycom business segments, respectively. The Company finalized the Goodwill impairment analysis during the first quarter of 2009 and an additional non-cash Goodwill impairment charge of $14.4 million was recorded in its condensed consolidated financial statements for the three months ended March 31, 2009. Approximately $14.9 million of the additional impairment was allocated to the AZEK Building Products segment, a reduction of $3.3 million was allocated to the Scranton Products business segment and $2.8 million of the additional impairment was allocated to Vycom. The additional impairment was not a result of further deterioration in the business, but the completion of the required analysis.
The Company considers the trademark intangible ("Trademark") assets as indefinite-lived intangible assets and as such do not require amortization. Rather, these intangible assets are tested at least annually for impairment or more frequently if events or circumstances indicate that the asset might be impaired, by comparing the fair value of the Trademark assets to their carrying amount. If the carrying amounts of the Trademark assets were to exceed their fair value, an impairment loss would be recognized. As of December 31, 2010 and 2009, the fair value of the Trademark assets exceeded its carrying amount, and no impairment was recognized. As of December 31, 2008, the carrying amount of the Trademark assets exceeded their fair value and a $4.0 million impairment charge was recorded to the Scranton Products business segment for the year ended December 31, 2008. The annual evaluation of the Trademark requires the use of estimates about future operating revenues and an avoided royalty rate for each reporting unit in the determination of the estimated fair values. Changes in forecasted revenues could materially affect these estimates.
The Company evaluates potential impairment of amortizable intangible assets and long-lived tangible assets whenever events or circumstances indicate that the carrying value of the asset may not be recoverable. Amortizable intangible assets and long-lived tangible assets include customer relationships, non-compete agreement, propriety knowledge and fixed assets. In the event these assets are impaired, which the Company would determine based on undiscounted cash flows, losses would be recognized to the extent the carrying value exceeds the fair value. Such an impairment loss would be calculated based upon the discounted future cash flows expected to result from the use of the asset, and would be recognized as a non-cash component of operating income.
The Company amortizes the following intangible assets: customer relationships (over 10 years); non-compete agreements (over 5 years) and proprietary knowledge (over 15 years). Certain of the
F-13
CPG INTERNATIONAL INC. AND SUBSIDIARIES
NOTES TO CONSOLIDATED FINANCIAL STATEMENTS (Continued)
1. ORGANIZATION AND SUMMARY OF SIGNIFICANT ACCOUNTING POLICIES (Continued)
Company's amortization of intangible assets is performed on an accelerated basis over the useful lives. See Note 6 for more detail regarding Goodwill and intangible assets.
Share-Based Compensation
Share-based compensation cost is measured at the grant date, based on the calculated fair value of the award, and is recognized as an expense over the employee's requisite service period (generally the vesting period of the equity grant). The Company expenses its share-based compensation on a straight-line basis over the requisite service period for each award. See Note 13 for additional detail regarding share-based compensation.
Comprehensive Income (Loss)
Comprehensive income (loss) is defined as net income (loss) and other changes in equity from transactions unrelated to the Company's shareholder. The Company's accumulated other comprehensive loss consists of accumulated foreign currency translation adjustments of approximately $1.4 million at December 31, 2010 and $2.4 million at December 31, 2009. Other comprehensive income for the year ended December 31, 2010 was approximately $1.0 million.
Retirement Benefits
The Company offers a 401(k) defined contribution plan to all full-time employees following 90 days of service. The Company does not offer a defined benefit plan (pension plan) nor does the Company offer any other post-retirement benefit. Each participant may contribute up to 100% of his or her salary, within dollar limitations set forth by the ERISA guidelines. The Company matches 50% of the first 5% of the employee contribution. Total company contributions to the 401(k) Plan were $522,000, $423,000 and $459,000 for the years ended December 31, 2010, 2009 and 2008, respectively.
Estimated Fair Value of Financial Instruments
The carrying amounts for the Company's financial instruments classified as current assets and liabilities, including accounts receivable and accounts payable, approximate their fair value due to their short maturities. Fair value measurements are classified and disclosed in one of three categories: Level 1, defined as observable inputs such as quoted prices in active markets; Level 2, defined as inputs other than quoted prices in active markets that are either directly or indirectly observable; and Level 3, defined as unobservable inputs in which little or no market data exists, therefore requiring an entity to develop its own assumptions. At December 31, 2010, the Company has reviewed its debt and has given consideration to their characteristics and covenants in formulating an opinion of fair value and believes that the carrying value approximates fair value.
Income Taxes
The Company accounts for income taxes using the asset and liability method. Under this method, deferred tax assets and liabilities are determined based upon differences between the financial reporting and the tax basis of assets and liabilities and are measured using the enacted tax rates expected to apply to taxable income in the periods in which the deferred tax assets or liabilities are expected to be realized or settled. A valuation allowance is established when it is more likely than not that all or a portion of a deferred tax asset will not be realized.
F-14
CPG INTERNATIONAL INC. AND SUBSIDIARIES
NOTES TO CONSOLIDATED FINANCIAL STATEMENTS (Continued)
1. ORGANIZATION AND SUMMARY OF SIGNIFICANT ACCOUNTING POLICIES (Continued)
When applicable, the Company's practice is to recognize interest and/or penalties related to income tax matters in income tax expense. As of December 31, 2010 there was $2,000 and $1,000 accrued for interest and penalties, respectively; at December 31, 2009 there was no accrual for interest or penalties recorded on the consolidated balance sheet. The Company and its subsidiaries file income tax returns in the U.S. Federal jurisdiction. The Company and its subsidiaries' federal income tax returns for tax years 2007 and beyond are open tax years subject to examination by the Internal Revenue Service (IRS). The Company and its subsidiaries also file income tax returns in various state jurisdictions, as appropriate, with varying statutes of limitation. One of the Company's subsidiaries files federal and provincial income tax returns in Canada. The Canadian subsidiary's tax returns have been examined by Canada Revenue Agency through February 29, 2008 with no significant findings noted.
Use of Estimates
The preparation of financial statements in conformity with accounting principles generally accepted in the United States of America requires management to make estimates and assumptions that affect the reported amounts of assets and liabilities and disclosure of contingent assets and liabilities at the date of the financial statements and reported amounts of revenues and expenses during the reporting period. Actual results could differ from those estimates. Management's estimates and assumptions are evaluated on an ongoing basis and are based on historical experience, current conditions and available information.
Net income (loss) per share
Basic and diluted net income (loss) per share is calculated by dividing net income (loss) by the weighted average number of shares of common stock outstanding during the period. CPG International Holdings LP is the owner of 100% of the Company's common stock as of December 31, 2010. There are no potentially dilutive common shares.
Recently Adopted Accounting Pronouncements
In January 2010, the Financial Accounting Standards Board ("FASB") issued Accounting Standard Update ("ASU") No. 2010-06 (ASU 2010-06), "Improving Disclosures about Fair Value Measurements" which requires new disclosures and clarifies existing disclosure requirements. The purpose of these amendments is to provide a greater level of disaggregated information as well as more disclosure around valuation techniques and inputs to fair value measurements. The provisions of this guidance were effective as of January 1, 2010, and the adoption of this guidance is limited to disclosures in the Company's consolidated financial statements. Certain provisions of this guidance are required for annual reporting periods beginning after December 15, 2010 and for interim periods. The amendment is not expected to have any significant impact on the Company's consolidated financial statement disclosures for the periods beginning after December 15, 2010, and no material impact on the Company's consolidated financial statements.
In December 2010, the FASB issued ASU 2010-29 "Disclosure of Supplementary Pro Forma Information for Business Combinations" which requires a public entity to disclose pro forma information for business combinations that occurred in the current reporting period. The disclosures include pro forma revenue and earnings of the combined entity for the current reporting period as though the acquisition date for all business combinations that occurred during the year had been as of
F-15
CPG INTERNATIONAL INC. AND SUBSIDIARIES
NOTES TO CONSOLIDATED FINANCIAL STATEMENTS (Continued)
1. ORGANIZATION AND SUMMARY OF SIGNIFICANT ACCOUNTING POLICIES (Continued)
the beginning of the annual reporting period. The Company continues to monitor changes that would trigger the application of this update.
In December 2010, the FASB issued ASU 2010-28 "When to Perform Step 2 of the Goodwill Impairment Test for Reporting Units with Zero or Negative Carrying Amounts" which affects all entities that have recognized goodwill and have one or more reporting units whose carrying amount for purposes of performing Step 1 of the goodwill impairment test is zero or negative. As of December 31, 2010 none of the Company's reporting units had a zero or negative carrying amount. The Company will monitor any changes in the goodwill of its reporting units that will trigger the application of this amendment.
In December 2009, the FASB issued ASU 2009-17 "Improvements to Financial Reporting by Enterprises Involved with Variable Interest Entities" which requires companies to perform an analysis to determine whether the enterprise's variable interest or interests give it a controlling financial interest in a Variable Interest Entity (VIE). The guidance requires ongoing assessments of whether an enterprise is the primary beneficiary of a VIE, requires enhanced disclosures and eliminates the scope exclusion for qualifying special-purpose entities. The provisions of this guidance were effective as of January 1, 2010, and the guidance did not have any impact on the Company's consolidated financial statements.
2. SEGMENT INFORMATION
The Company operates the following three operating segments which are also its reportable segments: AZEK Building Products ("AZEK"), which produces residential building products such as AZEK Trim, AZEK Moulding, AZEK Deck, AZEK Porch and AZEK Rail; Scranton Products ("Scranton"), which produces fabricated bathroom partition and locker systems under the Hiny Hiders, Resistall and TuffTec labels for the commercial market; and Vycom ("Vycom"), which extrudes plastic sheet products under the names of Celtec, Seaboard and Flametec and other non-fabricated products for special applications in the industrial markets. Beginning in the third quarter of 2009, the Company realigned its industrial business, previously included in AZEK and Scranton, into a third segment referred to as Vycom to reinforce it as a single, standalone entity, providing non-fabricated branded sheet to national distributors. Segment results for the year ended December 31, 2008, and asset information as of December 31, 2008, have been updated to conform to this organizational change.
The Company's chief operating decision makers (which consists of the Company's Chief Executive Officer and Chief Financial Officer), regularly review financial information about each of these segments in deciding how to allocate resources and evaluate performance. The Company evaluates each segment's performance based on gross profit and operating income. The accounting policies for the operating segments are the same as those for the Company. Certain assets are shared by more than one operating segment and have been allocated for reporting purposes based on either percentage of revenue or asset usage. Corporate costs, which include corporate salary and employee benefit costs, information technology and corporate related professional fees (including accounting and legal fees), are also allocated to the Company's segments.
F-16
CPG INTERNATIONAL INC. AND SUBSIDIARIES
NOTES TO CONSOLIDATED FINANCIAL STATEMENTS (Continued)
2. SEGMENT INFORMATION (Continued)
The following table sets forth summarized financial information for the Company by operating segment for the year ended December 31, 2010:
| (Dollars in thousands) |
AZEK Building Products |
Scranton Products |
Vycom | Corporate | Consolidated | ||||||||||||
|---|---|---|---|---|---|---|---|---|---|---|---|---|---|---|---|---|---|
Net sales |
$ | 213,413 | $ | 57,560 | $ | 56,562 | $ | — | $ | 327,535 | |||||||
Cost of sales |
(145,780 | ) | (34,315 | ) | (46,575 | ) | — | (226,670 | ) | ||||||||
Gross profit |
67,633 | 23,245 | 9,987 | — | 100,865 | ||||||||||||
Selling, general and administrative expenses |
(28,908 | ) | (8,885 | ) | (6,372 | ) | (12,324 | ) | (56,489 | ) | |||||||
Loss on disposal of property |
(254 | ) | (49 | ) | (33 | ) | — | (336 | ) | ||||||||
Impairment of long-lived assets |
(599 | ) | — | — | — | (599 | ) | ||||||||||
Segment operating income (loss) |
$ | 37,872 | $ | 14,311 | $ | 3,582 | $ | (12,324 | ) | $ | 43,441 | ||||||
Selected financial data: |
|||||||||||||||||
Depreciation and amortization classified as: |
|||||||||||||||||
Cost of sales |
$ | 11,861 | $ | 570 | $ | 3,391 | $ | — | $ | 15,822 | |||||||
Selling, general and administrative expense |
2,522 | 161 | 2,262 | 572 | 5,517 | ||||||||||||
Total depreciation and amortization |
$ | 14,383 | $ | 731 | $ | 5,653 | $ | 572 | $ | 21,339 | |||||||
Total capital expenditures(1) |
$ | 12,561 | $ | 935 | $ | 655 | $ | 2,615 | $ | 16,766 | |||||||
- (1)
- Includes capital expenditures in accounts payable.
F-17
CPG INTERNATIONAL INC. AND SUBSIDIARIES
NOTES TO CONSOLIDATED FINANCIAL STATEMENTS (Continued)
2. SEGMENT INFORMATION (Continued)
The following table sets forth summarized financial information for the Company by operating segment for the year ended December 31, 2009:
| (Dollars in thousands) |
AZEK Building Products |
Scranton Products |
Vycom | Corporate | Consolidated | ||||||||||||
|---|---|---|---|---|---|---|---|---|---|---|---|---|---|---|---|---|---|
Net sales |
$ | 163,775 | $ | 66,103 | $ | 36,997 | $ | — | $ | 266,875 | |||||||
Cost of sales |
(107,703 | ) | (36,694 | ) | (28,931 | ) | — | (173,328 | ) | ||||||||
Gross profit |
56,072 | 29,409 | 8,066 | — | 93,547 | ||||||||||||
Selling, general and administrative expenses |
(28,384 | ) | (9,847 | ) | (5,540 | ) | (13,621 | ) | (57,392 | ) | |||||||
Lease termination expense |
(413 | ) | — | — | (244 | ) | (657 | ) | |||||||||
Loss on disposal of property |
(282 | ) | (129 | ) | (89 | ) | (25 | ) | (525 | ) | |||||||
Impairment of long-lived assets |
(14,912 | ) | 3,273 | (2,769 | ) | — | (14,408 | ) | |||||||||
Segment operating income (loss) |
$ | 12,081 | $ | 22,706 | $ | (332 | ) | $ | (13,890 | ) | $ | 20,565 | |||||
Selected financial data: |
|||||||||||||||||
Depreciation and amortization classified as: |
|||||||||||||||||
Cost of sales |
$ | 11,146 | $ | 922 | $ | 3,687 | $ | — | $ | 15,755 | |||||||
Selling, general and administrative expense |
2,393 | 160 | 2,212 | 1,084 | 5,849 | ||||||||||||
Total depreciation and amortization |
$ | 13,539 | $ | 1,082 | $ | 5,899 | $ | 1,084 | $ | 21,604 | |||||||
Total capital expenditures(1) |
$ | 6,008 | $ | 1,173 | $ | 586 | $ | 370 | $ | 8,137 | |||||||
- (1)
- Includes capital expenditures in accounts payable.
F-18
CPG INTERNATIONAL INC. AND SUBSIDIARIES
NOTES TO CONSOLIDATED FINANCIAL STATEMENTS (Continued)
2. SEGMENT INFORMATION (Continued)
The following table sets forth summarized financial information for the Company by operating segment for the year ended December 31, 2008:
| (Dollars in thousands) |
AZEK Building Products |
Scranton Products |
Vycom | Corporate | Consolidated | ||||||||||||
|---|---|---|---|---|---|---|---|---|---|---|---|---|---|---|---|---|---|
Net sales |
$ | 180,536 | $ | 74,807 | $ | 49,897 | $ | — | $ | 305,240 | |||||||
Cost of sales |
(140,909 | ) | (52,607 | ) | (41,583 | ) | — | (235,099 | ) | ||||||||
Gross profit |
39,627 | 22,200 | 8,314 | — | 70,141 | ||||||||||||
Selling, general and administrative expenses |
(24,128 | ) | (9,145 | ) | (5,263 | ) | (12,108 | ) | (50,644 | ) | |||||||
Gain on disposal of property |
21 | — | — | 21 | |||||||||||||
Impairment of long-lived assets |
(10,946 | ) | (19,437 | ) | (9,617 | ) | — | (40,000 | ) | ||||||||
Segment operating income (loss) |
$ | 4,574 | $ | (6,382 | ) | $ | (6,566 | ) | $ | (12,108 | ) | $ | (20,482 | ) | |||
Selected financial data: |
|||||||||||||||||
Depreciation and amortization classified as: |
|||||||||||||||||
Cost of sales |
$ | 10,684 | $ | 662 | $ | 3,977 | $ | — | $ | 15,323 | |||||||
Selling, general and administrative expense |
2,678 | 160 | 2,220 | 1,110 | 6,168 | ||||||||||||
Total depreciation and amortization |
$ | 13,362 | $ | 822 | $ | 6,197 | $ | 1,110 | $ | 21,491 | |||||||
Total capital expenditures(1) |
$ | 3,567 | $ | 2,763 | $ | 274 | $ | 640 | $ | 7,244 | |||||||
- (1)
- Includes capital expenditures in accounts payable.
The following table sets forth summarized financial information regarding assets for the Company by operating segment:
| |
December 31, | |||||||||||
|---|---|---|---|---|---|---|---|---|---|---|---|---|
| (Dollars in thousands) |
2010 | 2009 | 2008 | |||||||||
Total assets: |
||||||||||||
AZEK Building Products |
$ | 315,452 | $ | 320,475 | $ | 314,865 | ||||||
Scranton Products |
81,781 | 113,819 | 85,010 | |||||||||
Vycom |
94,099 | 99,506 | 115,244 | |||||||||
Corporate |
61,752 | 5,604 | 23,786 | |||||||||
Total consolidated assets |
$ | 553,084 | $ | 539,404 | $ | 538,905 | ||||||
During 2010, the Company realigned assets by operating segment to more appropriately classify operating segment and corporate assets. These reclassifications primarily related to cash and deferred financing fees that were previously allocated to the operating segments. The impact on the Corporate segment was an increase of $43.3 million with a corresponding reduction on the three operating segments.
F-19
CPG INTERNATIONAL INC. AND SUBSIDIARIES
NOTES TO CONSOLIDATED FINANCIAL STATEMENTS (Continued)
2. SEGMENT INFORMATION (Continued)
The following table sets forth the Company's significant distributor group sales as a percentage of total consolidated net sales, as well as a percentage of AZEK net sales as each of these distributors are part of the AZEK segment:
| |
Year Ended December 31, | ||||||||||||||||||
|---|---|---|---|---|---|---|---|---|---|---|---|---|---|---|---|---|---|---|---|
| |
2010 | 2009 | 2008 | ||||||||||||||||
| |
% of Consolidated Sales |
% of AZEK Building Products Sales |
% of Consolidated Sales |
% of AZEK Building Products Sales |
% of Consolidated Sales |
% of AZEK Building Products Sales |
|||||||||||||
Distributor A |
28 | % | 42 | % | 26 | % | 42 | % | 26 | % | 44 | % | |||||||
Distributor B |
10 | 15 | 10 | 17 | 8 | 13 | |||||||||||||
Distributor C |
11 | 18 | 9 | 14 | 10 | 16 | |||||||||||||
Total |
49 | % | 75 | % | 45 | % | 73 | % | 44 | % | 73 | % | |||||||
Distributor A represented 9%, 8% and 19% of the Company's accounts receivable balances as of December 31, 2010, 2009 and 2008, respectively.
Over 97%, 96% and 97% of the Company's sales in 2010, 2009 and 2008, respectively, were in the United States. It is not practicable to provide revenue information by product below the operating segment level.
The Company's geographic distribution of long-lived assets as of December 31, 2010, 2009 and 2008 are as follows:
| |
December 31, | |||||||||||
|---|---|---|---|---|---|---|---|---|---|---|---|---|
| (Dollars in thousands) |
2010 | 2009 | 2008 | |||||||||
Long-lived assets: |
||||||||||||
United States |
$ | 75,749 | $ | 76,443 | $ | 84,871 | ||||||
Canada |
6,269 | 7,889 | 8,580 | |||||||||
Total consolidated assets |
$ | 82,018 | $ | 84,332 | $ | 93,451 | ||||||
3. ACQUISITION
On February 29, 2008, the Company purchased 100% of the outstanding stock of Compos-A-Tron Manufacturing Inc. ("Composatron") for approximately $32.4 million (the "Composatron Acquisition"). Since certain financial targets were met in 2008, the purchase price increased by approximately CAD $1.0 million in cash (approximately USD $0.9 million) at time of payment, to the former owners, which was paid on June 1, 2009. Composatron was a privately held manufacturer of Premier and Trademark Railing Systems, leading composite railing solutions for the residential housing market. Premier and Trademark are now part of AZEK Rail and are still used as trademarks by the Company. The Company borrowed approximately $25.0 million under the Term Loan Agreement as part of the financing for the Composatron Acquisition. The remaining funds came from the Company's operations. The Composatron Acquisition was accounted for as a purchase business combination.
F-20
CPG INTERNATIONAL INC. AND SUBSIDIARIES
NOTES TO CONSOLIDATED FINANCIAL STATEMENTS (Continued)
3. ACQUISITION (Continued)
The purchase price is allocated to the tangible and intangible assets acquired and liabilities assumed based on fair values as of the date of the acquisition, including a portion of which was capitalized to the balance sheet as Goodwill. A valuation study was performed to assist the Company in determining the fair value of land, buildings and equipment acquired, as well as intangible assets such as patented technology, trade names and customer relationships some of which are amortizable on an accelerated basis over the next fifteen, five and ten years respectively. The Company evaluated the fair market value of inventory as well as other liabilities such as accrued warranty costs, which impacted the purchase price allocation. The amount allocated to Goodwill is reflective of the future benefit the Company is expecting to realize from the Composatron Acquisition, including strategic growth opportunities within AZEK and additional product offerings. Composatron's results of operations, subsequent to February 29, 2008, were reported as part of the AZEK business unit. The amount allocated to Goodwill is not expected to be deductible for tax purposes.
The following table summarizes the allocation of fair values of Composatron's assets acquired and liabilities assumed at the date of acquisition, as follows:
| (Dollars in thousands) |
|
At March 1, 2008 |
||||||
|---|---|---|---|---|---|---|---|---|
Purchase price (includes contingent purchase price) |
$ | 31,181 | ||||||
Transaction costs |
1,261 | |||||||
|
32,442 | |||||||
Less: |
||||||||
Cash and cash equivalents |
$ | 466 | ||||||
Accounts receivable |
5,243 | |||||||
Inventory |
4,516 | |||||||
Intangible assets: |
||||||||
Proprietary technology |
4,000 | |||||||
Customer relationships |
1,080 | |||||||
Trademark |
370 | |||||||
Other intangibles |
1,207 | |||||||
Other assets |
1,601 | |||||||
Property, plant and equipment |
12,293 | |||||||
Total assets acquired |
30,776 | |||||||
Accounts payable assumed |
3,326 | |||||||
Deferred tax liability |
2,915 | |||||||
Other liabilities assumed |
1,703 | |||||||
Total liabilities assumed |
7,944 | |||||||
|
(22,832 | ) | ||||||
Goodwill (excess purchase price over net asset value) |
$ | 9,610 | ||||||
The following pro forma consolidated financial information for the year ended December 31, 2008 is presented as though the Composatron Acquisition occurred on January 1, 2008. The pro forma consolidated financial information is not indicative of future results of operations or results of operations that would have actually occurred had the Composatron Acquisition been consummated as
F-21
CPG INTERNATIONAL INC. AND SUBSIDIARIES
NOTES TO CONSOLIDATED FINANCIAL STATEMENTS (Continued)
3. ACQUISITION (Continued)
of January 1, 2008, due to the fair values assigned to Composatron's assets and liabilities, the changes made in related estimated useful lives of the assets at March 1, 2008, as well as changes in interest and income tax expenses as a result of the Composatron Acquisition.
| (Dollars in thousands) |
Unaudited Pro Forma Year Ended December 31, 2008 |
|||
|---|---|---|---|---|
Net sales |
$ | 312,789 | ||
Net (loss) income |
$ | (46,950 | ) | |
4. INVENTORIES
Inventories consisted of the following:
| |
December 31, | ||||||
|---|---|---|---|---|---|---|---|
| (Dollars in thousands) |
2010 | 2009 | |||||
Raw materials |
$ | 19,968 | $ | 25,695 | |||
Work in process |
14,449 | 72 | |||||
Finished goods |
24,997 | 20,155 | |||||
Total inventories |
$ | 59,414 | $ | 45,922 | |||
Inventories are valued at the lower of cost or market, determined on a first-in, first-out basis ("FIFO").
During 2010, in response to an increasing number of multi-stage and secondary manufacturing processes, we analyzed our inventory flows and deemed it appropriate to classify certain inventory items as work in process, which had previously been classified as raw materials and finished goods. While this did not impact the reported total amount of inventory, the classifications within total inventory changed.
5. PROPERTY AND EQUIPMENT—NET
Property and equipment consisted of the following:
| |
December 31, | |||||||
|---|---|---|---|---|---|---|---|---|
| (Dollars in thousands) |
2010 | 2009 | ||||||
Land and improvements |
$ | 1,701 | $ | 1,701 | ||||
Buildings and improvements |
25,570 | 23,616 | ||||||
Capital lease—building |
1,500 | 1,500 | ||||||
Capital lease—manufacturing equipment |
8,594 | 8,594 | ||||||
Manufacturing equipment |
104,200 | 100,015 | ||||||
Office furniture and equipment |
5,151 | 4,991 | ||||||
Total property and equipment |
146,716 | 140,417 | ||||||
Construction in progress |
7,532 | 2,855 | ||||||
|
154,248 | 143,272 | ||||||
Accumulated depreciation |
(72,230 | ) | (58,940 | ) | ||||
Total property and equipment—net |
$ | 82,018 | $ | 84,332 | ||||
F-22
CPG INTERNATIONAL INC. AND SUBSIDIARIES
NOTES TO CONSOLIDATED FINANCIAL STATEMENTS (Continued)
5. PROPERTY AND EQUIPMENT—NET (Continued)
Depreciation expense for the years ended December 31, 2010, 2009 and 2008 was approximately $16.6 million, $17.0 million and $16.6 million, respectively.
The useful lives of the Company's fixed assets are determined based on historical usage with consideration given to technological changes and trends in the industry, which could impact the asset utilization. Accordingly, in making this assessment, the Company considers (i) its planned use of the assets, (ii) the views of experts within and outside of the Company, (iii) sources regarding the impact of technological advances and (iv) trends in the industry on the value and useful lives of its assets. The Company annually evaluates the estimated useful lives used to depreciate its assets.
6. GOODWILL AND INTANGIBLE ASSETS—NET
Goodwill and intangible assets consisted of the following:
| |
|
December 31, | ||||||||||
|---|---|---|---|---|---|---|---|---|---|---|---|---|
| |
Lives in Years |
|||||||||||
| (Dollars in thousands) |
2010 | 2009 | ||||||||||
Goodwill |
— | $ | 247,337 | $ | 246,842 | |||||||
Non-amortizable intangibles |
||||||||||||
Trademarks |
67,400 | 67,400 | ||||||||||
Other intangibles |
794 | 752 | ||||||||||
Total non-amortizable intangibles |
68,194 | 68,152 | ||||||||||
Amortizable intangibles: |
||||||||||||
Non-compete agreement |
5 | 2,500 | 2,500 | |||||||||
Accumulated amortization non-compete agreement |
(1,973 | ) | (1,473 | ) | ||||||||
Non-compete agreement—net |
527 | 1,027 | ||||||||||
Customer relationships |
10 | 26,259 | 26,203 | |||||||||
Accumulated amortization customer relationships |
(14,798 | ) | (11,981 | ) | ||||||||
Customer relationships—net |
11,461 | 14,222 | ||||||||||
Proprietary knowledge |
15 | 13,022 | 12,816 | |||||||||
Accumulated amortization proprietary knowledge |
(5,267 | ) | (3,938 | ) | ||||||||
Proprietary knowledge—net |
7,755 | 8,878 | ||||||||||
Trade names |
5 | 376 | 357 | |||||||||
Accumulated amortization trade names |
(292 | ) | (204 | ) | ||||||||
Trade names—net |
84 | 153 | ||||||||||
Royalty license |
7 | 389 | 368 | |||||||||
Accumulated amortization royalty license |
(165 | ) | (101 | ) | ||||||||
Royalty license—net |
224 | 267 | ||||||||||
Total amortizable intangibles—net |
20,051 | 24,547 | ||||||||||
Intangible assets—net |
$ | 88,245 | $ | 92,699 | ||||||||
Goodwill and trademarks are tested for impairment annually. Goodwill is tested at the reporting unit level. The customer relationships, non-compete agreement and proprietary knowledge, which are amortizable, are tested for impairment whenever events or circumstances indicate that the carrying
F-23
CPG INTERNATIONAL INC. AND SUBSIDIARIES
NOTES TO CONSOLIDATED FINANCIAL STATEMENTS (Continued)
6. GOODWILL AND INTANGIBLE ASSETS—NET (Continued)
value may not be recoverable. At each reporting period, the assigned useful lives are considered for continued appropriateness. See Note 1 for discussion of the Company's impairment charge in 2008, which was finalized during the first quarter of 2009.
Amortization expense for the years ended December 31, 2010, 2009 and 2008 was approximately $4.7 million, $4.6 million and $4.9 million, respectively.
The following table presents the future intangible asset amortization expense based on existing intangible assets at December 31, 2010:
| (Dollars in thousands) |
December 31, 2010 |
||||
|---|---|---|---|---|---|
2011 |
$ | 4,462 | |||
2012 |
3,838 | ||||
2013 |
3,622 | ||||
2014 |
3,455 | ||||
2015 |
1,780 | ||||
Thereafter |
2,894 | ||||
Total |
$ | 20,051 | |||
F-24
CPG INTERNATIONAL INC. AND SUBSIDIARIES
NOTES TO CONSOLIDATED FINANCIAL STATEMENTS (Continued)
6. GOODWILL AND INTANGIBLE ASSETS—NET (Continued)
The following table summarizes the changes in the Company's goodwill for the years ended December 31, 2010, 2009 and 2008:
| (Dollars in thousands) |
AZEK Building Products |
Scranton Products |
Vycom | Consolidated | ||||||||||
|---|---|---|---|---|---|---|---|---|---|---|---|---|---|---|
Balance at December 31, 2007: |
||||||||||||||
Goodwill |
$ | 170,665 | $ | 47,384 | $ | 70,035 | $ | 288,084 | ||||||
Purchase goodwill related to the Procell Acquisition |
5 | — | — | 5 | ||||||||||
Purchase goodwill related to the Composatron Acquisition |
9,610 | — | — | 9,610 | ||||||||||
Purchase adjustment for deferred income taxes |
193 | — | 40 | 233 | ||||||||||
Impairment of goodwill(1) |
(10,946 | ) | (15,437 | ) | (9,617 | ) | (36,000 | ) | ||||||
Currency translation adjustment |
(1,928 | ) | — | — | (1,928 | ) | ||||||||
Balance at December 31, 2008: |
||||||||||||||
Goodwill |
178,545 | 47,384 | 70,075 | 296,004 | ||||||||||
Accumulated impairment losses |
(10,946 | ) | (15,437 | ) | (9,617 | ) | (36,000 | ) | ||||||
Goodwill at December 31, 2008 |
$ | 167,599 | $ | 31,947 | $ | 60,458 | $ | 260,004 | ||||||
Impairment of goodwill(2) |
(14,912 | ) | 3,273 | (2,769 | ) | (14,408 | ) | |||||||
Currency translation adjustment |
1,246 | — | — | 1,246 | ||||||||||
Balance at December 31, 2009: |
||||||||||||||
Goodwill |
179,791 | 47,384 | 70,075 | 297,250 | ||||||||||
Accumulated impairment losses |
(25,858 | ) | (12,164 | ) | (12,386 | ) | (50,408 | ) | ||||||
Goodwill at December 31, 2009 |
$ | 153,933 | $ | 35,220 | $ | 57,689 | $ | 246,842 | ||||||
Currency translation adjustment |
495 | — | — | 495 | ||||||||||
Balance at December 31, 2010: |
||||||||||||||
Goodwill |
180,286 | 47,384 | 70,075 | 297,745 | ||||||||||
Accumulated impairment losses |
(25,858 | ) | (12,164 | ) | (12,386 | ) | (50,408 | ) | ||||||
Goodwill at December 31, 2010 |
$ | 154,428 | $ | 35,220 | $ | 57,689 | $ | 247,337 | ||||||
- (1)
- As
estimated on a preliminary basis at December 31, 2008. See discussion above.
- (2)
- Finalization of second step of the impairment review as of December 31, 2008 completed in the first quarter of 2009.
F-25
CPG INTERNATIONAL INC. AND SUBSIDIARIES
NOTES TO CONSOLIDATED FINANCIAL STATEMENTS (Continued)
7. DEFERRED FINANCING COSTS
Deferred financing costs consisted of the following:
| |
December 31, | |||||||
|---|---|---|---|---|---|---|---|---|
| (Dollars in thousands) |
2010 | 2009 | ||||||
Deferred financing costs |
$ | 13,794 | $ | 13,675 | ||||
Accumulated amortization |
(10,803 | ) | (8,596 | ) | ||||
Total deferred financing costs, net |
$ | 2,991 | $ | 5,079 | ||||
Amortization of deferred financing costs for the years ended December 31, 2010, 2009 and 2008 were approximately $2.2 million, $2.3 million and $2.1 million, respectively. During the first quarter of 2008, the Company wrote off approximately $470,000 of unamortized deferred financing costs attributable to the Company's previous credit facility. Amortization of deferred financing costs, as well as the additional write-off, is included in interest expense in the consolidated statements of operations.
8. LONG-TERM DEBT
Long-term debt consisted of the following:
| |
December 31, | |||||||
|---|---|---|---|---|---|---|---|---|
| (Dollars in thousands) |
2010 | 2009 | ||||||
Senior Unsecured Fixed Rate Notes due 2013—10.5% |
$ | 150,000 | $ | 150,000 | ||||
Senior Unsecured Floating Rate Notes due 2012—LIBOR + 6.75% (7.5% at December 31, 2010 and 7.87% at December 31, 2009) (includes premium of $34 at December 31, 2010 and $59 at December 31, 2009) |
128,034 | 128,059 | ||||||
Term Loan due April 30, 2012—7.25% at December 31, 2010 and 5.26% at December 31, 2009 (includes discount of $38 at December 31, 2010 and $267 at December 31, 2009) |
24,212 | 24,233 | ||||||
Total |
302,246 | 302,292 | ||||||
Less current portion |
— | 250 | ||||||
Long-term debt—less current portion |
$ | 302,246 | $ | 302,042 | ||||
As of December 31, 2010, the Company had scheduled long term debt payments (excluding interest) of $0.25 million in 2011, $152.0 million in 2012 and $150.0 million in 2013. On February 18, 2011, the Company refinanced its then outstanding long term debt. The new debt facilities include a $65.0 million asset-based revolving credit facility and a $285.0 million term loan. The Term Loan has a term of 6 years and bears interest at LIBOR plus 4.50%, subject to a LIBOR floor of 1.50%. The ABL Facility has a term of 5 years and bears interest at LIBOR plus a range of 2.25% to 2.75% based on average excess availability. As per guidance provided in ASC 470 for the refinance of the short term portion of long term debt, the Company met the criteria of ability and intent to refinance and hence excluded the short term portion from current liabilities, and is disclosing the short term portion as part of the total long term debt as of December 31, 2010.
At December 31, 2010, CPG International I Inc. ("CPG"), a wholly owned subsidiary of the Company, had approximately $128.0 million aggregate principal amount of Senior Unsecured Floating Rate Notes due 2012 (the "Floating Rate Notes") and $150.0 million aggregate principal amount of
F-26
CPG INTERNATIONAL INC. AND SUBSIDIARIES
NOTES TO CONSOLIDATED FINANCIAL STATEMENTS (Continued)
8. LONG-TERM DEBT (Continued)
101/2% Senior Unsecured Notes due 2013 (the "Fixed Rate Notes" and, collectively with the Floating Rate Notes, the "Notes") outstanding at December 31, 2010 and 2009. The Notes were guaranteed by the Company and all of the domestic subsidiaries of CPG. The indenture governing the Notes contained a number of covenants that, among other things, restricted CPG's ability, and the ability of any subsidiary guarantors, subject to certain exceptions, to sell assets, incur additional debt, repay other debt, pay dividends and distributions on CPG's capital stock or repurchase CPG's capital stock, create liens on assets, make investments, loans or advances, make certain acquisitions, engage in mergers or consolidations and engage in certain transactions with affiliates.
The Company and its subsidiaries were a party to a Loan and Security Agreement with Wells Fargo Bank, N.A. (the "Loan Agreement"), as administrative agent, and General Electric Capital Corporation, as syndication agent, which was entered into on February 13, 2008. The Loan Agreement provided subsidiaries of the Company with up to $65.0 million in borrowing capacity, with the actual borrowing base limited to a percentage of eligible receivables and inventory, subject to reserves established by the administrative agent in the exercise of its reasonable business judgment. The Loan Agreement required subsidiaries of the Company to repay the outstanding principal on any loans thereunder at the maturity date as defined therein, but in any case no later than February 13, 2013. Borrowings under the Loan Agreement bore interest, at the Company's option, at the base rate (prime rate) plus a spread of up to 0.5% or adjusted LIBOR plus a spread of 1.5% to 2.25%, or a combination thereof. The Loan Agreement also provided for a fee ranging between 0.25% and 0.5% of unused commitments. Substantially all of the Company's and its subsidiaries' assets (excluding real property and 65% of equity interests of the Company's first tier foreign Canadian subsidiary) were pledged as collateral for any borrowings under the Loan Agreement.
The Loan Agreement contained various covenants, including a financial covenant which required the Company and its subsidiaries to maintain, in certain circumstances and as defined, minimum ratios or levels of consolidated EBITDA to consolidated fixed charges. The Loan Agreement also imposed certain restrictions on the Company, and its subsidiaries, including restrictions on the ability to issue guarantees, grant liens, make fundamental changes in their business, corporate structure or capital structure, make loans and investments, enter into transactions with affiliates, modify or waive material agreements, or prepay or repurchase indebtedness.
The Loan Agreement matured on the earliest of (i) February 13, 2013, (ii) the date which precedes the maturity date of the term loans under the Term Loan Agreement by three months to the extent that obligations thereunder are still outstanding, unless there is excess availability of at least $10.0 million, (iii) 6 months prior to the maturity of the Floating Rate Notes to the extent that obligations thereunder are still outstanding and (iv) 6 months prior to the maturity of the Fixed Rate Notes to the extent that obligations thereunder are still outstanding.
The Company and its subsidiaries were a party to a Term Loan and Security Agreement ("Term Loan Agreement"), which was entered into on February 29, 2008. Subsidiaries of the Company borrowed approximately $25.0 million under the term loan as part of the financing for the Composatron Acquisition. The Term Loan Agreement initially required the borrowers thereunder to repay the outstanding principal of the Term Loan in quarterly installments of $62,500 from March 31, 2008 through December 31, 2010, with the remaining outstanding principal balance of the Term Loan due no later than February 28, 2011. The Term Loan Agreement required mandatory prepayments of the term loans thereunder from certain debt and equity issuances, asset dispositions (subject to certain
F-27
CPG INTERNATIONAL INC. AND SUBSIDIARIES
NOTES TO CONSOLIDATED FINANCIAL STATEMENTS (Continued)
8. LONG-TERM DEBT (Continued)
reinvestment rights), excess cash flow and extraordinary receipts. The Term Loan Agreement contained a mandatory prepayment based on excess cash flow at December 31, 2009, which was payable on April 5, 2010. The Company applied for and obtained a waiver to release its obligation under this prepayment. In addition, on July 26, 2010, the Company and its subsidiaries entered into an amendment to the Term Loan Agreement, which amended certain provisions of the Term Loan Agreement, including, but not limited to (1) deleting the requirement to mandatorily prepay loans under the Term Loan Agreement with excess cash proceeds, (2) extending the maturity date of the Term Loan Agreement from February 28, 2011 to April 30, 2012 and (3) revising the Term Loan Agreement's amortization schedule to provide for quarterly installments of $62,500 through March 31, 2012, with the remaining outstanding principal balance of the Term Loan due no later than April 30, 2012.
The Term Loan Agreement contained various covenants, including a financial covenant which required the Company and its subsidiaries to maintain, as defined, a maximum ratio of consolidated senior secured indebtedness to consolidated EBITDA. The Term Loan Agreement also imposed certain restrictions on the Company and its subsidiaries, including restrictions on the ability to issue guarantees, grant liens, make fundamental changes in their business, corporate structure or capital structure, make loans and investments, declare or agree to pay any dividends or other distributions, enter into transactions with affiliates, modify or waive material agreements, or prepay or repurchase indebtedness.
The Company was in compliance with the financial and non-financial covenants imposed by the debt agreements as of December 31, 2010.
9. LEASE COMMITMENTS
The Company leases machinery, computer equipment and a manufacturing facility under various capital leases. The Company also leases office equipment, vehicles, a manufacturing facility and an office under operating leases expiring during the next six years.
During 2009, the Company decided to consolidate its administrative offices into one of its manufacturing facilities. On December 22, 2009, the Company gave notice of its intention to terminate the related operating lease to the lessor. In conjunction with the termination in February 2010, the Company paid approximately $0.2 million in required termination costs under the terms of the lease. These costs represented six months rent as well as the unamortized portion of prepaid real estate commissions, and were included as a part of operating expenses in the Company's corporate segment income statement in 2009.
In addition, the Company decided to consolidate its two Canadian manufacturing facilities into one facility. On December 20, 2009, the Company entered into an amended operating lease agreement with its lessor, which amended the original lease to advance the expiration of its term. The Company also recorded a liability of approximately $0.4 million, which represented the required termination costs under the terms of the lease. These costs represent funds payable directly to the lessor as well as costs to be incurred by the Company before exiting the lease. These costs are also included as a part of operating expense in the company's AZEK Building Product's income statement in 2009.
In connection with the facility consolidation, the Company identified certain machinery and equipment at the Canadian manufacturing facility that no longer had a useful life to the Company. The
F-28
CPG INTERNATIONAL INC. AND SUBSIDIARIES
NOTES TO CONSOLIDATED FINANCIAL STATEMENTS (Continued)
9. LEASE COMMITMENTS (Continued)
Company plans on disposing of a majority of the manufacturing equipment and has written the assets down by approximately $0.6 million to the estimated fair value net of any related selling costs. The current carrying value of the assets at December 31, 2010 was approximately $0.7 million. The asset write-down is included as part of operating expense in the Company's AZEK Building Product's income statement in the first quarter of 2010.
Future minimum rental payments at December 31, 2010 for capital and operating leases having non-cancelable lease terms in excess of one year are as follows:
| (Dollars in thousands) |
Capital | Operating | ||||||
|---|---|---|---|---|---|---|---|---|
2011 |
$ | 1,904 | $ | 1,390 | ||||
2012 |
949 | 995 | ||||||
2013 |
557 | 836 | ||||||
2014 |
537 | 653 | ||||||
2015 |
543 | 576 | ||||||
Thereafter |
7,774 | 576 | ||||||
Total |
12,264 | $ | 5,026 | |||||
Less amount representing interest |
(8,932 | ) | ||||||
Present value of minimum capital lease payments |
3,332 | |||||||
Less current installments of obligations under capital leases |
(1,311 | ) | ||||||
Obligations under capital leases—excluding current installments |
$ | 2,021 | ||||||
Total rent expense for the years ended December 31, 2010, 2009 and 2008 was approximately $1.6 million, $1.6 million and $1.8 million, respectively.
10. INCOME TAXES
The following is a summary of U.S. and non-U.S. components of income (loss) before taxes:
| |
Year Ended December 31, | ||||||||||
|---|---|---|---|---|---|---|---|---|---|---|---|
| (Dollars in thousands) |
2010 | 2009 | 2008 | ||||||||
United States |
$ | 14,171 | $ | (8,693 | ) | $ | (52,596 | ) | |||
Non-U.S. |
(1,249 | ) | (1,724 | ) | (2,853 | ) | |||||
Total income (loss) before taxes |
$ | 12,922 | $ | (10,417 | ) | $ | (55,449 | ) | |||
F-29
CPG INTERNATIONAL INC. AND SUBSIDIARIES
NOTES TO CONSOLIDATED FINANCIAL STATEMENTS (Continued)
10. INCOME TAXES (Continued)
Components of the income tax expense (benefit) for the periods ended:
| |
Year Ended December 31, | |||||||||||
|---|---|---|---|---|---|---|---|---|---|---|---|---|
| (Dollars in thousands) |
2010 | 2009 | 2008 | |||||||||
Current: |
||||||||||||
Federal |
$ | (135 | ) | $ | 16 | $ | (62 | ) | ||||
State and local |
508 | 114 | 158 | |||||||||
Foreign |
5 | 9 | — | |||||||||
Total current |
378 | 139 | 96 | |||||||||
Deferred: |
||||||||||||
Federal |
3,350 | 1,871 | (5,416 | ) | ||||||||
State and local |
259 | (1,563 | ) | (886 | ) | |||||||
Foreign |
(418 | ) | (558 | ) | (889 | ) | ||||||
Total deferred |
3,191 | (250 | ) | (7,191 | ) | |||||||
Income tax expense (benefit) |
$ | 3,569 | $ | (111 | ) | $ | (7,095 | ) | ||||
Income tax provision differed from the amounts computed by applying the US Federal income tax rate of 34% to income before income taxes as a result of the following:
| |
Year Ended December 31, | |||||||||
|---|---|---|---|---|---|---|---|---|---|---|
| (Dollars in thousands) |
2010 | 2009 | 2008 | |||||||
Expense (benefit) at federal statutory rate |
$ | 4,394 | $ | (3,543 | ) | $ | (18,852 | ) | ||
Foreign taxes |
11 | 37 | 81 | |||||||
State and local taxes—net of federal benefit |
425 | (951 | ) | (831 | ) | |||||
Impairment—nondeductible goodwill |
— | 3,867 | 6,147 | |||||||
(Decrease) /increase in valuation allowance |
(1,398 | ) | 618 | 6,338 | ||||||
Other |
137 | (139 | ) | 22 | ||||||
Income tax expense (benefit) |
$ | 3,569 | $ | (111 | ) | $ | (7,095 | ) | ||
The Company accounts for income taxes in accordance with ASC 740, Income Taxes, which requires an asset and liability approach to financial accounting and reporting for income taxes. Accordingly, deferred income taxes have been provided for the temporary differences between the financial reporting and the income tax basis of the Company's assets and liabilities by applying enacted
F-30
CPG INTERNATIONAL INC. AND SUBSIDIARIES
NOTES TO CONSOLIDATED FINANCIAL STATEMENTS (Continued)
10. INCOME TAXES (Continued)
statutory tax rates applicable to future years to the basis differences. Deferred tax assets (liabilities) consist of the following at December 31:
| (Dollars in thousands) |
2010 | 2009 | |||||||
|---|---|---|---|---|---|---|---|---|---|
Deferred tax asset: |
|||||||||
Federal net operating loss carryforwards |
$ | 7,124 | $ | 11,590 | |||||
State loss carryforwards and other benefits |
1,829 | 1,917 | |||||||
Foreign loss carryforwards |
624 | 272 | |||||||
Inventory reserves |
323 | 523 | |||||||
Warranty reserves |
1,020 | 800 | |||||||
Accrued expenses |
3,982 | 3,222 | |||||||
Valuation allowance |
(7,114 | ) | (8,511 | ) | |||||
Total deferred tax assets |
7,788 | 9,813 | |||||||
Deferred tax liabilities: |
|||||||||
Intangibles—net |
(35,301 | ) | (32,776 | ) | |||||
Prepaid assets |
(205 | ) | (227 | ) | |||||
Property, plant and equipment |
(8,188 | ) | (9,463 | ) | |||||
Total deferred tax liabilities |
(43,694 | ) | (42,466 | ) | |||||
Net deferred tax liability |
$ | (35,906 | ) | $ | (32,653 | ) | |||
At December 31, 2010, the Company has approximately $21.0 million of net operating loss carryforwards for federal income tax purposes which begin to expire after 2026, and approximately $24.6 million of net operating loss carryforwards for state tax purposes which expire in varying amounts beginning after 2015, and through 2030. The valuation allowance for deferred tax assets of $7.1 million and $8.5 million at December 31, 2010 and December 31, 2009, respectively, relates principally to the uncertainty as to the utilization of certain deferred tax assets, primarily federal and state tax loss carryforwards. The valuation allowance was determined in accordance with the provisions of ASC 740, which requires that a valuation allowance be established and maintained when management's analysis indicates it is "more likely than not" that all or a portion of deferred tax assets will not be realized. At December 31, 2010, the valuation allowance represents a full valuation allowance against U.S. federal net deferred tax assets and certain net state deferred tax assets, other than deferred tax liabilities related to indefinite-lived assets, which cannot be used to support the realization of the existing deferred tax assets. The decrease in the valuation allowance in 2010 was primarily attributable to the taxable income generated in 2010.
As of December 31, 2010, the Company has concluded that it is not more likely than not that the U.S. federal and the majority of its state net deferred tax assets will be realized, due to historical losses, the significant volatility in pre-tax earnings, and the ongoing uncertainties surrounding the building construction markets, particularly the commercial construction market. If the Company is able to demonstrate continued profitability combined with the favorable impact of the February 2011 refinancing (see Note 14), then it may reverse its valuation allowance in the future.
ASC 740, "Income Taxes," prescribes when deferred taxes should be recorded in connection with the temporary differences associated with the financial reporting basis and tax basis of an investment in a foreign subsidiary. Financial reporting basis and tax basis differences in the investment in the
F-31
CPG INTERNATIONAL INC. AND SUBSIDIARIES
NOTES TO CONSOLIDATED FINANCIAL STATEMENTS (Continued)
10. INCOME TAXES (Continued)
Company's foreign subsidiary consists of accumulated losses as well as foreign currency translation adjustments, such that tax basis is in excess of financial reporting basis. The Company considers that the invested capital is permanently reinvested under ASC 740 and all temporary differences associated with the investment in the Company's foreign subsidiary will not reverse in the foreseeable future. Accordingly, the Company has not recognized any net deferred tax assets with regard to the basis differences referred to above with respect to its foreign subsidiary.
Uncertain Tax Positions: A reconciliation of the beginning and ending balances for liabilities associated with unrecognized tax benefits is as follows:
| (Dollars in thousands) |
2010 | 2009 | 2008 | ||||||||
|---|---|---|---|---|---|---|---|---|---|---|---|
Balance at January 1 |
$ | 800 | $ | 1,280 | $ | 800 | |||||
Unrecognized tax benefits related to prior years |
50 | (480 | ) | 480 | |||||||
Unrecognized tax benefits related to the current year |
— | — | — | ||||||||
Settlements |
— | — | — | ||||||||
Reductions in unrecognized tax benefits due to the lapse of applicable statute of limitations |
— | — | — | ||||||||
Balance at December 31 |
$ | 850 | $ | 800 | $ | 1,280 | |||||
Unrecognized tax benefits of $0.8 million are recorded as an offset to certain non-current deferred tax assets at December 31, 2010 and December 31, 2009, respectively. The total liabilities associated with the unrecognized tax benefits that, if recognized, would impact the Company's effective tax rate were $0.9 million and $0.8 million at December 31, 2010 and December 31, 2009 respectively. It is not anticipated that the balance of unrecognized tax benefit will change significantly over the next twelve months.
When applicable, the Company's practice is to recognize interest and/or penalties related to income tax matters in income tax expense. During 2010, the Company accrued $2,000 and $1,000 of interest and penalty expense, respectively, which is included in income tax expense. No interest or penalty was included in income tax expense for 2009 or 2008. The corresponding liabilities recorded on the consolidated balance sheet for interest and penalties were $2,000 and $1,000 respectively at December 31, 2010. At December 31, 2009, there was no accrual for interest or penalties recorded on the consolidated balance sheet.
The Company and its subsidiaries file income tax returns in the U.S. federal jurisdiction. The Company and its subsidiaries' federal income tax returns for tax years 2007 and beyond are open tax years subject to examination by the Internal Revenue Service (IRS). The Company and its subsidiaries also file income tax returns in various state jurisdictions, as appropriate, with varying statutes of limitation. A subsidiary files federal and provincial income tax returns in Canada. The Canadian subsidiary's tax returns have been examined by Canada Revenue Agency through February 29, 2008 with no significant findings noted.
F-32
CPG INTERNATIONAL INC. AND SUBSIDIARIES
NOTES TO CONSOLIDATED FINANCIAL STATEMENTS (Continued)
11. COMMITMENTS AND CONTINGENCIES
From time to time, the Company is subject to litigation in the ordinary course of business. Currently, there are no claims or proceedings against the Company that it believes would be expected to have a material adverse effect on the Company's business or financial condition, results of operations or cash flows.
12. RELATED PARTY TRANSACTIONS
AEA Investors, the general partner of Holdings, the owner of 100% of the Company's common stock, is entitled to a management fee at an annual rate of $1.5 million, payable on a monthly basis pursuant to a management agreement with AEA Investors. Annual management fees of $1.5 million are included in selling, general and administrative expenses for the years ended December 31, 2010, 2009 and 2008. In consideration of services performed in connection with the Composatron Acquisition and the related financings, the Company paid a $500,000 fee to AEA Investors upon closing of the Composatron Acquisition in 2008. These acquisition related fees were accounted for as part of the purchase price of these transactions.
The Company leases one of its manufacturing facilities from an affiliate of an equity holder of Holdings. Total lease payments for each of the years ended December 31, 2010, 2009 and 2008 was approximately $0.5 million.
In 2007, the Company entered into an amended lease agreement related to an office and manufacturing facilities location with North Alabama Property Leasing, Inc. The lessor of the property is an entity whose sole shareholder was an equity holder in Holdings through May 2010 as a result of the acquisition by the Company of Pro-Cell, LLC ("Procell") in 2007 (the "Procell Acquisition"). Total lease expense for each of the years ended December 31, 2010, 2009 and 2008 was approximately $0.6 million. The Company also paid storage and other fees to the lessor in the amount of approximately $0.03 million for each of the years ended December 31, 2010, 2009 and 2008.
Tide Transport, Inc., a freight company owned by two equity holders of Holdings, provided certain freight services to the Foley, Alabama facility on a regular basis through 2008. These services included shipping finished product and the transportation of resin purchases. Total freight costs for this arrangement were approximately $0.4 million for the year ended December 31, 2008.
The former owners of Composatron are engaged in selling finished goods as well as providing machinery repairs and parts to various companies that are affiliated with them. The Company engages in business with Composatron affiliates. Total costs paid after the acquisition to Composatron affiliated companies were approximately $1,000, $10,000 and $0.2 million for the years ended December 31, 2010, 2009 and 2008, respectively.
A member of the Company's board of directors is employed by a financial institution associated with the Company's Term Loan and Credit Facility. Furthermore, the financial institution has an ownership interest in Holdings.
The Company entered into an agreement with its Chief Executive Officer, which provides Mr. Jungbluth with a bonus payment of $0.5 million if the Company is sold within 36 months after April 2008.
The Company also has long-term notes in the amount of approximately $13.9 million due from Holdings for the payment made on behalf of Holdings related to repurchase of ownership units in
F-33
CPG INTERNATIONAL INC. AND SUBSIDIARIES
NOTES TO CONSOLIDATED FINANCIAL STATEMENTS (Continued)
12. RELATED PARTY TRANSACTIONS (Continued)
Holdings. Included in the $13.9 million is approximately $3.0 million related to the repurchase of Class A limited partnership units and Class B Units pursuant to a separation agreement with Mr. James Keisling, the former chairman of the Company's board of directors. Also included in the $13.9 million is approximately $4.0 million related to the repurchase of Class A limited partnership units pursuant to the contribution agreement with Mr. Larry Sloan, one of the sellers of Procell. Currently, no repayment schedule has been established for these notes. The notes have been classified in shareholder's equity.
13. SHARE BASED COMPENSATION
Holdings, the owner of 100% of the Company's common stock, established a Class B Unit equity program, which offers executive officers and certain key managers and employees the opportunity to purchase limited partnership units in Holdings. These equity units in Holdings are intended to allow each employee participant to share in the value created at the time the current owners sell or otherwise exit the business based upon the number of limited partnership units held in Holdings by the participants when the sale or exit transaction is completed. All of the Class B Units sold to management are generally subject to repurchase at the option of Holdings, at the lower of cost or fair market value, upon termination of employment during the first year following their purchase. Thereafter, generally, 75% of such Class B Units are subject to repurchase by Holdings at the lower of cost or fair market value upon termination during the second year following their purchase, 50% during the third year and 25% during the fourth year. The Class B Unit equity program originally contained two types of units, referred to as B-1 and B-2 Units. Class B-1 Unit holders had a higher liquidation preference in the event that the current owners exit the business. Effective March 5, 2009, the B-1 and B-2 units were modified into the same "B" unit. This new B unit has the characteristics of the original B-1 unit. This modification did not have a material impact on the Company's results of operations.
The chosen valuation methodology used to determine fair value of the Class B Unit equity program is the probability-weighted expected return method (PWERM), as detailed by the American Institute of Certified Public Accountants entitled "Valuation of Privately Held Company Equity Securities Issued as Compensation" (AICPA Guide). Under the PWERM method, the value of Class B Units is estimated based upon an analysis of future values for the enterprise assuming various future outcomes. Class B Unit value is based upon the probability-weighted present value of expected future investment returns, considering each of the possible future outcomes available, as well as the rights of each unit class. The future outcomes the Company considered were: initial public offering; merger or sale to a strategic acquirer; sale to a financial buyer; distressed sale in a housing downturn; and a longer-term hold period. The PWERM method involves management making estimates of the anticipated timing of a potential liquidity event. The anticipated timing was based on the Company's estimation of likelihood of a liquidity event. For all grants, the amount of unit-based compensation expense recognized has been adjusted for estimated forfeitures of awards for which the requisite service was not expected to be provided.
At each date of measure, unit valuations incorporate a discount rate based on the risk-adjusted rate of return a Class B Unit investor would require given the circumstances of the Company at that time and the liquidation preference of the Class B Unit, which reflects the risk associated with the Company, risks and uncertainty regarding the achievement of potential liquidity events and consideration of observed rates of return on comparable investments. The Company believes that its selected discount rates are consistent with rates of return as outlined in the AICPA Guide.
F-34
CPG INTERNATIONAL INC. AND SUBSIDIARIES
NOTES TO CONSOLIDATED FINANCIAL STATEMENTS (Continued)
13. SHARE BASED COMPENSATION (Continued)
Additionally, the Company adjusted the valuation methodology of the units to reflect the impact of lack of control, potential dilution and the lack of liquidity and a trading market for the units at each valuation date.
A summary of all vested and non-vested Class B Unit activity under the equity program as of December 31, 2010 and 2009, and changes during the years then ended are presented below:
| Outstanding Units |
B Units |
Weighted Average Purchase Price |
Aggregate Intrinsic Value ($000) |
|||||||
|---|---|---|---|---|---|---|---|---|---|---|
Outstanding at January 1, 2010 |
14,285 | $ | 10 | |||||||
Granted |
510 | 56.41 | ||||||||
Repurchased at lower of cost or fair market value |
(197 | ) | 10 | |||||||
Forfeited |
(20 | ) | 10 | |||||||
Outstanding at December 31, 2010 |
14,578 | $ | 11.62 | $ | 9,431 | |||||
| |
B Units |
Weighted Average Purchase Price |
Aggregate Intrinsic Value ($000) |
|||||||
|---|---|---|---|---|---|---|---|---|---|---|
Outstanding at January 1, 2009 |
11,353 | $ | 10 | |||||||
Granted |
4,340 | 10 | ||||||||
Repurchased at lower of cost or fair market value |
(1,260 | ) | 10 | |||||||
Forfeited |
(148 | ) | 10 | |||||||
Outstanding at December 31, 2009 |
14,285 | $ | 10 | $ | 307 | |||||
A summary of the Class B Unit equity program's non-vested Class B Units as of December 31, 2010 and 2009, and changes during the years then ended are presented below:
Non-vested Units
|
B Units |
Weighted-Avg. Grant-Date Fair Value |
|||||
|---|---|---|---|---|---|---|---|
Non-vested at January 1, 2010 |
6,534 | $ | 23.26 | ||||
Granted/Issued |
510 | 57.83 | |||||
Vested |
(1,177 | ) | 35.08 | ||||
Forfeited |
(20 | ) | 18.26 | ||||
Non-vested at December 31, 2010 |
5,847 | $ | 27.90 | ||||
Non-vested Units
|
B Units |
Weighted-Avg. Grant-Date Fair Value |
|||||
|---|---|---|---|---|---|---|---|
Non-vested at January 1, 2009 |
4,668 | $ | 49.80 | ||||
Granted/Issued |
4,340 | 17.13 | |||||
Vested |
(2,326 | ) | 47.62 | ||||
Forfeited |
(148 | ) | 16.97 | ||||
Non-vested at December 31, 2009 |
6,534 | $ | 23.36 | ||||
F-35
CPG INTERNATIONAL INC. AND SUBSIDIARIES
NOTES TO CONSOLIDATED FINANCIAL STATEMENTS (Continued)
13. SHARE BASED COMPENSATION (Continued)
Total fair value of the units vested during the years ended December 31, 2010 and 2009 was approximately $0.04 million and $0.1 million, respectively.
Compensation costs represent the excess of fair value over the purchase price paid by the employee for their units. Compensation costs are generally recognized over the four year vesting period. Total compensation expense recognized for the years ended December 31, 2010, 2009 and 2008 was $36,000, $97,000 and $118,000, respectively. The remaining unrecognized compensation costs related to non-vested Class B Units at December 31, 2010 and 2009 was approximately $81,000 and $108,000, respectively, and the weighted-average period of time over which these costs will be recognized is 2.3 years and 2.8 years, respectively.
14. QUARTERLY INFORMATION (UNAUDITED)
| |
Quarter Ended | |
||||||||||||||
|---|---|---|---|---|---|---|---|---|---|---|---|---|---|---|---|---|
| (Dollars in thousands) |
March 31, 2010 |
June 30, 2010 |
September 30, 2010 |
December 31, 2010 |
Total | |||||||||||
Net sales |
$ | 94,667 | $ | 85,730 | $ | 96,606 | $ | 50,532 | $ | 327,535 | ||||||
Gross margin |
$ | 29,569 | $ | 26,505 | $ | 30,099 | $ | 14,697 | $ | 100,865 | ||||||
Operating income |
$ | 14,575 | $ | 11,414 | $ | 15,590 | $ | 1,867 | $ | 43,441 | ||||||
Net income (loss) |
$ | 3,191 | $ | 2,768 | $ | 7,495 | $ | (4,086 | ) | $ | 9,353 | |||||
| |
Quarter Ended | |
||||||||||||||
|---|---|---|---|---|---|---|---|---|---|---|---|---|---|---|---|---|
| (Dollars in thousands) |
March 31, 2009(1) |
June 30, 2009 |
September 30, 2009 |
December 31, 2009 |
Total | |||||||||||
Net sales |
$ | 81,415 | $ | 62,358 | $ | 78,404 | $ | 44,698 | $ | 266,875 | ||||||
Gross margin |
$ | 27,972 | $ | 22,223 | $ | 28,100 | $ | 15,259 | $ | 93,547 | ||||||
Operating income (loss) |
$ | 745 | $ | 8,010 | $ | 13,934 | $ | (2,128 | ) | $ | 20,565 | |||||
Net income (loss) |
$ | (7,050 | ) | $ | 92 | $ | 5,976 | $ | (9,367 | ) | $ | (10,306 | ) | |||
- (1)
- The Company recorded a non-cash Goodwill impairment charge of $36.0 million for the year ended December 31, 2008, representing its best estimate of the impairment charge at that time. The Company finalized the Goodwill impairment analysis during the first quarter of 2009 and an additional non-cash Goodwill impairment charge of $14.4 million was recorded in its condensed consolidated financial statements for the three months ended March 31, 2009.
15. SUBSEQUENT EVENTS
On February 18, 2011, the Company closed a $65.0 million asset-based revolving credit facility and a $285.0 million term loan and used proceeds of the new borrowings to (i) repay all amounts then outstanding (approximately $24.5 million) under the Loan Agreement and the Term Loan Agreement and (ii) repurchase approximately $245.5 million in aggregate principal amount of the Notes pursuant to a tender offer. After such repurchase, approximately $4.6 million and $27.9 million in aggregate principal amount of Floating Rate Notes and Fixed Rate Notes, respectively, remained outstanding. Also on February 18, 2011, CPG provided irrevocable notice that it will redeem for cash all Notes that remain outstanding on March 21, 2011 (the "Redemption Date"), at a redemption price of $1,000 per $1,000 principal amount of the Floating Rate Notes and $1,026.25 per $1,000 principal amount of the Fixed Rate Notes, in each case, plus accrued and unpaid interest to, but not including, the Redemption Date.
F-36
CPG INTERNATIONAL INC. AND SUBSIDIARIES
CONDENSED CONSOLIDATED BALANCE SHEETS
March 31, 2011 and December 31, 2010
(dollars in thousands, except share amounts)
| |
March 31, 2011 |
December 31, 2010 |
||||||||
|---|---|---|---|---|---|---|---|---|---|---|
| |
(unaudited) |
|
||||||||
ASSETS: |
||||||||||
Current assets: |
||||||||||
Cash and cash equivalents |
$ | 12,339 | $ | 49,072 | ||||||
Receivables: |
||||||||||
Trade, less allowance for doubtful accounts of $1,424 and $1,301 in 2011 and 2010, respectively |
76,677 | 15,762 | ||||||||
Inventories |
45,909 | 59,414 | ||||||||
Deferred income taxes—current |
9,773 | 5,335 | ||||||||
Prepaid expenses and other |
3,275 | 2,648 | ||||||||
Total current assets |
147,973 | 132,231 | ||||||||
Property and equipment—net |
83,197 | 82,018 | ||||||||
Goodwill |
247,613 | 247,337 | ||||||||
Intangible assets—net |
87,231 | 88,245 | ||||||||
Deferred financing costs—net |
8,335 | 2,991 | ||||||||
Other assets |
262 | 262 | ||||||||
Total assets |
$ | 574,611 | $ | 553,084 | ||||||
LIABILITIES AND SHAREHOLDER'S EQUITY: |
||||||||||
Current liabilities: |
||||||||||
Accounts payable |
$ | 32,085 | $ | 29,413 | ||||||
Current portion of capital lease |
1,117 | 1,311 | ||||||||
Current portion of long-term debt obligations |
42,850 | — | ||||||||
Accrued interest |
1,943 | 12,705 | ||||||||
Accrued rebates |
4,942 | 4,595 | ||||||||
Accrued expenses |
13,806 | 13,218 | ||||||||
Total current liabilities |
96,743 | 61,242 | ||||||||
Deferred income taxes |
44,588 | 41,241 | ||||||||
Capital lease obligation—less current portion |
1,828 | 2,021 | ||||||||
Long-term debt—less current portion |
279,723 | 302,246 | ||||||||
Accrued warranty |
3,253 | 2,843 | ||||||||
Other liabilities |
34 | 88 | ||||||||
Commitments and contingencies |
||||||||||
Shareholder's equity: |
||||||||||
Common shares, $0.01 par value: 1,000 shares authorized; 10 issued and outstanding at March 31, 2011 and December 31, 2010 |
— | — | ||||||||
Additional paid-in capital |
212,315 | 212,282 | ||||||||
Accumulated deficit |
(49,014 | ) | (53,546 | ) | ||||||
Note receivable—CPG Holdings |
(14,012 | ) | (13,947 | ) | ||||||
Accumulated other comprehensive loss |
(847 | ) | (1,386 | ) | ||||||
Total shareholder's equity |
148,442 | 143,403 | ||||||||
Total liabilities and shareholder's equity |
$ | 574,611 | $ | 553,084 | ||||||
The accompanying notes are an integral part of the unaudited condensed consolidated financial statements.
F-37
CPG INTERNATIONAL INC. AND SUBSIDIARIES
CONDENSED CONSOLIDATED STATEMENTS OF OPERATIONS
Three Months Ended March 31, 2011 and 2010
(unaudited)
(dollars in thousands, except share and per share amounts)
| |
Three Months Ended March 31, |
||||||||
|---|---|---|---|---|---|---|---|---|---|
| |
2011 | 2010 | |||||||
Net sales |
$ | 114,622 | $ | 94,667 | |||||
Cost of sales |
(81,276 | ) | (65,098 | ) | |||||
Gross profit |
33,346 | 29,569 | |||||||
Selling, general and administrative expenses |
(15,529 | ) | (14,395 | ) | |||||
Impairment of goodwill and long-lived assets |
— | (599 | ) | ||||||
Loss on disposal of property |
(12 | ) | — | ||||||
Operating income |
17,805 | 14,575 | |||||||
Other income (expenses): |
|||||||||
Loss on debt extinguishment |
(7,339 | ) | — | ||||||
Interest expense |
(6,682 | ) | (7,471 | ) | |||||
Interest income |
— | — | |||||||
Foreign currency gain |
14 | 78 | |||||||
Miscellaneous—net |
— | 7 | |||||||
Total other expenses—net |
(14,007 | ) | (7,386 | ) | |||||
Income before income taxes |
3,798 | 7,189 | |||||||
Income tax expense |
734 | (3,998 | ) | ||||||
Net income |
$ | 4,532 | $ | 3,191 | |||||
Earnings per common share: |
|||||||||
Weighted-average common shares outstanding (basic and diluted) |
10 | 10 | |||||||
Net income per common share (basic and diluted) |
$ | 453 | $ | 319 | |||||
The accompanying notes are an integral part of the unaudited condensed consolidated financial statements.
F-38
CPG INTERNATIONAL INC. AND SUBSIDIARIES
CONDENSED CONSOLIDATED STATEMENTS OF CASH FLOWS
Three Months Ended March 31, 2011 and 2010
(unaudited)
(dollars in thousands)
| |
Three Months Ended March 31, |
|||||||||
|---|---|---|---|---|---|---|---|---|---|---|
| (Dollars in thousands) |
2011 | 2010 | ||||||||
Cash flow from operating activities: |
||||||||||
Net income (loss) |
$ | 4,532 | $ | 3,191 | ||||||
Adjustments to reconcile net income (loss) to net cash flows provided by operating activities: |
||||||||||
Depreciation and amortization |
5,403 | 5,509 | ||||||||
Non-cash interest charges |
562 | 600 | ||||||||
Tender offer discount for extinguished debt |
(2,780 | ) | — | |||||||
Deferred income tax provision (benefit) |
(1,122 | ) | 3,486 | |||||||
Share based compensation |
9 | 14 | ||||||||
Impairment of long-lived assets |
— | 599 | ||||||||
Unrealized loss (gain) on foreign currency exchange |
(54 | ) | (158 | ) | ||||||
Loss on disposal of property |
12 | 11 | ||||||||
Bad debt provision |
123 | 494 | ||||||||
Write-off of deferred financing costs related to debt extinguishment |
1,943 | — | ||||||||
Changes in certain assets and liabilities: |
||||||||||
Trade receivables |
(61,034 | ) | (44,260 | ) | ||||||
Inventories |
13,505 | 11,880 | ||||||||
Prepaid expenses and other current assets |
(623 | ) | 26 | |||||||
Accounts payable |
2,961 | (3,747 | ) | |||||||
Accrued expenses and interest |
(9,126 | ) | (8,858 | ) | ||||||
Other liabilities and assets |
(355 | ) | 62 | |||||||
Net cash used in operating activities |
(46,044 | ) | (31,151 | ) | ||||||
Cash flows used in investing activities: |
||||||||||
Purchases of property and equipment |
(5,568 | ) | (3,490 | ) | ||||||
Net cash used in investing activities |
(5,568 | ) | (3,490 | ) | ||||||
Cash flows from financing activities: |
||||||||||
Proceeds under old revolving credit facility |
— | 10,000 | ||||||||
Payment of old debt |
(299,470 | ) | — | |||||||
Proceeds under new revolving credit facility |
39,675 | — | ||||||||
Proceeds under new term loan agreement |
283,575 | — | ||||||||
Payment on long-term obligations |
(1,071 | ) | (519 | ) | ||||||
Payments on behalf of CPG Holdings equity |
(41 | ) | (990 | ) | ||||||
Payment of financing fees |
(7,806 | ) | — | |||||||
Net cash provided by financing activities |
14,862 | 8,491 | ||||||||
Impact of foreign currency on cash and cash equivalents |
17 | 82 | ||||||||
Net increase (decrease) in cash and cash equivalents |
(36,733 | ) | (26,068 | ) | ||||||
Cash and cash equivalents—Beginning of period |
49,072 | 44,501 | ||||||||
Cash and cash equivalents—End of period |
$ | 12,339 | $ | 18,433 | ||||||
Supplemental disclosures: |
||||||||||
Cash paid for interest |
$ | 16,885 | $ | 13,617 | ||||||
Federal, state and local taxes paid |
$ | 72 | $ | 2 | ||||||
Supplemental disclosures of non-cash investing and financing activities: |
||||||||||
Capital expenditures in accounts payable at end of period |
$ | 1,129 | $ | 1,197 | ||||||
The accompanying notes are an integral part of the unaudited condensed consolidated financial statements.
F-39
CPG INTERNATIONAL INC. AND SUBSIDIARIES
NOTES TO CONDENSED CONSOLIDATED FINANCIAL STATEMENTS
1. ORGANIZATION AND SUMMARY OF SIGNIFICANT ACCOUNTING POLICIES
a. Organization
CPG International Inc. and Subsidiaries (the "Company") is a leading manufacturer of premium, low maintenance building products for residential (AZEK Building Products); commercial (Scranton Products); and industrial (Vycom) markets. The Company's products include AZEK Trim, AZEK Deck, AZEK Porch, AZEK Moulding and AZEK Rail for residential housing markets; bathroom and locker systems sold under the brand names Resistall, Hiny Hiders and TuffTec, used in commercial building markets; and Vycom which extrudes plastic sheet products under the names of Celtec, Seaboard and Flametec and other non-fabricated products for special applications in industrial markets. The Company operates in various locations throughout the United States and Canada.
b. Summary of Significant Accounting Policies
Basis of Presentation
The accompanying unaudited condensed consolidated financial statements and the accompanying notes are prepared in accordance with accounting principles generally accepted in the United States of America and the rules of the Securities and Exchange Commission (the "SEC"). In the opinion of management, all adjustments (consisting of normal recurring accruals) considered necessary for a fair presentation have been included. Certain information and notes normally included in financial statements prepared in accordance with accounting principles generally accepted in the United States of America have been condensed or omitted pursuant to the rules and regulations of the SEC. These accompanying financial statements include the accounts of the Company on a consolidated basis. On April 22, 2011, the Company filed a Form S-1 which included the notes to the consolidated financial statements for the year ended December 31, 2010 and which should be read in conjunction with these unaudited condensed consolidated financial statements. The results of operations for the three months ended March 31, 2011 and 2010 are not necessarily indicative of the operating results for the full year. The Company's condensed consolidated financial statements include all of the assets, liabilities and results of operations of the Company's subsidiaries. All inter-company transactions among consolidated entities have been eliminated.
Certain revisions in classification have been made to prior years' data in order to conform to current year presentation.
Allowance for Doubtful Accounts
Credit is extended to commercial, institutional, residential and industrial construction customers based on an evaluation of their financial condition, and collateral is generally not required. The evaluation of the customer's financial condition is performed to reduce the risk of loss. The Company maintains allowances for doubtful accounts for estimated losses resulting from the inability of its customers to make required payments. Amounts are written-off when they are determined to be uncollectible.
F-40
CPG INTERNATIONAL INC. AND SUBSIDIARIES
NOTES TO CONDENSED CONSOLIDATED FINANCIAL STATEMENTS (Continued)
1. ORGANIZATION AND SUMMARY OF SIGNIFICANT ACCOUNTING POLICIES (Continued)
Changes in the Company's allowance for doubtful accounts are as follows:
| |
Three Months Ended March 31, |
||||||
|---|---|---|---|---|---|---|---|
| (Dollars in thousands) |
2011 | 2010 | |||||
Beginning balance |
$ | 1,301 | $ | 1,064 | |||
Increase for anticipated bad debts |
123 | 494 | |||||
Decrease for accounts written off |
— | (4 | ) | ||||
Ending balance |
$ | 1,424 | $ | 1,554 | |||
Product Warranties
The Company provides warranty guarantees on its Scranton Products against breakage, corrosion and delamination. Prior to June 1, 2009, the Company had provided a 15-year limited warranty on Scranton Products. Beginning June 1, 2009, the warranty on Scranton Products was extended to 25 years for purchases after that date. The Company provides a 25-year limited warranty on AZEK Trim products and a lifetime limited warranty on AZEK Deck and AZEK Porch products sold for residential use. The warranty period for all other uses of AZEK Deck and AZEK Porch, including commercial use, is 20 years. AZEK Trim products are guaranteed against manufacturing defects that cause the products to rot, corrode, delaminate, or excessively swell from moisture. The AZEK Deck and AZEK Porch warranties guarantee against manufacturing defects in material and workmanship that result in blistering, peeling, flaking, cracking, splitting, cupping, rotting or structural defects from termites or fungal decay. AZEK Rail products have a 20-year limited warranty for white railing and a 10-year limited warranty for AZEK Premier colored railing. The AZEK Rail warranty also guarantees against rotting, cracking, peeling, blistering or structural defects from fungal decay.
Estimating the required warranty reserves requires a high level of judgment as AZEK Trim products have only been on the market for ten years, AZEK Deck has only been on the market for six years, and AZEK Rail has only been on the market for ten years, each of which are early in their product life cycles. Management estimates warranty reserves, based in part upon historical warranty costs, as a proportion of sales by product line. Management also considers various relevant factors, including its stated warranty policies and procedures, as part of its evaluation of its liability. Because warranty issues may surface later in the product life cycle, management continues to review these estimates on a regular basis and considers adjustment to these estimates based on actual experience compared to historical estimates. Although management believes that the warranty reserves at March 31, 2011 are adequate, actual results may vary from these estimates. The Company currently classifies a portion of the warranty reserve as a current liability which appears on the consolidated balance sheet in accrued expenses.
F-41
CPG INTERNATIONAL INC. AND SUBSIDIARIES
NOTES TO CONDENSED CONSOLIDATED FINANCIAL STATEMENTS (Continued)
1. ORGANIZATION AND SUMMARY OF SIGNIFICANT ACCOUNTING POLICIES (Continued)
Components of the reserve for warranty costs are as follows:
| |
Three Months Ended March 31, |
|||||||
|---|---|---|---|---|---|---|---|---|
| (Dollars in thousands) |
2011 | 2010 | ||||||
Beginning balance |
$ | 3,544 | $ | 3,596 | ||||
Additions |
268 | 233 | ||||||
Warranty claims |
(67 | ) | (99 | ) | ||||
Adjustment to reserve |
(99 | ) | (88 | ) | ||||
Ending balance |
3,646 | 3,642 | ||||||
Current portion of accrued warranty |
(393 | ) | (410 | ) | ||||
Total accrued warranty—less current portion |
$ | 3,253 | $ | 3,232 | ||||
Estimated Fair Value of Financial Instruments
The carrying amounts for the Company's financial instruments classified as current assets and liabilities, including accounts receivable and accounts payable, approximate their fair value due to their short maturities. Fair value measurements are classified and disclosed in one of three categories: Level 1, defined as observable inputs such as quoted prices in active markets; Level 2, defined as inputs other than quoted prices in active markets that are either directly or indirectly observable; and Level 3, defined as unobservable inputs in which little or no market data exists, therefore requiring an entity to develop its own assumptions. At March 31, 2011, the Company has reviewed its debt and has given consideration to their characteristics and covenants in formulating an opinion of fair value and believes that the carrying value approximates fair value.
Use of Estimates
The preparation of financial statements in conformity with accounting principles generally accepted in the United States of America requires management to make estimates and assumptions that affect the reported amounts of assets and liabilities and disclosure of contingent assets and liabilities at the date of the financial statements and reported amounts of revenues and expenses during the reporting period. Actual results could differ from those estimates. Management's estimates and assumptions are evaluated on an ongoing basis and are based on historical experience, current conditions and available information.
Income Taxes
Income tax expense decreased by $4.7 million to a benefit of $0.7 million for the three months ended March 31, 2011 from $4.0 million for the same period in 2010. Income tax expense decreased primarily due to the impact of a discrete tax benefit of $2.9 million related to the charges associated with the debt extinguishment recorded in the first quarter 2011. In addition, the Company recorded a discrete tax benefit of $1.6 million resulting from the reversal of the valuation allowance associated with federal deferred tax assets, offset by a discrete charge of $0.8 million associated with a tax rate adjustment with respect to its net federal temporary differences. During the first quarter of 2011, and based on the debt refinancing as well as the improved forecast of ordinary income for 2011 and future years, the Company determined that it was more likely than not that its federal deferred tax assets
F-42
CPG INTERNATIONAL INC. AND SUBSIDIARIES
NOTES TO CONDENSED CONSOLIDATED FINANCIAL STATEMENTS (Continued)
1. ORGANIZATION AND SUMMARY OF SIGNIFICANT ACCOUNTING POLICIES (Continued)
would be realized. Income tax expense for the first quarter of 2010 was primarily attributable to deferred tax expense associated with indefinite-lived assets.
Comprehensive Income (Loss)
Comprehensive income (loss) is defined as net income (loss) and other changes in equity from transactions unrelated to the Company's shareholder. The Company's accumulated other comprehensive loss consists of accumulated foreign currency translation adjustments of approximately $0.8 million at March 31, 2011 and $1.4 million at December 31, 2010. Other comprehensive income for the three months ended March 31, 2011 and March 31, 2010 was approximately $0.5 million and $0.7 million, respectively. Comprehensive income for the three months ended March 31, 2011 and March 31, 2010 was approximately $5.1 million and $3.9 million, respectively.
Recently Issued Accounting Pronouncements
In May 2011, the Financial Accounting Standards Board ("FASB") issued Accounting Standards Update ("ASU") No. 2011-04 "Amendments to Achieve Common Fair Value Measurement and Disclosure Requirements in U.S. GAAP and IFRSs." The amendments in this update generally represent clarifications of Topic 820, but also include some instances where a particular principle or requirement for measuring fair value or disclosing information about fair value measurements has changed. This update results in common principles and requirements for measuring fair value and for disclosing information about fair value measurements in accordance with U.S. GAAP and International Financial Reporting Standards (IFRSs). The amendments in this update apply to all reporting entities that are required or permitted to measure or disclose the fair value of an asset, a liability, or an instrument classified in a reporting entity's shareholders' equity in the financial statements. The amendments in this update are to be applied prospectively and are effective during interim and annual periods beginning after December 15, 2011. Early application is not permitted. The Company will monitor any impact the amendment may have after the adoption date.
In January 2010, the FASB issued ASU 2010-06, "Improving Disclosures about Fair Value Measurements" which requires new disclosures and clarifies existing disclosure requirements. The purpose of these amendments is to provide a greater level of disaggregated information as well as more disclosure around valuation techniques and inputs to fair value measurements. The provisions of this guidance were effective as of January 1, 2010, and the adoption of this guidance is limited to disclosures in the Company's consolidated financial statements. Certain provisions of this guidance are required for annual reporting periods beginning after December 15, 2010 and for interim periods. The amendment did not have a material impact on the Company's consolidated financial statement disclosures for the periods beginning after December 15, 2010.
In December 2010, the FASB issued ASU 2010-29 "Disclosure of Supplementary Pro Forma Information for Business Combinations" which requires a public entity to disclose pro forma information for business combinations that occurred in the current reporting period. The disclosures include pro forma revenue and earnings of the combined entity for the current reporting period as though the acquisition date for all business combinations that occurred during the year had been as of the beginning of the comparable prior annual reporting period only. The amendments in this update also expand the supplemental pro forma disclosures under Topic 805 to include a description of the nature and amount of material, nonrecurring pro forma adjustments directly attributable to the
F-43
CPG INTERNATIONAL INC. AND SUBSIDIARIES
NOTES TO CONDENSED CONSOLIDATED FINANCIAL STATEMENTS (Continued)
1. ORGANIZATION AND SUMMARY OF SIGNIFICANT ACCOUNTING POLICIES (Continued)
business combination included in the reported pro forma revenue and earnings. The amendments in this update are effective prospectively after the beginning of the first annual reporting period of December 15, 2010. The amendment did not have an impact on the Company's consolidated financial statement disclosures for the periods beginning after December 15, 2010. The Company continues to monitor changes that would trigger the application of this update.
In December 2010, the FASB issued ASU 2010-28 "When to Perform Step 2 of the Goodwill Impairment Test for Reporting Units with Zero or Negative Carrying Amounts" which affects all entities that have recognized goodwill and have one or more reporting units whose carrying amount for purposes of performing Step 1 of the goodwill impairment test is zero or negative. As of December 31, 2010 none of the Company's reporting units had a zero or negative carrying amount. The Company will monitor any changes in the goodwill of its reporting units that will trigger the application of this amendment.
2. SEGMENT INFORMATION
The Company operates the following three operating segments which are also its reportable segments: AZEK Building Products ("AZEK"), which produces residential building products such as AZEK Trim, AZEK Moulding, AZEK Deck, AZEK Porch and AZEK Rail; Scranton Products ("Scranton"), which produces fabricated bathroom partition and locker systems under the Hiny Hiders, Resistall and TuffTec labels for the commercial market; and Vycom ("Vycom"), which extrudes plastic sheet products under the names of Celtec, Seaboard and Flametec and other non-fabricated products for special applications in industrial markets.
The Company's chief operating decision makers (which consists of the Company's Chief Executive Officer and Chief Financial Officer), regularly review financial information about each of these segments in deciding how to allocate resources and evaluate performance. The Company evaluates each segment's performance based on gross profit and operating income. The accounting policies for the operating segments are the same as those for the Company. Certain assets are shared by more than one operating segment and have been allocated for reporting purposes based on either percentage of revenue or asset usage. Corporate costs, which include corporate salary and employee benefit costs, information technology and corporate related professional fees (including accounting and legal fees), are also allocated to the Company's segments.
F-44
CPG INTERNATIONAL INC. AND SUBSIDIARIES
NOTES TO CONDENSED CONSOLIDATED FINANCIAL STATEMENTS (Continued)
2. SEGMENT INFORMATION (Continued)
The following table sets forth summarized financial information for the Company by operating segment for the three months ended March 31, 2011:
| (Dollars in thousands) |
AZEK Building Products |
Scranton Products |
Vycom | Corporate | Consolidated | ||||||||||||
|---|---|---|---|---|---|---|---|---|---|---|---|---|---|---|---|---|---|
Net sales |
$ | 85,415 | $ | 11,599 | $ | 17,608 | $ | — | $ | 114,622 | |||||||
Cost of sales |
(59,976 | ) | (7,310 | ) | (13,990 | ) | — | (81,276 | ) | ||||||||
Gross profit |
25,439 | 4,289 | 3,618 | — | 33,346 | ||||||||||||
Selling, general and administrative expenses |
(7,829 | ) | (2,076 | ) | (1,487 | ) | (4,137 | ) | (15,529 | ) | |||||||
Loss on disposal of property |
(12 | ) | — | — | — | (12 | ) | ||||||||||
Segment operating income (loss) |
$ | 17,598 | $ | 2,213 | $ | 2,131 | $ | (4,137 | ) | $ | 17,805 | ||||||
Selected financial data: |
|||||||||||||||||
Depreciation and amortization classified as: |
|||||||||||||||||
Cost of sales |
$ | 3,041 | $ | 227 | $ | 846 | $ | — | $ | 4,114 | |||||||
Selling, general and administrative expense |
595 | 40 | 548 | 106 | 1,289 | ||||||||||||
Total depreciation and amortization |
$ | 3,636 | $ | 267 | $ | 1,394 | $ | 106 | $ | 5,403 | |||||||
Total capital expenditures(1) |
$ | 5,647 | $ | 131 | $ | 531 | $ | 388 | $ | 6,697 | |||||||
- (1)
- Includes capital expenditures in accounts payable.
The following table sets forth summarized financial information for the Company by operating segment for the three months ended March 31, 2010:
| (Dollars in thousands) |
AZEK Building Products |
Scranton Products |
Vycom | Corporate | Consolidated | ||||||||||||
|---|---|---|---|---|---|---|---|---|---|---|---|---|---|---|---|---|---|
Net sales |
$ | 68,892 | $ | 13,143 | $ | 12,632 | $ | — | $ | 94,667 | |||||||
Cost of sales |
(47,082 | ) | (7,649 | ) | (10,367 | ) | — | (65,098 | ) | ||||||||
Gross profit |
21,810 | 5,494 | 2,265 | — | 29,569 | ||||||||||||
Selling, general and administrative expenses |
(7,546 | ) | (2,253 | ) | (1,520 | ) | (3,076 | ) | (14,395 | ) | |||||||
Impairment of long-lived assets |
(599 | ) | — | — | — | (599 | ) | ||||||||||
Segment operating income (loss) |
$ | 13,665 | $ | 3,241 | $ | 745 | $ | (3,076 | ) | $ | 14,575 | ||||||
Selected financial data: |
|||||||||||||||||
Depreciation and amortization classified as: |
|||||||||||||||||
Cost of sales |
$ | 2,942 | $ | 246 | $ | 846 | $ | — | $ | 4,034 | |||||||
Selling, general and administrative expense |
632 | 40 | 568 | 235 | 1,475 | ||||||||||||
Total depreciation and amortization |
$ | 3,574 | $ | 286 | $ | 1,414 | $ | 235 | $ | 5,509 | |||||||
Total capital expenditures(1) |
$ | 3,970 | $ | 194 | $ | 377 | $ | 146 | $ | 4,687 | |||||||
- (1)
- Includes capital expenditures in accounts payable.
F-45
CPG INTERNATIONAL INC. AND SUBSIDIARIES
NOTES TO CONDENSED CONSOLIDATED FINANCIAL STATEMENTS (Continued)
2. SEGMENT INFORMATION (Continued)
The following table sets forth summarized financial information regarding assets for the Company by operating segment at March 31, 2011 and December 31, 2010:
| (Dollars in thousands) |
March 31, 2011 |
December 31, 2010 |
|||||||
|---|---|---|---|---|---|---|---|---|---|
Total assets: |
|||||||||
AZEK Building Products |
$ | 355,612 | $ | 315,452 | |||||
Scranton Products |
81,818 | 81,781 | |||||||
Vycom |
101,774 | 94,099 | |||||||
Corporate |
35,407 | 61,752 | |||||||
Total consolidated assets |
$ | 574,611 | $ | 553,084 | |||||
The following table sets forth the Company's significant distributor group sales as a percentage of total consolidated net sales, as well as a percentage of AZEK Building Products net sales as each of these distributors are part of the AZEK Building Products segment for the three months ended March 31, 2011 and 2010:
| |
Three Months Ended March 31, | ||||||||||||
|---|---|---|---|---|---|---|---|---|---|---|---|---|---|
| |
2011 | 2010 | |||||||||||
| |
% of Consolidated Sales |
% of AZEK Building Product Sales |
% of Consolidated Sales |
% of AZEK Building Product Sales |
|||||||||
Distributor A |
49 | % | 65 | % | 29 | % | 40 | % | |||||
Distributor B |
13 | 17 | 17 | 24 | |||||||||
Total |
62 | % | 82 | % | 46 | % | 64 | % | |||||
The Company's geographic distribution of long-lived assets at March 31, 2011 and December 31, 2010 are as follows:
| (Dollars in thousands) |
March 31, 2011 |
December 31, 2010 |
|||||||
|---|---|---|---|---|---|---|---|---|---|
Long-lived assets: |
|||||||||
United States |
$ | 76,966 | $ | 75,749 | |||||
Canada |
6,231 | 6,269 | |||||||
Total consolidated long-lived assets |
$ | 83,197 | $ | 82,018 | |||||
F-46
CPG INTERNATIONAL INC. AND SUBSIDIARIES
NOTES TO CONDENSED CONSOLIDATED FINANCIAL STATEMENTS (Continued)
3. INVENTORIES
Inventories consisted of the following at March 31, 2011 and December 31, 2010:
| (Dollars in thousands) |
March 31, 2011 |
December 31, 2010 |
|||||
|---|---|---|---|---|---|---|---|
Raw materials |
$ | 19,330 | $ | 19,968 | |||
Work in process |
11,975 | 14,449 | |||||
Finished goods |
14,604 | 24,997 | |||||
Total inventories |
$ | 45,909 | $ | 59,414 | |||
Inventories are valued at the lower of cost or market, determined on a first-in, first-out basis ("FIFO").
4. PROPERTY AND EQUIPMENT—NET
Property and equipment consisted of the following at March 31, 2011 and December 31, 2010:
| (Dollars in thousands) |
March 31, 2011 |
December 31, 2010 |
||||||
|---|---|---|---|---|---|---|---|---|
Land and improvements |
$ | 1,701 | $ | 1,701 | ||||
Buildings and improvements |
25,957 | 25,570 | ||||||
Capital lease—building |
1,500 | 1,500 | ||||||
Capital lease—manufacturing equipment |
8,594 | 8,594 | ||||||
Manufacturing equipment |
107,121 | 104,200 | ||||||
Office furniture and equipment |
5,192 | 5,151 | ||||||
Total property and equipment |
150,065 | 146,716 | ||||||
Construction in progress |
9,524 | 7,532 | ||||||
|
159,589 | 154,248 | ||||||
Accumulated depreciation |
(76,392 | ) | (72,230 | ) | ||||
Total property and equipment—net |
$ | 83,197 | $ | 82,018 | ||||
Depreciation expense for the three months ended March 31, 2011 and 2010 was approximately $4.4 million and $4.3 million, respectively.
F-47
CPG INTERNATIONAL INC. AND SUBSIDIARIES
NOTES TO CONDENSED CONSOLIDATED FINANCIAL STATEMENTS (Continued)
5. GOODWILL AND INTANGIBLE ASSETS—NET
Goodwill and intangible assets consisted of the following at March 31, 2011 and December 31, 2010:
| (Dollars in thousands) |
Lives in Years |
March 31, 2011 |
December 31, 2010 |
||||||||
|---|---|---|---|---|---|---|---|---|---|---|---|
Goodwill |
— | $ | 247,613 | $ | 247,337 | ||||||
Non-amortizable intangibles: |
|||||||||||
Trademarks |
67,400 | 67,400 | |||||||||
Other intangibles |
817 | 794 | |||||||||
Total non-amortizable intangibles |
68,217 | 68,194 | |||||||||
Amortizable intangibles: |
|||||||||||
Non-compete agreement |
5 | 2,500 | 2,500 | ||||||||
Accumulated amortization non-compete agreement |
(2,098 | ) | (1,973 | ) | |||||||
Non-compete agreement—net |
402 | 527 | |||||||||
Customer relationships |
10 | 26,290 | 26,259 | ||||||||
Accumulated amortization customer relationships |
(15,487 | ) | (14,798 | ) | |||||||
Customer relationships—net |
10,803 | 11,461 | |||||||||
Proprietary knowledge |
15 | 13,137 | 13,022 | ||||||||
Accumulated amortization proprietary knowledge |
(5,612 | ) | (5,267 | ) | |||||||
Proprietary knowledge—net |
7,525 | 7,755 | |||||||||
Trade names |
5 | 388 | 376 | ||||||||
Accumulated amortization trade names |
(319 | ) | (292 | ) | |||||||
Trade names—net |
69 | 84 | |||||||||
Royalty license |
7 | 400 | 389 | ||||||||
Accumulated amortization royalty license |
(185 | ) | (165 | ) | |||||||
Royalty license—net |
215 | 224 | |||||||||
Total amortizable intangibles—net |
19,014 | 20,051 | |||||||||
Intangible assets—net |
$ | 87,231 | $ | 88,245 | |||||||
Goodwill and trademarks are tested for impairment annually at December 31. Goodwill is tested at the reporting unit level. The customer relationships, non-compete agreement and proprietary knowledge, which are amortizable, are tested for impairment whenever events or circumstances indicate that the carrying value may not be recoverable. At each reporting period, the assigned useful lives are considered for continued appropriateness. As of December 31, 2010, the Company completed its annual evaluation of potential impairment of goodwill and trademarks and determined that no impairment existed.
Amortization expense for the three months ended March 31, 2011 and 2010 was approximately $1.1 million and $1.2 million, respectively.
F-48
CPG INTERNATIONAL INC. AND SUBSIDIARIES
NOTES TO CONDENSED CONSOLIDATED FINANCIAL STATEMENTS (Continued)
5. GOODWILL AND INTANGIBLE ASSETS—NET (Continued)
The following table presents the future intangible asset amortization expense based on existing amortizable intangible assets at March 31, 2011:
| (Dollars in thousands) |
|
||||
|---|---|---|---|---|---|
2011 |
$ | 3,341 | |||
2012 |
3,855 | ||||
2013 |
3,636 | ||||
2014 |
3,468 | ||||
2015 |
1,790 | ||||
Thereafter |
2,924 | ||||
Total |
$ | 19,014 | |||
The following tables summarize the changes in the Company's goodwill for the three months ended March 31, 2011:
| (Dollars in thousands) |
AZEK Building Products |
Scranton Products |
Vycom | Consolidated | ||||||||||
|---|---|---|---|---|---|---|---|---|---|---|---|---|---|---|
Balance at December 31, 2010: |
||||||||||||||
Goodwill |
$ | 180,286 | $ | 47,384 | $ | 70,075 | $ | 297,745 | ||||||
Accumulated impairment losses |
(25,858 | ) | (12,164 | ) | (12,386 | ) | (50,408 | ) | ||||||
Goodwill at December 31, 2010 |
154,428 | 35,220 | 57,689 | 247,337 | ||||||||||
Currency translation adjustment |
276 | — | — | 276 | ||||||||||
Goodwill at March 31, 2011 |
$ | 154,704 | $ | 35,220 | $ | 57,689 | $ | 247,613 | ||||||
6. DEFERRED FINANCING COSTS, NET
Deferred financing costs consisted of the following at March 31, 2011 and December 31, 2010:
| (Dollars in thousands) |
March 31, 2011 |
December 31, 2010 |
||||||
|---|---|---|---|---|---|---|---|---|
Deferred financing costs |
$ | 8,506 | $ | 13,794 | ||||
Accumulated amortization |
(171 | ) | (10,803 | ) | ||||
Total deferred financing costs, net |
$ | 8,335 | $ | 2,991 | ||||
Amortization of deferred financing costs for the three months ended March 31, 2011 and 2010 was approximately $0.5 million. Included in the $0.5 million for the three months ended March 31, 2011, was $0.3 million related to the amortization of the old debt and $0.2 million related to amortization of the new debt. Amortization of deferred financing costs is included in interest expense in the consolidated statements of operations. On February 18, 2011, the Company refinanced its existing debt and had approximately $2.6 million of deferred financing costs outstanding on its balance sheet. As part of the accounting for the debt refinancing, $1.9 million of the deferred financing fees were written-off to the loss on debt extinguishment and $0.7 million, which relates to the modification, remains capitalized and will be amortized over the new debt term (Note 7).
F-49
CPG INTERNATIONAL INC. AND SUBSIDIARIES
NOTES TO CONDENSED CONSOLIDATED FINANCIAL STATEMENTS (Continued)
7. LONG-TERM DEBT
Long-term debt consisted of the following at March 31, 2011 and December 31, 2010:
| (Dollars in thousands) |
March 31, 2011 |
December 31, 2010 |
||||||
|---|---|---|---|---|---|---|---|---|
Senior Unsecured Fixed Rate Notes due July 1, 2013—10.5% |
$ | — | $ | 150,000 | ||||
Senior Unsecured Floating Rate Notes due July 1, 2012—LIBOR + 6.75% (7.50% at December 31, 2010 and includes a premium of $34 at December 31, 2010) |
— | 128,034 | ||||||
Term Loan due April 30, 2012—7.25% at December 31, 2010 (includes a discount of $38 at December 31, 2010) |
— | 24,212 | ||||||
Term Loan due February 18, 2017—LIBOR + 4.5% (6% at March 31, 2011 and includes a discount of $1,397) |
282,890 | — | ||||||
Revolving Credit Facility due February 18, 2016—LIBOR + 2.5% (2.97% at March 31, 2010 and includes a discount of $317) |
39,683 | — | ||||||
Total |
322,573 | 302,246 | ||||||
Less current portion |
42,850 | — | ||||||
Long-term debt—less current portion |
$ | 279,723 | $ | 302,246 | ||||
As of March 31, 2011, the Company has scheduled debt payments (excluding interest) of approximately $2.1 million in 2011, $2.9 million in 2012 through 2016, and $267.9 million in 2017. The Company intends to retire the $40.0 million outstanding on its revolving credit facility during the year ending December 31, 2011.
At December 31, 2010, CPG International I Inc. ("CPG I"), a wholly owned subsidiary of the Company, had approximately $128.0 million aggregate principal amount of Senior Unsecured Floating Rate Notes due July 1, 2012 (the "Floating Rate Notes") and $150.0 million aggregate principal amount of 101/2% Senior Unsecured Notes due July 1, 2013 (the "Fixed Rate Notes," and collectively with the Floating Rate Notes, the "Notes") outstanding. The Notes were guaranteed by the Company and all of the domestic subsidiaries of CPG I. The indenture governing the Notes contained a number of covenants that, among other things, restricted CPG I's ability, and the ability of any subsidiary guarantors, subject to certain exceptions, to sell assets, incur additional debt, repay other debt, pay dividends and distributions on CPG I's capital stock or repurchase CPG I's capital stock, create liens on assets, make investments, loans or advances, make certain acquisitions, engage in mergers or consolidations and engage in certain transactions with affiliates.
On February 18, 2011, the Company refinanced its then outstanding long term debt, and entered into (i) a senior secured revolving credit facility (the "New Revolving Credit Facility") by and among Scranton Products Inc. ("Scranton Inc."), AZEK Building Products, Inc. ("AZEK Inc.") and Procell Decking Inc. ("Procell Inc."), as borrowers, the Company, CPG I, Santana Products Inc. ("Santana"), CPG Sub I Corporation ("CPG Sub"), Vycom Corp. and Sanatec Sub I Corporation ("Sanatec"), as guarantors, Credit Suisse AG, Cayman Islands Branch ("Credit Suisse AG"), as administrative agent, Wells Fargo Capital Finance, LLC ("Wells Fargo Capital"), as collateral agent, and the lenders from time to time party thereto, (ii) a senior secured term loan agreement (the "New Term Loan Agreement") by and among CPG I, Scranton Inc., AZEK Inc. and Procell Inc., as borrowers, the Company, Santana, CPG Sub, Vycom Corp. and Sanatec, as guarantors, Credit Suisse AG, as administrative agent and collateral agent, and the lenders from time to time party thereto.
F-50
CPG INTERNATIONAL INC. AND SUBSIDIARIES
NOTES TO CONDENSED CONSOLIDATED FINANCIAL STATEMENTS (Continued)
7. LONG-TERM DEBT (Continued)
The proceeds from borrowings under the New Term Loan Agreement and New Revolving Credit Facility were used to repay all amounts outstanding under the Old Revolving Credit Facility and Old Term Loan Agreement. In aggregate, the Company repaid approximately $24.5 million under the Old Revolving Credit Facility and Old Term Loan Agreement.
Also on February 18, 2011, CPG I repurchased $123.4 million aggregate principal amount of the Floating Rate Notes and $122.1 million aggregate principal amount of the Fixed Rate Notes pursuant to a tender offer. The $32.5 million aggregate principal amount of the Notes that remained outstanding after the tender offer was redeemed in full on March 21, 2011. The repurchase and redemption of the Notes was funded with the proceeds of borrowings under the New Term Loan Agreement.
The Company incurred $7.4 million in consent payments, $0.7 million in prepayment premiums and $8.4 million of creditor and third party fees. Approximately $8.2 million of the fees that the Company incurred were expensed as a loss on extinguishment of debt. The New Term Loan Agreement and the New Revolving Credit Facility had an original issue discount of $1.4 million and $0.3 million, respectively.
The loss on extinguishment of debt is summarized as follows:
| (Dollars in thousands) |
March 31, 2011 |
|||
|---|---|---|---|---|
Consent Payments for the Notes |
$ | 7,223 | ||
Prepayments for the Fixed Rate Notes |
732 | |||
Write-off of deferred financing costs, premiums and discounts related to the Notes |
1,916 | |||
Fees and expenses relating to the Notes |
248 | |||
Tender Offer discount for extinguished debt |
(2,780 | ) | ||
Loss on extinguishment of debt |
$ | 7,339 | ||
The New Term Loan Agreement provides for a term loan of $285.0 million, which was drawn on February 18, 2011 and matures on February 18, 2017. The New Term Loan Agreement provides for interest on outstanding principal thereunder at a fluctuating rate, at the Company's option, at (i) the base rate (prime rate) plus a spread of 3.50% or (ii) adjusted LIBOR plus a spread of 4.50%, subject to a LIBOR floor of 1.50% or (iii) a combination thereof.
The obligations under the New Term Loan Agreement are secured by substantially all of the present and future assets of the borrowers and guarantors including equity interests of their domestic subsidiaries and 65% of the equity interests of the Company's first-tier foreign subsidiaries, subject to certain exceptions. The obligations under the New Term Loan Agreement are guaranteed by the Company and its wholly owned domestic subsidiaries other than certain immaterial subsidiaries.
The New Term Loan Agreement requires mandatory prepayments of the term loans thereunder from certain debt issuances, a percentage of certain equity issuances (subject to step-downs upon the Company achieving certain leverage ratios), certain asset dispositions (subject to certain reinvestment rights) and a percentage of excess cash flow (subject to step-downs upon the Company achieving certain leverage ratios). The borrowers are required to repay the outstanding principal under the New Term Loan Agreement in quarterly installments of $712,500 from March 31, 2011 through
F-51
CPG INTERNATIONAL INC. AND SUBSIDIARIES
NOTES TO CONDENSED CONSOLIDATED FINANCIAL STATEMENTS (Continued)
7. LONG-TERM DEBT (Continued)
December 31, 2016, with the remaining outstanding principal balance under the New Term Loan Agreement due on the maturity date, February 18, 2017.
The New Term Loan Agreement contains negative covenants that are customary for financings of this type. The New Term Loan Agreement also includes financial covenants that require the Company to maintain quarterly (i) a maximum total leverage ratio ranging from 5.75 to 1.0 for the fiscal quarter ending June 30, 2011 to 3.00 to 1.0 for the fiscal quarter ending June 30, 2016 and thereafter and (ii) a minimum interest coverage ratio of 2.50 to 1.0 for the fiscal quarters ending June 30, September 30 and December 31, 2011 and 2.75 to 1.0 for the fiscal quarter ending March 31, 2012 and thereafter.
As of March 31, 2011, the Company was in compliance with the financial and non-financial covenants imposed by the New Term Loan agreement.
The New Revolving Credit Facility matures on February 18, 2016 and provides for maximum aggregate borrowings of up to $65.0 million. The borrowers under the New Revolving Credit Facility are AZEK Inc., Procell Inc. and Scranton Inc. (AZEK Inc. and Procell Inc. on one hand and Scranton Inc. on the other hand, each a "group"). The borrowing capacity available to each group is limited by a borrowing base. For each group, the borrowing base is limited to a percentage of eligible accounts receivable and inventory, less reserves that may be established by the administrative agent in the exercise of its reasonable business judgment. As of March 31, 2011, $40.0 million was outstanding under the New Revolving Credit Facility with a letter of credit of $1.4 million held against it, and approximately $23.6 million remained available under the borrowing base for future borrowings.
The New Revolving Credit Facility provides for interest on outstanding principal thereunder at a fluctuating rate, at the Company's option, at (i) the base rate (prime rate) plus a spread of 1.25% to 1.75%, or (ii) adjusted LIBOR plus a spread of 2.25% to 2.75% or (iii) a combination thereof. The obligations under the New Revolving Credit Facility are secured by substantially all of the present and future assets of the borrowers and guarantors including equity interests of their domestic subsidiaries and 65% of the equity interests of their first-tier foreign subsidiaries, subject to certain exceptions. The obligations under the New Revolving Credit Facility are guaranteed by the Company and its wholly owned domestic subsidiaries other than certain immaterial subsidiaries.
The New Revolving Credit Facility contains negative covenants that are customary for financings of this type. The New Revolving Credit Facility also includes a financial covenant that requires the Company to maintain, when the average excess availability falls below $7.5 million, a minimum fixed charge coverage ratio (generally defined as the ratio of (a) the amount of (i) the Company's consolidated EBITDA for the 12-month period ended prior to the relevant month end, less (ii) capital expenditures made during such period, less (iii) cash taxes paid during such period, and less (iv) cash dividend and equity redemption payments to (b) the sum of all cash interest expense and certain regularly scheduled prepayments of debt made during such period) equal to at least 1.0 to 1.0, for each month until such time as the average excess availability over 90 days or 120 days (as applicable) exceeds $7.5 million.
During the three months ended March 31, 2011, the Company borrowed $40.0 million under the New Revolving Credit Facility. As of March 31, 2011, the Company was in compliance with the financial and non-financial covenants imposed by the New Revolving Credit Facility.
F-52
CPG INTERNATIONAL INC. AND SUBSIDIARIES
NOTES TO CONDENSED CONSOLIDATED FINANCIAL STATEMENTS (Continued)
8. LEASE COMMITMENTS
The Company leases machinery, computer equipment and a manufacturing facility under various capital leases. The Company also leases office equipment, vehicles, a manufacturing facility and an office under operating leases expiring during the next five years.
In connection with the consolidation of the Company's two Canadian manufacturing facilities into one facility, the Company identified certain machinery and equipment at the Canadian manufacturing facility that no longer had a useful life to the Company. The Company plans on disposing of a majority of the manufacturing equipment and has written the assets down by approximately $0.6 million. The asset write-down is included as part of operating expense in the Company's AZEK Building Product's income statement in the first quarter of 2010.
Future minimum lease payments at March 31, 2011 for capital and operating leases having non-cancelable lease terms in excess of one year are as follows:
| (Dollars in thousands) |
Capital | Operating | ||||||
|---|---|---|---|---|---|---|---|---|
2011 |
$ | 1,356 | $ | 1,241 | ||||
2012 |
949 | 1,256 | ||||||
2013 |
557 | 1,097 | ||||||
2014 |
537 | 913 | ||||||
2015 |
543 | 598 | ||||||
Thereafter |
7,774 | 576 | ||||||
Total |
11,716 | $ | 5,681 | |||||
Less amount representing interest |
(8,771 | ) | ||||||
Present value of minimum capital lease payments |
2,945 | |||||||
Less current installments of obligations under capital leases |
(1,117 | ) | ||||||
Obligations under capital leases—excluding current installments |
$ | 1,828 | ||||||
Total rent expense for the three months ended March 31, 2011 and 2010 was approximately $0.5 million and $0.4 million, respectively.
9. COMMITMENTS AND CONTINGENCIES
From time to time, the Company is subject to litigation in the ordinary course of business. Currently, there are no claims or proceedings against the Company that it believes would be expected to have a material adverse effect on the Company's business or financial condition, results of operations or cash flows.
10. RELATED PARTY TRANSACTIONS
AEA Investors, the general partner of CPG International Holdings LP ("Holdings"), the owner of 100% of the Company's common stock, is entitled to a management fee at an annual rate of $1.5 million, payable on a monthly basis pursuant to a management agreement with AEA Investors. Management fees of $0.4 million are included in selling, general and administrative expenses for each of the three month periods ended March 31, 2011 and 2010.
F-53
CPG INTERNATIONAL INC. AND SUBSIDIARIES
NOTES TO CONDENSED CONSOLIDATED FINANCIAL STATEMENTS (Continued)
10. RELATED PARTY TRANSACTIONS (Continued)
The Company leases one of its manufacturing facilities from an affiliate of an equity holder of Holdings. Total lease payments for each of the three month periods ended March 31, 2011 and 2010 were approximately $0.1 million.
In 2007, the Company entered into an amended lease agreement related to an office and manufacturing facilities location with North Alabama Property Leasing, Inc. The lessor of the property is an entity whose sole shareholder was an equity holder in Holdings through May 2010 as a result of the acquisition by the Company of Pro-Cell, LLC ("Procell") in 2007. Total lease expense for the three months ended March 31, 2010 was approximately $0.2 million. The Company has also paid storage and other fees to the lessor in the amount of approximately $8,000 for the three months ended March 31, 2010. As of March 31, 2011, the lessor is no longer a related party.
The Company also has long-term notes in the amount of approximately $14.0 million due from Holdings for the payment made on behalf of Holdings related to repurchase of ownership units in Holdings. Included in the $14.0 million is approximately $3.0 million related to the repurchase of Class A limited partnership units and Class B Units pursuant to a separation agreement with Mr. James Keisling, the former chairman of the Company's board of directors. Also included in the $14.0 million is approximately $4.0 million related to the repurchase of Class A limited partnership units pursuant to the contribution agreement with Mr. Larry Sloan, one of the sellers of Procell. Currently, no repayment schedule has been established for these notes. The notes have been classified in shareholder's equity.
The Company entered into an agreement with its Chief Executive Officer, which provided Mr. Jungbluth with a bonus payment of $0.5 million if the Company was sold within 36 months after April 2008.
F-54

Through and including , 2011 (the 25th day after the date of this prospectus), all dealers effecting transactions in these securities, whether or not participating in this offering, may be required to deliver a prospectus. This is in addition to the dealers' obligation to deliver a prospectus when acting as underwriters and with respect to their unsold allotments or subscriptions.
Shares

CPG International Inc.
Common Stock
Prospectus
, 2011
Barclays Capital
Deutsche Bank Securities
Credit Suisse
PART II
INFORMATION NOT REQUIRED IN PROSPECTUS
Item 13. Other Expenses of Issuance and Distribution.
The following table sets forth the costs and expenses to be paid by the registrant in connection with the sale of the shares of common stock being registered hereby. All amounts are estimates except for the SEC registration fee, the FINRA filing fee and the stock exchange listing fee.
ITEM
|
AMOUNT | ||||
|---|---|---|---|---|---|
SEC registration fee |
$ | 17,415 | |||
FINRA filing fee |
15,500 | ||||
Stock exchange listing fee |
* | ||||
Printing and engraving expenses |
* | ||||
Legal fees and expenses |
* | ||||
Accounting fees and expenses |
* | ||||
Blue Sky fees and expenses |
* | ||||
Transfer agent and registrar fees |
* | ||||
Miscellaneous expenses |
* | ||||
Total |
$ | * | |||
- *
- To be filed by amendment.
Item 14. Indemnification of Directors and Officers.
We are incorporated under the laws of the State of Delaware. Section 145 of the Delaware General Corporation Law, or DGCL, provides that a Delaware corporation may indemnify directors and officers as well as other employees and individuals against expenses (including attorneys' fees), judgments, fines and amounts paid in settlement in connection with specified actions, suits and proceedings, whether civil, criminal, administrative or investigative (other than action by or in the right of the corporation—a "derivative action"), if they acted in good faith and in a manner they reasonably believed to be in or not opposed to the best interests of the corporation and, with respect to any criminal action or proceeding, had no reasonable cause to believe their conduct was unlawful.
A similar standard is applicable in the case of derivative actions, except that indemnification only extends to expenses (including attorneys' fees) incurred in connection with the defense or settlement of such action, and the statute requires court approval before there can be any indemnification where the person seeking indemnification has been found liable to the corporation. The statute provides that it is not exclusive of other indemnification that may be granted by a corporation's certificate of incorporation, bylaws, disinterested director vote, stockholder vote, agreement, or otherwise.
The DGCL further authorizes a Delaware corporation to purchase and maintain insurance on behalf of any person who is or was a director, officer, employee or agent of the corporation, or is or was serving at the request of the corporation as a director, officer, employee or agent of another corporation or enterprise, against any liability asserted against him and incurred by him in any such capacity, arising out of his status as such, whether or not the corporation would otherwise have the power to indemnify him under Section 145.
Our bylaws provide for the indemnification our directors and officers to the fullest extent authorized by law. Our certificate of incorporation of provides that, to the fullest extent permitted by the DGCL, a director shall not be liable for monetary damages for breach of the director's fiduciary duty. We have purchased insurance on behalf of our directors and officers.
II-1
Item 15. Recent Sales of Unregistered Securities.
During the three years preceding the filing of this registration statement, the Registrant has not sold its securities without registration under the Securities Act.
Item 16. Exhibits and Financial Statement Schedules.
- (a)
- Exhibits
| Exhibit Number |
Description | ||
|---|---|---|---|
| 1.1 | * | Form of Underwriting Agreement. | |
2.1 |
Stock Purchase Agreement, dated as of March 12, 2005, by and among Compression Polymers Holdings LLC, as Seller, Compression Polymers Holding II LP, as Purchaser, Vycom Corp., Compression Polymers Corp. and CPCapitol Acquisition Corp. and North Keyser Partners, as the Companies (filed as Exhibit 2.1 to the Registrant's Registration Statement on Form S-4 filed on May 12, 2006 (the "Form S-4") and incorporated herein by reference). |
||
2.2 |
First Amendment to the Stock Purchase Agreement, dated as of May 5, 2005, by and among Compression Polymers Holdings LLC, as Seller, Compression Polymers Holding II LP, as Purchaser, Compression Polymers Corp., Vycom Corp. and CPCapitol Acquisition Corp., as the Companies (filed as Exhibit 2.2 to the Form S-4 and incorporated herein by reference). |
||
2.3 |
Stock Purchase Agreement, dated as of April 20, 2006, between Santana Holdings, LLC, as Seller, and Compression Polymers Holding Corporation, as Buyer (filed as Exhibit 2.3 to the Form S-4 and incorporated herein by reference). |
||
2.4 |
Unit Purchase Agreement, dated as of December 13, 2006, by and among CPG International I Inc., as Buyer, and Christopher Bardasian, Kevin Sloan, and Larry Sloan, as Sellers (filed as Exhibit 2.1 to the Registrant's Current Report on Form 8-K filed on December 13, 2006 (the "December 13, 2006 Form 8-K") and incorporated herein by reference). |
||
2.5 |
Contribution Agreement, dated as of December 13, 2006, by and among CPG International Holdings LP and Christopher Bardasian, Kevin Sloan, and Larry Sloan, as Subscribers (filed as Exhibit 2.2 to the December 13, 2006 Form 8-K and incorporated herein by reference). |
||
2.6 |
Share Purchase Agreement, dated as of February 11, 2008, by and among AZEK Canada, as Buyer, and John Scrymgeour, Cheryl Scrymgeour, Paolo Baldassarra, Mary Baldassarra, Kurt Gowman, Donna Gowman, Janet Pratt, Knox & Company International, Inc. and Creative Composite Products Inc., as Sellers, and Creative Composite Products Inc., as the Company (filed as Exhibit 2.6 to the Registrant's Annual Report on Form 10-K filed on March 31, 2008 (the "December 31, 2007 Form 10-K") and incorporated herein by reference). |
||
3.1 |
* |
Form of Amended and Restated Certificate of Incorporation of CPG International Inc. |
|
3.2 |
* |
Form of Amended and Restated By-laws of CPG International Inc. |
|
4.1 |
* |
Form of Common Stock Certificate. |
|
5.1 |
* |
Opinion of Fried, Frank, Harris, Shriver & Jacobson LLP. |
|
10.1 |
Amended and Restated Industrial Lease between North Keyser Partners, LLC and Vycom Corp., dated May 10, 2005, re: 888 North Keyser Avenue, Scranton, PA 18504 Lackawanna County (filed as Exhibit 10.3 to the Form S-4 and incorporated herein by reference). |
||
II-2
| Exhibit Number |
Description | ||
|---|---|---|---|
| 10.2 | Employment Agreement, dated as of March 3, 2008, by and among CPG International Holdings LP, CPG International Inc., CPG International I Inc., Scranton Products Inc., AZEK Building Products, Inc. and Eric Jungbluth (filed as Exhibit 10.17 to the December 31, 2007 Form 10-K and incorporated herein by reference). | ||
10.3 |
Noncompetition Agreement, dated as of March 3, 2008, by and among CPG International Holdings LP, CPG International Inc., CPG International I Inc., Scranton Products Inc., AZEK Building Products, Inc. and Eric Jungbluth (filed as Exhibit 10.18 to the December 31, 2007 Form 10-K and incorporated herein by reference). |
||
10.4 |
† |
Executive Subscription Agreement and Power of Attorney for Class B Limited Partnership Interests in CPG International Holdings LP, dated as of June 3, 2009, between CPG International Holdings LP and Eric Jungbluth. |
|
10.5 |
Amended and Restated Employment Agreement, dated as of July 1, 2008, by and among CPG International I Inc., Scranton Products Inc., AZEK Building Products, Inc. and Scott Harrison (filed as Exhibit 10.11 to the Registrant's Annual Report on Form 10-K filed on March 31, 2009 (the "December 31, 2008 Form 10-K") and incorporated herein by reference). |
||
10.6 |
Separation Agreement and Release, dated as of December 19, 2008, by and among CPG International Holdings LP, CPG International I Inc., Scranton Products Inc., AZEK Building Products, Inc., KF Equities and James Keisling (filed as Exhibit 10.12 to the December 31, 2008 Form 10-K and incorporated herein by reference). |
||
10.7 |
† |
Noncompetition Agreement, dated as of November 1, 2005, by and among Compression Polymers Holding Corporation, Vycom Corp., Compression Polymers Corp. and Scott Harrison. |
|
10.8 |
† |
Amended and Restated Employment Agreement, dated as of April 20, 2011, by and among CPG International Holdings LP, CPG International Inc., CPG International I Inc., AZEK Building Products, Inc. and Scranton Products Inc. and Donald C. Wharton. |
|
10.9 |
† |
Amended and Restated Employment Agreement, dated as of April 20, 2011, by and among CPG International Holdings LP, CPG International Inc., CPG International I Inc., AZEK Building Products, Inc. and Scranton Products Inc. and Jason Grommon. |
|
10.10 |
† |
Amended and Restated Employment Agreement, dated as of April 20, 2011, by and among CPG International Holdings LP, CPG International Inc., CPG International I Inc., AZEK Building Products, Inc. and Scranton Products Inc. and Ken Buck. |
|
10.11 |
† |
Form of Noncompetition Agreement, entered into by each of Donald C. Wharton, Jason Grommon and Ken Buck with CPG International Holdings LP, CPG International Inc., CPG International I Inc., AZEK Building Products, Inc. and Scranton Products Inc. |
|
10.12 |
Form of Subscription Agreement for Class A Limited Partnership Interests in CPG International Holdings LP (filed as Exhibit 10.1 to the Registrant's Current Report on Form 8-K filed on April 23, 2008 and incorporated herein by reference). |
||
10.13 |
Form of Executive Subscription Agreement and Power of Attorney for Class B Limited Partnership Interests in CPG International Holdings LP (filed as Exhibit 10.16 to the December 31, 2008 Form 10-K and incorporated herein by reference). |
||
10.14 |
Management Agreement, dated as of May 10, 2005, by and between Compression Polymers Holding Corporation and AEA Investors LLC (filed as Exhibit 10.10 to the Form S-4 and incorporated herein by reference). |
||
II-3
| Exhibit Number |
Description | ||
|---|---|---|---|
| 10.15 | Amendment No. 1 to Management Agreement, dated as of May 1, 2006, by and between Compression Polymers Holding Corporation and AEA Investors LLC (filed as Exhibit 10.11 to the Form S-4 and incorporated herein by reference). | ||
10.16 |
Management Rights Letter Agreement, dated as of January 31, 2007, between CPG International I Inc. and AEA Mezzanine Funding LLC and AEA Mezzanine (Unleveraged) Fund LP (filed as Exhibit 10.2 to the Registrant's Current Report on Form 8-K filed on February 2, 2007 and incorporated herein by reference). |
||
10.17 |
Form of Intercompany Note, by and between CPG International Holdings LP and AZEK Building Products, Inc. (filed as Exhibit 10.1 to the Registrant's Current Report on Form 8-K filed on April 4, 2008 and incorporated herein by reference). |
||
10.18 |
† |
Loan and Security Agreement, dated as of February 18, 2011, by and among Scranton Products Inc., AZEK Building Products, Inc. and Procell Decking Inc., as borrowers, CPG International Inc., CPG International I Inc., Santana Products Inc., CPG Sub I Corporation, Vycom Corp. and Sanatec Sub I Corporation, as guarantors, Credit Suisse AG, Cayman Islands Branch, as administrative agent, Wells Fargo Capital Finance, LLC, as collateral agent, and the lenders party thereto. |
|
10.19 |
† |
Term Loan and Security Agreement, dated as of February 18, 2011, by and among CPG International I Inc., Scranton Products Inc., AZEK Building Products, Inc. and Procell Decking Inc., as borrowers, CPG International Inc., Santana Products Inc., CPG Sub I Corporation, Vycom Corp. and Sanatec Sub I Corporation, as guarantors, Credit Suisse AG, Cayman Islands Branch, as administrative agent and collateral agent, and the lenders party thereto. |
|
10.20 |
† |
ABL/Term Loan Intercreditor Agreement, dated as of February 18, 2011, by and among CPG International I Inc., Scranton Products Inc., AZEK Building Products, Inc. and Procell Decking Inc., as borrowers, CPG International Inc., Santana Products Inc., CPG Sub I Corporation, Vycom Corp. and Sanatec Sub I Corporation, as guarantors, Wells Fargo Capital Finance, LLC, as ABL agent and Credit Suisse AG, Cayman Islands Branch, as term loan agent and control agent. |
|
10.21 |
† |
Key Manager Bonus Plan Document for CPG International Inc. |
|
16.1 |
Letter from Deloitte and Touche LLP dated April 1, 2010 to the Securities and Exchange Commission (filed as Exhibit 16.1 to the Registrant's Current Report on Form 8-K filed on April 1, 2010 and incorporated herein by reference). |
||
21.1 |
† |
List of Subsidiaries of the Registrant. |
|
23.1 |
* |
Consent of Fried, Frank, Harris, Shriver & Jacobson LLP (included in the opinion filed as Exhibit 5.1). |
|
23.2 |
** |
Consent of PricewaterhouseCoopers LLP. |
|
23.3 |
** |
Consent of Deloitte & Touche LLP. |
|
23.4 |
** |
Consent of L.E.K. Consulting LLC. |
|
24.1 |
† |
Power of Attorney. |
|
- *
- To
be filed by amendment.
- **
- Filed
herewith.
- †
- Previously filed.
II-4
The undersigned registrant hereby undertakes to provide to the underwriters at the closing specified in the underwriting agreements certificates in such denominations and registered in such names as required by the underwriters to permit prompt delivery to each purchaser.
Insofar as indemnification for liabilities arising under the Securities Act of 1933 may be permitted to directors, officers and controlling persons of the registrant pursuant to the foregoing provisions, or otherwise, the registrant has been advised that in the opinion of the Securities and Exchange Commission such indemnification is against public policy as expressed in the Securities Act and is, therefore, unenforceable. In the event that a claim for indemnification against such liabilities (other than the payment by the registrant of expenses incurred or paid by a director, officer or controlling person of the registrant in the successful defense of any action, suit or proceeding) is asserted by such director, officer or controlling person in connection with the securities being registered, the registrant will, unless in the opinion of its counsel the matter has been settled by controlling precedent, submit to a court of appropriate jurisdiction the question whether such indemnification by it is against public policy as expressed in the Securities Act and will be governed by the final adjudication of such issue.
The undersigned registrant hereby undertakes that:
(1) For purposes of determining any liability under the Securities Act of 1933, the information omitted from the form of prospectus filed as part of this registration statement in reliance upon Rule 430A and contained in a form of prospectus filed by the registrant pursuant to Rule 424(b) (1) or (4) or 497(h) under the Securities Act shall be deemed to be part of this registration statement as of the time it was declared effective.
(2) For the purpose of determining any liability under the Securities Act of 1933, each post-effective amendment that contains a form of prospectus shall be deemed to be a new registration statement relating to the securities offered therein, and the offering of such securities at that time shall be deemed to be the initial bona fide offering thereof.
II-5
Pursuant to the requirements of the Securities Act of 1933, the registrant has duly caused this amendment to the registration statement to be signed on its behalf by the undersigned, thereunto duly authorized, in the city of Scranton, Commonwealth of Pennsylvania, on the 5th day of August, 2011.
|
CPG INTERNATIONAL INC. | |||
|
By: |
/s/ SCOTT HARRISON |
||
|
Scott Harrison | |||
|
Executive Vice President, Chief Financial Officer and Treasurer | |||
Pursuant to the requirements of the Securities Act of 1933, this amendment to the registration statement has been signed below by the following persons in the capacities and on the dates indicated.
Signature
|
Title
|
Date
|
||
|---|---|---|---|---|
| * Eric K. Jungbluth |
President and Chief Executive Officer (principal executive officer) and Director | August 5, 2011 | ||
/s/ SCOTT HARRISON Scott Harrison |
Executive Vice President, Chief Financial Officer and Treasurer (principal financial officer and principal accounting officer) |
August 5, 2011 |
||
* James Andersen |
Director |
August 5, 2011 |
||
* Vincent A. Calarco |
Director |
August 5, 2011 |
||
* Stuart M. Christhilf, IV |
Director |
August 5, 2011 |
||
* John L. Garcia |
Director |
August 5, 2011 |
||
* Brian R. Hoesterey |
Chairman of the Board |
August 5, 2011 |
II-6
Signature
|
Title
|
Date
|
||
|---|---|---|---|---|
| * Vincent A. Sarni |
Director | August 5, 2011 | ||
* Julian M. Steinberg |
Director |
August 5, 2011 |
| *By: | /s/ SCOTT HARRISON Scott Harrison Attorney-in-fact |
II-7
| Exhibit Number |
Description | ||
|---|---|---|---|
| 1.1 | * | Form of Underwriting Agreement. | |
2.1 |
Stock Purchase Agreement, dated as of March 12, 2005, by and among Compression Polymers Holdings LLC, as Seller, Compression Polymers Holding II LP, as Purchaser, Vycom Corp., Compression Polymers Corp. and CPCapitol Acquisition Corp. and North Keyser Partners, as the Companies (filed as Exhibit 2.1 to the Registrant's Registration Statement on Form S-4 filed on May 12, 2006 (the "Form S-4") and incorporated herein by reference). |
||
2.2 |
First Amendment to the Stock Purchase Agreement, dated as of May 5, 2005, by and among Compression Polymers Holdings LLC, as Seller, Compression Polymers Holding II LP, as Purchaser, Compression Polymers Corp., Vycom Corp. and CPCapitol Acquisition Corp., as the Companies (filed as Exhibit 2.2 to the Form S-4 and incorporated herein by reference). |
||
2.3 |
Stock Purchase Agreement, dated as of April 20, 2006, between Santana Holdings, LLC, as Seller, and Compression Polymers Holding Corporation, as Buyer (filed as Exhibit 2.3 to the Form S-4 and incorporated herein by reference). |
||
2.4 |
Unit Purchase Agreement, dated as of December 13, 2006, by and among CPG International I Inc., as Buyer, and Christopher Bardasian, Kevin Sloan, and Larry Sloan, as Sellers (filed as Exhibit 2.1 to the Registrant's Current Report on Form 8-K filed on December 13, 2006 (the "December 13, 2006 Form 8-K") and incorporated herein by reference). |
||
2.5 |
Contribution Agreement, dated as of December 13, 2006, by and among CPG International Holdings LP and Christopher Bardasian, Kevin Sloan, and Larry Sloan, as Subscribers (filed as Exhibit 2.2 to the December 13, 2006 Form 8-K and incorporated herein by reference). |
||
2.6 |
Share Purchase Agreement, dated as of February 11, 2008, by and among AZEK Canada, as Buyer, and John Scrymgeour, Cheryl Scrymgeour, Paolo Baldassarra, Mary Baldassarra, Kurt Gowman, Donna Gowman, Janet Pratt, Knox & Company International, Inc. and Creative Composite Products Inc., as Sellers, and Creative Composite Products Inc., as the Company (filed as Exhibit 2.6 to the Registrant's Annual Report on Form 10-K filed on March 31, 2008 (the "December 31, 2007 Form 10-K") and incorporated herein by reference). |
||
3.1 |
* |
Form of Amended and Restated Certificate of Incorporation of CPG International Inc. |
|
3.2 |
* |
Form of Amended and Restated By-laws of CPG International Inc. |
|
4.1 |
* |
Form of Common Stock Certificate. |
|
5.1 |
* |
Opinion of Fried, Frank, Harris, Shriver & Jacobson LLP. |
|
10.1 |
Amended and Restated Industrial Lease between North Keyser Partners, LLC and Vycom Corp., dated May 10, 2005, re: 888 North Keyser Avenue, Scranton, PA 18504 Lackawanna County (filed as Exhibit 10.3 to the Form S-4 and incorporated herein by reference). |
||
10.2 |
Employment Agreement, dated as of March 3, 2008, by and among CPG International Holdings LP, CPG International Inc., CPG International I Inc., Scranton Products Inc., AZEK Building Products, Inc. and Eric Jungbluth (filed as Exhibit 10.17 to the December 31, 2007 Form 10-K and incorporated herein by reference). |
||
10.3 |
Noncompetition Agreement, dated as of March 3, 2008, by and among CPG International Holdings LP, CPG International Inc., CPG International I Inc., Scranton Products Inc., AZEK Building Products, Inc. and Eric Jungbluth (filed as Exhibit 10.18 to the December 31, 2007 Form 10-K and incorporated herein by reference). |
||
10.4 |
† |
Executive Subscription Agreement and Power of Attorney for Class B-2 Limited Partnership Interests in CPG International Holdings LP, dated as of June 3, 2009, between CPG International Holdings LP and Eric Jungbluth. |
|
| Exhibit Number |
Description | ||
|---|---|---|---|
10.5 |
Amended and Restated Employment Agreement, dated as of July 1, 2008, by and among CPG International I Inc., Scranton Products Inc., AZEK Building Products, Inc. and Scott Harrison (filed as Exhibit 10.11 to the Registrant's Annual Report on Form 10-K filed on March 31, 2009 (the "December 31, 2008 Form 10-K") and incorporated herein by reference). |
||
10.6 |
Separation Agreement and Release, dated as of December 19, 2008, by and among CPG International Holdings LP, CPG International I Inc., Scranton Products Inc., AZEK Building Products, Inc., KF Equities and James Keisling (filed as Exhibit 10.12 to the December 31, 2008 Form 10-K and incorporated herein by reference). |
||
10.7 |
† |
Noncompetition Agreement, dated as of November 1, 2005, by and among Compression Polymers Holding Corporation, Vycom Corp., Compression Polymers Corp. and Scott Harrison. |
|
10.8 |
† |
Amended and Restated Employment Agreement, dated as of April 20, 2011, by and among CPG International Holdings LP, CPG International Inc., CPG International I Inc., AZEK Building Products, Inc. and Scranton Products Inc. and Donald C. Wharton. |
|
10.9 |
† |
Amended and Restated Employment Agreement, dated as of April 20, 2011, by and among CPG International Holdings LP, CPG International Inc., CPG International I Inc., AZEK Building Products, Inc. and Scranton Products Inc. and Jason Grommon. |
|
10.10 |
† |
Amended and Restated Employment Agreement, dated as of April 20, 2011, by and among CPG International Holdings LP, CPG International Inc., CPG International I Inc., AZEK Building Products, Inc. and Scranton Products Inc. and Ken Buck. |
|
10.11 |
† |
Form of Noncompetition Agreement, entered into by each of Donald C. Wharton, Jason Grommon and Ken Buck with CPG International Holdings LP, CPG International Inc., CPG International I Inc., AZEK Building Products, Inc. and Scranton Products Inc. |
|
10.12 |
Form of Subscription Agreement for Class A Limited Partnership Interests in CPG International Holdings LP (filed as Exhibit 10.1 to the Registrant's Current Report on Form 8-K filed on April 23, 2008 and incorporated herein by reference). |
||
10.13 |
Form of Executive Subscription Agreement and Power of Attorney for Class B Limited Partnership Interests in CPG International Holdings LP (filed as Exhibit 10.16 to the December 31, 2008 Form 10-K and incorporated herein by reference). |
||
10.14 |
Management Agreement, dated as of May 10, 2005, by and between Compression Polymers Holding Corporation and AEA Investors LLC (filed as Exhibit 10.10 to the Form S-4 and incorporated herein by reference). |
||
10.15 |
Amendment No. 1 to Management Agreement, dated as of May 1, 2006, by and between Compression Polymers Holding Corporation and AEA Investors LLC (filed as Exhibit 10.11 to the Form S-4 and incorporated herein by reference). |
||
10.16 |
Management Rights Letter Agreement, dated as of January 31, 2007, between CPG International I Inc. and AEA Mezzanine Funding LLC and AEA Mezzanine (Unleveraged) Fund LP (filed as Exhibit 10.2 to the Registrant's Current Report on Form 8-K filed on February 2, 2007 and incorporated herein by reference). |
||
10.17 |
Form of Intercompany Note, by and between CPG International Holdings LP and AZEK Building Products, Inc. (filed as Exhibit 10.1 to the Registrant's Current Report on Form 8-K filed on April 4, 2008 and incorporated herein by reference). |
||
10.18 |
† |
Loan and Security Agreement, dated as of February 18, 2011, by and among Scranton Products Inc., AZEK Building Products, Inc. and Procell Decking Inc., as borrowers, CPG International Inc., CPG International I Inc., Santana Products Inc., CPG Sub I Corporation, Vycom Corp. and Sanatec Sub I Corporation, as guarantors, Credit Suisse AG, Cayman Islands Branch, as administrative agent, Wells Fargo Capital Finance, LLC, as collateral agent, and the lenders party thereto. |
|
| Exhibit Number |
Description | ||
|---|---|---|---|
10.19 |
† |
Term Loan and Security Agreement, dated as of February 18, 2011, by and among CPG International I Inc., Scranton Products Inc., AZEK Building Products, Inc. and Procell Decking Inc., as borrowers, CPG International Inc., Santana Products Inc., CPG Sub I Corporation, Vycom Corp. and Sanatec Sub I Corporation, as guarantors, Credit Suisse AG, Cayman Islands Branch, as administrative agent and collateral agent, and the lenders party thereto. |
|
10.20 |
† |
ABL/Term Loan Intercreditor Agreement, dated as of February 18, 2011, by and among CPG International I Inc., Scranton Products Inc., AZEK Building Products, Inc. and Procell Decking Inc., as borrowers, CPG International Inc., Santana Products Inc., CPG Sub I Corporation, Vycom Corp. and Sanatec Sub I Corporation, as guarantors, Wells Fargo Capital Finance, LLC, as ABL agent and Credit Suisse AG, Cayman Islands Branch, as term loan agent and control agent. |
|
10.21 |
† |
Key Manager Bonus Plan Document for CPG International Inc. |
|
16.1 |
Letter from Deloitte and Touche LLP dated April 1, 2010 to the Securities and Exchange Commission (filed as Exhibit 16.1 to the Registrant's Current Report on Form 8-K filed on April 1, 2010 and incorporated herein by reference). |
||
21.1 |
† |
List of Subsidiaries of the Registrant. |
|
23.1 |
* |
Consent of Fried, Frank, Harris, Shriver & Jacobson LLP (included in the opinion filed as Exhibit 5.1). |
|
23.2 |
** |
Consent of PricewaterhouseCoopers LLP. |
|
23.3 |
** |
Consent of Deloitte & Touche LLP. |
|
23.4 |
** |
Consent of L.E.K. Consulting LLC. |
|
24.1 |
† |
Power of Attorney. |
|
- *
- To
be filed by amendment.
- **
- Filed
herewith.
- †
- Previously filed.