Attached files
Table of Contents
As filed with the Securities and Exchange Commission on August 5, 2011
Registration No. 333-175126
UNITED STATES
SECURITIES AND EXCHANGE COMMISSION
Washington, D.C. 20549
Amendment No. 1
to
FORM S-1
REGISTRATION STATEMENT
Under
The Securities Act of 1933
BLUEARC CORPORATION
(Exact name of Registrant as specified in its charter)
| Delaware | 3572 | 77-0526726 | ||
| (State or other jurisdiction of incorporation or organization) | (Primary Standard Industrial Classification Code Number) | (I.R.S. Employer Identification Number) |
50 Rio Robles
San Jose, California 95134
(408) 576-6600
(Address, including zip code, and telephone number, including area code, of Registrant’s principal executive offices)
Michael B. Gustafson
President and Chief Executive Officer
BlueArc Corporation
50 Rio Robles
San Jose, California 95134
(408) 576-6600
(Address, including zip code, and telephone number, including area code, of Registrant’s principal executive offices)
Copies to:
| Michael J. Danaher, Esq. Julia Reigel, Esq. Wilson Sonsini Goodrich & Rosati Professional Corporation 650 Page Mill Road Palo Alto, California 94304 (650) 493-9300 |
Martin A. Wellington, Esq. Davis Polk & Wardwell LLP 1600 El Camino Real Menlo Park, California 94025 (650) 752-2000 |
Approximate date of commencement of proposed sale to the public: As soon as practicable after the effective date of this Registration Statement.
If any of the securities being registered on this Form are to be offered on a delayed or continuous basis pursuant to Rule 415 under the Securities Act, check the following box. ¨
If this Form is filed to register additional securities for an offering pursuant to Rule 462(b) under the Securities Act, please check the following box and list the Securities Act registration statement number of the earlier effective registration statement for the same offering. ¨
If this Form is a post-effective amendment filed pursuant to Rule 462(c) under the Securities Act, check the following box and list the Securities Act registration statement number of the earlier effective registration statement for the same offering. ¨
If this Form is a post-effective amendment filed pursuant to Rule 462(d) under the Securities Act, check the following box and list the Securities Act registration statement number of the earlier effective registration statement for the same offering. ¨
Indicate by check mark whether the registrant is a large accelerated filer, an accelerated filer, a non-accelerated filer, or a smaller reporting company. See the definitions of “large accelerated filer,” “accelerated filer” and “smaller reporting company” in Rule 12b-2 of the Exchange Act. (Check one):
| Large accelerated filer ¨ | Accelerated filer ¨ | |||
| Non-accelerated filer x | (Do not check if a smaller reporting company) | Smaller reporting company ¨ |
The Registrant hereby amends this Statement on such date or dates as may be necessary to delay its effective date until the Registrant shall file a further amendment which specifically states that this Registration Statement shall thereafter become effective in accordance with Section 8(a) of the Securities Act of 1933 or until the Registration Statement shall become effective on such date as the Commission, acting pursuant to said Section 8(a) may determine.
Table of Contents
The information in this prospectus is not complete and may be changed. We may not sell these securities until the registration statement filed with the Securities and Exchange Commission is effective. This prospectus is not an offer to sell securities and it is not soliciting an offer to buy these securities in any jurisdiction where the offer or sale is not permitted.
Subject to completion, dated August 5, 2011
shares

Common stock
This is the initial public offering of our common stock of BlueArc Corporation. We are offering shares of common stock.
Prior to this offering, there has been no public market for our common stock. We expect the initial public offering price of our common stock will be between $ and $ per share. We expect to apply to list our common stock on either The NASDAQ Global Market or The New York Stock Exchange under the symbol “BLRC.”
Investing in our common stock involves risks. See “Risk Factors ” beginning on page 12.
| Price to public | Underwriting discounts and commissions |
Proceeds to BlueArc Corporation |
||||||||||
| Per Share |
$ | $ | $ | |||||||||
| Total |
$ | $ | $ | |||||||||
|
|
||||||||||||
The underwriters have an option to purchase up to additional shares of common stock from us to cover over-allotments, if any.
Neither the Securities and Exchange Commission nor any state securities commission has approved of these securities or determined if this prospectus is truthful or complete. Any representation to the contrary is a criminal offense.
The underwriters expect to deliver the shares of common stock to purchasers on , 2011.
| J.P. Morgan | BofA Merrill Lynch | Credit Suisse | ||
| William Blair & Company | ||||
| Pacific Crest Securities | ThinkEquity LLC | |||
The date of this prospectus is , 2011.
Table of Contents
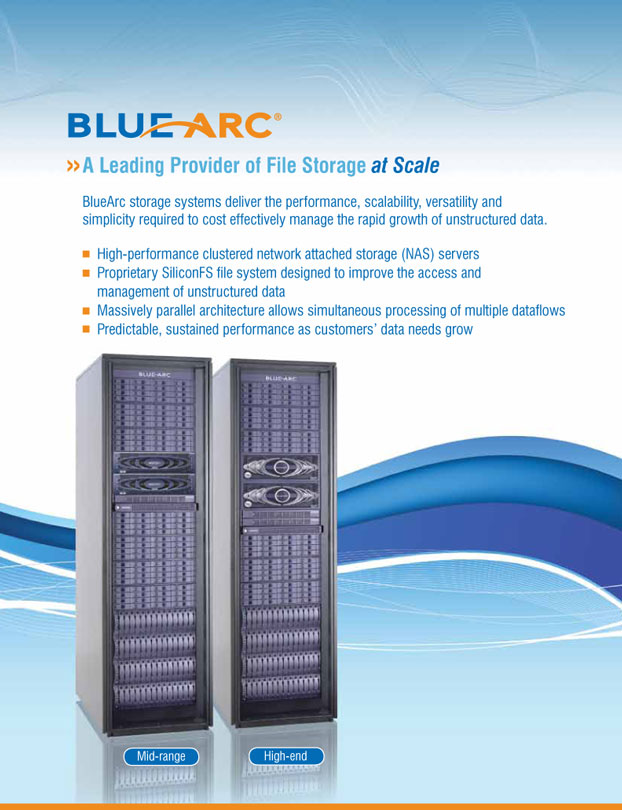
Table of Contents
| Page | ||||
| 1 | ||||
| 7 | ||||
| 9 | ||||
| 12 | ||||
| Special note regarding forward-looking statements and industry data |
40 | |||
| 41 | ||||
| 41 | ||||
| 42 | ||||
| 44 | ||||
| 46 | ||||
| Management’s discussion and analysis of financial condition and results of operations |
49 | |||
| 80 | ||||
| 101 | ||||
| 111 | ||||
| 135 | ||||
| 143 | ||||
| 146 | ||||
| 151 | ||||
| Material United States federal income tax and estate tax consequences to non-U.S. holders |
154 | |||
| 158 | ||||
| 168 | ||||
| 168 | ||||
| 168 | ||||
| F-1 | ||||
You should rely only on the information contained in this prospectus or to which we have referred you. We have not authorized anyone to provide you with information that is different. This document may only be used where it is legal to sell these securities. The information in this document may only be accurate on the date of this document.
No action is being taken in any jurisdiction outside the United States to permit a public offering of the common stock or possession or distribution of this prospectus in that jurisdiction. Persons who come into possession of this prospectus in jurisdictions outside the United States are required to inform themselves about and to observe any restrictions as to this offering and the distribution of this prospectus applicable to that jurisdiction.
-i-
Table of Contents
This summary highlights information contained elsewhere in this prospectus and does not contain all the information you should consider in making your investment decision. You should read this summary together with the more detailed information, including our consolidated financial statements and the related notes, elsewhere in this prospectus. You should carefully consider, among other things, the matters discussed in “Risk factors” beginning on page 12. Unless the context otherwise requires, we use the terms “BlueArc,” “we,” “us” and “our” in this prospectus to refer to BlueArc Corporation and its subsidiaries.
Overview
We are a leading provider of high performance, highly scalable networked storage systems for businesses of all sizes. Our storage systems deliver the levels of performance, scalability, versatility and simplicity required to cost effectively manage the rapid growth of unstructured data, such as email,business documents, web pages, digital images, audio and video, making them particularly suited for data-intensive applications such as server and desktop virtualization and cloud-based computing. Document retention and access requirements of regulatory compliance are also driving rapid growth of unstructured data. The need to manage and access unstructured data at scale has resulted in the demand for next-generation storage systems that minimize the complexities and overcome the performance limitations of existing storage systems. Our storage systems leverage our proprietary file system and flexible architecture to meet the needs of today’s most demanding applications and to manage unstructured data at scale. We enable our customers to more effectively explore, discover, research, create, process and innovate in performance sensitive and data intensive environments.
Our storage systems minimize the complexities and overcome the performance limitations of existing networked storage systems. We enable our customers to address storage bottlenecks and accelerate processes to achieve their critical business goals, such as enhanced revenue generation and improved service offerings. Our massively parallel architecture is highly scalable and delivers sustained performance under increased workloads, unlike competing storage systems. Our storage systems combine our servers with our advanced, proprietary software suite, and use standard interfaces and multiple tiers of efficient enterprise-class storage devices to provide a wide variety of system configurations to our customers. We also sell our servers independently as a gateway solution that can be deployed in storage environments to enable file services for easier data sharing, simplified management, server and desktop virtualization and improved functionality. Our storage systems are deployed throughout a wide range of organizations, from global businesses to small organizations with a single location. Our diverse customer base includes organizations in industries such as media and entertainment, electronic discovery for litigation, or e-Discovery, energy, the federal government, life sciences, Internet and cloud hosted service providers and other enterprises. As of April 30, 2011, over 750 customers worldwide have deployed over 2,000 of our storage systems.
According to IDC, an independent research firm, the network attached storage, or NAS, and Internet small computer system interface storage area network, or iSCSI SAN, markets are expected to grow from $8.1 billion in 2010 to $12.0 billion in 2014, representing a 10.2% compound annual growth rate, or CAGR. We believe that our networked storage systems address multiple end markets in light of the proliferation of unstructured data, the growing need to
-1-
Table of Contents
manage it at scale and the continuing shift to Internet Protocol networking. In addition, we believe that the Fibre Channel connectivity of our platform enables us to address the migration and transition away from Fibre Channel to next-generation storage systems that are optimized for unstructured data and file-based applications. We sell our storage systems through multiple channels; which include our direct sales force, our extensive network of channel partners and a global original equipment manufacturer, or OEM, agreement with Hitachi Data Systems Corporation, or HDS.
In fiscal 2009, fiscal 2010, fiscal 2011 and the three months ended April 30, 2011, we had total revenue of $74.2 million, $65.9 million, $85.6 million and $24.7 million, respectively. In fiscal 2009, fiscal 2010, fiscal 2011 and the three months ended April 30, 2011, we incurred net losses of $19.6 million, $15.8 million, $9.4 million and $4.3 million, respectively.
Industry background
The amount of data used by businesses of all sizes globally is growing rapidly. IDC predicts that between 2009 and 2020, the amount of digital data in customer sites will grow to 44 times what it was in 2010—growing to 35 billion terabytes. Businesses are focusing on leveraging highly scalable, high performance file systems and related storage infrastructure that seamlessly scale as they seek to organize, manage, access and analyze growing amounts of data. In recent years, unstructured data has become increasingly critical to businesses. In addition, system capabilities such as high scalability and parallel processing, once required only for specific high performance computing, or HPC, applications such as genomics, have become increasingly common for a wide variety of businesses. The growth in unstructured data, combined with advanced networking capabilities, increased disk capacities, improved computer processing capabilities and server and desktop virtualization have resulted in the need for next-generation data center technologies uniquely architected to meet the needs of today’s most demanding applications.
Key trends affecting growing data center environments
Proliferation of unstructured data. The long-term storage and management of unstructured data poses a significant challenge for businesses as the amount of unstructured data has grown exponentially, the commercial value of that data has increased and the need to store and access it for long periods continues. IDC estimates that worldwide enterprise storage capacity shipped for traditional unstructured data is expected to grow from 3,924 petabytes in 2010 to 22,930 petabytes in 2014, representing a CAGR of 55.5%. Unlike structured data, which is typically stored in databases, unstructured data is stored in file systems. The proliferation of unstructured data is driving a need for next-generation file systems and the related storage infrastructure that are high performance, flexible and scalable to manage, move, protect and deliver growing amounts of unstructured data for businesses and consumers.
Growing performance demands. Mainstream businesses and organizations are increasingly requiring high performance, highly scalable storage systems that were previously only needed for HPC environments. At the same time, the storage system requirements to support HPC applications continue to increase. Growing performance burdens on storage infrastructure also result from greater numbers of files, concurrent users, demands for faster response times, increased sharing of data and the proliferation of server and desktop virtualization.
-2-
Table of Contents
Focusing on reduced complexity and leveraging existing infrastructure. Many organizations have deployed multiple disparate storage systems over time as their data needs have grown. This has resulted in overly complex infrastructure that is difficult and expensive to manage. To address these difficulties, businesses increasingly demand solutions that provide open architectures, are highly scalable and are interoperable with their existing data center deployments, enabling them to leverage significant existing infrastructure investments.
Increasing use of virtualization technologies. Increased adoption of server and desktop virtualization technologies has resulted in data center environments with dynamic storage requirements. Server virtualization technologies enable an administrator to use a software application to divide one physical server into multiple virtual servers, enabling multiple operating systems to run simultaneously on the same computer. Desktop virtualization environments provide multiple users with desktop, processing and storage capabilities on a remote central server instead of on a local computer. Adoption of server virtualization technologies and consolidation of data center resources has resulted in independent storage resources becoming siloed. This drives demand for solutions that enable the consolidation and centralization of these siloed storage pools. Increased use of server and desktop virtualization technologies within data centers has also resulted in an exponential increase in requirements for high input output operations per second, or IOPs, to support simultaneous operations of a large number of virtual desktops, such as having multiple users log in at the same time, and highly unpredictable traffic patterns within data centers.
Accelerating adoption of cloud-based architectures. The proliferation of cloud-based architectures, or architectures that enable the delivery of hosted on-demand services over the Internet, and data has resulted in the rapid growth of large data centers that require highly scalable networked storage with centralized management. The requirements of on-demand storage in cloud-based architectures are driving the need for storage technologies that deliver high efficiency across the storage infrastructure. To increase cost efficiency, storage architectures are increasingly incorporating tiering, which automatically routes and stores data in different storage media based on administrator-defined policies. Using cloud-based storage as one tier of the architecture reduces the cost of storing data. Many existing data center deployments are not optimized for current volumes of data and traffic or for the interoperability to offload data to a cloud-based tier of storage, making them difficult to scale and operate cost effectively.
Increasing focus on minimizing total cost of ownership. To stay competitive, businesses have increasingly focused on lowering their operating costs, particularly information technology infrastructure costs. Managing information technology infrastructure costs has also become increasingly complex as the rapid adoption of applications has competed with the need to manage mixed workloads across a shared network infrastructure environment.
We believe that existing storage systems do not fully address key requirements of businesses in today’s environment because they were not originally architected to address the scale of and broad prevalence of unstructured data. Existing storage systems lack the performance and scalability to address the diversity of applications and the size of data sets that are now being generated across distributed storage resources.
Our networked storage systems
We provide industry leading storage systems that leverage our proprietary file system, SiliconFS, and flexible architecture to deliver intelligent data management functionality for our customers.
-3-
Table of Contents
Our massively parallel architecture is designed to overcome the data network bottlenecks created by existing storage systems and deliver superior performance across diverse workloads without sacrificing scalability, storage bandwidth, functionality, or overall capacity. Through our intelligent file system architecture, we enable our customers to scale their infrastructure up, or enable higher performance out of a single storage system, and scale their infrastructure out, or enable multiple servers to be deployed seamlessly across data centers to meet continually changing business and application requirements. Our intelligent file system architecture enables our customers to scale-right, or scale each of these attributes independently to their specific needs, and to run intensive data management applications seamlessly without burdening the performance of overall storage infrastructure.
Our massively parallel architecture and highly scalable storage systems leverage a combination of standard field programmable gate arrays, or FPGAs, as an offload engine for high speed data transfer and multi-core processors for intensive data management functions. This architecture, combined with SiliconFS, allows us to deliver the following benefits to customers:
Management of unstructured data at scale. Our storage systems allow for the intelligent management of applications in data intensive environments and allow our customers to add storage systems, applications and data management features seamlessly without sacrificing performance or functionality. We believe our storage systems provide the most scalable solution in our product class, with the highest performance, as measured in IOPs, storage capacity up to 16 petabytes in a single system, throughput up to 1.5 gigabytes per second and the ability to configure clusters of up to eight servers. We also enable our customers to scale each of these attributes independently, significantly reducing the potential for underutilization of resources.
Ability to reduce complexity. Our storage systems are often deployed as a consolidation platform for networked storage environments, reducing complexity and cost by eliminating excess storage systems. Our storage systems serve as an ideal platform for the consolidation of applications, such as email, databases and home directories, as well as SAN and NAS on the same storage system and allow different users, applications, protocols and performance requirements to share storage resources. Our storage systems also enable traditionally siloed pools of storage to be viewed and managed through our single cluster namespace, which enables a user to view clusters of multiple servers and file systems as if they are a single coherent unit. We architected our storage systems to be easily integrated into our customers’ data centers to simplify the integration and management of our storage systems.
Optimized for virtual environments. Our architecture is ideally suited for large scale virtualized server and desktop environments because it delivers high levels of predictable performance for unpredictable workloads. In addition, our proprietary technology provides the ability to instantly create space-efficient, writeable copies of files for use in a wide variety of environments and run multiple simulations with large-scale data sets. This allows administrators to quickly deploy many new virtual machines without consuming additional disk storage space.
Support for cloud-based environments. Our storage systems allow our customers to easily scale their storage solutions, applications and data management features without sacrificing performance, making our storage systems optimal for cloud-based environments. In addition, our customers benefit from our storage systems’ predictable performance across a variety of complex workloads such as those associated with hosted security, storage and software models. Our open
-4-
Table of Contents
architecture provides and supports interoperability with cloud-based tiers of storage, allowing customers to seamlessly offload noncritical data to locations hosted offsite in public and private clouds.
Low total cost of ownership. We believe our storage systems enable our customers to achieve higher usable capacity per server and lower overall total cost of ownership. Our customers are able to realize cost savings and higher efficiencies from using fewer servers, smaller physical data center space, less power and fewer administrators. In addition, our platform is based on our open architecture, which supports interoperability within data center environments, enabling our customers to leverage their significant investments in existing infrastructure to achieve higher returns on investment and faster payback periods.
Our strategy
Our objective is to be the leading networked storage system vendor providing solutions to solve the challenges businesses face in managing unstructured data at scale. Key elements of our strategy include:
| • | Extending our technology leadership and product breadth by leveraging our massively parallel architecture and file system; |
| • | Continuing to deepen and expand our customer relationships and vertical market penetration through leveraging our proven high performance technology and our diverse routes to market; |
| • | Continuing to expand our routes to market, including direct and channel distribution, to maximize our reach to customers; and |
| • | Broadening our technology partnerships with infrastructure vendors, application vendors and storage suppliers by leveraging our existing platform. |
Risk factors
An investment in our common stock involves a high degree of risk. You should carefully consider the risks and uncertainties described in “Risk Factors” below together with all the other information contained in this prospectus, including the following:
| • | We have a history of losses, and we may not be able to achieve or sustain consistent profitability in the future. |
| • | We must continue to expand our routes to market and maintain adequate support for our partners and customers. If we fail to do so, our revenue may suffer, our relationships with our partners could be harmed and sales of our storage systems could decline. |
| • | If we do not timely develop and introduce new products and technologies, we may be unable to grow our customer base and our business. |
| • | We have experienced rapid growth in recent periods and we may not be able to sustain or manage any future growth effectively. If we fail to manage our growth effectively, we may be unable to execute our business plan, sell our storage systems and services successfully and adequately address competitive challenges. As a result, our financial performance may suffer. |
-5-
Table of Contents
| • | We are dependent on our relationship with HDS for a substantial portion of our revenue, and any disruption in this relationship, including competition from HDS, could adversely affect our ability to sell our storage systems and achieve our revenue forecasts and we may be unable to sell excess inventory that was intended to be sold to HDS. |
| • | If we are unable to maintain or extend our relationships with our current customers, establish new customer relationships and additional strategic partners or to increase the diversification of our current customer base and strategic partners, our growth may be limited and our revenue could decline. |
| • | The market for our storage systems is highly competitive and dominated by larger companies with significantly greater resources than us. If we are unable to compete effectively, we may experience decreased sales or pricing pressure, which would adversely impact our operating results. |
Corporate information
We were founded in 1998 in Bracknell, England. In 1999, we relocated our corporate headquarters to San Jose, California and incorporated as a Delaware corporation under the name Synaxia Networks Inc. We changed our name to BlueArc Corporation in January 2001. Our principal executive offices are located at 50 Rio Robles, San Jose, California 95134. Our telephone number is (408) 576-6600. Our website address is www.bluearc.com. Information contained on, or that can be accessed through, our website is not incorporated by reference into this prospectus.
“BlueArc,” “Titan,” “Mercury,” “SiliconFS,” “JetCenter,” “JetClone,” “Data Migrator,” our logo and other trademarks or service marks of BlueArc appearing in this prospectus are the property of BlueArc Corporation. This prospectus contains additional trade names, trademarks and service marks of other companies. We do not intend our use or display of other companies’ trade names, trademarks or service marks to imply a relationship with, or endorsement or sponsorship of us by, these other companies.
-6-
Table of Contents
| Common stock offered by BlueArc |
shares |
| Over-allotment option |
shares |
| Common stock to be outstanding after this offering |
shares |
| Use of proceeds |
We intend to use the net proceeds from this offering for working capital and other general corporate purposes including research and development and the expansion of our storage systems to serve other high growth data intensive markets. We may also use part of the net proceeds to develop technology partnerships and to acquire other businesses, products or technologies. However, we do not have agreements or commitments for any specific partnerships or acquisitions at this time. |
| Proposed symbol |
BLRC |
The number of shares of our common stock to be outstanding following this offering is based on 43,366,170 shares of our common stock outstanding as of July 30, 2011, which excludes:
| • | 9,071,435 shares of common stock issuable upon exercise of options outstanding as of July 30, 2011 at a weighted average exercise price of $1.71 per share; |
| • | 749,845 shares of common stock reserved as of July 30, 2011 for future grant under our 2000 Stock Plan, or our 2000 Plan; |
| • | shares of common stock reserved for future issuance under our 2011 Equity Incentive Plan, or our 2011 Plan, that will become effective on the effective date of the registration statement of which this prospectus is a part; |
| • | 1,073,447 shares of common stock reserved for issuance upon the exercise of outstanding warrants as of July 30, 2011, at a weighted average exercise price of $2.68 per share; and |
| • | 320,393 shares of common stock reserved for issuance upon the exercise of outstanding warrants as of July 30, 2011, at a weighted average exercise price of $2.53 per share that will be net exercised for shares of common stock, based on an assumed initial public offering price of $ per share, which is the midpoint of the range of the initial public offering price listed on the cover page of this prospectus. |
Unless otherwise indicated, this prospectus reflects and assumes the following:
| • | the automatic conversion of each outstanding share of our preferred stock into one share of common stock (excluding conversion of our Series CC and Series EE preferred stock) upon the closing of the offering; |
-7-
Table of Contents
| • | the automatic conversion of each outstanding share of our Series CC preferred stock into 11.80684 shares of common stock upon the closing of the offering; |
| • | the automatic conversion of each outstanding share of our Series EE preferred stock into 1.02268 shares of common stock upon the closing of the offering; |
| • | the filing of our amended and restated certificate of incorporation and the adoption of our amended and restated bylaws immediately prior to the closing of this offering; and |
| • | no exercise of the underwriters’ over-allotment option. |
-8-
Table of Contents
Summary condensed consolidated financial data
We derived the summary condensed consolidated statements of operations data for the fiscal years ended January 31, 2009, January 30, 2010 and January 29, 2011 from our audited consolidated financial statements and related notes included elsewhere in this prospectus. The condensed consolidated statements of operations data for the three months ended May 1, 2010 and April 30, 2011 and the condensed consolidated balance sheet data as of April 30, 2011, are derived from our unaudited consolidated financial statements included elsewhere in this prospectus. The unaudited consolidated financial statements have been prepared on the same basis as the audited consolidated financial statements and include, in our opinion, all adjustments, which include only normal recurring adjustments, that we consider necessary for the fair presentation of the financial information set forth in those financial statements. Historical results are not necessarily indicative of future results. The summary of our consolidated financial data set forth below should be read together with our consolidated financial statements and the accompanying notes to those statements, as well as “Selected consolidated financial data” and “Management’s discussion and analysis of financial condition and results of operations,” appearing elsewhere in this prospectus.
| Year ended | Three months ended | |||||||||||||||||||
| January 31, 2009 |
January 30, 2010 |
January 29, 2011 |
May 1, 2010 |
April 30, 2011 |
||||||||||||||||
|
|
||||||||||||||||||||
| (unaudited) | ||||||||||||||||||||
| (in thousands, except per share data) | ||||||||||||||||||||
| Consolidated statements of operations data: |
||||||||||||||||||||
| Product revenue |
$ | 59,864 | $ | 49,523 | $ | 66,550 | $ | 14,103 | $ | 19,596 | ||||||||||
| Support revenue |
14,366 | 16,352 | 19,039 | 4,511 | 5,116 | |||||||||||||||
|
|
|
|
|
|
|
|
|
|
|
|||||||||||
| Total revenue |
74,230 | 65,875 | 85,589 | 18,614 | 24,712 | |||||||||||||||
| Cost of product revenue |
32,179 | 29,709 | 34,627 | 7,546 | 9,938 | |||||||||||||||
| Cost of support revenue |
3,483 | 4,570 | 6,184 | 1,395 | 1,815 | |||||||||||||||
|
|
|
|
|
|
|
|
|
|
|
|||||||||||
| Total cost of revenue(1) |
35,662 | 34,279 | 40,811 | 8,941 | 11,753 | |||||||||||||||
|
|
|
|
|
|
|
|
|
|
|
|||||||||||
| Gross profit |
38,568 | 31,596 | 44,778 | 9,673 | 12,959 | |||||||||||||||
|
|
|
|
|
|
|
|
|
|
|
|||||||||||
| Sales and marketing(1) |
33,759 | 28,540 | 32,068 | 7,868 | 9,327 | |||||||||||||||
| Research and development(1) |
18,274 | 13,783 | 16,410 | 3,775 | 4,966 | |||||||||||||||
| General and administrative(1) |
5,659 | 4,868 | 5,277 | 1,464 | 1,614 | |||||||||||||||
|
|
|
|
|
|
|
|
|
|
|
|||||||||||
| Total operating expenses |
57,692 | 47,191 | 53,755 | 13,107 | 15,907 | |||||||||||||||
|
|
|
|
|
|
|
|
|
|
|
|||||||||||
| Loss from operations |
(19,124 | ) | (15,595 | ) | (8,977 | ) | (3,434 | ) | (2,948 | ) | ||||||||||
| Interest income |
260 | 24 | 15 | — | 2 | |||||||||||||||
| Interest expense |
(237 | ) | (1,065 | ) | (1,317 | ) | (339 | ) | (284 | ) | ||||||||||
| Other expense, net |
(1,359 | ) | (389 | ) | (566 | ) | (136 | ) | (1,552 | ) | ||||||||||
|
|
|
|
|
|
|
|
|
|
|
|||||||||||
| Loss before income taxes |
(20,460 | ) | (17,025 | ) | (10,845 | ) | (3,909 | ) | (4,782 | ) | ||||||||||
| Benefit from income taxes |
882 | 1,272 | 1,420 | 324 | 453 | |||||||||||||||
|
|
|
|
|
|
|
|
|
|
|
|||||||||||
| Net loss |
$ | (19,578 | ) | $ | (15,753 | ) | $ | (9,425 | ) | $ | (3,585 | ) | $ | (4,329 | ) | |||||
|
|
|
|
|
|
|
|
|
|
|
|||||||||||
|
|
||||||||||||||||||||
-9-
Table of Contents
| Year ended | Three months ended | |||||||||||||||||||
| January 31, 2009 |
January 30, 2010 |
January 29, 2011 |
May 1, 2010 |
April 30, 2011 |
||||||||||||||||
|
|
||||||||||||||||||||
| (unaudited) | ||||||||||||||||||||
| (in thousands, except per share data) | ||||||||||||||||||||
| Deemed dividend on exchange of preferred stock |
— | — | (940 | ) | — | — | ||||||||||||||
| Net loss attributable to common stockholders |
$ | (19,578 | ) | $ | (15,753 | ) | $ | (10,365 | ) | $ | (3,585 | ) | $ | (4,329 | ) | |||||
|
|
|
|
|
|
|
|
|
|
|
|||||||||||
| Net loss per share attributable to common stockholders, basic and diluted |
$ | (8.74 | ) | $ | (6.55 | ) | $ | (3.54 | ) | $ | (1.47 | ) | $ | (1.25 | ) | |||||
|
|
|
|
|
|
|
|
|
|
|
|||||||||||
| Shares used in computing net loss per share attributable to common stockholders, basic and diluted |
2,241 | 2,404 | 2,930 | 2,438 | 3,465 | |||||||||||||||
|
|
|
|
|
|
|
|
|
|
|
|||||||||||
| Pro forma net loss per share, basic and diluted (unaudited)(2) |
$ | (0.24 | ) | $ | (0.06 | ) | ||||||||||||||
|
|
|
|
|
|
|
|
|
|
|
|||||||||||
| Shares used in computing pro forma net loss per share attributable to common stockholders, basic and diluted (unaudited)(2) |
39,363 | 43,284 | ||||||||||||||||||
|
|
|
|
|
|
|
|
|
|
|
|||||||||||
| Year ended | Three months ended | |||||||||||||||||||
| January 31, 2009 |
January 30, 2010 |
January 29, 2011 |
May 1, 2010 |
April 30, 2011 |
||||||||||||||||
| (in thousands, unaudited) | ||||||||||||||||||||
| Other financial data: |
||||||||||||||||||||
| Adjusted EBITDA(3) |
$ | (14,875 | ) | $ | (10,739 | ) | $ | (5,146 | ) | $ | (2,514 | ) | $ | (1,546 | ) | |||||
|
|
|
|
|
|
|
|
|
|
|
|||||||||||
| As of April 30, 2011 | ||||||||||||
| Actual | Pro forma(4) | Pro forma as adjusted(5)(6) |
||||||||||
|
|
||||||||||||
| (in thousands, unaudited) | ||||||||||||
| Consolidated balance sheet data: |
||||||||||||
| Cash and cash equivalents |
$ | 16,084 | $ | 16,084 | $ | |||||||
| Working capital |
12,187 | 12,187 | ||||||||||
| Total assets |
57,646 | 57,646 | ||||||||||
| Total debt and capital lease obligations |
7,481 | 7,481 | ||||||||||
| Total liabilities |
48,022 | 44,420 | ||||||||||
| Convertible preferred stock |
121,699 | — | ||||||||||
| Common stock and additional paid-in-capital |
117,094 | 242,395 | ||||||||||
| Total stockholders’ equity (deficit) |
(112,075 | ) | 13,226 | |||||||||
|
|
||||||||||||
| (1) | Includes stock-based compensation expense as follows: |
| Year ended | Three months ended | |||||||||||||||||||
| January 31, 2009 |
January 30, 2010 |
January 29, 2011 |
May 1, 2010 |
April 30, 2011 |
||||||||||||||||
|
|
||||||||||||||||||||
| (unaudited) | ||||||||||||||||||||
| (in thousands) | ||||||||||||||||||||
| Cost of revenue |
$ | 51 | $ | 67 | $ | 44 | $ | 9 | $ | 11 | ||||||||||
| Sales and marketing |
498 | 610 | 476 | 86 | 116 | |||||||||||||||
| Research and development |
282 | 366 | 254 | 69 | 62 | |||||||||||||||
| General and administrative |
387 | 366 | 343 | 115 | 132 | |||||||||||||||
|
|
|
|
|
|
|
|
|
|
|
|||||||||||
| Total stock-based compensation expense |
$ | 1,218 | $ | 1,409 | $ | 1,117 | $ | 279 | $ | 321 | ||||||||||
|
|
|
|
|
|
|
|
|
|
|
|||||||||||
|
|
||||||||||||||||||||
| (2) | Pro forma weighted average shares outstanding reflects the conversion of our convertible preferred stock (using the if-converted method) into common stock as though the conversion had occurred at the beginning of the period or original date of issuance, if later. |
-10-
Table of Contents
| (3) | We present Adjusted EBITDA, which we define as net loss excluding: |
| • | benefit from income taxes; |
| • | other income (expense), net; |
| • | interest expense; |
| • | interest income; |
| • | stock-based compensation; and |
| • | depreciation and amortization. |
Adjusted EBITDA is a financial measure that is not calculated in accordance with generally accepted accounting principles, or GAAP. We exclude other income (expense), net from Adjusted EBITDA as it largely consists of mark to market and other expenses related to our warrants and foreign currency gain or losses. Gains from nonrecurring engineering projects included in other income (expense), net are all excluded from other income (expense), net when calculating Adjusted EBITDA. We have provided a reconciliation of Adjusted EBITDA, a non-GAAP financial measure, to net loss, the most directly comparable financial measure calculated and presented in accordance with GAAP. Adjusted EBITDA should not be considered as an alternative to net loss, operating income or any other measure of financial performance calculated and presented in accordance with GAAP. Our Adjusted EBITDA may not be comparable to similarly titled measures of other organizations because other organizations may not calculate Adjusted EBITDA in the same manner as we do. We have included Adjusted EBITDA in this prospectus because it is a basis upon which our management assesses financial performance and it eliminates the impact of items that we do not consider indicative of our core operating performance. In evaluating Adjusted EBITDA, you should be aware that in the future we will incur expenses similar to the adjustments in this presentation. Our presentation of Adjusted EBITDA should not be construed as an inference that our future results will be unaffected by these expenses or any unusual or nonrecurring items.
We reconcile net loss to Adjusted EBITDA as follows:
| Year ended | Three months ended | |||||||||||||||||||
| January 31, 2009 |
January 30, 2010 |
January 29, 2011 |
May 1, 2010 |
April 30, 2010 |
||||||||||||||||
|
|
||||||||||||||||||||
| (in thousands, unaudited) | ||||||||||||||||||||
| Net loss |
$ | (19,578 | ) | $ | (15,753 | ) | $ | (9,425 | ) | $ | (3,585 | ) | $ | (4,329 | ) | |||||
| Benefit from income taxes |
(882 | ) | (1,272 | ) | (1,420 | ) | (324 | ) | (453 | ) | ||||||||||
| Other expense, net |
1,359 | 389 | 566 | 136 | 1,832 | |||||||||||||||
| Interest expense |
237 | 1,065 | 1,317 | 339 | 284 | |||||||||||||||
| Interest income |
(260 | ) | (24 | ) | (15 | ) | — | (2 | ) | |||||||||||
| Stock-based compensation |
1,218 | 1,409 | 1,117 | 279 | 321 | |||||||||||||||
| Depreciation and amortization |
3,031 | 3,447 | 2,714 | 641 | 801 | |||||||||||||||
|
|
|
|
|
|
|
|
|
|
|
|||||||||||
| Adjusted EBITDA |
$ | (14,875 | ) | $ | (10,739 | ) | $ | (5,146 | ) | $ | (2,514 | ) | $ | (1,546 | ) | |||||
|
|
|
|
|
|
|
|
|
|
|
|||||||||||
|
|
||||||||||||||||||||
| (4) | The pro forma consolidated balance sheet data in the table above gives effect to the automatic conversion of all of our outstanding convertible preferred stock into common stock upon the closing of this offering, assuming that our Series CC preferred stock converts at a ratio of one for 11.80684 and our Series EE preferred stock converts at a ratio of one for 1.02268. In addition, it assumes the reclassification of the convertible preferred stock warrant liability to additional paid-in capital. |
| (5) | The pro forma as adjusted consolidated balance sheet data in the table above gives effect to our receipt of the estimated net proceeds from this offering at an assumed initial public offering price of $ per share, after deducting underwriting discounts and commission and estimated offering expenses payable by us. |
| (6) | A $1.00 increase (decrease) in the assumed initial public offering price of $ per share of our common stock in this offering would increase (decrease) each of cash and cash equivalents, working capital, total assets and total stockholders’ equity (deficit) by $ , assuming the number of shares offered by us, as set forth on the cover page of this prospectus, remains the same, and after deducting underwriting discounts and commissions and estimated offering expenses payable by us. |
-11-
Table of Contents
An investment in our common stock involves a high degree of risk. You should carefully consider the risks and uncertainties described below together with all the other information contained in this prospectus, including our consolidated financial statements and the related notes, before deciding whether to invest.
Risks related to our business and industry
We have a history of losses, and we may not be able to achieve or sustain consistent profitability in the future.
Since our formation, we have recorded a net loss in every fiscal year and we expect to continue to record net losses. We had a net loss of $9.4 million in fiscal 2011 and $4.3 million in the three months ended April 30, 2011. As of April 30, 2011, our accumulated deficit was $230.3 million. We anticipate spending significantly to develop our storage systems and expand our business, including expenditures for additional personnel in sales and marketing and research and development. As a public company, we will also incur significant legal, accounting and other expenses as a result of regulatory requirements that did not apply to us as a private company. We may encounter unforeseen difficulties, complications and delays and other unknown factors that require additional expenditures. Due to these increased expenditures, we will have to generate and sustain substantially higher revenue in order to achieve and maintain profitability. Our revenue growth trend since the first quarter of fiscal 2010 may not be sustainable, and we may not generate revenue in excess of our anticipated expenditures to achieve or maintain profitability. Failure to achieve and sustain consistent profitability may require us to raise additional capital, which may not be available on terms acceptable to us, or at all. In addition, our expense levels are based in part on our expectations as to future sales and a significant percentage of our expenses are fixed. If sales are below expectations, our operating expenses would be disproportionately high relative to revenue, which would adversely impact our ability to become profitable. Although we achieved Adjusted EBITDA profitability during the three months ended January 29, 2011, we expect that our Adjusted EBITDA will continue to be negative on a quarterly basis.
We must continue to expand our routes to market and maintain adequate support for our partners and customers. If we fail to do so, our revenue may suffer, our relationships with our partners could be harmed and sales of our storage systems could decline.
We may not continue to experience revenue growth unless we gain market share by expanding our routes to market, including our relationships with OEMs, value added resellers, or VARs, and other distribution partners, as well as our internal sales force. Expanding our relationships with new OEMs, VARs and other distribution partners requires significant time and resources from many of our key personnel. Expanding our internal sales force is a lengthy process that involves substantial training of new sales personnel and competing with our competitors for qualified talent. If we are not successful in expanding our routes to market, our ability to generate future growth could be impaired. In addition, we may be unsuccessful in establishing these new relationships or hiring new sales personnel if our competitors offer incentives or other terms that we are unable to match or exceed. Consequently, our revenue could suffer, our relationships with our existing OEM partner, VARs and other distribution partners could be harmed and our ability to adequately grow or retain our internal sales force could be impaired.
-12-
Table of Contents
We must also continue to scale and improve our processes and procedures that support our partners and sales personnel, including investments in systems and training. These processes and procedures may become increasingly complex and difficult to manage. If we fail to adequately develop these processes and procedures, our partners and sales personnel may not adequately market and sell our storage systems or accurately educate our potential customers regarding the benefits of our storage systems.
If we do not timely develop and introduce new products and technologies, we may be unable to grow our customer base and our business.
We must timely develop and introduce new products and technologies that allow us to increase our business with our existing customers, broaden our customer base and expand our business both domestically and internationally. We must also deepen our relationships with our existing customers by penetrating their organizations more deeply with our existing products. Successful marketing and selling of our storage systems depends on us identifying appropriate customers, educating them about the benefits of our storage systems and overcoming any concerns they may have about working with a small, independent storage system vendor with whom they may not have a business relationship. If our storage systems do not continue to achieve market adoption, our ability to grow our business will be materially and adversely affected.
If we are unable to establish and maintain relationships with strategic partners, our revenue could decline and we could lose customers.
One of our key strategies is to partner with major third party software and hardware vendors to integrate our storage systems into their products and also co-market our storage systems with the vendors. We have significant partner relationships with database, business application, backup management and server virtualization companies, including VMware, Inc. A number of these strategic partners are industry leaders that offer us expanded access to segments of the storage and data management market. There is intense competition for strategic partners, and even if we can establish relationships with these or other partners, these partnerships may not generate significant revenue or may not continue to be in effect for any specific period of time. If these relationships are not maintained or fail to materialize as expected, our revenue could be adversely affected and we could suffer delays in product development or experience other operational difficulties.
Our contracts with our partners do not prohibit them from offering products or services that compete with ours. These partners may choose to discontinue offering our storage systems and services or may not devote sufficient attention and resources to selling our storage systems and services. Our competitors may provide more favorable terms or more lucrative sales incentives to our existing and potential partners to use or purchase their products and services or to prevent or reduce sales of our storage systems and services. If our distribution and strategic partners do not effectively promote and sell our storage systems or if we lose the services of certain of our key distribution and strategic partners, we would have to develop additional relationships with other third parties or devote more resources to directly marketing and selling our storage systems, either of which could reduce our revenue or cause us to lose customers.
-13-
Table of Contents
We have experienced rapid growth in recent periods and we may not be able to sustain or manage any future growth effectively. If we fail to manage our growth effectively, we may be unable to execute our business plan, sell our storage systems and services successfully and adequately address competitive challenges. As a result, our financial performance may suffer.
In recent periods we have significantly expanded the size and scope of our business, and our future operating results depend to a large extent on our ability to successfully manage any future expansion and growth. Continued growth in our business will place significant demands on our managerial, administrative, operational, financial and other resources. Successful management of any future growth will require substantial management attention with respect to, among other things:
| • | recruiting, hiring, integrating and retaining highly skilled and motivated individuals, including research and development and sales personnel; |
| • | maintaining and expanding our indirect sales channels and educating and supporting the sales forces of those channel partners; |
| • | expanding and broadening product development processes; |
| • | accurately forecasting revenue and controlling costs; |
| • | enhancing and expanding our infrastructure; |
| • | managing inventory levels; |
| • | expanding our international operations and managing increasingly dispersed geographic locations and facilities; and |
| • | implementing and improving our company-wide processes and procedures to address human resource, financial reporting and financial management matters. |
If we are unable to execute our growth strategy effectively or to manage any future growth we may experience, we may not be able to take advantage of market opportunities, execute our business plan or remain competitive. In addition, our failure to effectively sustain or manage any future growth we do experience could result in a reduction of revenue, an inability to maintain customer relationships or attract new customers and our business and financial results could be materially and adversely affected.
We are dependent on our relationship with HDS for a substantial portion of our revenue, and any disruption in this relationship could adversely affect our ability to sell our storage systems and achieve our revenue forecasts and we may be unable to sell excess inventory that was intended to be sold to HDS.
We sell our SiliconFS file system and license additional software applications to HDS, which resells them in combination with its storage arrays. HDS accounted for 22%, 30%, 41% and 45% of our revenue in fiscal 2009, fiscal 2010, fiscal 2011 and the three months ended April 30, 2011, respectively. Although we have experienced high rates of growth from HDS in recent periods, we do not expect the rate of revenue growth to continue at the level we experienced in fiscal 2011 and the three months ended April 30, 2011. We expect that our relationship with HDS will continue to account for a substantial portion of our revenue for the foreseeable future. We rely upon HDS’ sales force to continue to prioritize the sale of the HDS products into which our SiliconFS file system is incorporated. HDS’ sales personnel may decide to focus on selling other HDS products due to changes in sales incentives, the lengthy sales cycle for our products or HDS
-14-
Table of Contents
internal directives to push other products into the market. If these sales personnel reduced their efforts to actively sell the storage systems containing our SiliconFS file system, our revenue would decline and our relationship with HDS and our operating results could be negatively affected. Although our OEM agreement with HDS has one-year automatic renewals of its term, either party can terminate the agreement for any reason by providing the other party with written notice at least 60 days prior to the end of the next renewal period, which for the current term is in July 2013. A termination of our agreement with HDS, decreased purchases by HDS, whether under the OEM agreement or otherwise, or any other disruption in our relationship with HDS, could adversely affect our ability to sell our storage systems and achieve our revenue forecasts.
After September 30, 2011, HDS will no longer have any minimum purchase commitments under the OEM agreement. Although HDS has agreed to provide us with rolling forecasts of potential orders under the agreement, the forecasts are nonbinding. The nonbinding nature of the forecasts and the elimination of HDS’ minimum purchase obligations may make it difficult for us to accurately predict HDS sales of our products during any given period. Our long lead time for manufacturing, coupled with this uncertainty in predicting the requirements of HDS, could result in an inventory shortage and force us to make difficult decisions regarding the allocation of our available inventory among HDS and our other customers. If we are unable to fully satisfy purchase orders of HDS on a timely basis, our relationship with HDS could be damaged. Alternatively, if we overestimate the number of units that HDS may purchase in any period, we could have an excess inventory of products that we may or may not be able to sell to other customers.
If HDS began competing in our markets or engaging our customers, our sales to HDS and to our direct customers could suffer and prices for our products may decline.
Our agreement with HDS does not prohibit us or HDS from competing in each other’s respective markets or from approaching the other party’s customer prospects for future business. If we and HDS engage with the same customers, there may be customer confusion and prices for our products may decline due to competition between us and HDS. Although we support HDS’ selling activities, we and HDS do not coordinate our sales and channel conflicts may arise. In addition, if HDS or another OEM partner required us to allow them to rebrand or sell our storage systems as white box storage systems, we may not build the brand recognition we need to grow our business because customers purchasing these storage systems may not realize they are storage systems we developed and sell independently.
Our agreement does not preclude HDS or its affiliates from developing competing products or technologies internally and focusing the activities of its sales force on selling and marketing those internal products and technologies. HDS currently has internally developed NAS storage systems in its product portfolio that do not address the same markets as our storage systems. In the future HDS or its affiliates may enhance these existing storage systems or develop new storage systems or technologies to directly compete with our storage systems. If HDS or its affiliates were to do so, HDS may opt to reduce or eliminate purchases from us in order to promote its internally developed solution, regardless of the relative quality or functionality of its solutions compared to ours, which would cause our sales to HDS and to our direct customers to suffer.
If we are unable to maintain or extend our relationships with our current customers, establish new customer relationships or to increase the diversification of our current customer base, our growth may be limited and our revenue could decline.
We have historically derived a large percentage of our revenue from repeat sales to our existing customers. We may be unable to secure future orders from these customers as they build out
-15-
Table of Contents
their storage networks and, even if we do, our current customers may reach saturation once they complete their storage networks. We cannot provide any assurance that we will be able to sustain our revenue from our existing customers. Our customers typically buy storage systems on a purchase order basis and do not enter into long-term contracts or minimum purchase commitments that would obligate them to continue to buy additional storage systems or services from us in the future. Although we continuously seek to grow our customer base through the addition of new customers, there is no assurance that we will be successful in doing so. If we are unable to generate repeat business from our existing customers or to generate revenue from new customers or expand into broader enterprise markets, we may be unable to maintain or expand our growth and our sales would be adversely affected.
Our operating results may fluctuate significantly as a result of factors that may be outside of our control, which may make it difficult to rely on our quarterly comparisons as an indicator of future performance.
Our operating results may fluctuate due to a variety of factors, many of which are outside of our control. As a result, comparing our operating results on a period to period basis may not be meaningful. You should not rely on our past results as an indication of our future performance. Our sales cycles can be long and unpredictable and our sales efforts require substantial time and expense. Our revenue is difficult to predict and may vary substantially from quarter to quarter, which may cause our operating results to fluctuate significantly. We ship the vast majority of our storage systems in the same quarter in which they are ordered, and as a result do not enter new quarters with any significant backlog. Our revenue each quarter depends on our ability to receive purchase orders and ship our products in that quarter. In addition, a significant percentage of our sales typically occurs near the end of the quarter. Small delays in receipt of purchase orders and shipment of products could result in our failure to achieve our internal forecasts or stock market expectations. Our customers also often purchase our storage systems as part of larger storage installations and the timing of negotiations for those purchases may cause the timing of our orders with customers to fluctuate. In addition, some of the orders we receive may include conditions, such as customer acceptance criteria, in which case we cannot immediately recognize revenue for those orders, if at all. These conditions make it difficult to determine when orders will translate to revenue and to accurately predict future operating results. If our revenue or operating results fall below the expectations of investors or the securities analysts that follow us, the price of our common stock may decline.
In any quarter, our revenue may be largely attributable to the timing of our customers’ orders. We expect our gross margins to fluctuate over time depending on product configuration and channel mix shifts, as well as quarter to quarter volatility caused by large implementations of our storage systems. For these reasons, comparisons of our operating results on a period to period basis may not be meaningful. You should not rely on our past results as an indication of our future performance.
Factors that are difficult to predict and that may affect our operating results include:
| • | the timing and magnitude of shipments of our storage systems in each quarter; |
| • | the gain or loss of one or more of our significant customers; |
| • | reductions in customers’ budgets for storage system purchases or delays in their purchasing cycles; |
-16-
Table of Contents
| • | our ability to timely develop new technologies, products and enhancements that meet customer requirements; |
| • | deferments of customer storage system purchases in anticipation of new products or updates from us or our competitors or products used in combination with ours; |
| • | production delays as a result of manufacturing or supplier capacity or quality issues; |
| • | the extent to which and the timing of when our customers renew their support contracts with us; |
| • | increases in the costs or lack of availability of the components we use in our storage systems; |
| • | the timing of product releases or upgrades or announcements by us or our competitors; |
| • | unanticipated warranty expenses or charges for excess or obsolete inventory; |
| • | fluctuations in demand and prices for our storage systems; |
| • | changes in industry standards in the storage industry; |
| • | any change in the competitive landscape of our industry, including further consolidation or the entrance of new competitors; |
| • | general economic conditions in the markets in which we operate; and |
| • | other factors outside our control. |
Our sales cycles can be long and unpredictable, and our sales efforts often require a substantial amount of time and expenses. As a result, the timing of our sales is difficult to predict and could vary substantially from quarter to quarter, which may cause our operating results to fluctuate significantly.
Our sales efforts involve educating our current and prospective customers about the use and benefits of our storage systems, including their technical merits and potential cost savings to the customers as compared to storage solutions currently used by them or other storage solutions that are available. Customers often undertake a significant evaluation and testing process that can result in a lengthy sales cycle that typically averages six months, but has, in some cases, exceeded 12 months. We spend substantial time and resources on our sales efforts without any assurance that our efforts will produce any sales. In addition, purchases by our current and prospective customers are frequently subject to budget constraints, multiple approvals and a variety of unpredictable administrative, processing and other delays. Purchases of our storage systems may also occur in connection with a larger data center scale out. The effect of these factors tends to be magnified even greater in the case of large orders.
Our sales to HDS can also involve a substantial amount of time. HDS incorporates our solutions into its products, which can require a lengthy evaluation and testing process before our product is approved for inclusion in one of its storage systems. From time to time HDS may also require us to customize our SiliconFS file systems and related software to ensure that they interoperate with new products or product enhancements of HDS. This customization process could lengthen our normal sales cycle and make us vulnerable to the risk of delays if we encounter manufacturing or supplier capacity issues. Sales cycles to customers of HDS may be longer than our normal sales cycle because our product may be a part of a larger storage solution. Our extended sales cycle with HDS’ customers makes us vulnerable to the risk of delays or termination of orders if the end
-17-
Table of Contents
customers decide to delay or withdraw their purchases, which could occur for various reasons, including global economic cycles and capital market fluctuations. These delays or termination of orders could negatively impact the revenue we realize from sales to HDS.
Our lengthy and uncertain sales cycles make it difficult for us to predict when customers may purchase and accept products from us, may prevent us from recognizing revenue in a particular quarter and ultimately may not produce any sales. As a result, our operating results may vary significantly from quarter to quarter.
The market for our storage systems is highly competitive and dominated by larger companies with significantly greater resources than us. If we are unable to compete effectively, we may experience decreased sales or pricing pressure, which would adversely impact our operating results.
The market for our storage systems is highly competitive and we expect competition to intensify in the future. Currently, we face competition from a number of established companies, including EMC Corporation, or EMC, Hewlett Packard Company, or HP, International Business Machines Corporation, or IBM, and NetApp, Inc., or NetApp. We also face competition from smaller, privately held companies and could face competition from new market entrants, whether from new ventures or from established companies moving into our industry. We also compete against internally developed storage systems as well as combined third party software and hardware systems. A number of new, privately held companies are currently attempting to enter our market, some of which may become significant competitors in the future. All of our well established competitors, as well as some of our other current and potential competitors, have longer operating histories, greater brand awareness, more employees, a larger customer base, more established customer relationships and significantly greater financial, technical, sales, marketing and other resources than we have. As a result of their established presence in the industry, some of our competitors have substantial control and influence over future trends in the industry, including acceptance of a particular industry standard or competing technology. In addition, many of our competitors benefit from long-standing relationships with key decision makers at many of our current and prospective customers. Our competitors may be able to leverage these existing relationships to persuade our current and potential customers to purchase our competitors’ products, regardless of the performance or features of our storage systems. Our competitors may also be able to devote greater resources to the development, promotion and sale of products, which could allow them to introduce new technologies and products to the market faster than we can.
Because many of our competitors have greater resources than we do and are able to offer a more diversified and comprehensive bundle of products and services, these competitors may be able to adopt more aggressive pricing policies than we can adopt, through which they could deliver competitive products or technologies at a lower price than our storage systems. If our competitors are able to undercut our prices, we may be unable to remain competitive in the industry or be forced to reduce our selling prices. This could result in reduced gross margins, increased sales and marketing expenses or our failure to increase, or our loss of, market share, any of which could seriously harm our business, operating results and financial condition.
Our ability to compete effectively depends on a number of factors, including:
| • | our ability to effectively respond to aggressive business tactics by our competitors, including selling at a discount or asserting intellectual property rights irrespective of the validity of the claims; |
-18-
Table of Contents
| • | our storage systems’ scalability, performance, quality, ease of use and cost effectiveness relative to that of our competitors’ products; |
| • | our storage systems’ interoperability with various operating systems, software applications, data access protocols and other storage systems; |
| • | our success in developing and using new and proprietary technologies to offer products and features previously not available in the marketplace; |
| • | our ability to attract and retain other VARs and OEMs; |
| • | our success in identifying new markets, applications and technologies; |
| • | our ability to continue to establish greater name recognition and build upon our reputation in the industry; |
| • | our ability to recruit and retain development engineers and sales and marketing personnel; and |
| • | our ability to protect our intellectual property. |
We may not be able to address one or more of the factors listed above, which could hurt our ability to effectively compete in our industry and adversely affect our operating results and financial condition.
Consolidation in the storage industry has increased the competitive pressures that we face and could materially and adversely affect our prices, our revenue and our ability to achieve profitability.
The storage industry has consolidated over the past several years as the result of a series of acquisitions, including recent acquisitions by EMC, HP and IBM. For example, Isilon Systems, Inc. was acquired by EMC in December 2010, 3Par Inc. was acquired by HP in September 2010 and Data Domain, Inc. was acquired by EMC in July 2009. The consolidation in the storage industry has resulted in a few large companies controlling a substantial portion of the market share, which may make it difficult for us to compete effectively. These large competitors may seek to further consolidate the industry by acquiring components, technologies and resources of suppliers in the industry, which may make it difficult for us to obtain components for our storage systems at competitive prices or in sufficient quantities. For example, NetApp recently acquired Engenio, the external storage systems business of LSI Corporation, which is one of our component suppliers. Although we historically competed with targeted sales forces of independent competitors, we now compete with the larger sales forces of integrated storage providers. In addition, current and potential competitors have established, or may establish, strategic alliances among themselves or with third parties, including some of our partners. Through these alliances our competitors could acquire additional market share and further strengthen their positions in the industry. Continued consolidation of our industry or establishment of strategic alliances by our competitors could increase the competitive pressures that we face and materially and adversely affect our prices, our revenue and our ability to achieve profitability.
If we are unsuccessful in developing and selling new storage systems, services and product enhancements that achieve market acceptance, our ability to attract and retain customers could be impaired, our competitive position could be harmed and our revenue could be reduced.
We compete in a market characterized by rapid technological change, frequent new product introductions, evolving industry standards and changing customer needs. Improvements in
-19-
Table of Contents
existing technologies and applications, including desktop and server virtualization, to accelerate storage performance or reduce storage costs may reduce the need for our storage systems. Improvements in other emerging technologies, other application protocols or network protocols such as the Transmission Control Protocol could have a similar effect. Our future growth depends on our ability to anticipate future market needs and to successfully design, develop, market and sell new file systems and software products that provide increasingly higher levels of performance, functionality, capacity and reliability and that meet the cost expectations of our customers. Developing our storage systems is expensive and the investment in product development may involve a long payback cycle. In fiscal 2009, fiscal 2010, fiscal 2011 and the three months ended April 30, 2011, our research and development expenses were $18.3 million, $13.8 million, $16.4 million and $5.0 million, respectively. We believe that we must continue to dedicate a significant amount of resources to our research and development efforts to maintain and extend our competitive position.
Due to the complexity of storage systems, the new storage systems that we develop are subject to significant technical risks that may impact our ability to introduce these storage systems successfully. Our new storage systems must address technological changes and evolving industry standards and may not achieve market acceptance. In addition, in the event that new storage systems require features for which we have not developed or otherwise acquired technology, we will be required to develop or obtain such technology through purchase, license or other arrangements. If the required technology is not available on commercially reasonable terms, or at all, we may incur additional expenses in an effort to internally develop the required technology.
Despite our efforts to develop new and successful storage systems and technologies, our competitors, many of whom have greater financial and engineering resources than we do, may be able to introduce new storage systems or develop new technologies more quickly than we can. If our investments in our research and development do not provide the desired returns in a timely manner or if the new storage systems and technologies we develop do not achieve market acceptance, our ability to attract and retain customers could be impaired, our competitive position could be harmed and our revenue could be reduced.
If we are unable to reduce or adequately control our total costs of revenue, our gross margins could decrease and we may be unable to achieve profitability.
If we are unable to reduce or maintain a sufficiently low level of costs for manufacturing and selling our storage systems relative to their selling prices, our operating results, gross margins and business could be materially and adversely impacted. The largest component of our cost of product revenue is disk drives and disk arrays that we integrate into and sell with our storage systems. We have made, and will be required to make, significant efforts to reduce the cost of products, including but not limited to disk drives and disk arrays. The consolidation that has occurred among suppliers of a variety of components, including but not limited to disk drives, makes it difficult for us to control the cost of the components we use in our storage systems. As compared to our larger competitors, we typically do not purchase a sufficiently high volume of components to obtain the discounts that our larger competitors are often able to obtain from their component suppliers. Some of our larger competitors, such as NetApp, have also acquired component suppliers, which provides them with advantages in obtaining lower cost components and may negatively affect our ability to reduce our cost of product revenue as we will be negotiating pricing with our competitors. We expect this consolidation of the component suppliers to continue in the future. Further consolidation would continue to make it difficult for
-20-
Table of Contents
us to reduce or control the costs of manufacturing our storage systems due to a lack of alternative suppliers.
If the average selling prices of our storage systems decrease, our revenue and gross margins could decline.
We anticipate that we will be forced to make price reductions in the future. Because of the resources available to many of our large, established competitors, reductions in average selling prices throughout our industry could have a more adverse effect on our business than on the business of these large competitors. In addition, if we decide to target the lower end of our market, we may sell our storage systems at prices that are lower than those of our storage systems that address the mid-range and high-end of the market. If we are unsuccessful in offsetting price reductions in our storage systems by increasing our sales volumes or reducing our cost of goods, our revenue and operating results could suffer. If the average selling prices of our existing products decline and if we are unable to introduce and generate significant demand for higher margin storage systems or additional software applications, we may be unable to maintain our current gross margins.
We and our contract manufacturer rely on a limited number of suppliers, and in some cases single sources, and any disruption or termination of these supply arrangements could delay shipments of our storage systems and reduce our revenue.
We and Sanmina-SCI Corporation, or Sanmina-SCI, our contract manufacturer, rely on a limited number of suppliers for several key components used in the assembly of our storage systems, including our FPGAs, which are manufactured by Altera Corporation, and our disk drives, which are manufactured by Seagate Technology plc., or Seagate, and Hitachi Global Storage Technologies, Inc., or Hitachi GST. This reliance on a limited number of suppliers involves several risks, including:
| • | supplier capacity constraints; |
| • | price increases; |
| • | timely delivery; and |
| • | component quality. |
If any of these suppliers were to cancel or materially change their commitments to us or Sanmina-SCI or fail to meet the quality or delivery requirements needed to allow Sanmina-SCI to timely manufacture our storage systems, we could lose time-sensitive customer orders, be unable to develop or sell certain storage systems cost effectively or on a timely basis, if at all, and have significantly reduced revenue. In addition, in the event that it became necessary to find other suppliers of certain of the key components used in the manufacturing and assembly of our storage systems, transition to the new supplier could take three to six months, due to the lengthy qualification and technology development process that is required to qualify suppliers of these key components. Inadequate supplies of critical components may impair our ability to fulfill orders in a given quarter and/or result in a decrease in our gross margins.
Component quality is particularly significant for suppliers of our disk drives. Disruption or termination of the supply of these components and problems with manufacturing quality could delay shipments of our storage systems and materially and adversely affect our operating results. For example, we recently experienced a supply chain disruption for the disk drives used in certain
-21-
Table of Contents
of our storage systems as a result of the Japanese earthquake and tsunami in March 2011. In the past we have also experienced quality problems with disk drives and we were forced to seek out and engage a new supplier of disk drives. These delays and quality defects are outside of our control and are difficult to predict. Any delay of storage system shipments or the existence of defects in our storage systems could damage relationships with current and prospective customers, increase our costs due to the time and money spent remedying the defects and reduce our revenue.
Our future financial performance depends on growth in the market for the storage and management of unstructured data at scale and our ability to adapt to customer demands in the market. If this market does not grow as we expect or if we are unable to adequately address market demands, our revenue could decline, our ability to sell our storage systems could suffer and we may be unable to maintain or increase our revenue and our business and results of operations could be materially adversely affected.
Our storage systems are designed to address the market for the storage and management of unstructured data at scale. This is a rapidly growing, evolving and challenging market. Accordingly, our future financial performance will depend in large part on growth in this market and on our ability to adapt to emerging market demands. Unlike many of our large competitors that have a broad offering of storage systems for various markets and industries, our business is predominantly focused on the NAS segment of the storage industry that addresses the storage and management of unstructured data at scale. Consequently, we are vulnerable to fluctuations in the growth in this market and the demand for storage systems that address this market. A number of factors could adversely affect the growth in this market or the demand for our storage systems, including the following:
| • | introduction of new products and technologies that serve as replacements or substitutes to our storage systems or that reduce the demand for high performance network systems, such as advances in file compression technology that result in smaller file sizes; |
| • | lack of customer acceptance of new storage systems or technologies that we may develop or our inability to timely develop product enhancements that satisfy customer requirements; |
| • | decreased reliance by businesses on data that their businesses generate; and |
| • | customer budgetary constraints or reduced corporate spending on data storage solutions. |
Any of the factors listed above could result in decreased revenue to us or a lower growth rate in our revenue, which would materially adversely affect our business and results of operations.
We are dependent on our customers’ information technology budgets for storage systems and any economic constraints on their capital spending they experience could negatively impact our ability to sell our storage systems and to meet our revenue forecasts.
Our business is subject to our customers’ information technology budgets for building and maintaining storage solutions within their organizations. If the demand for storage solutions declines as a result of our customers’ budgetary constraints, reduced corporate spending on storage solutions or any other factors, demand for our storage systems will be similarly affected. The recent global economic downturn caused a significant reduction in information technology budgets for storage solutions across a wide range of industries, which resulted in a decline in our revenue. Limitations on significant build out of storage infrastructure due to economic factors, lack of access to funding for capital expenditures or other conditions could result in reduced demand for our storage systems. If there is another downturn or customers experience
-22-
Table of Contents
substantial reductions in their information technology budgets, our ability to sell our storage systems and to meet our revenue forecasts may be materially harmed.
As we introduce subsequent generations of our storage systems, we may experience difficulties transitioning customers to these newer offerings. Customer acceptance of the newer generations of storage systems is critical because if we are unable to sell customers these newer offerings, we may experience a decline in revenue that could materially impact our financial results.
As we develop and introduce new storage systems to the market, we face the risk that potential and existing customers may be unwilling to replace their current storage systems with our newer storage systems. Transitioning customers to newer generations of storage systems involves a substantial amount of time educating our customers on the benefits provided by the new storage systems. However, regardless of the enhanced features or superior performance of the newer generation of storage systems as compared to older storage systems that the customers may currently have installed, they may be unwilling to adopt the new storage systems as a result of familiarity with the existing storage system, reluctance to use a new storage system that has an unproven record in the industry or internal budget restraints that prevent them from purchasing the new storage systems. We must also successfully manage product transition in order to minimize disruption in our customers’ ordering and purchasing patterns, ensure that sufficient supplies of new storage systems are available to meet customer demand and avoid reductions in the demand for our prior generation storage systems and resulting excessive inventory levels of those storage systems. Due to the extensive time and resources that we invest in developing new storage systems, if we are unable to sell customers subsequent generations of our storage systems, our revenue could decline and our financial results could be materially impacted.
Our storage systems must interoperate with our customers’ existing infrastructure, including hardware and software applications that are developed by others, as well as various data access protocols. If our storage systems fail to interoperate, we may be unable to increase, or we may lose, market share and we may experience weakening demand for our storage systems.
Our storage systems must interoperate with our customers’ existing infrastructure, specifically their networks, operating systems, software applications and other storage devices and hardware that are developed by others, each of which may have different specifications. When new or updated versions of these operating systems or software applications are introduced, or if we find, as we have in the past, defects in the existing software or hardware used in our customers’ infrastructure or an incompatibility or deficiency in our software, we must sometimes develop updated versions of our software so that they interoperate properly with these operating systems, software applications and hardware. We may not accomplish these development efforts quickly, cost effectively or at all. These development efforts may require substantial capital investment and the devotion of substantial employee resources. If we fail to maintain compatibility with these operating systems, software applications or other storage devices and hardware, our storage systems may not be able to fulfill our customers’ requirements, or we may experience longer sales and implementation cycles for our storage systems or order cancellations. As a result, there may be weakening demand for our storage systems and we may fail to increase, or we may lose, market share.
In addition, our storage systems interoperate with servers and software applications predominantly through the use of protocols, many of which are created and maintained by independent standards organizations. Some of these protocols that exist today or that may be
-23-
Table of Contents
created in the future are, or could be, proprietary technology and therefore require licensing a proprietary protocol’s specifications from a third party or implementing the protocol without specifications, which could entail significant effort on our part. If we fail to obtain a license to necessary specifications on reasonable terms from third party vendors, we could be liable for infringing certain intellectual property rights of such vendors, and if we are not able to implement a necessary protocol in the absence of these specifications, our storage systems might become less competitive, which would harm our business. For example, Microsoft maintains and enhances the Common Internet File System, or CIFS, a proprietary protocol that our storage systems use to communicate with the Windows operating system. Although our storage systems are currently compatible with CIFS, at present we do not license the specifications to this proprietary protocol. If we are not able to continue to maintain adequate compatibility with CIFS or if we are not able to license adequate specifications to this protocol on reasonable terms, our storage systems would likely be less competitive in the marketplace, which could reduce our revenue.
If we lose key personnel, key personnel are distracted or we are unable to attract and retain highly qualified personnel, we would be required to dedicate more time and resources to recruiting and training and our product development and sales efforts would likely suffer.
Our future success also depends on our continued ability to attract and retain highly qualified technical, sales, support and management personnel. In particular, our ability to enhance and maintain our technology requires talented software and hardware development engineers with specialized skills in areas such as very large scale integration, or VLSI, FPGA design, distributed computing, file systems, network and storage protocols and operating systems. If we are unable to recruit and retain these engineers, we would be required to spend more time and resources on our hiring efforts, the quality and speed with which our storage systems are developed would likely be seriously compromised, and our reputation and business would suffer as a result. In addition, our sales positions require candidates with specific sales and engineering backgrounds in the storage industry, and we may be unable to locate and hire individuals with these credentials as quickly as needed, if at all. Once new sales personnel are hired, we need a reasonable amount of time to train the new sales personnel before they are able to effectively and efficiently perform their responsibilities. Failure to hire and retain qualified sales personnel could adversely impact our storage system sales. Competition for these and the other personnel we require, particularly in the Silicon Valley area, is intense, and we may fail to attract or retain highly qualified technical, sales, support and management personnel necessary for our business. In addition, we compete for these personnel with large, established publicly traded companies and we may be unsuccessful at attracting and retaining employees because of our history of losses and concerns about the impact on employees if we are acquired. If we are unable to attract and retain the necessary key personnel, our business and our results of operations could be harmed.
Our ability to sell our storage systems is partially dependent on ease of use and the quality of our support offerings, and any failure to offer high-quality technical support services could negatively impact our sales, damage our reputation and harm our customer relationships.
After our storage systems are deployed within our customers’ storage networks, our customers depend on our support services organization to resolve issues relating to our storage systems and how they perform within our customers’ environments. Our storage systems serve mission critical functions for our customers and high-quality support services are therefore imperative for the successful marketing and sale of our storage systems. If we do not succeed in helping our customers to quickly resolve post-deployment issues, it would damage our reputation, harm our
-24-
Table of Contents
customer relationships and adversely affect our ability to sell our storage systems to potential and existing customers. Our ability to provide effective support and service offerings is largely dependent on our ability to attract, train and retain qualified service personnel. As we expand our operations internationally, our support services organization will face additional challenges, including those associated with delivering support, training and documentation in languages other than English. If our customers do not receive high-quality post-sale support services from us, they may be unwilling to recommend our storage systems to other potential customers or we may gain a reputation in the industry of providing poor support services. As a result, our failure to maintain high quality support services could reduce our sales and revenue and negatively impact our business, operating results and financial condition.
Our storage systems are highly technical and complex and may contain undetected software or hardware defects, which could cause data unavailability, loss or corruption that might, in turn, result in liability to our customers, harm to our reputation, a loss of customers and a reduction in our revenue.
Our storage systems are highly technical and complex and are often used to store information critical to our customers’ business operations. Our storage systems have contained and may contain undetected errors, defects or security vulnerabilities that could result in data unavailability, loss or corruption or other harm to our customers. Some errors in our storage systems may only be discovered after they have been installed and used by customers. Resolving these errors and defects sometimes requires a significant amount of time and prevents our technical personnel from working on other tasks that may be more important to the future growth of our business.
In addition, if flaws in the design, production or assembly of our storage systems or our suppliers’ components were to occur, we could experience a rate of failure in our storage systems that could result in substantial repair, replacement or service costs and harm to our reputation. The availability of quality components from our suppliers and quality services from our manufacturers are key factors to our continued growth and success. We have in the past, and may in the future, experience quality problems with the components provided by our suppliers. Although we have procedures in place to monitor the quality of our suppliers’ components and our manufacturers’ processes, we cannot assure you that our efforts will be sufficient to avoid a rate of failure in our storage systems that results in substantial delays in shipment or significant repair or replacement costs, any of which could result in lost sales, harm to our reputation and an increase in our operating costs.
Any errors, defects or security vulnerabilities discovered in our storage systems after commercial release, as well as any computer virus or human error on the part of our customer support or other personnel resulting in a customer’s data unavailability, loss or corruption could result in a loss of customers, product return or increased support and warranty costs, any of which may adversely affect our business, operating results and financial condition. Our OEM partner and resellers may also terminate their relationships with us or reduce their efforts to sell our storage systems if we experience significant product failures and they do not believe we respond quickly and effectively. We may also face claims for product liability, tort or breach of warranty, including claims relating to changes to our storage systems made by our partners. Our contracts with customers contain provisions relating to warranty disclaimers and liability limitations, which may be difficult to enforce. Defending a lawsuit, regardless of its merit, could be costly and might divert management’s attention and adversely affect the market’s perception of us and our
-25-
Table of Contents
storage systems. In addition, if the amount and scope of our business liability insurance coverage proves inadequate for a claim, or future coverage is unavailable on acceptable terms or at all, our revenue could be reduced.
We currently rely on a single contract manufacturer to manufacture and assemble our storage systems, and our failure to manage this relationship effectively could negatively impact our revenue and operating results.
We currently rely on a single contract manufacturer, Sanmina-SCI, to manufacture our storage systems, assemble our storage systems and, alone or together with us, negotiate certain component costs. Our reliance on Sanmina-SCI reduces our control over the manufacturing and assembly process, exposing us to risks, including reduced control over quality assurance, production costs and product supply. If we fail to manage our relationship with Sanmina-SCI effectively, or if Sanmina-SCI experiences delays, disruptions, capacity constraints or quality control problems in its operations, our ability to ship storage systems to our customers could be impaired and our competitive position and reputation could be harmed. If Sanmina-SCI cannot negotiate with certain suppliers for reduced component costs, our operating results could suffer. Additionally, if Sanmina-SCI terminates its agreement with us, which is terminable by Sanmina-SCI for any reason upon 60 days’ notice, we would be required to engage a new manufacturer. Qualifying a new contract manufacturer and commencing volume production would be expensive and time consuming. If we are required to change contract manufacturers, move from the current production site or assume internal manufacturing operations for any reason including any negative developments in Sanmina-SCI’s business that are unrelated to our relationship, we may lose revenue, incur increased costs and damage our customer relationships.
We are subject to business uncertainties that make it difficult to forecast demand and production levels accurately and to secure components and products on a timely basis, which could interfere with our ability to deliver our storage systems and generate product sales.
Our sales are generally based on purchase orders with our customers rather than long-term purchase commitments. As a result, it is difficult to accurately forecast customer demand for future periods. We are required under our agreement with Sanmina-SCI to provide forecasts regarding product demand and production levels. In order to secure components required for the production of our storage systems on a timely basis and to ensure that we have sufficient inventory to meet our customers’ demands, it is imperative that our forecasts are accurate. If we inaccurately forecast demand for our storage systems, we may have excess or inadequate inventory or incur cancellation charges or penalties. Excess inventory levels could result in unexpected expenses or increases in our reserves that could adversely impact our operating results. Conversely, inadequate inventory levels could cause us to forego revenue opportunities, potentially lose market share and harm our customer relationships. We also intend to introduce new storage systems and product enhancements, which could require us to achieve volume production rapidly or manage transitions from our old storage systems to our new storage systems by coordinating with Sanmina-SCI and our suppliers. We may need to increase our component purchases, contract manufacturing capacity and internal test and quality functions, if we experience increased demand. The inability of Sanmina-SCI to provide us with adequate supplies of high quality products on a timely basis, or an inability to obtain adequate quantities of components, could cause a delay in our order fulfillment and could interfere with our ability to deliver our storage systems and generate revenue.
-26-
Table of Contents
Our business, financial condition and results of operations could be adversely affected by the political and economic conditions of the countries in which we conduct business and other factors related to our international operations.
We derived 30%, 24%, 30% and 30% of our revenue from customers outside the United States in fiscal 2009, fiscal 2010, fiscal 2011 and the three months ended April 30, 2011, respectively. We have sales and technical support personnel in countries other than the United States, as well as a significant number of research and development personnel in England. We outsource certain quality assurance related to research and development as well as product development to third parties in India. We may continue to add personnel in additional countries. Our international operations subject us to a variety of risks, including:
| • | the difficulty of managing and staffing international offices and the increased travel, infrastructure and legal compliance costs associated with multiple international locations; |
| • | difficulties in enforcing contracts and collecting accounts receivable, and longer payment cycles, especially in emerging markets; |
| • | the challenge of managing a development team in geographically disparate locations; |
| • | tariffs and trade barriers and other regulatory or contractual limitations on our ability to sell or develop our storage systems in various foreign markets; |
| • | restrictions imposed by the U.S. government on our ability to do business with certain companies or in certain countries as a result of international political conflicts involving the U.S. government; |
| • | increased exposure to foreign currency exchange rate risk; |
| • | reduced protection for intellectual property rights in some countries; |
| • | geopolitical turmoil, including terrorism, war or political or military coups; and |
| • | political and economic instability. |
As we expand our business globally, our success will depend, in large part, on our ability to anticipate and effectively manage these risks. Our failure to manage any of these risks successfully could adversely affect our business, financial condition and results of operations.
If we need additional capital in the future, it may not be available to us on favorable terms, or at all.
There can be no assurance that we will be successful in executing our business plan, maintaining and growing our existing customer base or achieving profitability and realizing our working capital. Failure to generate sufficient revenue, achieve planned gross margins or control operating costs may require us to raise additional capital through equity or debt financing. Such additional financing may not be available on acceptable terms, or at all, and could require us to modify, delay or abandon some of our planned future expansion or expenditures or reduce some of our ongoing operating costs, which could have a material adverse effect on our business, operating results, financial condition and ability to achieve our intended business objectives. If we raise additional funds through further issuances of equity, convertible debt securities or other securities convertible into equity, our existing stockholders could suffer significant dilution in their percentage ownership of our company and any new securities we issue could have rights, preferences and privileges senior to those of holders of our common stock. Our accounts
-27-
Table of Contents
receivable based credit facility, which expires in December 2012, includes a material adverse change clause as a condition precedent to funding, which allows the lender to withdraw any unutilized portion of the facility at the time it is notified of the occurrence of certain triggering events. In addition, our long-term capital growth facility is subject to interest-only payments through December 2011. However, if we do not meet certain performance criteria tied to a measure of our quarterly earnings for quarters through October 29, 2011, repayment of principal via monthly installments will be accelerated and will commence in the month following the determination that the performance criteria have not been achieved.
We are exposed to fluctuations in currency exchange rates that could negatively impact our operating expenses and cash flows.
Because a portion of our business is conducted outside the United States, we face exposure to adverse movements in foreign currency exchange rates. These exposures may change over time as business practices evolve, and they could have a material adverse impact on our operating expenses and cash flows. Historically, our primary exposures have related to nondollar denominated operating expenses in the British pound sterling. An increase in the value of the dollar could increase the real cost to our customers of our storage systems in those markets outside the United States where we sell in dollars and other currencies, and a weakened dollar could increase the cost of local operating expenses.
If we or our third party contractors fail to comply with environmental requirements, we could be subject to civil or criminal fines and penalties or other sanctions and our reputation could be adversely affected.
We are subject to various environmental laws and regulations, including laws governing the hazardous material content of our products and laws relating to the collection and recycling of electrical and electronic equipment. We face increasing complexity in our research and development and procurement operations as a result of requirements relating to the materials composition of many of our storage systems, including the European Union’s, or EU, Restriction on the Use of Certain Hazardous Substances in Electrical and Electronic Equipment, or RoHS, directive, which restricts the content of lead and certain other substances in specified electronic products put on the market in the EU after July 2006 and similar legislation relating to marking of electronic products which became effective in March 2007 in China. In addition, we could be required to recall and replace any non-compliant storage systems already shipped, resulting in reduced revenue, increased costs and harm to our business, customer relationships and reputation. If there are changes to these laws (or their interpretation) or if new similar laws are passed in other jurisdictions, we may be required to reengineer our storage systems to comply with such laws, which could result in additional costs to us or disrupt or delay our operations and adversely affect our business.
There are also significant costs and liabilities associated with product take back legislation. The EU has enacted the Waste Electrical and Electronic Equipment, or WEEE, directive, which makes producers of electronic equipment responsible for specified collection, recycling, treatment and disposal of past and future covered products. We rely on third party contractors to manufacture and take back products on our behalf in compliance with environmental requirements. If such third party contractors do not comply with these laws and regulations, we could be subject to fines, civil or criminal sanctions and contract damage claims.
Some of our operations, such as our research and development facilities, are also regulated under various other federal, state, local, foreign and international environmental laws and
-28-
Table of Contents
requirements, including those governing, among other matters, the discharge of pollutants into the air and water, the management, disposal, handling, use, labeling of and exposure to, hazardous substances and wastes and the cleanup of contaminated sites. Liability under certain environmental laws can be joint and several and without regard to comparative fault. Our failure to comply with these and other environmental laws could result in civil or criminal fines and penalties or other sanctions and decreased revenue, which could adversely affect our operating results.
As a result of our efforts to comply with these or other future environmental laws and regulations, we could incur substantial costs, including those relating to excess component inventory, and be subject to disruptions to our operations and logistics, which could harm our business and financial condition. We expect that our operations and products will be affected by new environmental laws and regulations on an ongoing basis, and although we cannot predict the ultimate impact of any such laws or regulations, they will likely result in additional costs and may increase penalties associated with violations or require us to change the content of our products or how they are manufactured, any of which could have a material adverse effect on our business.
We are subject to governmental export and import controls and economic sanctions laws that could subject us to liability and impair our ability to compete in international markets.
Because we incorporate encryption technology into our storage systems, our storage systems are subject to United States export controls and may be exported outside the United States only with the required level of export license or through an export license exception. If a transaction involves countries, individuals or entities that are the target of U.S. or other economic sanctions, licenses or other approvals from the United States Department of the Treasury’s Office of Foreign Assets Control or other sanctions authorities may be required and may not be granted. In addition, various countries regulate the importation of certain encryption technology and have enacted laws that could limit our ability to distribute our storage systems or could limit our customers’ ability to implement our storage systems in those countries. Changes in our storage systems or changes in export or import or economic sanctions regulations may create delays in the introduction of our storage systems in international markets, prevent our customers with international operations from deploying our storage systems throughout their global information technology infrastructure or, in some cases, prevent the export or import of our storage systems to certain countries altogether. Any change in export, import or economic sanctions regulations or related legislation, shift in approach to the enforcement or scope of existing regulations or change in the countries, persons or technologies targeted by these regulations could result in decreased use of our storage systems by, or in our decreased ability to export or sell our storage systems to, existing or potential customers with international operations. In addition, failure to obtain required import or export approval for our storage systems or failure to comply with these regulations could result in penalties and restrictions on export privileges and could impair our ability to compete in international markets.
Failure to comply with the United States Foreign Corrupt Practices Act, or the FCPA, and similar laws associated with our activities outside the United States could subject us to penalties and other adverse consequences.
As a growing percentage of our revenue is and will be from jurisdictions outside of the United States, we face significant risks if we fail to comply with the FCPA and other applicable
-29-
Table of Contents
anticorruption laws that prohibit improper payments or offers of payment to foreign government officials and political parties by us for the purpose of obtaining or retaining business. In many foreign countries, particularly in countries with developing economies, which represent our principal markets, it may be a local custom that businesses operating in such countries engage in business practices that are prohibited by the FCPA or other applicable laws and regulations. We are in the early stages of implementing our FCPA compliance program. There can be no assurance that all of our employees and agents, as well as those companies to which we outsource certain of our business operations, will not take actions in violation of our policies and applicable law, for which we may be ultimately held responsible. Any violation of the FCPA or other applicable anticorruption laws could result in severe criminal or civil sanctions and, in the case of the FCPA, suspension or debarment from U.S. government contracting, which could have a material and adverse effect on our reputation, business, operating results and financial condition.
We may engage in future acquisitions that could disrupt our business, cause dilution to our stockholders, reduce our financial resources and harm our business.
In the future, we may acquire other businesses, products or technologies. We have not made any acquisitions to date and are not engaged in any at this time. Accordingly, our ability as an organization to make acquisitions is unproven. We may not be able to find suitable acquisition candidates and we may not be able to complete acquisitions on favorable terms, if at all. If we do complete acquisitions, we may not strengthen our competitive position or achieve our goals, or these acquisitions may be viewed negatively by customers, financial markets or investors. In addition, any acquisitions that we make could lead to difficulties in integrating personnel, technologies and operations from the acquired businesses and in retaining and motivating key personnel from these businesses. Acquisitions may disrupt our ongoing operations, divert management from day-to-day responsibilities, subject us to additional liabilities, increase our expenses and adversely impact our business, operating results and financial condition. Future acquisitions may reduce our cash available for operations and other uses, and could result in an increase in amortization expense related to identifiable assets acquired, potentially dilutive issuances of equity securities or the incurrence of debt, any of which could harm our business.
Our ability to benefit from certain tax credits or net operating losses, or NOLs, may be impaired as a result of our growth or changes in tax laws or regulations.
To date, we have not paid material income taxes as a result of our losses. In the United Kingdom, we receive tax benefits primarily due to the surrendering of our NOL carryforwards, in exchange for a current cash refund for research and development activities in the United Kingdom. Beginning after fiscal 2014, we no longer expect to be eligible to surrender these NOLs and receive a cash tax refund as we expect to exceed certain specified statutory thresholds. In the past, these tax credits have resulted in positive cash flows. We also have significant NOL carryforwards in the United States and other jurisdictions. Some of these NOLs will expire at various times in the future or may be rescinded with changes in tax laws or regulations. Any changes that may affect our NOLs would affect our ability to estimate our provision for income tax in the future.
Our ability to use NOLs to offset future taxable income may be subject to significant limitations.
In general, under Section 382 of the Internal Revenue Code of 1986, as amended, or the Internal Revenue Code, a corporation that undergoes an “ownership change” is subject to limitations on
-30-
Table of Contents
its ability to utilize its prechange NOLs to offset future taxable income. We experienced an ownership change as defined by Section 382 in July 2003. This change resulted in an annual limitation of $1.4 million on all NOLs incurred prior to this date. If we undergo an ownership change in connection with or after this public offering, our ability to utilize NOL carryforwards could be further limited by Section 382 of the Internal Revenue Code. Future changes in our stock ownership, some of which are outside of our control, could result in an ownership change under Section 382 of the Internal Revenue Code. In addition, the State of California has currently suspended the use of NOL carryforwards to offset taxable income. For these reasons, it is likely that we may not be able to utilize a significant portion of our NOL carryforwards if we attain profitability.
Our business is vulnerable to interruption by events beyond our control, including earthquakes, fire, floods and other natural catastrophic events.
Our corporate headquarters and the operations of our key suppliers, manufacturers and spare parts logistics provider are located in the San Francisco Bay area, Wisconsin, England, Singapore, Mexico, China, Japan and Taiwan. A significant natural disaster, such as an earthquake, tsunami, fire or flood, could have a material adverse impact on our business, operating results and financial condition. In the event that any of our service providers’ information technology systems or manufacturing or logistics abilities are hindered by any of these events, shipments could be delayed, resulting in our missing key financial targets, including revenue and earnings estimates, for a particular quarter. For example, in June 2011, our spare parts logistics provider suffered a fire at one of their locations and we lost approximately $350,000 of spare parts inventory. See Note 16 in the notes to our consolidated financial statements. Although we believe the losses we incurred as a result of the fire will be covered by insurance, we cannot determine when, if and to what extent we will be reimbursed for our losses.
Risks related to our intellectual property
We operate in an industry with extensive intellectual property litigation. Claims of infringement against us or our suppliers could increase our expenses, disrupt our ability to sell our storage systems and reduce our revenue.
Third parties may claim that our storage systems or technologies infringe or misappropriate their intellectual property rights. The data storage industry is characterized by the existence of a large number of patents, trademarks, trade secrets and copyrights and by frequent litigation based on allegations of infringement or other violations of intellectual property rights. From 2003 to 2006, we defended an intellectual property infringement claim that was brought by NetApp against us. Although we ultimately prevailed, it was costly to defend and required a substantial amount of our senior management’s time and attention. We expect that infringement claims and misappropriation claims may further increase as the number of products and competitors in our market increases. In addition, if we gain greater visibility and market exposure as a public company, we face a higher risk of being the subject of intellectual property infringement claims and misappropriation claims. We cannot assure you that we do not currently infringe or misappropriate, or that we will not in the future infringe or misappropriate, any third party patents or other proprietary rights. For instance, because patent applications in the United States and foreign jurisdictions are typically maintained in confidence for up to 18 months after their filing or, in some cases, for the entire time prior to issuance as a U.S. patent, third parties may have earlier filed applications covering methods or other inventions that we consider our trade secrets. In addition, the limited size of our patent portfolio may not provide meaningful deterrence against third parties alleging that we infringe their patents, particularly against
-31-
Table of Contents
patent holding companies or other adverse patent owners who have no relevant product revenues. Any claims of infringement or misappropriation by a third party, even those without merit, could cause us to incur substantial costs defending against the claims, and could distract our management from our business. Further, a party making such a claim, if successful, could secure a judgment that requires us to pay substantial damages. A judgment could also include an injunction or other court order that could prevent us from offering our storage systems. In addition, we might be required to seek a license for the use of the infringed intellectual property, which might not be available on commercially reasonable terms or at all. Alternatively, we might be required to develop noninfringing technology, which could require significant effort and expense and might ultimately be unsuccessful. Any of these events could seriously harm our business, operating results and financial condition.
We may also be required to indemnify our customers and partners against third party infringement claims, which could increase our operating expenses and impair our relationships with our customers.
Third parties may also assert infringement claims against our customers and partners. Claims against our customers and partners may require us to initiate or defend potentially protracted and costly litigation on a customer’s or partner’s behalf, regardless of the merits of these claims, because we generally defend and indemnify our customers and partners from claims of infringement and misappropriation of proprietary rights of third parties based on the use or resale of our storage systems. Because some of our customers and partners, including HDS, are much larger than us and have much greater resources than we do, they may be more likely to be the target of an infringement claim by third parties than we would be, which could increase our chances of becoming involved in a future lawsuit. If any of these claims succeeds, we might be forced to pay damages on behalf of our customers or partners which could increase our expenses, disrupt our ability to sell our storage systems and reduce our revenue.
It is also not uncommon for suppliers of certain components in our storage systems to be involved in infringement lawsuits by or against third parties. Although some of our suppliers are obligated to indemnify us in connection with infringement claims related to their intellectual property rights, these suppliers may contest their obligations to indemnify us, or their available assets or indemnity obligation may not be sufficient to cover our losses. We cannot determine with certainty whether any existing or future third party intellectual property infringement claims that involved us or our suppliers would require us to alter our technologies, obtain licenses or cease certain activities.
We may not be able to protect and enforce our intellectual property rights, which could harm our competitive position and reduce the value of our proprietary technology.
Our success is dependent in part on obtaining, maintaining and enforcing our patent and other proprietary rights. We rely on trade secret, patent, copyright and trademark laws and confidentiality agreements with employees and third parties, all of which offer only limited protection. The steps we have taken to protect our proprietary rights may not be adequate to prevent misappropriation of our proprietary information or infringement of our intellectual property rights, and our ability to prevent such misappropriation or infringement is uncertain, particularly in countries outside of the United States. We do not know whether any of our pending patent applications will result in the issuance of a patent or whether the examination process will require us to narrow our claims. As of July 30, 2011, we had six issued U.S. patents,
-32-
Table of Contents
four issued foreign patents, 13 U.S. pending patent applications and 16 pending foreign patent applications. Our patents may be contested, circumvented, found unenforceable or invalidated and we may not be able to prevent third parties from infringing them. Moreover, the rights granted under any issued patents may not provide us with proprietary protection or competitive advantages, and, as a result, our competitors may be able to develop technologies similar or superior to ours. In some countries where our storage systems are sold or may be sold, we do not have foreign patents or pending applications corresponding to some of our U.S. patents and patent applications. Even if foreign patents are granted, effective enforcement in foreign countries may not be available.
Protecting against the unauthorized use of our technology, trademarks and other proprietary rights is expensive and difficult. Litigation may be necessary in the future to enforce or defend our intellectual property rights, to protect our trade secrets or to determine the validity and scope of the proprietary rights of others. Any such litigation could result in substantial costs and diversion of management resources, either of which could harm our business, operating results and financial condition. Litigation also puts our patents at risk of being invalidated or interpreted narrowly and our patent applications at risk of not issuing. Additionally, any enforcement of our patents or other intellectual property may provoke third parties to assert counterclaims against us. For instance, our objection to an Australian web design firm’s use of the BLUEARC name has prompted that firm to challenge our Australian trademark registration, and we will be forced to defend against their claims in a hearing scheduled for October 2011. Further, many of our current and potential competitors have the ability to dedicate substantially greater resources to enforcing their intellectual property rights than we have. Accordingly, we may not be able to prevent third parties from infringing upon or misappropriating our intellectual property.
Patent protection outside the United States is generally not as comprehensive as in the United States and may not protect our intellectual property in some countries where our storage systems are sold or may be sold in the future. Even if patents are granted outside the United States, effective enforcement in those countries may not be available. For example, the legal regime protecting intellectual property rights in China is relatively weak and it is often difficult to create and enforce such rights. Accordingly, we may not be able to effectively protect our intellectual property rights in China or elsewhere. Many companies have encountered substantial intellectual property infringement in countries where we sell or intend to sell storage systems. If such an impermissible use of our intellectual property or trade secrets were to occur, our ability to sell our storage systems at competitive prices and to be the sole provider of leading edge products may be adversely affected and our financial condition and results of operations could be materially and adversely affected.
Our use of open source and third party software could impose limitations on our ability to commercialize our storage systems.
We incorporate open source software into certain of our storage systems. Although we monitor our use of open source software to avoid subjecting our storage systems to conditions we do not intend, the terms of many open source licenses have not been interpreted by United States courts, and there is a risk that these licenses could be construed in a way that could impose unanticipated conditions or restrictions on our ability to commercialize our storage systems. For example, we may be required to seek licenses from third parties to continue offering our storage systems, to make generally available, in source code form, our proprietary code that is used in
-33-
Table of Contents
connection with certain open source modules, to license or redistribute our proprietary software at no charge, to reengineer our storage systems, or to discontinue the sale of our storage systems if reengineering could not be accomplished on a timely basis, any of which could adversely affect our business, operating results and financial condition.
We may also find that we need to incorporate certain proprietary, third party technologies, including software programs, into our storage systems in the future. However, licenses to relevant third party technology may not be available to us on commercially reasonable terms, or at all. Therefore, we could face delays in product releases until equivalent technology can be identified, licensed or developed, and integrated into our current storage systems. These delays, if they occur, could result in lost sales and a reduction in our revenue.
Security breaches could expose us to liability and our reputation and business may suffer.
Our storage systems retain sensitive data, including intellectual property, accounting books and records and personally identifiable information of our customers. It is critical to our business strategy that our storage systems remain secure and are perceived by customers and partners to be secure. Despite our security measures, our storage systems may be vulnerable to attacks by hackers or other disruptive problems. Any such security breach may compromise information stored on our storage systems. While we do not believe that any attack to date has successfully penetrated our network defenses, we have not commissioned a formal security audit by any third party. Any such breach could negatively affect our reputation by adversely affecting the market’s perception of the security or reliability of our storage systems.
Risks related to this offering and ownership of our common stock
If securities or industry analysts do not publish research or publish inaccurate or unfavorable research about our business, our stock price and trading volume could decline.
The trading market for our common stock will depend in part on any research and reports that securities or industry analysts publish about us or our business. We do not currently have and may never obtain research coverage by securities and industry analysts. If no securities or industry analysts start coverage of us, the trading price for our stock would be negatively impacted. If securities or industry analysts cover us and one or more of these analysts downgrades our stock or publishes inaccurate or unfavorable research about our business, our stock price would likely decline. If one or more of these analysts stops coverage of us or fails to publish reports on us regularly, demand for our stock could decrease which could cause our stock price and trading volume to decline.
If we experience material weaknesses in the future or otherwise fail to maintain an effective system of internal controls in the future, we may not be able to accurately report our financial condition or results of operations, which may adversely affect investor confidence in our company and, as a result, the value of our common stock.
As a result of becoming a public company, we will be required, under Section 404 of the Sarbanes-Oxley Act, to furnish a report by management on, among other things, the effectiveness of our internal control over financial reporting for the first fiscal year beginning after the effective date of this offering. This assessment will need to include disclosure of any material weaknesses identified by our management in our internal control over financial reporting, as well as an opinion from our independent registered public accounting firm on the effectiveness of our internal control over financial reporting. A material weakness is a control
-34-
Table of Contents
deficiency or combination of control deficiencies that results in more than a remote likelihood that a material misstatement of annual or interim financial statements will not be prevented or detected.
We are in the very early stages of the costly and challenging process of hiring personnel and compiling the system and processing documentation necessary to perform the evaluation needed to comply with Section 404. We may not be able to complete our evaluation, testing and any required remediation in a timely fashion. During the evaluation and testing process, if we identify one or more material weaknesses in our internal control over financial reporting, we will be unable to assert that our internal controls are effective. We cannot assure you that there will not be material weaknesses and significant deficiencies in our internal controls in the future. If we are unable to conclude that our internal control over financial reporting is effective, or if our independent registered public accounting firm were to issue an adverse opinion on the effectiveness of our internal control over financial reporting, we could lose investor confidence in the accuracy and completeness of our financial reports, which would cause the price of our common stock to decline.
We have not completed a testing cycle under Section 404 of the Sarbanes-Oxley Act and cannot assure you that we will be able to implement and maintain an effective internal control over financial reporting in the future. Any failure to maintain such controls could severely inhibit our ability to accurately report our financial condition or results of operations.
We will incur increased costs and demands upon management as a result of complying with the laws and regulations affecting public companies, which could harm our operating results.
As a public company, we will incur significant legal, accounting, investor relations and other expenses that we did not incur as a private company, including costs associated with public company reporting requirements. We also have incurred and will incur costs associated with current corporate governance requirements, including requirements under Section 404 and other provisions of the Sarbanes-Oxley Act and the Dodd-Frank Act of 2010, as well as rules implemented by the Securities and Exchange Commission, or SEC, and the stock exchange on which our common stock is traded. We expect these rules and regulations to increase our legal and financial compliance costs substantially and to make some activities more time consuming and costly. We are currently unable to estimate these costs with any degree of certainty. We also expect that, as a public company, it will be more expensive for us to obtain director and officer liability insurance. As a result, it may be more difficult for us to attract and retain qualified individuals to serve on our board of directors or as our executive officers.
Our common stock has no prior public trading market and could trade at prices below the initial public offering price.
Our common stock has no prior public trading market. Historically, the trading prices of the securities of technology companies have been highly volatile. Our common stock could trade at prices below the initial public offering price. Factors that could affect the trading price of our common stock, some of which are outside our control, include the following:
| • | price and volume fluctuations in the overall stock market from time to time; |
| • | significant volatility in the market price and trading volume of technology companies in general, and of companies in our industry; |
| • | variations in our operating results or those of our competitors; |
-35-
Table of Contents
| • | actual or anticipated announcements of technological innovations, new services or service enhancements, strategic alliances or significant agreements by us or by our competitors; |
| • | the gain or loss of significant customers; |
| • | recruitment or departure of key personnel; |
| • | level of sales in a particular quarter; |
| • | changes in the estimates of our operating results; |
| • | lawsuits threatened or filed against us; |
| • | sales of large blocks of our stock; |
| • | actual or anticipated changes in recommendations by any securities analysts who elect to follow our common stock; |
| • | whether our operating results meet the expectations of investors or securities analysts; |
| • | major catastrophic events; and |
| • | adoption or modification of regulations, policies, procedures or programs applicable to our business. |
In addition, if the market for technology stocks or the stock market in general experiences loss of investor confidence, the trading price of our common stock could decline for reasons unrelated to our business, operating results or financial condition. The trading price of our common stock might also decline in reaction to events that affect other companies in our industry, even if these events do not directly affect us. Each of these factors, among others, could have a material adverse effect on your investment in our common stock. Some companies that have had volatile market prices for their securities have had securities class actions filed against them. If a suit were filed against us, regardless of its merits or outcome, it would likely result in substantial costs and divert management’s attention and resources. This could have a material adverse effect on our business, operating results and financial condition.
A market may not develop for our securities and our stock price may decline after the offering.
Before this offering, there has been no public market for shares of our common stock and we cannot assure you that one will develop or be sustained after this offering. If a market does not develop or is not sustained, it may be difficult for you to sell your shares of our common stock at an attractive price or at all. We cannot predict the prices at which our common stock will trade. The initial public offering price will not necessarily reflect the price at which investors in the market will be willing to buy and sell our shares following this offering. As a result of these and other factors, the price of our common stock may decline, possibly materially.
Insiders will continue to have substantial control over us after this offering, which could limit your ability to influence corporate matters.
Upon completion of this offering, our directors and executive officers and their affiliates will beneficially own, in the aggregate, approximately % of our outstanding common stock. As a result, these stockholders, if acting together, will be able to exercise significant influence over all matters requiring stockholder approval, including the election of directors and approval of significant corporate transactions such as a merger or other sale of our company or our assets. This concentration of ownership could limit your ability to influence corporate matters and may
-36-
Table of Contents
have the effect of delaying or preventing a third party from acquiring control over us. For information regarding the ownership of our outstanding stock by our executive officers and directors and their affiliates, see the section titled “Principal stockholders.”
Future sales of shares by existing stockholders could cause our stock price to decline.
If our existing stockholders sell, or show an intention to sell, substantial amounts of our common stock in the public market after the contractual lock-up agreements and other restrictions on resale discussed in this prospectus lapse, the trading price of our common stock could decline. Based on shares outstanding as of July 30, 2011, upon completion of this offering, we will have outstanding shares of common stock. Of these shares, only the shares of common stock sold in this offering or shares of common stock sold in this offering if the underwriters’ over-allotment option were exercised in full, would be freely tradable, without restriction, in the public market. Our underwriters may, in their sole discretion, permit our directors, officers, employees and current stockholders who are subject to the 180-day contractual lock-up to sell shares before the lock-up agreements expire. The lock-up may be extended under some circumstances.
At various times after the lock-up agreements pertaining to this offering expire, up to an additional 43,366,170 shares will be eligible for sale in the public market of which 26,177,168 shares are held by directors, executive officers and other affiliates and will be subject to volume limitations under Rule 144 under the Securities Act of 1933, as amended, or Securities Act, and in certain cases, various vesting agreements.
In addition, the shares that are either subject to outstanding options under our 2000 Plan or reserved for future issuance under any post-initial public offering stock plans, 1,073,447 shares of common stock reserved for issuance upon the exercise of outstanding warrants and 320,393 shares of common stock reserved for issuance of certain outstanding warrants that will be net exercised for shares of common stock upon completion of this offering will become eligible for sale in the public market to the extent permitted by the provisions of various vesting arrangements, the lock-up agreements and Rules 144 and 701 under the Securities Act. If these additional shares are sold or if it is perceived that they will be sold in the public market, the trading price of our common stock could decline.
Some of our existing stockholders have demand and piggyback rights to require us to register with the SEC up to 40,732,348 shares of our common stock (including 592,718 shares of our common stock reserved for issuance upon the exercise of certain outstanding warrants and 320,393 shares of our common stock reserved for issuance upon the exercise of outstanding warrants that will be net exercised for shares of common stock upon completion of this offering). If we register these shares of common stock, the stockholders would be able to sell those shares freely in the public market. Most of these shares are subject to lock-up agreements restricting their sale for 180 days after the date of this prospectus, subject to extension or reduction.
After this offering, we intend to register approximately shares of our common stock that we have issued or may issue under our equity plans. Once we register these shares, they can be freely sold in the public market upon issuance, subject to the applicable lock-up agreements described above.
As a new investor, you will experience substantial dilution as a result of this offering.
The assumed initial public offering price per share is substantially higher than the pro forma net tangible book value per share of our common stock outstanding before this offering. As a result,
-37-
Table of Contents
investors purchasing common stock in this offering will experience immediate dilution of $ per share in the pro forma net tangible book value per share from the price paid, based on an assumed initial public offering price of $ per share (the mid-point of the range set forth on the cover page of this prospectus). Investors who purchase shares in this offering will contribute approximately % of the total amount of equity capital raised by us through the date of this offering, but will only own approximately % of the outstanding capital stock. In addition, we have issued options and warrants to acquire common stock at prices significantly below the assumed initial public offering price. To the extent outstanding options and warrants are ultimately exercised, there will be further dilution to investors in this offering. This dilution occurs because our earlier investors paid substantially less than the initial public offering price when they purchased their shares of common stock. In addition, if the underwriters exercise their option to purchase additional shares from us or if we issue additional equity securities, you will experience additional dilution.
Provisions in our certificate of incorporation and bylaws and Delaware law might discourage, delay or prevent a change of control of us or changes in our management and therefore depress the trading price of our common stock.
Our certificate of incorporation and bylaws contain provisions that could depress the trading price of our common stock by acting to discourage, delay or prevent a change in control of our company or changes in our management that our stockholders may consider advantageous. These provisions:
| • | establish a classified board of directors so that not all members of our board are elected at one time; |
| • | provide that directors may only be removed for cause; |
| • | authorize the issuance of blank check preferred stock that our board of directors could issue to increase the number of outstanding shares and to discourage a takeover attempt; |
| • | eliminate the ability of our stockholders to call special meetings of stockholders; |
| • | prohibit stockholder action by written consent, which has the effect of requiring all stockholder actions to be taken at a meeting of stockholders; |
| • | provide that the board of directors is expressly authorized to make, alter or repeal our bylaws; and |
| • | establish advance notice requirements for nominations for election to our board of directors or for proposing matters that can be acted upon by stockholders at stockholder meetings. |
In addition, Section 203 of the Delaware General Corporation Law may discourage, delay or prevent a change in control of us by prohibiting stockholders owning in excess of 15% of our outstanding voting stock from merging or combining with us.
Our management will have broad discretion as to the use of the net proceeds from this offering and might invest or spend the proceeds in ways with which you might not agree or in ways that may not yield a return.
Our management will have broad discretion to use the net proceeds from this offering and you will be relying on the judgment of our management regarding the application of these proceeds. Our management might not apply the net proceeds of this offering in ways with which you
-38-
Table of Contents
agree or that increase the value of your investment. We expect to use the net proceeds from this offering for working capital and general corporate purposes, which may include acquisitions of complementary businesses, products or technologies. We have not allocated these net proceeds for any specific purposes. Our management might not be able to yield a significant return, if any, on any investment of these net proceeds. You may not have the opportunity to influence our decisions on how to use the net proceeds from this offering. Until the net proceeds are used, they may be placed in investments that do not produce significant income or that may lose value.
We do not expect to pay dividends in the foreseeable future.
We have never declared or paid any cash dividends on our common stock and do not anticipate paying any cash dividends in the foreseeable future. Our long-term capital growth facility agreement with Gold Hill Capital also limits our ability to pay dividends. We expect to retain all of our future earnings for use in the development of business and for general corporate purposes. Any determination to pay dividends in the future will be at the discretion of our board of directors. Consequently, investors must rely on sales of their common stock after price appreciation which may never occur, as the only way to realize any future gains on their investment. Investors seeking cash dividends should not purchase our common stock.
-39-
Table of Contents
Special note regarding forward-looking statements and industry data
This prospectus contains forward-looking statements that are based on our management’s beliefs and assumptions and on information currently available to us. The forward-looking statements are contained principally in the sections entitled “Prospectus summary,” “Risk factors,” “Management’s discussion and analysis of financial condition and results of operations,” “Business,” “Compensation discussion and analysis” and “Executive compensation.” Forward-looking statements include information concerning our possible or assumed future results of operations, business strategies, financing plans, competitive position, industry environment, potential growth opportunities and the effects of competition. Forward-looking statements include statements that are not historical facts and can be identified by terms such as “anticipates,” “believes,” “could,” “seeks,” “estimates,” “expects,” “intends,” “may,” “plans,” “potential,” “predicts, “projects,” “should,” “will,” “would” or similar expressions and the negatives of those terms.
Forward-looking statements involve known and unknown risks, uncertainties and other factors that may cause our actual results, performance or achievements to be materially different from any future results, performance or achievements expressed or implied by the forward-looking statements. We discuss these risks in greater detail in “Risk factors” and elsewhere in this prospectus. Given these uncertainties, you should not place undue reliance on these forward-looking statements. Also, forward-looking statements represent our management’s beliefs and assumptions only as of the date of this prospectus. You should read this prospectus and the documents that we have filed as exhibits to the registration statement, of which this prospectus is a part, completely and with the understanding that our actual future results may be materially different from what we expect.
Except as required by law, we assume no obligation to update these forward-looking statements, or to update the reasons actual results could differ materially from those anticipated in these forward-looking statements, even if new information becomes available in the future.
This prospectus also contains estimates and other information concerning our industry, including market size and growth rates, that we obtained from industry publications, surveys and forecasts, including those generated by IDC. This information involves a number of assumptions and limitations and is inherently subject to uncertainties. Actual events or circumstances may differ materially from events and circumstances reflected in this information, and you are cautioned not to give undue weight to these estimates and information. The industry in which we operate is subject to a high degree of uncertainty and risk due to variety of factors, including those described in the section entitled “Risk factors.”
-40-
Table of Contents
We estimate that our net proceeds from the sale of the common stock that we are offering will be approximately $ million, assuming an initial public offering price of $ per share, which is the midpoint of the range of the initial public offering price listed on the cover page of this prospectus and after deducting an assumed underwriting discount and estimated offering expenses that we must pay. If the underwriters’ option to purchase additional shares in this offering is exercised in full, we estimate that our net proceeds will be approximately $ . A $1.00 increase (decrease) in the assumed initial public offering price of $ per share would increase (decrease) our expected net proceeds by approximately $ million, assuming the number of shares offered by us, as set forth on the cover page of this prospectus, remains the same and after deducting an assumed underwriting discount and estimated offering expenses that we must pay.
We intend to use the net proceeds from this offering for working capital and other general corporate purposes including research and development efforts, sales and marketing initiatives, general and administrative expenditures, the expansion of our storage systems to serve other high growth data intensive markets and funding capital expenditures. We may also use part of the net proceeds to develop technology partnerships and to acquire other businesses, products or technologies. However, we do not have agreements or commitments for any specific partnerships or acquisitions at this time. By establishing a public market for our common stock, this offering is also intended to facilitate our future access to public markets.
Pending use of net proceeds from this offering, we intend to invest the net proceeds in investment grade, interest-bearing securities.
We have never declared or paid cash dividends on our common or preferred stock. We currently intend to retain all available funds and any future earnings for use in the operation of our business and do not anticipate paying any cash dividends in the foreseeable future. Our long-term capital growth facility agreement with Gold Hill Capital also limits our ability to pay dividends. Any future determination to declare cash dividends will be made at the discretion of our board of directors and will depend on our financial condition, results of operations, capital requirements, general business conditions and other factors that our board of directors may consider relevant.
-41-
Table of Contents
The following table sets forth our cash and cash equivalents and capitalization:
| • | on an actual basis as of April 30, 2011; |
| • | on a pro forma basis after giving effect to the automatic conversion of all outstanding shares of preferred stock, assuming our Series CC preferred stock converts on a one for 11.80684 basis and our Series EE preferred stock converts on a one for 1.02268 basis, into common stock upon the closing of this offering and the reclassification of a portion of the warrants liability to additional paid-in capital; and |
| • | on a pro forma as adjusted basis reflecting (i) the pro forma presentation described above; (ii) the receipt of the estimated net proceeds from the sale of shares of common stock offered by us in this offering at an assumed initial public offering price of $ , which is the midpoint of the range of the initial public offering price listed on the cover page of this prospectus, after deducting an assumed underwriting discount and estimated offering expenses that we must pay; and (iii) the filing of our amended and restated certificate of incorporation immediately prior to the closing of this offering. |
You should read this table in conjunction with the sections of this prospectus entitled “Selected consolidated financial data” and “Management’s discussion and analysis of financial condition and results of operations” and with our consolidated financial statements and related notes.
| As of April 30, 2011 | ||||||||||||
| Actual | Pro forma | Pro forma as adjusted(1) |
||||||||||
|
|
|
|
|
|
|
|||||||
| (in thousands, except share numbers, |
||||||||||||
| Cash and cash equivalents |
$ | 16,084 | $ | 16,084 | $ | |||||||
|
|
|
|
|
|
|
|||||||
| Total debt and capital lease obligations |
7,481 | 7,481 | ||||||||||
| Warrants liability |
3,935 | 333 | ||||||||||
| Convertible preferred stock, $0.001 par value: 52,566,195 authorized, 36,451,015 shares issued and outstanding actual; no shares authorized, no shares issued and outstanding pro forma and pro forma as adjusted |
121,699 | — | ||||||||||
| Stockholders’ equity (deficit): |
||||||||||||
| Preferred stock, $0.001 par value: no shares authorized, issued or outstanding actual or pro forma; 50,000,000 shares authorized, no shares issued or outstanding pro forma as adjusted |
— | — | — | |||||||||
| Common stock and additional paid-in capital, $0.001 par value: 50,540,389 shares authorized, 3,511,504 shares issued and outstanding actual; 75,950,000 shares authorized, 43,330,741 shares issued and outstanding pro forma; 500,000,000 shares authorized, shares issued and outstanding pro forma as adjusted |
117,094 | 242,395 | ||||||||||
| Accumulated other comprehensive income |
1,093 | 1,093 | ||||||||||
| Accumulated deficit |
(230,262 | ) | (230,262 | ) | ||||||||
|
|
|
|
|
|
|
|||||||
| Total stockholders’ equity (deficit) |
(112,075 | ) | 13,226 | |||||||||
|
|
|
|
|
|
|
|||||||
| Total capitalization |
$ | 21,040 | $ | 21,040 | $ | |||||||
|
|
|
|
|
|
|
|||||||
|
|
||||||||||||
| (1) | A $1.00 increase (decrease) in the assumed initial public offering price of $ per share of our common stock in this offering would increase (decrease) each of cash and cash equivalents, additional paid-in capital, total stockholders’ equity (deficit) and total capitalization by $ , assuming the number of shares offered by us, as set forth on the cover page of this prospectus, remains the same, and after deducting underwriter discounts and commissions and estimated offering expense payable by us. |
-42-
Table of Contents
If the underwriters’ option to purchase additional shares in the offering were exercised in full, pro forma as adjusted cash and cash equivalents, common stock and additional paid-in capital, total stockholders’ equity (deficit) and total capitalization as of April 30, 2011 would be $ , $ , $ , $ and $ respectively.
This table excludes the following shares:
| • | 7,019,362 shares of common stock issuable upon exercise of options outstanding as of April 30, 2011 at a weighted average exercise price of $1.02 per share; |
| • | 894,327 shares of common stock reserved as of April 30, 2011 for future issuance under our 2000 Plan; |
| • | shares of common stock reserved for future issuance under our 2011 Plan that will become effective on the effective date of the registration statement of which this prospectus is a part; |
| • | 1,073,447 shares of common stock reserved for issuance upon the exercise of outstanding warrants as of April 30, 2011, at a weighted average exercise price of $2.68 per share; and |
| • | 320,393 shares of common stock reserved for issuance upon the exercise of outstanding warrants as of April 30, 2011, at a weighted average exercise price of $2.53 per share, that will be net exercised for shares of common stock, based on an assumed initial public offering price of $ per share, which is the midpoint of the range of the initial public offering price listed on the cover page of this prospectus. |
See the section titled “Executive compensation—Employee benefit plans” for a description of our equity plans.
-43-
Table of Contents
Our pro forma net tangible book value as of April 30, 2011 was $ , or $ per share. Our pro forma net tangible book value per share represents the amount of our total tangible assets reduced by the amount of our total liabilities and divided by shares of common stock outstanding after giving effect to the automatic conversion of all outstanding shares of preferred stock into shares of common stock upon the closing of this offering, assuming that our Series CC preferred stock converts on a one for 11.80684 basis and our Series EE preferred stock converts on a one for 1.02268 basis.
Net tangible book value dilution per share to new investors represents the difference between the amount per share paid by purchasers of shares of common stock in this offering and the net tangible book value per share of common stock immediately after completion of this offering. After giving effect to our sale of shares of common stock in this offering at an assumed initial public offering price of $ per share, which is the midpoint of the range of the initial public offering price listed on the cover page of this prospectus, and after deducting an assumed underwriting discount and estimated offering expenses, our pro forma net tangible book value as of April 30, 2011 would have been $ million, or $ per share. This represents an immediate increase in pro forma net tangible book value of $ per share attributable to existing stockholders and an immediate dilution in pro forma net tangible book value of $ per share to purchasers of common stock in this offering, as illustrated in the following table:
| Assumed initial public offering price per share |
$ | |||||
| Pro forma net tangible book value per share as of April 30, 2011 |
$ | |||||
| Increase in pro forma net tangible book value per share attributable to new investors |
||||||
| Pro forma net tangible book value per share after the offering |
||||||
|
|
|
|||||
| Dilution of pro forma net tangible book value per share to new investors |
$ | |||||
|
|
||||||
If the underwriters exercise in full their option to purchase additional shares of our common stock in this offering, the pro forma net tangible book value per share after the offering would be $ per share, the increase in pro forma net tangible book value per share to existing stockholders would be $ per share and the dilution to new investors purchasing shares in this offering would be $ per share.
Each $1.00 increase (decrease) in the assumed initial public offering price of $ per share would increase (decrease) our pro forma net tangible book value by $ million, or $ per share, the increase in pro forma net tangible book value attributable to existing stockholders by $ per share and the dilution in pro forma net tangible book value per share to purchasers of common stock in this offering by $ per share, assuming that the number of shares offered by us, as set forth on the cover page of this prospectus, remains the same and after deducting an assumed underwriting discount and estimated offering expenses we must pay.
-44-
Table of Contents
The following table presents on a pro forma basis as of April 30, 2011, after giving effect to the automatic conversion of all outstanding shares of preferred stock, assuming the conversion of our Series CC preferred stock on a one for 11.80684 basis and the conversion of our Series EE preferred stock on a one for 1.02268 basis, into common stock upon completion of this offering, the differences between the existing stockholders and the purchasers of shares in the offering with respect to the number of shares purchased from us, the total consideration paid and the average price paid per share:
| Shares purchased | Total consideration | Average price per share | ||||||||
| Number | Percent | Amount | Percent | |||||||
|
| ||||||||||
| (in thousands, except per share data and percentage) | ||||||||||
| Existing stockholders |
||||||||||
| New stockholders |
||||||||||
|
|
|
|
|
|||||||
| Total |
||||||||||
|
| ||||||||||
If the underwriters exercise their over-allotment option in full, the number of shares held by new investors will increase to shares, or % of the total number of shares of our common stock outstanding after this offering.
These tables exclude the following shares:
| • | 7,019,362 shares of common stock issuable upon exercise of options outstanding as of April 30, 2011 at a weighted average exercise price of $1.02 per share; |
| • | 894,327 shares of common stock reserved as of April 30, 2011 for future issuance under our 2000 Plan; |
| • | shares of common stock reserved for future issuance under our 2011 Plan that will become effective on the effective date of the registration statement of which this prospectus is a part; |
| • | 1,073,447 shares of common stock reserved for issuance upon the exercise of outstanding warrants as of April 30, 2011, at a weighted average exercise price of $2.68 per share; and |
| • | 320,393 shares of common stock reserved for issuance upon the exercise of outstanding warrants as of April 30, 2011, at a weighted average exercise price of $2.53 per share, that will be net exercised for shares of common stock, based on an assumed initial public offering price of $ per share, which is the midpoint of the range of the initial public offering price listed on the cover page of this prospectus. |
See the section titled “Executive compensation—Employee benefit plans” for a description of our equity plans.
-45-
Table of Contents
Selected consolidated financial data
We derived the selected consolidated statements of operations data for the years ended January 31, 2009, January 30, 2010 and January 29, 2011 and consolidated balance sheet data as of January 30, 2010 and January 29, 2011 from our audited consolidated financial statements and related notes included elsewhere in this prospectus. We derived the selected consolidated statements of operations data for the years ended January 31, 2007 and January 31, 2008 and consolidated balance sheet data as of January 31, 2007, January 31, 2008 and January 31, 2009 from our audited consolidated financial statements and related notes not included in this prospectus. We derived the consolidated statements of operations data for the three months ended May 1, 2010 and April 30, 2011 and the consolidated balance sheet data as of April 30, 2011 from our unaudited consolidated financial statements included elsewhere in this prospectus. The unaudited interim consolidated financial statements have been prepared on the same basis as our audited consolidated financial statements and include, in our opinion, all adjustments, which include only normal recurring adjustments, that we consider necessary for the fair presentation of the financial information set forth in those financial statements. Historical results are not necessarily indicative of future results.
| Year ended | Three months ended | |||||||||||||||||||||||||||
| Jan. 31, 2007 |
Jan. 31, 2008 |
Jan. 31, 2009 |
Jan. 30, 2010 |
Jan. 29, 2011 |
May 1, 2010 |
Apr. 30, 2011 |
||||||||||||||||||||||
|
|
||||||||||||||||||||||||||||
| (unaudited) | ||||||||||||||||||||||||||||
| (in thousands, except per share data) | ||||||||||||||||||||||||||||
| Consolidated statements of operations data: |
||||||||||||||||||||||||||||
| Product revenue |
$ | 35,555 | $ | 56,490 | $ | 59,864 | $ | 49,523 | $ | 66,550 | $ | 14,103 | $ | 19,596 | ||||||||||||||
| Support revenue |
6,509 | 10,730 | 14,366 | 16,352 | 19,039 | 4,511 | 5,116 | |||||||||||||||||||||
|
|
|
|
|
|
|
|
|
|
|
|
|
|
|
|||||||||||||||
| Total revenue |
42,064 | 67,220 | 74,230 | 65,875 | 85,589 | 18,614 | 24,712 | |||||||||||||||||||||
| Cost of product revenue |
19,752 | 29,174 | 32,179 | 29,709 | 34,627 | 7,546 | 9,938 | |||||||||||||||||||||
| Cost of support revenue |
2,947 | 3,920 | 3,483 | 4,570 | 6,184 | 1,395 | 1,815 | |||||||||||||||||||||
|
|
|
|
|
|
|
|
|
|
|
|
|
|
|
|||||||||||||||
| Total cost of revenue(1) |
22,699 | 33,094 | 35,662 | 34,279 | 40,811 | 8,941 | 11,753 | |||||||||||||||||||||
|
|
|
|
|
|
|
|
|
|
|
|
|
|
|
|||||||||||||||
| Gross profit |
19,365 | 34,126 | 38,568 | 31,596 | 44,778 | 9,673 | 12,959 | |||||||||||||||||||||
|
|
|
|
|
|
|
|
|
|
|
|
|
|
|
|||||||||||||||
| Sales and marketing(1) |
17,625 | 28,413 | 33,759 | 28,540 | 32,068 | 7,868 | 9,327 | |||||||||||||||||||||
| Research and development(1) |
11,149 | 16,800 | 18,274 | 13,783 | 16,410 | 3,775 | 4,966 | |||||||||||||||||||||
| General and administrative(1) |
4,846 | 9,062 | 5,659 | 4,868 | 5,277 | 1,464 | 1,614 | |||||||||||||||||||||
|
|
|
|
|
|
|
|
|
|
|
|
|
|
|
|||||||||||||||
| Total operating expenses |
33,620 | 54,275 | 57,692 | 47,191 | 53,755 | 13,107 | 15,907 | |||||||||||||||||||||
|
|
|
|
|
|
|
|
|
|
|
|
|
|
|
|||||||||||||||
| Loss from operations |
(14,255 | ) | (20,149 | ) | (19,124 | ) | (15,595 | ) | (8,977 | ) | (3,434 | ) | (2,948 | ) | ||||||||||||||
| Interest income |
746 | 744 | 260 | 24 | 15 | — | 2 | |||||||||||||||||||||
| Interest expense |
(605 | ) | (76 | ) | (237 | ) | (1,065 | ) | (1,317 | ) | (339 | ) | (284 | ) | ||||||||||||||
| Other income (expense), net |
373 | 33 | (1,359 | ) | (389 | ) | (566 | ) | (136 | ) | (1,552 | ) | ||||||||||||||||
|
|
|
|
|
|
|
|
|
|
|
|
|
|
|
|||||||||||||||
| Loss before income taxes |
(13,741 | ) | (19,448 | ) | (20,460 | ) | (17,025 | ) | (10,845 | ) | (3,909 | ) | (4,782 | ) | ||||||||||||||
| Benefit from income taxes |
983 | 1,390 | 882 | 1,272 | 1,420 | 324 | 453 | |||||||||||||||||||||
|
|
|
|
|
|
|
|
|
|
|
|
|
|
|
|||||||||||||||
| Net loss |
$ | (12,758 | ) | $ | (18,058 | ) | $ | (19,578 | ) | $ | (15,753 | ) | $ | (9,425 | ) | $ | (3,585 | ) | $ | (4,329 | ) | |||||||
|
|
|
|
|
|
|
|
|
|
|
|
|
|
|
|||||||||||||||
-46-
Table of Contents
| Year ended | Three months ended | |||||||||||||||||||||||||||
| Jan. 31, 2007 |
Jan. 31, 2008 |
Jan. 31, 2009 |
Jan. 30, 2010 |
Jan. 29, 2011 |
May 1, 2010 |
Apr. 30, 2011 |
||||||||||||||||||||||
|
|
||||||||||||||||||||||||||||
| (unaudited) | ||||||||||||||||||||||||||||
| (in thousands, except per share data) | ||||||||||||||||||||||||||||
| Deemed dividend on exchange of preferred stock |
— | — | — | — | (940 | ) | — | — | ||||||||||||||||||||
| Net loss attributable to common stockholders |
$ | (12,758 | ) | $ | (18,058 | ) | $ | (19,578 | ) | $ | (15,753 | ) | $ | (10,365 | ) | $ | (3,585 | ) | $ | (4,329 | ) | |||||||
|
|
|
|
|
|
|
|
|
|
|
|
|
|
|
|||||||||||||||
| Net loss per share attributable to common stockholders, basic and diluted |
$ | (17.93 | ) | $ | (10.85 | ) | $ | (8.74 | ) | $ | (6.55 | ) | $ | (3.54 | ) | $ | (1.47 | ) | $ | (1.25 | ) | |||||||
|
|
|
|
|
|
|
|
|
|
|
|
|
|
|
|||||||||||||||
| Shares used in computing net loss per share attributable to common stockholders, basic and diluted (unaudited) |
711 | 1,665 | 2,241 | 2,404 | 2,930 | 2,438 | 3,465 | |||||||||||||||||||||
|
|
|
|
|
|
|
|
|
|
|
|
|
|
|
|||||||||||||||
| Pro forma net loss per common share, basic and diluted (unaudited) |
$ | (0.24 | ) | $ | (0.06 | ) | ||||||||||||||||||||||
|
|
|
|
|
|||||||||||||||||||||||||
| Pro forma shares used in calculation of basic and diluted net loss per share attributable to common stockholders, basic and diluted (unaudited) |
39,363 | 43,284 | ||||||||||||||||||||||||||
|
|
|
|
|
|||||||||||||||||||||||||
| Year ended | Three months ended | |||||||||||||||||||||||||||
| Jan. 31, 2007 |
Jan. 31, 2008 |
Jan. 31, |
Jan. 30, |
Jan. 29, |
May 1, |
Apr. 30, |
||||||||||||||||||||||
| (in thousands, unaudited) | ||||||||||||||||||||||||||||
| Other financial data: |
||||||||||||||||||||||||||||
| Adjusted EBITDA(2) |
$ | (12,441 | ) | $ | (17,044 | ) | $ | (14,875 | ) | $ | (10,739 | ) | $ | (5,146 | ) | $ | (2,514 | ) | $ | (1,546 | ) | |||||||
| As of | ||||||||||||||||||||||||
| Jan. 31, 2007 |
Jan. 31, 2008 |
Jan. 31, 2009 |
Jan. 30, 2010 |
Jan. 29, 2011 |
Apr. 30, 2011 |
|||||||||||||||||||
|
|
||||||||||||||||||||||||
| (unaudited) | ||||||||||||||||||||||||
| (in thousands) | ||||||||||||||||||||||||
| Consolidated balance sheet data: |
||||||||||||||||||||||||
| Cash and cash equivalents |
$ | 20,140 | $ | 8,978 | $ | 13,805 | $ | 10,711 | $ | 15,971 | $ | 16,084 | ||||||||||||
| Working capital |
22,013 | 8,442 | 14,286 | 4,126 | 17,716 | 12,187 | ||||||||||||||||||
| Total assets |
48,037 | 45,190 | 46,669 | 38,223 | 55,082 | 57,646 | ||||||||||||||||||
| Total debt and capital lease obligations |
— | 7,393 | 6,020 | 7,501 | 7,197 | 7,481 | ||||||||||||||||||
| Total liabilities |
21,174 | 34,834 | 32,197 | 37,943 | 41,681 | 48,022 | ||||||||||||||||||
| Convertible preferred stock |
79,510 | 79,510 | 102,617 | 102,617 | 121,699 | 121,699 | ||||||||||||||||||
| Common stock and additional paid-in-capital |
109,065 | 110,524 | 111,821 | 113,265 | 116,727 | 117,094 | ||||||||||||||||||
| Total stockholders’ equity (deficit) |
(52,647 | ) | (69,154 | ) | (88,145 | ) | (102,337 | ) | (108,298 | ) | (112,075 | ) | ||||||||||||
|
|
||||||||||||||||||||||||
| (1) | Includes stock-based compensation expense as follows: |
| Year ended | Three months ended | |||||||||||||||||||||||||||
| Jan. 31, 2007 |
Jan. 31, 2008 |
Jan. 31, 2009 |
Jan. 30, 2010 |
Jan. 29, 2011 |
May 1, 2010 |
Apr. 30, 2011 |
||||||||||||||||||||||
|
|
||||||||||||||||||||||||||||
| (unaudited) | ||||||||||||||||||||||||||||
| (in thousands) | ||||||||||||||||||||||||||||
| Cost of revenue |
$ | — | $ | — | $ | 51 | $ | 67 | $ | 44 | $ | 9 | $ | 11 | ||||||||||||||
| Sales and marketing |
61 | 370 | 498 | 610 | 476 | 86 | 116 | |||||||||||||||||||||
| Research and development |
26 | 155 | 282 | 366 | 254 | 69 | 62 | |||||||||||||||||||||
| General and administrative |
110 | 235 | 387 | 366 | 343 | 115 | 132 | |||||||||||||||||||||
|
|
|
|
|
|
|
|
|
|
|
|
|
|
|
|||||||||||||||
| Total stock-based compensation expense |
$ | 197 | $ | 760 | $ | 1,218 | $ | 1,409 | $ | 1,117 | $ | 279 | $ | 321 | ||||||||||||||
|
|
|
|
|
|
|
|
|
|
|
|
|
|
|
|||||||||||||||
-47-
Table of Contents
| (2) | We present Adjusted EBITDA, which we define as net loss excluding: |
| • | benefit from income taxes; |
| • | other income (expense), net; |
| • | interest expense; |
| • | interest income; |
| • | stock-based compensation; and |
| • | depreciation and amortization. |
| Adjusted EBITDA is a financial measure that is not calculated in accordance with GAAP. We exclude other income (expense), net from Adjusted EBITDA as it largely consists of mark to market and other expenses related to our warrants and foreign currency gain or losses. Gains from nonrecurring engineering projects included in other income (expense), net are all excluded from other income (expense), net when calculating Adjusted EBITDA. We have provided a reconciliation of Adjusted EBITDA, a non-GAAP financial measure, to net loss, the most directly comparable financial measure calculated and presented in accordance with GAAP. Adjusted EBITDA should not be considered as an alternative to net loss, operating income or any other measure of financial performance calculated and presented in accordance with GAAP. Our Adjusted EBITDA may not be comparable to similarly titled measures of other organizations because other organizations may not calculate Adjusted EBITDA in the same manner as we do. We have included Adjusted EBITDA in this prospectus because it is a basis upon which our management assesses financial performance and it eliminates the impact of items that we do not consider indicative of our core operating performance. In evaluating Adjusted EBITDA, you should be aware that in the future we will incur expenses similar to the adjustments in this presentation. Our presentation of Adjusted EBITDA should not be construed as an inference that our future results will be unaffected by these expenses or any unusual or nonrecurring items. |
| We reconcile net loss to Adjusted EBITDA as follows: |
| Year ended | Three months ended | |||||||||||||||||||||||||||
| Jan. 31, 2007 |
Jan. 31, 2008 |
Jan. 31, 2009 |
Jan. 30, 2010 |
Jan. 29, 2011 |
May 1, 2010 |
Apr. 30, 2011 |
||||||||||||||||||||||
|
|
||||||||||||||||||||||||||||
| (in thousands, unaudited) | ||||||||||||||||||||||||||||
| Net loss |
$ | (12,758 | ) | $ | (18,058 | ) | $ | (19,578 | ) | $ | (15,753 | ) | $ | (9,425 | ) | $ | (3,585 | ) | $ | (4,329 | ) | |||||||
| Benefit from income taxes |
(983 | ) | (1,390 | ) | (882 | ) | (1,272 | ) | (1,420 | ) | (324 | ) | (453 | ) | ||||||||||||||
| Other income (expense), net |
(373 | ) | (33 | ) | 1,359 | 389 | 566 | 136 | 1,832 | |||||||||||||||||||
| Interest expense |
605 | 76 | 237 | 1,065 | 1,317 | 339 | 284 | |||||||||||||||||||||
| Interest income |
(746 | ) | (744 | ) | (260 | ) | (24 | ) | (15 | ) | — | (2 | ) | |||||||||||||||
| Stock-based compensation |
197 | 760 | 1,218 | 1,409 | 1,117 | 279 | 321 | |||||||||||||||||||||
| Depreciation and amortization |
1,617 | 2,345 | 3,031 | 3,447 | 2,714 | 641 | 801 | |||||||||||||||||||||
|
|
|
|
|
|
|
|
|
|
|
|
|
|
|
|||||||||||||||
| Adjusted EBITDA |
$ | (12,441 | ) | $ | (17,044 | ) | $ | (14,875 | ) | $ | (10,739 | ) | $ | (5,146 | ) | $ | (2,514 | ) | $ | (1,546 | ) | |||||||
|
|
|
|
|
|
|
|
|
|
|
|
|
|
|
|||||||||||||||
-48-
Table of Contents
Management’s discussion and analysis of
financial condition and results of operations
The following discussion and analysis of the financial condition and results of our operations should be read in conjunction with the consolidated financial statements and related notes included elsewhere in this prospectus. This discussion contains forward-looking statements that involve risks and uncertainties. Our actual results could differ materially from those discussed below. Factors that could cause or contribute to such differences include, but are not limited to, those identified below, and those discussed in the sections titled “Risk Factors” and “Special Note Regarding Forward-looking Statements and Industry Data” included elsewhere in this prospectus.
Overview
We are a leading provider of high performance, highly scalable networked storage systems for businesses of all sizes. Our storage systems deliver the levels of performance, scalability, versatility and simplicity required to cost effectively manage the rapid growth of unstructured data, making them particularly suited for data-intensive applications such as server and desktop virtualization and cloud-based computing. Reliance on email, business documents, web pages, digital images, audio and video, as well as the document retention and access requirements of regulatory compliance are driving the rapid growth of unstructured data. The proliferation of unstructured data and the need to manage and access it at scale has resulted in the demand for next-generation storage systems that minimize the complexities and overcome the performance limitations of existing storage systems. Our storage systems leverage our proprietary file system and flexible architecture to meet the needs of today’s most demanding applications and to manage unstructured data at scale. We enable our customers to more effectively explore, discover, research, create, process and innovate in performance sensitive and data intensive environments. Our diverse customer base includes organizations in industries such as media and entertainment, e-Discovery, energy, the federal government, life sciences, Internet and cloud hosted service providers and other enterprises. As of April 30, 2011, over 750 customers worldwide have deployed over 2,000 of our storage systems.
We were founded in 1998 and began commercial shipments of our storage systems in 2001. In January 2004, we introduced our first generation storage systems aimed at customers seeking HPC solutions in industries such as genomics, oil and gas and media and entertainment. We have continued to innovate and advance our storage systems for HPC. We also leveraged the architecture of our HPC systems to expand our storage system offerings and address the mid-range market. The introduction of our mid-range storage systems in July 2009 resulted in us achieving significant revenue growth beginning in late fiscal 2010. Our solutions include an advanced suite of software features and data management software, such as our software that addresses desktop and server virtualization and cloud environments. We expect the volumes of our mid-range storage systems to increasingly become a significant portion of our sales. Our mid-range storage systems have been successful particularly in the enterprise market and have met the affordability and performance requirements of a much broader market. We plan to continue to invest in research and development efforts in both hardware and software for the mid-range storage systems to offer our customers increased performance within a similar price range as our previous generation mid-range systems. We also plan to continue offering increased performance at similar price points so that our products will remain price competitive and rival the system performance of our competitors’ storage systems in the mid-range market segment. If our next generation products are
-49-
Table of Contents
not able to compete on performance with our competitors’ systems and we are not able to price our products competitively, we could experience decreased sales.
We view the expansion of our technology partnerships with infrastructure vendors, application vendors and storage suppliers as key strategic priorities. We therefore plan to continue to invest in software development that will enable our product platform to work with or be part of various vendors’ ecosystems. We also plan to expand our storage supplier relationships to offer customers a choice of storage arrays, to improve our supply chain and to encourage competitive pricing from our suppliers.
Historically, the substantial majority of our sales were made through our direct sales force. Today we sell our storage systems through multiple channels, which include our direct sales force, our extensive network of channel partners and our OEM, HDS. HDS has sold our products to over 300 customers worldwide. HDS accounted for 22%, 30%, 41% and 45% of revenue in fiscal 2009, fiscal 2010, fiscal 2011 and the three months ended April 30, 2011, respectively. Although we have experienced an increasing percentage of our sales from HDS and remain dependent on the continued success of our relationship, we are investing in our direct sales force and other channel partners to grow revenue generated through these avenues. If we are not able to increase our direct or channel sales, our ability to grow revenue could be negatively impacted. We also intend to evaluate additional OEMs to leverage their global reach and continue to drive penetration into our traditional vertical markets and the enterprise market.
We outsource our manufacturing, repair and supply chain operations and also our spare parts logistics to increase our operational efficiency and flexibility. We also outsource some quality assurance related to research and development as well as product development activities.
We experienced a decrease in revenue in the last quarter of fiscal 2009 and in the first half of fiscal 2010 as a consequence of decreased information technology infrastructure spending caused by global economic conditions. In response, we implemented a variety of cost saving measures, which included a reduction in our direct sales force, and focused on the development of our mid-range storage systems. With the introduction of our mid-range storage systems and improving economic conditions, we achieved 30% growth in revenue from fiscal 2010 to fiscal 2011. To the extent our mid-range storage systems continue to gain acceptance in the market place and we penetrate deeper into various market segments, and to the extent the global economy shows signs of stabilization, we expect our revenue to continue to grow, but at a lower rate of growth than we experienced in fiscal 2011.
We have a history of net losses in each fiscal year since our inception as we have invested significantly in our product development, customer services and sales and marketing organizations to support the growth of our business. We financed our operations through the issue of preferred stock and debt securities. We plan to continue to invest in our sales channels, customer service and research and development organizations and infrastructure, which we expect will result in future net losses. We believe this strategy will better position us in the market to achieve substantial, long-term growth and market share in our business. Our ability to attain profitability over the long term will depend on our ability to increase revenue and maintain current gross margins while controlling expense growth. We intend to use the proceeds from this offering and other potential sources of funding, if and when available, to fund our growth.
-50-
Table of Contents
Key financial data
| Year ended | Three months ended | |||||||||||||||||||
| January 31, 2009 |
January 30, 2010 |
January 29, 2011 |
May 1, 2010 |
April 30, 2011 |
||||||||||||||||
|
|
||||||||||||||||||||
| (unaudited) | ||||||||||||||||||||
| (in thousands) | ||||||||||||||||||||
| Revenue |
$ | 74,230 | $ | 65,875 | $ | 85,589 | $ | 18,614 | $ | 24,712 | ||||||||||
| Gross profit |
38,568 | 31,596 | 44,778 | 9,673 | 12,959 | |||||||||||||||
| Net loss |
(19,578 | ) | (15,753 | ) | (9,425 | ) | (3,585 | ) | (4,329 | ) | ||||||||||
| Other financial data: |
||||||||||||||||||||
| Adjusted EBITDA (unaudited) |
$ | (14,875 | ) | $ | (10,739 | ) | $ | (5,146 | ) | $ | (2,514 | ) | $ | (1,546 | ) | |||||
|
|
||||||||||||||||||||
We present Adjusted EBITDA, which we define as net loss excluding:
| • | benefit from income taxes; |
| • | other income (expense), net; |
| • | interest expense; |
| • | interest income; |
| • | stock-based compensation; and |
| • | depreciation and amortization. |
Adjusted EBITDA is a financial measure that is not calculated in accordance with GAAP. We exclude other income (expense), net from Adjusted EBITDA as it largely consists of mark to market and other expenses related to our warrants and foreign currency gain or losses. Gains from nonrecurring engineering projects included in other income (expense), net are all excluded from other income (expense), net when calculating Adjusted EBITDA. We have provided a reconciliation of Adjusted EBITDA, a non-GAAP financial measure, to net loss, the most directly comparable financial measure calculated and presented in accordance with GAAP. Adjusted EBITDA should not be considered as an alternative to net loss, operating income or any other measure of financial performance calculated and presented in accordance with GAAP. Our Adjusted EBITDA may not be comparable to similarly titled measures of other organizations because other organizations may not calculate Adjusted EBITDA in the same manner as we do. We have included Adjusted EBITDA in this prospectus because it is a basis upon which our management assesses financial performance and it eliminates the impact of items that we do not consider indicative of our core operating performance. In evaluating Adjusted EBITDA, you should be aware that in the future we will incur expenses similar to the adjustments in this presentation. Our presentation of Adjusted EBITDA should not be construed as an inference that our future results will be unaffected by these expenses or any unusual or nonrecurring items.
Hitachi Data Systems arrangements
We have a Master Distribution Agreement, or MDA, with HDS. The MDA commits HDS to purchase specified dollar amounts of our product offerings through September 2011. Under the MDA, during fiscal 2010 and fiscal 2011, HDS prepaid $10.0 million and $5.0 million, respectively, for future purchases of our products. As partial consideration for these prepayments, during fiscal 2011 we issued to HDS vested warrants to purchase 206,184 shares of our common stock with a per share exercise price of $1.94 and expiration in 2017. We determined the fair value at issuance was $222,000 and recognized as a reduction in revenue upon HDS’ purchase of products using the prepayment.
-51-
Table of Contents
During fiscal 2011, HDS paid us $1.5 million for certain research and development projects. We recognized these amounts as a reduction in research and development expense as the associated projects were conducted. As of April 30, 2011, $537,000 remained included in customer deposits in our balance sheet. We have also received fees from HDS for an inventory supply agreement, whereby we set aside certain inventory quantities to be available for them as needed. The amount of support fees recognized for this service was $112,000, $682,000 and $321,000 in fiscal 2009, fiscal 2010 and fiscal 2011, respectively. This inventory arrangement expired at the end of fiscal 2011.
During fiscal 2009, we issued HDS vested warrants to purchase 151,418 shares of our common stock with a per share exercise price of $4.13 and a fair value at issuance of $194,000. The warrants were issued upon HDS’ achievement of specified revenue milestones for the sale of our products. These warrants expired unexercised in fiscal 2011. We recognized fair value of these warrants as a reduction in revenue.
Components of our results of operations
Revenue. We generate product revenue from sales of our storage systems in configurations tailored to meet our customers’ requirements. Our storage systems combine our file servers with an advanced software suite critical to the functionality of our SiliconFS file system, standard interfaces and multiple tiers of enterprise-class storage devices. We also license certain of our software separately to add functionality for our storage solution. We sell our SiliconFS file system and license additional software applications to HDS, which resells them in combination with its storage arrays. We generate our support revenue by providing hardware and software support and maintenance under contracts, which are generally one to three years, as well as installation, training and professional services. We generally ship our products and recognize the related revenue in the period in which the products are ordered and do not carry a significant backlog
from period to period. As such, our revenue in a given period is substantially dependent on sales in that period.
-52-
Table of Contents
We market and sell our storage systems, support and professional services primarily through our direct sales force or through resellers and other channel partners. We maintain sales operations, which include our direct sales force and our channel management personnel, in the United States, England, Germany, Canada, Norway and Australia. The following table summarizes by geographic region our total revenue in fiscal 2009, fiscal 2010, fiscal 2011 and the three months ended May 1, 2010 and April 30, 2011:
| Year ended | Three months ended | |||||||||||||||||||
| January 31, 2009 |
January 30, 2010 |
January 29, 2011 |
May 1, 2010 |
Apr. 30, 2011 |
||||||||||||||||
|
|
||||||||||||||||||||
| (unaudited) | ||||||||||||||||||||
| (in thousands) | ||||||||||||||||||||
| Revenue: |
||||||||||||||||||||
| United States |
$ | 51,645 | $ | 50,295 | $ | 59,492 | $ | 12,549 | $ | 17,218 | ||||||||||
| Canada |
8,830 | 1,932 | 3,943 | 1,915 | 806 | |||||||||||||||
| EMEA |
9,002 | 7,372 | 15,937 | 3,700 | 4,442 | |||||||||||||||
| Other |
4,753 | 6,276 | 6,217 | 450 | 2,246 | |||||||||||||||
|
|
|
|
|
|
|
|
|
|
|
|||||||||||
| Total |
$ | 74,230 | $ | 65,875 | $ | 85,589 | $ | 18,614 | $ | 24,712 | ||||||||||
|
|
|
|
|
|
|
|
|
|
|
|||||||||||
| Percent of revenue by geography: |
||||||||||||||||||||
| United States |
70 | % | 76 | % | 70 | % | 67 | % | 70 | % | ||||||||||
| Canada |
12 | 3 | 5 | 10 | 3 | |||||||||||||||
| EMEA |
12 | 11 | 19 | 20 | 18 | |||||||||||||||
| Other |
6 | 10 | 6 | 3 | 9 | |||||||||||||||
|
|
|
|
|
|
|
|
|
|
|
|||||||||||
| Total |
100 | % | 100 | % | 100 | % | 100 | % | 100 | % | ||||||||||
|
|
|
|
|
|
|
|
|
|
|
|||||||||||
We expect that sales in the United States will continue to contribute a substantial majority of our revenue for the foreseeable future. We plan to continue to add direct sales personnel in the United States, as well as elsewhere, and to expand our network of channel partners and resellers.
Cost of revenue
Cost of product revenue. Cost of product revenue consists primarily of the cost of components used to manufacture our SiliconFS file system and storage hardware, as well as manufacturing and assembly costs charged by our contract manufacturer. We make provisions for excess and obsolete inventory, if any, product warranty obligations, shipping charges, overhead allocations and personnel-related costs. Because our storage systems combine our proprietary SiliconFS file system and software with third party storage arrays, gross margins on these storage systems are lower than when we sell our file system and software on a standalone basis. We intend to continue to optimize our cost of product revenue through cost improvements and achievements of economies of scale. We expect our product gross margins to fluctuate over time depending on product configuration and channel mix shifts, as well as quarter to quarter volatility caused by large implementations of our storage systems.
Cost of support revenue. Cost of support revenue consists of customer service and technical support personnel and third party costs we incur in order to provide hardware repair and replacement services, installation, training and other professional services. We expect cost of support revenue to increase on an absolute basis as we continue to invest in our support infrastructure.
Operating expenses. Personnel-related costs, which include stock-based compensation, are the most significant component of each of our operating expense categories. We expect to hire significant numbers of additional employees in order to support our anticipated growth. In any particular period, the timing of additional hires could materially affect our operating expenses.
-53-
Table of Contents
We recently began outsourcing certain research and development, quality assurance related to research and development and product development activities and expect to continue to do so in the future to reduce costs.
Sales and marketing. Sales and marketing expenses represent the largest component of our operating expenses and include personnel-related costs, sales commissions, travel and marketing programs. We intend to continue to invest heavily in sales and marketing by increasing the number of sales and support personnel worldwide. New sales personnel do not immediately generate revenue and therefore we may not experience the full benefits of these additional sales personnel until they gain experience selling our storage systems. We expect sales and marketing costs to continue to increase in absolute dollars.
Research and development. Research and development expenses primarily include personnel-related costs, depreciation on lab equipment, prototype equipment, outsourced quality assurance and product development. In addition, we periodically perform nonrecurring research and development services for HDS, payment for which we offset against personnel and equipment costs. We expense research and development costs as incurred. Our research and development employees are based in England and the United States. A substantial majority of our research and development employees focus on software development. We expect our research and development expense to increase in absolute dollars.
General and administrative. General and administrative expenses consist primarily of personnel-related costs and facilities costs related to our executives, finance, human resource and information technology functions and fees for professional services. Professional services consist of outside legal, tax and audit. We expect our general and administrative expenses to increase in absolute dollars as we invest in additional infrastructure to support our growth and incur expenses as a result of operating as a public company, including increased audit and legal fees, compliance costs, investor relations expenses and higher insurance premiums.
Interest income. Interest income consists of interest income on our cash and cash equivalents balances. We have historically primarily invested our funds in deposits and money market accounts.
Interest expense. Interest expense primarily consists of interest accrued or paid and loan fees on our outstanding long-term capital growth facility agreement and/or our accounts receivable revolving line of credit.
Other income (expense), net. We classify our outstanding preferred stock warrants and certain common stock warrants as liabilities on our balance sheets and record changes in their fair value from period to period in other income (expense), net. In addition, we record fluctuations in foreign exchange rates on receivables and payables denominated in currencies other than the U.S. dollar in other income (expense), net.
Benefit from income taxes. To date, we have not paid material income taxes as a result of our losses. We receive tax benefits primarily due to the surrendering of our NOL carryforwards in the United Kingdom, in exchange for a cash refund for research and development activities in the United Kingdom. After fiscal 2014, we no longer expect to be eligible to surrender these NOLs and receive a cash tax refund as we expect to exceed certain specified statutory thresholds.
Critical accounting policies and estimates
We prepare our consolidated financial statements in accordance with GAAP. In many cases, the accounting treatment of a particular transaction is specifically dictated by GAAP and does not require our judgment in its application. In other cases, our judgment is required in selecting
-54-
Table of Contents
among available alternative accounting policies that allow different accounting treatment for similar transactions. The preparation of consolidated financial statements also requires us to make estimates and assumptions that affect the reported amounts of assets, liabilities, revenue, costs and expenses and related disclosures. We base our estimates on historical experience and various other assumptions that we believe are reasonable under the circumstances. In many instances, we could reasonably use different accounting estimates, and in some instances changes in the accounting estimates are reasonably likely to occur from period to period. Accordingly, actual results could differ significantly from the estimates made by our management. To the extent that there are differences between our estimates and actual results, our future financial statement presentation, financial condition, results of operations and cash flows will be affected. We believe that the accounting policies discussed below are critical to understanding our historical and future performance, as these policies relate to the more significant areas involving our judgments and estimates.
Revenue recognition. We recognize revenue, net of sales tax, when persuasive evidence of an arrangement exists, delivery has occurred, the fee is fixed or determinable and collection is probable. These criteria are usually met for hardware and software license elements when the storage system is shipped to the customer. For evaluation units, we do not recognize revenue until receipt and acceptance of the customer’s purchase order requesting conversion of the unit into a sale. We defer support revenue and recognize it ratably over the period during which the support is to be performed, which is typically from one to three years.
For channel partner sales, we evaluate whether fees are fixed or determinable by considering a number of factors, including payment terms, the channel partner’s credit standing and financial position and our contractual relationship and past history with the particular channel partner. If the fees are not deemed to be fixed or determinable, we delay the shipment or, if product is shipped, defer recognition of revenue until there is persuasive evidence that fees are fixed or determinable and that collection is probable. Persuasive evidence may include copies of end customer purchase orders, cash payments or letters of credit guaranteeing cash payments, reports from channel partners documenting sell-through activity, data indicating an order has shipped to an end customer or other similar information. We do not offer channel partners return rights, rebate, price protection or other similar rights.
Deferred revenue balances consist of deferred support revenue and deferred product revenue.
Our storage systems are typically sold with multiple elements: hardware and perpetual software licenses for the embedded software and support services that entitle customers during the support services term to telephone support and unspecified software upgrades, bug fixes and patch releases, which are offered on a when-and-if-available basis. The hardware in our storage systems is integrated with software that is essential to the functionality of the equipment, except for certain optional software features, and more than incidental to the storage system as a whole. Accordingly, we applied the accounting standards for software revenue recognition for all transactions involving the sales of software and related services for all periods prior to January 30, 2011. For these fiscal years, we allocated revenue between delivered hardware and software elements and undelivered support services using the residual value method. Under the residual method the amount equal to the fair value of the undelivered support services, also known as vendor specific objective evidence, or VSOE, is deferred and amortized over the period when such services are provided and any remaining amounts are attributed to the delivered hardware and software elements and are recognized when those items are delivered. VSOE represents the price charged for a deliverable when it is sold separately.
-55-
Table of Contents
We established VSOE of fair value for our support services. For arrangements where support renewal rates are not contractually stated, fair value is established based on the pricing analysis of our actual support renewals. For arrangements with contractually stated support renewal rates, fair value of one year of support services is established by reference to the contractually stated renewal rates.
In October 2009, the Financial Accounting Standards Board, or FASB, issued an accounting standards update, which removes tangible products containing software components and non-software components that function together to deliver the product’s essential functionality from the scope of industry specific software revenue guidance. At the same time, FASB amended the accounting standard for multiple element revenue arrangements, which are not in the scope of industry specific software revenue recognition guidance, to provide updated guidance to separate the deliverables and to measure and allocate arrangement consideration to one or more units of accounting. The new guidance eliminates the use of the residual method and requires an entity to allocate arrangement consideration at the inception of the arrangement to all deliverables using the relative selling price method. In contrast to the residual method, this has the effect of allocating any inherent discount in a multiple element arrangement to each of the deliverables on a proportionate basis. The guidance also expands the disclosure requirements to require an entity to provide both qualitative and quantitative information about the significant judgments made in applying the revised guidance and subsequent changes in those judgments that may significantly affect the timing or amount of revenue recognition. The revised revenue recognition accounting standards are effective for revenue arrangements entered into or materially modified in fiscal years beginning on or after June 15, 2010.
We adopted the new revenue recognition guidance for arrangements with multiple deliverables on a prospective basis for new or modified arrangements entered on or after January 30, 2011. We now allocate arrangement consideration at the inception of the arrangement to all deliverables using the relative selling price method unless the amount allocated to delivered hardware and software elements exceeds the arrangement consideration that is not contingent upon delivery of support services. This method requires us to determine the selling price at which each deliverable could be sold if it were sold regularly on a standalone basis. Under this approach, the selling price of a deliverable is determined by using a selling price hierarchy which requires the use of VSOE of fair value if available, third party evidence, or TPE, if VSOE is not available, or estimated selling price, or ESP, if neither VSOE nor TPE is available. Since we generally do not have standalone sales of our hardware and software products, the use of VSOE is limited to support services. TPE of selling price is established by evaluating largely interchangeable competitor products or services in standalone sales to similarly situated customers. However, since our competitors do not generally sell tangible products and perpetual licenses on a standalone basis except for limited cases, no consistent pricing information is available. Therefore, we concluded that no reliable TPE is available for our products and services. We determine ESP by considering multiple factors including, but not limited to, market conditions, sales channels, internal costs and product margin objectives, and pricing practices. Due to the complexity of our product offerings, we determine the price in each transaction based on the pricing of competitive product offerings and that specific customer’s needs. We do not differentiate the pricing of our products based on market segments, sales channels or geography. Consistent with our overall pricing practices, we establish one ESP for each deliverable for all customer segments.
-56-
Table of Contents
We determine ESP for our tangible products, including tangible products requiring essential bundled software, based on our anticipated gross margin on hardware components and value added features relating to essential software. Our estimate of gross margin is the highest for servers which have the highest value added element. In developing our estimate of gross margin we consider historical margin on standalone sales of tangible products as a result of customers either purchasing new systems or upgrading their existing systems as well as overall margin goals for our business. We estimate the value of the features relating to essential software by evaluating list prices for such software and historical discounts to list prices in our bundled arrangements as well as discounts to list prices in standalone sales of our optional software.
We determine the selling price for our support offerings based on VSOE of fair value.
We determine ESP for perpetual licenses relating to our optional software based on list prices adjusted for a discount which is estimated by considering historical discounts in standalone sales of our optional software. This approach is consistent with our current business practices since our list prices for software licenses are established with the objective of reflecting the relative value of such licenses compared to other deliverables while our historical discounts reflect customer and market specific pricing considerations. We further corroborate ESP for software licenses by comparing the pricing of our support as a percentage of software license ESP with pricing practices used in software industry.
We regularly review and update our ESP information and obtain formal approval by appropriate levels of management.
We continue to account for optional software applications and related support services included in a multiple element arrangement under industry specific software revenue recognition guidance using the residual method. Revenue is first allocated to the nonsoftware deliverables and to the software deliverables as a group using the relative selling prices of each of the deliverables in the arrangement based on the selling price hierarchy described above. Next, under the residual method, we defer revenue from the sale equivalent to the VSOE of the fair value of software support services and apply any inherent discounts to the delivered software element.
The adoption of the new revenue recognition guidance did not result in changes of the individual deliverables to which we allocate revenue, or the timing of recognition of revenue for the individual deliverables. The change in the allocation method from residual to relative selling price did not have a material impact on our financial statements during the three months ended April 30, 2011.
Income taxes. We use the asset and liability method of accounting for income taxes. We recognize deferred tax assets and liabilities for the estimated future tax consequences attributable to differences between the consolidated financial statement carrying amounts of existing assets and liabilities and their respective tax bases. Deferred tax assets and liabilities are measured using enacted tax rates expected to apply to taxable income in the years in which those temporary differences are expected to be recovered or settled. We establish valuation allowances when necessary to reduce deferred tax assets where management concludes that it is more likely than not that the deferred tax assets will not be realized based upon the available evidence.
We record a liability for the uncertain tax positions taken or expected to be taken on our tax return when it is more likely than not that the tax position might be challenged and additional
-57-
Table of Contents
taxes may be due as a result, despite our belief that the tax return positions are fully supportable. To the extent that our assessment of our tax positions change, the change in estimate is recorded in the period in which the determination is made. The provision for income taxes includes the impact of provisions for uncertain tax positions.
Warranty reserve. We provide three year and 90 day warranties for our hardware and software, respectively. These warranty periods are extended for customers who purchase additional hardware support after the warranty period has expired. We estimate the costs that we may incur under our warranty obligations and record a liability concurrent with the revenue recognition, which is included in other accrued liabilities and other long-term liabilities. The warranty accrual is based on our historical experience of product replacements, repair costs and ongoing product failure rates and for specific failure issues, if necessary. Each period, we assess the adequacy of our recorded warranty reserve and make adjustments we deem necessary. We record warranty cost as part of our cost of product revenue.
Inventory. Inventories include the cost of materials, labor and related manufacturing overhead and are adjusted to approximate the lower of cost or market value. Raw materials consist principally of storage system components and finished goods are comprised of assembled storage systems. We write down inventory to market value if lower than cost, based on current inventory levels, projected realizable values and demand, expected lives and technological obsolescence of the products or component parts.
Service spares inventory consists of components used to support the field services organization. In addition, in order to fulfill our hardware warranty obligations, we hold storage system components at our logistics provider’s depots that are used to repair and replace broken hardware. We establish an inventory valuation reserve for spares inventory to reduce the carrying amounts of the inventories to their net estimated realizable values. We estimate these net estimated realizable values by analyzing historical failure rates and past usage of service components, expected lives and support terms, technological obsolescence and economic factors.
Evaluation storage systems are finished goods located at customer sites, as some of our customers test our storage systems prior to purchase primarily for a period of up to 90 days. At the end of the evaluation period, a customer may decide to either purchase the system or return the system to us at no further cost or obligation. We disassemble returned evaluation storage systems and we hold the related components as raw materials. We adjust the inventory value of evaluation storage systems for expected wear and tear based upon factors that include past experience of diminution in value of returned evaluation storage systems and the length of time the storage systems are at our customers’ sites.
We include the reserve provision for all inventories in cost of product revenue. Once the lower cost basis is established, subsequent changes in facts or circumstances do not result in the restoration or increase in that newly established cost basis. Historically, we have written off excess and obsolete inventory during product transitions.
Stock-based compensation. We grant our employees options to purchase our common stock. Effective February 1, 2006, we utilize the fair value recognition method of accounting for stock-based employee compensation arrangements, which requires us to measure the stock-based compensation costs of stock-based compensation arrangements based on the grant date fair value, and recognize the costs in the financial statements over the employees’ requisite service period. We adopted the above guidance using the modified prospective transition method.
-58-
Table of Contents
Under this transition method, the new fair value recognition provisions are applied to option grants on and after July 1, 2005. We expense all options granted or modified after July 1, 2005 on a straight-line basis. We measure the cost of employee services received in exchange for an award of equity instruments, including stock options, based on the grant date fair value of the award. We recognize the fair value of the employee awards that vest based only on employees’ continuing service on a straight-line basis over the requisite service period, which is generally the vesting period. For employee awards with performance conditions, we recognize expense separately for each vesting event of the award to the extent we determine it is probable that the performance goals will be achieved. We continue to recognize this expense until such time as the vesting event is achieved or becomes unachievable. The fair value of the options granted to nonemployees is revalued as they vest, and the resulting change in value, if any, is recognized as expense during the period the related services are rendered. We estimate the fair value of stock-based awards on the grant date using an option pricing model.
In future periods, our stock-based compensation expense is expected to increase as a result of our existing unrecognized stock-based compensation still to be recognized combined with the issuance of additional stock-based awards in order to attract and retain employees and nonemployee consultants.
Significant factors, assumptions and methodologies used in determining fair value. The fair value of options on the grant date is estimated using the Black-Scholes option-pricing model, which requires the use of certain subjective assumptions including expected term, volatility, risk-free interest rate and the fair value of our common stock. Compensation expense is recognized on awards ultimately expected to vest and reduced for forfeitures that are estimated at the time of grant and revised, if necessary, in subsequent periods if actual forfeitures differ from those estimates. These assumptions generally require significant judgment.
The fair value of each new employee option awarded was estimated on the grant date for the periods below using the Black-Scholes option-pricing model with the following assumptions:
| For the year ended January 29, 2011 |
Three months ended May 1, 2010 |
Three months ended April 30, 2011 |
||||||||||
|
|
||||||||||||
| Risk-free interest rate |
1.4% - 2.7% | 2.4% - 2.7% | 2% | |||||||||
| Expected term (in years) |
4.5 | 4.5 | 4.9 | |||||||||
| Expected dividend |
0% | 0% | 0% | |||||||||
| Expected volatility |
50% - 51% | 50% | 53% | |||||||||
|
|
||||||||||||
Our assumptions used in the Black-Scholes model are discussed below:
Expected volatility. As we have no active trading history for our common stock, we have derived our expected volatility from historical volatilities of several peer public companies deemed to be comparable to our business.
Expected term. The expected term represents the period that our stock-based awards are expected to be outstanding and was estimated based on patterns of historical exercises and post-vesting cancellations and the options’ contractual term.
Risk-free interest rate. The risk-free interest rate is based on the U.S. Treasury yield in effect at the time of grant for zero coupon U.S. Treasury notes with maturities approximately equal to each award’s expected term.
Expected dividend. The expected dividend was assumed to be zero as we have never paid dividends and have no current plans to do so.
-59-
Table of Contents
We estimate our forfeiture rate based on an analysis of our actual forfeitures, employee turnover and other factors.
The absence of an active market for our common stock also required our board of directors, the members of which we believe have extensive business, finance and venture capital experience, to estimate the fair value of our common stock for purposes of granting options and for determining stock-based compensation expense for the periods presented. In response to these requirements, our board of directors’ practice has been to estimate the fair market value of common stock at each meeting at which options were granted. We have obtained contemporaneous third party valuations to assist our board of directors in determining fair market value. We have historically granted stock options at not less than the fair market value of our common stock as determined at the time of grant. These contemporaneous third party valuations used the methodologies, approaches and assumptions consistent with the American Institute of Certified Public Accountants Practice Guide, Valuation of Privately-Held-Company Equity Securities Issued as Compensation, or the AICPA Practice Guide.
The following table summarizes the options granted or existing grants we modified during fiscal 2011 and the three months ended April 30, 2011:
| Date of grants | Number of shares granted |
Exercise price per share |
||||||
|
|
||||||||
| April 2010 |
240,767 | $ | 1.94 | |||||
| September 2010 |
841,108 | 1.42 | ||||||
| October 2010 |
306,261 | 1.42 | ||||||
| December 2010 |
42,000 | 1.71 | ||||||
| March 2011 |
347,500 | 1.78 | ||||||
|
|
|
|||||||
| 1,777,636 | ||||||||
|
|
|
|||||||
Our board of directors determined the fair value of our common stock based on an evaluation of numerous objective and subjective factors as of the date of each grant including the following:
| • | contemporaneous valuations by an unrelated third party valuation firm; |
| • | the prices of the recent preferred stock sales to investors in arms-length transactions; |
| • | our capital resources and financial condition; |
| • | the preferences held by our preferred stock classes in favor of our common stock; |
| • | the likelihood and timing of achieving a liquidity event, such as an initial public offering or sale of our company given prevailing market conditions; |
| • | our historical operating and financial performance as well as management’s estimates of future financial performance; |
| • | recent acquisitions and valuations of comparable companies; |
| • | the hiring of key personnel; |
| • | the status of our development, product introduction and sales efforts; |
| • | revenue growth; |
| • | industry information such as market growth and volume and macro-economic events; and |
| • | additional objective and subjective factors relating to our business. |
-60-
Table of Contents
The valuations that our board of directors considered in making its determination of the fair value of our common stock utilized a probability-weighted expected return method, or PWERM. This valuation method was considered to be most appropriate given the status of our business and the anticipated liquidity events. Under PWERM, the valuations assigned probabilities and timing estimates to potential liquidity events for us based on a variety of factors, including primarily our recent operating history, the amount of cash held by us and the preferences held by the preferred stock relative to our common stock. Three principal scenarios were examined: a merger or acquisition, or M&A, scenario; an initial public offering, or IPO, scenario; and a scenario in which we continue to operate as a private entity. For each valuation date, we prepared a financial forecast to be used in the computation of the enterprise value. The financial forecasts took into account our past experience and future expectations.
To arrive at a value for common shares under the M&A scenario and the IPO scenario, the market approach and specifically, the guideline public company method, was used to estimate our total stockholder value at the time of the respective anticipated liquidity event. The guideline public
company method estimates the fair value of a company by applying to that company market revenue multiples of publicly traded firms in similar lines of business. When choosing the comparable companies to be used for the guideline public company method, the valuations focused on companies in the computer storage industry. Some of the specific criteria used to select and analyze comparable companies within our industry included the business description, business size, projected growth, financial condition and historical operating results. The valuations analyzed the business and financial profiles of the selected companies for relative similarity to us, and once such differences and similarities were determined and proper adjustments were made, determined an appropriate total stockholder value revenue multiple for us. This revenue multiple was applied to the trailing 12 months’ revenue to arrive at our anticipated total stockholder value at the time of the anticipated future liquidity event. The total stockholder value was then allocated amongst share classes based on the amount of liquidation preferences, and the resulting values were discounted to the present value using a discount rate which accounted for the market cost of capital and risk.
To estimate the value of the common shares under the continuing to operate as a private company scenario, the valuations used two approaches: a guideline public company method (market approach), and a discounted cash flow approach (income approach). The guideline public company method, as discussed previously, was applied at the valuation date to estimate the total stockholder value of the company at the present. Under the discounted cash flow approach, the valuations analyzed the forecast of our expected future financial performance, and discounted those amounts to present value using an appropriate discount rate which reflected the then-current company’s cost of capital. The total stockholder values determined by the guideline public company method and the discounted cash flow approach were weighed to arrive at a single enterprise value for the continuing to operate as a private company scenario. Subsequently, this total stockholder value was apportioned to the various classes of our stock, based on their respective liquidation preferences, to arrive at a value for the common shares under the continuing to operate as a private company scenario. Finally, the valuations applied a marketability discount to reflect the fact that our common stockholders were unable to liquidate their holdings at will, or possibly at all.
The common stockholder values under each of the scenarios were probability weighed to arrive at an indication of value for our common equity.
-61-
Table of Contents
The following table provides some key assumptions utilized in the contemporaneous third party valuations at each respective grant or modification date:
| Grant date | Derived common stock value |
Expected liquidity timing |
Probability % weighting of potential outcomes (IPO, M&A, Private) |
Discount rate | Remain for lack of |
|||||||||||||||
|
|
||||||||||||||||||||
| April 2010 grants |
$ | 1.94 | June 2011 | 25%, 40%, 35% | 31% | 35% | ||||||||||||||
| September & October 2010 grants |
$ | 1.42 | June 2011 | 25%, 35%, 40% | 31% | 37% | ||||||||||||||
| December 2010 grants |
$ | 1.71 | June 2011 | 25%, 45%, 30% | 32% | 39% | ||||||||||||||
| March 2011 grants |
$ | 1.78 | March 2012 | 25%, 45%, 30% | 33% | 38% | ||||||||||||||
|
|
||||||||||||||||||||
Determining the fair value of the enterprise using PWERM requires us to estimate the probability and timing of IPO and non-IPO scenarios. Changes to the timing and probability estimates can significantly affect the fair value of the enterprise. In addition, our calculations are sensitive to highly subjective assumptions relating to an appropriate present value discount rate that we were required to make at each valuation date. Our present value discount rate was determined using a Capital Asset Pricing Model, or CAPM. The discount rate was based on an analysis of comparable companies in the computer storage industry. We also compared the results of the CAPM discount rate analysis to discount rates published in various studies of venture capital required rate of return for investments in companies of an equivalent stage of development.
April to September 2010. The lower common stock value for the September and October 2010 grants as compared to the common stock value for the April 2010 grants was primarily due to the issuance of our Series GG convertible preferred stock in July 2010. During the first half of 2010, we lowered our financial forecasts from the one in existence at the beginning of 2010 and used for the valuation of the April 2010 grants as we continued to develop and elaborate on our business plan and multi-year financial model. Finally, a slightly lower estimated probability assigned to an M&A scenario occurring by the middle of 2011 and a slightly higher estimated probability assigned to a remain private scenario (which had a lower derived value for our company compared to the M&A scenario) lowered the common stock value.
October to December 2010. The higher common stock value for the December 2010 grants compared to the September and October 2010 value is primarily due to our higher estimated probability of an M&A scenario at those dates; progress towards achieving the projected financial forecast; the passage of time toward the expected liquidity event date; and slightly higher peer company comparable valuations. We estimated a higher probability of the M&A scenario primarily as a result of the increased number of public company acquisitions of comparable companies in our industry.
December 2010 to March 2011. The higher common stock value for the March 2011 grants compared to the December 2010 grants is primarily due to the incorporation of a higher financial forecast due to an improved outlook for our business, partially offset by the extension of time anticipated for the liquidity events. The improved outlook was a result of the ongoing acceptance of our mid-range storage systems into the enterprise market, the anticipation of new product features expanding on the capabilities of our high-end storage system offerings and the overall anticipated growth of our industry as well as expected improvements in the overall macro-economic environment. The extension of time anticipated for the liquidity events was primarily due to management’s assessment of a potential liquidity event date and the length of time it would take to complete an IPO process.
-62-
Table of Contents
Convertible preferred stock warrants and common stock warrants.
Convertible preferred stock warrants. We classify freestanding warrants to purchase shares of our convertible preferred stock as liabilities on our consolidated balance sheets carry them at fair value, because the warrants may obligate us to transfer assets to the holders under certain circumstances (e.g., upon a change in control) at some point in the future. The warrants are subject to remeasurement at each balance sheet date, and any change in fair value is recognized as a component of other income (expense), net in the consolidated statements of operations. We estimated the fair value of these warrants at issuance and at the respective balance sheet dates using the Black-Scholes option pricing model or a binomial model, to the extent the warrants had antidilutive features. The various estimates and assumptions inputted into these models are highly judgmental and could differ significantly in the future.
As of January 30, 2010, we had outstanding warrants to purchase an aggregate of 397,847 shares of our Series CC and Series FF convertible preferred stock. As of January 29, 2011 and April 30, 2011, we had outstanding warrants to purchase an aggregate of 913,111 shares of our Series FF, Series FF-1 and Series GG convertible preferred stock. The aggregate fair value of our warrants was $1.3 million, $1.8 million and $3.6 million as of January 30, 2010, January 29, 2011 and April 30, 2011, respectively, and these amounts were recorded on our consolidated balance sheets as a warrant liability within current liabilities. The change in fair value of these warrants resulted in a gain to other income (expense), net in the amount of $134,000, a loss of $372,000, a loss of $5,000 and a loss of $1.8 million during fiscal 2009, fiscal 2010, fiscal 2011 and the three months ended April 30, 2011, respectively.
We will continue to record adjustments to the fair value of the warrants until they are exercised, converted into warrants to purchase common stock or expire, at which time the warrants will no longer be remeasured at each balance sheet date. Upon the closing of this offering, for example, all outstanding warrants to purchase shares of our convertible preferred stock will become warrants to purchase shares of our common stock and, as a result, will no longer be remeasured. The then-current aggregate fair value of these warrants at the time of the offering will be reclassified from liabilities to additional paid-in capital, a component of stockholders’ (equity) deficit.
Common stock warrants. We have issued warrants to purchase our common stock that have certain exercise features not indexed to our common stock. These features require such warrants to be classified as liabilities and remeasured to fair value at each balance sheet date, with any change in fair value recognized as a component of other income (expense), net. These common stock warrants were issued to our growth facility lender as part of the renegotiated terms of the loan. We issued warrants to purchase 174,371 and 100,170 shares of our common stock in April 2010 and January 2011, respectively. The number of shares subject to the warrant issued in April 2010 was subject to a one-time reduction if we did not achieve certain levels of earnings during quarters within fiscal 2011. The number of shares subject to the warrant issued in January 2011 is subject to a one-time reduction if we do not achieve certain levels of earnings during quarters within fiscal 2012. The number of shares subject to the reduction varies depending on the quarter in which we do not achieve the requisite level of earnings, and the principal on the loan will begin to amortize. We achieved the contractual levels of earnings during fiscal 2011 and expect to achieve all contractual levels of earnings during fiscal 2012, such that there has been, and we expect, no reduction in the number of shares underlying these warrants.
-63-
Table of Contents
We will continue to record adjustments to the fair value of these warrants until the number of shares of common stock underlying the warrants is no longer subject to change. At that time, the then-current fair value of these warrants will be reclassified from liabilities to additional paid-in capital.
We estimated the fair value of these warrants at issuance and at the respective balance sheet dates using the Black-Scholes option pricing model under various probability-weighted outcomes and estimates and assumptions, including the probabilities of achieving the quarterly earnings levels, fair value and volatility of our stock, the remaining contractual term of the warrants, risk-free interest rates and expected dividend yield.
As of January 29, 2011, we had an outstanding warrant to purchase an aggregate of 174,371 shares of our common stock with a fair value of $208,000 for which the number of shares was no longer subject to change and that were reclassified to equity. The change in the fair value of this warrant throughout the remeasurement period during fiscal 2011 resulted in a gain to other income (expense), net in the amount of $64,000.
As of January 29, 2011, we also had an outstanding warrant to purchase an aggregate of 100,170 shares of our common stock with a fair value of $135,000. The change in the fair value of this warrant during the three months ended April 30, 2011 resulted in a loss to other income (expense), net in the amount of $198,000.
We have also issued warrants to purchase common stock to HDS in connection with HDS’s achievement of certain revenue milestones as well as for prepayments for our products. We estimated the fair value of these warrants at the respective issuance dates using the Black-Scholes option pricing model and various estimates and assumptions, including fair value and volatility of our common stock, the remaining contractual term of the warrants, risk-free interest rates and expected dividend yield. The fair value of these common stock warrants at issuance was recorded on our consolidated balance sheets in stockholders’ deficit and was not subject to remeasurement. Warrants to purchase a total of 151,418 shares of our common stock at a fair value at issuance of $194,000 were issued to HDS in fiscal 2009. These warrants expired unexercised in fiscal 2011. The fair value of these warrants was recognized as a reduction in revenue. We issued HDS warrants to purchase a total of 206,184 shares of our common stock with a fair value at issuance of $222,000 in fiscal 2011. The fair value of these warrants was also recorded as a reduction in revenue.
-64-
Table of Contents
Results of operations
The following table sets forth our historical operating results for fiscal 2009, fiscal 2010, fiscal 2011 and the three months ended May 1, 2010 and April 30, 2011, respectively. The period to period comparison of financial results is not necessarily indicative of the financial results we may achieve in future periods and the results for the three months ended April 30, 2011 are not necessarily indicative of financial results to be expected for the full fiscal year or any other period.
| Year ended | Three months ended | |||||||||||||||||||
| January 31, 2009 |
January 30, 2010 |
January 29, 2011 |
May 1, 2010 |
April 30, 2011 |
||||||||||||||||
|
|
||||||||||||||||||||
| (unaudited) | ||||||||||||||||||||
| (in thousands) | ||||||||||||||||||||
| Consolidated statements of operations data: |
||||||||||||||||||||
| Product revenue |
$ | 59,864 | $ | 49,523 | $ | 66,550 | $ | 14,103 | $ | 19,596 | ||||||||||
| Support revenue |
14,366 | 16,352 | 19,039 | 4,511 | 5,116 | |||||||||||||||
|
|
|
|
|
|
|
|
|
|
|
|||||||||||
| Total revenue |
74,230 | 65,875 | 85,589 | 18,614 | 24,712 | |||||||||||||||
| Cost of product revenue |
32,179 | 29,709 | 34,627 | 7,546 | 9,938 | |||||||||||||||
| Cost of support revenue |
3,483 | 4,570 | 6,184 | 1,395 | 1,815 | |||||||||||||||
|
|
|
|
|
|
|
|
|
|
|
|||||||||||
| Total cost of revenue |
35,662 | 34,279 | 40,811 | 8,941 | 11,753 | |||||||||||||||
|
|
|
|
|
|
|
|
|
|
|
|||||||||||
| Gross profit |
38,568 | 31,596 | 44,778 | 9,673 | 12,959 | |||||||||||||||
|
|
|
|
|
|
|
|
|
|
|
|||||||||||
| Sales and marketing |
33,759 | 28,540 | 32,068 | 7,868 | 9,327 | |||||||||||||||
| Research and development |
18,274 | 13,783 | 16,410 | 3,775 | 4,966 | |||||||||||||||
| General and administrative |
5,659 | 4,868 | 5,277 | 1,464 | 1,614 | |||||||||||||||
|
|
|
|
|
|
|
|
|
|
|
|||||||||||
| Total operating expenses |
57,692 | 47,191 | 53,755 | 13,107 | 15,907 | |||||||||||||||
|
|
|
|
|
|
|
|
|
|
|
|||||||||||
| Loss from operations |
(19,124 | ) | (15,595 | ) | (8,977 | ) | (3,434 | ) | (2,948 | ) | ||||||||||
| Interest income |
260 | 24 | 15 | — | 2 | |||||||||||||||
| Interest expense |
(237 | ) | (1,065 | ) | (1,317 | ) | (339 | ) | (284 | ) | ||||||||||
| Other expense, net |
(1,359 | ) | (389 | ) | (566 | ) | (136 | ) | (1,552 | ) | ||||||||||
|
|
|
|
|
|
|
|
|
|
|
|||||||||||
| Loss before income taxes |
(20,460 | ) | (17,025 | ) | (10,845 | ) | (3,909 | ) | (4,782 | ) | ||||||||||
| Benefit from income taxes |
882 | 1,272 | 1,420 | 324 | 453 | |||||||||||||||
|
|
|
|
|
|
|
|
|
|
|
|||||||||||
| Net loss |
$ | (19,578 | ) | $ | (15,753 | ) | $ | (9,425 | ) | $ | (3,585 | ) | $ | (4,329 | ) | |||||
|
|
|
|
|
|
|
|
|
|
|
|||||||||||
|
|
||||||||||||||||||||
| Year ended | Three months ended | |||||||||||||||||||
| January 31, 2009 |
January 30, 2010 |
January 29, 2011 |
May 1, 2010 |
April 30, 2011 |
||||||||||||||||
|
|
||||||||||||||||||||
| (unaudited) | ||||||||||||||||||||
| (as a percentage of revenue) | ||||||||||||||||||||
| Consolidated statements of operations data: |
||||||||||||||||||||
| Product revenue |
81 | % | 75 | % | 78 | % | 76 | % | 79 | % | ||||||||||
| Support revenue |
19 | 25 | 22 | 24 | 21 | |||||||||||||||
|
|
|
|
|
|
|
|
|
|
|
|||||||||||
| Total revenue |
100 | 100 | 100 | 100 | 100 | |||||||||||||||
| Cost of product revenue |
43 | 45 | 41 | 41 | 40 | |||||||||||||||
| Cost of support revenue |
5 | 7 | 7 | 7 | 8 | |||||||||||||||
|
|
|
|
|
|
|
|
|
|
|
|||||||||||
| Total cost of revenue |
48 | 52 | 48 | 48 | 48 | |||||||||||||||
|
|
|
|
|
|
|
|
|
|
|
|||||||||||
| Gross profit |
52 | 48 | 52 | 52 | 52 | |||||||||||||||
| Sales and marketing |
45 | 43 | 38 | 42 | 38 | |||||||||||||||
| Research and development |
25 | 21 | 19 | 20 | 20 | |||||||||||||||
| General and administrative |
8 | 8 | 6 | 8 | 6 | |||||||||||||||
|
|
|
|
|
|
|
|
|
|
|
|||||||||||
| Total operating expenses |
78 | 72 | 63 | 70 | 64 | |||||||||||||||
|
|
|
|
|
|
|
|
|
|
|
|||||||||||
| Loss from operations |
(26 | ) | (24 | ) | (11 | ) | (18 | ) | (12 | ) | ||||||||||
| Interest income |
— | — | — | — | — | |||||||||||||||
| Interest expense |
— | (2 | ) | (2 | ) | (2 | ) | (1 | ) | |||||||||||
| Other expense, net |
(2 | ) | (1 | ) | (1 | ) | (1 | ) | (6 | ) | ||||||||||
|
|
|
|
|
|
|
|
|
|
|
|||||||||||
| Loss before income taxes |
(28 | ) | (27 | ) | (14 | ) | (21 | ) | (19 | ) | ||||||||||
| Benefit from income taxes |
1 | 2 | 2 | 2 | 2 | |||||||||||||||
|
|
|
|
|
|
|
|
|
|
|
|||||||||||
| Net loss |
(27 | )% | (25 | )% | (12 | )% | (19 | )% | (17 | )% | ||||||||||
|
|
|
|
|
|
|
|
|
|
|
|||||||||||
-65-
Table of Contents
Comparison of the three months ended May 1, 2010 and April 30, 2011
Revenue. Revenue and the related changes for the three months ended May 1, 2010 and April 30, 2011 were as follows (in thousands):
| Three months ended | Change | |||||||||||||||||||||||
| May 1, 2010 | April 30, 2011 | |||||||||||||||||||||||
| $ | % of total revenue |
$ | % of total revenue |
$ | % | |||||||||||||||||||
| (unaudited) | ||||||||||||||||||||||||
| Revenue |
||||||||||||||||||||||||
| Product |
$ | 14,103 | 76 | % | $ | 19,596 | 79 | % | $ | 5,493 | 39 | % | ||||||||||||
| Support |
4,511 | 24 | 5,116 | 21 | 605 | 13 | ||||||||||||||||||
|
|
|
|
|
|
|
|
|
|
|
|||||||||||||||
| Total |
$ | 18,614 | 100 | % | $ | 24,712 | 100 | % | $ | 6,098 | 33 | % | ||||||||||||
|
|
|
|
|
|
|
|
|
|
|
|||||||||||||||
Product revenue. The increase in product revenue resulted from increased volumes for both our high-end and mid-range storage systems. Overall demand for our products increased as the global economic conditions continued to improve. In particular, we experienced continued strong adoption of our lower-priced, mid-range storage systems across all channels. Volumes of our mid-range storage systems grew by 64%. We introduced our mid-range storage systems in July 2009 and experienced increased demand particularly among enterprise customers. The mid-range storage systems addressed a new set of customers that required a more affordable system price with similar performance demands. System prices were better for the three months ended April 30, 2011 as compared to the three months ended May 1, 2010. Our systems prices can vary depending on the configuration of hardware, software and amounts of storage purchased. Additional storage increases overall revenue but tends to lower our gross margin.
Support revenue. The increase in support revenue was primarily due to an increase in the number of hardware and software maintenance contracts resulting from the increase in our installed base. Once our customers sign up for support services, a substantial majority of them tend to renew the support throughout the life of their installed systems, which is typically for three to four years. This high renewal rate increases our cumulative installed base and results in increased support revenue.
Of our revenue, indirect sales, including HDS, VARs and other channel partners, accounted for 51% and 57% in the three months ended May 1, 2010 and April 30, 2011, respectively. HDS contributed 38% and 45% of our revenue in the three months ended May 1, 2010 and April 30, 2011, respectively. No other customer accounted for 10% or more of our revenue in either period. Our sales to HDS benefited from higher demand of our mid-range storage systems, particularly in the enterprise market segment. Our revenue in the United States and Canada decreased from 77% to 73% of total sales from the three months ended May 1, 2010 to the three months ended April 30, 2011. We experienced a larger percentage of our sales in EMEA and other geographic areas due to higher shipments to these regions for HDS sales as well as higher sales made through our VARs and other channel partners.
-66-
Table of Contents
Cost of revenue and gross margin. Cost of revenue, gross margin and the related changes for the three months ended May 1, 2010 and April 30, 2011 were as follows (in thousands):
| Three months ended | Change | |||||||||||||||||||||||
| May 1, 2010 | April 30, 2011 | |||||||||||||||||||||||
| $ | Gross margin |
$ | Gross margin |
$ | % | |||||||||||||||||||
| (unaudited) | ||||||||||||||||||||||||
| Cost of revenue |
||||||||||||||||||||||||
| Product |
$ | 7,546 | 47 | % | $ | 9,938 | 49 | % | $ | 2,392 | 32 | % | ||||||||||||
| Support |
1,395 | 69 | 1,815 | 65 | 420 | 30 | ||||||||||||||||||
|
|
|
|
|
|
|
|||||||||||||||||||
| Total |
$ | 8,941 | 52 | % | $ | 11,753 | 52 | % | $ | 2,812 | 32 | % | ||||||||||||
|
|
|
|
|
|
|
|||||||||||||||||||
Cost of product revenue increased as a result of higher volumes of our storage systems sold, as well as incremental inventory write downs of $640,000 in the three months ended April 30, 2011, as compared to the three months ended May 1, 2010 for excess materials and spare parts inventory amortization. Product gross margin increased as a result of faster growth in our OEM channel and less pricing pressure as economic conditions improved.
Cost of support revenue increased as a result of continued investment in our customer support infrastructure, which resulted in an increase of $385,000 in headcount and third party vendor costs associated with providing support and training to customers. These infrastructure expenses were incurred in connection with the incremental needs of our customers. The impact of additional headcount and infrastructure expenses adversely affected support gross margin for the period.
Operating expenses. Operating expenses and the related changes for the three months ended May 1, 2010 and April 30, 2011 were as follows (in thousands):
| Three months ended | Change | |||||||||||||||||||||||
| May 1, 2010 | April 30, 2011 | |||||||||||||||||||||||
| $ | % of total revenue |
$ | % of total revenue |
$ | % | |||||||||||||||||||
| (unaudited) | ||||||||||||||||||||||||
| Operating expenses |
||||||||||||||||||||||||
| Sales and marketing |
$ | 7,868 | 42 | % | $ | 9,327 | 38 | % | $ | 1,459 | 19 | % | ||||||||||||
| Research and development |
3,775 | 20 | 4,966 | 20 | 1,191 | 32 | ||||||||||||||||||
| General and administrative |
1,464 | 8 | 1,614 | 6 | 150 | 10 | ||||||||||||||||||
|
|
|
|
|
|
|
|
|
|
|
|||||||||||||||
| Total |
$ | 13,107 | 70 | % | $ | 15,907 | 64 | % | $ | 2,800 | 21 | % | ||||||||||||
|
|
|
|
|
|
|
|
|
|
|
|||||||||||||||
Sales and marketing. Sales and marketing expense increased primarily due to an increase in headcount, resulting in an $838,000 increase in salaries, employee benefits and stock-based compensation expense, a $320,000 increase in third party vendors for marketing and outsourced sales activities and a $253,000 increase in sales and marketing related travel.
Research and development. Research and development expense increased primarily due to an increase in headcount, resulting in an $884,000 increase in salaries, employee benefits and stock-based compensation expense and a $218,000 increase in outside services, including offshore providers of quality assurance services and product development.
General and administrative. General and administrative expense remained relatively flat compared to the three months ended May 1, 2010. An increase in recruiting costs of $217,000 was offset by lower costs in various other areas.
-67-
Table of Contents
Other income (expense), net. Other income (expense), net was $1.6 million in the three months ended April 30, 2011 and was higher than the three months ended May 1, 2010, primarily due to higher outstanding preferred and common stock warrants and mark to market adjustments of the outstanding warrants. We realized nonrecurring income of $280,000 by obtaining acceptance of one of our research and development arrangements from HDS.
Benefit from income taxes. Our benefit from income taxes increased by $129,000 to $453,000. This was primarily due to the increased expenses eligible for the United Kingdom research and development tax credit.
Fiscal 2010 compared to fiscal 2011
Revenue. Revenue and the related changes for fiscal 2010 and fiscal 2011 were as follows (in thousands):
| Year ended | Change | |||||||||||||||||||||||
| January 30, 2010 | January 29, 2011 | |||||||||||||||||||||||
| $ | % of total revenue |
$ | % of total revenue |
$ | % | |||||||||||||||||||
|
|
||||||||||||||||||||||||
| Revenue |
||||||||||||||||||||||||
| Product |
$ | 49,523 | 75 | % | $ | 66,550 | 78 | % | $ | 17,027 | 34 | % | ||||||||||||
| Support |
16,352 | 25 | 19,039 | 22 | 2,687 | 16 | ||||||||||||||||||
|
|
|
|
|
|
|
|
|
|
|
|||||||||||||||
| Total |
$ | 65,875 | 100 | % | $ | 85,589 | 100 | % | $ | 19,714 | 30 | % | ||||||||||||
|
|
|
|
|
|
|
|
|
|
|
|||||||||||||||
Product revenue. The increase in product revenue resulted from a 186% increase in volume of our mid-range storage systems and, to a lesser extent, higher system prices for our high-end and mid-range storage systems. Overall demand for our storage systems increased as the global economic conditions continued to improve. In particular, our fiscal 2011 product revenue benefited from the strong adoption and full year of sales of our lower-priced, mid-range storage systems, which we introduced during the second quarter of fiscal 2010. Pricing improved throughout fiscal 2011, which contributed to higher year over year revenue.
Support revenue. The increase in support revenue was primarily due to an increase in the number of hardware and software maintenance contracts resulting from the increase in our installed base.
Of our revenue, indirect sales, including OEMs, VARs and other channel partners, accounted for 47% and 57% in fiscal 2010 and 2011, respectively. HDS contributed 30% and 41% of our revenue in fiscal 2010 and fiscal 2011, respectively. No other customer accounted for 10% or more of our revenue in either period. Our sales to HDS benefited from higher demand of our mid-range storage system, particularly in the enterprise market segment. Our revenue in the United States and Canada decreased from 79% to 75% of total sales from fiscal 2010 to fiscal 2011. We experienced a larger percentage of our sales in EMEA due to higher shipments to this region for HDS sales as well as higher sales made through our VARs and other channel partners.
-68-
Table of Contents
Cost of revenue and gross margin. Cost of revenue, gross margin and the related changes for fiscal 2010 and fiscal 2011 were as follows (in thousands):
| Year ended | Change | |||||||||||||||||||||||
| January 30, 2010 | January 29, 2011 | |||||||||||||||||||||||
| $ | Gross margin |
$ | Gross margin |
$ | % | |||||||||||||||||||
|
|
||||||||||||||||||||||||
| Cost of revenue |
||||||||||||||||||||||||
| Cost of product revenue |
$ | 29,709 | 40 | % | $ | 34,627 | 48 | % | $ | 4,918 | 17 | % | ||||||||||||
| Cost of support revenue |
4,570 | 72 | 6,184 | 68 | 1,614 | 35 | ||||||||||||||||||
|
|
|
|
|
|
|
|||||||||||||||||||
| Total |
$ | 34,279 | 48 | % | $ | 40,811 | 52 | % | $ | 6,532 | 19 | % | ||||||||||||
|
|
|
|
|
|
|
|||||||||||||||||||
Cost of product revenue increased as a result of higher volumes of storage systems sales. In fiscal 2011, we recorded an increase of $1.5 million in warranty-related expense driven by increased volumes in our mid-range storage systems as well as higher reserves for certain components. In fiscal 2010, cost of product revenue included a $1.0 million charge for excess and obsolete inventory in connection with the transition to our new mid-range storage systems. Product gross margin in fiscal 2011 increased as a result of faster growth in our OEM channel, continued adoption of our mid-range storage systems and more favorable pricing due to improving economic conditions.
Cost of support revenue increased primarily as a result of continued investment in our customer support infrastructure, which resulted in an increase of $1.4 million in headcount and third party vendor costs associated with providing support and training to customers. As a result, support gross margin decreased.
Operating expenses. Operating expenses and the related changes for fiscal 2010 and fiscal 2011 were as follows (in thousands):
| Year ended | Change | |||||||||||||||||||||||
| January 30, 2010 | January 29, 2011 | |||||||||||||||||||||||
| $ | % of total revenue |
$ | % of total revenue |
$ | % | |||||||||||||||||||
|
|
||||||||||||||||||||||||
| Operating expenses |
||||||||||||||||||||||||
| Sales and marketing |
$ | 28,540 | 43 | % | $ | 32,068 | 38 | % | $ | 3,528 | 12 | % | ||||||||||||
| Research and development |
13,783 | 21 | 16,410 | 19 | 2,627 | 19 | ||||||||||||||||||
| General and administrative |
4,868 | 8 | 5,277 | 6 | 409 | 8 | ||||||||||||||||||
|
|
|
|
|
|
|
|
|
|
|
|||||||||||||||
| Total |
$ | 47,191 | 72 | % | $ | 53,755 | 63 | % | $ | 6,564 | 14 | % | ||||||||||||
|
|
|
|
|
|
|
|
|
|
|
|||||||||||||||
Sales and marketing. Sales and marketing expense increased primarily due to an increase in headcount, as well as restoration of salaries following cost reduction actions taken in fiscal 2010, resulting in a $2.9 million increase in salaries, employee benefits and stock-based compensation expense, a $780,000 increase in sales and marketing related travel and a $473,000 increase in marketing programs and trade shows. These increases were partially offset by a $403,000 decrease in depreciation expense.
Research and development. Research and development expense increased primarily due to an increase in headcount, as well as restoration of salaries following cost reduction actions taken in fiscal 2010, resulting in a $2.0 million increase in salaries, employee benefits and stock-based compensation expense, and a $631,000 increase in outside services including an offshore provider of quality assurance and product development services.
-69-
Table of Contents
General and administrative. General and administrative expense increased primarily due to an increase in headcount, as well as restoration of salaries following cost reduction actions taken in fiscal 2010, resulting in a $575,000 increase in salaries, employee benefits and stock-based compensation expense, and an increase in recruiting fees of $273,000. These increases were partially offset by a decrease in bad debt expense of $335,000.
Interest expense. Interest expense increased by $252,000 to $1.3 million in fiscal 2011, primarily due to interest payable on our long-term capital growth facility agreement that we entered into during fiscal 2010.
Other income (expense), net. Other income (expense), net increased by $177,000 to $566,000 in fiscal 2011. The increase in expense was primarily due to the issuances of preferred and common stock warrants and the mark to market adjustments of the outstanding warrants.
Benefit from income taxes. Our benefit from income taxes increased by $148,000 to $1.4 million in fiscal 2011. This was primarily due to the increased expenses eligible for the United Kingdom research and development tax credit.
Fiscal 2009 compared to fiscal 2010
Revenue. Revenue and the related changes for fiscal 2009 and fiscal 2010 were as follows (in thousands):
| Year ended | Change | |||||||||||||||||||||||
| January 31, 2009 | January 30, 2010 | |||||||||||||||||||||||
| $ | % of total revenue |
$ | % of total revenue |
$ | % | |||||||||||||||||||
|
|
||||||||||||||||||||||||
| Revenue |
||||||||||||||||||||||||
| Product |
$ | 59,864 | 81 | % | $ | 49,523 | 75 | % | $ | (10,341 | ) | (17 | )% | |||||||||||
| Support |
14,366 | 19 | 16,352 | 25 | 1,986 | 14 | ||||||||||||||||||
|
|
|
|
|
|
|
|
|
|
|
|||||||||||||||
| Total |
$ | 74,230 | 100 | % | $ | 65,875 | 100 | % | $ | (8,355 | ) | (11 | )% | |||||||||||
|
|
|
|
|
|
|
|
|
|
|
|||||||||||||||
Product revenue. The decrease in product revenue was primarily due to reduced spending by customers purchasing new storage systems across our industry in response to the challenging economic conditions that existed during fiscal 2010. In the second half of fiscal 2010, we introduced and experienced strong adoption of our mid-range storage systems, which partially offset the negative impact of economic conditions.
Support revenue. The increase in support revenue was primarily due to an increase in the number of hardware and software maintenance contracts resulting from the cumulative growth in our installed base. An inventory supply arrangement with HDS also accounted for a $570,000 increase in support revenue.
Of our revenue, indirect sales, including HDS, VARs and other channel partners, accounted for 40% and 47% in fiscal 2009 and fiscal 2010, respectively. HDS contributed 22% and 30% of our revenue in fiscal 2009 and fiscal 2010. No other customer accounted for 10% or more of our revenue in either period. Our revenue in the United States and Canada decreased from 82% to 79% of total sales from fiscal 2009 to fiscal 2010 due to decreased sales in Canada.
-70-
Table of Contents
Cost of revenue and gross margin. Cost of revenue and gross margin and the related changes for fiscal 2009 and fiscal 2010 were as follows (in thousands):
| Year ended | Change | |||||||||||||||||||||||
| January 31, 2009 | January 30, 2010 | |||||||||||||||||||||||
| $ | Gross margin |
$ | Gross margin |
$ | % | |||||||||||||||||||
|
|
||||||||||||||||||||||||
| Cost of revenue |
||||||||||||||||||||||||
| Cost of product revenue |
$ | 32,179 | 46 | % | $ | 29,709 | 40 | % | $ | (2,470 | ) | (8 | )% | |||||||||||
| Cost of support revenue |
3,483 | 76 | 4,570 | 72 | 1,087 | 31 | ||||||||||||||||||
|
|
|
|
|
|
|
|||||||||||||||||||
| Total |
$ | 35,662 | 52 | % | $ | 34,279 | 48 | % | $ | (1,383 | ) | (4 | )% | |||||||||||
|
|
|
|
|
|
|
|||||||||||||||||||
Cost of product revenue decreased as a result of lower volumes. Product gross margin decreased primarily due to pricing pressure caused by the challenging economic conditions that existed during fiscal 2010.
Cost of support revenue increased primarily as a result of investment in our customer support infrastructure, which resulted in an increase of $1.1 million in headcount and third party vendor costs associated with providing support and training to customers.
Operating expenses. Operating expenses and the related changes for fiscal 2009 and fiscal 2010 were as follows (in thousands):
| Year ended | ||||||||||||||||||||||||
| January 31, 2009 | January 30, 2010 | Change | ||||||||||||||||||||||
| $ | % of total revenue |
$ | % of total revenue |
$ | % | |||||||||||||||||||
|
|
||||||||||||||||||||||||
| Operating expenses |
||||||||||||||||||||||||
| Sales and marketing |
$ | 33,759 | 45 | % | $ | 28,540 | 43 | % | $ | (5,219 | ) | (16) | % | |||||||||||
| Research and development |
18,274 | 25 | 13,783 | 21 | (4,491 | ) | (25) | |||||||||||||||||
| General and administrative |
5,659 | 8 | 4,868 | 8 | (791 | ) | (14) | |||||||||||||||||
|
|
|
|
|
|
|
|
|
|
|
|||||||||||||||
| Total |
$ | 57,692 | 78 | % | $ | 47,191 | 72 | % | $ | (10,501 | ) | (18) | % | |||||||||||
|
|
|
|
|
|
|
|
|
|
|
|||||||||||||||
In the fourth quarter of fiscal 2009 and early fiscal 2010, we implemented a variety of cost saving measures due to the challenging economic conditions. These cost saving measures included a reduction in personnel costs through a variety of measures, renegotiation of costs for third party services such as legal, insurance and audit, and reduced travel costs.
Sales and marketing. Sales and marketing expense decreased as a result of a reduction in force and salary reductions for the remaining employees. These actions resulted in a $1.2 million decrease in salaries, employee benefits and stock-based compensation expense. We also experienced a $2.1 million decrease in commissions, an $848,000 reduction in travel costs and a $734,000 decrease in marketing programs.
Research and development. Research and development expense decreased primarily as a result of salary reductions. We experienced a $1.6 million decrease in salaries, employee benefits and stock-based compensation expense, a $1.0 million decrease in temporary contractors and outside services and an $881,000 decrease in engineering consumables for prototypes and development of new products.
General and administrative. General and administrative expense decreased primarily as a result of cost saving measures and salary reductions. We experienced a $628,000 decrease in third
-71-
Table of Contents
party services and a $552,000 decrease in salaries, employee benefits and stock-based compensation. These decreases were partially offset by an increase in bad debt expense of $305,000.
Interest income. Interest income decreased by $236,000 from $260,000 in fiscal 2009 due to lower interest rates payable on available cash balances.
Interest expense. Interest expense increased by $828,000 to $1.1 million in fiscal 2010 primarily due to interest payable on our long-term capital growth facility agreement entered into in April 2009.
Other income (expense), net. Other income (expense), net decreased by $970,000 to $389,000 in fiscal 2010 primarily due to lower foreign currency exchange rate losses.
Benefit from income taxes. Our benefit from income taxes increased by $390,000 to $1.3 million in fiscal 2010. This was primarily due to the increased expenses eligible for the United Kingdom research and development tax credit.
-72-
Table of Contents
Unaudited quarterly results of operations
Our operating results may fluctuate due to a variety of factors, many of which are outside of our control. As a result, comparing our operating results on a period to period basis may not be meaningful. A significant portion of our quarterly sales typically occurs during the last month of the quarter, which we believe reflects customer buying patterns of products similar to ours and other products in the technology industry, generally. You should not rely on our past results as an indication of our future performance. The unaudited interim consolidated financial statements have been prepared on the same basis as our audited consolidated financial statements and include, in our opinion, all adjustments, which include only normal recurring adjustments, that we consider necessary for the fair presentation of the financial information set forth in those financial statements. As a result, our quarterly operating results are difficult to predict even in the near term.
| Three months ended | ||||||||||||||||||||
| May 1, 2010 |
July 31, 2010 |
October 30, 2010 |
January 29, 2011 |
April 30, 2011 |
||||||||||||||||
|
|
||||||||||||||||||||
| (in thousands, unaudited) | ||||||||||||||||||||
| Consolidated statements of operations data: |
||||||||||||||||||||
| Product revenue |
$ | 14,103 | $ | 15,473 | $ | 17,319 | $ | 19,655 | $ | 19,596 | ||||||||||
| Support revenue |
4,511 | 4,588 | 4,778 | 5,162 | 5,116 | |||||||||||||||
|
|
|
|
|
|
|
|
|
|
|
|||||||||||
| Total revenue |
18,614 | 20,061 | 22,097 | 24,817 | 24,712 | |||||||||||||||
| Cost of product revenue |
7,546 | 8,057 | 8,680 | 10,344 | 9,938 | |||||||||||||||
| Cost of support revenue |
1,395 | 1,528 | 1,579 | 1,682 | 1,815 | |||||||||||||||
|
|
|
|
|
|
|
|
|
|
|
|||||||||||
| Total cost of revenue |
8,941 | 9,585 | 10,259 | 12,026 | 11,753 | |||||||||||||||
|
|
|
|
|
|
|
|
|
|
|
|||||||||||
| Gross profit |
9,673 | 10,476 | 11,838 | 12,791 | 12,959 | |||||||||||||||
| Sales and marketing |
7,868 | 7,690 | 8,504 | 8,006 | 9,327 | |||||||||||||||
| Research and development |
3,775 | 3,875 | 4,260 | 4,500 | 4,966 | |||||||||||||||
| General and administrative |
1,464 | 1,226 | 1,447 | 1,140 | 1,614 | |||||||||||||||
|
|
|
|
|
|
|
|
|
|
|
|||||||||||
| Total operating expenses |
13,107 | 12,791 | 14,211 | 13,646 | 15,907 | |||||||||||||||
|
|
|
|
|
|
|
|
|
|
|
|||||||||||
| Loss from operations |
(3,434 | ) | (2,315 | ) | (2,373 | ) | (855 | ) | (2,948 | ) | ||||||||||
| Interest income |
— | 1 | 4 | 10 | 2 | |||||||||||||||
| Interest expense |
(339 | ) | (346 | ) | (337 | ) | (295 | ) | (284 | ) | ||||||||||
| Other income (expense), net |
(136 | ) | (409 | ) | (208 | ) | 187 | (1,552 | ) | |||||||||||
|
|
|
|
|
|
|
|
|
|
|
|||||||||||
| Loss before income taxes |
(3,909 | ) | (3,069 | ) | (2,914 | ) | (953 | ) | (4,782 | ) | ||||||||||
| Benefit from income taxes |
324 | 370 | 293 | 433 | 453 | |||||||||||||||
|
|
|
|
|
|
|
|
|
|
|
|||||||||||
| Net loss |
$ | (3,585 | ) | $ | (2,699 | ) | $ | (2,621 | ) | $ | (520 | ) | $ | (4,329 | ) | |||||
|
|
|
|
|
|
|
|
|
|
|
|||||||||||
| Three months ended | ||||||||||||||||||||
| May 1, 2010 |
July 31, 2010 |
October 30, 2010 |
January 29, 2011 |
April 30, 2011 |
||||||||||||||||
|
|
||||||||||||||||||||
| (in thousands, unaudited) | ||||||||||||||||||||
| Other financial data: |
||||||||||||||||||||
| Adjusted EBITDA (1) |
$ | (2,514 | ) | $ | (1,369 | ) | $ | (1,361 | ) | $ | 98 | $ | (1,546 | ) | ||||||
-73-
Table of Contents
| (1) | We define Adjusted EBITDA as net loss excluding benefit from income taxes, other income (expense), net, interest expense, interest income, stock-based compensation and depreciation and amortization. Please see footnote 2 in the section titled “Selected consolidated financial data” for more information. We reconcile net loss to Adjusted EBITDA as follows: |
| Three months ended | ||||||||||||||||||||
| May 1, 2010 |
July 31, 2010 |
October 30, 2010 |
January 29, 2011 |
April 30, 2011 |
||||||||||||||||
|
|
||||||||||||||||||||
| (in thousands, unaudited) | ||||||||||||||||||||
| Net loss |
$ | (3,585 | ) | $ | (2,699 | ) | $ | (2,621 | ) | $ | (520 | ) | $ | (4,329 | ) | |||||
| Benefit from income taxes |
(324 | ) | (370 | ) | (293 | ) | (433 | ) | (453 | ) | ||||||||||
| Other income (expense), net |
136 | 409 | 208 | (187 | ) | 1,832 | ||||||||||||||
| Interest expense |
339 | 346 | 337 | 295 | 284 | |||||||||||||||
| Interest income |
— | (1 | ) | (4 | ) | (10 | ) | (2 | ) | |||||||||||
| Stock-based compensation |
279 | 314 | 297 | 227 | 321 | |||||||||||||||
| Depreciation and amortization |
641 | 632 | 715 | 726 | 801 | |||||||||||||||
|
|
|
|
|
|
|
|
|
|
|
|||||||||||
| Adjusted EBITDA |
$ | (2,514 | ) | $ | (1,369 | ) | $ | (1,361 | ) | $ | 98 | $ | (1,546 | ) | ||||||
|
|
|
|
|
|
|
|
|
|
|
|||||||||||
The following table sets forth our unaudited quarterly consolidated statements of operations data as a percentage of revenue:
| Three months ended | ||||||||||||||||||||
| May 1, 2010 |
July 31, 2010 |
October 30, 2010 |
January 29, 2011 |
April 30, 2011 |
||||||||||||||||
|
|
||||||||||||||||||||
| (unaudited) | ||||||||||||||||||||
| Consolidated statements of operations data: |
||||||||||||||||||||
| Product revenue |
76 | % | 77 | % | 78 | % | 79 | % | 79 | % | ||||||||||
| Support revenue |
24 | 23 | 22 | 21 | 21 | |||||||||||||||
|
|
|
|
|
|
|
|
|
|
|
|||||||||||
| Total revenue |
100 | 100 | 100 | 100 | 100 | |||||||||||||||
| Cost of product revenue |
41 | 40 | 39 | 42 | 40 | |||||||||||||||
| Cost of support revenue |
7 | 8 | 7 | 7 | 8 | |||||||||||||||
|
|
|
|
|
|
|
|
|
|
|
|||||||||||
| Total cost of revenue |
48 | 48 | 46 | 49 | 48 | |||||||||||||||
|
|
|
|
|
|
|
|
|
|
|
|||||||||||
| Gross profit |
52 | 52 | 54 | 51 | 52 | |||||||||||||||
| Sales and marketing |
42 | 38 | 38 | 32 | 38 | |||||||||||||||
| Research and development |
20 | 19 | 19 | 18 | 20 | |||||||||||||||
| General and administrative |
8 | 6 | 7 | 5 | 6 | |||||||||||||||
|
|
|
|
|
|
|
|
|
|
|
|||||||||||
| Total operating expenses |
70 | 63 | 64 | 55 | 64 | |||||||||||||||
|
|
|
|
|
|
|
|
|
|
|
|||||||||||
| Loss from operations |
(18 | ) | (11 | ) | (10 | ) | (4 | ) | (12) | |||||||||||
| Interest income |
— | — | — | — | — | |||||||||||||||
| Interest expense |
(2 | ) | (2 | ) | (2 | ) | (1 | ) | (1) | |||||||||||
| Other income (expense), net |
(1 | ) | (2 | ) | (1 | ) | 1 | (6) | ||||||||||||
|
|
|
|
|
|
|
|
|
|
|
|||||||||||
| Loss before income taxes |
(21 | ) | (15 | ) | (13 | ) | (4 | ) | (19) | |||||||||||
| Benefit from income taxes |
2 | 2 | 1 | 1 | 2 | |||||||||||||||
|
|
|
|
|
|
|
|
|
|
|
|||||||||||
| Net loss |
(19 | )% | (13 | )% | (12 | )% | (3 | )% | (17 | )% | ||||||||||
|
|
|
|
|
|
|
|
|
|
|
|||||||||||
Revenue was flat in the three months ended April 30, 2011 due to seasonally reduced activity. In the three months ended January 29, 2011, our warranty-related expense increased by $449,000 due to higher reserves for certain components. In the three months ended January 29, 2011 and the three months ended April 30, 2011, our inventory reserve expense increased by $259,000 and $258,000, respectively, compared to the three months ended October 30, 2010. These expenses were for excess materials in the three months ended January 29, 2011 and excess materials and spare parts inventory amortization in the three months ended April 30, 2011. Sales and marketing expenses have generally increased sequentially in each of the quarters presented as we continue to add personnel and incur related costs to accommodate our growing business, with the exception of the three months ended January 29, 2011, during which we recognized a benefit of $508,000 for a change in estimate regarding commissions expense. We usually experience increased costs in the first quarter of each fiscal year due to some annual events and year end activities, such as audit.
-74-
Table of Contents
Liquidity and capital resources
Since our inception, we have incurred significant losses and, as of April 30, 2011, we had an accumulated deficit of $230.3 million. We have funded our operations primarily with customer payments for our storage systems and services, proceeds from issuances of convertible preferred stock, borrowings under our long-term capital growth facility, the utilization of our accounts receivable credit line and the issuance of convertible promissory notes. From inception, we have sold an aggregate of $247 million of our convertible preferred stock, including the conversion or our convertible promissory notes. At April 30, 2011, we had cash and cash equivalents of $16.1 million, an unutilized accounts receivable credit line of $12.5 million, $7.5 million of debt outstanding on our long-term capital growth facility, and $686,000 of capital and $4.1 million of operating lease obligations. We had positive working capital of $17.7 million and $12.2 million as of January 29, 2011 and April 30, 2011, respectively.
Based on our internal financial forecast, we believe that our current cash and cash equivalent balances and our existing sources of liquidity such as customer payments for our product sales and the utilization of our accounts receivable credit line will satisfy our working capital and capital requirements for at least the next 12 months. We expect to make capital expenditures of approximately $5.0 million to $6.0 million as we invest in computer equipment and other equipment to support our expected growth. There can be no assurance, however, that we will be successful in executing our business plan, maintaining and growing our existing customer base or achieving profitability and realizing our working capital. Failure to generate sufficient revenue, achieve planned gross margins or control operating costs may require us to raise additional capital through equity or debt financing. Such additional financing may not be available on terms acceptable to us, or at all, and could require us to modify, delay or abandon some of our planned future expansion or expenditures or reduce some of our ongoing operating costs, which could have a material adverse effect on our business, operating results, financial condition and ability to achieve our intended business objectives. If we raise additional funds through further issuances of equity, convertible debt securities or other securities convertible into equity, our existing stockholders could suffer significant dilution in their percentage ownership of our company and any new securities we issue could have rights, preferences and privileges senior to those of holders of our common stock. Our accounts receivable based credit facility, which expires in December 2012, includes a material adverse change clause as a condition precedent to funding which allows the lender to withdraw any unutilized portion of the facility at the time we are notified of the occurrence of certain triggering events. In addition, our long-term capital growth facility is subject to interest-only payments through December 2011. However, if we do not meet certain performance criteria tied to a measure of our quarterly earnings for quarters through October 29, 2011, repayment of principal via monthly installments will be accelerated and will commence in the month following the determination that the performance criteria have not been achieved. Historically we have satisfied all performance criteria and we expect to meet such criteria in the future. We have been in compliance with all debt covenants for the applicable periods presented.
-75-
Table of Contents
In summary, our cash flows were as follows:
| Year ended | Three months ended | |||||||||||||||||||
| January 31, 2009 |
January 30, 2010 |
January 29, 2011 |
May 1, 2010 |
April 30, 2011 |
||||||||||||||||
|
|
||||||||||||||||||||
| (unaudited) | ||||||||||||||||||||
| (in thousands) | ||||||||||||||||||||
| Net cash provided by (used in): |
||||||||||||||||||||
| Operating activities |
$ | (14,059 | ) | $ | (2,464 | ) | $ | (11,529 | ) | $ | (479 | ) | $ | 1,247 | ||||||
| Investing activities |
(2,833 | ) | (2,013 | ) | (3,920 | ) | (1,007 | ) | (1,118 | ) | ||||||||||
| Financing activities |
21,719 | 1,383 | 20,682 | 2,653 | (22 | ) | ||||||||||||||
| Net increase/(decrease) in cash and cash equivalents |
$ | 4,827 | $ | (3,094 | ) | $ | 5,233 | $ | 1,167 | $ | 107 | |||||||||
Cash flows from operating activities. We have historically experienced negative cash flows from operating activities as we continued to expand our business and built our infrastructure. Our operating cash flow primarily depends on the timing and amount of cash receipts from our customers, inventory purchases and payments for operating expenses. Net cash used in operating activities for the periods presented consisted of net losses adjusted for certain noncash items and changes in assets and liabilities.
Three months ended May 1, 2010 compared to three months ended April 30, 2011. For the three months ended April 30, 2011, revenue increased by 33% compared to the three months ended May 1, 2010. This increase in revenue was a result of improved demand for our products from the continued improvements in global economic conditions as well as the strong adoption of our lower-priced, mid-range storage systems. The change in accounts receivable balances was a source of cash despite the days sales outstanding increasing to 63 days for the three months ended April 30, 2011 from 49 days for the three months ended May 1, 2010. The days sales outstanding for the three months ended May 1, 2010 was lower primarily due to the prepayment from HDS for future purchases of our products. Despite the significantly higher revenue, our net loss was higher due to a significant increase in noncash expenses related to fair value adjustments of warrant liabilities in the three months ended April 30, 2011. Increases in product sales, and a higher level of evaluation units led to an increase in the inventory balance during the period. We experienced higher levels of evaluation units due to our customers’ desire to evaluate our systems in their IT infrastructure as a condition to making the decision to purchase the system. The increase in use of cash was more than offset by higher accounts payables and accrued liabilities balances, primarily due to the timing of inventory purchases at the end of the quarter.
Fiscal 2010 compared to fiscal 2011. For fiscal 2011, revenue increased 30%, resulting in a smaller net loss. The increase in revenue was a result of improved demand for our products from the continued improvements in global economic conditions as well as the strong adoption of our lower-priced, mid-range storage systems. This substantial revenue growth in fiscal 2011 resulted in an increase in outstanding accounts receivable balances. Also, our days sales outstanding increased to 60 days for the fourth quarter of fiscal 2011 from 45 days for the fourth quarter of fiscal 2010. The days sales outstanding for the fourth quarter of 2010 was lower due to the prepayment from HDS for future purchases of our products. Noncash expenses such as stock-based compensation and depreciation were lower while changes in the fair value of issued preferred and common stock warrants were higher in fiscal 2011. The change in inventory in fiscal 2011 was not significant. However, in fiscal 2010 the change in inventory was a source of cash of $2.1 million as a result of increased reserves for excess and obsolete inventory. These increases in uses of cash were partially offset by higher accounts payable and accrued liability balances in fiscal 2011 as we increased our headcount and spending to support our growth.
-76-
Table of Contents
Fiscal 2009 compared to fiscal 2010. Our fiscal 2010 results were adversely impacted by the global economic downturn. In response to this, we reduced our net loss by reducing our headcount and operating expenses to a greater extent. Noncash expenses such as stock-based compensation, depreciation and changes in the fair value of issued preferred stock warrants were higher in fiscal 2010. The lower sales and spending levels contributed to an overall decrease in cash used in operating activities as we had lower outstanding receivable and inventory balances. Deferred revenue increased because of a larger installed base purchasing our support services. A source of cash was prepayments from HDS in fiscal 2010 to be applied toward future sales. This prepayment as well as increased collection efforts contributed to our days sales outstanding decreasing to 45 days for the fourth quarter of fiscal 2010 from 88 days for the fourth quarter of fiscal 2009. Declines in cash usage during fiscal 2010 were partially offset by a higher research and development tax credit receivable balance.
Cash flows from investing activities. Cash flows from investing activities primarily relate to capital expenditures incurred to support our growth. In the three months ended April 30, 2011, our cash used for capital expenditures increased by 11% compared to three months ended May 1, 2010. During fiscal 2011, fiscal 2010 and fiscal 2009, our net cash used in investing activities was $3.9 million, $2.0 million and $2.8 million, respectively. The increase in capital expenditures in fiscal 2011 and the three months ended April 1, 2011 was due to increased investment in our engineering and lab equipment, and leasehold improvements at our offices in the United States and England.
Cash flows from financing activities. Cash flows from financing activities primarily include net proceeds from issuances of convertible preferred stock and convertible promissory notes; proceeds and payments related to our accounts receivable credit line; proceeds from our long-term capital growth facility and payments on our capital lease obligations.
In the three months ended April 30, 2011, cash used in financing activities primarily consisted of payments related to our capital lease obligations, partially offset by proceeds from issuance of common stock resulting from exercise of stock options.
We generated $20.7 million of net cash from financing activities during fiscal 2011. In July 2010, we issued Series GG convertible preferred stock for net proceeds of $18.1 million and the conversion of promissory notes amounting to $2.7 million that were issued in connection with the Series GG financing.
We generated $1.4 million in net cash from financing activities in fiscal 2010, including $7.5 million borrowed from our long-term growth facility, offset by payment of $6.0 million on our accounts receivables credit line.
During fiscal 2009, we generated $21.7 million in cash from financing activities, primarily due to the net proceeds of $16.4 million received from the sale and issuance of our Series FF convertible preferred stock, and proceeds of $6.7 million from the issuance of convertible promissory notes and related warrants, offset by payment of $1.4 million on our accounts receivables credit line.
Off balance sheet arrangements
During the periods presented, we did not have any relationships with unconsolidated entities or financial partnerships, such as entities often referred to as structured finance or special purpose entities, which would have been established for the purpose of facilitating off-balance sheet arrangements or other contractually narrow or limited purpose.
-77-
Table of Contents
Contractual obligations and commitments
The following table summarizes our contractual obligations and commitments for principal and interest payments due on the long-term capital growth facility and lease payments as of January 29, 2011:
| Payments due by period | ||||||||||||||||
| Total | Less than 1 Year |
1 to 3 Years |
3 to 5 Years |
|||||||||||||
|
|
||||||||||||||||
| (in thousands) | ||||||||||||||||
| Debt payments |
$ | 9,236 | $ | 1,048 | $ | 6,776 | $ | 1,412 | ||||||||
| Operating lease obligations |
4,193 | 992 | 1,997 | 1,204 | ||||||||||||
| Capital lease obligations |
436 | 287 | 149 | — | ||||||||||||
| Component purchase obligations |
10,809 | 10,809 | — | — | ||||||||||||
|
|
|
|
|
|
|
|
|
|||||||||
| Total |
$ | 24,674 | $ | 13,136 | $ | 8,922 | $ | 2,616 | ||||||||
|
|
|
|
|
|
|
|
|
|||||||||
|
|
||||||||||||||||
At January 29, 2011 we had a liability for unrecognized tax benefits of $202,000. Due to uncertainties with respect to the timing to future cash flow associated with our unrecognized tax benefits at January 29, 2011 we are unable to make reasonably reliable estimates of the period of cash settlement with the applicable taxing authority. Therefore, $202,000 of unrecognized tax benefits have been excluded from the contractual obligations table above. See Note 12 in the notes to our consolidated financial statements for a discussion of income taxes.
Our operating lease commitments primarily relate to the lease of our corporate headquarters in San Jose, California and our England office, and to a lesser extent, our leases for our sales offices in Germany, Australia and New Zealand.
Our capital lease consists of equipment financing arrangements with vendors.
To ensure uninterrupted supply, our contract manufacturer makes advance purchases of components based on the system unit forecasts we provide. To the extent these components are purchased by the contract manufacturer and cannot be used by their other customers, we are obligated to purchase these components. The amounts in the table above represent the maximum amount of purchase commitment that we may be obligated to pay within one year. The amount as of April 30, 2011 was $7.5 million. Actual amounts paid may be lower to the extent that the contract manufacturer can avoid purchasing components that are ultimately not needed. Additionally, we have an obligation to purchase components procured by our contract manufacturer if these components become obsolete. Accruals related to obsolete components purchased by the contract manufacturer were immaterial as of January 29, 2011 and April 30, 2011.
Quantitative and qualitative disclosures about market risk
Foreign currency risk. A substantial portion of our sales are currently denominated in U.S. dollars. Our international research and development and sales operations incur expenses that are denominated in foreign currencies. Our international sales and operating expenses could be materially affected by currency fluctuations. Our exposures are to fluctuations in exchange rates primarily for the U.S. dollar versus the euro, the British pound, and to a lesser extent, the Australian, Canadian and New Zealand dollar. Any foreign currency transaction, defined as a transaction denominated in a currency other than the U.S. dollar, will be reported in U.S. dollars at the applicable exchange rate. Changes in currency exchange rates could adversely affect our consolidated results of operations or financial position. Additionally, our research and
-78-
Table of Contents
development operations maintain cash balances denominated in the British pound. In order to decrease the inherent risk associated with translation of foreign cash balances into our reporting currency, we have not maintained significant cash balances in foreign currencies. As of April 30, 2011, we had $420,000 of cash in foreign accounts. To date, we have occasionally used foreign currency forward contracts to manage our currency exposure to the British pound.
Interest rate sensitivity. We had cash and cash equivalents of $16.1 million as of April 30, 2011. Our cash and cash equivalents are held primarily in cash deposits and money market funds. We hold our cash and cash equivalents for working capital purposes. Due to the short-term nature of these instruments, we believe that we do not have any material exposure to changes in the fair value of our investment portfolio as a result of changes in interest rates. Declines in interest rates, however, will reduce future interest income. During fiscal 2011, a 10% appreciation or depreciation in overall interest rates would not have had a material impact on our interest income.
-79-
Table of Contents
Overview
We are a leading provider of high performance, highly scalable networked storage systems for businesses of all sizes. Our storage systems deliver the levels of performance, scalability, versatility and simplicity required to cost effectively manage the rapid growth of unstructured data, making them particularly suited for data-intensive applications such as server and desktop virtualization and cloud-based computing. Reliance on email, business documents, web pages, digital images, audio and video, as well as the document retention and access requirements of regulatory compliance are driving the rapid growth of unstructured data. The proliferation of unstructured data and the need to manage and access it at scale has resulted in the demand for next-generation storage systems that minimize the complexities and overcome the performance limitations of existing storage systems. Our storage systems leverage our proprietary file system and flexible architecture to meet the needs of today’s most demanding applications and to manage unstructured data at scale. We enable our customers to more effectively explore, discover, research, create, process and innovate in performance sensitive and data intensive environments.
Our storage systems minimize the complexities and overcome the performance limitations of existing networked storage systems. We enable our customers to address storage bottlenecks and accelerate processes to achieve their critical business goals, including enhanced revenue generation and improved service offerings. Our massively parallel architecture is highly scalable and delivers sustained performance without feature degradation under increased workloads, unlike competing storage systems, which typically suffer from performance or feature degradation as the workload increases. Our storage systems combine our servers with our advanced, proprietary software suite, and use standard interfaces and multiple tiers of efficient enterprise-class storage devices to provide a wide variety of system configurations to our customers. We also sell our servers independently as a gateway solution that can be deployed in storage environments to enable file services for easier data sharing, simplified management, server and desktop virtualization and improved functionality. As of April 30, 2011, over 750 customers worldwide have deployed over 2,000 of our storage systems.
We believe that our networked storage systems address multiple end markets in light of the proliferation of unstructured data, the growing need to manage it at scale and the continuing shift to Internet Protocol networking. According to IDC, the NAS and iSCSI SAN markets are expected to grow from $8.1 billion in 2010 to $12.0 billion in 2014, representing a 10.2% CAGR. In addition, we believe that the Fibre Channel connectivity of our platform enables us to address the migration and transition away from Fibre Channel to next-generation storage systems that are optimized for unstructured data and file-based applications. Our storage systems are deployed throughout a wide range of organizations, from global businesses to small organizations with a single location. Our diverse customer base includes organizations in industries such as media and entertainment, e-Discovery, energy, the federal government, life sciences, Internet and cloud hosted service providers and other enterprises. We sell our storage systems through multiple channels which include our direct sales force, our extensive network of channel partners and an OEM agreement with HDS.
In fiscal 2009, fiscal 2010, fiscal 2011 and the three months ended April 30, 2011, we had total revenue of $74.2 million, $65.9 million, $85.6 million and $24.7 million, respectively. In fiscal
-80-
Table of Contents
2009, fiscal 2010, fiscal 2011 and the three months ended April 30, 2011, we incurred net losses of $19.6 million, $15.8 million, $9.4 million and $4.3 million, respectively.
Industry background
The amount of data used by businesses of all sizes globally is growing rapidly. IDC predicts that between 2009 and 2020, the amount of digital data in customer sites will grow to 44 times what it was in 2010—growing to 35 billion terabytes. Businesses are increasingly focusing on leveraging highly scalable, high performance file systems and related storage infrastructure as they seek to intelligently organize, manage, access and analyze growing amounts of data. Given the rapid pace of change in today’s markets, businesses seek solutions that can seamlessly scale as their business requirements evolve. In recent years, unstructured data has become increasingly critical to businesses. Reliance on email, business documents, web pages, digital images, audio and video, as well as the document retention and access requirements of regulatory compliance are driving the rapid growth of unstructured data across businesses. For example, computer-generated imagery for film, games and television and e-Discovery all require massive amounts of unstructured data to carry out their primary functions. In addition, system capabilities such as high scalability and parallel processing, once required only for specific HPC applications such as genomics, have become increasingly common for a wide variety of businesses. The growth in unstructured data, combined with advanced networking capabilities, increased disk capacities, improved computer processing capabilities and server and desktop virtualization have resulted in the need for next-generation data center technologies uniquely architected to meet the needs of today’s most demanding applications.
Key trends affecting growing data center environments
Proliferation of unstructured data. As modern applications continue to grow in sophistication, they produce and require increasing amounts of unstructured data. The long-term storage and management of this unstructured data poses a significant challenge for businesses as the amount of unstructured data has grown exponentially, the commercial value of that data has increased and the need to store and access it for long periods continues. IDC estimates that worldwide enterprise storage capacity shipped for traditional unstructured data is expected to grow from 3,924 petabytes in 2010 to 22,930 petabytes in 2014, representing a CAGR of 55.5%. Unlike structured data, which is typically stored in databases, unstructured data is stored in file systems. The proliferation of unstructured data is driving a need for next-generation file systems and the related storage infrastructure to manage, move, protect and deliver growing amounts of unstructured data for businesses and consumers. These next-generation solutions must be high performance, flexible and scalable to address the rapid growth of unstructured data.
Growing performance demands. As data sets have grown and the performance requirements to both process and manage them have increased, mainstream businesses and organizations increasingly require high performance, highly scalable storage systems that were previously only needed for HPC environments. At the same time, the storage system requirements to support HPC applications continue to increase. HPC applications, such as oil and gas exploration, animation rendering services and genomics, and emerging data-intensive applications, such as cloud-based services, e-Discovery and web analytics, are driving new performance and scalability requirements for networked storage. Growing performance burdens on storage infrastructure also result from greater numbers of files, concurrent users, demands for faster response times, increased sharing of data and the proliferation of server and desktop
-81-
Table of Contents
virtualization. In addition, as businesses increasingly consolidate their data center footprint to achieve cost efficiencies, the performance and scalability requirements for storage intensify.
Focusing on reduced complexity and leveraging existing infrastructure. To scale their infrastructure and manage growth in unstructured data, many organizations have deployed multiple disparate storage systems over time as their data needs have grown. This has resulted in overly complex infrastructure that is difficult and expensive to manage. To address these difficulties, businesses increasingly demand solutions that provide open architectures, are highly scalable and are interoperable with their existing data center deployments, enabling them to leverage significant existing infrastructure investments. Most businesses have traditionally selected either a SAN, which is optimized for structured, or block-level, data, or a NAS, which is optimized for unstructured, or file-level data. As businesses increasingly need to manage both types of data efficiently and cost effectively, they are looking for solutions that support interoperability and convergence of their SAN and NAS storage infrastructures.
Increasing use of virtualization technologies. Increased adoption of server and desktop virtualization technologies has resulted in data center environments with dynamic storage requirements. Server virtualization technologies enable an administrator to use a software application to divide one physical server into multiple virtual servers, enabling multiple operating systems to run simultaneously on the same computer. Desktop virtualization environments provide multiple users with desktop processing and storage capabilities on a remote central server instead of on a local computer. As businesses increasingly adopt server virtualization technologies and consolidate their data center resources, independent storage resources become siloed, driving demand for solutions that enable the consolidation and centralization of these siloed storage pools. In addition, as businesses continue to adopt desktop virtualization technologies, their data centers are required to evolve to support simultaneous operations of a large number of virtual desktops, such as having multiple users log in at the same time. Increased use of server and desktop virtualization technologies within data centers has resulted in an exponential increase in requirements for high IOPs to support highly unpredictable traffic patterns within data centers. Storage infrastructure is frequently cited as the bottleneck in these highly virtualized environments.
Accelerating adoption of cloud-based architectures. Cloud-based architectures, or architectures that enable the delivery of hosted on-demand services over the Internet, have gained prominence given their ability to provide cost effective support to multiple users while maintaining the security, agility and reliability of existing computing platforms. The proliferation of cloud-based architectures and data has resulted in the rapid growth of large data centers that require highly scalable networked storage with centralized management. The requirements of on-demand storage in cloud-based architectures are driving the need for storage technologies that deliver high efficiency across the storage infrastructure. To increase cost efficiency, storage architectures are increasingly incorporating tiering, which automatically routes and stores data in different storage media based on administrator-defined policies. Using cloud-based storage as one tier of the architecture reduces the cost of storing data. Many existing data center deployments were not optimized for current volumes of data and traffic or for the interoperability to offload data to a cloud-based tier of storage, making them difficult to scale and operate cost effectively.
Increasing focus on minimizing total cost of ownership. To stay competitive, businesses have increasingly focused on lowering their operating costs, particularly information technology infrastructure costs. As data center infrastructure struggles to keep up with the growth in data,
-82-
Table of Contents
there has been increased focus from businesses on managing operating costs and efficiently scaling capacity, or doing more with less. With increasing focus on budgets, businesses seek the flexibility to add only the capacity or additional IOPs needed on an incremental basis. Managing information technology infrastructure costs has also become increasingly complex as the rapid adoption of applications has competed with the need to manage mixed workloads across a shared network infrastructure environment.
Limitations of existing storage networking systems
We believe that existing storage systems do not fully address key requirements of businesses in today’s environment because they were not originally architected to address the scale of and broad prevalence of unstructured data. Key limitations of existing storage systems include:
Inability to manage unstructured data at scale. Existing storage systems lack the performance and scalability to address the diversity of applications and the size and diversity of data sets that are now being generated across distributed storage resources. Most NAS systems are based on general purpose server technology running a proprietary operating system that has been optimized for file serving, creating a dedicated storage server appliance that is easy to deploy. Many existing NAS storage systems only support a small file system size, small storage capacity and a limited number of concurrent users. These network protocol, file system and storage management functions all contend for the same internal system resources. As the burden of the workload and the number of users increases, businesses are required to deploy additional devices, resulting in sprawling systems with very unpredictable performance that can drop off dramatically. Many alternative remedial solutions have been designed to scale capacity, bandwidth and processing power in unison, which results in over-provisioning of one of those areas, creating complexity and underutilization of resources.
Inability to manage complexities within data centers. Businesses have often responded to data growth by using multiple storage systems with multiple file systems that, when combined together within a data center, result in an overly complex environment that is difficult to manage and results in excess capacity that cannot be used to address other needs. Many existing storage systems were based on proprietary platforms and are not interoperable with other components of the data center infrastructure. While both NAS and SAN have particular strengths, there remain challenges for the vast majority of businesses due to the lack of heterogeneous block and file support from the same system. SAN environments are not optimized to readily access file-based, unstructured data. In addition, most existing NAS deployments have been ineffective at achieving the performance and scalability of SAN deployments. Businesses increasingly need a storage solution that delivers the performance benefits of a SAN with the ability to work with large volumes of unstructured data.
Not optimized for virtualization. Most existing networked storage systems were not architected to support data center environments that use server and desktop virtualization technologies. The use of server and desktop virtualization results in highly unpredictable traffic patterns and higher performance demands on storage systems, which combine to create significant performance degradation. Existing storage systems lack the performance and scalability necessary to satisfy the exponential increase in demand for IOPs within these environments, resulting in significant bottlenecks from storage systems.
Lack of support for cloud-based environments. The proliferation of cloud-based environments has placed significant strains on data centers as unstructured data continues to
-83-
Table of Contents
grow rapidly. The mix of unpredictable workloads pervasive in cloud environments causes existing network storage systems to experience performance degradation during periods of high demand. In addition, most existing storage systems do not provide support for the interoperability, information movement and management necessary for the deployment of cloud-based tiers of storage.
Total cost of ownership. Limitations on performance, scalability and manageability have a direct impact on total cost of ownership. The use of multiple single-application storage systems and the proliferation of devices within data centers results in lower storage utilization and increased storage administration time. Siloed storage resources have resulted in higher energy use and physical footprint, increasing capital and operating costs for businesses that are looking to drive more utilization out of their infrastructure investments.
These dynamic requirements and challenges within data centers make it difficult for many storage systems to cost effectively address continually evolving business requirements. Market trends, such as the management of unstructured data and data center complexity at scale, virtualization and cloud computing and an increased focus on total cost of ownership make existing storage systems inadequate to address businesses’ storage systems problems today.
Our networked storage systems
We provide industry-leading storage systems that leverage our proprietary file system, SiliconFS, and flexible architecture to deliver intelligent data management functionality for our customers. Our massively parallel architecture is designed to overcome the data network bottlenecks created by existing storage systems and deliver superior performance across diverse workloads without sacrificing scalability, storage bandwidth, functionality or overall capacity. Through our intelligent file system architecture, we enable our customers to scale their infrastructure up, or enable higher performance out of a single storage system, and scale their infrastructure out, or enable multiple servers to be deployed seamlessly across data centers, to meet continually changing business and application requirements. Our intelligent file system architecture enables our customers to scale-right, or scale each of these attributes independently to their specific needs, and to run intensive data management applications seamlessly without burdening the performance of overall storage infrastructure.
-84-
Table of Contents
BlueArc “Scale-Right” storage architecture
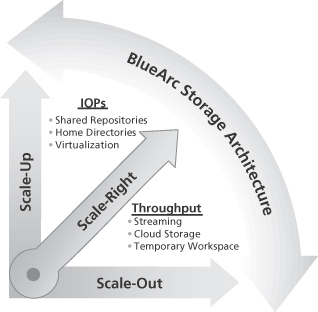
Our massively parallel architecture and highly scalable storage systems leverage a combination of standard FPGAs, as an offload engine for high speed data transfer and multi-core processors for intensive data management functions. This architecture, combined with SiliconFS, allows us to deliver the following benefits to customers:
Management of unstructured data at scale. Our storage systems allow for the intelligent management of applications in data intensive environments and allow our customers to add storage systems, applications and data management features seamlessly without sacrificing performance or functionality. We believe our storage systems provide the most scalable solution in our product class, with the highest performance, as measured in IOPs, storage capacity up to 16 petabytes in a single system, throughput up to 1.5 gigabytes per second and the ability to configure clusters of up to eight servers. By scaling right, we also enable our customers to scale each of these attributes independently, significantly reducing the potential for underutilization of resources.
Ability to reduce complexity. Our storage systems are often deployed as a consolidation platform for networked storage environments, reducing complexity and cost by eliminating excess storage systems. Due to their ability to handle diverse and unpredictable workloads, our storage systems serve as an ideal platform for the consolidation of applications, such as email, databases and home directories, on the same storage system. Our storage systems allow different users, applications, protocols and performance requirements to share storage resources and enable traditionally siloed pools of storage to be viewed and managed through our single cluster namespace, which enables a user to view clusters of multiple servers and file systems as if they are a single coherent unit. We architected our storage systems to be easily integrated into our customers’ data centers to simplify the integration and management of our storage systems. Our solution is a unified storage platform supporting both SAN and NAS file and management protocols.
-85-
Table of Contents
Optimized for virtual environments. Our architecture is ideally suited for large scale virtualized server and desktop environments because it delivers high levels of predictable performance for unpredictable workloads. In addition, our proprietary technology provides the ability to instantly create space-efficient, writeable copies of files for use in a wide variety of environments and run multiple simulations with large-scale data sets. This allows administrators to quickly deploy many new virtual machines without consuming additional disk storage space. Our differentiated solutions enable virtualized environments to achieve maximum utilization of storage resources and avoid performance bottlenecks, reducing the management time required and making the data center less complex and cumbersome to manage.
Support for cloud-based environments. Our storage systems deliver high predictability, high performance and continuous availability across a variety of workloads. These characteristics allow our customers to easily scale their storage systems, applications and data management features without sacrificing performance, making our storage systems optimal for cloud-based environments. In addition, where most existing storage systems realize performance degradation as capacity begins to be utilized, our customers benefit from our predictable performance across a variety of complex workloads such as those associated with hosted security, storage and software models. Our open architecture provides and supports interoperability with cloud-based tiers of storage, allowing customers to seamlessly offload noncritical data to locations hosted offsite in public and private clouds. Our solutions enable businesses to easily manage the high growth of data in cloud-based environments without increasing complexity or unnecessary infrastructure costs.
Lower total cost of ownership. We believe our storage systems enable our customers to achieve higher usable capacity per server and lower overall total cost of ownership. Given the high capacity, performance and scalability of our networked storage systems, our customers are able to realize cost savings and higher efficiencies from using fewer servers, smaller physical data center space and fewer administrators. Our storage systems also provide superior power efficiency, require less cooling and offer efficient space utilization. We enable our customers to scale performance, capacity and throughput independently when they need it, increasing efficiency and reducing upfront capital requirements. In addition, our platform is based on our open architecture, which supports interoperability within data center environments, enabling our customers to leverage their significant investments in existing infrastructure to achieve higher returns on investment and faster payback periods.
Our strategy
Our objective is to be the leading networked storage system vendor providing solutions to solve the challenges businesses face in managing unstructured data at scale. Key elements of our strategy include:
Extending our technology leadership and product breadth. We intend to continue to innovate and to maintain our leadership position by leveraging our massively parallel architecture and file system. We believe that our innovative system architecture and design provide us with significant competitive advantages over existing storage systems for managing unstructured data at scale, including virtualized and cloud-based environments. We intend to continue to make investments to extend the performance leadership of our platform through both software and hardware improvements. We will continue to make significant investment in our SiliconFS file system that enables customers to run more intensive applications on our systems, such as primary deduplication, while preserving the performance of the file system.
-86-
Table of Contents
Continuing to deepen and expand our customer relationships and vertical market penetration. We intend to expand our enterprise customer base by continuing to leverage our proven high performance technology and our diverse routes to market. We will continue to target customers who are increasingly dependent on storage performance and management of unstructured data at scale. We believe our deep customer relationships, service offerings and customer feedback programs enable us to better understand their challenges and determine the solutions that we can provide to better serve their needs as well as to identify areas of focus for our ongoing research and development activities. This positions us to sell additional products and services such as storage capacity and additional software functionality to address their growing demand for storage.
Continuing to expand our routes to market including direct and channel distribution. We utilize a multi-channel go-to-market strategy through our direct sales effort, our extensive network of partners and our OEM relationship with HDS. We plan to continue optimizing our multi-dimensional go-to-market strategy to maximize our reach to customers. We plan to further invest in growing our direct, VAR and solution partners channels across various geographies. We will continue to evaluate additional OEM and strategic reseller partnerships to leverage their global reach and continue to drive our penetration into the enterprise.
Broadening our technology partnerships. We intend to continue to leverage our existing platform by expanding our technology partnerships with infrastructure vendors, application vendors and storage suppliers. Broadening our partnerships with infrastructure vendors in particular vertical markets will provide us with additional competitive insights into those markets so we can continue tailoring our products to specific applications. We plan to enhance our partnerships with application vendors that benefit from running their applications in close proximity to the data set, as this will serve as a fundamental component of our software initiatives as we leverage the ability to run applications on the storage server itself. We continuously seek to expand our storage supplier relationships to offer customers a choice of storage arrays, to improve our supply chain and to encourage competitive pricing from our suppliers.
Case studies
Major Internet company using cloud computing. Over the past year, a large worldwide Internet company made a strategic decision to move part of its business away from its existing storage vendor and implemented our SiliconFS file system due to its ability to meet the Internet company’s requirements. The Internet company consolidated data that was previously spread across many systems and moved its business data to our storage systems. The Internet company is now able to use our streamlined storage system environment to deliver the performance required to serve data, such as photos, video and email, at scale from the cloud.
Large airline. In 2010, a large airline was looking for an optimal storage solution to deploy a large scale virtual desktop environment. The airline adopted our storage systems after evaluating competing solutions. Although it had adopted another company’s NAS solution for general file management, the airline selected our storage system because of our SiliconFS file system’s virtual desktop capabilities.
Major media and entertainment company. In early 2010, one of the world’s largest movie, music and entertainment companies needed a more powerful solution for transcoding, which is the process of converting original content into an increasing variety of format outputs. Transcoding enables original content providers to stream full length motion pictures over the
-87-
Table of Contents
Internet for viewing on a laptop, game player or other device, each of which requires a separate file conversion. We collaborated with a transcoding software vendor to offer the entertainment company a unified solution. The entertainment company selected our storage solution based in part on our storage systems’ ability to handle the dynamic workloads involved in this data-intensive process, as well as our other high performance features that enable quick conversion of original source files. The high performance and quick conversion of our storage systems enabled the entertainment company to realize a faster time to revenue for its product.
Large oil exploration company. One of the world’s largest publicly traded oil companies was interested in decreasing costs while increasing the performance of the primary applications used in the exploration for oil resources. The key application was a third party seismic data processing suite that was known for its high IOPs requirements. Our technology enabled the oil exploration company to complete a large consolidation of the oil exploration company’s legacy storage environment while significantly improving application performance. Subsequently, the oil exploration company’s Australian subsidiary decided to move all of its geophysical and commercial office applications to our platform. The oil exploration company now has our storage solutions in its four largest global exploration and production data centers that host high performance computing applications. Implementation of our storage systems reduced the time to complete its seismic processing work flows, reduced its information technology expense and enabled it to locate and exploit oil resources faster.
Products
We offer a range of storage systems to meet different performance, scalability and price points. Our storage systems share a common underlying architecture, with most software and file system features available across our product offerings. In addition, we offer a rich suite of software features organized into a comprehensive operating environment that includes the base operating system, licensed options for file services, data protection services, integration with system virtualization products and an extensive system management framework. To facilitate the sale of our platform and software products when sold as complete systems, we also offer a range of ancillary products that we purchase and resell, including storage arrays, Fibre Channel switches, equipment racks and other items.
With common software across all of our storage systems, customers have a choice of different price and performance points to meet their individual application requirements. All of our software features are available on our storage systems, including unique features that take advantage of our hybrid core design. Software updates with new features can be added as they become available.
High-end and mid-range storage systems. Currently we designate our products as Mercury and Titan.
Our Titan storage systems offer competitive pricing with high-end performance, scalability and functionality for HPC environments. Our Titan product family consists of our 3200 series storage systems that are designed to meet the needs of customers seeking HPC solutions. Our Titan storage systems have been our performance flagship systems over three product generations for the past seven years. Titan’s performance and scalability have doubled with each succeeding generation and offers a suitable storage solution for large-scale installations.
We leveraged the architecture of our HPC systems to expand our storage system offerings and address the mid-range market and tailor solutions for a broader array of customer needs. Our
-88-
Table of Contents
Mercury storage systems offer mid-range pricing with high-end performance, scalability and functionality. Our Mercury product family consists of our 55 and 110 series storage systems that are designed to meet the needs of mid-range storage customers.
The following table provides certain technical and performance statistics regarding our products:
| Mid-range |
High-end | |||||||
| Mercury 55 | Mercury 110 | Titan 3200 | ||||||
|
| ||||||||
| SPECsfs IOPs(1) |
Up to 40,000 | Up to 73,000 | Up to 200,000 | |||||
| Data throughput per server(2) |
up to 700 MB/sec | Up to 1,100 MB/sec | Up to 1,500 MB/sec | |||||
| Maximum capacity(3) |
4 PB | 8 PB | 16 PB | |||||
| Ethernet network data ports(4) |
Two 10 GbE + Six GbE | Two 10 GbE + Six GbE | Two 10 GbE | |||||
| Fibre Channel storage ports(5) |
Four 4 Gb | Four 4 Gb | Eight 4 Gb | |||||
| Clustering interconnect ports(6) |
Two 10 GbE | Two 10 GbE | Two 10 GbE | |||||
|
| ||||||||
| (1) | Input/output operations per second are measured using the SPECsfs 2008 benchmark for Mercury 55 and Mercury 110 and SPECsfs 97_r1.v3 benchmark for Titan 3210. SPECsfs benchmarks are developed and published by Standard Performance Evaluation Corporation. |
| (2) | Maximum data throughput capability in megabytes/second, or MB/sec for mixed read/write operations as measured using the IOzone benchmark. |
| (3) | Maximum capacity is defined as maximum usable storage capacity in petabytes, or PBs. |
| (4) | Ethernet LAN ports are used for LAN connectivity to enable client access to our platforms and operate at either 1 gigabit/second, or Gb/sec, or 10 Gb/sec each. |
| (5) | Fibre Channel storage ports are used for connection to Fibre Channel switches and Redundant Array of Independent Drives, or RAID, disk arrays and operate at 4 Gb/sec. |
| (6) | Clustering interconnect ports are used to connect two or more Mercury or Titan systems together in a high-availability cluster, and operate at 10 Gb/sec. |
Our storage systems use open standards for both network and disk array connections, making integration into existing local area networks, or LANs, easy and enabling a range of different classes of disk array storage to meet various application requirements. Our customers can mix a range of storage media types, formats, capacities and speeds including solid state storage, SAS, Serial Attached ATA drives, Fibre Channel and tape libraries. This allows our customers to take advantage of the latest storage media to create different tiers of storage and to tailor their storage environments to specific budgets and application needs. Our storage systems can be clustered together to increase system availability and performance, offering a combination of scalability and performance growth over time.
Software. Our highly integrated software suite offers users a base operating system and file services, optional licensed software functionality and an extensive system management framework. Our software suite enables users to quickly and cost effectively add new features to existing platforms, such as data protection, data management, virtualization and system management.
Base operating system and file services include:
| • | Object-based file system. Our file system provides the flexibility and power to handle a variety of file sizes as well as several concurrent file system operations without impacting performance. Our file systems can scale up to 256 terabytes, support over 16 million files per directory and up to 128 separate file systems can coexist on any one of our platforms. |
| • | Multi-protocol support. We offer a unified network storage system with support for both block- and file-level data within a single system, enabling both block and file protocols to share common storage, features and administrative functions where possible and within one integrated platform. |
-89-
Table of Contents
| • | Snapshot backups. Our snapshots offer the use of high speed point-in-time copy technology that provides rapid data protection, allows for quick and easy recovery of individual files that were accidentally deleted, lost or changed and requires no copying of data, significantly reducing amount of storage needed. |
| • | Storage pools. Our file system virtualizes physical storage through the creation of one or more storage pools that can be shared by multiple file systems, eliminating siloed storage and enabling all applications and users to securely access the storage pools as needed. |
We intend to include a parallel file system option in NFS version 4.1 that will be based on the new industry standard, parallel network file system. Our design will distribute the contents of a data set or even a single large file across multiple storage systems that will work in parallel to read and write the data to a large number of clients, such as HPC computer servers or workstations, simultaneously, which will provide near-linear scaling of aggregated throughput and capacity as our customers add storage systems.
In addition to the base operating system, we offer our customers the following advanced software functionality options:
Advanced file services.
| • | Advanced name space services. We offer a single namespace across all of our platforms in a cluster and also provide the capability to link in third party NAS platforms into the namespace to create a single virtual file system. This enables simplified provisioning, faster performance through load balancing between nodes and easier administration of consistent data protection, data management and security policies across the storage infrastructure. |
| • | Advanced data caching services. Our cluster read caching functionality caches commonly used files across multiple nodes in a cluster, improving performance for read-intensive applications. This functionality also simplifies administration for environments that have applications with unpredictable workloads. |
| • | Data Migrator. Our Data Migrator application enables data movement among tiers of storage by allowing automated and transparent data migration from one tier of storage to another based on predefined policies, rules and triggers. Our Data Migrator application also supports the use of external cross volume links, enabling customers to repurpose other NFS-compatible storage servers for use as data migration targets for archival data. |
Advanced data protection services.
| • | High availability clustering. Our clustering technology allows our storage systems to share access to the same storage resources and provide automatic fail over for data protection and continuous access in mission critical applications. Depending on the storage system, cluster configurations support anywhere from two to eight node configurations and offer increased application availability and simplified administration. |
| • | Local and remote replication. We offer a complete range of policy-based replication capabilities, including synchronous and asynchronous data replication at the block and file level for full or incremental copies as well as replication on the same system or to another geographically dispersed storage system. Using rule-based policies, administrators can create one or more copies of their data for local or remote backup or alternate use. |
-90-
Table of Contents
| • | Backup services. We offer Network Data Management Protocol, or NDMP, and object-based backup capabilities for both SAN attached and LAN-based backup using a variety of commonly used third party backup software packages, and we support the use of most NDMP compatible tape libraries and virtual tape libraries as data repositories. |
Advanced data management services. We offer advanced data management services to facilitate the scheduling and movement of data to different tiers as needs to access the data change. Our data management features allow administrators to consolidate and manage block- and file-based data on a single storage system.
Advanced virtualization services.
| • | JetCenter. For customers who are using VMware, we offer JetCenter, a plug-in storage management tool for VMware’s vCenter management suite. JetCenter enables easy management of various storage functions on our platforms, such as creation of clones of virtual machine environments and management of backup capabilities, from within the familiar vCenter environment. |
| • | JetClones. JetClones are an extension of our snapshot technology and provide file-level writeable snapshot capabilities, enabling users to make near-instant, space-efficient copies of entire virtual machine environments. Each clone can be mounted as a new, writable virtual environment for use by a VMware server and thousands of JetClones can be created within a single SiliconFS file system, making this technology especially attractive to customers deploying server and desktop virtualization solutions. |
| • | Virtual servers. Virtual servers allow administrators to create separate logical servers with their own IP addresses, security policies and management policies within a single storage system, providing for better use of available storage, elimination of hot spots and the ability to quickly add or move storage to other projects, or even other storage systems, in response to changes in the data center environment. |
Extensive system management framework. Our system management framework simplifies common storage tasks performed by administrators. When using our storage systems, administrators have the ability to create file services, data protection, data management and virtualization policies, as well as consistent security policies with multiple administrator roles and access privileges for managing storage and server resources.
Our external System Management Unit provides a web-based graphical user interface and a command line interface, or CLI, as well as keeping historical information, management system redundancy and administration functions. With an easy to use interface and an online documentation library, administrators can quickly and easily provision storage resources for immediate user access. Our system management framework allows users to take advantage of programming and scripting functionality or perform further integration of our storage systems with other applications via CLI and simple network management protocol capabilities.
Technology and architecture
Our high performance NAS systems are comprised of our highly parallelized operating system, file system and core software and run on industry-standard hardware components. Our system software is designed to concurrently take advantage of both multi-core X86 processors and
-91-
Table of Contents
standard FPGAs. Using this architecture, our storage systems are able to deliver high performance file serving at near line-speed levels, while simultaneously offering a range of data management and storage efficiency-related functionality.
Our file system, SiliconFS, is the core of our architecture and with our operating system runs across our entire product family. Our file system and operating system have over 10 years of development history and are optimized to address the diverse needs associated with managing unstructured data at scale.
We use open industry standards in our product portfolio whenever possible . We believe through incorporating open standards in our product portfolio we are able to drive significant benefit to our customers. Our storage systems are designed to communicate with users and applications running Windows, Unix/Linux operating systems and cloud protocols using industry standard file sharing protocols over 10 Gigabit and Gigabit Ethernet networks.
We designed our storage systems to minimize complexity within customer deployments. Our systems use a standards-based SAN protocol with the flexibility to communicate with a range of storage arrays which have been qualified by us in close cooperation with the storage array vendors. To mitigate the complexity of provisioning and managing large arrays of storage, our systems provide the ability to virtualize the attached storage to create large pools grouped by class or tier of storage. This approach delivers the performance and scalability typically associated with a SAN, while providing the clients with standard IP network-based protocols, including NFS for UNIX or Linux clients, CIFS for Windows clients and iSCSI for block-based storage needs. With the use of SAN protocols on our systems, backups and replication are handled in the high speed storage network, minimizing impact on the client network.
By enabling pooling of storage resources, our systems simplify the scalability of storage infrastructure, allowing multiple systems to communicate, replicate and share data access through a single name space across the entire cluster. Our systems incorporate a data migration mechanism that transparently migrates data to storage tiers based upon the customer-defined value of the data, resulting in better utilization of storage infrastructure. Another benefit associated with our systems use of a standards-based SAN is the ability to scale capacity and performance independently. Our systems can also aggregate throughput across nodes while still maintaining the ability to scale capacity independently.
The parallelism of our system software allows data management and storage efficiency tools to operate simultaneously without slowing down file access. This capability provides significant benefit to performance-sensitive applications that run in close proximity to their dataset, such as deduplication. We are currently working on enhancing this on-board application environment. Applications currently under development within this framework include primary deduplication and cloud gateway connectivity.
Customers
Since inception, over 750 customers worldwide have deployed over 2,000 of our storage systems. We deploy our storage systems in a wide range of organizations, from large global enterprises with multiple locations to small organizations with just one location. Our customer base includes businesses and other organizations of all sizes across a variety of industries such as energy, the federal government, life sciences, Internet and cloud hosted service providers, media and entertainment and e-Discovery.
-92-
Table of Contents
HDS accounted for 22%, 30%, 41% and 45% of our revenue in fiscal 2009, fiscal 2010, fiscal 2011 and the three months ended April 30, 2011, respectively. No other customer accounted for 10% or more of our revenue in fiscal 2009, fiscal 2010, fiscal 2011 and the three months ended April 30, 2011. In fiscal 2009, fiscal 2010, fiscal 2011 and the three months ended April 30, 2011, sales to customers outside the United States represented 30%, 24%, 30% and 30% of our revenue, respectively. In fiscal 2009, fiscal 2010, fiscal 2011 and the three months ended April 30, 2011, sales to customers in the United States represented 70%, 76%, 70% and 70% of revenue, respectively. Please see “Geographical Information” in Note 14 of the notes to our consolidated financial statements for more information regarding our revenues by geographic area and our long-lived assets held in each geographic region.
Sales and marketing
We sell our storage systems to businesses and organizations of all sizes through multiple channels, which include our direct sales force, our extensive network of channel partners and a global OEM agreement with HDS. As of July 30, 2011, we had 124 employees in sales and marketing located in North America, Europe and Australia.
We have a variety of marketing programs designed to create brand recognition and market awareness for our product offerings and for qualified sales lead generation for our direct sales force and partners. Our marketing efforts include trade shows, technical conferences and technology seminars, advertising, publication of technical and educational articles in industry journals and sales training.
In addition, our strategic partners augment our marketing and sales campaigns through seminars, trade shows and joint advertising campaigns. Our customers and strategic partners provide references and recommendations that we often feature in our advertising and promotional activities.
Support and services
Customer services. We offer services that supplement the basic product warranty we provide. The services are provided globally and offer various levels of remote support, parts delivery and field support.
Our customer service organization provides the following services and support:
| • | Toll-free phone, web and email support, 24 hours a day, 7 days a week, 365 days a year; |
| • | Proactive remote system monitoring through a Callhome email system that allows automation and advanced product analytics to both monitor individual customers and population changes; |
| • | Onsite troubleshooting, service and system hardware and software upgrades; |
| • | Parts fulfillment, tiered delivery based on service level; and |
| • | Remote service capability to aid in remote troubleshooting and advanced diagnostic tools. |
Technical assistance centers. We have centralized support call centers in the United States and England running 24x7 as complete Technical Assistance Centers, or TACs, enabling phone, email and remote monitoring of customer systems. The call centers are responsible for the traditional Level One, Two and Three support layers, case management and field replacement dispatch.
-93-
Table of Contents
Worldwide parts fulfillment. Our customer services organization provides the logistics management related to worldwide parts replacement and returned materials authorization, as well as managing the failure analysis process and corrective action reports for customers.
Integrated serviceability. Our storage systems include a built-in reporting capability that provides system status monitoring and enables our TACs to respond to critical alerts. Our support personnel are able to leverage these management capabilities to better diagnose and resolve field issues.
Standard service plans. We offer the following service plans:
| • | Hardware service plans |
| • | 3 year warranty; |
| • | Standard plan provides next business day parts delivery; |
| • | Premium plan provides 4 hour parts delivery; |
| • | Secure standard to enable parts retention; and |
| • | Secure premium to enable parts retention. |
| • | Software services |
| • | 90 day warranty; and |
| • | Can be extended to co-terminate with any of the available hardware plans. |
Authorized service providers. We have Authorized Service Provider programs for our partners designed to enable key strategic OEM and channel partners to select from a range of services and support strategies to fit their business. We can enable partners to offer their own support contracts and provide their own level 1 and level 2 support processes.
Direct professional services. We develop and deliver professional service offerings to our end user customers. Our professional services offerings are designed to help our customers with the initial implementation of our technology and the scaling of our storage systems. Our professional services typically are used to help our customers through transitional events associated with changes to their business or information technology infrastructure.
Our professional services offerings include:
| • | Installation, upgrade and expansion services; |
| • | Data center relocation services; |
| • | Design and architecture services; |
| • | Optimization services for management and operation; |
| • | Replication services; |
| • | Data migration services; |
| • | Performance analysis services; |
| • | Assessment services; |
-94-
Table of Contents
| • | Technical account management; |
| • | On-site enterprise support engineers; and |
| • | Custom services. |
As of July 30, 2011, we had 47 employees in support and services.
Distribution
HDS OEM relationship. In November 2006, we entered into the MDA with HDS, which had an initial term of five years and has since been extended to July 31, 2013. Under this agreement, HDS combines our SiliconFS file system and related software with its disk arrays and sells the combined product as its HNAS system. HDS provides its own Level 1 and 2 support for the combined offering, which consists primarily of providing initial telephone support and problem resolution to customers, and we provide support for higher level issues. For fiscal 2009, fiscal 2010, fiscal 2011 and the three months ended April 30, 2011, HDS accounted for 22%, 30%, 41% and 45%, respectively, of our revenue.
The MDA commits HDS to purchase specified dollar amounts of our product offerings through September 2011. Under the MDA, during fiscal 2010 and fiscal 2011, HDS prepaid $10.0 million and $5.0 million, respectively, for future purchases of our products. As partial consideration for these prepayments, during fiscal 2011 we issued to HDS vested warrants to purchase 206,184 shares of our common stock with a per share exercise price of $1.94 and expiration in 2017. We determined the fair value at issuance was $222,000 and recognized as a reduction in revenue upon HDS’ purchase of products using the prepayment.
During fiscal 2011, HDS paid us $1.5 million for certain research and development projects. We recognized these amounts as a reduction in research and development expense as the associated projects were conducted. As of April 30, 2011, $537,000 remained included in customer deposits in our balance sheet. We have also received fees from HDS for an inventory supply agreement, whereby we set aside certain inventory quantities to be available for them as needed. The amount of support fees recognized for this service was $112,000, $682,000 and $321,000 in fiscal 2009, fiscal 2010 and fiscal 2011, respectively. This inventory arrangement expired at the end of fiscal 2011.
During fiscal 2009, we issued HDS vested warrants to purchase 151,418 shares of our common stock with a per share exercise price of $4.13 and a fair value at issuance of $194,000. The warrants were issued upon HDS’ achievement of specified revenue milestones for the sale of our products. These warrants expired unexercised in fiscal 2011. We recognized fair value of these warrants as a reduction in revenue.
Although the MDA prevents either party from soliciting the other party’s employees, it does not prohibit either party from competing in each other’s respective markets or from approaching the other party’s customer prospects for future business. We are obligated under the MDA to provide HDS with the same or better pricing than we provide any other similarly situated distributor, reseller or OEM.
After July 31, 2013, our MDA with HDS automatically renews for successive one-year periods, unless canceled by either party 60 days prior to the annual renewal date. In addition, either party may terminate the MDA with prior written notice if the other party commits a material breach that is not cured within a specified period.
-95-
Table of Contents
Value added resellers and other channel partners. We enter into agreements with VARs and other channel partners to provide our storage systems to their customers. As of April 30, 2011, we had effective agreements with 140 VARs and other channel partners. These agreements provide for and establish our channel partners as independent, nonexclusive resellers of our products solely to end users located within their territories as mutually agreed. The terms of these agreements are typically one year, with automatic annual renewals unless one of the parties indicates their intention not to renew by providing written notice at least 30 days prior to the renewal date. None of our VARs or other channel partners have minimum purchase commitments. None of our VARs or other channel partners accounted for more than 10% of our revenue in fiscal 2009, fiscal 2010, fiscal 2011 or the three months ended April 30, 2011.
Manufacturing
We outsource the manufacturing of our storage systems, as well as their assembly, testing and integration. Our manufacturing partner, Sanmina-SCI, provides us with a limited warranty to cover workmanship and manufactures all products in accordance with our specified tests and processes. Disk storage array and switch partners provide limited warranties for their hardware and software. Our storage systems are based on a common physical chassis, common modules, switches and disk storage components enabling Sanmina-SCI to more easily respond to changes in our storage systems without significant delay or increased costs.
We are party to a Manufacturing Services Agreement dated October 19, 2006 with Sanmina-SCI that had an initial term of one year. This agreement has one year automatic renewals of its term absent termination by either party for any reason by providing the other party with written notice at least 30 days prior to the expiration of each such one year period. Otherwise, Sanmina-SCI may terminate our agreement at any time upon 60 days notice. We may terminate the agreement for any reason upon 30 days prior written notice.
We forecast our supply requirements on a rolling 12-month basis and provide that forecast to Sanmina-SCI and key component suppliers. At any given time, we have firm purchase orders with Sanmina-SCI for three months of supply and nine additional months of forecast horizon. We review actual demand and supply on a weekly basis and adjust orders as required. The use of three months of confirmed, forward purchase orders provides Sanmina-SCI the lead time, if required, to qualify or source material from additional suppliers.
We incorporate disk arrays into our storage systems, which we source from Engenio under our OEM License and Distribution Agreement dated November 12, 2003. Our OEM agreement with Engenio had an initial term of two years and has one year automatic renewals. However, either party may terminate the agreement at any time and for any reason upon 30 days’ prior written notice. Engenio was recently acquired by NetApp.
We use multiple component sources and realize competitive pricing and sufficient supply by balancing order quantities between suppliers. We also leverage the supply chain of our vendors to reduce our inventory levels and minimize interruptions in our supply chain.
The lead times associated with certain components are lengthy and preclude rapid changes in quantity requirements and delivery schedules. Some of these components are available only from single or limited sources of supply. For example, our products use FPGAs that are manufactured by Altera and disk drives that are manufactured by Seagate and Hitachi GST. We do not have a long-term agreement with Altera with respect to the supply of the FPGAs.
-96-
Table of Contents
Competition
The market for our products is highly competitive and we expect competition to intensify in the future. Currently, we face competition from a number of established companies, including EMC, HP, IBM and NetApp. We also face competition from smaller, privately held companies and could face competition from new market entrants, whether from new ventures or from established companies moving into our industry. In addition, we compete against internally developed storage systems as well as combined third party software and hardware systems. A number of new, privately held companies are currently attempting to enter our market, some of which may become significant competitors in the future.
Our ability to compete effectively in our target markets depends on a number of factors, including:
| • | our ability to effectively respond to aggressive business tactics by our competitors, including selling at a discount or asserting intellectual property rights irrespective of the validity of the claims; |
| • | our storage systems’ scalability, performance, quality, ease of use and cost effectiveness relative to that of our competitors’ storage systems; |
| • | our storage systems’ interoperability with various operating systems, software applications, data access protocols and other storage systems; |
| • | our success in developing and using new and proprietary technologies to offer products and features previously not available in the marketplace; |
| • | our ability to attract and retain other VARs and OEMs; |
| • | our success in identifying new markets, applications and technologies; |
| • | our ability to continue to establish greater name recognition and build upon our reputation in the industry; |
| • | our ability to recruit development engineers and sales and marketing personnel; and |
| • | our ability to protect our intellectual property. |
With respect to these factors, based on publicly available data, we believe that we compete favorably on performance, scalability and total cost of ownership, and that our ease of use and reliability are comparable to market competitors, based on our customer feedback.
Research and development
Since our inception we have made substantial investments in research and development. We have research and development facilities in San Jose, California and Bracknell, England. As of July 30, 2011, we had 110 employees in research and development. Our focus is to maintain and enhance our current storage systems, develop new products that achieve market acceptance, maintain technological competitiveness and meet an expanding range of customer requirements. A substantial majority of our research and development employees focus on software development.
Our total expenses for research and development for fiscal 2009, fiscal 2010, fiscal 2011 and the three months ended April 30, 2011 were $18.3 million, $13.8 million, $16.4 million and $5.0 million, respectively.
-97-
Table of Contents
Intellectual property
Our success depends in part upon our ability to develop and protect our core technology and intellectual property. We rely primarily on a combination of trade secret, patent, copyright and trademark laws, as well as contractual provisions with employees and third parties, to establish and protect our intellectual property rights. Our products are provided to customers pursuant to agreements that impose restrictions on use and disclosure. Our agreements with employees and contractors who participate in the development of our core technology and intellectual property include provisions that assign any intellectual property rights to us. In addition to the foregoing protections, we generally control access to our proprietary and confidential information through the use of internal and external controls.
As of July 30, 2011, we held six U.S. patents expiring between August 2020 and February 2030 and also had 13 U.S. patent applications pending, of which 11 were nonprovisional patent applications, or patent applications that are examined on their merits by the U.S. Patent and Trademark Office and two were provisional patent applications, or patent applications filed for purposes of establishing priority that cannot result in an issued U.S. patent unless they are first converted to nonprovisional patent applications. We also held four issued foreign patents and had 16 foreign patent applications pending, of which 15 were applications filed in individual countries and one was an international application that cannot result in an issued foreign patent unless it is first converted into one or more national patent applications. Pending patent applications may receive unfavorable examination and are not guaranteed allowance as issued patents. We may elect to amend, abandon or otherwise not pursue prosecution of certain pending patent applications or of certain inventions disclosed in those patent applications due to patent examination results, strategic concerns, economic considerations or other factors. To the extent that a patent is issued, any such issued patent may be contested, circumvented, found unenforceable or invalidated, and we may be unwilling or unable to prevent third parties from infringing a particular patent. Moreover, there can be no assurance that we can successfully use our patents to prevent competitors from copying our products or developing competing technologies. We will continue to assess appropriate occasions to seek patent protection for aspects of our technology that we believe provide us a significant competitive advantage in the market.
We have registered the trademarks BLUEARC (either as one or two words) and our logo in Belgium, Canada, China, the European Union, France, Hong Kong, Israel, Japan, Luxembourg, Malaysia, Mexico, the Netherlands, New Zealand, Norway, Russia, Saudi Arabia, Singapore, South Africa, South Korea, Switzerland, Taiwan, Thailand, Turkey, Ukraine and the United States. In Australia and India certain classes of trademarks for BLUEARC (either as one or two words) and our logo have been registered and applications for other classes are pending.
The pending applications in Australia were initially rejected by that country’s trademark authority because third parties have filed trademark applications for similar marks, and for issues regarding the proper classification of some of the services listed. Our objection to an Australian web design firm’s use of the BLUEARC name has prompted that firm to challenge our Australian trademark registration, and we intend to defend against their claims in a hearing scheduled for October 2011.
BLUEARC MERCURY is registered in the European Union and Canada and is pending in the United States. We have registered the trademarks JETCENTER, JETCLONE and JETMIRROR in the
-98-
Table of Contents
European Union and applications for these marks are pending in Canada and the United States. The United States applications have been allowed and will register in due course once legally sufficient use information is submitted. The Canadian applications are still pending.
Although we rely on patent, copyright, trade secret, trademark and other intellectual property laws to protect our technology, we also believe that factors such as the technological and creative skills of our personnel, new product developments, frequent product enhancements and reliable product support and services are essential to establishing and maintaining a technology leadership position. We cannot be sure that others will not develop technologies that are similar or superior to our technology.
Despite our efforts to protect the intellectual property rights associated with our technology, unauthorized parties may still attempt to copy or otherwise obtain and use our technology. Moreover, it is difficult and expensive to monitor whether other parties are complying with patent and copyright laws and their confidentiality or other agreements with us and to pursue legal remedies against parties suspected of breaching our intellectual property rights.
Third parties could claim that our products or technologies infringe or misappropriate their proprietary rights. Our industry is characterized by the existence of a large number of patents, trademarks, trade secrets and copyrights and by frequent litigation based on allegations of infringement or other violations of intellectual property rights. We may in the future be sued for violations of other parties’ intellectual property rights and the risk of such a lawsuit will likely increase as our size and market share expand and as the number of products and competitors in our market increase.
Employees
As of July 30, 2011, we had 313 employees in offices across North America, Europe and Australia including 124 employees in sales and marketing, 110 in research and development, 47 in support and services and 32 in finance, administration and operations. We consider our current relationship with our employees to be good. None of our employees are represented by labor unions or have collective bargaining agreements.
Properties
Our principal administrative, sales, marketing, customer support and research and development facility is located at our headquarters in San Jose, California. We currently lease approximately 41,772 square feet of office space at the San Jose facility pursuant to a lease that expires in August 2014. In addition to our headquarters, we lease approximately 12,191 square feet of office space in Bracknell, England for research and development, as well as European sales and our lease for this facility expires in October 2015. We also have a sales office in Germany of approximately 345 square feet. Additionally, we have virtual offices which provide mail, phone and voicemail forwarding services in Australia and New Zealand pursuant to service agreements which expire November 30, 2011 and October 31, 2011, respectively. From time to time we rent conference rooms at our virtual offices for sales meetings with potential customers.
We believe that our existing properties are in good condition and are sufficient and suitable for the conduct of our business. We intend to add new facilities or expand existing facilities as we add employees or expand our markets and we believe that suitable additional space will be available as needed to accommodate any such expansion of our operations.
-99-
Table of Contents
Legal proceedings
We are currently not a party to any material legal proceedings. From time to time, we may be involved in legal actions arising in the ordinary course of business.
-100-
Table of Contents
Executive officers and directors
The following table sets forth information regarding our executive officers and directors and their ages as of July 30, 2011:
| Name | Age | Position | ||||
|
| ||||||
| Michael B. Gustafson |
44 | President, Chief Executive Officer and Director | ||||
| Rick Martig |
48 | Chief Financial Officer | ||||
| Shmuel Shottan |
59 | Chief Technology Officer | ||||
| Christopher J. McBride |
48 | Senior Vice President, Global Customer Operations | ||||
| David A. de Simone |
56 | Senior Vice President, Product and Technology Operations | ||||
| Bridget Warwick |
49 | Senior Vice President, Marketing & Business Development | ||||
| Christopher P. White |
45 | Vice President, Global Channel Sales | ||||
| Paul S. Madera(2) |
54 | Director | ||||
| David N. Martin |
66 | Director | ||||
| Gary J. Morgenthaler(1)(2)(3) |
63 | Director | ||||
| Michael J. Stark(3) |
56 | Director | ||||
| José F. Suarez(1)(2)(3) |
42 | Director | ||||
| Duston M. Williams(1) |
53 | Director | ||||
|
| ||||||
| (1) | Member of our audit committee. |
| (2) | Member of our compensation committee. |
| (3) | Member of our nominating and corporate governance committee. |
Executive officers
Michael B. Gustafson has served as our Chief Executive Officer and a director since May 2005, and as our President since June 2004. From April 1998 to May 2004, Mr. Gustafson served in various executive capacities as an officer of McData Corporation, an enterprise-level storage network company. His most recent positions at McData included Senior Vice President of Marketing and Senior Vice President of Sales. From 1989 to 1998, Mr. Gustafson served in various sales management positions for IBM Corporation, a global information technology systems and services company. Mr. Gustafson received a B.S. and B.A. from Washington University in St. Louis. We believe Mr. Gustafson possesses specific attributes that qualify him to serve as a member of our board of directors, including his extensive experience as a senior executive in the storage technology industry and the operational insight and expertise he has accumulated as our President and Chief Executive Officer.
Rick Martig has served as our Chief Financial Officer since July 2008. From November 2007 to July 2008, Mr. Martig served as Senior Vice President of Finance and Chief Financial Officer of Genesis Microchip, Inc., a supplier of integrated circuits. From 1995 to November 2007, Mr. Martig served in various positions with Xilinx, Inc., a supplier of programmable logic devices, most recently as Senior Director of Worldwide Corporate Finance and previously as Senior Director Controller of all business units within Xilinx. Mr. Martig received a B.S. from Santa Clara University and an M.B.A. from Saint Mary’s College.
Shmuel Shottan has served as our Senior Vice President of Product Development since August 2001 and as our Chief Technology Officer since January 2005. From September 2000 to July 2001, Mr. Shottan served as Chief Strategy Officer for SNAP Appliances, Inc., a network storage spin-off from Quantum Corporation. From August 1999 to September 2000, Mr. Shottan served as a General Partner of Quantum Technology Ventures, a storage focused venture fund. From September 1994 to July 1999, Mr. Shottan served as Senior Vice President of engineering and Chief Technology Officer at Meridian Data, Inc., a network storage solutions company,
-101-
Table of Contents
where he led the development of the Snap Server. Prior to Meridian Data, Mr. Shottan held engineering development and management positions at Parallan Computer, Inc. and AST Research. Mr. Shottan also serves as a director of Overland Storage, Inc. a provider of data management and protection solutions. Mr. Shottan received a B.S.E.E. degree from the Technion Institute of Technology in Israel.
Christopher J. McBride has served as our Senior Vice President, Global Customer Operations since December 2007 and from March 2007 to December 2007, served as our Vice President of Global Services. Prior to joining us, Mr. McBride served as a sales executive at Emulex Corporation, a networking company, from May 2006 to February 2007. From August 2004 to May 2006, Mr. McBride also served as a senior sales executive at Aarohi Communications, Inc., a semiconductor company acquired by Emulex in 2006. Before that, from October 1999 to July 2004, Mr. McBride served in various positions for McData, including Vice President of Sales—Americas. Prior to working for McData, Mr. McBride served in various sales and management positions from July 1995 to September 1999, at CompuCom Systems, Inc., a systems integrator for enterprise customers in the U.S. Prior to that, he served in various sales and management roles at IBM, a global IT systems and services company, from July 1987 to June 1995. Mr. McBride received an M.S. and a B.S. from Auburn University.
David A. de Simone has served as our Senior Vice President, Product Operations and Technology since June 2011. From September 2003 to June 2011, Mr. De Simone served in various capacities at Blue Coat Systems, Inc., a network technology company, most recently as its Senior Vice President, Products and Technology. Mr. de Simone previously held positions at Brocade Communications Systems, Inc., a provider of storage area networking products, Tandem Computers, an enterprise computer company, and Compaq Computer Systems, a computer systems company, after its acquisition of Tandem. Mr. de Simone holds a B.S.E.E. from the University of California, Davis.
Bridget Warwick has served as our Senior Vice President Marketing since February 2009. From February 2007 to February 2009, Ms. Warwick was self employed as an individual investor. From April 1997 to February 2007, Ms. Warwick served in various positions with NetApp, Inc., a network storage company, including most recently as its Vice President of Business Operations. From June 1995 to April 1997, Ms. Warwick served as Network Architect for Octel Communications Corporation, a telecommunications company. Ms. Warwick received a B.A. from Sheffield University in England.
Christopher P. White has served as our Vice President, Global Channel Sales since June 2011. Prior to joining us, Mr. White served as a Senior Director of Channel Sales at NetApp, Inc. from October 2009 to June 2011. From December 2000 to October 2009, with the exception of a period of time from July 2007 to August 2007, Mr. White held various sales management roles at Veritas Software Corp., a storage management software company, and Symantec Corporation, a security software company (Veritas was acquired by Symantec in July 2005). From July 2007 to August 2007, Mr. White was employed at CommVault Systems, Inc., a provider of enterprise backup software, as Director of Sales, West Area before rejoining Symantec Corporation. Before that, from June 1999 to December 2000, Mr. White held the position of National Director of Sales at Virtual Growth, Incorporated, a financial application services provider. Prior to that, from February 1994 to June 1999, Mr. White served in various sales and management positions at Automatic Data Processing, Inc., a provider of payroll services. Previous to that Mr. White held various sales roles in the pharmaceutical industry with Boehringer Mannheim Group, Syntex
-102-
Table of Contents
Laboratories Inc. and Ortho Pharmaceutical Corporation. Mr. White received a B.A. from the University of California at Irvine.
Directors
Paul S. Madera has served as one of our directors since July 2003. Mr. Madera currently serves as Managing Director of Meritech Capital Partners, a venture capital firm he cofounded in June 1999, where he focuses on investing in the storage, semiconductor and digital consumer sectors. In July 2003, Meritech led a round of equity financing which invested in us. Before founding Meritech, Mr. Madera held various positions at Montgomery Securities/Banc of America from 1994 to 1999 including Managing Director and Head of the Private Equity Group. Prior to joining Montgomery, Mr. Madera was an investment banker with Morgan Stanley & Co. in New York. Mr. Madera also serves as a director to a number of private companies, including DealerSocket, Inc., a developer of customer relationship management technology, Openlane, Inc., a company in the automotive wholesale market, and Force10 Networks, Inc., a network technology company. He also serves as a board observer at Facebook, Inc., the social networking company, Wonga Ltd., a UK-based short term lending company, as well as Glaukos, Inc., a medical device company. Mr. Madera received a B.S. from the United States Air Force Academy and an M.B.A. from the Stanford Graduate School of Business. We believe Mr. Madera possesses specific attributes that qualify him to serve as a member of our board of directors, including his experience in the venture capital and investment banking industries.
David N. Martin has served as one of our directors since September 2010. Mr. Martin currently serves as Founder and Managing Director of 280 Capital Partners, a private equity firm he cofounded in January 2008. From January 2006 to May 2007, Mr. Martin served as a CEO in Residence at Warburg Pincus LLC, a global venture capital and private equity firm. From October 2003 to July 2005, Mr. Martin served as Chairman and Chief Executive Officer of Qlusters, Inc., a utility computing software company. From July 1996 to October 2003, Mr. Martin served as Chairman and Chief Executive Officer of Entegrity Solutions Corporation, an Internet software and services provider. Prior to Entegrity, Mr. Martin also was an Executive Vice President and Board member at National Semiconductor Corporation and Chief Executive Officer of National Advanced Systems Co. Ltd., the predecessor company to HDS. Mr. Martin received a B.S.E. from Princeton University. We believe Mr. Martin possesses specific attributes that qualify him to serve as a member of our board of directors, including his experience as an executive in the technology and private equity industries.
Gary J. Morgenthaler has served as one of our directors since May 2006. Mr. Morgenthaler has served as General Partner of Morgenthaler Ventures since December 1989. Mr. Morgenthaler was a cofounder and Chief Executive Officer and Chairman of Illustra Information Technologies, Inc., a relational database software company, from 1992 to 1996. From 1980 until 1989, Mr. Morgenthaler served as a cofounder, Chief Executive Officer and Chairman of Ingres Corporation, a leading relational database software company. Before that, Mr. Morgenthaler served as a management consultant with McKinsey & Co., a global management consulting firm. Mr. Morgenthaler also serves as a director to a number of private companies, including Nominum, Inc., an Internet software company, OneChip Photonics Inc., a provider of optical transceiver solutions, Orb Networks, Inc. a provider of digital media streaming solution and Overture Networks, Inc., a provider of Carrier Ethernet solutions. Mr. Morgenthaler received a B.A. degree from Harvard University. We believe Mr. Morgenthaler possesses specific attributes
-103-
Table of Contents
that qualify him to serve as a member of our board of directors, including his extensive experience as a venture capitalist and technology executive.
Michael J. Stark has served as one of our directors since January 2008. Since January 1999, Mr. Stark has been founder and General Partner of Crosslink Capital, Inc., a venture capital and growth equity investment management firm. Mr. Stark served as Managing Director of Crosslink Capital, which was a business unit of Robertson Stephens from 1992 to December 1998. Mr. Stark was a research analyst with Robertson Stephens from 1983 to 1989. Before joining Robertson Stephens, Mr. Stark worked in Intel Corporation’s strategic planning group. Mr. Stark also serves as a director for a number of private companies, including Livescribe, Inc., a provider of low-cost mobile computing platforms, ReVera Incorporated, a semiconductor company and SiliconBlue Technologies Corporation, a semiconductor company. Mr. Stark received a B.S. from Northwestern University and an M.B.A. from the University of Michigan. We believe Mr. Stark possesses specific attributes that qualify him to serve as a member of our board of directors, including his extensive experience as an executive in the venture capital industry and as a board member of other privately held companies.
José F. Suarez has served as one of our directors since July 2010. Mr. Suarez has served as Managing Director of Investor Growth Capital, the venture capital arm of Investor AB, a Nordic industrial holding company, since January 2007. From August 2003 to December 2006, Mr. Suarez served in various roles at Investor AB, most recently as a Vice President. Mr. Suarez is currently a director of Atrenta, Inc., a electronic design automation company, Chelsio Communications, Inc., a provider of networking solutions, eSilicon Corporation, a semiconductor design company, ExaGrid Systems Inc., a provider of disk-based backup solutions, Innovative Micro Technology, Inc., a semiconductor manufacturing company, Magnum Semiconductor, Inc., a provider of broadcast infrastructure media processors and Millennium Microtech Group, a semiconductor company. Mr. Suarez received a B.A. from Dartmouth College. We believe Mr. Suarez possesses specific attributes that qualify him to serve as a member of our board of directors, including his experience as a director of technology companies and his background in the venture capital industry.
Duston M. Williams has served as one of our directors since October 2007. Mr. Williams has served as Chief Financial Officer of SandForce, Inc., a data storage company, since March 2011. From July 2010 to February 2011, Mr. Williams served as Chief Financial Officer of Soraa Inc., a semiconductor company. From June 2006 to June 2010, Mr. Williams served as Chief Financial Officer of Infinera Corp., a digital optical networking company. From December 2004 to June 2006, Mr. Williams was Executive Vice President and Chief Financial Officer of Maxtor Corporation, an information storage solutions company. From July 2003 to November 2004, Mr. Williams served as Chief Financial Officer of Aruba Networks, Inc., a wireless network infrastructure company. From July 2001 to February 2003, Mr. Williams served as Chief Financial Officer of Rhapsody Networks, Inc., a storage networking provider. Mr. Williams also spent 14 years at Western Digital Corporation, a disk drive company, including four years as Chief Financial Officer. Mr. Williams holds a B.S. from Bentley College and an M.B.A. from the University of Southern California. We believe Mr. Williams possesses specific attributes that qualify him to serve as a member of our board of directors, including his deep financial and accounting background and his extensive experience in the storage and networking industries.
-104-
Table of Contents
Board composition
Our board of directors currently consists of seven members. Our bylaws permit our board of directors to establish by resolution the authorized number of directors, and seven directors are currently authorized.
Board composition and risk oversight
Following the completion of this offering, at each annual meeting of stockholders, a class of directors will be elected for a three-year term to succeed the class whose term is then expiring. The terms of the directors will expire upon the election and qualification of successor directors at the annual meeting of stockholders to be held during 2012 for the Class I directors, 2013 for the Class II directors and 2014 for the Class III directors.
| • | Our Class I directors will be Messrs. Morgenthaler and Stark. |
| • | Our Class II directors will be Messrs. Madera, Martin and Suarez. |
| • | Our Class III directors will be Messrs. Gustafson and Williams. |
Our amended and restated certificate of incorporation and amended and restated bylaws will provide that the number of our directors shall be fixed from time to time by resolution of the majority of our board of directors. Any additional directorships resulting from an increase in the number of authorized directors will be distributed among the three classes so that, as nearly as possible, each class will consist of one-third of the directors.
The division of our board of directors into three classes with staggered three-year terms may delay or prevent a change of our management or a change of control. Under Delaware law, our directors may be removed for cause by the affirmative vote of the holders of a majority of our voting stock.
Our board of directors is responsible for, among other things, overseeing the conduct of our business, reviewing and, where appropriate, approving our long-term strategic, financial and organizational goals and plans, and reviewing the performance of our Chief Executive Officer and other members of senior management. Following the end of each year, our board of directors will conduct an annual self-evaluation, which includes a review of any areas in which the board of directors or management believes the board of directors can make a better contribution to our corporate governance, as well as a review of the committee structure and an assessment of the board of directors’ compliance with corporate governance principles. In fulfilling the board of directors’ responsibilities, directors have full access to our management and independent advisors.
Our board of directors, as a whole and through its committees, has responsibility for the oversight of risk management. Our senior management is responsible for assessing and managing our risks on a day to day basis. Our audit committee oversees and reviews with management our policies with respect to risk assessment and risk management and our significant financial risk exposures and the actions management has taken to limit, monitor or control such exposures, and our compensation committee oversees risk related to compensation policies. Both our audit and compensation committees report to the full board of directors with respect to these matters, among others.
-105-
Table of Contents
Director independence
In June 2011, our board of directors undertook a review of the independence of the directors and considered whether any director has a material relationship with us that could compromise his ability to exercise independent judgment in carrying out his responsibilities. As a result of this review, our board of directors determined that each of Messrs. Madera, Morgenthaler, Stark, Suarez and Williams are “independent directors” as defined under the rules of The NASDAQ Global Market and the New York Stock Exchange, constituting a majority of independent directors of our board of directors as required by the rules of The NASDAQ Global Market and the New York Stock Exchange.
Board committees
Our board of directors currently has an audit committee, a compensation committee and a nominating and corporate governance committee. Each committee operates under a charter that has been approved by our board of directors. Following the completion of the offering contemplated by this prospectus, copies of the charters for our audit committee, compensation committee and nominating and corporate governance committee will be available without charge, upon request in writing to BlueArc Corporation, 50 Rio Robles, San Jose, California 95134; Attn: Secretary, or on the investor relations portion of our website, www.bluearc.com. The inclusion of our website address in this prospectus does not include or incorporate by reference the information on our website into this prospectus.
Audit committee. Our audit committee oversees our corporate accounting and financial reporting processes. The audit committee generally oversees:
| • | our accounting and financial reporting processes as well as the audit and integrity of our financial statements; |
| • | the qualifications and independence of our independent registered public accounting firm; |
| • | the performance of our independent registered public accounting firm; and |
| • | our compliance with disclosure controls and procedures and internal controls over financial reporting, as well as the compliance of our employees, directors and consultants with ethical standards adopted by us. |
The audit committee also has certain responsibilities, including without limitation, the following:
| • | selecting and hiring the independent registered public accounting firm; |
| • | supervising and evaluating the independent registered public accounting firm; |
| • | evaluating the independence of the independent registered public accounting firm; |
| • | approving audit and nonaudit services and fees; |
| • | reviewing financial statements and discussing with management and the independent registered public accounting firm our annual audited and quarterly financial statements, the results of the independent audit and the quarterly reviews, and the reports and certifications regarding internal controls over financial reporting and disclosure controls; and |
| • | reviewing reports and communications from the independent registered public accounting firm. |
-106-
Table of Contents
Our audit committee consists of Mr. Williams, who is the committee Chairman, and Messrs. Morgenthaler and Suarez, each of whom is a nonemployee member of our board of directors. Our board of directors has determined that Mr. Williams is a financial expert as contemplated by the rules of the SEC implementing Section 407 of the Sarbanes Oxley Act of 2002. Mr. Williams has also been appointed to serve as the chairman of the audit committee. Our board of directors has considered the independence and other characteristics of each member of our audit committee. Our board of directors believes that the composition of the audit committee meets the requirements for independence under the current requirements of The NASDAQ Global Market, New York Stock Exchange and SEC rules and regulations. We believe that the audit committee charter and the functioning of the audit committee comply with the applicable requirements of The NASDAQ Global Market, New York Stock Exchange and SEC rules and regulations. Our audit committee also serves as our qualified legal compliance committee. We intend to comply with future requirements to the extent they become applicable to us.
Compensation committee. The compensation committee oversees our corporate compensation policies, plans and benefit programs and has the responsibilities described in the “Compensation discussion and analysis” below.
Our compensation committee consists of Mr. Madera, who is the committee chairman, and Messrs. Morgenthaler and Suarez, each of whom is a nonemployee member of our board of directors. We believe that each member of the compensation committee meets the requirements for independence under the current requirements of The NASDAQ Global Market and the New York Stock Exchange, is a nonemployee director as defined by Rule 16b-3 promulgated under the Exchange Act and is an outside director as defined pursuant to Section 162(m) of the Internal Revenue Code. We believe that the compensation committee charter and the functioning of the compensation committee comply with the applicable requirements of The NASDAQ Global Market, the New York Stock Exchange and SEC rules and regulations. We intend to comply with future requirements to the extent they become applicable to us.
The functions of this committee include, among other things:
| • | overseeing our compensation policies, plans and benefit programs; |
| • | reviewing and approving for our executive officers: the annual base salary, annual incentive bonus, including the specific goals and dollar amount, equity compensation, employment agreements, severance agreements and change in control arrangements and any other benefits, compensation or arrangements; |
| • | preparing the compensation committee report that the SEC requires to be included in our annual proxy statement; and |
| • | administrating our equity compensation plans. |
Nominating and corporate governance committee. Our nominating and corporate governance committee consists of Mr. Morgenthaler, who is the committee chairman and Messrs. Stark and Suarez, each of whom is a nonemployee director of our board of directors. Our board of directors has determined that each member of our nominating and governance committee meets the requirements for independence under the current requirements of The NASDAQ Global Market and the New York Stock Exchange. We believe that the nominating and corporate governance committee charter and the functioning of the nominating and corporate governance committee comply with the applicable requirements of The NASDAQ Global Market and New York Stock
-107-
Table of Contents
Exchange and SEC rules and regulations. We intend to comply with future requirements to the extent they become applicable to us.
The functions of this committee include, among other things:
| • | assisting our board of directors in identifying prospective director nominees and recommending nominees to the board of directors for each annual meeting of stockholders; |
| • | reviewing developments in corporate governance practices and developing and recommending governance principles applicable to our board of directors; |
| • | reviewing the succession planning for each of our executive officers; |
| • | overseeing the evaluation of our board of directors and management; and |
| • | recommending members for each board committee to our board of directors. |
Code of business conduct and ethics
We have adopted a code of business conduct and ethics that is applicable to all of our employees, officers and directors, and we have also adopted a code of ethics for principal executives and senior financial officers.
Director compensation
During fiscal 2011, our directors did not receive cash compensation for their services as directors; however, Mr. Williams received a stock option to purchase 58,261 shares of our common stock in connection with his continuing service with our board of directors, and Mr. Martin received a stock option to purchase 90,000 shares of our common stock upon his becoming a member of our board of directors.
Additionally, our board of directors granted Mr. Martin 28,926 shares of restricted stock under our 2000 Plan, subject to vesting, pursuant to a consulting agreement under which Mr. Martin provided consulting services to us. Mr. Martin also received cash compensation of $219,382 for his consulting services. Mr. Martin’s compensation related to the consulting services he provided to us is discussed further in the section entitled “Related party transactions.”
The following table provides information for fiscal 2011 regarding all compensation awarded to, earned by or paid to each nonemployee director for their services as a nonemployee director. Mr. Gustafson did not receive any separate compensation as a director.
| Name | Fees earned or |
Stock awards(1)(7) | Option awards(2)(7) |
Total | ||||||||||||
|
|
||||||||||||||||
| Paul S. Madera |
$ | — | $ | — | $ | — | $ | — | ||||||||
| David N. Martin |
219,382(3) | 49,463(3)(4) | 54,684(5) | 323,529 | ||||||||||||
| Gary J. Morgenthaler |
— | — | — | — | ||||||||||||
| Michael J. Stark |
— | — | — | — | ||||||||||||
| José F. Suarez |
— | — | — | — | ||||||||||||
| Duston M. Williams |
— | — | 35,399(6) | 35,399 | ||||||||||||
|
|
||||||||||||||||
| (1) | Amounts represent the aggregate grant date fair value of the restricted stock award calculated in accordance with Financial Accounting Standards Board Accounting Standards Codification Topic 718, Stock Compensation, as amended. See Note 9 in the notes to our consolidated financial statements for a discussion of valuation assumptions made in determining the grant date fair value and compensation expense of our restricted stock awards. |
| (2) | Amounts represent the aggregate grant date fair value of the option award calculated in accordance with Financial Accounting Standards Board Accounting Standards Codification Topic 718, Stock Compensation, as amended, without regard to estimated forfeitures. See Note 9 in the notes to our consolidated financial statements for a discussion of valuation assumptions made in determining the grant date fair value and compensation expense of our stock options. |
-108-
Table of Contents
| (3) | Amounts represent compensation earned by or paid to Mr. Martin for his services as a consultant in fiscal 2011. |
| (4) | Represents 28,926 shares of restricted stock granted on January 18, 2011 under our 2000 Stock Option/Stock Issuance Plan at a price per share of $1.71. The restricted stock vests beginning on November 1, 2010 and vests as to 1/6th of the shares monthly thereafter, subject to Mr. Martin’s continued service through each vesting date. |
| (5) | Represents an option granted on September 1, 2010 to purchase up to 90,000 shares of our common stock at a price per share of $1.42. The option vests beginning on September 1, 2010 and vests as to 1/48th of the shares subject to the option award monthly thereafter, subject to Mr. Martin’s continued service through each vesting date. |
| (6) | Represents an option award granted on October 22, 2010 to purchase up to 58,261 shares of our common stock at a price per share of $1.42. The option vests beginning on October 22, 2010 and vests as to 1/4th of the shares subject to the option award on the first anniversary of the vesting commencement date, then as to 1/48th of the shares subject to the option award monthly thereafter, subject to Mr. Williams’ continued service through each vesting date. |
| (7) | The aggregate number of shares subject to stock awards and stock options outstanding at January 29, 2011 for each nonemployee director is as follows: |
| Name | Aggregate number of stock awards outstanding |
Aggregate number of stock options outstanding |
||||||
|
|
||||||||
| Paul S. Madera |
— | — | ||||||
| David N. Martin |
28,926 | 100,000 | ||||||
| Gary J. Morgenthaler |
— | — | ||||||
| Michael J. Stark |
— | — | ||||||
| José F. Suarez |
— | — | ||||||
| Duston M. Williams |
— | 120,991 | ||||||
|
|
||||||||
On June 22, 2011, Messrs. Madera, Morgenthaler, Stark and Suarez were each granted an option to purchase 104,000 shares of common stock at an exercise price of $3.99 per share. Also on June 22, 2011, Mr. Martin was granted an option to purchase 30,000 shares of common stock at an exercise price of $3.99 share, and Mr. Williams was granted an option to purchase 60,000 shares of common stock at an exercise price of $3.99 per share. Subject to the director’s continued service through each vesting date, 1/48th of the shares subject to these options vest each month after the date of grant.
Compensation committee interlocks and insider participation
No member of our compensation committee has ever been an executive officer or employee of our company. None of our executive officers currently serves, or has served during the last completed year, on the compensation committee or board of directors of any other entity that has one or more executive officers serving as a member of our board of directors or compensation committee. Before establishing the compensation committee, our full board of directors made decisions relating to compensation of our executive officers. During fiscal 2011, Paul S. Madera, Gary J. Morgenthaler, Michael J. Stark and José F. Suarez served on our compensation committee.
The following is a description of transactions in fiscal 2011, to which we have been a participant in which the amount involved exceeded or will exceed $120,000 and in which the members of our compensation committee and entities with which they are associated had or will have a direct or indirect material interest.
Series GG preferred stock financing. In July 2010, we sold an aggregate of 8,342,358 shares of Series GG preferred stock at a per share purchase price of $2.53 pursuant to a stock purchase agreement. Funds affiliated with Crosslink Capital, which are associated with our director Michael J. Stark, purchased 622,249 shares of Series GG preferred stock for an aggregate purchase price of $1,573,605. Funds affiliated with Meritech Capital, which are associated with
-109-
Table of Contents
our director Paul S. Madera, purchased 957,680 shares of Series GG preferred stock for an aggregate purchase price of $2,421,877. Morgenthaler Partners VIII, L.P., which is associated with our director Gary J. Morgenthaler, purchased 398,670 shares of Series GG preferred stock for an aggregate purchase price of $1,008,197. Funds affiliated with Investor Growth Capital, which are associated with our director José F. Suarez, purchased 4,745,146 shares of Series GG preferred stock for an aggregate purchase price of $12,000,000.
Investors’ rights agreement. In connection with our Series GG financing, we entered into an amended and restated investors’ rights agreement with certain purchasers of our preferred stock, including our principal stockholders with whom certain of our directors are affiliated. Pursuant to this agreement, we granted such stockholders certain registration rights with respect to certain shares of our common stock which will be issuable upon conversion of the shares of preferred stock held by them. For a description of these registration rights, see “Description of capital stock—Registration rights.”
Voting agreement. In connection with our Series GG financing, we entered into a voting agreement with certain holders of our outstanding preferred stock and common stock, including entities with which certain of our directors are affiliated, and certain other stockholders, obligating each party to vote or consent at each stockholder meeting or with respect to each written stockholder consent to elect the nominees of certain parties to our board of directors. The parties to the voting agreement have agreed, subject to certain conditions, to vote their shares so as to elect as directors the nominees designated by certain of our investors, including Meritech Capital Partners, which has designated Paul S. Madera for election to our board of directors; Crosslink Capital, which has designated Michael J. Stark for election to our board of directors; Morgenthaler Partners VIII, L.P., which has designated Gary J. Morgenthaler for election to our board of directors; and Investor Growth Capital, Inc., which has designated José F. Suarez for election to our board of directors. In addition, the parties to the voting agreement have agreed to vote their shares so as to elect our then current Chief Executive Officer to our board of directors, and two persons nominated by the holders of a majority of the outstanding shares held by Meritech Capital Partners, Morgenthaler Partners VIII, L.P., Crosslink Capital and Investor Growth Capital, which are Duston M. Williams and David N. Martin. Upon the closing of this offering, the voting agreement will terminate in its entirety and none of our stockholders will have any special rights regarding the election or designation of members of our board of directors.
-110-
Table of Contents
Compensation discussion and analysis
This compensation discussion and analysis provides information about the material components of our compensation program for our named executive officers. Our named executive officers for fiscal 2011 were Michael B. Gustafson, our President and Chief Executive Officer, to whom we refer as our CEO; Rick Martig, our Chief Financial Officer, to whom we refer as our CFO; Christopher J. McBride, our Senior Vice President of Global Customer Operations; Shmuel Shottan, our Chief Technology Officer, to whom we refer as our CTO; and Bridget Warwick, our Senior Vice President of Marketing and Business Development. More information on the compensation for our named executive officers appears in the “—Fiscal 2011 summary compensation table” that follows this section.
Process overview. Our compensation committee discharges the board of directors’ responsibilities relating to compensation for all our executive officers. The responsibilities and primary functions of the compensation committee are discussed above under the heading “Management—Board committees—Compensation committee.”
The agenda for meetings is determined by the chair of the compensation committee with the assistance of certain employees who attend compensation committee meetings. Committee meetings are regularly attended by one or more of our CEO, our CFO and our Vice President of Human Resources. Our CEO supports the compensation committee in its work by providing information relating to our financial plans and performance assessments of our officers. Our CEO assesses our officers’ contributions to corporate goals as well as achievement of their individual goals, and makes a recommendation to the compensation committee with respect to any changes in compensation for each member of the executive team, other than himself. The compensation committee meets to evaluate, discuss and modify or approve these recommendations and to conduct a similar evaluation of our CEO’s contributions to corporate goals and achievement of individual goals. The compensation committee also has the authority under its charter to engage the services of outside advisors, experts and others for assistance. During fiscal 2011, the compensation committee did not engage any compensation consultants. In June 2011, the compensation committee retained Compensia LLC to perform certain compensatory advisory services for fiscal 2012. These services had not been completed as of the date of this prospectus. The compensation committee’s chair reports the compensation committee’s determinations and recommendations on compensation to our board of directors.
Compensation philosophy and objectives. One of the compensation committee’s principal objectives is to assess compensation levels and determine compensation in light of the following key factors: corporate performance, financial targets, individual performance and the competitive market for talent. The compensation committee believes that the most effective executive compensation program is one that is designed to reward the achievement of annual, long-term and strategic goals, with the ultimate objective of improving stockholder value. The compensation committee evaluates both performance and compensation to ensure that we maintain our ability to attract and retain superior employees in key positions with competitive compensation.
The compensation committee believes that the compensation we provide to our executive officers, including our named executive officers, should be weighted in favor of at-risk compensation incentives designed to reward performance. To that end, the total compensation
-111-
Table of Contents
of each executive officer includes base salary, an annual performance-based incentive component and a long-term equity incentive component. The annual performance-based incentive may include both cash and equity components linked to pre-established, objective corporate performance measures. The long-term equity component, in the form of stock options, links compensation to the price of our common stock. The compensation committee believes that both the short-term and long-term equity components align our executives’ interests with those of our stockholders.
The compensation committee applies its judgment in determining the relative allocation of each compensation element based on a compensation package for each executive officer. The compensation committee makes these allocations taking into consideration compensation of similarly situated executives at other private, late-stage companies in our industry and our geographic area, as described below. Other factors affecting the compensation committee’s judgments include performance compared to strategic goals established for each individual, the nature and scope of the executive’s responsibilities and the individual’s effectiveness in leading our initiatives to achieve corporate goals.
The compensation committee has not adopted any policies or guidelines for allocating compensation between cash and noncash compensation, or between short and long-term components of equity incentive compensation. However, our philosophy is to make a substantial portion of an officer’s compensation performance-based, using both cash and equity. The compensation committee sets guidelines that target executive officers’ base salary at the 50th percentile and total overall compensation at between the 50th and 75th percentile of an internal compensation index (based on executive compensation data taken from the technology company survey listed below). Only the compensation for our CTO falls outside the high end of these guidelines. We deviated from our targeted range for our CTO because of his contributions to our proprietary technology.
Our officers participate in an annual performance-based incentive program that has included both cash and equity components. Given our stage of growth, equity has historically been a significant component of the annual performance-based program; however, the cash component has become more significant in recent years and is now the sole component of the annual performance-based program for fiscal 2012.
Principal elements of executive compensation. In fiscal 2011, the principal components of compensation for our executive officers were:
| • | base salary; |
| • | performance-based incentive compensation; |
| • | long-term equity incentive compensation; and |
| • | change of control and severance arrangements. |
Competitive market review for fiscal 2011. The market for experienced management is highly competitive in the technology industry. We seek to attract and retain the most highly qualified executives to manage each of our business functions, and we face substantial competition in recruiting and retaining management from companies ranging from large and established technology companies to entrepreneurial early-stage companies. We expect competition for appropriate technical, commercial and management skills to remain strong for the foreseeable future.
-112-
Table of Contents
In making its compensation determinations for fiscal 2011, the compensation committee relied on their judgment and on data from the Radford High Technology Industry Report and the Meritech Late Stage Private Company Survey, or the Compensation Surveys, to compare our compensation levels to others in the markets in which we compete for executives. The compensation committee reviewed and considered compensation data for 18 public and private U.S. companies in Computer Peripheral or Networking Services industries with less than $200 million in revenue, both public and private. The Compensation Surveys provided information on base salary and target total cash compensation for specific positions and delineates its data based on quartiles. We used the Compensation Surveys to compare our compensation levels to the compensation levels of the following 18 peer companies:
| 3PAR |
Digi International | Netscout Systems | ||
| Adaptec |
Ditech Networks | Omneon | ||
| Allied Telesis |
Evans & Sutherland | Pillar Data Systems | ||
| Ampex Data Systems |
Fujifilm Dimatix | Printronix | ||
| Cray |
Immersion | Pure Digital Technologies | ||
| Datalogic Scanning |
Kentrox | Silver Spring Networks |
Base salary. The base salaries of our CEO and our other executive officers reflect the scope of their respective responsibilities, seniority and competitive market factors.
While base salaries and new survey data are reviewed by the compensation committee annually, the compensation committee generally considers an adjustment to salary for an executive officer only:
| • | when the survey data demonstrates a significant deviation from the market; |
| • | to recognize outstanding individual performance over the prior year; or |
| • | to recognize an increase in responsibilities over the prior year. |
Salary adjustments are determined by the compensation committee and are typically based on competitive conditions, our overall financial results, our budget requirements and individual performance. Even when one of the above circumstances exists, a salary adjustment is not automatic. In the course of its annual salary review, the compensation committee did not increase any of our named executive’s base salaries; however, the base salaries for Mr. Martig and Ms. Warwick were increased starting August 1, 2010 to reward their high ratings on their annual performance reviews and to align their base salaries closer to the 50th percentile of peer companies identified in the Compensation Surveys.
The following table shows our named executive officers’ beginning and ending salaries in fiscal 2011:
| Name | Fiscal 2011 starting base salary |
Salary adjustments on August 1, 2010 |
Fiscal 2011 ending base salary |
|||||||||
|
|
||||||||||||
| Michael B. Gustafson |
$ | 345,000 | $ | — | $ | 345,000 | ||||||
| Rick Martig |
225,000 | 12,500 | 237,500 | |||||||||
| Christopher J. McBride |
200,000 | — | 200,000 | |||||||||
| Shmuel Shottan |
226,600 | — | 226,600 | |||||||||
| Bridget Warwick |
200,000 | 13,500 | 213,500 | |||||||||
|
|
||||||||||||
-113-
Table of Contents
Performance-Based Incentive Compensation. Our performance-based cash and equity incentive program is tied to both achievement of an executive officer’s individual goals and the achievement of financial and other corporate objectives. These goals are approved by the compensation committee and communicated to the executives at the beginning of each fiscal year.
Fiscal Year 2011 Management Challenge Bonus Plan. The Fiscal Year 2011 Management Challenge Bonus Plan, or the Fiscal 2011 Management Plan, was a performance-based cash and equity incentive program developed to:
| • | support achievement of our key business goals and strategies; |
| • | attract, retain and motivate well-qualified management personnel; |
| • | reward high performing individuals and teams; and |
| • | encourage a collaborative, results-oriented management team environment. |
Certain key personnel were eligible to participate in the Fiscal 2011 Management Plan, including our CEO, executive officers and certain other members of the management team.
Under the Fiscal 2011 Management Plan, each participant was eligible to receive both a cash bonus and equity award if corporate performance objectives and individual goals were met during fiscal 2011. Participants’ target awards were determined based on role, responsibility and total compensation. Target cash awards were calculated using a percent of base salary pro-rated by the approved bonus cash pool and target equity awards were set by the compensation committee. Our named executive officers’ targets under the Fiscal 2011 Management Plan were as follows:
| Name | Target cash bonus |
Target equity award(1) |
||||||
|
|
||||||||
| Michael B. Gustafson |
$ | 58,504 | 8,144 | |||||
| Rick Martig |
50,873 | 7,082 | ||||||
| Christopher J. McBride |
28,263 | 3,934 | ||||||
| Shmuel Shottan |
51,235 | 7,132 | ||||||
| Bridget Warwick |
45,220 | 6,295 | ||||||
|
|
||||||||
| (1) | At the time of the adoption of the Fiscal 2011 Management Plan, each participant was granted an option to purchase shares of our common stock that vested only upon the achievement of our corporate performance objectives; the amounts in this column represent the number of shares subject to each named executive officers’ stock options. |
The Fiscal 2011 Management Plan’s threshold corporate objectives consisted of our recording at least $85.6 million in revenue and achieving an earnings before interest, taxes, depreciation and amortization, or Adjusted EBITDA, operating loss, which excludes stock based compensation, of better than $6.0 million. For purposes of our Fiscal 2011 Management Plan only, we calculate revenue, or MCBP revenue, by adding all of our direct sales revenue with 50% of our revenue from sales to our OEM and 50% of our revenue from sales to our OEM for product sold to their end customers. Adjusted EBITDA operating loss is a non-GAAP measure and is only used internally for measuring performance for purposes of our performance-based plans. We define Adjusted EBITDA as net loss excluding benefit from income taxes, other income (expense), net, interest expense, interest income, stock-based compensation and depreciation and amortization. Please see footnote 2 in the section titled “Selected consolidated financial data” for more information. As an incentive for superior performance, the compensation committee set these targets at levels moderately in excess of the operating plan for fiscal 2011 approved by our board of directors. In establishing the targets, the compensation committee considered management’s historic performance relative to prior operating plans as well as the compensation committee’s view of the prospects for our business in fiscal 2011. As a result of its review, the compensation
-114-
Table of Contents
committee believed the targets identified were attainable but acknowledged they required substantial management attention to growing our revenues during fiscal 2011.
If we had reached exactly the threshold achievement levels—MCBP revenue of $85.6 million and Adjusted EBITDA operating loss of $6.0 million—each participant would have been eligible to vest 49% of his or her equity awards shares, and subject to the participant achieving his or her individual goals, be paid 49% of his or her target cash bonus. If we did not meet these objectives, no award would be made. In the event we out-performed our threshold objectives, our compensation committee would determine any additional cash bonuses available for distribution to participants by calculating the additional revenue and/or operating expense savings, with the maximum payout being 150% of a participant’s cash bonus target and 100% vesting of equity awards. At the end of fiscal 2011, based on our MCBP revenue achievement of $85.7 million and our Adjusted EBITDA operating loss achievement of $5.146 million, both of which exceeded the threshold achievement level, each participant was entitled to a 49% of pool payout. In addition, due to the extent that our Adjusted EBITDA operating loss exceeded the threshold achievement level of $6.0 million, each participant was entitled to an additional 55% of pool payout. As a result our Fiscal 2011 Management Plan cash award pool was funded at 104% and 100% of each participant’s equity award vested. Individual cash payouts were subject to each participant’s level of achievement of his or her individual goals.
Our CEO’s individual goals were established by mutual agreement between our CEO and the compensation committee and ratified by our board of directors. The weight assigned to each of our CEO’s goals was determined at the discretion of the board of directors.
The other executive officers’ individual goals were established by mutual agreement between each of the executive officers and our CEO. The weight assigned to each of the individual goals of our executive officers, other than our CEO, was determined at the discretion of our CEO.
Mr. Gustafson’s individual goals in fiscal 2011 were based on us achieving our corporate objectives, achieving market penetration goals, developing our sales channel strategy and preparing for a possible initial public offering. Mr. Martig’s individual goals in fiscal 2011 were based on us achieving our corporate objectives, further developing our financial planning and reporting capabilities and preparing for our initial public offering. Mr. McBride’s individual goals for fiscal 2011 were based on us achieving our corporate objectives, further developing our sales channels and helping coordinate our sales and marketing teams. Mr. Shottan’s individual goals for fiscal 2011 were aligned with developing and maintaining our product strategy roadmap and overseeing our technology development. Ms. Warwick’s individual goals for fiscal 2011 were based on developing our marketing strategy and product roadmap. All of our named executive officers met their individual goals for fiscal 2011.
Our CEO or, in the case of our CEO’s award, the compensation committee, may reduce, modify or withhold participants’ awards under all incentive bonus plans in accordance with the terms of the plans. At the end of fiscal 2011, our CEO assessed each of the named executive officers’ level of achievement of his or her individual goals, other than his own, and adjusted each individual cash payout under our Fiscal 2011 Management Plan accordingly. He determined that Messrs. Martig and McBride and Ms. Warwick exceeded the objectives set for their respective individual goals, and adjusted their individual cash payouts upward to $60,211, $33,225 and $53,160, respectively. Our CEO determined that Mr. Shottan did not fully meet the objectives set for his individual goals and adjusted his individual cash payout downward to $45,953. Our compensation committee did not modify our CEO’s individual cash payout under our Fiscal 2011 Management Plan in fiscal 2011.
-115-
Table of Contents
Mr. McBride, our Senior Vice President of Global Customer Operations, also participated in an annual sales compensation plan that was structured in a manner similar to the commission-based compensation program in place for our sales group, of which he is the head. Commission earnings were tied to corporate revenues and gross margin.
Fiscal 2012 Management Challenge Bonus Plan. At the beginning of fiscal 2012, the compensation committee adopted the Fiscal Year 2012 Management Challenge Bonus Plan, or the Fiscal 2012 Management Plan, a performance-based cash bonus program designed to provide at-risk compensation in order to reward high performance throughout fiscal 2012.
Our CEO, named executive officers and certain other members of the management team are eligible to participate in the Fiscal 2012 Management Plan. A participant in the Fiscal 2012 Management Plan will be eligible to receive target cash bonuses only if our company meets specific financial objectives during fiscal 2012 and if such participant meets his or her individual goals during fiscal 2012.
The compensation committee and our board of directors established corporate performance objectives based on achieving minimum targets for revenue and Adjusted EBITDA operating loss for fiscal 2012. Our compensation committee believes these targets are difficult to achieve because these targets represent significant increases over the comparable results for fiscal 2011, and attaining these goals will require our management’s attention to expand our business and to engage with a substantially higher number of potential customers. We do not publicly disclose the corporate performance objectives for fiscal 2012 and, if disclosed, we believe the information would provide competitors and others with insights into our operations and compensation programs that would be harmful to us. Therefore we believe these corporate performance objectives may be omitted pursuant to instruction 4 to Item 402(b) of Regulation S-K.
The Fiscal 2012 Management Plan’s cash bonus awards were calculated using a percent of base salary pro-rated by the approved bonus cash pool. See the “Grants of plan-based awards” table following this section for a description of target awards for named executive officers.
If we do not achieve at least minimum thresholds for these performance goals, the cash award pool will not be funded. Minimum achievement of both revenue and Adjusted EBITDA operating loss performance goals will result in 49% of the cash pool being made available for distribution to participants. Over achievement of one or both of the revenue and Adjusted EBITDA operating loss performance goals would allow for up to 150% of the cash award pool being made available for distribution to participants. The available cash award pool in the event of over-achievement is determined by calculating the additional revenue and/or operating expense savings.
Our CEO’s individual goals were established by mutual agreement between our CEO and the compensation committee and ratified by our board of directors. The weight assigned to each of our CEO’s goals was determined at the discretion of the board of directors.
The cash award for the other executive officers is contingent on achievement of individual goals established by mutual agreement between each of the executive officers and CEO. The weight assigned to each of the individual goals of our executive officers, other than our CEO, was determined at the discretion of our CEO.
Our CEO may reduce, modify or withhold participants’ awards of all incentive bonus plans in accordance with the terms of the plans.
-116-
Table of Contents
Fiscal 2011 CEO management-by-objective bonus. At the beginning of fiscal 2011, the compensation committee approved a management-by-objective bonus, or MBO bonus, for our CEO. The compensation committee chose to take 25% of our CEO’s target cash bonus that would have been otherwise allocated to the Fiscal 2011 Management Plan and instead created a cash incentive for our CEO to achieve a goal related to expanding our routes to market. Once he achieved this goal, our CEO became entitled to receive the entire MBO bonus amount of $51,750.
Fiscal 2011 and 2012 CEO guaranteed bonuses. In recognition of our CEO’s leadership and commitment to our success, in each of fiscal 2011 and 2012, the compensation committee chose to take 25% of our CEO’s target cash bonus that would have been otherwise allocated to the Fiscal 2011 Management Plan and to the Fiscal 2012 Management Plan and instead approved a guaranteed cash bonus of $51,750 payable on the first day of fiscal 2011 and fiscal 2012, respectively.
Fiscal 2011 CEO performance based option grant. In December 2009, our board of directors granted our CEO options to purchase our common stock, the vesting of which was subject to the achievement of certain milestones to be completed during fiscal 2011. Because these milestones were not met, these options expired immediately before the first day of fiscal 2012.
Long-term equity incentive compensation. Generally, a significant stock option grant is made when an executive officer commences employment or is promoted to the position. This grant is made within our written guidelines for new-hire grants, consistent with the executive’s position. The guidelines were developed based on our historical practices as well as private and public company executive compensation data including proportionate share ownership of executive officers in comparable positions to our own executives in relation to total shares outstanding. The size of each grant is generally set at a level that the compensation committee deems appropriate to create a meaningful opportunity for stock ownership based upon the grant guidelines, the individual’s position with us, the stage of our growth when the individual joins us and the individual’s potential for future responsibility and promotion. Adjustments may be made as the compensation committee deems reasonable to attract candidates in the competitive environment in which we operate.
Subsequent option grants may be made at varying times, in varying amounts and with varying vesting schedules at the discretion of the compensation committee. Historically, there have not been annual stock option grants to all officers with the exception of annual performance-based awards as described above; however, in fiscal 2011 we did provide our named executive officers, with the exception of our CEO, with annual stock option grants. Please see the “—Fiscal 2011 summary compensation” and “—Outstanding equity awards at January 29, 2011” tables below for a more detailed description of the option grants to our named executive officers.
Under our 2000 Plan, most option grants vest as to 25% of the shares after one year of service and 1/48th of the shares each month thereafter. Accordingly, the option provides a return to the employee only if he or she remains in our employ and then only if the market price of our common stock appreciates over the option term.
Historically, the exercise price of our stock options has been equal to the fair market valuation of our common stock, as determined and approved by our board of directors based upon multiple factors. After this offering, the exercise price of stock options will be set based upon the closing price of our common stock on the effective date of the grant.
-117-
Table of Contents
Benefits programs. We provide our employees with retirement health and welfare benefits, such as our group health insurance plans, 401(k) retirement plan and life, disability and accidental death insurance plans. Those plans, most of which are available to all employees, including our named executive officers, are designed to provide a stable array of support to our employees and their families and are not performance based. Effective in fiscal 2008, our executive officers were eligible to receive a supplemental long term disability insurance program benefit not available to other employees. Our benefits programs are generally established and adjusted by our human resources department with approval, as necessary, from senior management, the compensation committee or our board of directors, as appropriate.
Perquisites. Historically, we have not provided special benefits or other perquisites to any of our executive officers; however, effective fiscal 2008, the executive officers were eligible to receive a supplemental long term disability insurance program benefit not available to other employees.
Change of control and severance benefits. We have entered into Change of Control Severance Agreements with our named executive officers, which provide for payments and benefits upon termination of their employment in specified circumstances, including following a change of control. These arrangements (including potential payments and terms) are discussed in more detail in the “Executive Compensation—Change of control severance agreements and potential payments upon termination or change of control” section below. We believe that these agreements are an important retention tool, and will incent the named executive officers to maintain continued focus and dedication to their assigned duties to maximize stockholder value.
Stock ownership guidelines. We currently do not require our directors or executive officers to own a particular amount of our common stock. The compensation committee believes that stock and option holdings among our directors and executive officers are sufficient at this time to provide motivation and to align this group’s interests with those of our stockholders.
Tax and accounting treatment of compensation
Deductibility of Executive Compensation. Generally, Section 162(m) of the Internal Revenue Code disallows a tax deduction to any publicly held corporation for any remuneration in excess of $1.0 million paid in any taxable year to its chief executive officer and to certain other highly compensated officers. Remuneration in excess of $1.0 million may be deducted if, among other things, it qualifies as “performance based compensation” within the meaning of the Internal Revenue Code. In this regard, the compensation income realized upon the exercise of stock options granted under a stockholder approved stock option plan generally will be deductible so long as the options are granted by a committee whose members are nonemployee directors and certain other conditions are satisfied.
As we had been a privately held corporation, the deductibility limit imposed by Section 162(m) previously did not apply to us. Moreover, under a certain Section 162(m) exception, any compensation paid pursuant to a compensation plan in existence before the effective date of this public offering will not be subject to the $1.0 million limitation until the earliest of: (i) the expiration of the compensation plan, (ii) a material modification of the compensation plan (as determined under Section 162(m), (iii) the issuance of all the employer stock and other compensation allocated under the compensation plan or (iv) the first meeting of stockholders at which directors are elected after the close of the third calendar year following the year in which the public offering occurs. We expect that, where reasonably practicable, we will seek to qualify
-118-
Table of Contents
the variable compensation paid to our executive officers for the “performance based compensation” exemption from the deductibility limit. As such, in approving the amount and form of compensation for our executive officers in the future, we will consider all elements of the cost to us of providing such compensation, including the potential impact of Section 162(m). The compensation committee may, in its judgment, authorize compensation payments that do not comply with an exemption from the deductibility limit when it believes that such payments are appropriate to attract and retain executive talent.
Taxation of “Parachute” Payments and Deferred Compensation. We did not provide any executive officer, including any named executive officer, with a “gross up” or other reimbursement payment for any tax liability that he or she might owe as a result of the application of Sections 280G, 4999, or 409A of the Internal Revenue Code during 2010 and
we have not agreed and are not otherwise obligated to provide any named executive officers with such a “gross up.” Sections 280G and 4999 of the Code provide that executive officers and directors who hold significant equity interests and certain other service providers may be subject to an excise tax if they receive payments or benefits in connection with a change in control that exceeds certain prescribed limits, and that we, or a successor, may forfeit a deduction on the amounts subject to this additional tax. Section 409A of the Internal Revenue Code also imposes additional significant taxes on the individual in the event that an executive officer, director or other service provider receives “deferred compensation” that does not meet the requirements of Section 409A of the Internal Revenue Code.
Accounting Treatment. We follow Financial Accounting Standards Board Accounting Standards Codification Topic 718, Stock Compensation, or ASC Topic 718, for our stock based awards. ASC Topic 718 requires companies to measure the compensation expense for all share based payment awards made to employees and directors, including stock options and restricted stock awards, based on the grant date fair value of these awards. This calculation is performed for accounting purposes and reported in the compensation tables below, even though our executive officers may never realize any value from their awards. ASC Topic 718 also requires companies to recognize the compensation cost of their stock based compensation awards over the period that an executive officer is required to render service in exchange for the option or other award.
Compensation risk assessment. The compensation committee believes that although a portion of compensation provided to our executive officers is performance-based, our compensation programs do not encourage excessive or unnecessary risk taking. In fact, the design of our compensation programs encourage our executives to remain focused on both short-term and long-term strategic goals, in particular in connection with our pay-for-performance business model.
-119-
Table of Contents
Fiscal 2011 summary compensation table
The following table presents compensation information for fiscal 2011 paid to or earned by our CEO, CFO and each of our three other most highly compensated executive officers whose aggregate salary and bonus was more than $100,000. We refer to these executive officers as our “named executive officers” elsewhere in this prospectus.
| Name and principal position | Salary(1) | Bonus | Option awards(2) |
Non-equity incentive plan compensation |
All other compensation |
Total | ||||||||||||||||||
|
|
||||||||||||||||||||||||
| Michael B. Gustafson President and Chief Executive Officer |
$ | 345,000 | $ | 103,500(3) | $ | 6,994(4) | $ | 60,844(6) | $ | 3,976(8) | $ | 520,314 | ||||||||||||
| Rick Martig Chief Financial Officer |
230,769 | — | 31,905(5) | 60,221(6) | 4,462(8) | 327,357 | ||||||||||||||||||
| Christopher J. McBride Senior Vice President, Global Customer Operations |
200,000 | — | 26,163(5) | 205,390(7) | 25,453(9) | 457,006 | ||||||||||||||||||
| Shmuel Shottan Chief Technology Officer |
226,600 | — | 24,353(5) | 45,953(6) | 7,759(8) | 304,665 | ||||||||||||||||||
| Bridget Warwick Senior Vice President, Marketing and Business Development |
206,231 | — | 60,090(5) | 53,160(6) | 3,114(8) | 322,595 | ||||||||||||||||||
|
|
||||||||||||||||||||||||
| (1) | The amounts in this column include payments in respect of accrued vacation, holidays and sick days. |
| (2) | These amounts represent grant date fair value for the respective executives’ option grants granted in the fiscal year computed in accordance with FASB ASC Topic 718. See Note 9 in the notes to our consolidated financial statements for a discussion of valuation assumptions made in determining the grant date fair value of our stock options. |
| (3) | This amount represents payment of the MBO bonus in the amount of $51,750 and the payment of Mr. Gustafson’s 2011 guaranteed bonus in the amount of $51,750. Please see the “Compensation Discussion and Analysis—Performance-Based Incentive Compensation” section for a more detailed description of these bonus payments. |
| (4) | Amounts represent total performance-based equity awards awarded pursuant to our Fiscal 2011 Management Plan. See Grants of plan-based awards table below for further discussion. |
| (5) | Amounts represent total performance-based equity awards awarded pursuant to our Fiscal 2011 Management Plan and stock options granted under our 2000 Plan. See Grants of plan-based awards table below for further discussion. |
| (6) | Amounts represent cash bonuses earned under our Fiscal 2011 Management Plan, which were 104% of each named executive’s target cash bonus amount and adjusted by our CEO. The non-equity incentive award was earned in fiscal 2011 but paid in fiscal 2012. For a description of the applicable non-equity incentive targets for each named executive officer, refer to the “—Compensation Discussion and Analysis—Performance-Based Incentive Compensation—Fiscal Year 2011 Management Challenge Bonus Plan” section above. |
| (7) | This amount includes sales commissions in the amount of $172,165 and a cash bonus in the amount of $33,255 paid under our Fiscal 2011 Management Plan. The cash bonus award was earned in fiscal 2011 but paid in fiscal 2012. For a description of the applicable non-equity incentive targets for Mr. McBride, refer to the “—Compensation Discussion and Analysis—Performance-Based Incentive Compensation—Fiscal Year 2011 Management Challenge Bonus Plan” section above. |
| (8) | This amount represents premiums we paid for supplemental long term disability insurance. |
| (9) | This amount Includes $19,200 reimbursed housing costs and $2,257 in related tax gross-ups, as well as $3,996 in premiums we paid for supplemental long term disability insurance. |
-120-
Table of Contents
Grants of plan-based awards
The following table presents information concerning grants of plan-based awards to each of our named executive officers during fiscal 2011.
| Estimated possible
payouts under non-equity incentive plan awards |
Estimated possible
payouts under equity incentive plan awards |
All
other underlying |
Exercise awards |
Grant date option |
||||||||||||||||||||||||||||||||||||
| Name | Grant date | Threshold (1) |
Target (2) |
Maximum (3) |
Threshold (#)(4) |
Target (#)(5) |
Maximum (#)(6) |
|||||||||||||||||||||||||||||||||
|
|
||||||||||||||||||||||||||||||||||||||||
| Michael B. Gustafson |
$ | 28,667 | $ | 58,504 | $ | 87,756 | — | — | — | — | $ | — | $ | — | ||||||||||||||||||||||||||
| 04/06/10 | — | — | — | 3,991 | 8,144 | 8,144 | — | 1.94 | 6,994 | |||||||||||||||||||||||||||||||
| Rick Martig |
24,928 | 50,873 | 76,310 | — | — | — | — | — | — | |||||||||||||||||||||||||||||||
| 04/06/10 | — | — | — | 3,470 | 7,082 | 7,082 | — | 1.94 | 6,082 | |||||||||||||||||||||||||||||||
| 10/22/10 | — | — | — | — | — | — | 42,500 | (9) | 1.42 | 25,823 | ||||||||||||||||||||||||||||||
| Christopher J. McBride |
13,849 | 28,263 | 42,395 | — | — | — | — | — | — | |||||||||||||||||||||||||||||||
| 04/06/10 | — | — | — | 1,928 | 3,934 | 3,934 | — | 1.94 | 3,378 | |||||||||||||||||||||||||||||||
| 10/22/10 | — | — | — | — | — | — | 37,500 | (9) | 1.42 | 22,785 | ||||||||||||||||||||||||||||||
| Shmuel Shottan |
25,105 | 51,235 | 76,853 | — | — | — | — | — | — | |||||||||||||||||||||||||||||||
| 04/06/10 | — | — | — | 3,495 | 7,132 | 7,132 | — | 1.94 | 6,125 | |||||||||||||||||||||||||||||||
| 10/22/10 | — | — | — | — | — | — | 30,000 | (9) | 1.42 | 18,228 | ||||||||||||||||||||||||||||||
| Bridget Warwick |
22,158 | 45,220 | 67,830 | — | — | — | — | — | — | |||||||||||||||||||||||||||||||
| 04/06/10 | — | — | — | 3,085 | 6,295 | 6,295 | — | 1.94 | 5,406 | |||||||||||||||||||||||||||||||
| 09/24/10 | — | — | — | — | — | — | 75,000 | (10) | 1.42 | 45,570 | ||||||||||||||||||||||||||||||
| 10/22/10 | — | — | — | — | — | — | 15,000 | (9) | 1.42 | 9,114 | ||||||||||||||||||||||||||||||
|
|
||||||||||||||||||||||||||||||||||||||||
| (1) | Amounts represent the minimum cash bonus amount each named executive officer would be eligible to receive under our Fiscal 2011 Management Plan if our threshold corporate objectives were met and his or her individual goals were met. These amounts are equal to 49% of each named executive officer’s target cash bonus amount. For further discussion of the applicable non-equity incentive targets for each named executive officer, please see to the “—Compensation Discussion and Analysis—Performance-Based Incentive Compensation—Fiscal Year 2011 Management Challenge Bonus Plan” section above. |
| (2) | Amounts represent the target cash bonus amount each named executive officer would be eligible to receive under our Fiscal 2011 Management Plan if our target corporate objectives were met and his or her individual goals were met. For further discussion of the applicable non-equity incentive targets for each named executive officer, please see to the “—Compensation Discussion and Analysis—Performance-Based Incentive Compensation—Fiscal Year 2011 Management Challenge Bonus Plan” section above. |
| (3) | Amounts represent the maximum cash bonus amount each named executive officer would be eligible to receive under our Fiscal 2011 Management Plan if our maximum corporate objectives were exceeded and his or her individual goals were met. These amounts are equal to 150% of each named executive officer’s target cash bonus amount. For further discussion of the applicable non-equity incentive targets for each named executive officer, please see to the “—Compensation Discussion and Analysis—Performance-Based Incentive Compensation—Fiscal Year 2011 Management Challenge Bonus Plan” section above. |
| (4) | Amounts represent the number of shares that would vest under each named executive’s equity award granted pursuant to our 2011 Management Plan, if our threshold corporate objectives were met. These amounts are equal to 49% of the shares under each named executive officer’s equity award. For further discussion of the applicable equity incentive targets for each named executive officer, please see to the “—Compensation Discussion and Analysis—Performance-Based Incentive Compensation—Fiscal Year 2011 Management Challenge Bonus Plan” section above. |
| (5) | Amounts represent the number of shares that would vest under each named executive’s equity award granted pursuant to our 2011 Management Plan, if our target corporate objectives were met. These amounts are equal to 100% of the shares under each named executive officer’s equity award. For further discussion of the applicable equity incentive targets for each named executive officer, please see to the “—Compensation Discussion and Analysis—Performance-Based Incentive Compensation—Fiscal Year 2011 Management Challenge Bonus Plan” section above. |
| (6) | Amounts represent the number of shares that would vest under each named executive’s equity award granted pursuant to our 2011 Management Plan, if our maximum corporate objectives were met. These amounts are equal to 100% of the shares under each named executive officer’s equity award. For further discussion of the applicable equity incentive targets for each named executive officer, please see to the “—Compensation Discussion and Analysis—Performance-Based Incentive Compensation—Fiscal Year 2011 Management Challenge Bonus Plan” section above. |
| (7) | Shares of our common stock were not publicly traded during fiscal 2011. The exercise price of all options was the fair value of a share of our common stock on the date of grant as determined in good faith by our board of directors. |
| (8) | Amounts represent the aggregate fair market value of options granted in fiscal 2011 to the named executive officers calculated in accordance with ASC Topic 718 without regard to estimated forfeitures. See Note 9 in the notes to our consolidated financial statements for a discussion of assumptions made in determining the grant date fair value and compensation expense of our stock options. |
-121-
Table of Contents
| (9) | 10% of the total number of shares subject to this option will vest on October 22, 2011; 15% of the total number of shares subject to this option will vest on October 22, 2012; 35% of the total number of shares subject to this option will vest on October 22, 2013 and 40% of the total number of shares subject to this option will vest on October 22, 2014. |
| (10) | 1/4th of the total number of shares subject to this stock option became vested and exercisable on September 1, 2010 (vesting commencement date) and the remaining shares subject to the option vest at a rate of 1/48th of the total number of shares subject to this stock option each month thereafter. |
Outstanding equity awards at January 29, 2011
The following table presents the outstanding option awards held by each of our named executive officers as of 2011. All stock options listed in this outstanding equity awards table were granted under our 2000 Plan. There were no other stock awards outstanding.
| Option awards | ||||||||||||||||||||
| Name | Number of securities underlying unexercised options (#) exercisable(1) |
Number of securities underlying unexercised options (#) unexercisable |
Equity incentive plan awards: number of securities underlying unexercised unearned options (#) |
Option exercise price ($) |
Option expiration date |
|||||||||||||||
|
|
||||||||||||||||||||
| Michael B. Gustafson |
10,625 | — | — | $ | 20.00 | 06/14/14 | ||||||||||||||
| 449,803 | — | — | 0.18 | 08/09/16 | ||||||||||||||||
| 26,274 | 10,820 | (2) | — | 0.86 | 07/15/19 | |||||||||||||||
| 3,311 | 3,600 | (3) | — | 0.86 | 07/15/19 | |||||||||||||||
| 41,945 | — | (4) | — | 0.86 | 09/02/19 | |||||||||||||||
| 103,930 | 279,814 | (5) | — | 0.86 | 12/11/19 | |||||||||||||||
| — | — | 8,144 | (6) | 1.94 | 04/06/20 | |||||||||||||||
| Rick Martig |
4,931 | — | (7) | — | 0.83 | 04/03/19 | ||||||||||||||
| 112,499 | 187,501 | (8) | — | 0.86 | 07/15/19 | |||||||||||||||
| 22,000 | — | (9) | — | 0.86 | 09/02/19 | |||||||||||||||
| — | — | 7,082 | (10) | 1.94 | 04/06/20 | |||||||||||||||
| — | 42,500 | (11) | — | 1.42 | 10/22/20 | |||||||||||||||
| Christopher J. McBride |
4,383 | — | (12) | — | 0.83 | 04/03/19 | ||||||||||||||
| 109,374 | 40,626 | (13) | — | 0.86 | 07/15/19 | |||||||||||||||
| 39,061 | 35,939 | (14) | — | 0.86 | 07/15/19 | |||||||||||||||
| 1,605 | 1,745 | (15) | — | 0.86 | 07/15/19 | |||||||||||||||
| 12,222 | — | (16) | — | 0.86 | 09/02/19 | |||||||||||||||
| — | — | 3,934 | (17) | 1.94 | 04/06/20 | |||||||||||||||
| — | 37,500 | (18) | — | 1.42 | 10/22/20 | |||||||||||||||
| Shmuel Shottan |
23 | — | — | 1,100.00 | 05/28/13 | |||||||||||||||
| 6,250 | — | — | 20.00 | 08/29/13 | ||||||||||||||||
| 57,936 | — | — | 0.18 | 08/09/16 | ||||||||||||||||
| 4,966 | — | (19) | — | 0.83 | 04/03/19 | |||||||||||||||
| 375 | 125 | (20) | — | 0.86 | 07/15/19 | |||||||||||||||
| 13,093 | 5,392 | (21) | — | 0.86 | 07/15/19 | |||||||||||||||
| 25,207 | 29,793 | (22) | — | 0.86 | 07/15/19 | |||||||||||||||
| 1,766 | 1,920 | (23) | — | 0.86 | 07/15/19 | |||||||||||||||
| 22,156 | — | (24) | — | 0.86 | 09/02/19 | |||||||||||||||
| — | — | 7,132 | (25) | 1.94 | 04/06/20 | |||||||||||||||
| — | 30,000 | (26) | — | 1.42 | 10/22/20 | |||||||||||||||
| Bridget Warwick |
95,834 | 104,166 | (27) | — | 0.83 | 02/25/19 | ||||||||||||||
| 19,555 | — | (28) | — | 0.86 | 09/02/19 | |||||||||||||||
| — | — | 6,295 | (29) | 1.94 | 04/06/20 | |||||||||||||||
| — | 75,000 | (30) | — | 1.42 | 09/24/20 | |||||||||||||||
| — | 15,000 | (31) | — | 1.42 | 10/22/20 | |||||||||||||||
|
|
||||||||||||||||||||
| (1) | The options listed are subject to an early exercise right and may be exercised in full prior to vesting of the shares underlying the option. The share numbers in this column represent the shares vested under each option as of January 29, 2011. |
| (2) | 1/48th of the total number of shares subject to this stock option vest monthly starting March 15, 2008 (vesting commencement date). |
| (3) | 1/48th of the total number of shares subject to this stock option vest monthly starting February 1, 2009 (vesting commencement date). |
-122-
Table of Contents
| (4) | 100% of the total number of shares subject to this stock option vested on January 31, 2010 upon achievement of certain corporate performance objectives set forth in the option agreement. |
| (5) | 1/48th of the total number of shares subject to this stock option vest monthly starting December 15, 2009 (vesting commencement date). |
| (6) | 100% of the total number of shares subject to this stock option vested on January 30, 2011 upon achievement of certain corporate performance objectives set forth in the option agreement. |
| (7) | 100% of the total number of shares subject to this stock option vested on January 31, 2010 upon achievement of certain corporate performance objectives set forth in the option agreement. |
| (8) | 1/48th of the total number of shares subject to this stock option vested monthly starting July 14, 2009 (vesting commencement date). |
| (9) | 100% of the total number of shares subject to this stock option vested on January 31, 2010 upon achievement of certain corporate performance objectives set forth in the option agreement. |
| (10) | 100% of the total number of shares subject to this stock option vested on January 30, 2011 upon achievement of certain corporate performance objectives set forth in the option agreement. |
| (11) | 10% of the total number of shares subject to this option will vest on October 22, 2011; 15% of the total number of shares subject to this option will vest on October 22, 2012; 35% of the total number of shares subject to this option will vest on October 22, 2013 and 40% of the total number of shares subject to this option will vest on October 22, 2014. |
| (12) | 100% of the total number of shares subject to this stock option vested on January 31, 2010 upon achievement of certain corporate performance objectives set forth in the option agreement. |
| (13) | 1/48th of the total number of shares subject to this stock option vested monthly starting February 27, 2008 (vesting commencement date). |
| (14) | 1/48th of the total number of shares subject to this stock option vested monthly starting December 17, 2008 (vesting commencement date). |
| (15) | 1/48th of the total number of shares subject to this stock option vested monthly starting February 1, 2009 (vesting commencement date). |
| (16) | 100% of the total number of shares subject to this stock option vested on January 31, 2010 upon achievement of certain corporate performance objectives set forth in the option agreement. |
| (17) | 100% of the total number of shares subject to this stock option vested on January 30, 2011 upon achievement of certain corporate performance objectives set forth in the option agreement. |
| (18) | 10% of the total number of shares subject to this option will vest on October 22, 2011; 15% of the total number of shares subject to this option will vest on October 22, 2012; 35% of the total number of shares subject to this option will vest on October 22, 2013 and 40% of the total number of shares subject to this option will vest on October 22, 2014. |
| (19) | 100% of the total number of shares subject to this stock option vested on January 31, 2010 upon achievement of certain corporate performance objectives set forth in the option agreement. |
| (20) | 1/48th of the total number of shares subject to this stock option vested monthly starting January 25, 2008 (vesting commencement date). |
| (21) | 1/48th of the total number of shares subject to this stock option vested monthly starting March 15, 2008 (vesting commencement date). |
| (22) | 1/48th of the total number of shares subject to this stock option vested monthly starting February 28, 2009 (vesting commencement date). |
| (23) | 1/48th of the total number of shares subject to this stock option vested monthly starting February 1, 2009 (vesting commencement date). |
| (24) | 100% of the total number of shares subject to this stock option vested on January 31, 2010 upon achievement of certain corporate performance objectives set forth in the option agreement. |
| (25) | 100% of the total number of shares subject to this stock option vested on January 30, 2011 upon achievement of certain corporate performance objectives set forth in the option agreement. |
| (26) | 10% of the total number of shares subject to this option will vest on October 22, 2011; 15% of the total number of shares subject to this option will vest on October 22, 2012; 35% of the total number of shares subject to this option will vest on October 22, 2013 and 40% of the total number of shares subject to this option will vest on October 22, 2014. |
| (27) | 1/4th of the total number of shares subject to this stock option vested and became exercisable on February 2, 2009 (vesting commencement date) and the remaining shares subject to the option vest at a rate of 1/36th each month thereafter. |
| (28) | 100% of the total number of shares subject to this stock option vested on January 31, 2010 upon achievement of certain corporate performance objectives set forth in the option agreement. |
| (29) | 100% of the total number of shares subject to this stock option vested on January 30, 2011 upon achievement of certain corporate performance objectives set forth in the option agreement. |
| (30) | 1/4th of the total number of shares subject to this stock option vested and became exercisable on September 1, 2010 (vesting commencement date) and the remaining shares subject to the option vest at a rate of 1/48th of the total number of shares subject to this stock option each month thereafter. |
| (31) | 10% of the total number of shares subject to this option will vest on October 22, 2011; 15% of the total number of shares subject to this option will vest on October 22, 2012; 35% of the total number of shares subject to this option will vest on October 22, 2013 and 40% of the total number of shares subject to this option will vest on October 22, 2014. |
-123-
Table of Contents
Option exercises and stock vested during fiscal 2011
None of the named executive officers exercised stock options during fiscal 2011.
Change of control severance agreements and potential payments upon termination or change of control
In June 2009, we entered into change of control severance agreements, or severance agreements, with our named executive officers, which require us to make specific payments and benefits in connection with termination of their employment under certain circumstances. These severance agreements superseded any other agreement or arrangement relating to severance benefits with these executive officers. The description and table that follow describe such payments and benefits that may be owed by us to each of our named executive officers upon the named executive officer’s termination under certain circumstances.
The severance agreements remain in effect until all obligations thereunder have been satisfied. The severance agreements also acknowledge that each executive officer is an at-will employee, whose employment can be terminated at any time.
In order to receive the severance benefits described below, each named executive officer is obligated to execute a release of claims against us, provided such release of claims becomes effective and irrevocable no later than 60 days following such executive officer’s termination date or such earlier date required by the release of claims.
In the event any payment to one of our named executive officers, under his or her severance agreement, is subject to the excise tax imposed by Section 4999 of the Internal Revenue Code (as a result of a payment being classified as a “parachute payment” under Section 280G of the Internal Revenue Code), the executive officer will be entitled to receive such payment as would entitle him or her to receive the greatest after tax benefit of either the full payment or a lesser payment which would result in no portion of such severance benefits being subject to excise tax.
All of our severance agreements with our named executive officers provide that upon each named executive officer’s termination, regardless of the reason for, or timing of, such termination, we will pay such named executive officer any unpaid base salary for periods prior to termination, all unused vacation accrued prior to termination and reimbursement of any expenses reasonably and necessarily incurred in connection with our business prior to termination.
For the purpose of the severance agreements, “cause” means the occurrence of any of the following:
| (i) | acts or omissions constituting gross negligence or willful misconduct with respect to the named executive officer’s obligations or otherwise relating to the business of our company; |
| (ii) | felony conviction of, or felony plea or nolo contendere for fraud, misappropriation or embezzlement, or a felony crime of moral turpitude or conviction of fraud, misappropriation or embezzlement; |
| (iii) | willfully or negligently exposing our company to a risk of civil or criminal legal damages, liabilities or penalties; |
| (iv) | violation or breach of any fiduciary duty; |
-124-
Table of Contents
| (v) | violation or breach of any contractual duty to us, which duty is material to the performance of the named executive officer’s duties or responsibilities or results in material damage to us or our business; |
| (vi) | breach of the named executive officer’s confidential information agreement with us; or |
| (vii) | engaging in any other act of dishonesty, fraud, intentional misrepresentation, illegality; or harassment, which, as determined in good faith by our board of directors, is reasonably likely to materially adversely affect our business or reputation with our current or prospective customers, suppliers, lenders and/or other third parties with whom we do or might do business. |
For the purpose of the severance agreements, “good reason” is defined as the occurrence of one or more of the following, without the named executive officer’s consent:
| (i) | a significant reduction of the executive officer’s duties, position or responsibilities relative to the executive officer’s duties, position or responsibilities in effect immediately prior to such reduction, or the removal of the executive officer from such position, duties and responsibilities, unless the named executive officer is provided with comparable or greater duties, position and responsibilities; provided, however, that a reduction in duties, position or responsibilities solely by virtue of our company being acquired and made part of a larger entity, whether as a subsidiary, business unit or otherwise will not constitute good reason; |
| (ii) | a material reduction by us of the named executive officer’s base salary and/or benefits as in effect immediately prior to such reduction, other than substantially similar reductions that are also applied to substantially similar employees of ours; |
| (iii) | the relocation of the named executive officer to a facility or location more than 50 miles from the executive officer’s then-current work location; |
| (iv) | the failure of us to obtain the assumption of the severance agreement by any successors of our company; or |
| (v) | a material breach by us of any term or condition of the severance agreement or any other agreement between us and the executive officer; |
provided that the named executive officer will not resign for good reason without first providing us with written notice of the acts or omissions constituting the grounds for good reason within 90 days of the occurrence of the good reason event and a reasonable cure period of not less than 30 days following the date of such notice.
For the purpose of the severance agreements, “change of control” means the occurrence of any of the following:
| (i) | any person, as such term is used in Sections 13(d) and 14(d) of the Securities Exchange Act of 1934, as amended, or the Exchange Act, becomes the beneficial owner, as defined in Rule 13d-3 under the Exchange Act, directly or indirectly, of securities of our company representing 50% or more of the total voting power represented by our then outstanding voting securities; |
| (ii) | the consummation of the sale or disposition by us of all or substantially all of our company’s assets; |
| (iii) | the consummation of a merger or consolidation of our company with any other corporation, other than a merger or consolidation which would result in our voting securities outstanding immediately prior thereto continuing to represent (either by remaining outstanding or by |
-125-
Table of Contents
| being converted into voting securities of the surviving entity or its parent) at least 50% of the total voting power represented by our voting securities or such surviving entity or its parent outstanding immediately after such merger or consolidation; or |
| (iv) | a change in the composition of our board of directors occurring within a two-year period, as a result of which less than a majority of the directors are either (1) directors of our company as of the date of each respective severance agreement, or (2) elected, or nominated for election, to our board of directors with the affirmative votes of at least a majority of the directors of our company at the time of such election or nomination, not including an individual whose election or nomination is in connection with an actual or threatened proxy contest relating to the election of directors to our company. |
Severance Agreement with Michael B. Gustafson. Mr. Gustafson’s severance agreement with us provides that if we terminate his employment without cause or if Mr. Gustafson resigns for good reason within 12 months of a change of control, he will be entitled to:
| • | a lump sum severance payment equal to six months of Mr. Gustafson’s base salary as in effect either immediately before the change of control or at the time of his termination, whichever is greater; |
| • | assuming Mr. Gustafson timely elects COBRA continuation coverage, reimbursement of payment of premiums for COBRA continuation coverage, at the coverage levels in effect immediately prior to his termination, until the earlier of (1) a period of six months from the last date of his employment with us, or (2) the date upon which he and/or his dependents becomes covered under similar plans; and |
| • | 100% of Mr. Gustafson’s then outstanding and unvested awards relating to our common stock shall vest and will remain subject to the terms and conditions of such awards. |
Mr. Gustafson’s severance agreement with us also provides for severance benefits that can be triggered without a change of control. If we terminate Mr. Gustafson’s employment without cause, he will be entitled to:
| • | a lump sum severance payment equal to six months of Mr. Gustafson’s base salary as in effect immediately before his termination; and |
| • | assuming Mr. Gustafson timely elects COBRA continuation coverage, reimbursement of payment of premiums for COBRA continuation coverage, at the coverage levels in effect immediately prior to his termination, until the earlier of (1) a period of six months from the last date of his employment with us or (2) the date upon which he and/or his dependents becomes covered under similar plans. |
Severance agreement with Rick Martig. Mr. Martig’s severance agreement with us provides that if we terminate his employment without cause or if Mr. Martig resigns for good reason within 12 months of a change of control, he will be entitled to:
| • | a lump sum severance payment equal to six months of Mr. Martig’s base salary as in effect either immediately before the change of control or at the time of his termination, whichever is greater; |
-126-
Table of Contents
| • | assuming Mr. Martig timely elects COBRA continuation coverage, reimbursement of payment of premiums for COBRA continuation coverage, at the coverage levels in effect immediately prior to his termination, until the earlier of (1) a period of six months from the last date of his employment with us, or (2) the date upon which he and/or his dependents becomes covered under similar plans; and |
| • | 100% of Mr. Martig’s then outstanding and unvested awards relating to our common stock shall vest and will remain subject to the terms and conditions of such awards. |
Severance agreement with Christopher J. McBride and Bridget Warwick. The severance agreements between us and each of Mr. McBride and Ms. Warwick, whom we refer to as the SVPs, provide that if we terminate a SVP’s employment without cause or if a SVP resigns for Good Reason within six months of a change of control, such SVP will be entitled to:
| • | a lump sum severance payment equal to six months of such SVP’s base salary as in effect either immediately before the change of control or at the time of such SVP’s termination, whichever is greater; |
| • | assuming such SVP timely elects COBRA continuation coverage, reimbursement of payment of premiums for COBRA continuation coverage, at the coverage levels in effect immediately prior to his or her termination, until the earlier of (1) a period of six months from the last date of his or her employment with us, or (2) the date upon which such SVP and/or his or her dependents becomes covered under similar plans; and |
| • | 50% of such SVP’s then outstanding and unvested awards relating to our common stock shall vest and will remain subject to the terms and conditions of such awards. |
Severance agreement with Shmuel Shottan. Mr. Shottan’s severance agreement with us provides that if we terminate his employment without cause or if Mr. Shottan resigns for good reason within six months of a change of control, he will be entitled to:
| • | a lump sum severance payment equal to six months of Mr. Shottan’s base salary as in effect either immediately before the change of control or at the time of his termination, whichever is greater; |
| • | assuming Mr. Shottan timely elects COBRA continuation coverage, reimbursement of payment of premiums for COBRA continuation coverage, at the coverage levels in effect immediately prior to his termination, until the earlier of (1) a period of six months from the last date of his employment with us, or (2) the date upon which he and/or his dependents becomes covered under similar plans; and |
| • | 50% of Mr. Shottan’s then outstanding and unvested awards relating to our common stock shall vest and will remain subject to the terms and conditions of such awards. |
Mr. Shottan’s severance agreement with us also provides for severance benefits that can be triggered without a change of control. If we terminate Mr. Shottan’s employment without cause, he will be entitled to:
| • | a lump sum severance payment equal to six months of Mr. Shottan’s base salary as in effect immediately before his termination. |
-127-
Table of Contents
Potential payments upon termination or change of control. The following table shows the amounts each of our named executive officers would have received in the event of their termination with and without a change of control. This table assumes the termination took place on January 29, 2011, the last day of fiscal 2011.
| Involuntary termination | ||||||||||
| Name | Benefits | Not in connection with change of control |
In connection with change of control |
|||||||
|
|
||||||||||
| Michael B. Gustafson |
Severance Payment (Salary) | $ | 172,500(1) | $ | 172,500(3) | |||||
| Healthcare Benefits | 9,676(2) | 9,676(4) | ||||||||
| Acceleration of Stock Options | — | 250,096(5) | ||||||||
| Rick Martig |
Severance Payment (Salary) | — | 118,750(3) | |||||||
| Healthcare Benefits | — | 3,191(4) | ||||||||
| Acceleration of Stock Options | — | 170,930(5) | ||||||||
| Christopher J. McBride |
Severance Payment (Salary) | — | 100,000(6) | |||||||
| Healthcare Benefits | — | 9,676(7) | ||||||||
| Acceleration of Stock Options | — | 38,378(8) | ||||||||
| Shmuel Shottan |
Severance Payment (Salary) | 113,300(1) | 113,300(6) | |||||||
| Healthcare Benefits | — | 9,676(7) | ||||||||
| Acceleration of Stock Options | — | 19,413(8) | ||||||||
| Bridget Warwick |
Severance Payment (Salary) | — | 106,750(6) | |||||||
| Healthcare Benefits | — | 9,676(7) | ||||||||
| Acceleration of Stock Options | — | 58,748(8) | ||||||||
|
|
||||||||||
| (1) | Upon an involuntary termination without cause that is not in connection with a change of control, the named executive officer would receive a lump sum severance payment equal to six months of the named executive officer’s base salary as in effect immediately before the termination. |
| (2) | Upon an involuntary termination without cause that is not in connection with a change of control, the named executive officer would be entitled to COBRA continuation coverage, at the coverage levels in effect immediately prior to the named executive officer’s termination for a period of six months from the last date of the employment with us. |
| (3) | Upon an involuntary termination without cause or if the named executive officer resigns for good reason within 12 months of a change of control, the named executive officer would receive a lump sum severance payment equal to six months of the named executive officer’s base salary as in effect either immediately before the change of control or at the time of the termination, whichever is greater. |
| (4) | Upon an involuntary termination without cause or if the named executive officer resigns for good reason within 12 months of a change of control, the named executive officer would be entitled to COBRA continuation coverage, at the coverage levels in effect immediately prior to the named executive officer’s termination for a period of six months from the last date of the employment with us. |
| (5) | Upon an involuntary termination without cause or if the named executive officer resigns for good reason within 12 months of a change of control, 100% of the named executive officer’s then outstanding and unvested awards relating to our common stock shall vest and will remain subject to the terms and conditions of such awards. The amount represents the gain the named executive officer would receive, calculated as the difference between the fair market value of our common stock on the last day of fiscal 2011 and the exercise price of such accelerated shares. The fair market value of our common stock on the last day of fiscal 2011 as determined by our board of directors was $1.71 per share. |
| (6) | Upon an involuntary termination without cause or if the named executive officer resigns for good reason within six months of a change of control, the named executive officer would receive a lump sum severance payment equal to six months of the named executive officer’s base salary as in effect either immediately before the change of control or at the time of the termination, whichever is greater. |
| (7) | Upon an involuntary termination without cause or if the named executive officer resigns for good reason within six months of a change of control, the named executive officer would be entitled to COBRA continuation coverage, at the coverage levels in effect immediately prior to the named executive officer’s termination for a period of six months from the last date of the employment with us. |
| (8) | Upon an involuntary termination without cause or if the named executive officer resigns for good reason within six months of a change of control, 50% of the named executive officer’s then outstanding and unvested awards relating to our common stock shall vest and will remain subject to the terms and conditions of such awards. The amount represents the gain the named executive officer would receive, calculated as the difference between the fair market value of our common stock on the last day of fiscal 2011 and the exercise price of such accelerated shares. The fair market value of our common stock on the last day of fiscal 2011 as determined by our board of directors was $1.71 per share. |
-128-
Table of Contents
Employee benefit plans
2000 Stock Plan. Our board of directors adopted, and our stockholders approved, our 2000 Plan on March 2, 2000. We amended the 2000 Plan in March 2010 to extend its term to March 2020. Our 2000 Plan provides for the grant of incentive stock options within the meaning of Section 422 of the Internal Revenue Code, to our employees and any parent or subsidiary corporation’s employees, and for the grant of nonstatutory stock options to our employees, directors and consultants and any parent or subsidiary corporation’s employees and consultants. The 2000 Plan also allows for awards of stock purchase rights. At the time our 2011 Plan becomes effective, we will no longer grant new awards under the 2000 Plan.
Administration. Our board of directors or a committee appointed by our board of directors administers our 2000 Plan. Under our 2000 Plan, the board of directors has the power to determine the terms of the awards, including the service providers who will receive awards, the exercise price, the number of shares subject to each award, the vesting schedule and exercisability of awards and the form of consideration payable upon exercise of an option. Our compensation committee recommends guidelines for equity compensation arrangements for all employees including guidelines for stock and option awards and vesting schedules.
Share reserve. Subject to adjustment, as of July 30, 2011, the maximum aggregate number of shares that may be subject to options and sold under the 2000 Plan was 12,405,677 shares of our common stock. As of July 30, 2011, options to purchase 9,071,435 shares of our common stock were outstanding under our 2000 Plan and 749,845 shares of our common stock remained available for future grant under the 2000 Plan. If a stock option or other stock award expires or otherwise terminates without having been exercised in full, the unpurchased shares to subject to such awards will become available for future grant under the 2000 Plan, unless the 2000 Plan has terminated. We will not grant any additional awards under our 2000 Plan following this offering and will instead grant awards under our 2011 Plan. However, the 2000 Plan will continue to govern the terms and conditions of the outstanding awards previously granted thereunder.
Stock options. The administrator may grant incentive and/or nonstatutory stock options under our 2000 Plan; provided that incentive stock options are only granted to employees. The exercise price of incentive stock options within the meaning of Section 422 of the Internal Revenue Code must equal at least 100% of the fair market value of our common stock on the date of grant and the exercise price of nonstatutory stock options may not be less than 85% of the fair market value of our common stock on the date of grant. The term of an option may not exceed ten years; provided, however, that an incentive stock option held by a participant who owns more than 10% of the total combined voting power of all classes of our stock, or of certain of our parent or subsidiary corporations, may not have a term in excess of five years and must have an exercise price of at least 110% of the fair market value of our common stock on the grant date. The administrator will determine the methods of payment of the exercise price of an option, which may include cash, shares or other property acceptable to the plan administrator. Subject to the provisions of our 2000 Plan, the administrator determines the remaining terms of the option (e.g., vesting). After a participant’s termination of service, the participant may exercise his or her option, to the extent vested as of the date of termination, for a period of three months (one year in the case of termination due to death or disability) following such termination, or such longer period of time specified in the individual option agreement. However, in no event may an option be exercised later than the expiration of its term.
-129-
Table of Contents
Stock purchase rights. Stock purchase rights may be issued alone, in addition to or in tandem with other awards granted under our 2000 Plan. Stock purchase rights are rights to purchase our common stock that vest in accordance with terms and conditions established by the administrator. The administrator will determine the number of shares subject to a stock purchase right granted to any service provider. Unless the administrator determines otherwise, we have a repurchase option exercisable upon termination of the purchaser’s service with us. Shares subject to stock purchase rights that do not vest are subject to our right of repurchase.
Dissolution or liquidation. Upon a dissolution or liquidation of us, the administrator shall notify each optionee as soon as practicable prior to the effective date of such dissolution or liquidation. The administrator, in its discretion, may provide for an optionee to have the right to exercise his or her option or stock purchase right until 15 days prior to such transaction as to all of the optioned stock covered by his or her award, including shares as to which the award would not otherwise be exercisable. To the extent that the award has not been previously exercised, an option of stock purchase right will terminate immediately prior to the consummation of the dissolution or liquidation of us.
Effect of a change of control. Our 2000 Plan provides that in the event of our merger with or into another corporation, or a sale of substantially all of our assets, the successor corporation shall assume or substitute an equivalent award with respect to each outstanding award under the 2000 Plan. In the event that the successor corporation refuses to assume or substitute for the award, the optionee will fully vest in and have the right to exercise the option or stock purchase right, as to all of the optioned stock, including shares as to which it would not otherwise be vested or exercisable. If an award becomes fully vested and exercisable, the administrator will provide notice to the participant that he or she has the right to exercise such outstanding awards for a period of 15 days from the date of such notice, and the options or stock purchase rights will terminate at the expiration of such stated notice period.
Transferability of awards. Our 2000 Plan generally does not allow for awards to be transferred in any manner other than by will or the laws of descent or distribution and may be exercised, during the lifetime of the participant, only by the participant.
Amendment and termination. Our board of directors may at any time amend, suspend or terminate the 2000 Plan, provided such action does not impair the existing rights of any participant. Our 2000 Plan will terminate in connection with, and contingent upon, the effectiveness of this offering; provided that the 2000 Plan will continue to govern the terms and conditions of awards originally granted under the 2000 Plan.
2011 Equity Incentive Plan. Our board of directors adopted our 2011 Plan in June 2011 and we expect our stockholders will approve the plan before we complete this offering. The 2011 Plan is effective upon its adoption by our board of directors, but will not be utilized until immediately prior to the time the registration statement to which this offering relates is declared effective by the SEC. Our 2011 Plan provides for the grant of incentive stock options, within the meaning of Section 422 of the Internal Revenue Code, to our employees and for the grant of nonstatutory stock options, restricted stock, restricted stock units, stock appreciation rights, performance units and performance shares to our employees, directors and consultants.
Authorized shares. The maximum aggregate number of shares that may be issued under the 2011 Plan is shares of our common stock, plus (i) any shares that as of the completion of this offering, have been reserved but not issued pursuant to any awards granted under our 2000 Plan and are not subject to any awards granted thereunder, and (ii) any shares subject to
-130-
Table of Contents
stock options or similar awards granted under the 2000 Plan that expire or otherwise terminate without having been exercised in full and unvested shares issued pursuant to awards granted under the 2000 Plan that are forfeited to or repurchased by us, with the maximum number of shares to be added to the 2011 Plan pursuant to clauses (i) and (ii) above equal to 9,821,280 shares as of July 30, 2011. In addition, the number of shares available for issuance under the 2011 Plan will be annually increased on the first day of each of our fiscal years beginning with fiscal year 2014, by an amount equal to the lesser of:
| • | shares; |
| • | % of the outstanding shares of our common stock as of the last day of our immediately preceding fiscal year; or |
| • | such other amount as our board of directors may determine. |
Shares issued pursuant to awards under the 2011 Plan that we repurchase or that are forfeited, as well as shares used to pay the exercise price of an award or to satisfy the tax withholding obligations related to an award, will become available for future grant under the 2011 Plan. In addition, to the extent that an award is paid out in cash rather than shares, such cash payment will not reduce the number of shares available for issuance under the 2011 Plan.
Plan administration. The 2011 Plan will be administered by our board of directors which, at its discretion or as legally required, may delegate such administration to our compensation committee and/or one or more additional committees. In the case of awards intended to qualify as “performance-based compensation” within the meaning of Internal Revenue Code Section 162(m), the committee will consist of two or more “outside directors” within the meaning of Internal Revenue Code Section 162(m).
Subject to the provisions of our 2011 Plan, the administrator has the power to determine the terms of awards, including the recipients, the exercise price, if any, the number of shares subject to each award, the fair market value of a share of our common stock, the vesting schedule applicable to the awards, together with any vesting acceleration, and the form of consideration, if any, payable upon exercise of the award and the terms of the award agreement for use under the 2011 Plan. The administrator also has the authority, subject to the terms of the 2011 Plan, to amend existing awards to reduce or increase their exercise price, to allow participants the opportunity to transfer outstanding awards to a financial institution or other person or entity selected by the administrator, to institute an exchange program by which outstanding awards may be surrendered in exchange for awards that may have different exercise prices and terms, to prescribe rules and to construe and interpret the 2011 Plan and awards granted thereunder.
Stock options. The administrator may grant incentive and/or nonstatutory stock options under our 2011 Plan; provided that incentive stock options are only granted to employees. The exercise price of such options must equal at least the fair market value of our common stock on the date of grant. The term of an incentive stock option may not exceed ten years; provided, however, that an incentive stock option held by a participant who owns more than 10% of the total combined voting power of all classes of our stock, or of certain of our parent or subsidiary corporations, may not have a term in excess of five years and must have an exercise price of at least 110% of the fair market value of our common stock on the grant date. The administrator will determine the methods of payment of the exercise price of an option, which may include cash, shares or other property acceptable to the plan administrator. Subject to the provisions of our 2011 Plan, the administrator determines the remaining terms of the options (e.g., vesting).
-131-
Table of Contents
After the termination of service of an employee, director or consultant, the participant may exercise his or her option, to the extent vested as of such date of termination, for the period of time stated in his or her option agreement. Unless otherwise specified in the award agreement, if termination is due to death or disability, the option will remain exercisable for 12 months. In all other cases, unless otherwise specified in the award agreement, the option will remain exercisable for three months following the termination of service. However, in no event may an option be exercised later than the expiration of its term. The specific terms will be set forth in an award agreement.
Stock appreciation rights. Stock appreciation rights may be granted under our 2011 Plan. Stock appreciation rights allow the recipient to receive the appreciation in the fair market value of our common stock between the exercise date and the date of grant. Subject to the provisions of our 2011 Plan, the administrator determines the terms of stock appreciation rights, including when such rights vest and become exercisable and whether to settle such awards in cash or with shares of our common stock, or a combination thereof, except that the per share exercise price for the shares to be issued pursuant to the exercise of a stock appreciation right will be no less than 100% of the fair market value per share on the date of grant. The specific terms will be set forth in an award agreement.
Restricted stock. Restricted stock may be granted under our 2011 Plan. Restricted stock awards are grants of shares of our common stock that are subject to various restrictions, including restrictions on transferability and forfeiture provisions. Shares of restricted stock will vest, and the restrictions on such shares will lapse, in accordance with terms and conditions established by the administrator. Such terms may include, among other things, vesting upon the achievement of specific performance goals determined by the administrator and/or continued service to us. The administrator, in its sole discretion, may accelerate the time at which any restrictions will lapse or be removed. Recipients of restricted stock awards generally will have voting and dividend rights with respect to such shares upon grant without regard to vesting, unless the administrator provides otherwise. Shares of restricted stock that do not vest for any reason will be forfeited by the recipient and will revert to us. The specific terms will be set forth in an award agreement.
Restricted stock units. Restricted stock units may be granted under our 2011 Plan. Each restricted stock unit granted is a bookkeeping entry representing an amount equal to the fair market value of one share of our common stock. The administrator determines the terms and conditions of restricted stock units, including the vesting criteria, which may include achievement of specified performance criteria or continued service to us, and the form and timing of payment. The administrator, in its sole discretion, may accelerate the time at which any restrictions will lapse or be removed. The administrator determines in its sole discretion whether an award will be settled in stock, cash or a combination of both. The specific terms will be set forth in an award agreement.
Performance units/performance shares. Performance units and performance shares may be granted under our 2011 Plan. Performance units and performance shares are awards that will result in a payment to a participant only if performance goals established by the administrator are achieved or the awards otherwise vest. The administrator will establish organizational or individual performance goals in its discretion, which, depending on the extent to which they are met, will determine the number and/or the value of performance units and performance shares to be paid out to participants. After the grant of a performance unit or performance share, the administrator, in its sole discretion, may reduce or waive any performance objectives or other
-132-
Table of Contents
vesting provisions for such performance units or performance shares. Performance units shall have an initial dollar value established by the administrator prior to the grant date. Performance shares shall have an initial value equal to the fair market value of our common stock on the grant date. The administrator, in its sole discretion, may pay earned performance units or performance shares in the form of cash, in shares or in some combination thereof. The specific terms will be set forth in an award agreement.
Transferability of awards. Unless the administrator provides otherwise, our 2011 Plan generally does not allow for the transfer of awards and only the recipient of an option or stock appreciation right may exercise such an award during his or her lifetime.
Certain adjustments. In the event of certain changes in our capitalization, to prevent diminution or enlargement of the benefits or potential benefits available under the 2011 Plan, the administrator will make adjustments to one or more of the number and class of shares that may be delivered under the plan and/or the number, class and price of shares covered by each outstanding award and the numerical share limits contained in the plan. In the event of our proposed liquidation or dissolution, the administrator will notify participants as soon as practicable and all awards will terminate immediately prior to the consummation of such proposed transaction.
Merger or change in control. Our 2011 Plan provides that in the event of a merger or change in control, as defined under the 2011 Plan, each outstanding award will be treated as the administrator determines, except that if a successor corporation or its parent or subsidiary does not assume or substitute an equivalent award for any outstanding award, then such award will fully vest, all restrictions on such award will lapse, all performance goals or other vesting criteria applicable to such award will be deemed achieved at 100% of target levels and such award will become fully exercisable, if applicable, for a specified period prior to the transaction. The award will then terminate upon the expiration of the specified period of time. If the service of an outside director is terminated on or following a change of control, other than pursuant to a voluntary resignation, his or her options, restricted stock units and stock appreciation rights, if any, will vest fully and become immediately exercisable, all restrictions on his or her restricted stock will lapse, and all performance goals or other vesting requirements for his or her performance shares and units will be deemed achieved at 100% of target levels, and all other terms and conditions met.
Plan amendment, termination. Our board of directors has the authority to amend, suspend or terminate the 2011 Plan provided that any action that impairs the rights of any participant must be agreed to by such participant. Our 2011 Plan will automatically terminate in 2021, unless we terminate it sooner.
401(k) plan. We maintain a tax-qualified 401(k) retirement plan for all employees who satisfy certain eligibility requirements, including requirements relating to age and length of service. Under our 401(k) plan, employees may elect to defer up to 60% of their eligible compensation subject to applicable annual Internal Revenue Code limits. We currently do not match any contributions made by our employees, including executives, but have the discretion to do so. We intend for the 401(k) plan to qualify under Section 401(a) and 501(a) of the Code so that contributions by employees to the 401(k) plan, and income earned on those contributions, are not taxable to employees until withdrawn from the 401(k) plan.
Other. In addition to the United States, we currently have employees located in England, Germany, Canada, Norway and Australia. In addition to providing statutorily mandated benefit
-133-
Table of Contents
programs in each country, we contribute to private plans for health, pension and insurance benefits in the countries where those contributions are customarily provided to employees.
Limitation of liability and indemnification
Our amended and restated certificate of incorporation, which will be in effect upon the completion of this offering, contains provisions that limit the liability of our directors for monetary damages to the fullest extent permitted by Delaware law. Consequently, our directors will not be personally liable to us or our stockholders for monetary damages for any breach of fiduciary duties as directors, except liability for:
| • | any breach of the director’s duty of loyalty to us or our stockholders; |
| • | any act or omission not in good faith or that involves intentional misconduct or a knowing violation of law; |
| • | unlawful payments of dividends or unlawful stock repurchases or redemptions as provided in Section 174 of the Delaware General Corporation Law; or |
| • | any transaction from which the director derived an improper personal benefit. |
Our amended and restated certificate of incorporation and amended and restated bylaws to be in effect upon the completion of this offering provide that we are required to indemnify our directors and officers, in each case to the fullest extent permitted by Delaware law. Our amended and restated bylaws also provide that we are obligated to advance expenses incurred by a director or officer in advance of the final disposition of any action or proceeding, and permit us to secure insurance on behalf of any officer, director, employee or other agent for any liability arising out of his or her actions in that capacity regardless of whether we would otherwise be permitted to indemnify him or her under the provisions of Delaware law. We have entered and expect to continue to enter into agreements to indemnify our directors, executive officers and other employees as determined by our board of directors. With specified exceptions, these agreements provide for indemnification for related expenses including, among other things, attorneys’ fees, judgments, fines and settlement amounts incurred by any of these individuals in any action or proceeding. We believe that these bylaw provisions and indemnification agreements are necessary to attract and retain qualified persons as directors and officers. We also maintain directors’ and officers’ liability insurance.
The limitation of liability and indemnification provisions in our amended and restated certificate of incorporation and amended and restated bylaws may discourage stockholders from bringing a lawsuit against our directors and officers for breach of their fiduciary duty. They may also reduce the likelihood of derivative litigation against our directors and officers, even though an action, if successful, might benefit us and other stockholders. Further, a stockholder’s investment may be adversely affected to the extent that we pay the costs of settlement and damage awards against directors and officers as required by these indemnification provisions. Insofar as indemnification for liabilities arising under the Securities Act may be permitted to our directors, officers and controlling persons pursuant to the foregoing provisions, or otherwise, we have been advised that, in the opinion of the SEC, such indemnification is against public policy as expressed in the Securities Act, and is, therefore, unenforceable. At present, there is no pending litigation or proceeding involving any of our directors, officers or employees for which indemnification is sought, and we are not aware of any threatened litigation that may result in claims for indemnification.
-134-
Table of Contents
In addition to the director and executive compensation arrangements discussed above under “Executive Compensation”, the following is a description of transactions since February 1, 2006, to which we have been a participant in which the amount involved exceeded or will exceed $120,000 and in which any of our directors, executive officers, beneficial holders of more than 5% of our capital stock or entities affiliated with them, had or will have a direct or indirect material interest.
Private placements
Series DD preferred stock financing. In May 2006, we sold an aggregate of 7,004,826 shares of Series DD preferred stock at a per share purchase price of $4.14 pursuant to a stock purchase agreement. Purchasers of the Series DD preferred stock include venture capital funds that hold 5% or more of our capital stock and were represented on our board of directors. The following table summarizes purchases of Series DD preferred stock by the above-listed investors:
| Name of stockholder | BlueArc director | Number of Series DD shares(1) |
Total purchase price |
|||||||||
|
|
||||||||||||
| Funds affiliated with Crosslink Capital(2) |
David J. Epstein | 600,139 | $ | 2,484,575 | ||||||||
| Funds affiliated with Meritech Capital(3) |
Paul S. Madera | 1,081,374 | 4,476,888 | |||||||||
| Morgenthaler Partners VIII, L.P. |
Gary J. Morgenthaler | 3,381,642 | 13,999,997 | |||||||||
| Peter Johnson(4) |
143,211 | 592,893 | ||||||||||
| Rod Canion(5) |
143,211 | 592,893 | ||||||||||
|
|
||||||||||||
| (1) | Includes shares of Series DD preferred stock which were converted into Series DD-1 preferred stock in the recapitalization discussed below. |
| (2) | Affiliates of Crosslink Capital holding our securities whose shares are aggregated for purposes of reporting share ownership information include Crosslink Ventures IV, L.P., Crosslink Crossover Fund V, L.P., Crosslink Omega Ventures IV GmbH & Co. KG, Offshore Crosslink Omega Ventures IV, Offshore Crosslink Crossover Fund III and Omega Bayview IV, LLC. Mr. Epstein served on our board of directors as the representative of Crosslink Capital at the time of our Series DD preferred stock financing. Michael J. Stark replaced Mr. Epstein on our board of directors in January 2008 as the representative of Crosslink Capital. |
| (3) | Affiliates of Meritech Capital holding securities whose shares are aggregated for purposes of reporting share ownership information include MCP Entrepreneur Partners II, Meritech Capital Partners II and Meritech Capital Affiliates II. |
| (4) | Mr. Johnson was a member of our board of directors until his resignation in October 2008. |
| (5) | Mr. Canion was one of our founders and a member of our board of directors until his resignation in January 2007. |
Series FF preferred stock financing. Between May and August 2008, we sold an aggregate of 5,140,814 shares of Series FF preferred stock at a per share purchase price of $4.53 pursuant to a stock purchase agreement. Purchasers of the Series FF preferred stock include venture capital funds that hold 5% or more of our capital stock and were represented on our board of directors. The following table summarizes purchases of Series FF preferred stock by the above-listed investors:
| Name of stockholder | BlueArc director | Number of Series FF shares(1) |
Total purchase price |
|||||||||
|
|
||||||||||||
| Funds affiliated with Crosslink Capital(2) |
Michael J. Stark | 416,776 | $ | 1,886,937 | ||||||||
| Funds affiliated with Meritech Capital(3) |
Paul S. Madera | 641,449 | 2,904,115 | |||||||||
| Morgenthaler Partners VIII, L.P. |
Gary J. Morgenthaler | 267,028 | 1,208,948 | |||||||||
|
|
||||||||||||
| (1) | Includes shares of Series FF preferred stock which were converted into Series FF-1 preferred stock in the recapitalization discussed below. |
| (2) | Affiliates of Crosslink Capital holding our securities whose shares are aggregated for purposes of reporting share ownership information include Crosslink Ventures IV, L.P., Crosslink Crossover Fund V, L.P., Crosslink Omega Ventures IV GmbH & Co. KG, Offshore Crosslink Omega Ventures IV, Offshore Crosslink Crossover Fund III and Omega Bayview IV, LLC. |
| (3) | Affiliates of Meritech Capital holding securities whose shares are aggregated for purposes of reporting share ownership information include MCP Entrepreneur Partners II, Meritech Capital Partners II and Meritech Capital Affiliates II. |
-135-
Table of Contents
Series GG preferred stock financing and recapitalization. In July 2010, we sold an aggregate of 8,342,358 shares of Series GG preferred stock at a per share purchase price of $2.53 pursuant to a stock purchase agreement. Purchasers of the Series GG preferred stock include venture capital funds that hold 5% or more of our capital stock and were represented on our board of directors. In addition, Investor Growth Capital, which made its initial investment in our company in the Series GG financing, became a greater than 5% holder of our outstanding capital and is represented on our board of directors. The following table summarizes purchases of Series GG preferred stock by the above-listed investors:
| Name of stockholder | BlueArc director | Number of Series GG shares |
Total purchase price |
|||||||||
|
|
||||||||||||
| Funds affiliated with Crosslink Capital(1) |
Michael J. Stark | 622,249 | $ | 1,573,605 | ||||||||
| Funds affiliated with Meritech Capital(2) |
Paul S. Madera | 957,680 | 2,421,877 | |||||||||
| Morgenthaler Partners VIII, L.P. |
Gary J. Morgenthaler | 398,670 | 1,008,197 | |||||||||
| Funds affiliated with Investor Growth Capital(3) |
José F. Suarez | 4,745,146 | 12,000,000 | |||||||||
|
|
||||||||||||
| (1) | Affiliates of Crosslink Capital holding our securities whose shares are aggregated for purposes of reporting share ownership information include Crosslink Ventures IV, L.P., Crosslink Crossover Fund V, L.P., Crosslink Omega Ventures IV GmbH & Co. KG, Offshore Crosslink Omega Ventures IV, Offshore Crosslink Crossover Fund III and Omega Bayview IV, LLC. |
| (2) | Affiliates of Meritech Capital holding securities whose shares are aggregated for purposes of reporting share ownership information include MCP Entrepreneur Partners II, Meritech Capital Partners II and Meritech Capital Affiliates II. |
| (3) | Affiliates of Investor Growth Capital holding securities whose shares are aggregated for purposes of reporting share ownership information include Investor Growth Capital Limited and Investor Group LP. |
In accordance with the terms of our amended and restated certificate of incorporation that we filed in connection with the Series GG financing, 50% of every preferred stockholder’s outstanding shares of Series AA preferred stock, or Series AA, Series BB preferred stock, or Series BB, Series DD preferred stock, or Series DD, and Series FF preferred stock, or Series FF, was converted to common stock. To the extent each holder of previously converted preferred stock participated at the required level in the Series GG financing, such holder was able to immediately exchange each of the previously converted shares of common stock into one share of preferred stock of a new series. Shares of common stock issued upon conversion of Series AA were exchanged for shares of Series AA-1 preferred stock, or Series AA-1; shares of common stock issued upon conversion of Series BB were exchanged for shares of Series BB-1 preferred stock, or Series BB-1; shares of common stock issued upon conversion of Series DD were exchanged for shares of Series DD-1 preferred stock, or Series DD-1; and shares of common stock issued upon conversion of Series FF were exchanged for shares of Series FF-1 preferred stock, or Series FF-1. In aggregate, there were 2,691,061 shares of Series AA-1, 4,603,023 shares of Series BB-1, 3,279,749 shares of Series DD-1 and 2,517,391 shares of Series FF-1 issued, and 504,647 shares of Series AA, 45,818 shares of Series BB, 222,653 shares of Series DD and 53,010 shares of Series FF were converted to common stock and not exchanged for the new series of preferred stock. The liquidation preferences per share for Series AA-1 is $5.91, for Series BB-1 is $2.51, for Series DD-1 is $3.85 and for Series FF-1 is $4.21. In addition, the liquidation preferences per share of the remaining 50% shares of Series AA, Series BB, Series DD and Series FF were reduced as follows: from $6.00 to $4.98 for Series AA; from $3.00 to $2.49 for Series BB; from $4.14 to $3.60 for Series DD; and from $4.53 to $4.12 for Series FF. None of the Series EE preferred stock was converted into common stock; however, the liquidation preference per share decreased from $5.19 to $4.52. The Series CC preferred stock was not affected by the Series GG transaction.
Other than through the sale of the Series GG, we received no proceeds from the issuance of the shares of the Series “-1” preferred stock.
-136-
Table of Contents
Bridge debt financings. In March and April 2008 we entered into a Note and Warrant Purchase Agreement with certain of our stockholders pursuant to which we issued convertible promissory notes and warrants in an aggregate amount of $6,694,655. The principal amount of the notes was convertible into an aggregate of 1,478,684 principal shares of Series FF preferred stock at $4.53 per share. The following table summarizes the original note investment amounts of our officers, directors and principal stockholders under this bridge financing:
| Name of stockholder | BlueArc director | Aggregate principal amount of notes |
Warrants(1) | Series FF preferred stock issued upon conversion of notes(2) |
||||||||||||
|
|
||||||||||||||||
| Funds affiliated with Crosslink Capital |
Michael J. Stark | $ | 1,886,937 | 41,675 | 416,776 | |||||||||||
| Funds affiliated with Meritech Capital |
Paul S. Madera | 2,904,115 | 64,144 | 641,449 | ||||||||||||
| Morgenthaler Partners VIII, L.P. |
Gary J. Morgenthaler | 1,208,948 | 26,702 | 267,028 | ||||||||||||
|
|
||||||||||||||||
| (1) | Reflects currently outstanding warrants to purchase shares of Series FF and Series FF-1 with an exercise price of $4.53 per share. |
| (2) | Includes shares of Series FF preferred stock which were converted into Series FF-1 preferred stock in the recapitalization discussed above. |
In February 2010, we entered into a Note and Warrant Purchase Agreement with certain of our stockholders pursuant to which we issued subordinated convertible promissory notes and warrants in an aggregate of $2,700,885. The promissory notes bore interest at the rate of 8% per annum, and pursuant to their terms were converted into 1,099,938 shares of Series GG at $2.53 per share. The following table summarizes the original note investment amounts of our officers, directors and principal stockholders under this bridge financing:
| Name of stockholder | BlueArc director | Aggregate principal amount and accrued interest of notes |
Warrants(1) | Series GG preferred stock issued upon conversion of notes |
||||||||||||
|
|
||||||||||||||||
| Funds affiliated with Crosslink Capital |
Michael J. Stark | $ | 737,762 | 84,947 | 291,730 | |||||||||||
| Funds affiliated with Meritech Capital |
Paul S. Madera | 1,135,463 | 130,742 | 448,993 | ||||||||||||
| Morgenthaler Partners VIII, L.P. |
Gary J. Morgenthaler | 472,679 | 54,427 | 186,911 | ||||||||||||
|
|
||||||||||||||||
| (1) | Reflects currently outstanding warrants to purchase shares of Series GG with exercise price of $2.53 per share that will be net exercised for shares of common stock based on an assumed initial public offering price of $ per share, which is the midpoint of the range of the initial public offering listed on the cover page of the prospectus. |
-137-
Table of Contents
Stock option awards
Certain stock option grants to our directors and executive officers and related option grant policies are described in this prospectus under the sections entitled “Management—Director compensation,” “Executive compensation—Compensation disclosure and analysis,” “Executive compensation—Grants of plan-based awards at fiscal year end,” “Executive compensation—Outstanding awards at fiscal year-end” and “Executive compensation—Change of control severance agreements and potential payments upon termination or change of control.” Pursuant to our director and executive officer compensation policies or other arrangements, we granted the following options to certain directors and executive officers since February 1, 2007:
| Name | Grant date | Shares subject to option(1) |
Exercise price |
|||||||||
| Michael B. Gustafson |
03/15/07 | (2) | 37,094 | $ | 1.70 | |||||||
| 03/26/08 | (3) | 6,911 | 4.13 | |||||||||
| 06/05/08 | (4) | 14,808 | 4.13 | |||||||||
| 04/03/09 | (4) | 21,912 | 0.83 | |||||||||
| 09/02/09 | (5) | 41,945 | 0.86 | |||||||||
| 12/11/09 | (6) | 383,744 | 0.86 | |||||||||
| 12/11/09 | (4) | 95,936 | 0.86 | |||||||||
| 12/11/09 | (4) | 95,936 | 0.86 | |||||||||
| 04/06/10 | (7) | 8,144 | 1.94 | |||||||||
| 06/17/11 | (6) | 150,000 | 3.99 | |||||||||
| Rick Martig |
08/27/08 | (8) | 300,000 | 2.58 | ||||||||
| 08/27/08 | (4) | 4,332 | 2.58 | |||||||||
| 04/03/09 | (5) | 4,931 | 0.83 | |||||||||
| 04/03/09 | (4) | 11,493 | 0.83 | |||||||||
| 09/02/09 | (5) | 22,000 | 0.86 | |||||||||
| 04/06/10 | (7) | 7,082 | 1.94 | |||||||||
| 10/22/10 | (9) | 42,500 | 1.42 | |||||||||
| 06/17/11 | (6) | 100,000 | 3.99 | |||||||||
| Shmuel Shottan |
01/25/07 | (10) | 500 | 1.70 | ||||||||
| 03/15/07 | (11) | 18,485 | 1.70 | |||||||||
| 03/26/08 | (12) | 55,000 | 4.13 | |||||||||
| 03/26/08 | (13) | 3,686 | 4.13 | |||||||||
| 06/05/08 | (4) | 7,821 | 4.13 | |||||||||
| 04/03/09 | (4) | 11,574 | 0.83 | |||||||||
| 04/03/09 | (5) | 4,966 | 0.83 | |||||||||
| 09/02/09 | (5) | 22,156 | 0.86 | |||||||||
| 04/06/10 | (7) | 7,132 | 1.94 | |||||||||
| 10/22/10 | (9) | 30,000 | 1.42 | |||||||||
| 06/17/11 | (6) | 20,000 | 3.99 | |||||||||
| Christopher J. McBride |
02/27/07 | (14) | 141,177 | 1.70 | ||||||||
| 03/15/07 | (15) | 58,823 | 1.70 | |||||||||
| 03/26/08 | (16) | 24,213 | 4.13 | |||||||||
| 03/26/08 | (17) | 50,787 | 4.13 | |||||||||
| 03/26/08 | (18) | 3,350 | 4.13 | |||||||||
| 06/05/08 | (4) | 4,315 | 4.13 | |||||||||
| 04/03/09 | (5) | 4,383 | 0.83 | |||||||||
| 04/03/09 | (4) | 6,385 | 0.83 | |||||||||
| 09/02/09 | (5) | 12,222 | 0.86 | |||||||||
| 04/06/10 | (7) | 3,934 | 1.94 | |||||||||
| 10/22/10 | (9) | 37,500 | 1.42 | |||||||||
| 06/17/11 | (6) | 40,000 | 3.99 | |||||||||
| Bridget Warwick |
02/25/09 | 200,000 | 0.83 | |||||||||
| 04/03/09 | (4) | 10,216 | 0.83 | |||||||||
| 09/02/09 | (5) | 19,555 | 0.86 | |||||||||
| 04/06/10 | (7) | 6,295 | 1.94 | |||||||||
| 09/24/10 | 75,000 | 1.42 | ||||||||||
| 10/22/10 | (9) | 15,000 | 1.42 | |||||||||
| 06/17/11 | (6) | 25,000 | 3.99 | |||||||||
| David A. de Simone |
06/17/11 | 400,000 | 3.99 | |||||||||
-138-
Table of Contents
| Name | Grant date | Shares subject to option(1) |
Exercise price |
|||||||||
| Christopher P. White |
06/17/11 | 150,000 | 3.99 | |||||||||
| Paul S. Madera |
06/22/11 | (6) | 104,000 | 3.99 | ||||||||
| David N. Martin |
06/10/09 | (6) | 10,000 | 0.86 | ||||||||
| 09/01/10 | (6) | 90,000 | 1.42 | |||||||||
| 06/22/11 | (6) | 30,000 | 3.99 | |||||||||
| Gary J. Morgenthaler |
06/22/11 | (6) | 104,000 | 3.99 | ||||||||
| Michael J. Stark |
06/22/11 | (6) | 104,000 | 3.99 | ||||||||
| José F. Suarez |
06/22/11 | (6) | 104,000 | 3.99 | ||||||||
| Duston M. Williams |
10/08/07 | (19) | 62,730 | 5.81 | ||||||||
| 10/22/10 | 58,261 | 1.42 | ||||||||||
| 06/22/11 | (6) | 60,000 | 3.99 | |||||||||
| Alan E. Baratz, PhD(20) |
08/02/07 | (21) | 46,800 | 5.22 | ||||||||
| 09/30/10 | (22) | 10,725 | 1.71 | |||||||||
|
|
||||||||||||
| (1) | Unless otherwise noted, each option listed in this table vests and becomes exercisable at a rate of 25% on the first anniversary of the vesting commencement date with the remainder vesting and becoming exercisable ratably over the next 36 months, subject to continued service through each applicable date by the applicable optionholder. |
| (2) | This option was exchanged for an option to purchase 37,094 shares of common stock at an exercise price of $0.86 per share granted on July 15, 2009. The vesting schedule of the option granted on July 15, 2009 remained the same as the stock option granted on March 15, 2007, which vests and becomes exercisable ratably over 48 months, subject to continued service through each applicable date; however, the vesting commencement date was 12 months later than the original option vesting commencement date. |
| (3) | This option was exchanged for an option to purchase 6,911 shares of common stock at an exercise price of $0.86 per share granted on July 15, 2009. The vesting schedule of the option granted on July 15, 2009 remained the same as the stock option granted on March 26, 2008, which vests and becomes exercisable ratably over 48 months, subject to continued service through each applicable date; however, the vesting commencement date was 12 months later than the original option vesting commencement date. |
| (4) | These options were exercisable only in the event that we attained certain performance objectives. We did not attain those objectives and the options were cancelled. |
| (5) | This option became vested and exercisable on January 31, 2010 upon achievement of certain corporate performance objectives set forth in the option agreement. |
| (6) | 1/48th of the total number of shares subject to this option vest monthly subject to continued service through each applicable date. |
| (7) | 100% of the total number of shares subject to this option vested on January 30, 2011 upon achievement of certain corporate performance objectives set forth in the option agreement. |
| (8) | This option was exchanged for an option to purchase 300,000 shares of common stock at an exercise price of $0.86 per share granted on July 15, 2009. The vesting schedule of the option granted on July 15, 2009 remained the same as the stock option granted on March 15, 2007, which vests and becomes exercisable ratably over 48 months, subject to continued service through each applicable date; however, the vesting commencement date was 12 months later than the original option vesting commencement date. |
| (9) | This option vests as to 10% of the total shares subject to the option on the first anniversary of the grant date; 15% of the total shares subject to the option on the second anniversary of the grant date; 30% of the total shares subject to the option on the third anniversary of the grant date and 40% of the total shares subject to the option on the fourth anniversary of the grant date. |
| (10) | This option was exchanged for an option to purchase 500 shares of common stock at an exercise price of $0.86 per share granted on July 15, 2009. The vesting schedule of the option granted on July 15, 2009 remained the same as the stock option granted on January 25, 2007, which vests and becomes exercisable ratably over 48 months, subject to continued service through each applicable date; however, the vesting commencement date was 12 months later than the original option vesting commencement date. |
| (11) | This option was exchanged for an option to purchase 18,485 shares of common stock at an exercise price of $0.86 per share granted on July 15, 2009. The vesting schedule of the option granted on July 15, 2009 remained the same as the stock option granted on March 15, 2007, which vests and becomes exercisable ratably over 48 months, subject to continued service through each applicable date; however, the vesting commencement date was 12 months later than the original option vesting commencement date. |
| (12) | This option was exchanged for an option to purchase 55,000 shares of common stock at an exercise price of $0.86 per share granted on July 15, 2009. The vesting schedule of the option granted on July 15, 2009 remained the same as the stock option granted on March 26, 2008, which vests and becomes exercisable ratably over 48 months, subject to continued service through each applicable date; however, the vesting commencement date was 12 months later than the original option vesting commencement date. |
| (13) | This option was exchanged for an option to purchase 3,686 shares of common stock at an exercise price of $0.86 per share granted on July 15, 2009. The vesting schedule of the option granted on July 15, 2009 remained the same as the stock option granted on March 26, 2008, which vests and becomes exercisable ratably over 48 months, subject to continued service through each applicable date; however, the vesting commencement date was 12 months later than the original option vesting commencement date. |
-139-
Table of Contents
| (14) | This option was exchanged for an option to purchase 141,177 shares of common stock at an exercise price of $0.86 per share granted on July 15, 2009. The vesting schedule of the option granted on July 15, 2009 remained the same as the stock option granted on February 27, 2007, which vests and becomes exercisable ratably over 48 months, subject to continued service through each applicable date; however, the vesting commencement date was 12 months later than the original option vesting commencement date. |
| (15) | 50,000 of the shares subject to this option were exercised by Mr. McBride in April 2007, and the remaining 8,823 shares were exchanged for an option to purchase 8,823 shares of common stock at an exercise price of $0.86 per share granted on July 15, 2009. The vesting schedule of the option granted on July 15, 2009 remained the same as the stock option granted on March 15, 2007, which vests and becomes exercisable ratably over 48 months, subject to continued service through each applicable date; however, the vesting commencement date was 12 months later than the original option vesting commencement date. |
| (16) | This option was exchanged for an option to purchase 24,213 shares of common stock at an exercise price of $0.86 per share granted on July 15, 2009. The vesting schedule of the option granted on July 15, 2009 remained the same as the stock option granted on March 26, 2008, which vests and becomes exercisable ratably over 48 months, subject to continued service through each applicable date; however, the vesting commencement date was 12 months later than the original option vesting commencement date. |
| (17) | This option was exchanged for an option to purchase 50,787 shares of common stock at an exercise price of $0.86 per share granted on July 15, 2009. The vesting schedule of the option granted on July 15, 2009 remained the same as the stock option granted on March 26, 2008, which vests and becomes exercisable ratably over 48 months, subject to continued service through each applicable date; however, the vesting commencement date was 12 months later than the original option vesting commencement date. |
| (18) | This option was exchanged for an option to purchase 3,350 shares of common stock at an exercise price of $0.86 per share granted on July 15, 2009. The vesting schedule of the option granted on July 15, 2009 remained the same as the stock option granted on March 26, 2008, which vests and becomes exercisable ratably over 48 months, subject to continued service through each applicable date; however, the vesting commencement date was 12 months later than the original option vesting commencement date. |
| (19) | This option was exchanged for an option to purchase 62,730 shares of common stock at an exercise price of $0.86 per share granted on July 15, 2009. The vesting schedule of the option granted on July 15, 2009 remained the same as the stock option granted on October 8, 2007, which vests and becomes exercisable ratably over 48 months, subject to continued service through each applicable date; however, the vesting commencement date was 12 months later than the original option vesting commencement date. |
| (20) | Dr. Baratz resigned as a member of our board of directors in September 2010, but continues to providing consulting services. |
| (21) | This option was exchanged for an option to purchase 46,800 shares of common stock at an exercise price of $0.86 per share granted on July 15, 2009. The vesting schedule of the option granted on July 15, 2009 remained the same as the stock option granted on August 2, 2007, which vests and becomes exercisable ratably over 48 months, subject to continued service through each applicable date; however, the vesting commencement date was 12 months later than the original option vesting commencement date. |
| (22) | This option vests and becomes exercisable ratably over 24 months, subject to continued service through each applicable date. |
Consulting agreement with David N. Martin
On June 1, 2009, we entered into a consulting agreement, or the Consulting Agreement, with David N. Martin, who became a member of our board of directors on September 1, 2010. Pursuant to the Consulting Agreement, Mr. Martin provided services to us in exchange for cash compensation and the grant of equity awards under our 2000 Plan. The following table provides information regarding all compensation awarded to, earned by or paid to Mr. Martin since June 2009 for his services as a consultant.
| Fiscal Year | Fees earned or paid in cash |
Stock awards(1) | Option awards(2) | Total | ||||||||||||
|
|
||||||||||||||||
| 2010 |
$ | 180,120 | $ | — | $ | 12,571(3) | $ | 192,691 | ||||||||
| 2011 |
219,382 | 49,463(4) | — | 268,845 | ||||||||||||
|
|
||||||||||||||||
| (1) | Amounts represent the aggregate grant date fair value of the restricted stock award calculated in accordance with Financial Accounting Standards Board Accounting Standards Codification Topic 718, Stock Compensation, as amended. See Note 9 in the notes to our consolidated financial statements for a discussion of valuation assumptions made in determining the grant date fair value and compensation expense of our restricted stock awards. |
| (2) | Amounts represent the aggregate grant date fair value of the option award calculated in accordance with Financial Accounting Standards Board Accounting Standards Codification Topic 718, Stock Compensation, as amended, without regard to estimated forfeitures. See Note 9 in the notes to our consolidated financial statements for a discussion of valuation assumptions made in determining the grant date fair value and compensation expense of our stock options. |
| (3) | Represents an option granted on June 10, 2009 to purchase up to 10,000 shares of our common stock at a price per share of $0.86. The option vests beginning on June 10, 2009 and vests as to 1/48th of the shares subject to the option award monthly thereafter or until the end of the Consulting Agreement, whichever is earlier. |
-140-
Table of Contents
| (4) | Represents 28,926 shares of restricted stock granted on January 18, 2011 under our 2000 Stock Option/Stock Issuance Plan at a price per share of $1.71. The restricted stock vests beginning on November 1, 2010 and vests as to 1/6th of the shares monthly thereafter, subject to Mr. Martin’s continued service through each vesting date. |
Investors’ rights agreement
In connection with our Series GG financing, we entered into an amended and restated investors’ rights agreement with certain purchasers of our preferred stock, including our principal stockholders with whom certain of our directors are affiliated. Pursuant to this agreement, we granted such stockholders certain registration rights with respect to certain shares of our common stock which will be issuable upon conversion of the shares of preferred stock held by them. For a description of these registration rights, see “Description of capital stock—Registration rights.”
Voting agreement
We have entered into a voting agreement with certain holders of our outstanding preferred stock and common stock, including entities with which certain of our directors are affiliated, and certain other stockholders, obligating each party to vote or consent at each stockholder meeting or with respect to each written stockholder consent to elect the nominees of certain parties to our board of directors. The parties to the voting agreement have agreed, subject to certain conditions, to vote their shares so as to elect as directors the nominees designated by certain of our investors, including Meritech Capital Partners, which has designated Paul S. Madera for election to our board of directors; Crosslink Capital, which has designated Michael J. Stark for election to our board of directors; Morgenthaler Partners VIII, L.P., which has designated Gary J. Morgenthaler for election to our board of directors; and Investor Growth Capital, Inc., which has designated José F. Suarez for election to our board of directors. In addition, the parties to the voting agreement have agreed to vote their shares so as to elect our then current Chief Executive Officer to our board of directors, and two persons nominated by the holders of a majority of the outstanding shares held by Meritech Capital Partners, Morgenthaler Partners VIII, L.P., Crosslink Capital and Investor Growth Capital, which are Duston M. Williams and David N. Martin. Upon this closing of this offering, the voting agreement will terminate in its entirety and none of our stockholders will have any special rights regarding the election or designation of members of our board of directors.
Indemnification agreements
We have entered into indemnity agreements with each of our current directors and officers, in addition to the indemnification provided for in our bylaws. These agreements will require us to indemnify each such person against expenses and liabilities incurred by such person for a proceeding related to such person’s services for us, and to advance expenses incurred for such proceeding, all subject to limited exceptions. See “Compensation Discussion and Analysis—Limitation of liability and indemnification.”
-141-
Table of Contents
Policies and procedures for related party transactions
As provided by our audit committee charter to be effective upon completion of this offering, our audit committee is responsible for reviewing and approving in advance any related party transaction. All of our directors, officers and employees are required to report to the audit committee any related party transaction prior to entering into the transaction.
We believe that we have executed all of the transactions set forth under the section entitled “Related party transactions” on terms no less favorable to us than we could have obtained from unaffiliated third parties. It is our intention to ensure that all future transactions between us and our officers, directors and principal stockholders and their affiliates, are approved by the audit committee of our board of directors, and are on terms no less favorable to us than those that we could obtain from unaffiliated third parties.
-142-
Table of Contents
The following table presents information as to the beneficial ownership of our common stock as of July 30, 2011, and as adjusted to reflect the sale of the common stock in this offering, by:
| • | each stockholder known by us to be the beneficial owner of more than 5% of our common stock; |
| • | each of our directors; |
| • | each of our named executive officers; and |
| • | all of our directors and executive officers as a group. |
Beneficial ownership is determined under the rules of the SEC and generally includes voting or investment power for securities. Unless otherwise shown below, to our knowledge, the persons and entities named in the table have sole voting and sole investment power for all shares beneficially owned, subject to community property laws where applicable. Shares of our common stock subject to options and warrants that are currently exercisable or exercisable within 60 days of July 30, 2011 are considered to be outstanding and to be beneficially owned by the person holding the options or warrants to compute the percentage ownership of that person, but are not treated as outstanding to compute the percentage ownership of any other person.
The number of shares of our common stock outstanding after this offering includes shares of common stock being offered by us and does not include the shares that are subject to the underwriters’ over-allotment option. The percentage of our common stock outstanding before and after the offering is based on 43,366,170 shares of our common stock outstanding on July 30, 2011, assuming the conversion of all outstanding shares of preferred stock, including our Series CC preferred stock (assuming a one for 11.80684 conversion ratio), into an aggregate of 3,660,325 shares of common stock and including our Series EE preferred stock (assuming a one for 1.02268 conversion ratio), into an aggregate of 807,896 shares of common stock immediately prior to the closing of this offering. The percentage ownership information assumes no exercise of the underwriters’ overallotment option.
-143-
Table of Contents
Unless otherwise indicated, the address of each of the individuals and entities named below is c/o BlueArc Corporation, 50 Rio Robles San Jose, California 95134.
| Number of shares beneficially owned(1) |
Percentage of shares beneficially owned | |||||||||
| Before offering | After offering | |||||||||
|
| ||||||||||
| 5% Stockholders: |
||||||||||
| Entities affiliated with Meritech Capital Partners(2) |
10,063,248 | 23.17 | % | |||||||
| Entities affiliated with Crosslink Capital(3) |
6,365,297 | 14.66 | ||||||||
| Entities affiliated with Investor Growth Capital(4) |
4,751,646 | 10.96 | ||||||||
| Morgenthaler Venture Partners VIII, L.P.(5) |
4,080,542 | 9.40 | ||||||||
| Directors and Executive Officers: |
||||||||||
| Michael B. Gustafson(6) |
1,489,480 | 3.38 | ||||||||
| Rick Martig(7) |
202,761 | * | ||||||||
| Shmuel Shottan(8) |
384,349 | * | ||||||||
| Christopher J. McBride(9) |
261,137 | * | ||||||||
| Bridget Warwick(10) |
176,891 | * | ||||||||
| Christopher P. White |
— | * | ||||||||
| David A. de Simone |
— | * | ||||||||
| Paul S. Madera(2) |
10,063,248 | 23.17 | ||||||||
| David N. Martin(11) |
58,926 | * | ||||||||
| Gary J. Morgenthaler(5) |
4,080,542 | 9.40 | ||||||||
| Michael J. Stark(3) |
6,365,297 | 14.66 | ||||||||
| José F. Suarez(4) |
4,751,646 | 10.96 | ||||||||
| Duston M. Williams(12) |
49,490 | * | ||||||||
| All directors and executive officers as a group (13 persons)(13) |
27,883,767 | 64.17 | ||||||||
|
| ||||||||||
| * | Represents beneficial ownership of less than 1%. |
| (1) | The options granted to our executive officers and directors are subject to an early exercise right and may be exercised in full prior to vesting of the shares underlying the options. The option exercisable information provided in this table includes only the shares vested under such options within 60 days of July 30, 2011. |
| (2) | Represents 9,669,861 shares held by Meritech Capital Partners II, L.P., 248,810 shares held by Meritech Capital Affiliates II, L.P. and 73,933 shares held by MCP Entrepreneur Partners II. L.P. Includes 64,144 shares of common stock to be issued upon exercise of outstanding warrants to purchase Series FF and Series FF-1 preferred stock, and warrants to purchase 130,742 shares of Series GG preferred stock that will be net exercised on the closing of this offering for shares of common stock, based on an assumed initial public offering price of $ per share, which is the midpoint of the range of the initial public offering price listed on the cover page of this prospectus. Includes 6,500 shares issuable upon exercise of options that are exercisable within 60 days after July 30, 2011. Meritech Management Associates II L.L.C., the managing members of Meritech Capital Associates II L.L.C., the general partner of each of these funds, and Paul S. Madera and Mike B. Gordon, the managing member of Meritech Management Associates II L.L.C., may be considered to share voting and dispositive power over these shares. Each of Meritech Management Associates II, L.L.C., Meritech Capital Associates II, L.L.C., Mr. Madera and Mr. Gordon disclaims beneficial ownership of these shares except to the extent of their respective pecuniary interests therein. The address of each of these funds is c/o Meritech Capital Partners, 245 Lytton Avenue, Suite 350, Palo Alto, California 94301. |
| (3) | Represents 2,447,262 shares held by Crosslink Ventures IV, L.P. (“Crosslink IV”), 1,080,598 shares held by Crosslink Crossover Fund III (“Crossover III”), 820,575 shares held by Crosslink Crossover Fund IV, L.P. (“Crossover IV”), 867,343 shares held by Offshore Crosslink Omega Ventures IV (“Offshore IV”), 435,242 shares held by Offshore Crosslink Crossover Fund III (“Offshore III”), 185,082 shares held by Omega Bayview IV, L.L.C., 106,756 shares held by Crosslink Omega Ventures IV GmbH & Co. KG (“GmbH & Co.”), and 374,264 shares held by Crosslink Crossover Fund V, L.P. (collectively, the “Crosslink Funds”). Includes 41,675 shares of common stock to be issued upon exercise of outstanding warrants to purchase Series FF and Series FF-1 preferred stock, and warrants to purchase 84,947 shares of Series GG preferred stock that will be net exercised on the closing of this offering for shares of common stock, based on an assumed initial public offering price of $ per share, which is the midpoint of the range of the initial public offering price listed on the cover page of this prospectus, and includes 6,500 shares issuable upon exercise of options that are exercisable within 60 days after July 30, 2011. Crosslink Ventures IV Holdings LLC is the general partner of Crosslink IV and Offshore IV; Crosslink Fund III Management LLC is the general partner of Crossover III and Offshore III; Crossover Fund IV Management LLC is the general partner of Crossover IV; and Crosslink Verwaltungs GmbH is the general partner of GmbH & Co. Each of the general partners of each of the Crosslink Funds, and Michael J. Stark, as the control person for the Crosslink Funds and the general partners of such Crosslink Funds, may be considered to share voting and dispositive power over these shares. The general partners of the Crosslink Funds and Mr. Stark disclaims beneficial ownership of these shares except to the extent of their respective pecuniary interests therein. The address of each of these funds is c/o Crosslink Ventures ATTN: Maureen Offer, Two Embarcadero Center, Suite 2200, San Francisco, California 94116. |
| (4) | Represents 3,321,602 shares held by Investor Growth Capital Limited (“IGC Ltd”), 1,423,544 shares held by Investor Group, L.P. (“IG LP”) and 6,500 shares issuable upon exercise of options that are exercisable within 60 days after July 30, 2011. Investor AB, a publicly traded company on the Stockholm Stock Exchange, is the beneficial owner of the shares held by IGC Ltd and IG |
-144-
Table of Contents
| LP. Lisa H. Barnett, Nicola C. McGall, Liam O. Jones, Robert De Heus, Anders M. Eckerwall and Maarten Van Der Malen are the directors of IGC Ltd and may be considered to share voting and dispositive power over the shares held by IGC Ltd. Andreas Lukas Karl Hünerwadel, Stephan E. Hürlimann, Robert De Heus and Anders M. Eckerwall are the directors of Investor Group GmbH, the general partner of IGVC L.P. which is the general partner of IG LP, and may be considered to share voting and dispositive power over the shares held by IG L.P. Jose Suarez, one of our directors, is a managing director of Investor Growth Capital Inc, which provides investment management services to IGC Ltd and IG LP, and is a wholly owned subsidiary of Investor AB. Mr. Suarez is an employee of Investor AB. Mr. Suarez disclaims beneficial ownership of these shares except to the extent of his pecuniary interest therein. The address for each of these funds is Canada Court, Upland Road, St. Peter Port, Guernsey GY1 3BQ. |
| (5) | Represents 4,047,340 shares held by Morgenthaler Partners VIII, L.P. Includes 6,500 shares issuable upon exercise of options that are exercisable within 60 days after July 30, 2011, 26,702 shares of common stock to be issued upon exercise of outstanding warrants to purchase Series FF and Series FF-1 preferred stock, and warrants to purchase 54,427 shares of Series GG preferred stock that will be net exercised on the closing of this offering for shares of common stock, based on an assumed initial public offering price of $ per share, which is the midpoint of the range of the initial public offering price listed on the cover page of this prospectus. Gary J. Morgenthaler, the managing member of Morgenthaler Ventures may be considered to share voting and dispositive power over these shares. Morgenthaler Ventures and Mr. Morgenthaler disclaim beneficial ownership of these shares except to the extent of their respective pecuniary interests therein. The address of each of these funds is c/o Morgenthaler Partners VIII, L.P., 2710 Sand Hill Road, Suite 100, Menlo Park, California 94025. |
| (6) | Includes 724,700 shares issuable upon exercise of options that are exercisable within 60 days after July 30, 2011. |
| (7) | Includes 202,761 shares issuable upon exercise of options that are exercisable within 60 days after July 30, 2011. |
| (8) | Includes 153,099 shares issuable upon exercise of options that are exercisable within 60 days after July 30, 2011. |
| (9) | Includes 211,137 shares issuable upon exercise of options that are exercisable within 60 days after July 30, 2011. |
| (10) | Includes 176,891 shares issuable upon exercise of options that are exercisable within 60 days after July 30, 2011. |
| (11) | Includes 30,000 shares issuable upon exercise of options that are exercisable within 60 days after July 30, 2011. |
| (12) | Includes 49,490 shares issuable upon exercise of options that are exercisable within 60 days after July 30, 2011. |
| (13) | Includes 1,574,078 shares issuable upon exercise of options that are exercisable within 60 days after July 30, 2011 132,521 shares of common stock to be issued upon exercise of outstanding warrants to purchase Series FF and Series FF-1 preferred stock, and warrants to purchase 270,116 shares of Series GG preferred stock that will be net exercised on the closing of this offering for shares of common stock, based on an assumed initial public offering price of $ per share, which is the midpoint of the range of the initial public offering price listed on the cover page of this prospectus. |
-145-
Table of Contents
The following is a summary of our capital stock and certain provisions of our amended and restated certificate of incorporation and amended and restated bylaws, as they will be in effect upon the closing of this offering. This summary does not purport to be complete and is qualified in its entirety by the provisions of our amended and restated certificate of incorporation and amended and restated bylaws, copies of which have been filed as exhibits to the registration statement of which this prospectus is a part.
Immediately following the closing of this offering, our authorized capital stock will consist of shares of common stock, $.001 par value per share, and shares of preferred stock, $.001 par value per share.
Common stock
Based on 3,546,933 shares of common stock outstanding as of July 30, 2011 and the conversion of outstanding preferred stock as of July 30, 2011 into 39,819,237 shares of common stock upon the completion of this offering (assuming that shares of Series CC preferred stock convert on a one for 11.80684 basis and the shares of Series EE preferred stock convert on a one for 1.02268 basis), assuming no outstanding options are exercised prior to the closing of this offering and the issuance of shares of common stock in this offering, there will be shares of common stock outstanding upon the closing of this offering (including 1,073,447 shares of common stock reserved for issuance upon the exercise of outstanding warrants as of July 30, 2011, at a weighted average exercise price of $2.68 per share; and 320,393 shares of common stock reserved for issuance upon the exercise of outstanding warrants as of July 30, 2011, at a weighted average exercise price of $2.53 per shares, that will be net exercised for shares of common stock, based on an assumed initial public offering price of $ per share, which is the midpoint of the range of the initial public offering price listed on the cover page of this prospectus). As of July 30, 2011, assuming the conversion of all outstanding preferred stock into common stock upon the closing of this offering, we had 268 record holders of our common stock.
Holders of our common stock are entitled to one vote for each share of common stock held of record for the election of directors and on all matters submitted to a vote of stockholders. Holders of our common stock are entitled to receive dividends ratably, if any, as may be declared by our board of directors out of legally available funds, subject to any preferential dividend rights of any preferred stock then outstanding. Upon our dissolution, liquidation or winding up, holders of our common stock are entitled to shares ratably in our net assets legally available after the payment of all our debts and other liabilities, subject to the preferential rights of any preferred stock then outstanding. Holders of our common stock have no preemptive, subscription, redemption or conversion rights. The rights, preferences and privileges of holders of common stock are subject to, and may be adversely affected by, the rights of the holders of shares of any series of preferred stock that we may designate and issue in the future. All of our outstanding shares of common stock are, and the shares of common stock to be issued pursuant to this offering will be, fully paid and nonassessable.
Preferred stock
Upon completion of this offering, our board of directors will be authorized, without further vote or action by the stockholders, to issue from time to time, up to an aggregate of 50,000,000 shares of preferred stock in one or more series and to fix or alter the designations, rights, preferences
-146-
Table of Contents
and privileges and any qualifications, limitations or restrictions of the shares of each such series of preferred stock, including the dividend rights, dividend rates, conversion rights, voting rights, terms of redemption including sinking fund provisions, redemption price or prices, liquidation preferences and the number of shares constituting any series or designations of such series, any or all of which may be greater than the rights of common stock. The issuance of preferred stock could adversely affect the voting power of holders of our common stock and the likelihood that holders of our common stock will receive dividend payments upon liquidation and could have the effect of delaying, deferring or preventing a change in control. We have no present plans to issue any shares of preferred stock.
Warrants
As of July 30, 2011, we had the following warrants outstanding:
| • | Warrants to purchase an aggregate of 480,729 shares of common stock at exercise prices ranging from $1.71 to $44,000 per share. The warrants expire on various dates between March 8, 2012 and April 16, 2020. |
| • | Warrants to purchase 296,362 shares of Series FF and 296,356 shares of Series FF-1 at exercise prices ranging from $2.53 to $4.53 per share in connection with a debt financing. Each warrant contains provisions for the adjustment of the exercise price and the number of shares issuable upon exercise in the event of stock dividends, stock splits, reorganizations and reclassifications, consolidations and the like. The warrants expire on various dates between March 11, 2018 and March 30, 2019. |
| • | Warrants to purchase 320,393 shares of Series GG at an exercise price of $2.53 per share in connection with a debt financing. Upon completion of this offering, all of these warrants will expire if not exercised. Each warrant contains provisions for the adjustment of the exercise price and the number of shares issuable upon exercise in the event of stock dividends, stock splits, reorganizations and reclassifications, consolidations and the like. |
Registration rights
Following the closing of this offering, the holders of an aggregate of 40,732,348 shares of our common stock issuable upon the conversion of our convertible preferred stock (including 592,718 shares of common stock reserved for issuance upon the exercise of outstanding warrants as of July 30, 2011, at a weighted average exercise price of $3.02 per share; and 320,393 shares of common stock reserved for issuance upon the exercise of outstanding warrants as of July 30, 2011, at a weighted average exercise price of $2.53 per shares, that will be net exercised for shares of common stock, based on an assumed initial public offering price of $ per share, which is the midpoint of the range of the initial public offering price listed on the cover page of this prospectus), or their transferees, will be entitled to the registration rights set forth below with respect to registration of the resale of such shares under the Securities Act pursuant to an investors’ rights agreement by and among us and certain of our stockholders. As applicable, we refer to these shares collectively as registrable securities. The rights set forth below will expire on the fifth anniversary of the closing of the offering.
Demand registration rights. At any time, other than during the six-month period following the effective date of the registration statement of which this prospectus is a part and subject to certain exceptions, the holders of at least 30% of the registrable securities may demand that we effect a registration under the Securities Act covering the public offering and sale of all or part
-147-
Table of Contents
of the registrable securities held by such stockholders, provided that the aggregate offering price of the registrable securities that such holders propose to sell in such offering is at least $25,000,000. Upon any such demand we must use our best efforts to effect the registration of the registrable securities which we have been requested to register together with all other registrable securities that we may have been requested to register by other stockholders pursuant to the incidental registration rights described below. We are only obligated to effect two registrations in response to these demand registration rights for the holders of the registrable securities. Depending on certain conditions, we may defer such registration for up to 90 days.
Incidental registration rights. If we register any securities for public sale, including pursuant to any stockholder initiated demand registration, holders of the registrable securities will have the right to include their shares in the registration statement, subject to certain exceptions relating to employee benefit plans and mergers and acquisitions. The underwriters of any underwritten offering will have the right to limit the number registrable securities to be included in the registration statement, subject to certain restrictions.
Short form registration rights. Following this offering, we are obligated under the investors’ rights agreement to use our best efforts to qualify and remain eligible for registration on Form S-3 under the Securities Act. At any time after we are qualified to file a registration statement on Form S-3, the holders of at least 30% of the registrable securities may request in writing that we effect a registration on Form S-3 if the proposed aggregate offering price of the shares to be registered by the holders requesting registration is at least $5,000,000, subject to certain exceptions.
Expenses of registration. We will pay all registration expenses related to any demand, company or Form S-3 registration, including reasonable fees and expenses of counsel for the selling holders of the registrable securities, other than underwriting discounts, selling commissions and transfer taxes (if any), which will be borne by the holders of the registrable securities.
Canadian registration requirements. We are obligated, at the request of any Canadian holder of registrable securities and subject to certain conditions, to file a prospectus under the securities laws of each Canadian province in which holders of registrable securities are then resident, to qualify the distribution of the registrable securities in such provinces, and to use our best efforts to obtain a receipt (or equivalent document) therefor concurrently with the completion of this offering.
Indemnification. The investors’ rights agreement contains indemnification provisions pursuant to which we are obligated to indemnify the selling stockholders and any person who might be deemed to control us or any of our subsidiaries in the event of material misstatements or omissions in the registration statement or related violations of law attributable to us. As a condition to including their securities in any registration statement filed pursuant to demand or incidental registration rights, the selling stockholders shall indemnify us for misstatements or omissions attributable to them.
Antitakeover effects of provisions of the amended and restated certificate of incorporation and amended and restated bylaws
Our amended and restated certificate of incorporation and our amended and restated bylaws contain certain provisions that could have the effect of delaying, deferring or discouraging another party from acquiring control of us. We expect these provisions and certain provisions of Delaware law, which are summarized below, to discourage coercive takeover practices and inadequate takeover bids. These provisions are also designed, in part, to encourage persons
-148-
Table of Contents
seeking to acquire control of us to negotiate first with our board of directors. We believe that the benefits of increased protection due to our potential ability to negotiate more favorable terms with an unfriendly or unsolicited acquirer outweigh the disadvantages of discouraging a proposal to acquire us.
Undesignated preferred stock. As discussed above, our board of directors has the ability to issue preferred stock with voting or other rights or preferences that could impede the success of any attempt to change control of us. These and other provisions may have the effect of deterring hostile takeovers or delaying changes in control or management of our company.
Limits on the ability of stockholders to act by written consent or call a special meeting. Our amended and restated certificate of incorporation provides that our stockholders may not act by written consent, which may lengthen the amount of time required to take stockholder actions. As a result, a holder controlling a majority of our capital stock would not be able to amend our certificate of incorporation or bylaws or remove directors without holding a meeting of our stockholders called in accordance with our bylaws.
In addition, our amended and restated certificate of incorporation and amended and restated bylaws provide that special meetings of the stockholders may be called only by the chairperson of the board of directors, the chief executive officer or our board of directors. Stockholders may not call a special meeting, which may delay the ability of our stockholders to force consideration of a proposal or for holders controlling a majority of our capital stock to take any action, including the removal of directors.
Requirements for advance notification of stockholder nominations and proposals. Our amended and restated bylaws establish advance notice procedures with respect to stockholder proposals and the nomination of candidates for election as directors, other than nominations made by or at the direction of our board of directors. These provisions may have the effect of precluding the conduct of certain business at a meeting if the proper procedures are not followed. These provisions may also discourage or deter a potential acquirer from conducting a solicitation of proxies to elect the acquirer’s own slate of directors or otherwise attempting to obtain control of our company.
Board classification. Our amended and restated certificate of incorporation provides that our board of directors will be divided into three classes, one class of which is elected each year by our stockholders. The directors in each class will serve for a three-year term. For more information on the classified board of directors, see “Management—Board composition and risk oversight.” Our classified board of directors may tend to discourage a third party from making a tender offer or otherwise attempting to obtain control of us because it generally makes it more difficult for stockholders to replace a majority of the directors.
Election and removal of directors. Our amended and restated certificate of incorporation and amended and restated bylaws contain provisions that establish specific procedures for appointing and removing members of our board of directors. Under our amended and restated certificate of incorporation and amended and restated bylaws, vacancies and newly created directorships on our board of directors may be filled only by a majority of the directors then serving on the board of directors. Under our amended and restated certificate of incorporation and amended and restated bylaws, directors may be removed only for cause by the affirmative vote of the holders of a majority of the shares then entitled to vote at an election of directors.
No cumulative voting. The Delaware General Corporation Law provides that stockholders are not entitled to the right to cumulate votes in the election of directors unless our restated
-149-
Table of Contents
certificate of incorporation provides otherwise. Our restated certificate of incorporation and amended and restated bylaws do not expressly provide for cumulative voting. The absence of cumulative voting makes it more difficult for a minority stockholder to gain a seat on our board of directors to influence our board of directors’ decision regarding a takeover.
Delaware antitakeover statute. Upon the completion of this offering, we will be subject to the provisions of Section 203 of the Delaware General Corporation Law regulating corporate takeovers. In general, Section 203 prohibits a publicly held Delaware corporation from engaging, under certain circumstances, in a business combination with an interested stockholder for a period of three years following the date the person became an interested stockholder unless:
| • | prior to the date of the transaction, our board of directors approved either the business combination or the transaction which resulted in the stockholder becoming an interested stockholder; |
| • | upon completion of the transaction that resulted in the stockholder becoming an interested stockholder, the interested stockholder owned at least 85% of the voting stock of the corporation outstanding at the time the transaction commenced, calculated as provided under Section 203; or |
| • | at or subsequent to the date of the transaction, the business combination is approved by our board of directors and authorized at an annual or special meeting of stockholders, and not by written consent, by the affirmative vote of at least two-thirds of the outstanding voting stock which is not owned by the interested stockholder. |
Generally, a business combination includes a merger, asset or stock sale or other transaction resulting in a financial benefit to the interested stockholder. An interested stockholder is a person who, together with affiliates and associates, owns or, within three years prior to the determination of interested stockholder status, did own 15% or more of a corporation’s outstanding voting stock. We expect the existence of this provision to have an antitakeover effect with respect to transactions our board of directors does not approve in advance. We also anticipate that Section 203 may discourage takeover attempts that might result in a premium over the market price for the shares of common stock held by stockholders.
The provisions of Delaware law and the provisions of our amended and restated certificate of incorporation and amended and restated bylaws, could have the effect of discouraging others from attempting hostile takeovers and, as a consequence, they might also inhibit temporary fluctuations in the market price of our common stock that often result from actual or rumored hostile takeover attempts. These provisions might also have the effect of preventing changes in our management. It is possible that these provisions could make it more difficult to accomplish transactions that stockholders might otherwise deem to be in their best interests.
Transfer agent and registrar
The transfer agent and registrar for our common stock is . The transfer agent’s address is and its telephone number is ( ) .
Listing on The NASDAQ Global Market or The New York Stock Exchange
We intend to apply to list our common stock on The NASDAQ Global Market or the New York Stock Exchange under the trading symbol “BLRC.”
-150-
Table of Contents
Shares eligible for future sale
Prior to this offering, there has not been any public market for our common stock, and we make no prediction as to the effect, if any, that market sales of shares of our common stock or the availability of shares of common stock for sale will have on the market price of our common stock. Nevertheless, sales of substantial amounts of common stock in the public market, or the perception that such sales could occur, could adversely affect the market price of common stock and could impair our future ability to raise capital through the sale of equity securities.
Upon the completion of this offering, we will have an aggregate of shares of common stock outstanding, assuming no exercise of the underwriters’ over-allotment option and no exercise of outstanding options. Of the outstanding shares, all of the shares sold in this offering, plus any additional shares sold upon exercise of the underwriters’ over-allotment option, will be freely tradable, except that any shares purchased by “affiliates” (as that term is defined in Rule 144 under the Securities Act), may only be sold in compliance with the limitations described below. The remaining shares of common stock will be deemed “restricted securities” as defined in Rule 144. Restricted securities may be sold in the public market only if registered or if they qualify for an exemption from registration under Rule 144 or Rule 701, promulgated under the Securities Act, which rules are summarized below.
As a result of the contractual restrictions described below and the provisions of Rules 144 and 701, the restricted shares will be available for sale in the public market as follows:
| • | no shares will be eligible for sale upon completion of this offering; |
| • | no shares will be eligible for sale upon the expiration of the lock-up agreements, described below, beginning 90 days after the date of this prospectus; |
| • | 43,366,170 shares will be eligible for sale upon the expiration of the lock-up agreements, described below, beginning 180 days after the date of this prospectus; and |
| • | shares will be eligible for sale upon the exercise of vested options 180 days after the date of this prospectus, subject to extension in certain circumstances. |
Lock-up agreements and obligations
Our directors, officers and substantially all of our stockholders have entered into lock-up agreements that generally provide that these holders will not offer, pledge, sell, agree to sell, directly or indirectly, or otherwise dispose of any shares of common stock or any securities convertible into or exchangeable for shares of common stock without the prior written consent of J.P. Morgan Securities LLC and Merrill Lynch, Pierce, Fenner & Smith Incorporated for a period of 180 days from the date of this prospectus, subject to certain exceptions described under the heading “Underwriting.”
In addition, each grant agreement under each of our 2000 Plan contains restrictions similar to those set forth in the lock-up agreements described above limiting the disposition of securities issuable pursuant to those plans for a period of at least 180 days following the date of this prospectus.
The 180-day restricted periods described above are subject to extension such that, in the event that either (1) during the last 17 days of the 180-day restricted period, we issue an earnings
-151-
Table of Contents
release or (2) prior to the expiration of the 180-day restricted period, we announce that we will release earnings results during the 16-day period beginning on the last day of the 180-day period, the restrictions on offers, pledges, sales, agreements to sell or other dispositions of common stock or securities convertible into or exchangeable or exercisable for shares of our common stock described above will continue to apply until the expiration of the 18-day period beginning on the issuance of the earnings release; provided, however, that if none of the underwriters’ representatives publishes or otherwise distributes a research report or makes a public appearance concerning us within three trading days of the announcement of such material news or material event, the extension of the 180-day restricted period related to such material news or material event (but not related to any other material news or material event) will be only until the later of (i) the last day of the initial 180-day restricted period and (ii) the third trading day after such announcement.
Rule 144
In general, under Rule 144 as currently in effect, once we have been subject to public company reporting requirements for at least 90 days, a person who is not deemed to have been one of our affiliates for purposes of the Securities Act at any time during 90 days preceding a sale and who has beneficially owned the shares proposed to be sold for at least six months, including the holding period of any prior owner other than our affiliates, is entitled to sell such shares without complying with the manner of sale, volume limitation or notice provisions of Rule 144, subject to compliance with the public information requirements of Rule 144. If such a person has beneficially owned the shares proposed to be sold for at least one year, including the holding period of any prior owner other than our affiliates, then such person is entitled to sell such shares without complying with any of the requirements of Rule 144.
In general, under Rule 144, as currently in effect, our affiliates or persons selling shares on behalf of our affiliates are entitled to sell upon expiration of the lock-up agreements described above, within any three-month period beginning 90 days after the date of this prospectus, a number of shares that does not exceed the greater of:
| • | 1% of the number of shares of common stock then outstanding, which will equal approximately shares immediately after this offering; or |
| • | the average weekly trading volume of the common stock during the four calendar weeks preceding the filing of a notice on Form 144 with respect to such sale. |
Sales under Rule 144 by our affiliates or persons selling shares on behalf of our affiliates are also subject to certain manner of sale provisions and notice requirements and to the availability of current public information about us.
Rule 701
Rule 701 generally allows a stockholder who purchased shares of our common stock pursuant to a written compensatory plan or contract and who is not deemed to have been an affiliate of our company during the immediately preceding 90 days to sell these shares in reliance upon Rule 144, but without being required to comply with the public information, holding period, volume limitation, or notice provisions of Rule 144. Rule 701 also permits affiliates of our company to sell their Rule 701 shares under Rule 144 without complying with the holding period requirements of
-152-
Table of Contents
Rule 144. All holders of Rule 701 shares, however, are required to wait until 90 days after the date of this prospectus before selling such shares pursuant to Rule 701.
As of July 30, 2011, 2,702,138 shares of our outstanding common stock had been issued in reliance on Rule 701 as a result of exercises of stock options and stock awards.
Stock options
We intend to file registration statements on Form S-8 under the Securities Act covering all of the shares of our common stock subject to options outstanding or reserved for issuance under our stock plans, employee stock purchase plan and shares of our common stock issued upon the exercise of options by employees. We expect to file this registration statement as soon as practicable after this offering. However, the shares registered on Form S-8 will be subject to volume limitations, manner of sale, notice and public information requirements of Rule 144 and will not be eligible for resale until expiration of the lock-up agreements to which they are subject.
Registration rights
Upon completion of this offering, the holders of an aggregate of 40,732,348 shares of our common stock issuable upon the conversion of our convertible preferred stock (including 592,718 shares of common stock reserved for issuance upon the exercise of outstanding warrants as of July 30, 2011, at a weighted average exercise price of $3.02 per share; and 320,393 shares of common stock reserved for issuance upon the exercise of outstanding warrants as of July 30, 2011, at a weighted average exercise price of $2.53 per shares, that will be net exercised for shares of common stock, based on an assumed initial public offering price of $ per share, which is the midpoint of the range of the initial public offering price listed on the cover page of this prospectus), or their transferees, will be entitled to rights with respect to the registration of their shares under the Securities Act. Registration of these shares under the Securities Act would result in these shares becoming freely tradeable without restriction under the Securities Act immediately upon the effectiveness of such registration. For a further description of these rights, see “Description of capital stock—Registration rights.”
-153-
Table of Contents
Material United States federal income tax and estate tax consequences to non-U.S. holders
The following is a summary of the material U.S. federal income tax and estate tax consequences to non-U.S. holders (as defined below) of the ownership and disposition of our common stock, but does not purport to be a complete analysis of all the potential tax considerations relating thereto. This summary is based upon the provisions of the Internal Revenue Code, Treasury regulations promulgated thereunder, administrative rulings and judicial decisions, all as of the date hereof. These authorities may be changed, possibly retroactively, so as to result in U.S. federal income or estate tax consequences different from those set forth below.
This summary does not address the tax considerations arising under the laws of any non-U.S., state or local jurisdiction or under U.S. federal gift and estate tax laws, except to the limited extent below. In addition, this discussion does not address tax considerations applicable to an investor’s particular circumstances or to investors that may be subject to special tax rules, including, without limitation:
| • | banks, insurance companies or other financial institutions; |
| • | persons subject to the alternative minimum tax; |
| • | tax-exempt organizations; |
| • | controlled foreign corporations, passive foreign investment companies and corporations that accumulate earnings to avoid U.S. federal income tax; |
| • | dealers in securities or currencies; |
| • | traders in securities that elect to use a mark-to-market method of accounting for their securities holdings; |
| • | persons that own, or are deemed to own, more than five percent of our capital stock, except to the extent specifically set forth below; |
| • | certain former citizens or long-term residents of the United States; |
| • | persons who hold our common stock as a position in a hedging transaction, “straddle,” “conversion transaction” or other risk reduction transaction; |
| • | persons who do not hold our common stock as a capital asset within the meaning of Section 1221 of the Internal Revenue Code (generally, for investment purposes); or |
| • | persons deemed to sell our common stock under the constructive sale provisions of the Internal Revenue Code. |
In addition, if a partnership or entity classified as a partnership for U.S. federal income tax purposes holds our common stock, the tax treatment of a partner generally will depend on the status of the partner and upon the activities of the partnership. Accordingly, partnerships that hold our common stock, and partners in such partnerships, should consult their tax advisors.
YOU ARE URGED TO CONSULT YOUR TAX ADVISOR WITH RESPECT TO THE APPLICATION OF THE U.S. FEDERAL INCOME TAX LAWS TO YOUR PARTICULAR SITUATION, AS WELL AS ANY TAX
-154-
Table of Contents
CONSEQUENCES OF THE PURCHASE, OWNERSHIP AND DISPOSITION OF OUR COMMON STOCK ARISING UNDER THE U.S. FEDERAL ESTATE OR GIFT TAX RULES OR UNDER THE LAWS OF ANY STATE, LOCAL, NON-U.S. OR OTHER TAXING JURISDICTION OR UNDER ANY APPLICABLE TAX TREATY.
Non-U.S. holder defined
For purposes of this discussion, you are a non-U.S. holder if you are any holder, other than a partnership or entity classified as a partnership for U.S. federal income tax purposes, that is not:
| • | an individual citizen or resident of the United States; |
| • | a corporation or other entity taxable as a corporation created or organized in the United States or under the laws of the United States or any political subdivision thereof; |
| • | an estate whose income is subject to U.S. federal income tax regardless of its source; or |
| • | a trust (x) whose administration is subject to the primary supervision of a U.S. court and which has one or more U.S. persons who have the authority to control all substantial decisions of the trust or (y) which has made an election to be treated as a U.S. person. |
Distributions
We have not made any distributions on our common stock and we do not plan to make any distributions for the foreseeable future. However, if we do make distributions on our common stock, those payments will constitute dividends for U.S. tax purposes to the extent paid from our current or accumulated earnings and profits, as determined under U.S. federal income tax principles. To the extent those distributions exceed both our current and our accumulated earnings and profits, they will constitute a return of capital and will first reduce your basis in our common stock, but not below zero, and then will be treated as gain from the sale of our common stock.
Any dividend paid to you generally will be subject to U.S. withholding tax either at a rate of 30% of the gross amount of the dividend or such lower rate as may be specified by an applicable income tax treaty. In order to receive a reduced treaty rate, you must provide us with an IRS Form W-8BEN or other appropriate version of IRS Form W-8 certifying qualification for the reduced rate. A non-U.S. holder of shares of our common stock eligible for a reduced rate of U.S. withholding tax pursuant to an income tax treaty may obtain a refund of any excess amounts withheld by filing an appropriate claim for refund with the Internal Revenue Service, or IRS. If the non-U.S. holder holds the stock through a financial institution or other agent acting on the non-U.S. holder’s behalf, the non-U.S. holder will be required to provide appropriate documentation to the agent, which then will be required to provide certification to us or our paying agent, either directly or through other intermediaries.
Dividends received by you that are effectively connected with your conduct of a U.S. trade or business, and, if required by an applicable income tax treaty, attributable to a permanent establishment maintained by you in the United States, are exempt from such withholding tax. In order to obtain this exemption, you must provide us with an IRS Form W-8ECI or other applicable IRS Form W-8 properly certifying such exemption. Such effectively connected dividends, although not subject to withholding tax, are generally taxed at the same graduated rates applicable to U.S.
-155-
Table of Contents
persons, net of certain deductions and credits. In addition, if you are a corporate non-U.S. holder, dividends you receive that are effectively connected with your conduct of a U.S. trade or business may also be subject to a branch profits tax at a rate of 30% or such lower rate as may be specified by an applicable income tax treaty.
Gain on disposition of common stock
You generally will not be required to pay U.S. federal income tax on any gain realized upon the sale or other disposition of our common stock unless:
| • | the gain is effectively connected with your conduct of a U.S. trade or business, and, if required by an applicable income tax treaty, the gain is attributable to a permanent establishment maintained by you in the United States; |
| • | you are an individual who is present in the United States for a period or periods aggregating 183 days or more during the calendar year in which the sale or disposition occurs and certain other conditions are met; or |
| • | our common stock constitutes a U.S. real property interest by reason of our status as a “United States real property holding corporation,” or a USRPHC, for U.S. federal income tax purposes, at any time within the shorter of the five-year period preceding the disposition or your holding period for our common stock. |
We believe that we are not currently and will not become a USRPHC. However, because the determination of whether we are a USRPHC depends on the fair market value of our U.S. real property relative to the fair market value of our other business assets, there can be no assurance that we will not become a USRPHC in the future. Even if we become a USRPHC, however, as long as our common stock is regularly traded on an established securities market, such common stock will be treated as a U.S. real property interest only if you actually or constructively hold more than five percent of such regularly traded common stock at any time during the applicable period described above.
If you are a non-U.S. holder described in the first bullet above, you will generally be required to pay tax on the gain derived from the sale, net of certain deductions or credits, under regular graduated U.S. federal income tax rates, and corporate non-U.S. holders described in the first bullet above may be subject to branch profits tax at a 30% rate or such lower rate as may be specified by an applicable income tax treaty. If you are an individual non-U.S. holder described in the second bullet above, you will be required to pay a flat 30% tax on the gain derived from the sale, which tax may be offset by U.S. source capital losses, even though you are not considered a resident of the United States. You should consult any applicable income tax or other treaties that may provide for different rules.
Federal estate tax
Our common stock beneficially owned by an individual who is not a citizen or resident of the United States, as defined for U.S. federal estate tax purposes, at the time of death will generally be includable in the decedent’s gross estate for U.S. federal estate tax purposes, unless an applicable estate tax treaty provides otherwise.
-156-
Table of Contents
Backup withholding and information reporting
Generally, we must report annually to the IRS the amount of dividends paid to you, your name and address, and the amount of tax withheld, if any. A similar report will be sent to you. Pursuant to applicable income tax treaties or other agreements, the IRS may make these reports available to tax authorities in your country of residence.
Payments of dividends or of proceeds on the disposition of stock made to you may be subject to additional information reporting and backup withholding at a current rate of 28% unless you establish an exemption, for example by properly certifying your non-U.S. status on an IRS Form W-8BEN or another appropriate version of IRS Form W-8. Notwithstanding the foregoing, backup withholding and information reporting may apply if either we or our paying agent has actual knowledge, or reason to know, that you are a U.S. person.
Backup withholding is not an additional tax; rather, the U.S. income tax liability of persons subject to backup withholding will be reduced by the amount of tax withheld. If withholding results in an overpayment of taxes, a refund or credit may generally be obtained from the IRS, provided that the required information is furnished to the IRS in a timely manner.
Recently enacted legislation affecting taxation of our common stock held by or through foreign entities
Recently enacted legislation generally will impose a U.S. federal withholding tax of 30% on dividends and the gross proceeds of a disposition of our common stock paid after December 31, 2012 to a “foreign financial institution,” as specially defined under these rules, unless such institution enters into an agreement with the U.S. government to withhold on certain payments and to collect and provide to the U.S. tax authorities substantial information regarding U.S. account holders of such institution, which includes certain equity and debt holders of such institution, as well as certain account holders that are foreign entities with U.S. owners. The legislation also will generally impose a U.S. federal withholding tax of 30% on dividends and the gross proceeds of a disposition of our common stock paid after December 31, 2012 to a non financial foreign entity unless such entity provides the withholding agent with a certification identifying the direct and indirect U.S. owners of the entity. Under certain circumstances, a non-U.S. holder might be eligible for refunds or credits of such taxes. Prospective investors are encouraged to consult with their own tax advisors regarding the possible implications of this legislation on their investment in our common stock.
THE PRECEDING DISCUSSION OF U.S. FEDERAL TAX CONSIDERATIONS IS FOR GENERAL INFORMATION ONLY. IT IS NOT TAX ADVICE. EACH PROSPECTIVE INVESTOR SHOULD CONSULT ITS OWN TAX ADVISOR REGARDING THE PARTICULAR U.S. FEDERAL, STATE AND LOCAL AND NON-U.S. TAX CONSEQUENCES OF PURCHASING, HOLDING AND DISPOSING OF OUR COMMON STOCK, INCLUDING THE CONSEQUENCES OF ANY PROPOSED CHANGE IN APPLICABLE LAWS.
-157-
Table of Contents
J.P. Morgan Securities LLC, Merrill Lynch, Pierce, Fenner & Smith Incorporated and Credit Suisse Securities (USA) LLC, or the Representatives, are acting as the representatives of the underwriters and joint book running managers in connection with this offering. Under the terms of an underwriting agreement, the form of which will be filed as an exhibit to the registration statement of which this prospectus forms a part, each of the underwriters named below has severally agreed to purchase from us, and have agreed to sell, the respective number of shares of common stock shown opposite its name below:
| Name | Number of shares | |
|
| ||
| J.P. Morgan Securities LLC |
||
| Merrill Lynch, Pierce, Fenner & Smith |
||
|
Incoporated |
||
| Credit Suisse Securities (USA) LLC |
||
| William Blair & Company, L.L.C. |
||
| Pacific Crest Securities LLC |
||
| ThinkEquity LLC |
||
|
| ||
| Total |
||
|
| ||
The underwriting agreement provides that the underwriters’ obligation to purchase shares of common stock depends on the satisfaction of the conditions contained in the underwriting agreement, including:
| • | the obligation to purchase all of the shares of common stock offered hereby (other than those shares of common stock covered by their option to purchase additional shares as described below), if any of the shares are purchased; |
| • | the representations and warranties made by us to the underwriters are true; |
| • | there is no material adverse change in our business or in the financial markets; and |
| • | we deliver customary closing documents to the underwriters. |
Commissions and expenses
The following table summarizes the underwriting discounts and commissions we will pay to the underwriters. These amounts are shown assuming both no exercise and full exercise of the underwriters’ option to purchase up to additional shares from us. The underwriting fee is the difference between the initial price to the public and the amount the underwriters pay to us, and we have severally agreed to sell, for the shares.
| Paid by us | No exercise | Full exercise | ||||||
|
|
||||||||
| Per Share |
$ | $ | ||||||
| Total |
$ | $ | ||||||
|
|
|
|
|
|||||
The Representatives have advised us that the underwriters propose to offer the shares of common stock directly to the public at the public offering price on the cover of this prospectus and to selected dealers, which may include the underwriters, at such offering price less a selling concession not in excess of $ per share. After the offering, the Representatives may change the offering price and other selling terms.
-158-
Table of Contents
The expenses of this offering, which are payable by us, are estimated to be approximately $ million (excluding underwriting discounts and commissions).
Option to purchase additional shares
We have granted the underwriters an option exercisable for 30 days after the date of this prospectus to purchase, from time to time, in whole or in part, up to an aggregate of shares of common stock at the public offering price less underwriting discounts and commissions. This option may be exercised by the underwriters to cover over-allotments, if any, in connection with this offering. To the extent that the underwriters exercise this option, each underwriter will be committed, so long as the conditions of the underwriting agreement are satisfied, to purchase a number of additional shares of common stock proportionate to that underwriter’s initial commitment as indicated in the table above, and we will be obligated to sell the additional shares of common stock to the underwriters.
Lock-up agreements
We, all of our directors and executive officers and holders of substantially all of our outstanding stock, have agreed that, subject to certain exceptions, we and they will not directly or indirectly, without the prior written consent of J.P. Morgan Securities LLC and Merrill Lynch, Pierce, Fenner & Smith Incorporated, (1) offer, sell, pledge, contract to sell, sell any option or contract to purchase, purchase any option or contract to sell, grant any option, right or warrant to purchase or otherwise dispose of (or enter into any transaction or device that is designed to, or could be expected to, result in the disposition by any person at any time in the future of) any shares of our common stock or securities convertible into or exercisable or exchangeable for our common stock (including, without limitation, shares of common stock that may be deemed to be beneficially owned in accordance with the rules and regulations of the SEC and shares of common stock that may be issued upon exercise of any stock options), or publicly disclose the intention to make any offer, pledge, sale disposition, (2) enter into any swap or other derivatives transaction that transfers to another, in whole or in part, any of the economic benefits or risks of ownership of shares of common stock or such securities, whether any such transaction described in clause (1) or (2) above is to be settled by delivery of common stock or other securities, in cash or otherwise or (3) make any demand for or exercise any right or cause to be filed with respect to the registration of any shares of common stock or securities convertible into or exercisable or exchangeable for common stock or any other securities for a period of 180 days after the date of this prospectus.
The 180-day restricted period described in the preceding paragraph will be extended if:
| (1) | during the last 17 days of the 180-day restricted period, we issue an earnings release or material news or a material event relating to us occurs; or |
| (2) | prior to the expiration of the 180-day restricted period, we announce that we will release earnings results during the 16-day period beginning on the last day of the 180-day period, |
in which case the restrictions described in the preceding paragraph will continue to apply until the expiration of the 18-day period beginning on the issuance of the earnings release or the announcement of the material news or occurrence of the material event, unless such extension is waived in writing by J.P. Morgan Securities LLC and Merrill Lynch, Pierce, Fenner & Smith Incorporated.
-159-
Table of Contents
J.P. Morgan Securities LLC and Merrill Lynch, Pierce, Fenner & Smith Incorporated, in their sole discretion, may release the common stock and other securities subject to the lock-up agreements described above in whole or in part at any time with or without notice. When determining whether or not to release common stock and other securities from lock-up agreements, J.P. Morgan Securities LLC and Merrill Lynch, Pierce, Fenner & Smith Incorporated will consider, among other factors, the holder’s reasons for requesting the release, the number of shares of common stock and other securities for which the release is being requested and market conditions at the time.
Offering price determination
Prior to this offering, there has been no public market for our common stock. The initial public offering price will be negotiated between the Representatives and us. In determining the initial public offering price of our common stock, the Representatives will consider:
| • | the history and prospects for the industry in which we compete; |
| • | our financial information; |
| • | an assessment of management and our business potential and earning prospects; |
| • | the prevailing securities market conditions at the time of this offering; and |
| • | the recent market prices of, and the demand for, publicly traded shares of generally comparable companies. |
Indemnification
We have agreed to indemnify the underwriters against certain liabilities, including liabilities under the Securities Act and liabilities arising from breaches of the representations and warranties contained in the underwriting agreement, and to contribute to payments that the underwriters may be required to make for these liabilities.
Stabilization, short positions and penalty bids
The underwriters may engage in stabilizing transactions, short sales and purchases to cover positions created by short sales, and penalty bids or purchases for the purpose of pegging, fixing or maintaining the price of our common stock, in accordance with Regulation M under the Exchange Act:
| • | Stabilizing transactions permit bids to purchase the underlying security so long as the stabilizing bids do not exceed a specified maximum. |
| • | A short position involves a sale by the underwriters of shares in excess of the number of shares the underwriters are obligated to purchase in the offering, which creates the syndicate short position. This short position may be either a covered short position or a naked short position. In a covered short position, the number of shares involved in the sales made by the underwriters in excess of the number of shares they are obligated to purchase is not greater than the number of shares that they may purchase by exercising their option to purchase additional shares. In a naked short position, the number of shares involved is greater than the number of shares in their option to purchase additional shares. The underwriters may close out |
-160-
Table of Contents
| any short position by either exercising their option to purchase additional shares and/or purchasing shares in the open market. In determining the source of shares to close out the short position, the underwriters will consider, among other things, the price of shares available for purchase in the open market as compared to the price at which they may purchase shares through their option to purchase additional shares. A naked short position is more likely to be created if the underwriters are concerned that there could be downward pressure on the price of the shares in the open market after pricing that could adversely affect investors who purchase in the offering. |
| • | Syndicate covering transactions involve purchases of the common stock in the open market after the distribution has been completed in order to cover syndicate short positions. |
| • | Penalty bids permit the Representatives to reclaim a selling concession from a syndicate member when the common stock originally sold by the syndicate member is purchased in a stabilizing or syndicate covering transaction to cover syndicate short positions. |
These stabilizing transactions, syndicate covering transactions and penalty bids may have the effect of raising or maintaining the market price of our common stock or preventing or retarding a decline in the market price of the common stock. As a result, the price of the common stock may be higher than the price that may otherwise exist in the open market. These transactions may be effected on or otherwise and, if commenced, may be discontinued at any time.
Neither we nor any of the underwriters make any representation or prediction as to the direction or magnitude of any effect that the transactions described above may have on the price of our common stock. In addition, neither we nor any of the underwriters make representation that the Representatives will engage in these stabilizing transactions or that any transaction, once commenced, will not be discontinued without notice.
Electronic distribution
A prospectus in electronic format may be made available on Internet sites or through other online services maintained by one or more of the underwriters and/or selling group members participating in this offering, or by their affiliates. In those cases, prospective investors may view offering terms online and, depending upon the particular underwriter or selling group member, prospective investors may be allowed to place orders online. The underwriters may agree with us to allocate a specific number of shares for sale to online brokerage account holders. Any such allocation for online distributions will be made by the Representatives on the same basis as other allocations.
Other than the prospectus in electronic format, the information on any underwriter’s or selling group member’s website and any information contained in any other website maintained by an underwriter or selling group member is not part of the prospectus or the registration statement of which this prospectus forms a part, has not been approved and/or endorsed by us or any underwriter or selling group member in its capacity as underwriter or selling group member and should not be relied upon by investors in deciding whether to purchase any shares of common stock.
Discretionary sales
The underwriters have informed us that they do not intend to confirm sales to discretionary accounts that exceed 5% of the total number of shares offered by them.
-161-
Table of Contents
Stamp taxes
If you purchase shares of common stock offered in this prospectus, you may be required to pay stamp taxes and other charges under the laws and practices of the country of purchase, in addition to the offering price listed on the cover page of this prospectus.
Directed share program
At our request, the underwriters have reserved percent of the shares of common stock to be issued by us and offered by this prospectus for sale, at the initial public offering price, to business associates, customers and related persons. If purchased by these persons, these shares will be subject to a 180-day lock-up restriction, subject to certain extensions. The number of shares of our common stock available for sale to the general public will be reduced to the extent these individuals purchase such reserved shares. Any reserved shares that are not so purchased will be offered by the underwriters to the general public on the same basis as the other shares offered by this prospectus. We have agreed to indemnify the underwriters against certain liabilities and expenses, including liabilities under the Securities Act, in connection with the sales of directed shares.
Relationships
The underwriters and certain of their respective affiliates are financial institutions engaged in various activities, which may include securities trading, commercial and investment banking, financial advisory, investment management, investment research, principal investment, hedging, financing and brokerage activities. Certain of the underwriters and their respective affiliates may in the future perform, investment banking and advisory services for us from time to time, for which they may in the future receive customary fees and expenses. The underwriters and their respective affiliates may, from time to time, engage in transactions with or perform services for us in the ordinary course of their business.
In the ordinary course of their various business activities, the underwriters and their respective affiliates may make or hold a broad array of investments and actively trade debt and equity securities (or related derivative securities) and financial instruments (including bank loans) for their own account and for the accounts of their customers, and such investment and securities activities may involve our securities and/or instruments. The underwriters and their respective affiliates may also make investment recommendations and/or publish or express independent research views in respect of such securities or instruments and may at any time hold, or recommend to clients that they acquire, long and/or short positions in such securities and instruments.
Selling restrictions
The common stock is being offered for sale in those jurisdictions in the United States, Europe and elsewhere where it is lawful to make such offers.
European economic area
In relation to each member state of the European Economic Area which has implemented the Prospectus Directive (each, a “Relevant Member State”), including each Relevant Member State that has implemented the 2010 PD Amending Directive with regard to persons to whom an offer
-162-
Table of Contents
of securities is addressed and the denomination per unit of the offer of securities (each, an “Early Implementing Member State”), with effect from and including the date on which the Prospectus Directive is implemented in that Relevant Member State (the “Relevant Implementation Date”), no offer of ordinary shares will be made to the public in that Relevant Member State (other than offers (the “Permitted Public Offers”) where a prospectus will be published in relation to the ordinary shares that has been approved by the competent authority in a Relevant Member State or, where appropriate, approved in another Relevant Member State and notified to the competent authority in that Relevant Member State, all in accordance with the Prospectus Directive), except that with effect from and including that Relevant Implementation Date, offers of ordinary shares may be made to the public in that Relevant Member State at any time:
| a) | to “qualified investors” as defined in the Prospectus Directive, including: |
| A. | (in the case of Relevant Member States other than Early Implementing Member States), legal entities which are authorized or regulated to operate in the financial markets or, if not so authorized or regulated, whose corporate purpose is solely to invest in securities, or any legal entity which has two or more of (i) an average of at least 250 employees during the last financial year; (ii) a total balance sheet of more than €43.0 million and (iii) an annual turnover of more than €50.0 million as shown in its last annual or consolidated accounts; or |
| B. | (in the case of Early Implementing Member States), persons or entities that are described in points (1) to (4) of Section I of Annex II to Directive 2004/39/EC, and those who are treated on request as professional clients in accordance with Annex II to Directive 2004/39/EC, or recognized as eligible counterparties in accordance with Article 24 of Directive 2004/39/EC unless they have requested that they be treated as nonprofessional clients; or |
| b) | to fewer than 100 (or, in the case of Early Implementing Member States, 150) natural or legal persons (other than “qualified investors” as defined in the Prospectus Directive), as permitted in the Prospectus Directive, subject to obtaining the prior consent of the representatives for any such offer; or |
| c) | in any other circumstances falling within Article 3(2) of the Prospectus Directive, |
provided that no such offer of ordinary shares shall result in a requirement for the publication of a prospectus pursuant to Article 3 of the Prospectus Directive or of a supplement to a prospectus pursuant to Article 16 of the Prospectus Directive.
Each person in a Relevant Member State (other than a Relevant Member State where there is a Permitted Public Offer) who initially acquires any ordinary shares or to whom any offer is made will be deemed to have represented, acknowledged and agreed that (A) it is a “qualified investor,” and (B) in the case of any ordinary shares acquired by it as a financial intermediary, as that term is used in Article 3(2) of the Prospectus Directive, (x) the ordinary shares acquired by it in the offering have not been acquired on behalf of, nor have they been acquired with a view to their offer or resale to, persons in any Relevant Member State other than “qualified investors” as defined in the Prospectus Directive, or in circumstances in which the prior consent of the Subscribers has been given to the offer or resale, or (y) where ordinary shares have been acquired by it on behalf of persons in any Relevant Member State other than “qualified investors” as defined in the Prospectus Directive, the offer of those ordinary shares to it is not treated under the Prospectus Directive as having been made to such persons.
-163-
Table of Contents
For the purpose of the above provisions, the expression “an offer to the public” in relation to any ordinary shares in any Relevant Member State means the communication in any form and by any means of sufficient information on the terms of the offer of any ordinary shares to be offered so as to enable an investor to decide to purchase any ordinary shares, as the same may be varied in the Relevant Member State by any measure implementing the Prospectus Directive in the Relevant Member State and the expression “Prospectus Directive” means Directive 2003/71 EC (including the 2010 PD Amending Directive, in the case of Early Implementing Member States) and includes any relevant implementing measure in each Relevant Member State and the expression “2010 PD Amending Directive” means Directive 2010/73/EU.
United Kingdom
This document is only being distributed to and is only directed at (i) persons who are outside the United Kingdom or (ii) investment professionals falling within Article 19(5) of the Financial Services and Markets Act 2000 (Financial Promotion) Order 2005, or the Order, or (iii) high net worth entities, and other persons to whom it may lawfully be communicated, falling within Article 49(2)(a) to (d) of the Order (all such persons together being referred to as “relevant persons”). The securities are only available to and any invitation, offer or agreement to subscribe purchase or otherwise acquire such securities will be enjoyed in only with relevant persons. Any person in the United Kingdom that is not a relevant person should not act or rely on this document or any of its contents.
Australia
This prospectus is not a formal disclosure document and has not been lodged with the Australian Securities and Investments Commission, or ASIC. It does not purport to contain all information that an investor or their professional advisers would expect to find in a prospectus for the purposes of Chapter 6D.2 of the Australian Corporations Act 2001, or the Act, in relation to the securities or our company.
This prospectus is not an offer to retail investors in Australia generally. Any offer of securities in Australia is made on the condition that the recipient is a “sophisticated investor” within the meaning of section 708(8) of the Act or a “professional investor” within the meaning of section 708(11) of the Act, or on condition that the offer to that recipient can be brought within the exemption for ‘Small-Scale Offerings’ (within the meaning of section 708(1) of the Act). If any recipient does not satisfy the criteria for these exemptions, no applications for securities will be accepted from that recipient. Any offer to a recipient in Australia any agreement arising from acceptance of the offer, is personal and may only he accepted by the recipient.
If a recipient on-sells their securities within 12 months of their issue, that person will be required to lodge a disclosure document with ASIC unless either:
| • | the sale is pursuant to an offer received outside Australia or is made to a “sophisticated investor” within the meaning of 708(8) of the Act or a “professional investor” within the meaning of section 708(11) of the Act; or |
| • | it can be established that our company issued, and the recipient subscribed for, the securities without the purpose of the recipient on-selling them or granting, issuing or transferring interests in, or options or warrants over them. |
-164-
Table of Contents
Dubai International Financial Centre
This prospectus relates to an Exempt Offer in accordance with the Offered Securities Rules of the Dubai Financial Services Authority, or DFSA. This prospectus is intended for distribution only to persons of a type specified in the Offered Securities Rules of the DFSA. It must not be delivered to, or relied on by, any other person. The DFSA has no responsibility for reviewing or verifying any documents in connection with Exempt Offers. The DFSA has not approved this prospectus nor taken steps to verify the information set forth herein and has no responsibility for the prospectus. The shares to which this prospectus relates may be illiquid and/or subject to restrictions on their resale. Prospective purchasers of the shares offered should conduct their own due diligence on the shares. If you do not understand the contents of this prospectus you should consult an authorized financial advisor.
Hong Kong
The shares may not be offered or sold by means of any document other than (i) in circumstances which do not constitute an offer to the public within the meaning of the Companies Ordinance (Cap. 32, Laws of Hong Kong), or (ii) to “professional investors” within the meaning of the Securities and Futures Ordinance (Cap. 571, Laws of Hong Kong) and any rules made thereunder, or (iii) in other circumstances which do not result in the document being a “prospectus” within the meaning of the Companies Ordinance (Cap. 32, Laws of Hong Kong) and no advertisement, invitation or document relating to the shares may be issued or may be in the possession of any person for the purpose of the issue (in each case whether in Hong Kong or elsewhere), which is directed at, or the contents of which are likely to be accessed or read by, the public in Hong Kong (except if permitted to do so under the laws of Hong Kong) other than with respect to shares which are or are intended to be disposed of only to persons outside Hong Kong or only to “professional investors” within the meaning of the Securities and Futures Ordinance (Cap. 571, Laws of Hong Kong) or any rules made thereunder.
India
This prospectus has not been and will not be registered as a prospectus with the Registrar of Companies in India. This prospectus or any other material relating to these securities may not be circulated or distributed, directly or indirectly, to the public or any members of the public in India. Further, persons into whose possession this prospectus comes are required to inform themselves about and to observe any such restrictions. Each prospective investor is advised to consult its advisors about the particular consequences to it of an investment in these securities. Each prospective investor is also advised that any investment in these securities by it is subject to the regulations prescribed by the Reserve Bank of India and the Foreign Exchange Management Act and any regulations framed thereunder.
Japan
No registration has been made under Article 4, Paragraph 1 of the Financial Instruments and Exchange Law of Japan (Law No. 25 of 1948, as amended), which we refer to as the FIEL, in relation to the offering of the shares. The shares are being offered in a private placement to up to 49 investors under Article 2, Paragraph 3, Item 2 iii of the FIEL.
-165-
Table of Contents
Korea
Our securities may not be offered, sold and delivered directly or indirectly, or offered or sold to any person for reoffering or resale, directly or indirectly, in Korea or to any resident of Korea except pursuant to the applicable laws and regulations of Korea, including the Securities and Exchange Act and the Foreign Exchange Transaction Law and the decrees and regulations thereunder. Our securities have not been registered with the Financial Supervisory Commission of Korea for public offering in Korea. Furthermore, our securities may not be resold to Korean residents unless the purchaser of our securities complies with all applicable regulatory requirements (including but not limited to government approval requirements under the Foreign Exchange Transaction Law and its subordinate decrees and regulations) in connection with the purchase of our securities.
Singapore
This prospectus has not been registered as a prospectus with the Monetary Authority of Singapore. Accordingly, this prospectus and any other document or material in connection with the offer or sale, or invitation for subscription or purchase, of the shares may not be circulated or distributed, nor may the shares be offered or sold, or be made the subject of an invitation for subscription or purchase, whether directly or indirectly, to persons in Singapore other than (i) to an institutional investor under Section 274 of the Securities and Futures Act, Chapter 289 of Singapore, or SFA, (ii) to a relevant person, or any person pursuant to Section 275 (1A), and in accordance with the conditions, specified in Section 275 of the SFA or (iii) otherwise pursuant to, and in accordance with the conditions of, any other applicable provision of the SFA.
Where the shares are subscribed or purchased under Section 275 by a relevant person which is: (a) a corporation (which is not an accredited investor) the sole business of which is to hold investments and the entire share capital of which is owned by one or more individuals, each of whom is an accredited investor; or (b) a trust (where the trustee is not an accredited investor) whose sole whole purpose is to hold investments and each beneficiary is an accredited investor, shares, debentures and units of shares and debentures of that corporation or the beneficiaries’ rights and interest in that trust shall not be transferable for six months after that corporation or that trust has acquired the shares under Section 275 except: (i) to an institutional investor under Section 274 of the SFA or to a relevant person, or any person pursuant to Section 275 (1A), and in accordance with the conditions, specified in Section 275 of the SFA; (ii) where no consideration is given for the transfer; or (iii) by operation of law.
By accepting this prospectus, the recipient hereof represents and warrants that he is entitled to receive it in accordance with the restrictions set forth above and agrees to be bound by limitations contained herein. Any failure to comply with these limitations may constitute a violation of law.
Switzerland
The shares may not be publicly offered in Switzerland and will not be listed on the SIX Swiss Exchange, or SIX or on any other stock exchange or regulated trading facility in Switzerland. This document has been prepared without regard to the disclosure standards for issuance prospectuses under art. 652a or art. 1156 of the Swiss Code of Obligations or the disclosure standards for listing prospectuses under art. 27 ff. of the SIX Listing Rules or the listing rules of
-166-
Table of Contents
any other stock exchange or regulated trading facility in Switzerland. Neither this document nor any other offering or marketing material relating to the shares or the offering may be publicly distributed or otherwise made publicly available in Switzerland.
Neither this document nor any other offering or marketing material relating to the offering, the Company, the shares have been or will be filed with or approved by any Swiss regulatory authority. In particular, this document will not be filed with, and the offer of shares will not be supervised by, the Swiss Financial Market Supervisory Authority FINMA (FINMA), and the offer of shares has not been and will not be authorized under the Swiss Federal Act on Collective Investment Schemes, or CISA. The investor protection afforded to acquirers of interests in collective investment schemes under the CISA does not extend to acquirers of shares.
-167-
Table of Contents
The financial statements as of January 29, 2011 and January 30, 2010, and for each of the three fiscal years in the period ended January 29, 2011, included in this Prospectus have been so included in reliance on the report of PricewaterhouseCoopers LLP, an independent registered public accounting firm, given on the authority of said firm as experts in auditing and accounting.
The validity of the shares of common stock offered hereby has been passed upon for us by Wilson Sonsini Goodrich & Rosati, Professional Corporation, Palo Alto, California. Certain members of, and investment entities comprised of members of, and persons associated with, Wilson Sonsini Goodrich & Rosati, Professional Corporation own or control approximately 0.13% of the shares of our common stock, assuming the conversion of all outstanding convertible preferred stock. Davis Polk & Wardwell LLP, Menlo Park, California is representing the underwriters of this offering.
Where you can find more information
We have filed with the SEC a registration statement on Form S-1 under the Securities Act with respect to the shares of common stock we are offering. The registration statement, including the attached exhibits and schedules, contains additional relevant information about us and our common stock. This prospectus does not contain all of the information set forth in the registration statement and the exhibits and schedules thereto. The rules and regulations of the SEC allow us to omit from this prospectus certain information included in the registration statement.
For further information about us and our common stock, you may inspect a copy of the registration statement and the exhibits and schedules to the registration statement without charge at the offices of the SEC at 100 F Street, N.E., Washington D.C. 20549. You may obtain copies of all or any part of the registration statement from the Public Reference Section of the SEC, 100 F Street, N.E., Washington D.C. 20549 upon the payment of the prescribed fees. You may obtain information on the operation of the Public Reference Room by calling the SEC at 1-800-SEC-0330. The SEC maintains a website at www.sec.gov that contains reports, proxy and information statements and other information regarding registrants like us that file electronically with the SEC. You can also inspect our registration statement on this website.
Upon completion of this offering, we will become subject to the reporting and information requirements of the Securities Exchange Act of 1934, as amended, and we will file reports, proxy statements and other information with the SEC.
-168-
Table of Contents
Index to consolidated financial statements
| F-2 | ||||
| F-3 | ||||
| F-4 | ||||
| F-5 | ||||
| Consolidated Statements of Convertible Preferred Stock and Stockholders’ Deficit |
F-6 | |||
| F-7 |
F-1
Table of Contents
Report of independent registered public accounting firm
To Board of Directors and Stockholders of
BlueArc Corporation:
In our opinion, the accompanying consolidated balance sheets and the related consolidated statements of operations, of cash flows and of convertible preferred stock and stockholders’ deficit, present fairly, in all material respects, the financial position of BlueArc Corporation and its subsidiaries at January 29, 2011 and January 30, 2010, and the results of their operations and their cash flows for each of the three years in the period ended January 29, 2011 in conformity with accounting principles generally accepted in the United States of America. These financial statements are the responsibility of the Company’s management. Our responsibility is to express an opinion on these financial statements based on our audits. We conducted our audits of these statements in accordance with the standards of the Public Company Accounting Oversight Board (United States). Those standards require that we plan and perform the audit to obtain reasonable assurance about whether the financial statements are free of material misstatement. An audit includes examining, on a test basis, evidence supporting the amounts and disclosures in the financial statements, assessing the accounting principles used and significant estimates made by management, and evaluating the overall financial statement presentation. We believe that our audits provide a reasonable basis for our opinion.
/s/ PricewaterhouseCoopers LLP
San Jose, California
June 23, 2011
F-2
Table of Contents
Consolidated balance sheets
(in thousands, except per share data)
| January 30, 2010 |
January 29, 2011 |
April 30, 2011 |
Pro forma stockholders equity as of April 30, 2011 |
|||||||||||||
|
|
||||||||||||||||
| (unaudited) | ||||||||||||||||
| ASSETS |
||||||||||||||||
| CURRENT ASSETS: |
||||||||||||||||
| Cash and cash equivalents |
$ | 10,711 | $ | 15,971 | $ | 16,084 | ||||||||||
| Accounts receivable, net of allowance of $241, $140 and $132 as of January 30, 2010, January 29, 2011 and April 30, 2011 (unaudited) |
11,057 | 20,580 | 19,638 | |||||||||||||
| Inventory |
7,768 | 8,050 | 9,770 | |||||||||||||
| Prepaid expenses and other current assets |
3,133 | 3,328 | 4,232 | |||||||||||||
|
|
|
|
|
|
|
|||||||||||
| Total current assets |
32,669 | 47,929 | 49,724 | |||||||||||||
| Property and equipment, net |
4,120 | 5,551 | 6,223 | |||||||||||||
| Other assets |
1,434 | 1,602 | 1,699 | |||||||||||||
|
|
|
|
|
|
|
|||||||||||
| TOTAL ASSETS |
$ | 38,223 | $ | 55,082 | $ | 57,646 | ||||||||||
|
|
|
|
|
|
|
|||||||||||
| LIABILITIES, CONVERTIBLE PREFERRED STOCK AND STOCKHOLDERS’ EQUITY (DEFICIT) |
||||||||||||||||
| CURRENT LIABILITIES: |
||||||||||||||||
| Accounts payable |
$ | 5,466 | $ | 8,426 | $ | 12,326 | ||||||||||
| Accrued compensation |
3,433 | 3,604 | 3,716 | |||||||||||||
| Other accrued liabilities |
2,565 | 2,231 | 1,980 | |||||||||||||
| Customer deposits |
2,275 | 960 | 632 | |||||||||||||
| Warranty liability, current portion |
1,628 | 1,954 | 2,004 | |||||||||||||
| Long-term debt, current portion |
2,728 | 502 | 1,269 | |||||||||||||
| Deferred revenue, current portion |
9,133 | 10,566 | 11,675 | |||||||||||||
| Warrants liability |
1,315 | 1,970 | 3,935 | $ | 333 | |||||||||||
|
|
|
|
|
|
|
|||||||||||
| Total current liabilities |
28,543 | 30,213 | 37,537 | |||||||||||||
| Deferred revenue, net of current portion |
4,020 | 3,982 | 3,449 | |||||||||||||
| Long-term debt, net of current portion |
4,773 | 6,695 | 6,212 | |||||||||||||
| Warranty liability, net of current portion |
354 | 453 | 453 | |||||||||||||
| Other liabilities |
253 | 338 | 371 | |||||||||||||
|
|
|
|
|
|
|
|||||||||||
| Total liabilities |
37,943 | 41,681 | 48,022 | |||||||||||||
|
|
|
|
|
|
|
|||||||||||
| Commitments and contingencies (Note 5) |
||||||||||||||||
| Convertible preferred stock, par value $0.001 per share—33,962, 52,566 and 52,566 shares authorized as of January 30, 2010, January 29, 2011 and April 30, 2011 (unaudited), 28,935, 36,451 and 36,451 shares issued and outstanding as of January 30, 2010, January 29, 2011 and April 30, 2011 (unaudited) (aggregate liquidation value of $136,600 as of January 29, 2011 and April 30, 2011 (unaudited)), actual; no shares issued and outstanding, pro forma (unaudited) |
102,617 | 121,699 | 121,699 | — | ||||||||||||
| STOCKHOLDERS’ EQUITY (DEFICIT): |
||||||||||||||||
| Common stock, par value $0.001 per share—55,045, 50,540 and 50,540 shares authorized as of January 30, 2010, January 29, 2011 and April 30, 2011 (unaudited), 2,449, 3,389 and 3,512 shares issued and outstanding as of January 30, 2010, January 29, 2011, April 30, 2011 (unaudited), actual; 43,331 shares issued and outstanding, pro forma (unaudited) |
2 | 3 | 3 | 43 | ||||||||||||
| Additional paid-in capital |
113,263 | 116,724 | 117,091 | 242,352 | ||||||||||||
| Accumulated other comprehensive income |
906 | 908 | 1,093 | 1,093 | ||||||||||||
| Accumulated deficit |
(216,508 | ) | (225,933 | ) | (230,262 | ) | (230,262 | ) | ||||||||
|
|
|
|
|
|
|
|
|
|||||||||
| Total stockholders’ equity (deficit) |
(102,337 | ) | (108,298 | ) | (112,075 | ) | $ | 13,226 | ||||||||
|
|
|
|
|
|
|
|
|
|||||||||
| TOTAL LIABILITIES, CONVERTIBLE PREFERRED STOCK AND STOCKHOLDERS’ EQUITY (DEFICIT) |
$ | 38,223 | $ | 55,082 | $ | 57,646 | ||||||||||
|
|
|
|
|
|
|
|||||||||||
The accompanying notes are an integral part of these consolidated financial statements.
F-3
Table of Contents
Consolidated statements of operations
(in thousands, except per share data)
| Year ended | Three months ended | |||||||||||||||||||
| January 31, 2009 |
January 30, 2010 |
January 29, 2011 |
May 1, 2010 |
April 30, 2011 |
||||||||||||||||
|
|
||||||||||||||||||||
| (unaudited) | ||||||||||||||||||||
| Product revenue |
$ | 59,864 | $ | 49,523 | $ | 66,550 | $ | 14,103 | $ | 19,596 | ||||||||||
| Support revenue |
14,366 | 16,352 | 19,039 | 4,511 | 5,116 | |||||||||||||||
|
|
|
|
|
|
|
|
|
|
|
|||||||||||
| Total revenue |
74,230 | 65,875 | 85,589 | 18,614 | 24,712 | |||||||||||||||
| Cost of product revenue |
32,179 | 29,709 | 34,627 | 7,546 | 9,938 | |||||||||||||||
| Cost of support revenue |
3,483 | 4,570 | 6,184 | 1,395 | 1,815 | |||||||||||||||
|
|
|
|
|
|
|
|
|
|
|
|||||||||||
| Total cost of revenue |
35,662 | 34,279 | 40,811 | 8,941 | 11,753 | |||||||||||||||
|
|
|
|
|
|
|
|
|
|
|
|||||||||||
| Gross profit |
38,568 | 31,596 | 44,778 | 9,673 | 12,959 | |||||||||||||||
|
|
|
|
|
|
|
|
|
|
|
|||||||||||
| Sales and marketing |
33,759 | 28,540 | 32,068 | 7,868 | 9,327 | |||||||||||||||
| Research and development |
18,274 | 13,783 | 16,410 | 3,775 | 4,966 | |||||||||||||||
| General and administrative |
5,659 | 4,868 | 5,277 | 1,464 | 1,614 | |||||||||||||||
|
|
|
|
|
|
|
|
|
|
|
|||||||||||
| Total operating expenses |
57,692 | 47,191 | 53,755 | 13,107 | 15,907 | |||||||||||||||
|
|
|
|
|
|
|
|
|
|
|
|||||||||||
| Loss from operations |
(19,124 | ) | (15,595 | ) | (8,977 | ) | (3,434 | ) | (2,948 | ) | ||||||||||
| Interest income |
260 | 24 | 15 | — | 2 | |||||||||||||||
| Interest expense |
(237 | ) | (1,065 | ) | (1,317 | ) | (339 | ) | (284 | ) | ||||||||||
| Other expense, net |
(1,359 | ) | (389 | ) | (566 | ) | (136 | ) | (1,552 | ) | ||||||||||
|
|
|
|
|
|
|
|
|
|
|
|||||||||||
| Loss before income taxes |
(20,460 | ) | (17,025 | ) | (10,845 | ) | (3,909 | ) | (4,782 | ) | ||||||||||
| Benefit from income taxes |
882 | 1,272 | 1,420 | 324 | 453 | |||||||||||||||
|
|
|
|
|
|
|
|
|
|
|
|||||||||||
| Net loss |
$ | (19,578 | ) | $ | (15,753 | ) | $ | (9,425 | ) | $ | (3,585 | ) | $ | (4,329 | ) | |||||
|
|
|
|
|
|
|
|
|
|
|
|||||||||||
| Deemed dividend on exchange of preferred stock |
— | — | (940 | ) | — | — | ||||||||||||||
| Net loss attributable to common stockholders |
$ | (19,578 | ) | $ | (15,753 | ) | $ | (10,365 | ) | $ | (3,585 | ) | $ | (4,329 | ) | |||||
|
|
|
|
|
|
|
|
|
|
|
|||||||||||
| Net loss per share attributable to common stockholders, basic and diluted |
$ | (8.74 | ) | $ | (6.55 | ) | $ | (3.54 | ) | $ | (1.47 | ) | $ | (1.25 | ) | |||||
|
|
|
|
|
|
|
|
|
|
|
|||||||||||
| Shares used in computing net loss per share attributable to common stockholders, basic and diluted |
2,241 | 2,404 | 2,930 | 2,438 | 3,465 | |||||||||||||||
|
|
|
|
|
|
|
|
|
|
|
|||||||||||
| Pro forma net loss per share, basic and diluted (unaudited) |
$ | (0.24 | ) | $ | (0.06 | ) | ||||||||||||||
|
|
|
|
|
|||||||||||||||||
| Shares used in computing pro forma net loss per share attributable to common stockholders, basic and diluted (unaudited) |
39,363 | 43,284 | ||||||||||||||||||
|
|
|
|
|
|||||||||||||||||
The accompanying notes are an integral part of these consolidated financial statements.
F-4
Table of Contents
Consolidated statements of cash flows
(in thousands)
| Year ended | Three months ended | |||||||||||||||||||
| January 31, 2009 |
January 30, 2010 |
January 29, 2011 |
May 1, 2010 |
April 30, 2011 |
||||||||||||||||
|
|
||||||||||||||||||||
| (unaudited) | ||||||||||||||||||||
| CASH FLOWS FROM OPERATING ACTIVITIES |
||||||||||||||||||||
| Net loss |
$ | (19,578 | ) | $ | (15,753 | ) | $ | (9,425 | ) | $ | (3,585 | ) | $ | (4,329 | ) | |||||
| Adjustments to reconcile net loss to net cash provided by (used in) operating activities: |
||||||||||||||||||||
| Depreciation and amortization |
3,031 | 3,447 | 2,714 | 641 | 801 | |||||||||||||||
| Loss on disposal of property and equipment |
— | 28 | 68 | — | 12 | |||||||||||||||
| Provision for (recovery of) bad debts |
132 | 109 | 60 | (9 | ) | (4 | ) | |||||||||||||
| Provision for inventory |
1,548 | 1,985 | 947 | (99 | ) | 541 | ||||||||||||||
| Stock-based compensation expense |
1,218 | 1,409 | 1,117 | 279 | 321 | |||||||||||||||
| Remeasurement of fair value of warrants liability |
(134 | ) | 372 | (59 | ) | (63 | ) | 1,965 | ||||||||||||
| Noncash issuance of warrants |
401 | — | 736 | 222 | — | |||||||||||||||
| Accrued interest on convertible promissory notes |
— | — | 82 | 38 | — | |||||||||||||||
| Amortization of debt discount |
— | 167 | 208 | 51 | 50 | |||||||||||||||
| Changes in operating assets and liabilities: |
||||||||||||||||||||
| Accounts receivable |
2,203 | 4,551 | (9,583 | ) | (358 | ) | 947 | |||||||||||||
| Inventory |
(4,317 | ) | 87 | (1,232 | ) | 492 | (2,261 | ) | ||||||||||||
| Prepaid expenses, other current assets and other assets |
(59 | ) | (1,173 | ) | (135 | ) | 115 | (386 | ) | |||||||||||
| Research and development credit |
2,391 | (670 | ) | (260 | ) | (440 | ) | (562 | ) | |||||||||||
| Accounts payable |
(3,583 | ) | 555 | 2,785 | 1,354 | 3,929 | ||||||||||||||
| Accrued compensation |
(328 | ) | 249 | 178 | 11 | 123 | ||||||||||||||
| Other accrued liabilities |
1,225 | (1,450 | ) | (341 | ) | (518 | ) | (247 | ) | |||||||||||
| Warranty liability |
55 | 309 | 425 | 4 | 50 | |||||||||||||||
| Customer deposits |
— | 2,157 | (1,315 | ) | 1,390 | (328 | ) | |||||||||||||
| Other liabilities |
244 | (523 | ) | 98 | 29 | 36 | ||||||||||||||
| Deferred revenue |
1,492 | 1,680 | 1,403 | (34 | ) | 589 | ||||||||||||||
|
|
|
|
|
|
|
|
|
|
|
|||||||||||
| Net cash provided by (used in) operating activities |
(14,059 | ) | (2,464 | ) | (11,529 | ) | (479 | ) | 1,247 | |||||||||||
|
|
|
|
|
|
|
|
|
|
|
|||||||||||
| CASH FLOWS FROM INVESTING ACTIVITIES |
||||||||||||||||||||
| Capital expenditures |
(2,833 | ) | (2,013 | ) | (3,920 | ) | (1,007 | ) | (1,118 | ) | ||||||||||
|
|
|
|
|
|
|
|
|
|
|
|||||||||||
| Net cash used in investing activities |
(2,833 | ) | (2,013 | ) | (3,920 | ) | (1,007 | ) | (1,118 | ) | ||||||||||
|
|
|
|
|
|
|
|
|
|
|
|||||||||||
| CASH FLOWS FROM FINANCING ACTIVITIES |
||||||||||||||||||||
| Repayment of line of credit |
(1,393 | ) | (6,000 | ) | — | — | — | |||||||||||||
| Proceeds from issuance of convertible promissory notes |
6,695 | — | 2,702 | 2,702 | — | |||||||||||||||
| Proceeds from issuance of loan |
— | 7,500 | — | — | — | |||||||||||||||
| Payment on capital lease obligations |
— | (118 | ) | (232 | ) | (54 | ) | (64 | ) | |||||||||||
| Proceeds from issuance of convertible preferred stock, net |
16,411 | — | 18,182 | — | — | |||||||||||||||
| Proceeds from issuance of common stock |
6 | 1 | 30 | 5 | 42 | |||||||||||||||
|
|
|
|
|
|
|
|
|
|
|
|||||||||||
| Net cash provided by (used in) financing activities |
21,719 | 1,383 | 20,682 | 2,653 | (22 | ) | ||||||||||||||
|
|
|
|
|
|
|
|
|
|
|
|||||||||||
| NET INCREASE (DECREASE) IN CASH AND CASH EQUIVALENTS |
4,827 | (3,094 | ) | 5,233 | 1,167 | 107 | ||||||||||||||
| Effect of exchange rate changes on cash and cash equivalents |
— | — | 27 | — | 6 | |||||||||||||||
| Cash and cash equivalents as of beginning of period |
8,978 | 13,805 | 10,711 | 10,711 | 15,971 | |||||||||||||||
|
|
|
|
|
|
|
|
|
|
|
|||||||||||
| CASH AND CASH EQUIVALENTS AS OF END OF PERIOD |
$ | 13,805 | $ | 10,711 | $ | 15,971 | $ | 11,878 | $ | 16,084 | ||||||||||
|
|
|
|
|
|
|
|
|
|
|
|||||||||||
| SUPPLEMENTAL CASH FLOW DISCLOSURE: |
||||||||||||||||||||
| Cash paid for interest |
$ | 237 | $ | 776 | $ | 906 | $ | 218 | $ | 206 | ||||||||||
| Cash paid for taxes |
$ | — | $ | — | $ | 71 | $ | 17 | $ | 31 | ||||||||||
| Cash received for research and development tax credit |
$ | 3,411 | $ | 698 | $ | 1,419 | $ | — | $ | — | ||||||||||
| NONCASH INVESTING AND FINANCING ACTIVITIES: |
||||||||||||||||||||
| Deemed dividends on preferred stock |
$ | — | $ | — | $ | (940 | ) | $ | — | $ | — | |||||||||
| Issuance of preferred and common stock warrants |
$ | — | $ | 677 | $ | 407 | $ | — | $ | — | ||||||||||
| Reclassification of common stock warrants from liability to equity |
$ | — | $ | — | $ | (208 | ) | $ | — | $ | — | |||||||||
| Conversion of convertible promissory notes into convertible preferred stock |
$ | 6,695 | $ | — | $ | 2,702 | $ | — | $ | — | ||||||||||
| Property and equipment acquired under capital leases |
$ | 21 | $ | — | $ | 130 | $ | 130 | $ | 297 | ||||||||||
| Property and equipment in accounts payable and other current liabilities |
$ | 73 | $ | 150 | $ | 329 | $ | 299 | $ | 309 | ||||||||||
|
|
||||||||||||||||||||
The accompanying notes are an integral part of these consolidated financial statements.
F-5
Table of Contents
Consolidated statements of convertible
preferred stock and stockholders’ deficit
(in thousands)
| Convertible preferred stock |
Common stock | Addi- tional paid-in |
Accu- mulated hensive income |
Accu- mulated deficit |
Total holders’ deficit |
|||||||||||||||||||||||||||||
| Shares | Amount | Shares | Amount | |||||||||||||||||||||||||||||||
|
|
||||||||||||||||||||||||||||||||||
| Balances as of January 31, 2008 |
23,794 | $ | 79,510 | 2,499 | $ | 2 | $ | 110,522 | $ | 1,499 | $ | (181,177 | ) | $ | (69,154 | ) | ||||||||||||||||||
| Exercise of vested stock options |
— | — | 13 | — | 6 | — | — | 6 | ||||||||||||||||||||||||||
| Vesting of shares exercised prior to vesting |
— | — | — | — | 73 | — | — | 73 | ||||||||||||||||||||||||||
| Repurchase of common stock |
— | — | (68 | ) | — | — | — | — | — | |||||||||||||||||||||||||
| Issuance of restricted stock |
— | — | 6 | — | — | — | — | — | ||||||||||||||||||||||||||
| Stock-based compensation expense |
— | — | — | — | 1,193 | — | — | 1,193 | ||||||||||||||||||||||||||
| Nonemployee stock-based compensation expense |
— | — | — | — | 25 | — | — | 25 | ||||||||||||||||||||||||||
| Issuance of Series FF convertible preferred stock (net of issuance costs of $68) |
5,141 | 23,107 | — | — | — | — | — | — | ||||||||||||||||||||||||||
| Comprehensive loss: |
||||||||||||||||||||||||||||||||||
| Foreign currency translation adjustment |
— | — | — | — | — | (710 | ) | — | (710 | ) | ||||||||||||||||||||||||
| Net loss |
— | — | — | — | — | — | (19,578 | ) | (19,578 | ) | ||||||||||||||||||||||||
|
|
|
|||||||||||||||||||||||||||||||||
| Total comprehensive loss |
— | — | — | — | — | — | — | (20,288 | ) | |||||||||||||||||||||||||
|
|
|
|
|
|
|
|
|
|
|
|
|
|
|
|
|
|||||||||||||||||||
| Balances as of January 31, 2009 |
28,935 | 102,617 | 2,450 | 2 | 111,819 | 789 | (200,755 | ) | (88,145 | ) | ||||||||||||||||||||||||
| Exercise of vested stock options |
— | — | 1 | — | 1 | — | — | 1 | ||||||||||||||||||||||||||
| Vesting of shares exercised prior to vesting |
— | — | — | — | 34 | — | — | 34 | ||||||||||||||||||||||||||
| Repurchase of common stock and shares surrendered by investors |
— | — | (2 | ) | — | — | — | — | — | |||||||||||||||||||||||||
| Stock-based compensation expense |
— | — | — | — | 1,405 | — | — | 1,405 | ||||||||||||||||||||||||||
| Nonemployee stock-based compensation expense |
— | — | — | — | 4 | — | — | 4 | ||||||||||||||||||||||||||
| Comprehensive income (loss): |
||||||||||||||||||||||||||||||||||
| Foreign currency translation adjustment |
— | — | — | — | — | 117 | — | 117 | ||||||||||||||||||||||||||
| Net loss |
— | — | — | — | — | — | (15,753 | ) | (15,753 | ) | ||||||||||||||||||||||||
|
|
|
|||||||||||||||||||||||||||||||||
| Total comprehensive loss |
— | — | — | — | — | — | — | (15,636 | ) | |||||||||||||||||||||||||
|
|
|
|
|
|
|
|
|
|
|
|
|
|
|
|
|
|||||||||||||||||||
| Balances as of January 30, 2010 |
28,935 | 102,617 | 2,449 | 2 | 113,263 | 906 | (216,508 | ) | (102,337 | ) | ||||||||||||||||||||||||
| Exercise of vested stock options |
— | — | 115 | — | 30 | — | — | 30 | ||||||||||||||||||||||||||
| Vesting of shares exercised prior to vesting |
— | — | — | — | 14 | — | — | 14 | ||||||||||||||||||||||||||
| Repurchase of common stock |
— | (1 | ) | — | — | — | — | — | ||||||||||||||||||||||||||
| Stock-based compensation expense |
— | — | — | — | 1,108 | — | — | 1,108 | ||||||||||||||||||||||||||
| Nonemployee stock-based compensation expense |
— | — | — | — | 9 | — | — | 9 | ||||||||||||||||||||||||||
| Issuance of common stock warrants |
— | — | — | — | 220 | — | — | 220 | ||||||||||||||||||||||||||
| Reclassification of common stock warrants from liabilities |
— | — | — | — | 208 | — | — | 208 | ||||||||||||||||||||||||||
| Issuance of Series GG convertible preferred stock (net of issuance costs of $142) |
8,342 | 20,955 | — | — | — | — | — | — | ||||||||||||||||||||||||||
| Conversion of convertible preferred stock into other series of convertible preferred and into common stock (recapitalization) |
(826 | ) | (1,873 | ) | 826 | 1 | 1,872 | — | — | 1,873 | ||||||||||||||||||||||||
| Comprehensive income (loss): |
||||||||||||||||||||||||||||||||||
| Foreign currency translation adjustment |
— | — | — | — | — | 2 | — | 2 | ||||||||||||||||||||||||||
| Net loss |
— | — | — | — | — | — | (9,425 | ) | (9,425 | ) | ||||||||||||||||||||||||
|
|
|
|||||||||||||||||||||||||||||||||
| Total comprehensive loss |
— | — | — | — | — | — | — | (9,423 | ) | |||||||||||||||||||||||||
|
|
|
|
|
|
|
|
|
|
|
|
|
|
|
|
|
|||||||||||||||||||
| Balances as of January 29, 2011 |
36,451 | 121,699 | 3,389 | 3 | 116,724 | 908 | (225,933 | ) | (108,298 | ) | ||||||||||||||||||||||||
| Exercise of vested stock options (unaudited) |
— | — | 76 | — | 42 | — | — | 42 | ||||||||||||||||||||||||||
| Vesting of shares exercised prior to vesting (unaudited) |
— | — | — | — | 4 | — | — | 4 | ||||||||||||||||||||||||||
| Issuance of restricted stock (unaudited) |
— | — | 47 | — | — | — | — | — | ||||||||||||||||||||||||||
| Stock-based compensation expense (unaudited) |
— | — | — | — | 304 | — | — | 304 | ||||||||||||||||||||||||||
| Nonemployee stock-based compensation expense (unaudited) |
— | — | — | — | 17 | — | — | 17 | ||||||||||||||||||||||||||
| Comprehensive income (loss): |
||||||||||||||||||||||||||||||||||
| Foreign currency translation adjustment (unaudited) |
— | — | — | — | — | 185 | — | 185 | ||||||||||||||||||||||||||
| Net loss (unaudited) |
— | — | — | — | — | — | (4,329 | ) | (4,329 | ) | ||||||||||||||||||||||||
|
|
|
|||||||||||||||||||||||||||||||||
| Total comprehensive loss (unaudited) |
— | — | — | — | — | — | — | (4,144 | ) | |||||||||||||||||||||||||
|
|
|
|
|
|
|
|
|
|
|
|
|
|
|
|
|
|||||||||||||||||||
| Balances as of April 30, 2011 (unaudited) |
36,451 | 121,699 | 3,512 | 3 | 117,091 | 1,093 | (230,262 | ) | (112,075 | ) | ||||||||||||||||||||||||
| Assumed conversion of convertible preferred stock (unaudited) |
(36,451 | ) | (121,699 | ) | 39,819 | 40 | 125,261 | — | — | 125,301 | ||||||||||||||||||||||||
|
|
|
|
|
|
|
|
|
|
|
|
|
|
|
|
|
|||||||||||||||||||
| Balances as of April 30, 2011, proforma (unaudited) |
$ | — | $ | — | 43,331 | $ | 43 | $ | 242,352 | $ | 1,093 | $ | (230,262 | ) | $ | 13,226 | ||||||||||||||||||
|
|
|
|
|
|
|
|
|
|
|
|
|
|
|
|
|
|||||||||||||||||||
The accompanying notes are an integral part of these consolidated financial statements.
F-6
Table of Contents
Notes to consolidated financial statements
1. Formation and business of the company
BlueArc Corporation, or BlueArc or the Company, was founded in 1998 in Bracknell, England. In 1999, the Company relocated its corporate headquarters to San Jose, California and incorporated as a Delaware corporation. The Company is a leading provider of high performance, highly scalable networked storage systems for businesses of all sizes. The Company operates in a single segment.
In these notes, the Company refers to the fiscal years ended January 31, 2009, January 30, 2010 and January 29, 2011 as fiscal 2009, fiscal 2010 and fiscal 2011, respectively, and the fiscal year ending January 28, 2012 as fiscal 2012. Effective February 1, 2009, the Company adopted fiscal year based on the 52 or 53 week period ending on the last Saturday in January. Each of fiscal 2010 and 2011 was, and fiscal 2012 will be, a 52-week fiscal year.
Since the Company’s inception, it has incurred significant losses and, as of April 30, 2011, it had an accumulated deficit of $230.3 million (unaudited). The Company has funded its operations primarily with customer payments for its products and services, proceeds from issuances of convertible preferred stock, borrowings under its long-term capital growth facility, the utilization of its accounts receivable credit line and the issuance of convertible promissory notes. From inception, the Company has sold an aggregate of $247 million of its convertible preferred stock, including the conversion of its convertible promissory notes. As of January 29, 2011, the Company had cash and cash equivalents of $16.0 million, an unutilized accounts receivable credit line of $12.5 million, $7.5 million of debt outstanding on its long-term capital growth facility, and capital and operating lease obligations. At April 30, 2011, the Company had cash and cash equivalents of $16.1 million (unaudited), an unutilized accounts receivable credit line of $12.5 million, $7.5 million of debt outstanding on its long-term capital growth facility, and capital and operating lease obligations. The Company had positive working capital of $17.7 million and $12.2 million (unaudited) as of January 29, 2011 and April 30, 2011, respectively.
The Company believes that its existing sources of liquidity and the proceeds of this offering will satisfy its working capital and capital requirements for at least the next 12 months. Failure to generate sufficient revenue, achieve planned gross margins, or control operating costs may require the Company to raise additional capital through equity or debt financing. Such additional financing may not be available on acceptable terms, or at all, and could require the Company to modify, delay or abandon some of its planned future expansion or expenditures or reduce some of its ongoing operating costs, which could have a material adverse effect on its business, operating results, financial condition and ability to achieve its intended business objectives. If the Company raises additional funds through further issuances of equity, convertible debt securities or other securities convertible into equity, its existing stockholders could suffer significant dilution in their percentage ownership of the Company and any new securities it issues could have rights, preferences and privileges senior to those of holders of its common stock. The Company’s accounts receivable based credit facility, which expires in December 2012, includes a material adverse change clause which allows the lender to withdraw any unutilized portion of the facility at the time of notification if certain triggering events per the agreement occur. In addition, the Company’s long-term capital growth facility is subject to interest-only payments through December 2011. However, if the Company does not meet certain performance criteria
F-7
Table of Contents
BlueArc Corporation
Notes to consolidated financial statements (continued)
tied to a measure of its quarterly earnings for quarters through October 29, 2011, repayment of principal via monthly installments will be accelerated and will commence in the month following the determination that the performance criteria have not been achieved.
Unaudited interim financial information
The accompanying interim consolidated balance sheet as of April 30, 2011, the interim consolidated statements of operations and cash flows for the three months ended May 1, 2010 and April 30, 2011 and the interim consolidated statement of convertible preferred stock and stockholders’ deficit for the three months ended April 30, 2011 are unaudited. The unaudited interim consolidated financial statements have been prepared on a basis consistent with the annual consolidated financial statements and, in the opinion of management, reflect all adjustments, which include only normal recurring adjustments, necessary to present fairly the Company’s consolidated financial position as of April 30, 2011 and its consolidated results of operations and cash flows for the three months ended May 1, 2010 and April 30, 2011. The financial data and the other financial information disclosed in these notes to the consolidated financial statements related to the three month periods are also unaudited. The consolidated results of operations during the three months ended April 30, 2011 are not necessarily indicative of the results to be expected during fiscal 2012 or for any other future annual or interim period.
Unaudited pro forma balance sheet
In the event that an initial public offering of the Company’s common stock, or IPO, is completed all shares of the Company’s outstanding convertible preferred stock will convert into common stock automatically, as further described in Note 8. In addition, the portion of the warrant liability related to shares of convertible preferred stock will be reclassified to additional paid-in capital as these warrants either expire upon an IPO or become common stock warrants that are classified as equity. The unaudited pro forma amounts as of April 30, 2011 give effect to the automatic conversion of convertible preferred stock into 39,819,237 shares of common stock and the related reclassification of the preferred stock warrant liability to additional paid-in capital, assuming that shares of the Company’s Series CC preferred stock convert on a 1 for 11.80684 basis and shares of the Company’s Series EE preferred stock convert on a 1 for 1.02268 basis. The pro forma amounts do not give effect to any proceeds from the IPO itself or the exercise of any outstanding warrants.
2. Summary of significant accounting policies
Basis of presentation
The consolidated financial statements include the accounts of BlueArc and its wholly owned subsidiaries. The consolidated financial statements are prepared in accordance with accounting principles generally accepted in the United States of America, or GAAP. All significant intercompany accounts and transactions have been eliminated.
F-8
Table of Contents
BlueArc Corporation
Notes to consolidated financial statements (continued)
Use of estimates
The preparation of financial statements in conformity with GAAP requires management to make judgments, estimates and assumptions that affect the reported amounts of assets and liabilities, the disclosure of contingent assets and liabilities at the date of the financial statements and the reported amounts of revenue and expense. These judgments, estimates and assumptions are used for, but not limited to: revenue recognition; accruals for warranty costs; inventory write-downs; the valuation of the Company’s convertible preferred stock, common stock and stock options; deferred income taxes including required valuation allowances; and the valuation of warrants to purchase convertible preferred stock and common stock. The Company bases its estimates and judgments on historical experience and on various other assumptions that it believes are reasonable under the circumstances. However, actual results could differ from these estimates, and these differences may be material.
Cash equivalents and short-term investments
All highly liquid investments with stated maturities of three months or less from the date of original purchase are classified as cash equivalents. As of January 30, 2010, January 29, 2011 and April 30, 2011, the Company had cash equivalents consisting of money market securities. The Company’s cash equivalents and short-term investments are classified as available-for-sale and stated at their fair values. Unrealized gains and losses on available-for-sale securities are included as a separate component of stockholders’ deficit. Realized gains and losses on available-for-sale securities are determined based on the specific identification of the cost of securities sold, and such gains and losses are reflected in the consolidated statements of operations as a component of interest income.
Fair value of financial instruments
Carrying amounts of certain of the Company’s financial instruments, including cash and cash equivalents, accounts receivable, accounts payable and accrued liabilities approximate fair values due to their short maturities. The carrying amounts of the warrants liability and foreign currency forward contracts represent their fair value. The carrying amount of long-term debt approximates its fair value based on borrowing rates currently available to the Company for loans with similar terms.
Fair value is defined as the price that would be received from selling an asset or paid to transfer a liability in an orderly transaction between market participants at the measurement date. When determining fair value, the Company considers the principal or most advantageous market in which the Company would transact, and takes into consideration the assumptions that market participants would use when pricing the asset or liability. The Company’s assessment of the significance of a particular input to the fair value measurement of an asset or liability requires management to make judgments and to consider specific characteristics of that asset or liability.
F-9
Table of Contents
BlueArc Corporation
Notes to consolidated financial statements (continued)
The current accounting guidance provides three levels of inputs that may be used to measure fair value, as follows:
Level 1—Unadjusted quoted prices in active markets for identical assets or liabilities.
Level 2—Observable inputs other than Level 1 prices, such as quoted prices for similar assets or liabilities, quoted prices in markets with insufficient volume or infrequent transactions (less active markets), or model-derived valuations in which all significant inputs are observable or can be derived principally from or corroborated with observable market data for substantially the full term of the assets or liabilities.
Level 3—Unobservable inputs to the valuation methodology that are significant to the measurement of the fair value of assets or liabilities.
In April 2009, the FASB issued guidance for estimating fair value when the level of market activity for an asset or liability has significantly decreased, which was effective for the Company in the first quarter of fiscal 2010. The adoption of this accounting standard did not have a material impact on the Company’s consolidated financial statements.
In January 2010, FASB revised the guidance for fair value measurements and disclosures by adding new disclosure requirements with respect to transfers in and out of Levels 1 and 2 fair value measurements, as well as by requiring gross basis disclosures for purchases, sales, issuances and settlements for Level 3 fair value measurements. This guidance also provides clarifications to existing disclosure requirements. The Company adopted this new guidance, including the guidance related to the disclosures about purchases, sales, issuances and settlements in the roll forwards of activity in Level 3 fair value measurements, beginning first quarter of our 2011 fiscal year. The adoption of this guidance did not have a material impact on our financial position or results of operations.
Concentrations of risk, significant customers and key suppliers
Most of the Company’s products are currently assembled and tested by a contract manufacturer, Sanmina-SCI, in the United States. The Company’s agreement with Sanmina-SCI has one-year automatic renewals of its term absent termination by either party for any reason by providing the other party with written notice at least 30 days prior to the expiration of each such one-year period. There are no long-term binding manufacturing agreements with this contractor. A significant disruption in the operations of this contractor may impact the production of the Company’s products for a substantial period of time, which could have a material adverse effect on the Company’s business, financial condition and results of operations. The Company’s agreement with Sanmina-SCI contains purchase commitment as discussed in Note 5. The Company incorporates disk arrays into its storage systems, which it sources from Engenio under a license agreement which was executed in November 2003. The Company’s agreement with Engenio had an initial term of two years and has one year automatic renewals. However, either party may terminate the agreement at any time and for any reason upon 30 days’ prior written notice. Engenio was recently acquired by NetApp. In the event that following its acquisition of Engenio, NetApp decides to terminate the agreement between Engenio and the Company, the
F-10
Table of Contents
BlueArc Corporation
Notes to consolidated financial statements (continued)
Company would be required to find and qualify other vendors to provide the components currently purchased by the Company under this agreement.
A significant portion of the Company’s research and development activities are conducted in the United Kingdom. Significant changes in exchange rates could substantially impact the Company’s results of operations.
Financial instruments that potentially subject the Company to credit risk consist of cash equivalents and accounts receivable. The Company maintains cash and cash equivalents with one financial institution, and these deposits may exceed amounts insured by the Federal Deposit Insurance Corporation. The Company performs both periodic evaluations of the risks associated with its investments and the relative credit standing of this financial institution.
The Company performs ongoing credit evaluations of its customers’ financial condition. The Company does not require collateral from its customers. The Company has not experienced significant credit losses to date.
For fiscal 2009, fiscal 2010 and fiscal 2011, Hitachi Data Systems Corporation, or HDS, accounted for 22%, 30% and 41% of the Company’s total revenues, respectively. HDS represented 32% of the Company’s outstanding accounts receivable as of January 29, 2011. For the three months ended April 30, 2011, HDS accounted for 45% of the Company’s revenue. HDS represented 27% of the Company’s outstanding accounts receivable as of April 30, 2011. See Note 7.
Accounts receivable and provision for doubtful accounts
Trade accounts receivables are recorded at invoiced amounts and do not bear interest. The Company generally does not require collateral and performs ongoing credit evaluations of its customers and provides an allowance for expected losses. The Company records a provision for doubtful accounts based on historical experience and a detailed assessment of the collectability of its accounts receivable. In estimating the allowance for doubtful accounts, management considers, among other factors: (i) the history of collections and the credit worthiness of each customer, (ii) the aging of accounts receivable balances relative to the payment terms for each customer, (iii) the Company’s historical write-offs and (iv) the economic conditions of the customer’s industry and general economic conditions. In cases where the Company is aware of circumstances that may impair a specific customer’s ability to meet its financial obligations, the Company records a specific allowance against amounts due from that customer, and thereby reduces the net recognized receivable to the amount the Company reasonably believes will be collected.
F-11
Table of Contents
BlueArc Corporation
Notes to consolidated financial statements (continued)
The following table presents changes in the allowance for doubtful accounts (in thousands):
| Year ended | Three months ended April 30, |
|||||||||||||||
| January 31, 2009 |
January 30, 2010 |
January 29, 2011 |
||||||||||||||
|
|
||||||||||||||||
| (unaudited) | ||||||||||||||||
| Allowance—beginning of period |
$ | — | $ | 132 | $ | 241 | $ | 140 | ||||||||
| Provisions for bad debts |
132 | 109 | 60 | — | ||||||||||||
| Write-off, net of recoveries and other adjustments |
— | — | (161 | ) | (8 | ) | ||||||||||
|
|
|
|
|
|
|
|
|
|||||||||
| Allowance—end of period |
$ | 132 | $ | 241 | $ | 140 | $ | 132 | ||||||||
|
|
|
|
|
|
|
|
|
|||||||||
Inventory
Inventories include the cost of materials, labor and related manufacturing overhead and are adjusted to approximate the lower of cost or market value. Raw materials consist principally of system components, and finished goods are comprised of assembled systems. The Company uses the weighted-average cost method to value its inventory which approximates the first-in, first-out method. The Company writes down inventory to market if lower than cost, based on current inventory levels, projected realizable values and product demand, expected product lives and technological obsolescence of the products or component parts.
Property and equipment
Property and equipment are stated at cost less accumulated depreciation and amortization. Depreciation and amortization expenses are included in cost of revenue, sales and marketing, research and development, and general and administrative expenses. Shared property and equipment, such as facility related equipment, is allocated to departments based on headcount. Depreciation is computed using the straight-line method over the estimated useful lives of the assets. An estimated useful life of three years is used for machinery and equipment, computer equipment and software. An estimated useful life of five years is used for furniture and fixtures. Leasehold improvements are amortized using the straight-line method over the shorter of five years, which is the estimated useful life of the leasehold improvements, or the remaining term of the lease.
Assets held under capital leases are recorded at the lower of the net present value of the minimum lease payments or the fair value of the leased assets at the inception of the lease. Amortization expense is computed using the straight-line method over the shorter of the estimated useful lives of the assets or the period of the related lease. Amortization of assets under capital leases is included in depreciation expense.
Impairment of long-lived assets
The Company evaluates long-lived assets, such as property and equipment, for impairment whenever events or changes in circumstances indicate that the carrying value of an asset may not be recoverable. If indicators of impairment exist and the undiscounted future cash flows that the assets are expected to generate are less than the carrying value of the assets, the Company reduces the carrying amount of the assets to their estimated fair values based on a discounted
F-12
Table of Contents
BlueArc Corporation
Notes to consolidated financial statements (continued)
cash flow approach or, when available and appropriate, to comparable market values. No impairment losses were recorded during any of the periods presented in these financial statements.
Warrants to purchase convertible preferred stock and common stock
Freestanding warrants to purchase shares of the Company’s convertible preferred stock are classified as liabilities in the consolidated balance sheets and are carried at fair value, because the warrants may obligate the Company to transfer assets to the holders at a future date under certain circumstances, such as a change in control. The warrants are subject to remeasurement at each balance sheet date and any change in fair value is recognized as a component of other income (expense), net in the consolidated statements of operations. The Company estimates the fair value of these warrants at issuance and at each balance sheet date using the Black-Scholes option pricing model or a binomial model to the extent the warrants have antidilutive features.
The Company will continue to adjust the liability for changes in fair value of preferred stock warrants until the earlier of the exercise or expiration of the warrants, or until the completion of an IPO, at which time these preferred stock warrants will be converted into warrants to purchase common stock and, accordingly, the liability will be reclassified into additional paid-in capital.
The Company also issued warrants to purchase common stock that have certain exercise features not indexed to common stock (Notes 6 and 10). In particular, the number of shares subject to the warrant is subject to a one-time reduction if the Company does not meet certain performance criteria tied to a measure of quarterly earnings for quarters through October 29, 2011, as a result of which the principal on the note would also begin to amortize. The number of shares by which the warrant is reduced varies depending on the quarter in which the Company does not achieve the requisite level of earnings. This feature requires such warrants to be classified as liabilities and remeasured to fair value at each balance sheet date, with any change in fair value recognized as a component of other income (expense), net. The Company estimates the fair value of these warrants at issuance and at each balance sheet date using the Black-Scholes option pricing model adjusted for a potential reduction in the number of shares based on various probability-weighted outcomes. When the number of shares underlying the warrants is no longer subject to change, the then-current fair value of these warrants will be reclassified from a liability into additional paid-in capital.
The Company also issued other common stock warrants that are included in stockholders’ deficit. The fair value of these warrants is estimated at issuance using the Black-Scholes option pricing model and is not subject to subsequent remeasurement.
Revenue recognition
The Company recognizes revenue, net of sales tax, when persuasive evidence of an arrangement exists, delivery has occurred, the fee is fixed or determinable, and collection is probable. These criteria are usually met for hardware and software license elements when the system is shipped to the customer. For evaluation units, revenue is not recognized until receipt and acceptance of the customer’s purchase order requesting conversion of the unit into a sale. Support revenue is deferred and recognized ratably over the period during which the support is to be performed, which is typically from one to three years.
F-13
Table of Contents
BlueArc Corporation
Notes to consolidated financial statements (continued)
For channel partner sales, the Company evaluates whether fees are fixed or determinable by considering a number of factors, including payment terms, the channel partner’s credit standing and financial position, and the Company’s contractual relationship and past history with the particular channel partner. If the fees are not deemed to be fixed or determinable, the Company delays the shipment or, if product is shipped, defers recognition of revenue until there is persuasive evidence that fees are fixed or determinable and that collection is probable. Persuasive evidence may include copies of end customer purchase orders, cash payments or letters of credit guaranteeing cash payments, reports from channel partners documenting sell-through activity, data indicating an order has shipped to an end customer, or other similar information. The Company does not offer channel partners return rights, rebate, price protection or other similar rights.
Deferred revenue balances consist of deferred support revenue and deferred product revenue.
The Company’s storage systems are typically sold with multiple elements: hardware and perpetual software licenses for the embedded software and support services that entitle customers during the support services term to telephone support and unspecified software upgrades, bug fixes and patch releases, which are offered on a when-and-if-available basis. The Company’s hardware in its storage systems is integrated with software that is essential to the functionality of the equipment, except for certain optional software features, and more than incidental to the storage system as a whole. Accordingly, the Company applied the accounting standards for software revenue recognition for all transactions involving the sales of software and related services for all periods prior to January 30, 2011. For these fiscal years, the Company allocated revenue between delivered hardware and software elements and undelivered support services using the residual value method. Under the residual method the amount equal to the fair value of the undelivered support services, also known as vendor specific objective evidence, or VSOE, is deferred and amortized over the period when such services are provided and any remaining amounts are attributed to the delivered hardware and software elements and are recognized when those items are delivered. VSOE represents the price charged for a deliverable when it is sold separately.
The Company has established VSOE of fair value for its support services. For arrangements where support renewal rates are not contractually stated, fair value is established based on the pricing analysis of the Company’s actual stand alone support renewals. For arrangements with contractually stated support renewal rates, fair value of one year of support services is established by reference to the contractually stated renewal rates.
In October 2009, the Financial Accounting Standards Board, or FASB, issued an accounting standards update, which removes tangible products containing software components and non-software components that function together to deliver the product’s essential functionality from the scope of industry specific software revenue guidance. At the same time, FASB amended the accounting standard for multiple element revenue arrangements, which are not in the scope of industry specific software revenue recognition guidance, to provide updated guidance to separate the deliverables and to measure and allocate arrangement consideration to one or more units of accounting. The new guidance eliminates the use of the residual method and requires an
entity to allocate arrangement consideration at the inception of the arrangement to all
F-14
Table of Contents
BlueArc Corporation
Notes to consolidated financial statements (continued)
deliverables using the relative selling price method. In contrast to the residual method, this has the effect of allocating any inherent discount in a multiple element arrangement to each of the deliverables on a proportionate basis. The guidance also expands the disclosure requirements to require an entity to provide both qualitative and quantitative information about the significant judgments made in applying the revised guidance and subsequent changes in those judgments that may significantly affect the timing or amount of revenue recognition. The revised revenue recognition accounting standards are effective for revenue arrangements entered into or materially modified in fiscal years beginning on or after June 15, 2010.
The Company adopted the new revenue recognition guidance for arrangements with multiple deliverables on a prospective basis for new or modified arrangements entered on or after January 30, 2011. The Company now allocates arrangement consideration at the inception of the arrangement to all deliverables using the relative selling price method unless the amount allocated to delivered hardware and software elements exceeds the arrangement consideration that is not contingent upon delivery of support services. This method requires the Company to determine the selling price at which each deliverable could be sold if it were sold regularly on a standalone basis. Under this approach, the selling price of a deliverable is determined by using a selling price hierarchy which requires the use of VSOE of fair value if available, third party evidence, or TPE, if VSOE is not available, or estimated selling price, or ESP, if neither VSOE nor TPE is available. Since the Company generally does not have standalone sales of its hardware and software products, the use of VSOE is limited to support services. TPE of selling price is established by evaluating largely interchangeable competitor products or services in standalone sales to similarly situated customers. However, since the Company’s competitors do not generally sell tangible products and perpetual licenses on a standalone basis except for limited cases, no consistent pricing information is available. Therefore, the Company concluded that no reliable TPE is available for its products and services. The Company determines ESP by considering multiple factors including, but not limited to, market conditions, sales channels, internal costs and product margin objectives, and pricing practices. Due to the complexity of the Company’s product offerings, it determines the price in each transaction based on the pricing of competitive product offerings and that specific customer’s needs. The Company does not differentiate the pricing of its products based on market segments, sales channels or geography. Consistent with its overall pricing practices, the Company establishes one ESP for each deliverable for all customer segments.
The Company determines ESP for its tangible products, including tangible products requiring essential bundled software, based on its anticipated gross margin on hardware components and value added features relating to essential software. The Company’s estimate of gross margin is the highest for servers which have the highest value added element. In developing its estimate of gross margin the Company considers historical margin on standalone sales of tangible products as a result of customers either purchasing new systems or upgrading their existing systems as well as overall margin goals for its business. The Company estimates the value of the features relating to essential software by evaluating list prices for such software and historical discounts to list prices in its bundled arrangements as well as discounts to list prices in standalone sales of its optional software.
F-15
Table of Contents
BlueArc Corporation
Notes to consolidated financial statements (continued)
The Company determines the selling price for its support offerings based on VSOE of fair value.
The Company determines ESP for perpetual licenses relating to its optional software based on list prices adjusted for a discount which is estimated by considering historical discounts in standalone sales of its optional software. This approach is consistent with the Company’s current business practices since its list prices for software licenses are established with the objective of reflecting the relative value of such licenses compared to other deliverables while its historical discounts reflect customer and market specific pricing considerations. The Company further corroborates ESP for software licenses by comparing the pricing of its support as a percentage of software license ESP with pricing practices used in software industry.
The Company regularly reviews and updates its ESP information and obtains formal approval by appropriate levels of management.
The Company continues to account for optional software applications and related support services included in a multiple element arrangement under industry specific software revenue recognition guidance using the residual method. Revenue is first allocated to the nonsoftware deliverables and to the software deliverables as a group using the relative selling prices of each of the deliverables in the arrangement based on the selling price hierarchy described above. Next, under the residual method, the Company defers revenue from the sale equivalent to the VSOE of the fair value of software support services and applies any inherent discounts to the delivered software element.
The adoption of the new revenue recognition guidance did not result in changes of the individual deliverables to which the Company allocates revenue, or the timing of recognition of revenue for the individual deliverables. The change in the allocation method from residual to relative selling price did not have a material impact on the Company’s financial statements during the three months ended April 30, 2011.
Shipping and handling costs
Shipping and handling costs incurred for inventory purchases and product shipments are recorded in cost of revenue in the Company’s consolidated statements of operations.
F-16
Table of Contents
BlueArc Corporation
Notes to consolidated financial statements (continued)
Product warranty
The Company provides three-year and 90-day warranties for its hardware and software, respectively. These warranty periods are extended for customers who purchase additional hardware support after the warranty period has expired. The Company estimates the costs that it may incur under its warranty obligations and records a liability concurrent with revenue recognition, which is included in other accrued liabilities and other long-term liabilities. The warranty accrual is based on the Company’s historical experience of product replacements, repair costs, ongoing product failure rates and specific quality issues, if any. Each period, the Company assesses the adequacy of its recorded warranty liability and makes adjustments it deems necessary. The Company records warranty cost as part of its cost of product revenue.
Research and development
Research and development costs are expensed as incurred and primarily include personnel costs, prototype expenses and allocated facilities costs as well as depreciation of equipment used in research and development.
Software development
Capitalization of certain software development costs is required subsequent to the establishment of technological feasibility. Based on the Company’s product development process, the Company has determined its software products generally reach technological feasibility upon completion of a working model. The Company does not incur material costs between the completion of the working model and the point at which products are available for general release; therefore, software development costs have been expensed as incurred and included in research and development expenses.
Costs related to internally developed software and software purchased for internal use are capitalized. These costs include software licenses, consulting services and direct materials, as well as associated employee payroll and related costs. Capitalized internal-use software costs, which are included in property and equipment, are depreciated over three years.
Stock-based compensation
The Company’s employee stock-based compensation cost is measured at the grant date, based on the estimated fair value of the award on such date and are expensed over the requisite service period.
The Company uses the Black-Scholes option pricing model to determine the fair value of the awards and the straight-line attribution method for recognizing compensation expense for awards that vest based only on the employees’ continuing service. For awards with performance conditions, expense is recognized separately for each vesting tranche of the award if it is probable that the related performance goals will be achieved. Compensation expense is recognized on awards ultimately expected to vest and reduced by forfeitures that are estimated
F-17
Table of Contents
BlueArc Corporation
Notes to consolidated financial statements (continued)
at the time of grant and revised, if necessary, in subsequent periods if actual forfeitures differ from those estimates. The Company estimates forfeitures based on its historical experience, employee turnover and other factors.
Equity instruments granted to nonemployees are valued using the Black-Scholes option pricing model and are subject to periodic revaluation over their vesting terms. Nonemployee stock-based compensation is recognized over the related performance period, which is generally the vesting term of the awards.
Foreign currency translation
The functional currency of the Company’s foreign subsidiaries is the local currency in the respective country. The assets and liabilities of all subsidiaries are translated into U.S. dollars at the exchange rate in effect at the balance sheet date. Revenue and expenses are translated using average exchange rates prevailing during the period. The Company records translation gains and losses as a component of other comprehensive income (loss) and are included in stockholders’ deficit. Gains or losses from transactions in foreign currencies are reflected in the consolidated statements of operations as a component of other income (expense), net. Transaction gains (losses) were $(0.8) million, $40,000, $(0.2) million and $0.1 million for fiscal 2009, fiscal 2010, fiscal 2011 and three months ended April 30, 2011, respectively.
Derivative instruments
Derivative instruments are carried at fair value in our consolidated balance sheets. The fair values of the derivative financial instruments generally represent the estimated amounts the Company would expect to receive or pay upon termination of the contracts as of the reporting date.
During fiscal 2010 and fiscal 2011, the Company held derivative instruments that consisted of short-term forward contracts to sell foreign currency, which were used to hedge foreign currency-denominated cash balances. The Company’s goal was to reduce its potential exposure to the changes that currency exchange rates might have on its operating results, cash flows and financial position. These foreign currency forward contracts did not qualify for hedge accounting treatment. Changes in the fair value of these forward contracts were included in other income (expense), net. The Company did not hold or issue financial instruments for speculative or trading purposes.
As of January 30, 2010, outstanding foreign currency forward contracts had a total notional value of £1.1 million (approximately $1.8 million using the exchange rate as of January 30, 2010). Fair value of these contracts was a liability of $56,000 and was included in other accrued liabilities as of January 30, 2010. No forward contracts were outstanding as of January 29, 2011. Net losses from foreign currency forward contracts were $80,000, $80,000 and $0 during fiscal 2010, fiscal 2011 and three months ended April 30, 2011, respectively. There were no outstanding foreign currency forward contracts outstanding at January 29, 2011 and April 30, 2011.
Income taxes
The Company uses the asset and liability method of accounting for income taxes. The Company recognizes deferred tax assets and liabilities for the estimated future tax consequences
F-18
Table of Contents
BlueArc Corporation
Notes to consolidated financial statements (continued)
attributable to differences between the consolidated financial statement carrying amounts of existing assets and liabilities and their respective tax bases. Deferred tax assets and liabilities are measured using enacted tax rates expected to apply to taxable income in the years in which those temporary differences are expected to be recovered or settled. The Company establishes valuation allowances when necessary to reduce deferred tax assets where management concludes that it is more likely than not that the deferred tax assets will not be realized based upon the available evidence.
The Company records a liability for the uncertain tax positions taken or expected to be taken on the Company’s tax return when it is more likely than not that the tax position might be challenged, and additional taxes may be due as a result, despite the Company’s belief that the tax return positions are fully supportable. To the extent that the Company’s assessment of its tax positions changes, the change in estimate is recorded in the period in which the determination is made. The provision for income taxes includes the impact of provisions for uncertain tax positions.
Interest and penalties related to unrecognized tax benefits are included within the provision for income taxes. Through January 29, 2011 and April 30, 2011, the Company did not have any interest or penalties associated with unrecognized tax benefits.
Net loss per share
Basic net loss per common share is calculated using the weighted-average number of common shares outstanding during the period that are not subject to vesting provisions. Net loss per common share assuming dilution is calculated on the basis of the weighted-average number of common shares outstanding and the dilutive effect of all potentially dilutive securities, including common stock options, unvested common stock, warrants and convertible securities. Basic and diluted net loss per common share was the same for all periods presented, as the impact of all potentially dilutive securities outstanding was antidilutive. Unaudited pro forma basic and diluted net loss per share have been computed to give effect to the conversion of the Company’s convertible preferred stock.
3. Balance sheet components
Inventory
Inventory consisted of the following (in thousands):
| January 30, 2010 |
January 29, 2011 |
April 30, 2011 |
||||||||||
|
|
||||||||||||
| (unaudited) | ||||||||||||
| Raw materials |
$ | 6,201 | $ | 6,553 | $ | 6,714 | ||||||
| Finished goods |
1,567 | 1,497 | 3,056 | |||||||||
|
|
|
|
|
|
|
|||||||
| Inventory |
$ | 7,768 | $ | 8,050 | $ | 9,770 | ||||||
|
|
|
|
|
|
|
|||||||
F-19
Table of Contents
BlueArc Corporation
Notes to consolidated financial statements (continued)
Property and equipment
Property and equipment consist of the following (in thousands):
| January 30, 2010 |
January 29, 2011 |
April 30, 2011 |
||||||||||
|
|
||||||||||||
| (unaudited) | ||||||||||||
| Machinery and equipment |
$ | 10,352 | $ | 13,000 | $ | 14,196 | ||||||
| Computer equipment and software |
1,810 | 2,317 | 2,429 | |||||||||
| Furniture and fixtures |
687 | 850 | 877 | |||||||||
| Leasehold improvements |
1,268 | 1,734 | 1,989 | |||||||||
| Construction in progress |
47 | 36 | — | |||||||||
|
|
|
|
|
|
|
|||||||
| 14,164 | 17,937 | 19,491 | ||||||||||
| Less accumulated depreciation and amortization |
(10,044 | ) | (12,386 | ) | (13,268 | ) | ||||||
|
|
|
|
|
|
|
|||||||
| Property and equipment, net |
$ | 4,120 | $ | 5,551 | $ | 6,223 | ||||||
|
|
|
|
|
|
|
|||||||
Cost and related accumulated depreciation of property and equipment acquired under capital leases are as follows (in thousands):
| January 30, 2010 |
January 29, 2011 |
April 30, 2011 |
||||||||||
|
|
||||||||||||
| (unaudited) | ||||||||||||
| Cost |
$ | 602 | $ | 729 | $ | 1,027 | ||||||
| Less accumulated depreciation |
(121 | ) | (357 | ) | (417 | ) | ||||||
|
|
|
|
|
|
|
|||||||
| $ | 481 | $ | 372 | $ | 610 | |||||||
|
|
|
|
|
|
|
|||||||
The Company capitalized certain external and internal costs, including internal payroll costs incurred in connection with the development or acquisition of software for internal use. These costs are capitalized when the Company has entered the application development stage. Capitalization ceases when the software is substantially complete and is ready for its intended use. The Company purchased software and capitalized internal costs of $55,000, $432,000 and $32,000 during fiscal 2010, fiscal 2011 and the three months ended April 30, 2011, respectively. Amortization expense associated with these capitalized costs was $57,000, $100,000 and $43,000 for fiscal 2010, fiscal 2011 and the three months ended April 30, 2011, respectively.
Product warranty
The amounts accrued and charged against the warranty reserve were as follows (in thousands):
| Year ended | Three months ended April 30, |
|||||||||||||||
| January 31, 2009 |
January 30, 2010 |
January 29, 2011 |
||||||||||||||
|
|
||||||||||||||||
| (unaudited) | ||||||||||||||||
| Warranty—beginning of period |
$ | 2,236 | $ | 2,291 | $ | 1,982 | $ | 2,407 | ||||||||
| Accrual of warranty |
660 | 459 | 1,986 | 363 | ||||||||||||
| Warranty costs |
(605 | ) | (768 | ) | (1,561 | ) | (313 | ) | ||||||||
|
|
|
|
|
|
|
|
|
|||||||||
| Warranty—end of period |
$ | 2,291 | $ | 1,982 | $ | 2,407 | $ | 2,457 | ||||||||
|
|
|
|
|
|
|
|
|
|||||||||
F-20
Table of Contents
BlueArc Corporation
Notes to consolidated financial statements (continued)
4. Fair value measurements
Assets and liabilities measured and recorded at fair value on a recurring basis consisted of the following types of instruments as of January 30, 2010, January 29, 2011 and April 30, 2011 (in thousands):
| January 30, 2010 | ||||||||||||||||
| Level 1 | Level 2 | Level 3 | Total | |||||||||||||
|
|
||||||||||||||||
| Assets |
||||||||||||||||
| Cash equivalents: |
||||||||||||||||
| Money market funds |
$ | 5,690 | $ | — | $ | — | $ | 5,690 | ||||||||
|
|
|
|
|
|
|
|
|
|||||||||
| Liabilities |
||||||||||||||||
| Other accrued liabilities: |
||||||||||||||||
| Foreign currency forward contracts |
$ | — | $ | — | $ | 55 | $ | 55 | ||||||||
|
|
|
|
|
|
|
|
|
|||||||||
| Other long-term liabilities: |
||||||||||||||||
| Preferred stock warrants |
$ | — | $ | — | $ | 1,315 | $ | 1,315 | ||||||||
|
|
|
|
|
|
|
|
|
|||||||||
| January 29, 2011 | ||||||||||||||||
| Level 1 | Level 2 | Level 3 | Total | |||||||||||||
|
|
||||||||||||||||
| Assets |
||||||||||||||||
| Cash equivalents: |
||||||||||||||||
| Money market funds |
$ | 10,833 | $ | — | $ | — | $ | 10,833 | ||||||||
|
|
|
|
|
|
|
|
|
|||||||||
| Liabilities |
||||||||||||||||
| Other long-term liabilities: |
||||||||||||||||
| Preferred stock warrants |
$ | — | $ | — | $ | 1,834 | $ | 1,834 | ||||||||
|
|
|
|
|
|
|
|
|
|||||||||
| Common stock warrants |
$ | — | $ | — | $ | 136 | $ | 136 | ||||||||
|
|
|
|
|
|
|
|
|
|||||||||
| April 30, 2011 | ||||||||||||||||
| Level 1 | Level 2 | Level 3 | Total | |||||||||||||
|
|
||||||||||||||||
| (unaudited) | ||||||||||||||||
| Assets |
||||||||||||||||
| Cash equivalents: |
||||||||||||||||
| Money market funds |
$ | 10,465 | $ | — | $ | — | $ | 10,465 | ||||||||
|
|
|
|
|
|
|
|
|
|||||||||
| Liabilities |
||||||||||||||||
| Other long-term liabilities: |
||||||||||||||||
| Preferred stock warrants |
$ | $ | $ | 3,602 | $ | 3,602 | ||||||||||
|
|
|
|
|
|
|
|
|
|||||||||
| Common stock warrants |
$ | $ | $ | 333 | $ | 333 | ||||||||||
|
|
|
|
|
|
|
|
|
|||||||||
The aggregate fair value of the Company’s money market funds approximated amortized cost and, as such, there were no unrealized gains or losses on money market funds as of January 30, 2010, January 29, 2011 and April 30, 2011.
F-21
Table of Contents
BlueArc Corporation
Notes to consolidated financial statements (continued)
The tables below present reconciliations for the preferred stock warrant and common stock warrant liabilities measured and recorded at fair value on a recurring basis using Level 3 inputs for fiscal 2010, fiscal 2011 and three months ended April 30, 2011 (in thousands):
Preferred stock warrants
| Year ended | Three months ended April 30, |
|||||||||||||||
| January 31, 2009 |
January 30, 2010 |
January 29, 2011 |
||||||||||||||
|
|
||||||||||||||||
| (unaudited) | ||||||||||||||||
| Beginning balance |
$ | — | $ | 267 | $ | 1,315 | $ | 1,834 | ||||||||
| Issuances |
401 | 676 | 514 | — | ||||||||||||
| Loss (gain) recognized in earnings |
(134 | ) | 372 | 5 | 1,768 | |||||||||||
|
|
|
|
|
|
|
|
|
|||||||||
| Ending balance |
$ | 267 | $ | 1,315 | $ | 1,834 | $ | 3,602 | ||||||||
|
|
|
|
|
|
|
|
|
|||||||||
Common stock warrants
| Year ended | Three months ended April 30, |
|||||||||||||||
| January 31, 2009 |
January 30, 2010 |
January 29, 2011 |
||||||||||||||
|
|
||||||||||||||||
| (unaudited) | ||||||||||||||||
| Beginning balance |
$ | — | $ | — | $ | — | $ | 136 | ||||||||
| Issuances |
— | — | 408 | — | ||||||||||||
| Loss (gain) recognized in earnings |
— | — | (64 | ) | 197 | |||||||||||
| Reclassification to additional paid-in capital |
— | — | (208 | ) | — | |||||||||||
|
|
|
|
|
|
|
|
|
|||||||||
| Ending balance |
$ | — | $ | — | $ | 136 | $ | 333 | ||||||||
|
|
|
|
|
|
|
|
|
|||||||||
The valuation of the preferred stock warrants and common stock warrants and input assumptions used in the valuation is discussed in Note 10. There were no transfers between Level 1 and Level 2 into Level 3 for the periods presented.
F-22
Table of Contents
BlueArc Corporation
Notes to consolidated financial statements (continued)
5. Commitments and contingencies
Leases
In October 2000, the Company entered into a noncancelable operating lease for its facility in Bracknell, England from November 1, 2000 to October 26, 2015. In May 2006, the Company entered into a noncancelable operating lease for its facility in San Jose, California from June 23, 2006 to August 30, 2009 and subsequently extended the term of the lease to August 31, 2014. The Company also leases various fixed assets under capital leases with terms that expire at various dates through January 2014. The Company also incurs rent expense to support sales offices in other countries with total square footage of approximately 345. Future minimum lease payments due under noncancelable leases as of January 29, 2011 were as follows (in thousands):
| Years ending: | Capital leases |
Operating leases |
||||||
|
|
||||||||
| January 28, 2012 |
$ | 287 | $ | 992 | ||||
| January 26, 2013 |
138 | 996 | ||||||
| January 25, 2014 |
11 | 1,001 | ||||||
| January 31, 2015 |
— | 808 | ||||||
| January 30, 2016 |
— | 396 | ||||||
|
|
|
|
|
|||||
| Total future minimum lease payments |
436 | $ | 4,193 | |||||
|
|
|
|||||||
| Less interest cost |
(31 | ) | ||||||
|
|
|
|||||||
| Net present value of future minimum lease payments |
405 | |||||||
| Less current obligations under capital leases, included under long-term debt, current portion |
(262 | ) | ||||||
|
|
|
|||||||
| Long-term obligations under capital leases included under long-term debt, net of current portion |
$ | 143 | ||||||
|
|
|
|||||||
The terms of certain lease arrangements have escalating rent payment provisions. The Company recognizes rent expense on a straight-line basis over the lease period, resulting in a deferred rent liability. Rent expense under all operating leases was $1.0 million, $0.9 million, $1.0 million and $0.3 million for fiscal 2009, fiscal 2010, fiscal 2011 and three months ended April 30, 2011, respectively.
Purchase commitments
To ensure uninterrupted supply, the Company’s contract manufacturer makes advance purchases of components based on the system unit forecasts provided by the Company. To the extent these components are purchased by the contract manufacturer and cannot be used by their other customers, the Company is obligated to purchase these components. The maximum amount of purchase commitment that the Company may be obligated to pay within one year was $10.8 million and $7.5 million as of January 29, 2011 and April 30, 2011, respectively. Actual amounts paid may be lower to the extent that the contract manufacturer can avoid purchasing components that are ultimately not needed. Additionally, the Company has an obligation to purchase components procured by its contract manufacturer if these components become obsolete. Accruals related to obsolete components purchased by the contract manufacturer were immaterial as of January 29, 2011 and April 30, 2011.
F-23
Table of Contents
BlueArc Corporation
Notes to consolidated financial statements (continued)
Indemnification obligations
The Company’s bylaws permit it to indemnify its officers and directors, as well as those who act as directors and officers of other entities at the request of the Company, against expenses, judgments, fines, settlements and other amounts actually and reasonably incurred in connection with any proceedings arising out of their services to the Company. In addition, the Company has entered into indemnification agreements with each director and officer that provide for indemnification of these persons under certain circumstances. The Company maintains insurance intended to cover claims made against its directors and officers. As a maximum obligation is not explicitly stated in the Company’s bylaws or these agreements and will depend on the facts and circumstances that arise from any future claims, the maximum amount of the obligations cannot reasonably be estimated. Historically, the Company has not made payments under these indemnification obligations and believes the estimated fair value of these indemnification obligations is not material. Accordingly, the Company recorded no liabilities for these agreements as of January 30, 2010, January 29, 2011 and April 30, 2011.
As is customary in the Company’s industry and as provided for under local law in certain jurisdictions, many of the Company’s contracts provide remedies to customers and other parties with whom the Company enters into contracts in the event that a claim is brought against the customer or other party alleging that the Company’s products infringe another party’s intellectual property. These remedies include provisions for the defense, settlement or payment of any final judgment entered against the indemnified party, subject to limitations set forth in the contract. From time to time, the Company also agrees to indemnify customers, suppliers, contractors, lessors, lessees and other parties with whom it enters into contracts, against loss, expense or liability arising from various events related to the sale and the use of the Company’s products and services, the use of the other party’s goods, services or facilities and other matters covered by such contracts, generally subject to a maximum amount. From time to time, the Company also agrees to indemnify third parties with whom it contracts against claims related to undiscovered liabilities or additional product liability. The Company maintains errors and omissions insurance intended to reduce its potential loss under indemnification obligations. Claims made under such indemnification obligations have not been significant, and the Company believes the estimated value of these indemnification obligations is not material. Accordingly, the Company has recorded no liabilities for these provisions as of January 30, 2010, January 29, 2011 and April 30, 2011.
6. Financing arrangements
Accounts receivable credit facility
The Company has an asset-based revolving credit facility with Silicon Valley Bank for $12.5 million. On June 3, 2011, the Company extended the facility until December 31, 2012 and amended various terms of the agreement. The credit facility is collateralized by the Company’s tangible assets and is subject to a borrowing base calculation with an advance rate of 80% of eligible accounts receivable. The interest rate on the credit facility is variable, ranging between 1% and 3% over prime rate on the basis of the Company’s unrestricted cash balance. Effective June 2011, the Company will pay an unused line charge of 0.25% per annum. As of January 30,
F-24
Table of Contents
BlueArc Corporation
Notes to consolidated financial statements (continued)
2010, January 29, 2011 and April 30, 2011, the Company did not have an outstanding balance on the credit facility. Based on the borrowing base calculation, the Company had $12.5 million available for future borrowings as of January 29, 2011 and April 30, 2011. Amounts borrowed under the credit facility are payable to Silicon Valley Bank following collection of the underlying accounts receivable and the credit facility includes a material adverse change clause as a condition precedent to funding which allows Silicon Valley Bank to withdraw any unutilized portion of the facility at the time it is notified of the occurrence of certain triggering events. The credit facility does not include a material adverse change clause as an event of default or any financial covenants.
Long-term capital growth facility
In April 2009, the Company entered into a long-term capital growth facility agreement with Gold Hill Capital for a principal amount of $7.5 million, of which the entire amount available was then drawn. The loan facility was amended in each of April 2010 and January 2011 to extend the facility repayment terms, originally scheduled to occur in installments from January 2010 to June 2012. The loan facility is subject to interest-only payments during a period that ends December 2011. The Company is obligated to start making payments of principal and interest monthly of $282,000 from January 2012 through June 2014. In June 2014, the Company will be obligated to pay an end of term fee of $150,000. The loan facility originally carried a fixed interest rate of 12%, which was reduced to 11% effective in April 2010. The interest rate is scheduled to be further reduced to 9.5% effective January 1, 2012.
If the Company does not meet specified performance criteria tied to a measure of quarterly earnings through October 29, 2011, its repayment of principal via monthly installments will be accelerated and will commence in the month following the determination that the performance criteria have not been met. In addition, the Company would not be entitled to any reduction in the interest rate, and the number of shares underlying warrants to purchase common stock issued to Gold Hill Capital in April 2010 and January 2011 would be reduced. The Company met all applicable performance criteria through January 29, 2011 and April 30, 2011.
Modifications in the terms of the Gold Hill loan facility in April 2010 and January 2011 were not so substantial as to be considered to result in the extinguishment of the original facility and drawing of a new debt. Therefore, the Company did not record a gain or loss upon the modifications and expensed all related legal and administrative expenses as incurred.
In connection with the issuance of the original facility, the Company issued warrants to purchase 248,486 of Series FF convertible preferred stock, or Series FF, at a price of $4.53 per share to Gold Hill Capital. At the time of issuance, the total fair value of these warrants was $0.7 million. The fair value of the warrants on the date of issuance was recorded as a liability and debt discount. See Note 10.
The terms of these warrants provide that the number of shares and the exercise price will be adjusted in the event the Company sells preferred stock at a lower price per share in a subsequent preferred stock financing. Since the issue price of the Company’s Series GG convertible preferred stock, or Series GG, of $2.53 per share was lower than the original per
F-25
Table of Contents
BlueArc Corporation
Notes to consolidated financial statements (continued)
share exercise price of $4.53, the Company adjusted the previously issued warrants such that the Gold Hill warrants are now exercisable for 222,429 shares of Series FF convertible preferred stock and 222,428 shares of Series FF-1 convertible preferred stock at an exercise price of $2.53 per share. The reason that one-half of the warrants were issued as Series FF-1 warrants was because the terms of the warrants allowed for Gold Hill to receive the same securities and/or rights as those who participate at their full pro rata share of the next round of financing. See Note 8.
In connection with the Gold Hill loan facility modifications in April 2010 and January 2011, the Company issued warrants to purchase 174,371 shares and 100,170 shares of the Company’s common stock with per share exercise prices of $1.94 and $1.71, respectively, to Gold Hill Capital. The number of shares subject to the warrant issued in April 2010 was subject to a one-time reduction if the Company failed to achieve specified performance criteria tied to a measure of quarterly earnings through January 29, 2011. The number of shares subject to the warrant issued in January 2011 is subject to a one-time reduction if the Company does not achieve specified performance criteria tied to a measure of quarterly earnings for quarters through October 29, 2011. The number of shares subject to the reduction varies depending on the quarter in which the Company fails to achieve the criteria. The April 2010 warrants had a fair value of $0.3 million at issuance and the January 2011 warrants had a fair value of $0.1 million at issuance. The Company estimated these fair values using the Black-Scholes option pricing model adjusted for a potential reduction in the number of shares, based on various probability-weighted outcomes. The following assumptions were used in the Black-Scholes model: expected volatility of 75% in April 2010 and 66% in January 2011, risk free interest rates of 4% in April 2010 and 3% in January 2011, expected life of 10 years and zero dividend yield. The fair value of the warrants on the date of issuance was recorded as a liability and debt discount.
Over the life of the loan facility, including the extension periods, using the effective interest method, the Company recognizes as interest expense fees paid to Gold Hill Capital upon the initial drawing of the loan facility, and modifications, the payment of the end of term fee, debt discounts resulting from the issuance of warrants and the direct and incremental costs of the initial borrowing.
As of January 30, 2010, January 29, 2011 and April 30, 2011, the Company was in compliance with all loan covenants with Gold Hill. Including the value of preferred stock warrants issued in connection with this loan, the effective interest rate was approximately 19% as of January 30, 2010 and 17% as of January 29, 2011 and April 30, 2011.
The Gold Hill loan is collateralized by a security interest in all of the Company’s assets, excluding the Company’s intellectual property. The Company, however, has provided a negative pledge regarding its intellectual property and cannot give or sell it to another party without Gold Hill’s consent. The loan agreement also limits the Company’s ability to pay dividends. Gold Hill’s security interest is subordinated to Silicon Valley Bank’s first priority security interest in the Company’s cash (including short- and long-term investments) and accounts receivable to the extent the Silicon Valley Bank line is drawn.
F-26
Table of Contents
BlueArc Corporation
Notes to consolidated financial statements (continued)
Aggregate annual payments due on the Gold Hill loan as of January 29, 2011 were as follows (in thousands):
| Years ending | Payments* | |||
| January 28, 2012 |
$ | 1,048 | ||
| January 26, 2013 |
3,388 | |||
| January 25, 2014 |
3,388 | |||
| January 31, 2015 |
1,412 | |||
|
|
|
|||
| Total payments |
9,236 | |||
| Less: amount representing interest |
(1,736 | ) | ||
|
|
|
|||
| Total debt |
7,500 | |||
| Less: unamortized discount |
(708 | ) | ||
|
|
|
|||
| Total debt, net of unamortized discount |
6,792 | |||
| Less: current portion |
(240 | ) | ||
|
|
|
|||
| Long-term portion |
$ | 6,552 | ||
|
|
||||
| * | These amounts were calculated using the interest rate of 11% through December 31, 2011 and 10% thereafter, which will apply if the Company meets specified performance criteria tied to a measure of quarterly earnings through October 29, 2011. The Company currently anticipates that it will achieve these performance criteria. If these criteria are not achieved, repayment of principal via monthly installments will be accelerated and will commence in the month following the determination that the performance criteria have not been achieved. In addition, the 11% interest rate will continue to apply for the remainder of the facility term. Should this occur, a maximum of $2.1 million may become due during fiscal 2012 as a result of repayment acceleration. Additional interest payments that may become due through the facility repayment period as a result of the higher interest rate are $0.2 million. |
Convertible promissory notes
In February 2010, the Company issued $2.7 million in convertible promissory notes with an annual interest rate of 8%. In July 2010, upon closing of the Series GG convertible preferred stock financing, the principal and accrued interest of $0.1 million was converted into shares of Series GG convertible preferred stock as discussed below in Note 8. Upon conversion, the Company also issued vested warrants to purchase 320,393 shares of Series GG convertible preferred stock at an exercise price of $2.53 per share to the promissory note holders and recorded a charge equal to the issuance-date fair value of these warrants of $0.6 million in other income (expense), net. The Company estimated the fair value of the warrants at issuance using the Black-Scholes option pricing model with the following assumptions: expected volatility of 51%, risk free interest rate of 2%, expected life of five years and zero dividend yield. See Note 10.
7. Hitachi Data Systems arrangements
The Company has a Master Distribution Agreement, or MDA, with HDS. The MDA commits HDS to purchase specified dollar amounts of the Company’s storage systems through September 2011. During fiscal 2010 and fiscal 2011, HDS made prepayments of $10.0 million and $5.0 million, respectively, for future purchases of the Company’s products. As partial consideration for these prepayments, during fiscal 2011 the Company issued to HDS vested warrants to purchase 206,184 shares of its common stock with a per share exercise price of $1.94, which expires in 2017. The Company determined the fair value at issuance was $0.2 million and it was recognized as a reduction in revenue upon HDS’ purchase of products using the prepayment. The Company estimated the fair value using the Black-Scholes option pricing model with the following assumptions: expected volatility of 50%, risk free interest rate of 4%, expected life of seven years and zero dividend yield.
F-27
Table of Contents
BlueArc Corporation
Notes to consolidated financial statements (continued)
During fiscal 2011, HDS paid the Company $1.5 million for certain research and development projects. The Company recognizes these amounts as a reduction in its research and development expense as the associated projects are conducted. As of January 29, 2011 and April 30, 2011, $0.9 million and $0.5 million of customer deposits associated with these projects remained on the Company’s balance sheet. The Company has also received fees from HDS for setting aside certain inventory quantities to be available for them as needed. The amount of support fees recognized for this service was $0.1 million, $0.7 million and $0.3 million in fiscal 2009, fiscal 2010 and fiscal 2011, respectively. This inventory arrangement expired at the end of fiscal 2011.
During fiscal 2009, the Company issued HDS vested warrants to purchase 151,418 shares of its common stock with a per share exercise price of $4.13 and a fair value at issuance of $0.2 million. The warrants were issued upon HDS’ achievement of specified revenue milestones for the sale of the Company’s products. The warrants expired unexercised in fiscal 2011. The fair value of these warrants was recognized as a reduction in revenue. The Company estimated the fair value using the Black-Scholes option pricing model with the following assumptions: expected volatility of 44%, risk free interest rate of 2%, expected life of 2.8 years and zero dividend yield.
Pursuant to the terms of the MDA as amended in March 2010, the Company agreed not to solicit a specified list of potential acquirers prior to April 1, 2011 and the Company and certain holders of its preferred stock agreed to certain limitations on the sale of the Company to a specified list of third parties. These protections expire on the earlier to occur of September 30, 2011 or immediately prior to the closing of an IPO.
8. Convertible preferred stock and stockholders’ deficit
In July 2010, the board and stockholders approved and the Company increased its authorized common stock to 50,540,389 shares and authorized convertible preferred stock to 52,566,195 shares, and designated 9,019,856 shares of convertible preferred stock as Series GG. The Company then issued 8,342,358 shares of Series GG for gross proceeds of $21.1 million, which included the conversion of $2.7 million of promissory notes and accumulated interest of $0.1 million.
In accordance with the terms of the amendment and restatement of our certificate of incorporation that we filed in connection with the Series GG financing, 50% of every preferred stockholder’s outstanding shares of Series AA convertible preferred stock, or Series AA, Series BB convertible preferred stock, or Series BB, Series DD convertible preferred stock, or Series DD and Series FF, was converted to common stock. To the extent each holder of previously converted preferred stock participated at the required level in the Series GG financing, such holder was able to immediately exchange each of the previously converted shares of common stock into one share of preferred stock of a new series. Shares of common stock issued upon conversion of Series AA were exchanged for shares of Series AA-1 convertible preferred stock, or Series AA-1; shares of common stock issued upon conversion of Series BB were exchanged for shares of Series BB-1 convertible preferred stock, or Series BB-1; shares of common stock issued upon conversion of Series DD were exchanged for shares of Series DD-1 convertible preferred stock, or Series DD-1; and shares of common stock issued upon conversion of Series FF were exchanged for shares of Series FF-1 convertible preferred stock, or Series FF-1. In aggregate, there were 2,691,061 shares of Series AA-1, 4,603,023 shares of Series BB-1, 3,279,749 shares of Series DD-1 and 2,517,391
F-28
Table of Contents
BlueArc Corporation
Notes to consolidated financial statements (continued)
shares of Series FF-1 issued, and 504,647 shares of Series AA, 45,818 shares of Series BB, 222,653 shares of Series DD and 53,010 shares of Series FF were converted to common stock and not exchanged for the new series of preferred stock. The liquidation preferences per share for Series AA-1 is $5.91, for Series BB-1 is $2.51, for Series DD-1 is $3.85 and for Series FF-1 is $4.21. In addition, the liquidation preferences per share of the remaining 50% shares of Series AA, Series BB, Series DD and Series FF were reduced as follows: from $6.00 to $4.98 for Series AA; from $3.00 to $2.49 for Series BB; from $4.14 to $3.60 for Series DD; and from $4.53 to $4.12 for Series FF. None of the Series EE convertible preferred stock was converted into common stock; however, the liquidation preference per share decreased from $5.19 to $4.52. The Series CC convertible preferred stock was not affected by the Series GG transaction.
The Company accounted for the exchange of convertible preferred stock into preferred stock of a new series as an extinguishment and a subsequent reissuance. The net difference between the fair values of newly issued convertible preferred stock, and the carrying values of the previously outstanding preferred stock that was exchanged, was reflected as a deemed dividend to preferred stockholders, with a debit to additional paid-in capital and an increase in net loss attributable to common stockholders for fiscal 2011. The fair values of newly issued convertible preferred stock shares were determined by management using probability-weighted expected return method and estimates and assumptions consistent with those used to estimate the fair value of the Company’s common stock. See Note 9.
The book value of shares of Series AA, BB, DD and FF converted into shares of common stock for those stockholders who did not participate in the Series GG financing was transferred from temporary equity to permanent equity since such conversion occurred at the initial conversion price.
F-29
Table of Contents
BlueArc Corporation
Notes to consolidated financial statements (continued)
The following table lists the shares of convertible preferred stock authorized and outstanding as of January 30, 2010 and January 29, 2011 (in thousands, except per share data):
| As of January 30, 2010 | Shares | Carrying value |
Aggregate preference |
Liquidation per share |
||||||||||||||||
| Designated | Outstanding | |||||||||||||||||||
|
|
||||||||||||||||||||
| Series |
||||||||||||||||||||
| AA |
6,391 | 6,391 | $ | 26,330 | $ | 38,349 | $ | 6.00 | ||||||||||||
| BB |
9,298 | 9,298 | 20,250 | 27,893 | $ | 3.00 | ||||||||||||||
| CC |
311 | 310 | — | — | $ | — | ||||||||||||||
| DD |
11,605 | 7,005 | 28,830 | 29,000 | $ | 4.14 | ||||||||||||||
| EE |
790 | 790 | 4,100 | 4,100 | $ | 5.19 | ||||||||||||||
| FF |
5,567 | 5,141 | 23,107 | 25,069 | $ | 4.53 | ||||||||||||||
|
|
|
|
|
|
|
|
|
|||||||||||||
| 33,962 | 28,935 | $ | 102,617 | $ | 124,411 | |||||||||||||||
|
|
|
|
|
|
|
|
|
|||||||||||||
| As of January 29, 2011 | Shares | Carrying value |
Aggregate preference |
Liquidation per share |
||||||||||||||||
| Designated | Outstanding | |||||||||||||||||||
|
|
||||||||||||||||||||
| Series |
||||||||||||||||||||
| AA |
6,391 | 3,197 | $ | 9,100 | $ | 15,915 | $ | 4.98 | ||||||||||||
| AA-1 |
3,196 | 2,691 | 10,604 | 15,915 | $ | 5.91 | ||||||||||||||
| BB |
9,298 | 4,649 | 13,947 | 11,576 | $ | 2.49 | ||||||||||||||
| BB-1 |
4,649 | 4,603 | 15,752 | 11,576 | $ | 2.51 | ||||||||||||||
| CC* |
311 | 310 | — | — | $ | — | * | |||||||||||||
| DD |
7,005 | 3,502 | 14,329 | 12,612 | $ | 3.60 | ||||||||||||||
| DD-1 |
3,502 | 3,280 | 11,920 | 12,615 | $ | 3.85 | ||||||||||||||
| EE |
790 | 790 | 4,100 | 3,567 | $ | 4.52 | ||||||||||||||
| FF |
5,537 | 2,570 | 11,470 | 10,588 | $ | 4.12 | ||||||||||||||
| FF-1 |
2,867 | 2,517 | 9,522 | 10,590 | $ | 4.21 | ||||||||||||||
| GG** |
9,020 | 8,342 | 20,955 | 31,646 | $ | 3.79 | ** | |||||||||||||
|
|
|
|
|
|
|
|
|
|||||||||||||
| 52,566 | 36,451 | $ | 121,699 | $ | 136,600 | |||||||||||||||
|
|
|
|
|
|
|
|
|
|||||||||||||
| * | See “Liquidation” section below. |
| ** | Amount if a liquidation event occurs before January 14, 2012. After January 14, 2012, the liquidation preference amount is $26.4 million, or $3.16 per share. |
Voting rights
The holder of each share of convertible preferred stock (other than Series CC) is entitled to one vote for each share of common stock into which it is convertible. Except as required by law, the Series CC convertible preferred stock does not have any voting rights.
The holders of Series AA stock, voting as a separate class, are entitled to elect two members of the Board of Directors. The holders of Series DD stock, voting as a separate class, are entitled to elect one member of the Board of Directors. The holders of Series GG stock, voting as a separate class, are entitled to elect one member of the Board of Directors. Holders of convertible preferred stock (other than Series CC) and common stock, voting together on an as converted to common stock basis, are entitled to elect three remaining members of the Board of Directors.
F-30
Table of Contents
BlueArc Corporation
Notes to consolidated financial statements (continued)
Conversion rights
Each share of convertible preferred stock (other than Series CC) is convertible, at the option of the holder and at any time, into such number of shares of common stock as is determined by dividing the applicable original issue price by the conversion price applicable to such shares in effect at the date of conversion, initially on a one for one basis. As of January 29, 2011, each share of preferred stock is convertible into common stock shares as follows:
| Series | Shares of common stock issuable upon conversion |
Conversion Price |
||||||
| AA and AA-1 |
1.00 | $ | 3.00 | |||||
| BB and BB-1 |
1.00 | 3.00 | ||||||
| DD and DD-1 |
1.00 | 4.14 | ||||||
| EE |
1.02 | 5.07 | ||||||
| FF and FF-1 |
1.00 | 4.53 | ||||||
| GG |
1.00 | 2.53 | ||||||
|
|
||||||||
Each share of Series CC is automatically convertible into shares of common stock only upon the closing of a qualified IPO. In the event of such a conversion, each share of Series CC is convertible into such number of shares of common stock determined by dividing $60.00 by the price per share to the public of the common stock sold in such qualified IPO.
Each share of convertible preferred stock will automatically convert into common stock immediately prior to the closing of an underwritten public offering pursuant to an effective registration statement under Securities Act of 1933, with an offering price to the public of at least $5.08 per share and aggregate gross offering proceeds of not less than $50.0 million, which would be a Qualified IPO, or with the written consent of at least two-thirds of the then outstanding convertible preferred stock; however, other than upon a Qualified IPO, Series GG cannot be converted to common stock without the consent of a majority of the holders of Series GG.
Dividends
| Payment preference order | Series | Dividend per share | ||
| 1 |
GG | $ 0.2023 | ||
| 2 |
FF and FF-1 | 0.3622 | ||
| 2 |
EE | 0.4152 | ||
| 2 |
DD and DD-1 | 0.3312 | ||
| 3 |
AA, AA-1, BB, BB-1 | 0.2400 | ||
|
| ||||
Holders of the convertible preferred stock are entitled to an annual noncumulative dividend per share payable in accordance with the payment preference order set forth above. Only until dividends for each series within a particular preference order are paid, will the next series in the preference order be paid. After the holders of the above series have received their dividend preferences, they will participate with shares of common stock on an as converted to common stock basis as to any additional declaration or payment of any dividend. No dividends had been declared or paid as of January 29, 2011.
F-31
Table of Contents
BlueArc Corporation
Notes to consolidated financial statements (continued)
Liquidation
In the event of any liquidation, dissolution or winding up of the Company, either voluntary or involuntary, distributions to the stockholders of the Company, after distribution of 10% of the proceeds to management of the Company in accordance with the terms of the management bonus plan (which expires upon the occurrence of an IPO), will be made in the following manner:
| Liquidation preference order | Series | |
| 1 |
GG | |
| 2 |
FF and FF-1 | |
| 3 |
DD, DD-1 and EE | |
| 4 |
AA and AA-1 | |
| 5 |
BB and BB-1 | |
|
| ||
The holders of the above series of convertible preferred stock carry a liquidation preference in accordance with the above liquidation preference order. Only until the liquidation preferences per share, combined with all declared but unpaid dividends within a particular liquidation preference order, are paid, will the next series in the preference order be paid. If the assets and funds distributed among the holders within a certain preference order are insufficient to permit the payment of the full preferential amounts, the entire assets and funds legally available for distribution will be distributed ratably among the holders of preferred stock within that preference order.
After the payment of the full preferential amounts to the preferred stockholders in the table above, the remaining assets and funds of the Company legally available for distribution to the preferred and common stock holders will be distributed in the following manner:
Series GG, Series FF, Series FF-1, Series EE, Series DD and Series DD-1 holders receive their pro rata share of the remaining assets determined on an as converted to common stock basis. Of the remaining proceeds, initially 50% is distributed to Series CC holders and the other 50% is distributed to Series AA, Series AA-1, Series BB, Series BB-1 and common stockholders on a pro rata as converted to common stock basis (except that 50% of the amount otherwise distributable to the Series BB and Series BB-1 holders will instead be allocated to the Series AA and Series AA-1 holders), until the Series CC holders have received an amount of $20.00 per share. Next, 7% of the remaining amounts is distributed to Series CC holders and the other 93% is distributed to Series AA, Series AA-1, Series BB, Series BB-1 and common stockholders on a pro rata as converted to common stock basis (except that 50% of the amount otherwise distributable to the Series BB and Series BB-1 holders will instead be allocated to the Series AA and Series AA-1 holders), until the Series CC holders have received an additional amount of $40.00 per share. Thereafter, 4% of the remaining amounts is distributed to Series CC holders and the other 96% is distributed to Series AA, Series AA-1, Series BB, Series BB-1 and common stockholders on a pro rata as converted to common stock basis (except that 50% of the amount otherwise distributable to the Series BB and Series BB-1 holders will instead be allocated to the Series AA and Series AA-1 holders).
The merger or consolidation of the Company into another entity in which the stockholders of the Company own less than 50% of the voting stock of the surviving company or the sale, transfer or
F-32
Table of Contents
BlueArc Corporation
Notes to consolidated financial statements (continued)
lease of substantially all of the assets of the Company is deemed to be a liquidation, dissolution or winding up of the Company, or a liquidation event. As the occurrence of a potential liquidation event is outside of the Company’s control due to the rights of the holders of convertible preferred stock to vote to approve or disapprove a potential liquidation event, the Company has classified all shares of convertible preferred stock outside of its permanent stockholders’ deficit.
Accretion
A change in control, as defined, is not currently probable and, therefore, the Company has not recorded any accretion related to the difference between the liquidation value and the carrying value of the Company’s convertible preferred stock.
Common Stock
Shares of common stock reserved for issuance on an as-if converted basis is as follows (in thousands):
| January 30, 2010 |
January 29, 2011 |
April 30, 2011 |
||||||||||
| (unaudited) | ||||||||||||
| Conversion of convertible preferred stock |
28,935 | 39,819 | 39,819 | |||||||||
| Exercise of stock options |
5,998 | 6,811 | 7,019 | |||||||||
| Available for option grants |
121 | 1,196 | 894 | |||||||||
| Exercise of convertible preferred stock warrants |
398 | 913 | 913 | |||||||||
| Exercise of common stock warrants |
456 | 481 | 481 | |||||||||
|
|
|
|
|
|
|
|||||||
| 35,908 | 49,220 | 49,126 | ||||||||||
|
|
|
|
|
|
|
|||||||
9. Stock based compensation
2000 Stock Option/Stock Issuance Plan
In April 2000, the Company adopted the 2000 Stock Option/Stock Issuance Plan, or 2000 Plan. The 2000 Plan was most recently amended in April 2010 to extend the term of the plan for an additional period of 10 years and increase the number of shares of common stock that may be issued under the plan. The maximum number of shares of common stock that may be issued under the plan as of January 29, 2011 was 8,036,521. The 2000 Plan provides for the grant of incentive stock options to employees, including officers and members of the Board of Directors who are also employees, and for the grants of nonqualified stock options and awards of restricted or unrestricted shares of common stock to employees, officers, directors, consultants and advisors of the Company. Stock options granted under the 2000 Plan generally vest over a period of 48 months and have a contractual life of 10 years from the date of grant. The incentive stock options may be granted to employees at prices not lower than fair value at the date of grant, as determined by the Board of Directors (110% in certain cases). Nonqualified options may be granted to key employees, including directors and consultants, at prices not lower than 85% of fair value at the date of grant (110% in certain cases) as determined by the Board of Directors.
F-33
Table of Contents
BlueArc Corporation
Notes to consolidated financial statements (continued)
During fiscal 2010 and fiscal 2011, the Company granted options to purchase 602,863 and 88,429 shares, respectively, that contained vesting criteria based on the Company’s performance during the year of grant. Of the options granted during fiscal 2010, options to purchase 410,991 shares vested as the related performance conditions were satisfied, and the remaining options to purchase 191,872 shares were cancelled as the performance conditions applicable to those options were not met. Of the options granted during fiscal 2011, options to purchase 85,800 shares vested as the related performance conditions were satisfied and options to purchase 2,629 shares were cancelled as the performance conditions applicable to those options were not met.
On July 15, 2009, the Company cancelled options to purchase 2,395,387 shares held by 201 employees that had exercise prices greater than the fair market value of Company’s common stock as of that date, and granted new options to those employees with exercise prices that were equal to the fair market value of Company’s common stock as of the date of grant. The Company’s Board of Directors determined that the fair market value as of that date was $0.86 per share and set the exercise prices of the new options at $0.86 per share. Prior to the cancellation of the earlier grants, their exercises prices ranged from $1.70 to $5.81. The Company extended the vesting term by 12 months for the replacement options for those original options that were not fully vested as of the date of grant of the replacement options. The grant of new options was treated as a modification of the original grants. The Company incurred additional stock-based compensation costs of $0.6 million as a result of the modification, of which $0.1 million was recognized immediately and the remaining amount of $0.5 million will be recognized over the remaining vesting period of the modified options.
Activity under the 2000 Plan is as follows (in thousands, except per share data):
| Shares available for grant |
Number of stock options outstanding |
Weighted- average exercise price |
Range of exercise prices |
|||||||||||||
| Balance as of January 31, 2010 |
121 | 5,998 | 0.84 | |||||||||||||
| Additional shares authorized |
2,030 | — | — | |||||||||||||
| Option grants |
(1,430 | ) | 1,430 | 1.50 | ||||||||||||
| Restricted stock grants |
(29 | ) | — | — | ||||||||||||
| Repurchases |
1 | — | 1.70 | |||||||||||||
| Exercises |
— | (114 | ) | 0.31 | $ | 0.03 -$1.94 | ||||||||||
| Forfeited |
368 | (368 | ) | 0.88 | ||||||||||||
| Expired |
135 | (135 | ) | 1.39 | ||||||||||||
|
|
|
|
|
|||||||||||||
| Balance as of January 29, 2011 |
1,196 | 6,811 | 0.97 | |||||||||||||
|
|
|
|
|
|||||||||||||
| Option grants (unaudited) |
(347 | ) | 347 | 1.78 | ||||||||||||
| Restricted stock grants (unaudited) |
(18 | ) | — | — | ||||||||||||
| Exercises (unaudited) |
— | (76 | ) | 0.51 | $ | 0.05 -$1.70 | ||||||||||
| Forfeited (unaudited) |
43 | (43 | ) | 1.35 | ||||||||||||
| Expired (unaudited) |
20 | (20 | ) | 1.32 | ||||||||||||
|
|
|
|
|
|||||||||||||
| Balance as of April 30, 2011 (unaudited) |
894 | 7,019 | ||||||||||||||
|
|
|
|
|
|||||||||||||
| Vested and expected to vest as of January 29, 2011 |
6,596 | 0.97 | ||||||||||||||
|
|
|
|||||||||||||||
| Exercisable as of January 29, 2011 |
6,112 | 0.97 | ||||||||||||||
|
|
|
|||||||||||||||
F-34
Table of Contents
BlueArc Corporation
Notes to consolidated financial statements (continued)
The following table summarizes information about stock options outstanding and exercisable as of January 29, 2011 (in thousands):
| Options outstanding | Options exercisable | |||||||||||||||||||||
| Exercise prices | Number | Weighted- average remaining life (in years) |
Weighted- average exercise price |
Number | Weighted- average exercise price |
|||||||||||||||||
|
|
||||||||||||||||||||||
| $0.03 – $0.05 |
755 | 4.3 | $ | 0.03 | 755 | $ | 0.03 | |||||||||||||||
| $0.18 – $0.71 |
932 | 5.5 | $ | 0.18 | 932 | $ | 0.18 | |||||||||||||||
| $0.83 – $0.86 |
3,602 | 8.4 | $ | 0.86 | 3,106 | $ | 0.86 | |||||||||||||||
| $1.42 – $1.94 |
1,428 | 9.5 | $ | 1.52 | 1,226 | $ | 1.53 | |||||||||||||||
| $2.28 – $5.81 |
56 | 6.8 | $ | 1.72 | 55 | $ | 1.72 | |||||||||||||||
| $20 – $11,000 |
38 | 3.0 | $ | 25.21 | 38 | $ | 25.21 | |||||||||||||||
|
|
|
|
|
|||||||||||||||||||
| 6,811 | 6,112 | |||||||||||||||||||||
|
|
|
|
|
|||||||||||||||||||
The weighted-average remaining contractual life for all exercisable options as of January 29, 2011 was 7.6 years. The weighted-average remaining contractual life of all vested and expected-to-vest stock options as of January 29, 2011 was 7.7 years.
The intrinsic value of unexercised and outstanding stock options, and expected to vest is the difference between the exercise price and the fair value of the underlying common stock. The aggregate intrinsic value of stock options outstanding as of January 29, 2011 and April 30, 2011 was $6.5 million and $21.8 million, respectively, of which $4.7 million and $13.6 million were related to exercisable options. The aggregate intrinsic value of stock options vested and expected to vest, net of estimated forfeitures, was $6.4 million and $21.2 million as of January 29, 2011 and April 30, 2011, respectively.
The intrinsic value of exercised stock options is the difference between the exercise price and the fair value of the underlying common stock as of the exercise date. The aggregate intrinsic value of exercised stock options was $34,000, $1,000, and $0.2 million during fiscal 2009, fiscal 2010 and fiscal 2011, respectively.
As of January 29, 2011 there was $2.4 million of unrecognized stock-based compensation cost, net of estimated forfeitures, related to stock options granted under the 2000 Plan. The unrecognized compensation cost was expected to be recognized over a weighted-average period of 2.7 years.
Stock-based compensation expense was included in the consolidated statements of operations as follows (in thousands):
| Year ended | Three months ended | |||||||||||||||||||
| January 31, 2009 |
January 30, 2010 |
January 29, 2011 |
May 1, 2010 |
April 30, 2011 |
||||||||||||||||
| (unaudited) | ||||||||||||||||||||
| Total cost of revenue |
$ | 51 | $ | 67 | $ | 44 | $ | 9 | $ | 11 | ||||||||||
| Sales and marketing |
498 | 610 | 476 | 86 | 116 | |||||||||||||||
| Research and development |
282 | 366 | 254 | 69 | 62 | |||||||||||||||
| General and administrative |
387 | 366 | 343 | 115 | 132 | |||||||||||||||
|
|
|
|
|
|
|
|
|
|
|
|||||||||||
| $ | 1,218 | $ | 1,409 | $ | 1,117 | $ | 279 | $ | 321 | |||||||||||
|
|
|
|
|
|
|
|
|
|
|
|||||||||||
F-35
Table of Contents
BlueArc Corporation
Notes to consolidated financial statements (continued)
The fair value of each option grant was estimated on the date of grant using the Black Scholes option pricing model with the following assumptions:
| Year Ended | Three Months Ended | |||||||||||||||||||
| January 31, 2009 |
January 30, 2010 |
January 29, 2011 |
May 1, 2010 |
April 30, 2011 |
||||||||||||||||
|
|
||||||||||||||||||||
| (unaudited) | ||||||||||||||||||||
| Risk-free interest rate |
1.8% - 3.3% | 2.0% - 2.5% | 1.4% - 2.7% | 2.4% - 2.7% | 2% | |||||||||||||||
| Expected term (in years) |
5.0 | 4.5 | 4.5 | 4.5 | 4.9 | |||||||||||||||
| Expected dividend |
0% | 0% | 0% | 0% | 0% | |||||||||||||||
| Expected volatility |
47% | 49% - 51% | 50% - 51% | 50% | 53% | |||||||||||||||
|
|
||||||||||||||||||||
The weighted average grant date fair values of options granted to employees for fiscal, 2009, 2010 and 2011 and the three months ended May 1, 2010 and April 30, 2011 were $1.29, $0.25, $0.65, $0.85 and $0.84, respectively.
As the Company has no active trading history, expected volatility was derived from historical volatilities of several peer public companies deemed to be comparable to the Company’s business.
The expected term represents the period that the Company’s stock options are expected to be outstanding, and was estimated based on patterns of historical exercises and post vesting cancellations and the options’ contractual term. The risk-free interest rate is based on the U.S. Treasury yield in effect at the time of grant for zero coupon U.S. Treasury notes with maturities approximately equal to each option’s expected term. The expected dividend was assumed to be zero as the Company has never paid dividends and has no current plans to do so.
The absence of an active market for the Company’s common stock also required the Company’s Board of Directors, the members of which the Company believes have extensive business, finance and venture capital experience, to estimate the fair value of the Company’s common stock for purposes of granting options and for determining stock-based compensation expense for the periods presented. In response to these requirements, the Company’s Board of Directors’ practice has been to estimate the fair market value of common stock at each meeting at which options were granted. The Company has obtained contemporaneous third party valuations to assist the Company’s Board of Directors in determining fair market value. The Company has historically granted stock options at not less than the fair market value of its common stock as determined at the time of grant. These contemporaneous third party valuations used the methodologies, approaches and assumptions consistent with the American Institute of Certified Public Accounts Practice Guide, Valuation of Privately-Held-Company Equity Securities Issued as Compensation (AICPA Practice Guide).
Other factors taken into consideration in assessing the fair market value of the Company’s common stock include: the prices of the recent preferred stock sales to investors in arms-length transactions; our capital resources and financial condition; the preferences held by the preferred stock classes in favor of common shares; the likelihood and timing of achieving a liquidity event, such as an initial public offering or sale of the Company given prevailing market conditions; the Company’s historical operating and financial performance as well as estimates of future financial performance; recent acquisitions and valuations of comparable companies; the hiring of key
F-36
Table of Contents
BlueArc Corporation
Notes to consolidated financial statements (continued)
personnel; the status of the Company’s development, product introduction and sales efforts; revenue growth; industry information such as market growth and volume and macro-economic events; and additional objective and subjective factors relating to the Company’s business.
Stock options granted under the 2000 Plan provide employee option holders the right to early exercise unvested options in exchange for common stock subject to a right of repurchase at the original issuance price in the event the optionee’s employment is terminated either voluntarily or involuntarily. The cash received from employees for the exercise of unvested options is accounted for as a refundable deposit and included in other liabilities on the balance sheet and reclassified into equity as the right of repurchase lapses. Proceeds from early exercises included in other liabilities were immaterial as of January 30, 2010, January 29, 2011 and April 30, 2011.
10. Warrants
Preferred stock warrants
As of January 30, 2010, outstanding warrants to purchase convertible preferred stock consisted of:
| Original issue date | Term (years) |
Convertible preferred stock |
Exercise price |
Number of shares |
Fair value as |
|||||||||||||
|
|
||||||||||||||||||
| (in thousands) | ||||||||||||||||||
| May 2005 |
5.5 | Series CC | $ | 60.00 | 1,500 | $ | — | |||||||||||
| March and April 2008 |
10.0 | Series FF | $ | 4.53 | 147,861 | 458 | ||||||||||||
| March 2009 |
10.0 | Series FF | $ | 4.53 | 248,486 | 857 | ||||||||||||
|
|
|
|
|
|||||||||||||||
| 397,847 | $ | 1,315 | ||||||||||||||||
|
|
|
|
|
|||||||||||||||
The warrants to purchase Series CC expired unexercised in December 2010.
As of January 29, 2011 and April 30, 2011, outstanding warrants to purchase convertible preferred stock consisted of:
| Original issue date | Term (years) |
Convertible preferred stock |
Exercise price |
Number of shares underlying warrants |
Fair value |
Fair value as of April 30, 2011 |
||||||||||||||||
|
|
||||||||||||||||||||||
| (in thousands) | ||||||||||||||||||||||
| (unaudited) | ||||||||||||||||||||||
| March and April 2008 |
10 | Series FF | $ | 4.53 | 73,933 | $ | 123 | $ | 253 | |||||||||||||
| March and April 2008 |
10 | Series FF-1 | $ | 4.53 | 73,928 | 126 | 256 | |||||||||||||||
| March 2009 |
10 | Series FF | $ | 2.53 | 222,429 | 534 | 981 | |||||||||||||||
| March 2009 |
10 | Series FF-1 | $ | 2.53 | 222,428 | 544 | 989 | |||||||||||||||
| July 2010 |
5 | Series GG | $ | 2.53 | 320,393 | 507 | 1,123 | |||||||||||||||
|
|
|
|
|
|
|
|||||||||||||||||
| 913,111 | $ | 1,834 | $ | 3,602 | ||||||||||||||||||
|
|
|
|
|
|
|
|||||||||||||||||
F-37
Table of Contents
BlueArc Corporation
Notes to consolidated financial statements (continued)
The Company used Black-Scholes option pricing model, or to the extent the warrant had antidilutive features, a binomial option pricing model, to estimate the fair value of the preferred stock warrants using the following assumptions:
| Measurement date | Risk free interest rate |
Remaining contractual term (years) |
Dividend yield |
Volatility | ||||||||||||
|
|
||||||||||||||||
| January 30, 2010 |
3.4-3.6% | 5.3-9.0 | — | 65-77% | ||||||||||||
| January 29, 2011 |
0.7-1.9% | 2.2-5.0 | — | 53-58% | ||||||||||||
| April 30, 2011 |
0.5-2.1% | 1.6-5.3 | — | 47-54% | ||||||||||||
|
|
||||||||||||||||
All preferred stock warrants are exercisable immediately and can be exercised for cash or net share settled.
In connection with the Series GG issuance in July 2010, the warrants issued in March and April 2008 to purchase Series FF were adjusted pursuant to their terms so that the warrants now allow the holder to purchase 73,933 shares of Series FF and 73,928 shares of Series FF-1. Also as a result of the Series GG issuance, the 248,486 warrants issued in March 2009 to Gold Hill Capital in connection with the $7.5 million growth capital facility adjusted pursuant to their terms to allow Gold Hill Capital to purchase 222,429 shares of Series FF and 222,428 shares of Series FF-1.
The Company recorded a gain of $0.1 million, a loss of $0.4 million and a loss of $5,000 for the changes in the estimated fair value of the preferred stock warrants for fiscal 2009, fiscal 2010 and fiscal 2011, respectively. For the three months ended April 30, 2011, the Company recorded a loss of $1.8 million for the changes in the estimated fair value of the preferred stock warrants.
Common stock warrants
As of January 30, 2010, January 29, 2011 and April 30, 2011, the Company had the following outstanding warrants to purchase the Company’s common stock:
| Number of shares underlying warrant as of |
||||||||||||||||||||||
| Holder | Original issue date |
Term (years) |
Exercise price |
January 30, 2010 |
January 29, 2011 |
April 30, 2011 |
||||||||||||||||
|
|
||||||||||||||||||||||
| (unaudited) | ||||||||||||||||||||||
| Consultant |
July 2000 | 10 | $ | 630.91 | 1,585 | — | — | |||||||||||||||
| Consultant |
May 2001 | 10 | $ | 44,000 | 4 | 4 | 4 | |||||||||||||||
| HDS |
August 2007 | 3.25 | $ | 5.22 | 302,836 | — | — | |||||||||||||||
| HDS (Note 7) |
April 2008 | 2.6 | $ | 4.13 | 151,418 | — | — | |||||||||||||||
| HDS (Note 7) |
April 2010 | 7 | $ | 1.94 | — | 206,184 | 206,184 | |||||||||||||||
| Gold Hill Capital (Note 6) |
April 2010 | 10 | $ | 1.94 | — | 174,371 | 174,371 | |||||||||||||||
| Gold Hill Capital (Note 6) |
January 2011 | 10 | $ | 1.71 | — | 100,170 | 100,170 | |||||||||||||||
|
|
|
|
|
|
|
|||||||||||||||||
| 455,843 | 480,729 | 480,729 | ||||||||||||||||||||
|
|
|
|
|
|
|
|||||||||||||||||
The outstanding warrants to purchase common stock as of April 30, 2011 are exercisable immediately and can only be exercised for cash or net share settled. The warrants to purchase the Company’s common stock that were issued in July 2000 to a consultant expired unexercised in July 2010. The warrants to purchase the Company’s common stock that were issued to HDS in August 2007 and April 2008 expired unexercised in November 2010.
F-38
Table of Contents
BlueArc Corporation
Notes to consolidated financial statements (continued)
The warrants issued to Gold Hill Capital in April 2010 and January 2011 were initially classified as liabilities and carried at fair value as the number of shares subject to the warrants is subject to a one-time reduction if the Company did not achieve certain performance criteria tied to a measure of quarterly earnings. On January 29, 2011, the then-current fair value of the warrant issued in April 2010 of $0.2 million was reclassified into additional paid-in capital as the Company achieved the performance criteria applicable to this warrant, and the number of shares underlying the warrant is no longer subject to change. The warrant issued to Gold Hill Capital in January 2011 continues to be classified as a liability and was carried at fair value at January 29, 2011 and April 30, 2011. The Company used Black-Scholes option pricing model to estimate the fair value of the common stock warrants using the following assumptions:
| Measurement date | Risk free interest rate |
Remaining contractual term (years) |
Dividend yield |
Volatility | ||||||||||||
|
|
||||||||||||||||
| January 29, 2011 |
3% | 9.2 | — | 60% | ||||||||||||
| April 30, 2011 |
3% | 9.8 | — | 62% | ||||||||||||
|
|
||||||||||||||||
The change in the fair value of the common stock warrant issued to Gold Hill Capital in April 2010 during fiscal 2011 resulted in a gain to other income (expense), net in the amount of $64,000.
The change in the fair value of the common stock warrant issued to Gold Hill Capital in January 2011 during the three months ended April 30, 2011 resulted in a loss to other income (expense), net in the amount of $0.2 million.
11. Net loss per share of common stock
The Company’s basic net loss per share of common stock is calculated by dividing the net loss by the weighted-average number of shares of common stock outstanding for the period. The diluted net loss per share of common stock is computed by giving effect to all potential common stock equivalents outstanding for the period. For purposes of this calculation, convertible preferred stock, stock options to purchase common stock, warrants to purchase convertible preferred stock and warrants to purchase common stock are considered to be common stock equivalents but have been excluded from the calculation of diluted net loss per share of common stock as their effect is antidilutive.
Pro forma basic and diluted net loss per share of common stock has been computed to give effect to the assumed conversion of the convertible preferred stock into common stock upon a qualifying IPO. Also, the numerator in the pro forma basic and diluted net loss per share calculation has been adjusted to remove gains and losses resulting from remeasurements of the preferred stock warrant liability as the related warrants will no longer be remeasured following a Qualified IPO.
F-39
Table of Contents
BlueArc Corporation
Notes to consolidated financial statements (continued)
The following table sets forth the computation of the Company’s basic and diluted net loss per share of common stock during fiscal 2009, fiscal 2010 and fiscal 2011 and three months ended May 1, 2010 and April 30, 2011 (in thousands, except per share amounts).
| Year ended | Three months ended | |||||||||||||||||||
| January 31, 2009 |
January 30, 2010 |
January 29, 2011 |
May 1, 2010 |
April 30, 2011 |
||||||||||||||||
|
|
||||||||||||||||||||
| (unaudited) | ||||||||||||||||||||
| Net Loss |
$ | (19,578 | ) | $ | (15,753 | ) | $ | (9,425 | ) | $ | (3,585 | ) | $ | (4,329 | ) | |||||
| Deemed dividend on exchange of preferred stock |
— | — | (940 | ) | — | — | ||||||||||||||
|
|
|
|
|
|
|
|
|
|
|
|||||||||||
| Net loss attributable to common stockholders |
$ | (19,578 | ) | $ | (15,753 | ) | $ | (10,365 | ) | $ | (3,585 | ) | $ | (4,329 | ) | |||||
|
|
|
|
|
|
|
|
|
|
|
|||||||||||
| Shares used in computing net loss attributable to common stockholders per share of common stock, basic and diluted |
2,241 | 2,404 | 2,930 | 2,438 | 3,465 | |||||||||||||||
|
|
|
|
|
|
|
|
|
|
|
|||||||||||
| Net loss per share of common stock, basic and diluted |
$ | (8.74 | ) | $ | (6.55 | ) | $ | (3.54 | ) | $ | (1.47 | ) | $ | (1.25 | ) | |||||
|
|
|
|
|
|
|
|
|
|
|
|||||||||||
The following outstanding common stock equivalents were excluded from the computation of diluted net loss per share of common stock for the periods presented because including them would have been antidilutive (in thousands):
| Year ended | Three months ended | |||||||||||||||||||
| January 31, 2009 |
January 30, 2010 |
January 29, 2011 |
May 1, 2010 |
April 30, 2011 |
||||||||||||||||
|
|
||||||||||||||||||||
| (unaudited) | ||||||||||||||||||||
| Convertible preferred stock |
28,935 | 28,935 | 36,451 | 28,935 | 36,451 | |||||||||||||||
| Stock options to purchase common stock |
4,541 | 5,998 | 6,811 | 6,161 | 7,019 | |||||||||||||||
| Preferred stock warrants |
149 | 398 | 913 | 398 | 913 | |||||||||||||||
| Common stock warrants |
456 | 456 | 481 | 662 | 481 | |||||||||||||||
|
|
||||||||||||||||||||
The following table sets forth the computation of the Company’s pro forma basic and diluted net loss per share of common stock during fiscal 2011 and three months ended April 30, 2011 (in thousands, except per share data):
| Year ended January 29, 2011 |
Three months ended April 30, 2011 |
|||||||
|
|
||||||||
| (unaudited) | ||||||||
| Net loss |
$ | (9,425 | ) | $ | (4,329 | ) | ||
| Less: Change in fair value of preferred stock warrant liabilities |
(5 | ) | 1,768 | |||||
|
|
|
|
|
|||||
| Net loss used in computing pro forma net loss per share of common stock, basic and diluted |
$ | (9,420 | ) | $ | (2,561 | ) | ||
|
|
|
|
|
|||||
| Shares used in computing net loss per share of common stock, basic and diluted |
2,930 | 3,465 | ||||||
| Pro forma adjustments to reflect assumed conversion of convertible preferred stock |
36,433 | 39,819 | ||||||
|
|
|
|
|
|||||
| Shares used in computing pro forma net loss per share of common stock, basic and diluted |
39,363 | 43,284 | ||||||
|
|
|
|
|
|||||
| Pro forma net loss per share of common stock, basic and diluted |
$ | (0.24 | ) | $ | (0.06 | ) | ||
|
|
|
|
|
|||||
F-40
Table of Contents
BlueArc Corporation
Notes to consolidated financial statements (continued)
12. Income taxes
The domestic and foreign components of loss before benefit from income tax were as follows (in thousands):
| Year ended | ||||||||||||
| January 31, 2009 |
January 30, 2010 |
January 29, 2011 |
||||||||||
|
|
||||||||||||
| Domestic |
$ | (20,865 | ) | $ | (11,490 | ) | $ | (5,745 | ) | |||
| Foreign |
405 | (5,535 | ) | (5,100 | ) | |||||||
|
|
|
|
|
|
|
|||||||
| Loss before benefit for income taxes |
$ | (20,460 | ) | $ | (17,025 | ) | $ | (10,845 | ) | |||
|
|
|
|
|
|
|
|||||||
Benefit (provision) from income taxes consisted of the following (in thousands):
| Year ended | ||||||||||||
| January 31, 2009 |
January 30, 2010 |
January 29, 2011 |
||||||||||
|
|
||||||||||||
| Current: |
||||||||||||
| U.S. Federal |
$ | (20 | ) | $ | (7 | ) | $ | (53 | ) | |||
| State |
(48 | ) | (1 | ) | (37 | ) | ||||||
| Foreign |
950 | 1,280 | 1,510 | |||||||||
|
|
|
|
|
|
|
|||||||
| Total current |
882 | 1,272 | 1,420 | |||||||||
|
|
|
|
|
|
|
|||||||
| Deferred: |
||||||||||||
| U.S. Federal |
— | — | — | |||||||||
| State |
— | — | — | |||||||||
| Foreign |
— | — | — | |||||||||
|
|
|
|
|
|
|
|||||||
| Total benefit from income taxes |
$ | 882 | $ | 1,272 | $ | 1,420 | ||||||
|
|
|
|
|
|
|
|||||||
Reconciliation of the statutory federal income tax rate to the Company’s effective tax rate was as follows:
| Year ended | ||||||||||||
| January 31, 2009 |
January 30, 2010 |
January 29, 2011 |
||||||||||
|
|
||||||||||||
| Tax at federal statutory rate |
34 | % | 34 | % | 34 | % | ||||||
| State income taxes, net of federal benefit |
— | — | — | |||||||||
| Nondeductible permanent difference |
(1 | ) | — | (2 | ) | |||||||
| Foreign rate differential |
5 | (3 | ) | (2 | ) | |||||||
| Change in valuation allowance |
(34 | ) | (23 | ) | (16 | ) | ||||||
| Research and development credits |
1 | 1 | 1 | |||||||||
| Stock-based compensation |
(1 | ) | (2 | ) | (2 | ) | ||||||
|
|
|
|
|
|
|
|||||||
| Benefit from income taxes |
4 | % | 7 | % | 13 | % | ||||||
|
|
|
|
|
|
|
|||||||
F-41
Table of Contents
BlueArc Corporation
Notes to consolidated financial statements (continued)
Deferred tax assets consist of the following (in thousands):
| January 30, 2010 |
January 29, 2011 |
|||||||
|
|
||||||||
| Deferred tax assets: |
||||||||
| Depreciation and amortization |
$ | 841 | $ | 893 | ||||
| Deferred revenue |
1,603 | 1,532 | ||||||
| Accrued liabilities and allowances |
3,475 | 3,263 | ||||||
| Federal and state credit carryforwards |
1,608 | 1,758 | ||||||
| Stock-based compensation |
458 | 634 | ||||||
| Other |
148 | 185 | ||||||
| Net operating loss carryforwards |
31,239 | 29,809 | ||||||
|
|
|
|
|
|||||
| Gross deferred tax assets |
39,372 | 38,074 | ||||||
| Deferred tax liability |
— | — | ||||||
|
|
|
|
|
|||||
| Total deferred tax assets |
39,372 | 38,074 | ||||||
| Valuation allowance |
(39,372 | ) | (38,074 | ) | ||||
|
|
|
|
|
|||||
| Net deferred tax assets |
$ | — | $ | — | ||||
|
|
|
|
|
|||||
Management believes that, based on a number of factors, it is more likely than not that the deferred tax assets will not be utilized. As a result, the Company recorded a full valuation allowance.
The following table sets forth the changes in the valuation allowance, for all periods presented (in thousands):
| Valuation Allowance |
||||
| Balance, January 31, 2008 |
$ | 35,691 | ||
| Decrease credited to operations |
(820 | ) | ||
|
|
|
|||
| Balance, January 31, 2009 |
34,871 | |||
| Additions charged to operations |
4,501 | |||
|
|
|
|||
| Balance, January 30, 2010 |
39,372 | |||
| Decrease credited to operations |
(1,298 | ) | ||
|
|
|
|||
| Balance, January 29, 2011 |
$ | 38,074 | ||
|
|
|
|||
The Internal Revenue Code limits the use of net operating loss and tax credit carry-forwards in certain situations where changes occur in the stock ownership of a company. A limitation in the amount of net operating losses that the Company may utilize in any one year may be caused by a cumulative change of more than 50% of the Company’s stock ownership, as defined in the Internal Revenue Code, over a three year period. The Company experienced an ownership change as defined in Section 382 of the Internal Revenue Code in July 2003. This change resulted in an annual limitation of $1.4 million on all net operating losses incurred prior to this date. As a result of this limitation, utilization of the net operating loss carry-forwards may be limited. The Company has not experienced another ownership change through January 31, 2011.
As of January 29, 2011, the Company had net operating loss carry-forwards of approximately $106.7 million and $83.7 million for federal and state tax purposes, respectively. The net operating loss carry-forwards expire between 2015 and 2030. The Company also had a United Kingdom net operating loss carry-forward of approximately $32.9 million, which can be carried forward indefinitely. As of January 29, 2011, the Company has federal and state research and
F-42
Table of Contents
BlueArc Corporation
Notes to consolidated financial statements (continued)
development credit carry-forwards of approximately $2.0 million and $1.2 million, respectively. If not utilized, the federal research and development credit carry-forward will expire in various amounts beginning in 2024. The California credit can be carried forward indefinitely.
The Company received $0.7 million and $1.3 million in cash for research and development tax credits from the United Kingdom’s HM Revenue & Customs for research work completed during fiscal 2009 and fiscal 2010; this tax credit is estimated to total approximately $1.6 million for fiscal 2011.
A reconciliation of the beginning and ending amount of unrecognized tax benefits is as follows (in thousands):
| Balances as of January 31, 2008 |
$ | 9,839 | ||
| Additions based on tax positions related to the current year |
5,995 | |||
|
|
|
|||
| Balances as of January 31, 2009 |
15,834 | |||
| Additions based on tax positions related to the current year |
4,600 | |||
|
|
|
|||
| Balances as of January 30, 2010 |
20,434 | |||
| Additional based on tax positions related to the current year |
2,105 | |||
| Reductions based on tax positions related to the prior year |
(311 | ) | ||
|
|
|
|||
| Balances as of January 29, 2011 |
$ | 22,228 | ||
|
|
|
|||
The amount of unrecognized tax benefits that, if recognized, would affect the Company’s effective tax rate is approximately $0.2 million for fiscal 2011. The Company recognizes interest and penalties related to uncertain tax positions in income tax expense. At January 2011, the Company had no interest or penalties accrued related to uncertain tax positions
The Company files income tax returns in the United States, various states and certain foreign jurisdictions. As a result of net operating loss carry-forwards, all of the Company’s tax years are subject to federal, state and foreign tax examination.
Income tax benefit for the three months ended May 1, 2010 and April 30, 2011 was $0.3 million and $0.5 million, respectively, and was comprised of federal, state and foreign income tax benefits. The benefit from income taxes for the periods differs from the 34% U.S. federal statutory rate primarily due to maintaining a valuation allowance for world-wide losses and tax assets which the Company does not consider to be realizable. The Company benefited from the foreign losses it surrendered. The Company benefited from the provision for cash refundable research and development credit it receives in the United Kingdom.
As of May 1, 2010 and April 30, 2011, the Company had a valuation allowance against the full amount of any net deferred tax assets. The Company currently provides a valuation allowance against deferred tax assets when it is more likely than not that some portion, or all, of its deferred tax assets will not be realized. As of January 29, 2011, the Company had a deferred tax asset of approximately $38.1 million, which was fully offset by a valuation allowance. If and when realized, the asset will be reflected on the Company’s balance sheet and the reversal of the corresponding valuation allowance will result in a tax benefit being recorded in the income statement in the respective period.
F-43
Table of Contents
BlueArc Corporation
Notes to consolidated financial statements (continued)
As of April 30, 2011, the total amount of gross unrecognized benefits was $22.8 million. Included in this balance was approximately $0.2 million of unrecognized tax benefits that, if recognized, would affect the effective income tax rate. The gross unrecognized tax benefits increased by $0.6 million during the three months ended April 30, 2011.
The Company does not expect any material change in its unrecognized tax benefits over the next 12 months.
13. Employee benefit plans
The Company has made available to all full-time United States employees a 401(k) retirement savings plan. Under this plan, employee and employer contributions and accumulated plan earnings qualify for favorable tax treatment under Section 401(k) of the Internal Revenue Code. The Company has not contributed to the plan.
The Company has a retirement savings plan available to all of its full-time United Kingdom employees. Under this United Kingdom plan, employee and employer contributions and accumulated plan earnings qualify for favorable tax treatment under Chapter IV, Part XIV, of the United Kingdom Income and Corporation Taxes Act of 1988. Company contributions to the United Kingdom plan totaled $0.4 million, $0.2 million and $0.5 million for fiscal 2009, 2010 and 2011, respectively.
14. Segment reporting
Operating segments are defined as components of an enterprise about which separate financial information is available that is evaluated regularly by the chief operating decision maker, or decision making group, in deciding how to allocate resources and in assessing performance. The Company’s chief operating decision maker is its Chief Executive Officer. The Chief Executive Officer reviews financial information presented on a consolidated basis, accompanied by information about revenue by geographic region for purposes of allocating resources and evaluating financial performance. The Company has one business activity and there are no segment managers who are held accountable for operations, operating results and plans below the consolidated level. Accordingly, the Company has a single reporting segment and operating unit structure.
F-44
Table of Contents
BlueArc Corporation
Notes to consolidated financial statements (continued)
Geographical information
Operations outside of the United Sates consist principally of research and development and sales activities. Geographic revenue is identified by the location of the end customer and in the event that the Company ships its storage systems to an OEM, reseller or other channel partner and does not have end customer shipping information, geographic revenue is identified by the ship to location of the OEM, reseller or other channel partner. Identifiable long-lived assets are those assets that can be directly associated with a particular geographic area. The following table presents the Company’s revenues by geographic area and the Company’s long-lived assets held in each geographic region (in thousands):
| Year ended | Three months ended | |||||||||||||||||||
| January 31, 2009 |
January 30, 2010 |
January 29, 2011 |
May 1, 2010 |
April 30, 2011 |
||||||||||||||||
|
|
||||||||||||||||||||
| (unaudited) | ||||||||||||||||||||
| Revenue: |
||||||||||||||||||||
| United States |
$ | 51,645 | $ | 50,295 | $ | 59,492 | $ | 12,549 | $ | 17,218 | ||||||||||
| Canada |
8,830 | 1,932 | 3,943 | 1,915 | 806 | |||||||||||||||
| EMEA |
9,002 | 7,372 | 15,937 | 3,700 | 4,442 | |||||||||||||||
| Other |
4,753 | 6,276 | 6,217 | 450 | 2,246 | |||||||||||||||
|
|
|
|
|
|
|
|
|
|
|
|||||||||||
| Total |
$ | 74,230 | $ | 65,875 | $ | 85,589 | $ | 18,614 | $ | 24,712 | ||||||||||
|
|
|
|
|
|
|
|
|
|
|
|||||||||||
| January 30, 2010 |
January 29, 2011 |
April 30, 2011 |
||||||||||
|
|
||||||||||||
| (unaudited) | ||||||||||||
| Long-lived assets: |
||||||||||||
| United States |
$ | 3,926 | $ | 4,858 | $ | 5,371 | ||||||
| United Kingdom |
1,628 | 2,295 | 2,551 | |||||||||
|
|
|
|
|
|
|
|||||||
| Total |
$ | 5,554 | $ | 7,153 | $ | 7,922 | ||||||
|
|
|
|
|
|
|
|||||||
15. Related party transactions
The Company has a contractual arrangement with a member of the board of directors for business advisory consulting services. The costs were expensed as incurred. There were no consulting expenses for fiscal 2009 and these consulting expenses were approximately $0.2 million for each of fiscal 2010 and 2011 and $45,000 for the three months ended April 30, 2011. In addition, the Company issued a total of 28,926 shares of its restricted stock, subject to a right of repurchase, to the director during fiscal 2011. The right of repurchase lapses monthly over 6 months from November 1, 2010. As of January 29, 2011 and April 30, 2011, no shares and 24,105 shares were vested, respectively.
16. Subsequent events
Between May 1, 2011 and June 22, 2011, the Company’s board of directors issued options to purchase 2,155,253 shares of its common stock to eligible service providers with a weighted average exercise price of $3.99.
F-45
Table of Contents
BlueArc Corporation
Notes to consolidated financial statements (continued)
In June 2011, the Company’s board of directors approved the increase in the number of shares authorized for issuance under its 2000 Plan of 1,943,020 shares to an aggregate of 12,405,677 shares. The Company intends to seek the approval of its stockholders for the increase in the number of shares authorized for issuance under the 2000 Plan.
In June 2011, the Company’s board of directors approved an initial public offering of shares of the Company’s common stock by the Company and selling stockholders under the Securities Act of 1933.
In June 2011, the Company’s board of directors approved an amendment to the Company’s amended and restated certificate of incorporation to effect the following:
| • | an increase in the number of authorized shares of the Company’s common stock from 50,540,389 shares to 75,950,000 shares; |
| • | the reduction in the number of authorized shares of certain series of its preferred stock to eliminate authorized but unissued shares; and |
| • | the removal of a formula to describe the liquidation preferences of the Company’s various series of preferred stock and replacement of the formula with the specified dollar amounts the application of the formula resulted in. |
Additionally, in June 2011, the Company’s board of directors approved an amendment and restatement of the Company’s certificate of incorporation immediately prior to the closing of the IPO to:
• increase the number of authorized shares of its common stock from 75,950,000 to 500,000,000 shares;
| • | effect the creation and authorization of 50,000,000 shares of undesignated preferred stock, par value $0.001 per share; |
| • | provide for the classification of the Company’s board of directors into three classes, with each such class serving a three year term and only one class subject to election in any given fiscal year; |
| • | eliminate the right of stockholders to act by written consent; and |
| • | provide for the removal of members of the Company’s board of directors only for cause. |
These amendments to the Company certificate of incorporation are subject to the approval of the Company’s stockholders and will become effective after its filing of the amended and restated certificate of incorporation with the Secretary of State of the State of Delaware prior to completion of the offering.
F-46
Table of Contents
BlueArc Corporation
Notes to consolidated financial statements (continued)
In June 2011, the Company’s board of directors approved and, unless otherwise noted, subject to the approval of the Company’s stockholders, the following actions to occur prior to or concurrently with the time the Company’s Registration Statement on Form S-1 is declared effective by the Securities and Exchange Commission:
| • | Termination of the 2000 Stock Plan as to future option grants other than pursuant to subplans for certain of the Company’s subsidiaries outside of the United States until such time as new sub-plans for these foreign subsidiaries have received any necessary qualification under applicable foreign laws. The Company does not expect to seek approval from its stockholders on this action. |
| • | Adoption of the 2011 Equity Incentive Plan—The board of directors adopted a 2011 Equity Incentive Plan to replace the 2000 Plan. The 2011 plan will terminate in June 2021, unless the board of directors terminates it sooner. The Company intends to seek the approval of its stockholders for the 2011 Equity Incentive Plan. |
In June 2011, the Company’s spare parts logistics provider suffered a fire at one of its depots and $350,000 of the Company’s spare parts inventory was destroyed. The Company put in place alternate arrangements to support customer part replacement needs. The Company believes that the losses it incurred as a result of the fire will be covered by insurance but cannot determine when, if and to what extent it will be reimbursed for its losses.
The Company evaluated subsequent events through June 23, 2011.
F-47
Table of Contents

Table of Contents
shares

Common stock
Prospectus
| J.P. Morgan | BofA Merrill Lynch | Credit Suisse | ||
| William Blair & Company | ||||
| Pacific Crest Securities | ThinkEquity LLC | |||
Through and including , 2011 (the 25th day after the date of this prospectus), all dealers effecting transactions in these securities, whether or not participating in this offering, may be required to deliver a prospectus. This is in addition to a dealer’s obligation to deliver a prospectus when acting as an underwriter and with respect to an unsold allotment or subscription.
Table of Contents
Part II
Information not required in prospectus
Item 13. Other expenses of issuance and distribution.
The following table presents the costs and expenses, other than underwriting discounts and commissions, payable by us for the sale of common stock being registered. All amounts are estimates except the SEC registration fee, the Financial Industry Regulatory Authority, or FINRA, filing fees and The NASDAQ Global Market or New York Stock Exchange listing fee.
| SEC registration fee |
$ | 11,610 | ||
| FINRA filing fee |
10,500 | |||
| NASDAQ Global Market or New York Stock Exchange, as applicable, listing fee |
* | |||
| Printing and engraving expenses |
* | |||
| Legal fees and expenses |
* | |||
| Accounting fees and expenses |
* | |||
| Blue sky fees and expenses |
* | |||
| Custodian and transfer agent fees |
* | |||
| Miscellaneous fees and expenses |
* | |||
|
|
|
|||
| Total |
$ | * | ||
|
|
|
|||
| * | To be completed by amendment. |
Item 14. Indemnification of directors and officers.
Our restated certificate of incorporation and amended and restated bylaws contain provisions relating to the limitation of liability and indemnification of directors and officers. The restated certificate of incorporation provides that our directors will not be personally liable to us or our stockholders for monetary damages for any breach of fiduciary duty as a director, except for liability:
| • | for any breach of the director’s duty of loyalty to us or our stockholders; |
| • | for acts or omissions not in good faith or that involve intentional misconduct or a knowing violation of law; |
| • | in respect of unlawful payments of dividends or unlawful stock repurchases or redemptions as provided in Section 174 of the Delaware General Corporation Law; or |
| • | for any transaction from which the director derives any improper personal benefit. |
Our restated certificate of incorporation also provides that if Delaware law is amended after the approval by our stockholders of the certificate of incorporation to authorize corporate action further eliminating or limiting the personal liability of directors, then the liability of our directors will be eliminated or limited to the fullest extent permitted by Delaware law.
Our amended and restated bylaws provide that we will indemnify our directors and officers to the fullest extent permitted by Delaware law, as it now exists or may in the future be amended, against all expenses and liabilities reasonably incurred for their service for or on our behalf. Our amended and restated bylaws provide that we shall advance the expenses incurred by a director or officer in advance of the final disposition of an action or proceeding. The bylaws also
II-1
Table of Contents
authorize us to indemnify any of our employees or agents and permit us to secure insurance on behalf of any officer, director, employee or agent for any liability arising out of his or her action in that capacity, whether or not Delaware law would otherwise permit indemnification.
We have entered into indemnification agreements with each of our directors and executive officers and certain other key employees, a form of which is attached as Exhibit 10.1. The form of agreement provides that we will indemnify each of our directors, executive officers and such other key employees against any and all expenses incurred by that director, executive officer or other key employee because of his or her status as one of our directors, executive officers or other key employees, to the fullest extent permitted by Delaware law, our restated certificate of incorporation and our amended and restated bylaws (except in a proceeding initiated by such person without board approval). In addition, the form agreement provides that, to the fullest extent permitted by Delaware law, we will advance all expenses incurred by our directors, executive officers and other key employees for a legal proceeding.
Reference is made to Section of the underwriting agreement contained in Exhibit 1.1 to this registration statement, indemnifying our directors and officers against limited liabilities. In addition, Section 2.8 of our amended and restated investors’ rights agreement contained in Exhibit 4.8 to this registration statement provides for indemnification of certain of our stockholders against liabilities described in our amended and restated investors’ rights agreement.
Item 15. Recent sales of unregistered securities.
Since February 1, 2008, we have issued the following securities that were not registered under the Securities Act:
(1) Sales of preferred stock
| • | In May, July and August 2008, we issued 5,140,814 shares of Series FF preferred stock to 24 accredited investors at a price of $4.52742 per share for aggregate gross proceeds of approximately $23.3 million. |
| • | In July 2010, we issued 8,342,358 shares of Series GG preferred stock to 32 accredited investors at a price of $2.5289 per share for aggregate gross proceeds of approximately $21.1 million. |
| • | In July 2010, we issued 2,691,061 shares of Series AA-1 preferred stock, 4,603,023 shares of Series BB-1 preferred stock, 3,279,749 shares of Series DD-1 preferred stock and 2,517,391 shares of Series FF-1 preferred stock to our existing stockholders pursuant to a recapitalization. |
(2) Sale of convertible promissory notes
| • | In March and April 2008, we issued approximately $6.7 million in convertible promissory notes to accredited investors. |
| • | In February 2010, we issued approximately $2.7 million in convertible promissory notes to accredited investors. |
(3) Warrants
| • | In March and April 2008, in connection with the issuance of the convertible promissory notes, we issued warrants to accredited investors to purchase shares of our Series FF preferred stock or, if we did not issue any shares of Series FF preferred stock in a qualified financing, Series DD preferred stock. |
II-2
Table of Contents
| • | In February 2010, in connection with the issuance of the convertible promissory notes, we issued warrants to accredited investors to purchase shares of our Series GG preferred stock, or if we did not issue any shares of Series GG preferred stock in a qualified financing, Series FF preferred stock. |
| • | In November 2006, we authorized the future issuance to an accredited investor, subject to certain performance milestones, of up to 9 warrants to purchase a total of 1,362,762 shares of common stock at the fair market value on date of issuance of the warrant. As of July 30, 2011, we have issued 6 warrants to purchase an aggregate of 480,729 shares of common stock. |
| • | Between April 2010 and January 2011, we issued warrants to purchase an aggregate of 274,451 shares of common stock at the fair market value on the date of issuance of the warrants to an accredited investor. |
(4) Issuances of Options and Stock Purchase Rights
| • | From February 1, 2008 through July 30, 2011, we issued and sold an aggregate of 291,678 shares of common stock upon the exercise of options and stock purchase rights issued to certain officers, directors, employees and consultants of the registrant’s 2000 Plan at exercise prices ranging from $0.03 to $5.22 per share, for an aggregate consideration of approximately $216,228. |
| • | From February 1, 2008 through July 30, 2011, we granted direct issuances or stock options to purchase an aggregate of 9,552,874 shares of our common stock at exercise prices ranging from $0.83 to $5.22 per share to employees, consultants, directors and other service providers under our 2000 Plan. |
None of the foregoing transactions involved any underwriters, underwriting discounts or commissions, or any public offering, and the registrant believes the transactions were exempt from the registration requirements of the Securities Act in reliance on Section 4(2) thereof, with respect to the items (1), (2) and (3) above, and Rule 701 thereunder, with respect to the item (4) above, as transactions by an issuer not involving a public offering or transactions pursuant to compensatory benefit plans and contracts relating to compensation as provided under such Rule 701.
II-3
Table of Contents
Item 16. Exhibits and financial statement schedules.
(a) Exhibits.
| Exhibit number |
Description | |
|
| ||
| 1.1† | Form of Underwriting Agreement. | |
| 3.1 | Amended and Restated Certificate of Incorporation of the Registrant to be effective upon closing of this offering. | |
| 3.1.1 | Amended and Restated Certificate of Incorporation of the Registrant as currently in effect. | |
| 3.1.2† | Certificate of Amendment to Amended and Restated Certificate of Incorporation of the Registrant. | |
| 3.2 | Amended and Restated Bylaws of the Registrant to be effective upon the closing of this offering. | |
| 4.1† | Form of Common Stock Certificate of the Registrant. | |
| 4.2# | Warrant Agreement between the Registrant and Gold Hill Capital 2008, LP dated January 26, 2011. | |
| 4.3# | Warrant Agreement between the Registrant and Gold Hill Capital 2008, LP dated April 2010. | |
| 4.4# | Warrant Agreement between the Registrant and Gold Hill Capital 2008, LP dated March 30, 2009. | |
| 4.5# | Form of Warrant to purchase Series FF Preferred Stock. | |
| 4.6# | Form of Warrant to purchase Series GG Preferred Stock. | |
| 4.7# | Form of Warrant Agreement between the Registrant and Hitachi Data Systems Corporation. | |
| 4.8# | Amended and Restated Investor’s Rights Agreement dated July 14, 2010 by and among the Registrant and certain stockholders of the Registrant. | |
| 5.1† | Opinion of Wilson Sonsini Goodrich & Rosati, Professional Corporation. | |
| 10.1# | Form of Indemnification Agreement for directors and executive officers. | |
| 10.2# | 2000 Stock Plan and form of agreements used thereunder. | |
| 10.3† | 2011 Equity Incentive Plan and form of agreements used thereunder. | |
| 10.4*# | OEM License and Distribution Agreement by and between the Registrant and LSI Logic Storage Systems, Inc. dated November 12, 2003. | |
| 10.5*# | Manufacturing Services Agreement by and between the Registrant and Sanmina-SCI Corporation dated October 19, 2006. | |
| 10.6*# | Master Distribution Agreement by and between the Registrant and Hitachi Data Systems Corporation dated November 15, 2006. | |
| 10.6A*# | Amendment No. One to Master Distribution Agreement by and between the Registrant and Hitachi Data Systems Corporation dated October 21, 2008. | |
| 10.6B*# | Amendment No. Two to Master Distribution Agreement by and between the Registrant and Hitachi Data Systems Corporation dated August 31, 2009. | |
II-4
Table of Contents
| Exhibit number |
Description | |
| 10.6C*# | Amendment No. Three to Master Distribution Agreement by and between the Registrant and Hitachi Data Systems Corporation dated March 19, 2010. | |
| 10.7# | Change of Control Severance Agreement by and between the Registrant and Michael B. Gustafson dated June 1, 2009. | |
| 10.8# | Change of Control Severance Agreement by and between the Registrant and Shmuel Shottan dated June 1, 2009. | |
| 10.9# | Form of Change of Control Severance Agreement by and between the Registrant and each of Rick Martig, Christopher J. McBride and Bridget Warwick. | |
| 10.10# | Form of First Year Executive Change of Control Severance Agreement by and between the Registrant and each of David De Simone and Christopher P. White. | |
| 10.11# | Office Lease between the Registrant and Carr NP Properties, L.L.C. dated July 16, 2009. | |
| 10.12# | Lease between the Registrant and the Scottish Provident Institution dated October 18, 2000. | |
| 10.13# | Loan and Security Agreement between the Registrant and Gold Hill Capital 2008, LP dated as of March 30, 2009, as amended by that certain First Amendment to Loan and Security Agreement dated April 2010 and that certain Second Amendment to Loan and Security Agreement dated as of January 26, 2011. | |
| 10.14# | Second Amended and Restated Loan and Security Agreement between the Registrant and Silicon Valley Bank dated as of March 30, 2009. | |
| 10.14A# | First Amendment to Second Amended and Restated Loan and Security Agreement between the Registrant and Silicon Valley Bank dated as of April 26, 2010. | |
| 10.14B# | Second Amendment to Second Amended and Restated Loan and Security Agreement between the Registrant and Silicon Valley Bank dated as of November 1, 2010. | |
| 10.14C# | Third Amendment to Second Amended and Restated Loan and Security Agreement between the Registrant and Silicon Valley Bank dated as of June 2, 2011. | |
| 21.1 | Subsidiaries. | |
| 23.1 | Consent of PricewaterhouseCoopers LLP, Independent Registered Public Accounting Firm. | |
| 23.2† | Consent of Wilson Sonsini Goodrich & Rosati, Professional Corporation (See Exhibit 5.1). | |
| 24.1# | Power of Attorney (See Page II-8 of the original filing of this Form S-1). | |
|
| ||
| * | Confidential treatment has been requested with respect to certain portions of this exhibit. Omitted portions have been filed separately with the Securities and Exchange Commission. |
| † | To be filed by amendment. |
| # | Previously filed. |
(b) Financial Statements Schedules—All schedules are omitted because they are not applicable or the required information is shown in the financial statements or notes thereto.
II-5
Table of Contents
Item 17. Undertakings.
The undersigned Registrant hereby undertakes to provide to the underwriters at the closing specified in the Purchase Agreement certificates in such denominations and registered in such names as required by the underwriters to permit prompt delivery to each purchaser.
Insofar as indemnification by the Registrant for liabilities arising under the Securities Act may be permitted to directors, officers and controlling persons of the Registrant pursuant to the provisions described in Item 14 or otherwise, the Registrant has been advised that in the opinion of the Securities and Exchange Commission such indemnification is against public policy as expressed in the Securities Act and is, therefore, unenforceable. In the event that a claim for indemnification against such liabilities (other than the payment by the Registrant of expenses incurred or paid by a director, officer or controlling person of the Registrant in the successful defense of any action, suit or proceeding) is asserted by such director, officer or controlling person in connection with the securities being registered, the Registrant will, unless in the opinion of its counsel the matter has been settled by controlling precedent, submit to a court of appropriate jurisdiction the question whether such indemnification by it is against public policy as expressed in the Securities Act and will be governed by the final adjudication of such issue.
The undersigned Registrant hereby undertakes that:
(1) For purposes of determining any liability under the Securities Act of 1933, the information omitted from the form of prospectus filed as part of this registration statement in reliance upon Rule 430A and contained in a form of prospectus filed by the registrant pursuant to Rule 424(b)(1) or (4), or 497(h) under the Securities Act of 1933, shall be deemed to be part of this registration statement as of the time it was declared effective.
(2) For the purpose of determining any liability under the Securities Act of 1933, each post-effective amendment that contains a form of prospectus shall be deemed to be a new registration statement relating to the securities offered therein, and this offering of such securities at that time shall be deemed to be the initial bona fide offering thereof.
II-6
Table of Contents
Signatures
Pursuant to the requirements of the Securities Act of 1933, the registrant has duly caused this Amendment No. 1 to the Registration Statement to be signed on its behalf by the undersigned, thereunto duly authorized, in the City of San Jose, State of California, on the 5th day of August 2011.
| BlueArc Corporation | ||
| By: |
/s/ Michael B. Gustafson | |
| Michael B. Gustafson | ||
| President, Chief Executive Officer and Director | ||
Pursuant to the requirements of the Securities Act of 1933, this Amendment No. 1 to the Registration Statement has been signed by the following persons in the capacities and on the dates shown:
| Signature |
Title |
Date | ||
| /s/ Michael B. Gustafson Michael B. Gustafson |
President, Chief Executive Officer and Director (Principal Executive Officer) |
August 5, 2011 | ||
| /s/ Rick Martig Rick Martig |
Chief Financial Officer (Principal Financial and Accounting Officer) |
August 5, 2011 | ||
| /s/ Paul S. Madera* Paul S. Madera |
Director |
August 5, 2011 | ||
| /s/ David N. Martin* David N. Martin |
Director |
August 5, 2011 | ||
| /s/ Gary J. Morgenthaler* Gary J. Morgenthaler |
Director |
August 5, 2011 | ||
| /s/ Michael J. Stark* Michael J. Stark |
Director |
August 5, 2011 | ||
| /s/ José F. Suarez* José F. Suarez |
Director |
August 5, 2011 | ||
| /s/ Duston M. Williams* Duston M. Williams |
Director |
August 5, 2011 | ||
| *By: |
/s/ Rick Martig | |
| Rick Martig | ||
| Attorney in Fact |
II-7
Table of Contents
Exhibit index
| Exhibit number |
Description | |
|
| ||
| 1.1† | Form of Underwriting Agreement. | |
| 3.1 | Amended and Restated Certificate of Incorporation of the Registrant to be effective upon closing of this offering. | |
| 3.1.1 | Amended and Restated Certificate of Incorporation of the Registrant as currently in effect. | |
| 3.1.2† | Certificate of Amendment to Amended and Restated Certificate of Incorporation of the Registrant. | |
| 3.2 | Amended and Restated Bylaws of the Registrant to be effective upon the closing of this offering. | |
| 4.1† | Form of Common Stock Certificate of the Registrant. | |
| 4.2# | Warrant Agreement between the Registrant and Gold Hill Capital 2008, LP dated January 26, 2011. | |
| 4.3# | Warrant Agreement between the Registrant and Gold Hill Capital 2008, LP dated April 2010. | |
| 4.4# | Warrant Agreement between the Registrant and Gold Hill Capital 2008, LP dated March 30, 2009. | |
| 4.5# | Form of Warrant to purchase Series FF Preferred Stock. | |
| 4.6# | Form of Warrant to purchase Series GG Preferred Stock. | |
| 4.7# | Form of Warrant Agreement between the Registrant and Hitachi Data Systems Corporation. | |
| 4.8# | Amended and Restated Investor’s Rights Agreement dated July 14, 2010 by and among the Registrant and certain stockholders of the Registrant. | |
| 5.1† | Opinion of Wilson Sonsini Goodrich & Rosati, Professional Corporation. | |
| 10.1# | Form of Indemnification Agreement for directors and executive officers. | |
| 10.2# | 2000 Stock Plan and form of agreements used thereunder. | |
| 10.3† | 2011 Equity Incentive Plan and form of agreements used thereunder. | |
| 10.4*# | OEM License and Distribution Agreement by and between the Registrant and LSI Logic Storage Systems, Inc. dated November 12, 2003. | |
| 10.5*# | Manufacturing Services Agreement by and between the Registrant and Sanmina-SCI Corporation dated October 19, 2006. | |
| 10.6*# | Master Distribution Agreement by and between the Registrant and Hitachi Data Systems Corporation dated November 15, 2006. | |
| 10.6A*# | Amendment No. One to Master Distribution Agreement by and between the Registrant and Hitachi Data Systems Corporation dated October 21, 2008. | |
| 10.6B*# | Amendment No. Two to Master Distribution Agreement by and between the Registrant and Hitachi Data Systems Corporation dated August 31, 2009. | |
| 10.6C*# | Amendment No. Three to Master Distribution Agreement by and between the Registrant and Hitachi Data Systems Corporation dated March 19, 2010. | |
Table of Contents
| Exhibit number |
Description | |
| 10.7# | Change of Control Severance Agreement by and between the Registrant and Michael B. Gustafson dated June 1, 2009. | |
| 10.8# | Change of Control Severance Agreement by and between the Registrant and Shmuel Shottan dated June 1, 2009. | |
| 10.9# | Form of Change of Control Severance Agreement by and between the Registrant and each of Rick Martig, Christopher J. McBride and Bridget Warwick. | |
| 10.10# | Form of First Year Executive Change of Control Severance Agreement by and between the Registrant and each of David De Simone and Christopher P. White. | |
| 10.11# | Office Lease between the Registrant and Carr NP Properties, L.L.C. dated July 16, 2009. | |
| 10.12# | Lease between the Registrant and the Scottish Provident Institution dated October 18, 2000. | |
| 10.13# | Loan and Security Agreement between the Registrant and Gold Hill Capital 2008, LP dated as of March 30, 2009, as amended by that certain First Amendment to Loan and Security Agreement dated April 2010 and that certain Second Amendment to Loan and Security Agreement dated as of January 26, 2011. | |
| 10.14# | Second Amended and Restated Loan and Security Agreement between the Registrant and Silicon Valley Bank dated as of March 30, 2009. | |
| 10.14A# | First Amendment to Second Amended and Restated Loan and Security Agreement between the Registrant and Silicon Valley Bank dated as of April 26, 2010. | |
| 10.14B# | Second Amendment to Second Amended and Restated Loan and Security Agreement between the Registrant and Silicon Valley Bank dated as of November 1, 2010. | |
| 10.14C# | Third Amendment to Second Amended and Restated Loan and Security Agreement between the Registrant and Silicon Valley Bank dated as of June 2, 2011. | |
| 21.1 | Subsidiaries. | |
| 23.1 | Consent of PricewaterhouseCoopers LLP, Independent Registered Public Accounting Firm. | |
| 23.2† | Consent of Wilson Sonsini Goodrich & Rosati, Professional Corporation (See Exhibit 5.1). | |
| 24.1# | Power of Attorney (See Page II-8 of the original filing of this Form S-1). | |
|
| ||
| * | Confidential treatment has been requested with respect to certain portions of this exhibit. Omitted portions have been filed separately with the Securities and Exchange Commission. |
| † | To be filed by amendment. |
| # | Previously filed. |