Attached files
| file | filename |
|---|---|
| EX-99.1 - PRESS RELEASE - SUNOCO INC | dex991.htm |
| 8-K - SUNOCO INC--FORM 8-K - SUNOCO INC | d8k.htm |
 2Q11 Earnings Conference Call
August 4, 2011
Exhibit 99.2 |
 2
Safe Harbor Statement
This slide presentation should be reviewed in conjunction with Sunoco’s Second Quarter 2011
earnings conference call held on August 4, 2011 at 5:00 p.m. ET. You may listen to the audio
portion of the conference call on the website or an audio recording will be available after the
call’s completion by calling 1-800-294-0988 and entering conference
ID #3113054.
Statements in this presentation that are not historical facts are forward-looking statements
intended to be covered by the safe harbor provisions of Section 27A of the Securities Act of
1933 and Section 21E of the Securities Exchange Act of 1934. These forward-looking
statements are based upon assumptions by Sunoco concerning future conditions, any or all of
which ultimately may prove to be inaccurate, and upon the current knowledge, beliefs and expectations of Sunoco
management. These forward-looking statements are not guarantees of future performance.
Forward-looking statements are inherently uncertain and involve significant risks and
uncertainties that could cause actual results to differ materially from those described during
this presentation. Such risks and uncertainties include economic, business, competitive
and/or regulatory factors affecting Sunoco's business, as well as uncertainties related to the
outcomes of pending or future litigation. In accordance with the safe harbor provisions of the
Private Securities Litigation Reform Act of 1995, Sunoco has included in its Annual Report on
Form 10-K for the year ended December 31, 2010, and in its subsequent Form 10-Q and
Form 8-K filings, cautionary language identifying important factors (though not necessarily
all such factors) that could cause future outcomes to differ materially from those set forth in the forward-
looking statements. For more information concerning these factors, see Sunoco's Securities and
Exchange Commission filings, available on Sunoco's website at www.SunocoInc.com. Sunoco
expressly disclaims any obligation to update or alter its forward-looking statements,
whether as a result of new information, future events or otherwise. This presentation includes
certain non-GAAP financial measures intended to supplement, not substitute for, comparable
GAAP measures. Reconciliations of non-GAAP financial measures to GAAP financial measures are
provided in the Appendix at the end of the presentation. Investors are urged to consider
carefully the comparable GAAP measures and the reconciliations to those measures provided in
the Appendix, or on our website at www.SunocoInc.com. |
 3
After-tax income before special items of $49MM* ($0.40/share diluted),
pretax
income of $71MM*
Strong performance from Logistics and Retail, growth areas of our business
Retail contributed $69MM pretax in a period of declining wholesale gasoline
prices Logistics delivered strong results with pretax income of $54MM as SXL
achieved record quarterly earnings
Refining & Supply (R&S) reported a pretax loss of $44MM as low utilization
in April limited ability to take advantage of improved market margins
Profitable in May/June with strong reliability
Progress in growth
SXL acquisitions in Inland, East Boston, Eagle Point (from Sunoco), Texon crude
leasing business
Expansion of retail network in Alabama
Successful IPO of SunCoke Energy (SXC)
Sunoco retains ownership of 81% of outstanding shares
* For reconciliation to Net Income (Loss), see Slide 12. Special Items in
2Q11 include a net loss of $174MM after-tax.
Summary of 2
nd
Quarter 2011 Performance |
 4
Retail
Marketing
–
Pretax
Earnings
of
$69MM
Achieved 12.4 cpg average gasoline margins helped by wholesale prices
declining throughout the quarter
Logistics
–
Pretax
Earnings
of
$54MM
Record quarterly earnings for Sunoco Logistics Partners driven by market
opportunities in the crude oil segment, as well as contribution from recent
acquisitions
Coke –
Pretax Earnings of $20MM
Improvement in Indiana Harbor results from 1Q11
One-time relocation/separation costs impacted 2Q11
R&S –
Pretax Loss of $44MM
Loss driven by poor crude utilization in April (65%)
May/June profitable with crude utilization at 94%
* Pretax Business Unit Income (Loss) Before Special Items, excluding Income
Attributable to Noncontrolling Interests. For reconciliation to Net Income
(Loss), see Slide 12. Segment Pretax Results* -
2Q11 |
 5
YTD
1Q10
2Q10
3Q10
4Q10
1Q11
2Q11
2011
Refining & Supply
(70)
138
(70)
(17)
(138)
(44)
(182)
Retail Marketing
34
73
68
1
12
69
81
Logistics
27
30
40
35
31
54
85
Coke
51
56
44
25
9
20
29
Chemicals
Continuing Operations
5
7
5
6
(9)
6
(3)
Discontinued Polypropylene Operations
33
-
-
-
-
-
-
Corporate Expenses
(23)
(30)
(28)
(27)
(22)
(18)
(40)
Net Financing Expenses & Other
(28)
(27)
(28)
(27)
(24)
(16)
(40)
Pretax Income (Loss) Before Special Items
29
247
31
(4)
(141)
71
(70)
Pretax Income (Loss) Before Special Items*, MM$
71
(141)
(4)
31
247
29
($200)
($100)
$0
$100
$200
$300
* For reconciliation to Net Income (Loss), see Slide 12.
|
 6
* For calculation, see Slide 22. Weighted benchmark in effect in 2010 and through
March 1, 2011. Realized R&S Margin vs. Benchmark, $/B
1Q10
2Q10
3Q10
4Q10
FY10
1Q11
2Q11
Refining & Supply
Realized Margin
4.08
7.34
3.88
4.77
5.04
3.14
4.31
Benchmark*
4.93
6.12
4.22
5.19
5.11
5.19
6.11
Differential
(0.85)
1.22
(0.34)
(0.42)
(0.07)
(2.05)
(1.80)
Margin Capture Rate
83%
120%
92%
92%
99%
61%
71%
Actual vs. Benchmark:
Crude
(0.52)
0.73
(0.52)
(0.25)
(0.09)
(1.08)
(0.51)
Product
(0.33)
0.49
0.18
(0.17)
0.02
(0.97)
(1.29)
Differential
(0.85)
1.22
(0.34)
(0.42)
(0.07)
(2.05)
(1.80) |
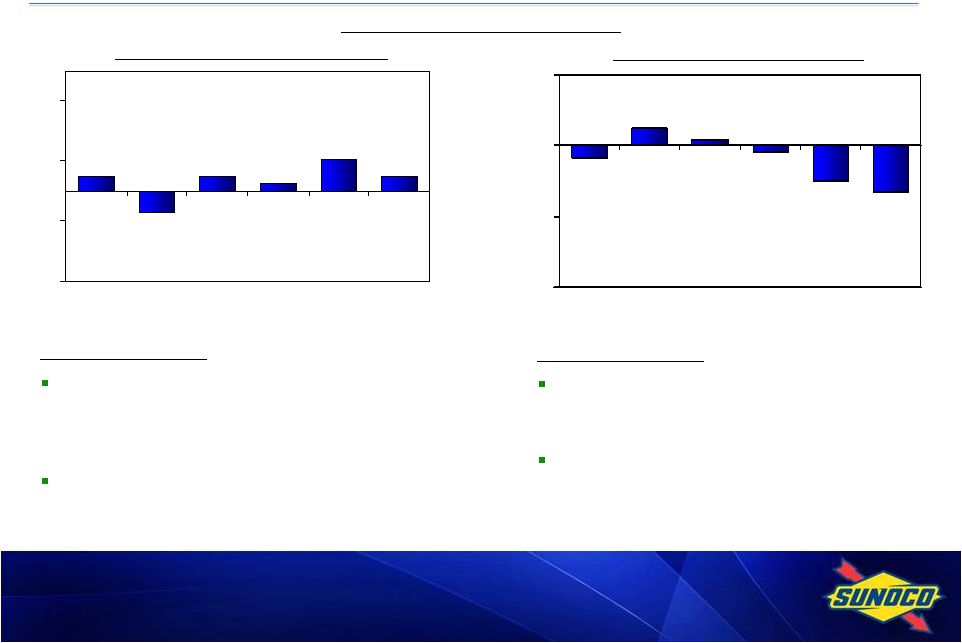 7
0.51
0.25
1.08
0.52
(0.73)
0.52
-3.00
-1.00
1.00
3.00
1Q10
2Q10
3Q10
4Q10
1Q11
2Q11
Crude Cost vs. Benchmark
(1.29)
(0.97)
(0.17)
0.18
0.49
(0.33)
-4.00
-2.00
0.00
2.00
1Q10
2Q10
3Q10
4Q10
1Q11
2Q11
Products vs. Benchmark
Total Refining & Supply
2Q11 Comments:
Quality differentials much higher than
benchmark and historical, with widening diffs
of West African crude and less discounted
crude purchases with rebalance of crude mix
Offset by timing and also inventory benefit due
to draw of crude from January build
2Q11 Comments:
Produced fuel net of yield gain $.75/B worse
than 1Q 11 due to higher absolute prices and
lower yield gains
May/June margin capture averaged > 90%
driven by positive product differentials
Realized R&S Margin vs. Benchmark*, $/B
* For calculation, see Slide 22. Weighted benchmark in effect in 2010 and through
March 1, 2011. |
 8
12/31/09
12/31/10
3/31/11
6/30/11
Sunoco (ex-SXL)*
32%
-6%
-6%
-13%
SXL
50%
54%
55%
57%
Consolidated**
41%
20%
22%
22%
Sunoco Net Debt/(Cash)
1,223
(182)
(165)
(335)
SXL Net Debt***
866
1,227
1,278
1,457
Consolidated Net Debt, MM$
2,089
945
1,013
1,022
Total Cash, MM$
377
1,485
1,480
1,476
* Proforma.
** Sunoco Revolver Covenant basis. For calculation, see Slides 17 and 18.
*** Includes intercompany loan due to Sunoco from SXL at 12/31/2010, 3/31/2011, and
6/30/2011 which is eliminated in consolidation.
Net Debt-to-Capital Ratio, %
41%
20%
22%
22%
-13%
-6%
-6%
32%
Consolidated
Sunoco (ex-SXL) |
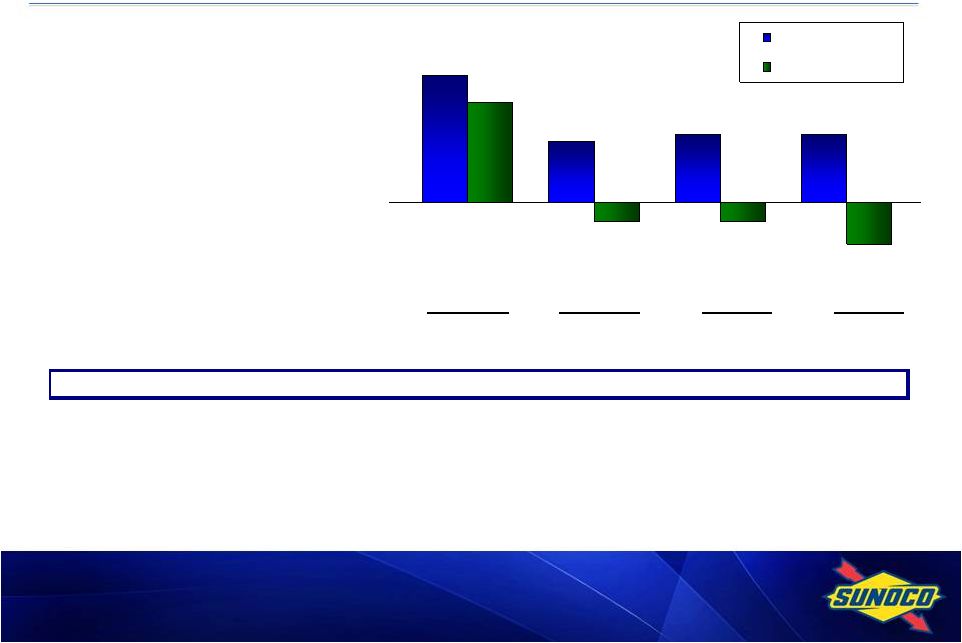
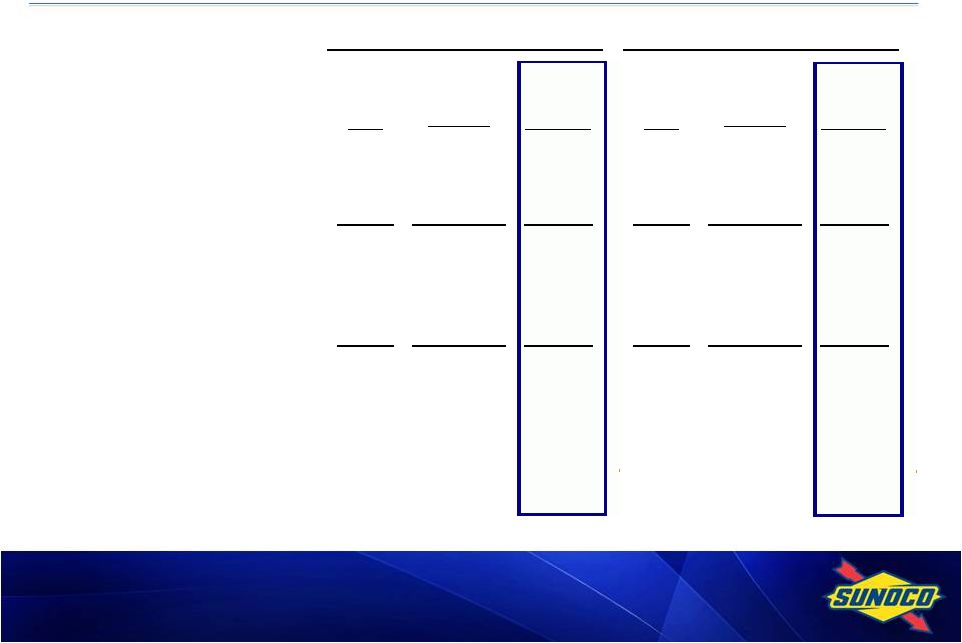
 9
SUN
SUN
SXL
(ex SXL)
Sunoco
SXL
(ex SXL)
Sunoco
Cash from ops ex working capital
115
185
300
185
(18)
167
Working capital
(102)
(187)
(289)
(142)
(382)
(524)
Cash flow from operations
13
(2)
11
43
(400)
(357)
Capital expenditures
(140)
(137)
(277)
(168)
(295)
(463)
Free cash flow
(127)
(139)
(266)
(125)
(695)
(820)
Divestments and other
-
301
301
-
847
847
Dividends to Sunoco shareholders
-
(18)
(18)
-
(36)
(36)
Distributions & other
(28)
-
(28)
(57)
3
(54)
SXL dividends to Sunoco
(24)
24
-
(48)
48
-
Net cash flow before net debt activity
(179)
168
(11)
(230)
167
(63)
Net debt activity
183
(176)
7
234
(180)
54
Net increase in cash & cash equivalents
4
(8)
(4)
4
(13)
(9)
2Q11
YTD11
Sunoco and SXL Cash Flow, MM$ |
 10
Remain focused on delivering value to shareholders
Strong results in retail and logistics => both areas targeted for growth
SunCoke IPO successful
>$450MM of announced acquisitions for SXL year-to-date through
July Positioning for future success
Grow through Retail (e.g. Alabama expansion) and SXL (e.g., Inland, East
Boston, Eagle Point, Texon crude business)
Balance sheet: Cash balance ($1.5 billion) provides strategic flexibility
Divest non-core assets (e.g., Frankford)
Key Takeaways |
 Appendix |
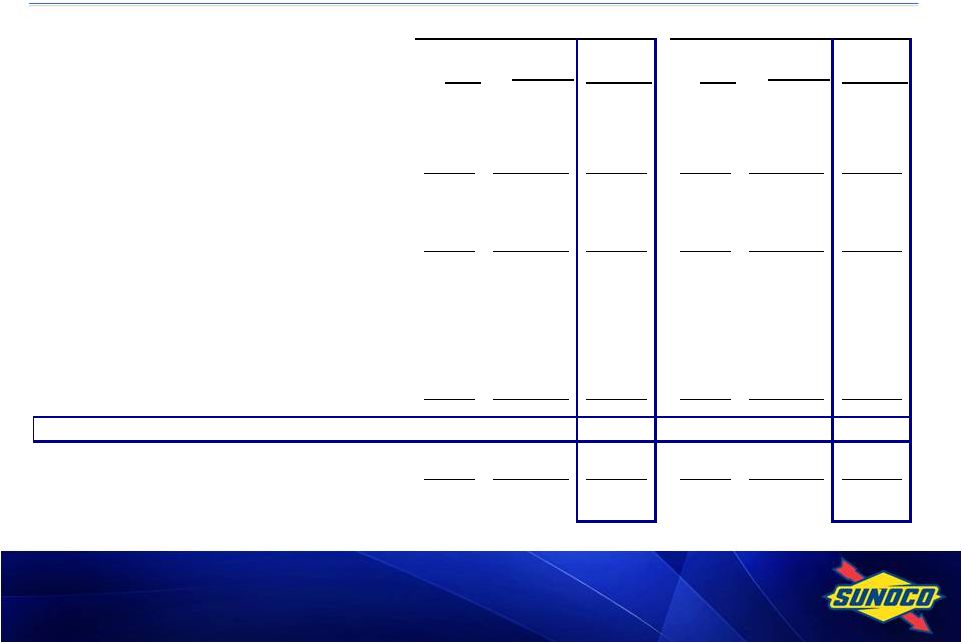
 12
Earnings Profile, MM$
YTD
1Q10
2Q10
3Q10
4Q10
FY10
1Q11
2Q11
2011
Refining & Supply
(70)
138
(70)
(17)
(19)
(138)
(44)
(182)
Retail Marketing
34
73
68
1
176
12
69
81
Logistics
27
30
40
35
132
31
54
85
Chemicals:
Continuing Operations
5
7
5
6
23
(9)
6
(3)
Discontinued Operations
33
-
-
-
33
-
-
-
Coke
51
56
44
25
176
9
20
29
Corporate and Other:
Corporate Expenses
(23)
(30)
(28)
(27)
(108)
(22)
(18)
(40)
Net Financing Expenses & Other
(28)
(27)
(28)
(27)
(110)
(24)
(16)
(40)
Pretax Income (Loss) attributable to Sunoco, Inc.
shareholders before special items
29
247
31
(4)
303
(141)
71
(70)
Income Tax Expense (Benefit) attributable to
Sunoco, Inc. shareholders
12
89
4
(17)
88
(19)
22
3
Income (Loss) attributable to Sunoco, Inc.
shareholders before special items
17
158
27
13
215
(122)
49
(73)
Special Items:
Continuing Operations
(45)
(22)
62
123
118
51
(294)
(243)
Discontinued Operations*
(169)
-
-
-
(169)
-
-
-
Pretax Income (Loss) from special items
(214)
(22)
62
123
(51)
51
(294)
(243)
Income Tax Expense (Benefit)
(134)
(9)
24
49
(70)
30
(120)
(90)
Income (Loss) from special items
(80)
(13)
38
74
19
21
(174)
(153)
Net Income (Loss) attributable to
Sunoco, Inc. shareholders
(63)
145
65
87
234
(101)
(125)
(226)
* Represents a loss recognized in connection with the divestment of the
polypropylene chemicals business. |
 13
Earnings Summary and EPS
YTD
MM$
1Q10
2Q10
3Q10
4Q10
FY10
1Q11
2Q11
2011
Income (Loss) attributable to Sunoco, Inc.
shareholders before special items
17
158
27
13
215
(122)
49
(73)
Special Items:
Continuing Operations
(45)
(22)
62
123
118
51
(294)
(243)
Discontinued Operations*
(169)
-
-
-
(169)
-
-
-
Pretax Income (Loss) from special items
(214)
(22)
62
123
(51)
51
(294)
(243)
Income Tax Expense (Benefit)
(134)
(9)
24
49
(70)
30
(120)
(90)
Income (Loss) from special items
(80)
(13)
38
74
19
21
(174)
(153)
Net Income (Loss) attributable to
Sunoco, Inc. shareholders
(63)
145
65
87
234
(101)
(125)
(226)
$/Share (diluted)
Earnings (Loss) per share of common stock (diluted):
Income (Loss) attributable to Sunoco, Inc.
shareholders before special items
0.14
1.31
0.22
0.11
1.79
(1.01)
0.40
(0.60)
Income (Loss) from special items
(0.67)
(0.11)
0.32
0.61
0.16
0.17
(1.43)
(1.27)
Net Income (Loss) attributable to
Sunoco, Inc. shareholders
(0.53)
1.20
0.54
0.72
1.95
(0.84)
(1.03)
(1.87)
* Represents a loss recognized in connection with the divestment of the
polypropylene chemicals business. |
 14
YTD
1Q10
2Q10
3Q10
4Q10
FY10
1Q11
2Q11
2011
Total Refining & Supply
Crude Throughputs, MB/D
533
618
632
572
589
460
425
442
% Capacity
79
92
94
85
87
74
84
79
Net Prod. Available for Sale, MB/D
591
664
682
634
643
512
461
487
Net Prod. Available for Sale, MMB
53
61
62
58
234
46
42
88
Key Volume Indicators –
Refining & Supply |
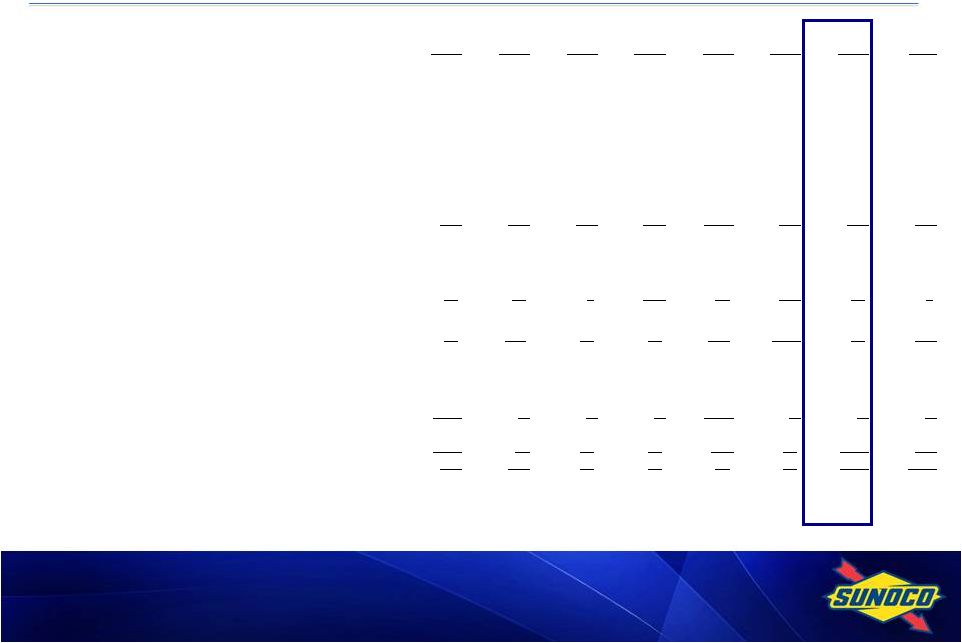
 15
* Excludes discontinued polypropylene operations.
Key Indicators
YTD
1Q10
2Q10
3Q10
4Q10
FY10
1Q11
2Q11
2011
Realized Margin Indicators
Refining & Supply, $/B
4.08
7.34
3.88
4.77
5.04
3.14
4.31
3.70
Retail Marketing, cpg
Gasoline
8.9
11.5
10.5
6.6
9.4
6.9
12.4
9.7
Distillate
8.0
9.0
7.8
5.6
7.6
7.1
12.5
9.9
Chemicals, cpp*
9.9
8.9
7.6
9.1
8.8
7.4
10.7
9.1
Market Indicators
Dated Brent Crude Oil, $/B
76.24
78.30
76.86
86.53
79.48
104.90
117.63
111.26
Natural Gas, $/DT
5.04
4.34
4.23
3.97
4.40
4.20
4.37
4.29 |
 16
* Excludes discontinued polypropylene operations.
Key Volume Indicators –
Retail, Chemicals, Coke
YTD
1Q10
2Q10
3Q10
4Q10
FY10
1Q11
2Q11
2011
Retail Marketing
Gasoline Sales, MM Gal
1,026
1,130
1,171
1,171
4,498
1,086
1,161
2,247
Middle Distillate Sales, MM Gal
91
114
117
110
432
97
106
203
Total Sales, MM Gal
1,117
1,244
1,288
1,281
4,930
1,183
1,267
2,450
Gasoline and Diesel Throughput
147
159
148
161
156
150
162
156
(Company-Owned or Leased Outlets)
(M Gal/Site/Month)
Merchandise Sales (M$/Store/Month)
87
101
103
92
96
85
97
91
Chemicals*
Phenol and Related Sales, MM#
449
554
567
582
2,152
470
478
948
Coke
Production, M Tons:
United States
841
883
953
916
3,593
861
922
1,783
Brazil
413
422
431
370
1,636
364
412
776 |
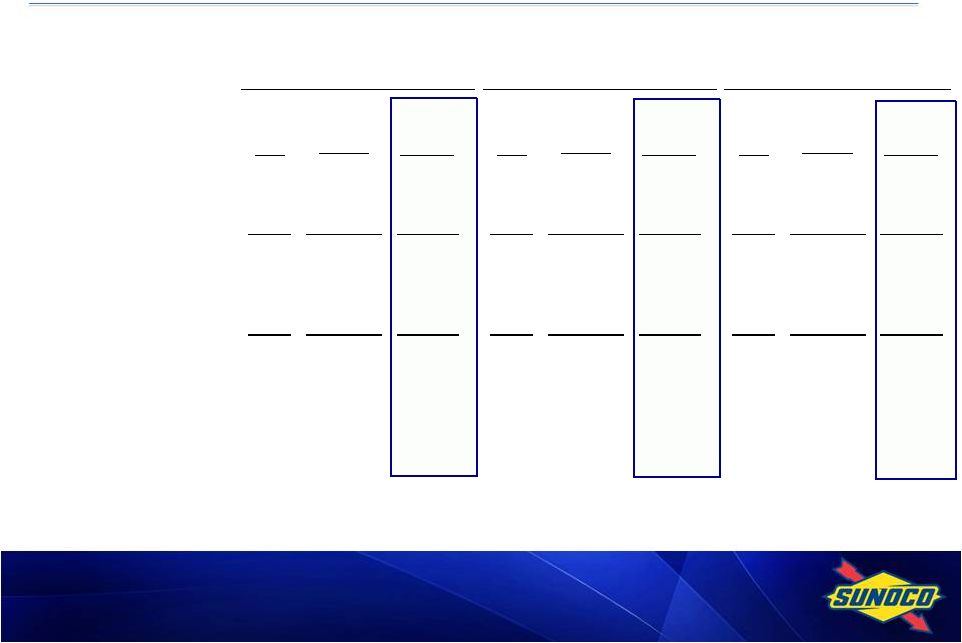
 17
* Represents intercompany loan due to Sunoco from SXL which is eliminated in
consolidation. ** Represents Partners’
Capital for SXL and Shareholders’
Equity for Sunoco.
*** The Net Debt / Capital ratio is used by Sunoco management in its internal
financial analysis and by investors and creditors in the assessment of
Sunoco’s financial position; calculation excludes noncontrolling interests except for
SXL as prescribed by the revolver covenant.
Financial Ratios, MM$ except ratios
Proforma
Proforma
SUN
SUN
SXL
(ex SXL)
Sunoco
SXL
(ex SXL)
Sunoco
Debt
868
1,596
2,464
1,129
1,300
2,429
Intercompany Debt*
-
-
-
100
-
-
Plus: Debt Guarantees
-
2
2
-
1
1
Less: Cash
(2)
(375)
(377)
(2)
(1,483)
(1,485)
Net Debt
866
1,223
2,089
1,227
(182)
945
Equity**
862
2,557
2,557
965
3,046
3,046
SXL Noncontrolling Interest
-
-
488
77
-
692
Other Noncontrolling Interest
-
74
74
-
61
61
Capital
1,728
3,854
5,208
2,269
2,925
4,744
Net Debt / Capital (Sunoco
Revolver Covenant
N/A
32%
41%
N/A
-6%
20%
Basis)***
Debt / Capital
50%
38%
44%
54%
29%
39%
(GAAP Basis)
12/31/2009
12/31/2010 |
 18
Financial Ratios, MM$ except ratios
* Represents intercompany loan due to Sunoco from SXL which is eliminated in
consolidation. ** Represents Partners’
Capital for SXL and Shareholders’
Equity for Sunoco.
*** The Net Debt / Capital ratio is used by Sunoco management in its internal
financial analysis and by investors and creditors in the assessment of
Sunoco’s financial position; calculation excludes noncontrolling interests except for
SXL as prescribed by the revolver covenant.
Proforma
Proforma
Proforma
SUN
SUN
SUN
SXL
(ex SXL)
Sunoco
SXL
(ex SXL)
Sunoco
SXL
(ex SXL)
Sunoco
Debt
1,129
1,300
2,429
1,180
1,292
2,472
1,363
1,115
2,478
Intercompany Debt*
100
-
-
100
-
-
100
-
-
Plus: Debt Guarantees
-
1
1
-
21
21
-
20
20
Less: Cash
(2)
(1,483)
(1,485)
(2)
(1,478)
(1,480)
(6)
(1,470)
(1,476)
Net Debt
1,227
(182)
945
1,278
(165)
1,013
1,457
(335)
1,022
Equity**
965
3,046
3,046
963
2,950
2,950
1,006
2,828
2,828
SXL Noncontrolling Interest
77
-
692
78
-
692
98
-
735
Other Noncontrolling Interest
-
61
61
-
52
52
-
54
54
Capital
2,269
2,925
4,744
2,319
2,837
4,707
2,561
2,547
4,639
Net Debt / Capital (Sunoco
Revolver Covenant
N/A
-6%
20%
N/A
-6%
22%
N/A
-13%
22%
Basis)***
Debt / Capital
54%
29%
39%
55%
30%
40%
57%
28%
41%
(GAAP Basis)
12/31/2010
3/31/2011
6/30/2011 |
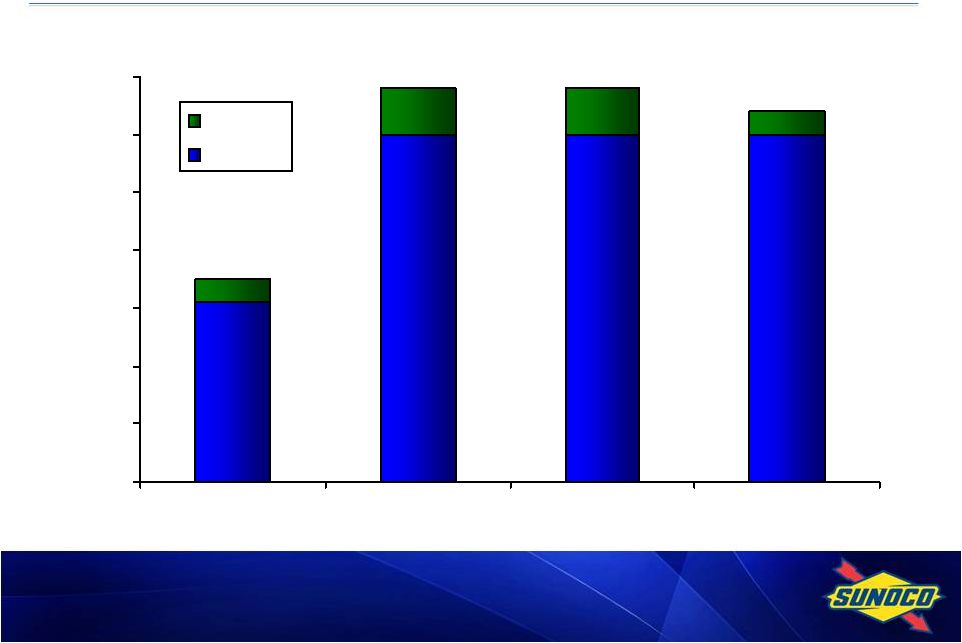 19
Liquidity*, B$
0.0
0.5
1.0
1.5
2.0
2.5
3.0
3.5
12/31/2009
12/31/2010
3/31/2011
6/30/2011
SXL
Sunoco
3.4
1.7
3.4
3.2
* Includes cash and cash equivalents of $0.4B, $1.5B, $1.5B, and $1.5B at
12/31/09, 12/31/10, 3/31/11 and 6/30/11
respectively. |
 20
YTD
1Q10
2Q10
3Q10
4Q10
FY10
1Q11
2Q11
2011
Total Refining & Supply
Net Production, MB/D
590.5
664.2
681.5
633.9
642.8
512.4
461.1
486.6
Gasoline
52%
52%
52%
54%
52%
52%
51%
51%
Middle Distillates
34%
37%
37%
35%
36%
36%
36%
36%
Residual Fuel
6%
6%
5%
4%
5%
5%
7%
6%
Petrochemicals
4%
3%
4%
4%
4%
3%
3%
3%
Other
9%
7%
7%
8%
8%
9%
8%
9%
Less Refinery Fuel
-5%
-5%
-5%
-5%
-5%
-5%
-5%
-5%
Refining & Supply –
Products Manufactured |
 21
YTD
1Q10
2Q10
3Q10
4Q10
FY10
1Q11
2Q11
2011
Total Refining & Supply
Gasoline Production, MB/D
306.3
343.1
357.9
339.9
337.0
265.4
234.6
249.9
RFG
47%
48%
43%
45%
46%
49%
63%
55%
Conventional
53%
52%
57%
55%
54%
51%
37%
45%
Distillate Production, MB/D
202.4
244.5
250.1
225.1
230.6
183.6
165.5
174.5
On-Road Diesel Fuel
53%
66%
62%
52%
59%
52%
58%
55%
Heating Oil / Off-Road Diesel
28%
15%
18%
25%
21%
26%
27%
27%
Jet Fuel
17%
19%
19%
21%
19%
20%
13%
16%
Kerosene/Other
2%
0%
1%
2%
1%
2%
2%
2%
Refining & Supply –
Gasoline and Distillate Production |
 22
Toledo 4-3-1 Benchmark
4 WTI Crude: NYMEX Futures Close + $2.00 for transportation
3 Unleaded Gasoline: Chicago Pipeline Platt’s Low
1 Distillate: 50% ULSD Chicago Pipeline Platt’s Low
50% Jet Gulf Coast Pipe Platt’s Low
Northeast 6-3-2-1 Value-Added Benchmark**
6 Dated Brent Crude: Platt’s Mid + $2.75 for transportation
3 Gasoline: 50% Unleaded RBOB NY Harbor Barge Platt's Low
50% 83 CBOB NY Harbor Barge Platt's Low
2 Distillate: 55% ULSD NY Harbor Barge Platt's Low
20% Jet/Kero NY Harbor Barge Platt's Low
25% No.2 Fuel Oil NY Harbor Barge Platt's Low
1 Resid: 60% No. 6 0.3% Sulfur High Pour Resid: NY Harbor Barge Platt’s
Low 40% No. 6 1.0% Sulfur High Pour Resid: NY Harbor Barge Platt’s Low
YTD
1Q10
2Q10
3Q10
4Q10
FY10
Jan 11
Feb 11
Mar 11
1Q11
2Q11
2011
Northeast 6-3-2-1
Value-Added Benchmark
5.17
5.42
3.39
4.90
4.72
3.93
2.79
5.11
3.94
6.11
5.02
Toledo 4-3-1
Benchmark
3.99
8.89
7.50
6.33
6.68
9.89
15.52
n/a
12.70
n/a
12.70
YTD
1Q10
2Q10
3Q10
4Q10
FY10
Jan 11
Feb 11
Mar 11
1Q11
2Q11
2011
Northeast 6-3-2-1
at 80% weight*
4.13
4.34
2.72
3.92
3.78
3.14
2.24
5.11
3.50
6.11
4.80
Toledo 4-3-1
at 20% weight*
0.80
1.78
1.50
1.27
1.33
1.98
3.10
n/a
1.69
n/a
0.85
R&S Weighted Benchmark*
4.93
6.12
4.22
5.19
5.11
5.12
5.34
5.11
5.19
6.11
5.65
Sunoco R&S Benchmark Margin, $/B
*
Beginning in March 2011, the R&S benchmark is no longer weighted with 20% of Toledo 4-3-1
margin due to the
sale of the Toledo refinery on 3/1/2011. Prior to Toledo sale: 80% of NE 6-3-2-1
Value Added Margin and 20% of Toledo 4-3-1 margin. Post Toledo sale: 100%
of NE 6-3-2-1 Value Added Margin.
** Adjusted in 2Q11 to reflect market conditions more closely associated with NE refining
system. 2010 amounts have been restated for comparative purposes.
|
 23
Media releases and SEC filings are available
on
our
website
at
www.SunocoInc.com
Contact for more information:
Clare McGrory
(215) 977-6764
For More Information |