Attached files
| file | filename |
|---|---|
| 8-K - 8-K - OLD SECOND BANCORP INC | a11-23710_18k.htm |
Exhibit 99.1
|
|
1 Old Second Bancorp, Inc. Founded in 1871 NASDAQ: OSBC William B. Skoglund Chairman 630-906-5483 James L. Eccher Chief Operating Officer 630-966-2433 Presenters August 2, 2011 |
|
|
Forward-looking statements In addition to historical information, this presentation contains forward-looking statements, which are subject to certain risks and uncertainties. Forward-looking statements include information concerning possible or assumed future results of Old Second’s operations. Forward-looking statements generally include words such as believes, expects, anticipates and other similar expressions. Stockholders should note that many factors could affect the future financial results of Old Second, causing those results to differ materially from those expressed in this presentation. These factors include operating, legal and regulatory risks; economic, political and competitive forces impacting our business; risk that our analysis of these risks and forces could be incorrect and/or that the strategies developed to address them could be unsuccessful; volatility in interest rates; and other risks and uncertainties which are summarized in our SEC filings. Old Second undertakes no obligation to publicly revise or update these forward-looking statements to reflect events that arise after this presentation. 2 |
|
|
Profile 3 Established in 1871 and Headquartered in Aurora, Illinois $2.0 Billion in Assets $1.5 Billion in Loans $1.8 Billion in Deposits Wealth Management Group with over $1.0 Billion under Management. Deposit Market Share Leader in Kane and Kendall Counties (Illinois) 28 Locations 82 ATM Locations |
|
|
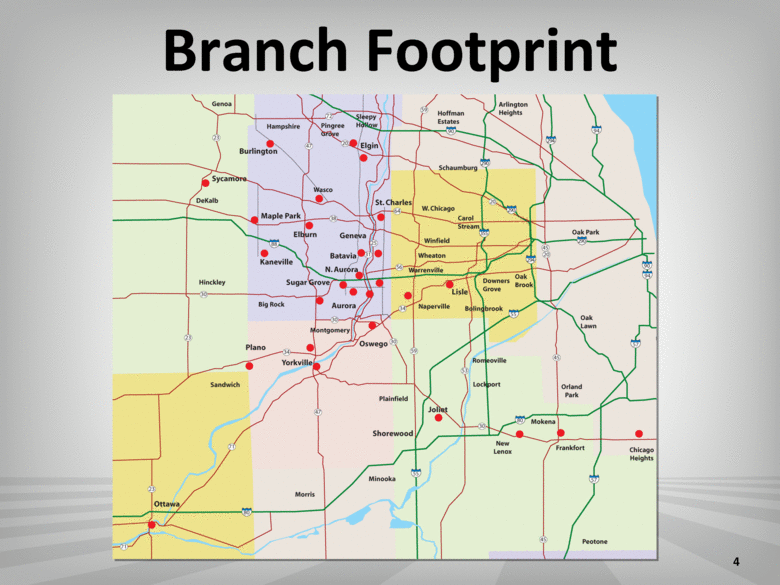
Branch Footprint 4 |
|
|
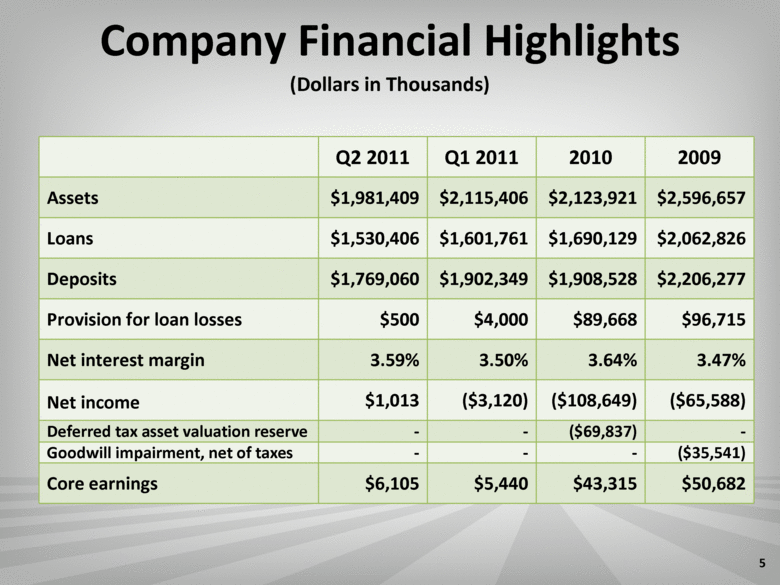
Company Financial Highlights (Dollars in Thousands) Q2 2011 Q1 2011 2010 2009 Assets $1,981,409 $2,115,406 $2,123,921 $2,596,657 Loans $1,530,406 $1,601,761 $1,690,129 $2,062,826 Deposits $1,769,060 $1,902,349 $1,908,528 $2,206,277 Provision for loan losses $500 $4,000 $89,668 $96,715 Net interest margin 3.59% 3.50% 3.64% 3.47% Net income $1,013 ($3,120) ($108,649) ($65,588) Deferred tax asset valuation reserve - - ($69,837) - Goodwill impairment, net of taxes - - - ($35,541) Core earnings $6,105 $5,440 $43,315 $50,682 5 |
|
|
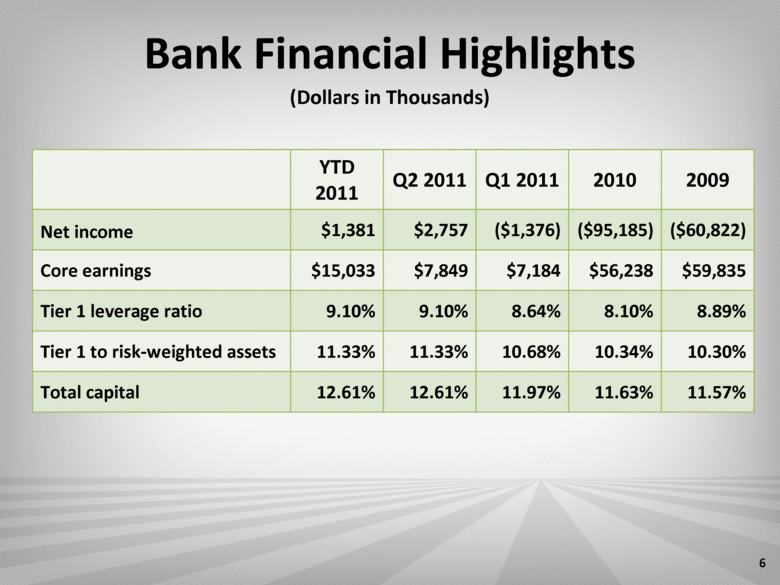
Bank Financial Highlights (Dollars in Thousands) YTD 2011 Q2 2011 Q1 2011 2010 2009 Net income $1,381 $2,757 ($1,376) ($95,185) ($60,822) Core earnings $15,033 $7,849 $7,184 $56,238 $59,835 Tier 1 leverage ratio 9.10% 9.10% 8.64% 8.10% 8.89% Tier 1 to risk-weighted assets 11.33% 11.33% 10.68% 10.34% 10.30% Total capital 12.61% 12.61% 11.97% 11.63% 11.57% 6 |
|
|
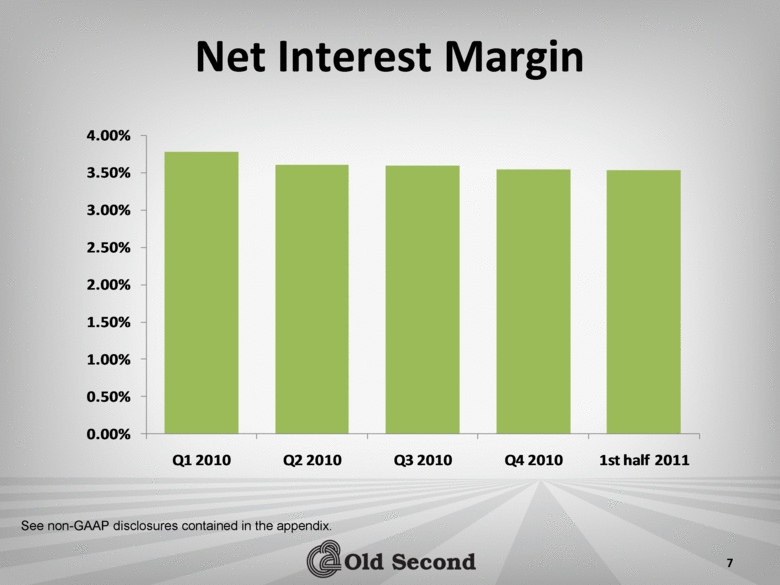
7 Net Interest Margin See non-GAAP disclosures contained in the appendix. 0.00% 0.50% 1.00% 1.50% 2.00% 2.50% 3.00% 3.50% 4.00% Q1 2010 Q2 2010 Q3 2010 Q4 2010 1st half 2011 |
|
|
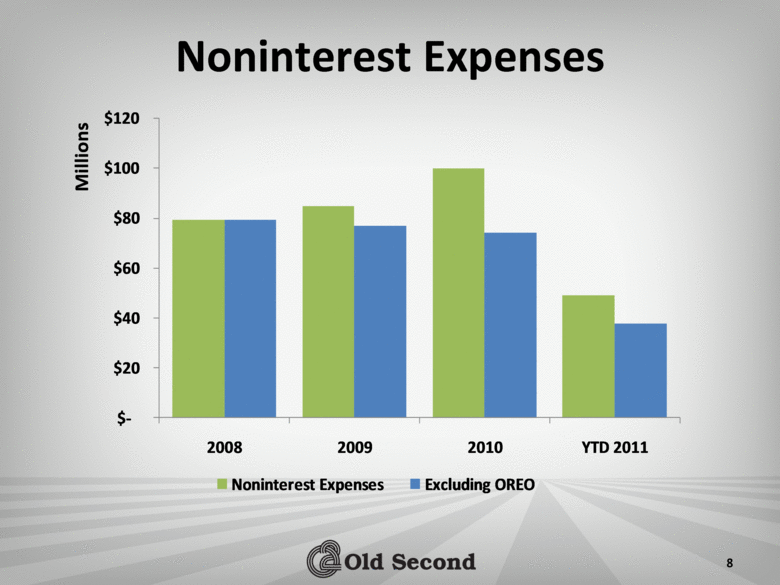
8 Noninterest Expenses $- $20 $40 $60 $80 $100 $120 2008 2009 2010 YTD 2011 Millions Noninterest Expenses Excluding OREO |
|
|
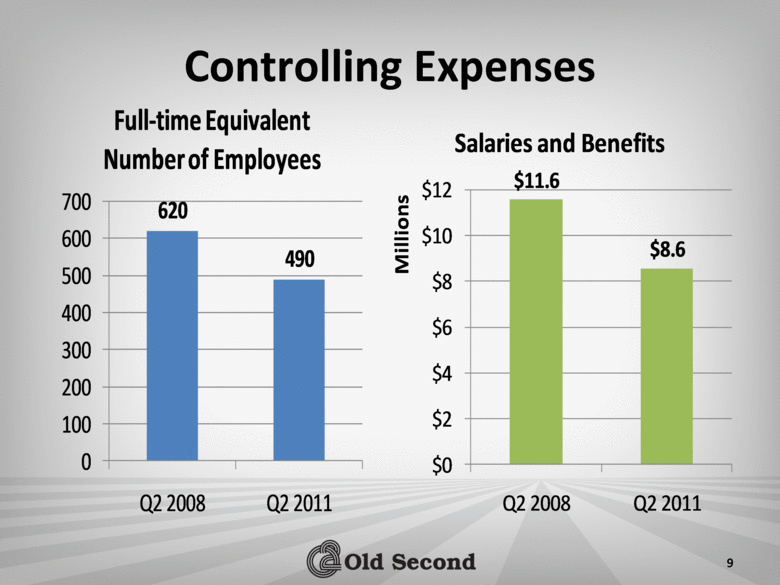
9 Controlling Expenses $11.6 $8.6 $0 $2 $4 $6 $8 $10 $12 Q2 2008 Q2 2011 Millions Salaries and Benefits Full-time Equivalent Number of Employees 620 490 700 600 500 400 300 200 100 0 |
|
|
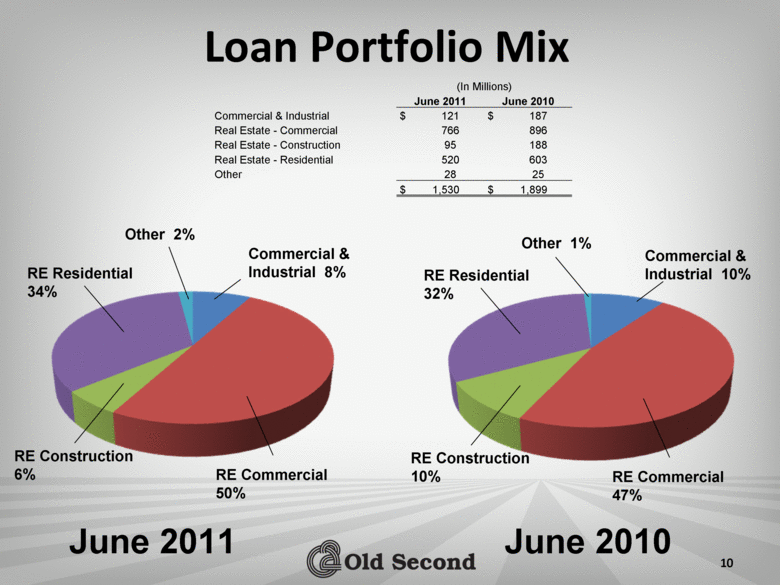
10 Loan Portfolio Mix (In Millions) June 2011 June 2010 Commercial & Industrial $ 121 $ 187 Real Estate - Commercial 766 896 Real Estate - Construction 95 188 Real Estate - Residential 520 603 Other 28 25 $ 1,530 $ 1,899 Commercial & Industrial 8% RE Commercial 50% RE Construction 6% RE Residential 34% Other 2% June 2010 Commercial & Industrial 10% RE Commercial 47% RE Construction 10% RE Residential 32% Other 1% June 2011 |
|
|
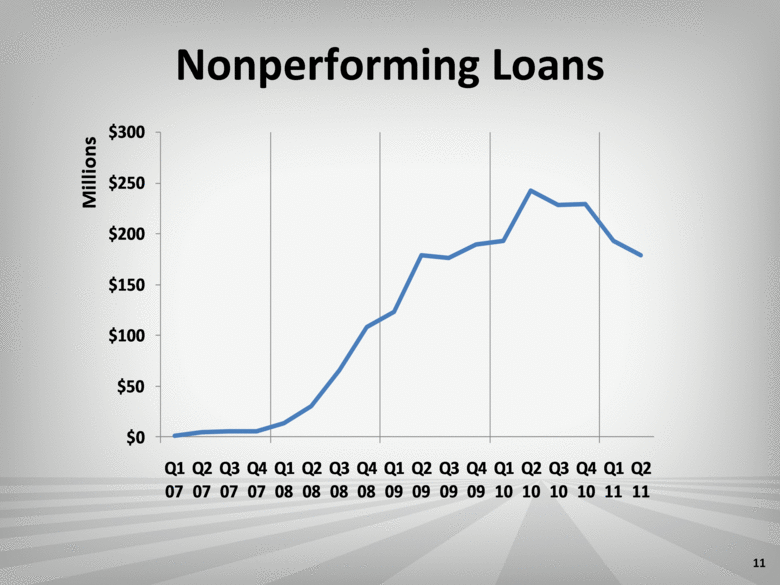
Nonperforming Loans 11 $0 $50 $100 $150 $200 $250 $300 Q1 07 Q2 07 Q3 07 Q4 07 Q1 08 Q2 08 Q3 08 Q4 08 Q1 09 Q2 09 Q3 09 Q4 09 Q1 10 Q2 10 Q3 10 Q4 10 Q1 11 Q2 11 Millions |
|
|
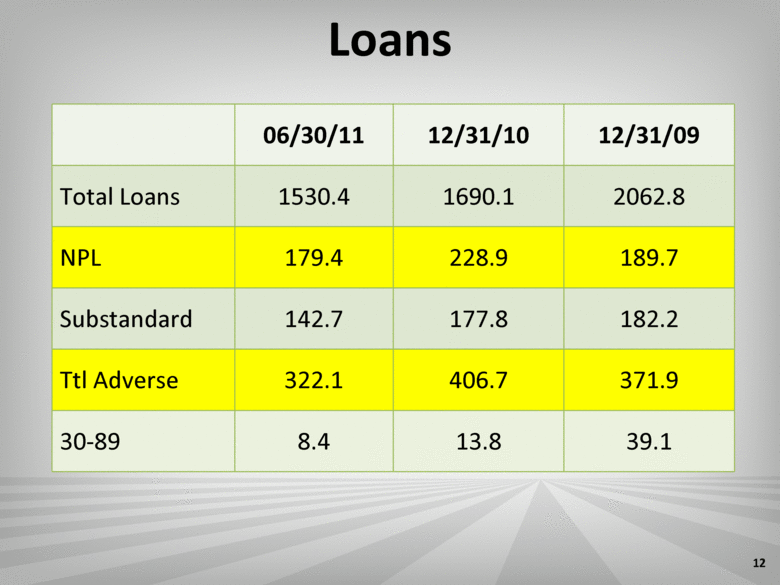
Loans 06/30/11 12/31/10 12/31/09 Total Loans 1530.4 1690.1 2062.8 NPL 179.4 228.9 189.7 Substandard 142.7 177.8 182.2 Ttl Adverse 322.1 406.7 371.9 30-89 8.4 13.8 39.1 12 |
|
|
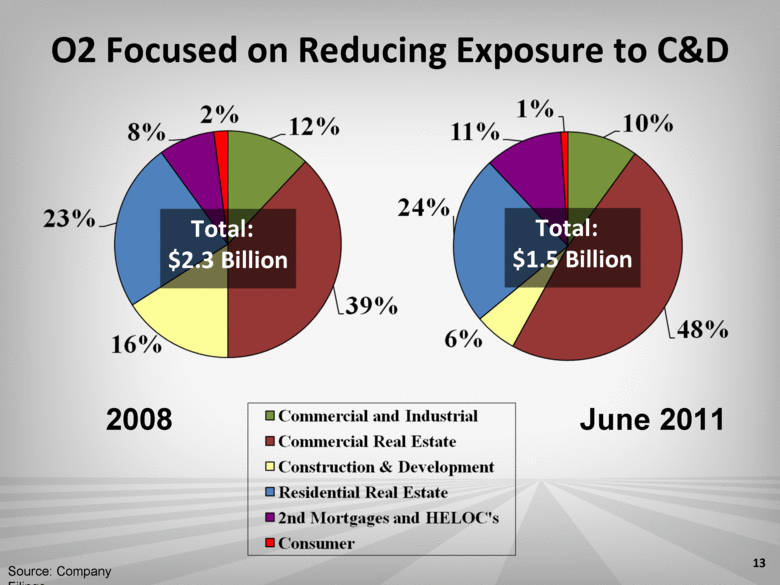
O2 Focused on Reducing Exposure to C&D Total: $2.3 Billion Total: $1.5 Billion Source: Company Filings 2008 June 2011 13 Commercial and Industrial Commercial Real Estate Construction & Development Residential Real Estate 2nd Mortgages and HELOC's Consumer 12% 38% 16% 24% 8% 2% 10% 48% 6% 24% 11% 1% |
|
|
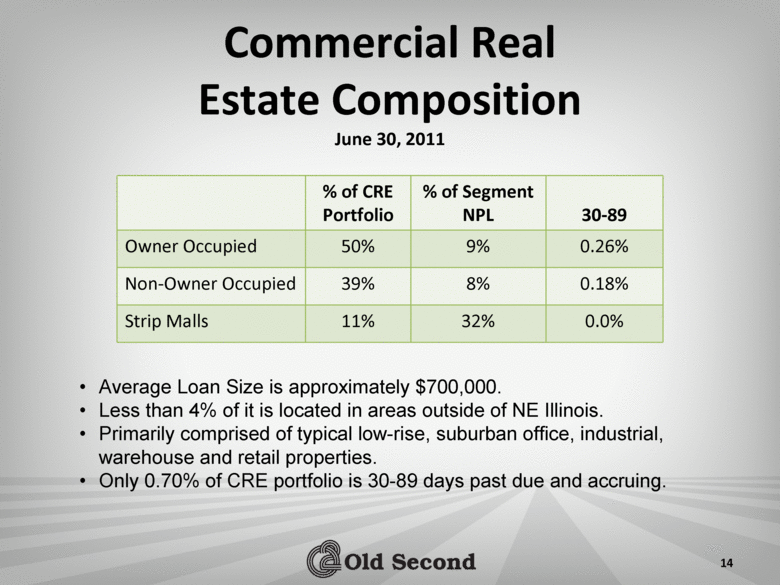
14 Commercial Real Estate Composition June 30, 2011 % of CRE Portfolio % of Segment NPL 30-89 Owner Occupied 50% 9% 0.26% Non-Owner Occupied 39% 8% 0.18% Strip Malls 11% 32% 0.0% Average Loan Size is approximately $700,000. Less than 4% of it is located in areas outside of NE Illinois. Primarily comprised of typical low-rise, suburban office, industrial, warehouse and retail properties. Only 0.70% of CRE portfolio is 30-89 days past due and accruing. |
|
|
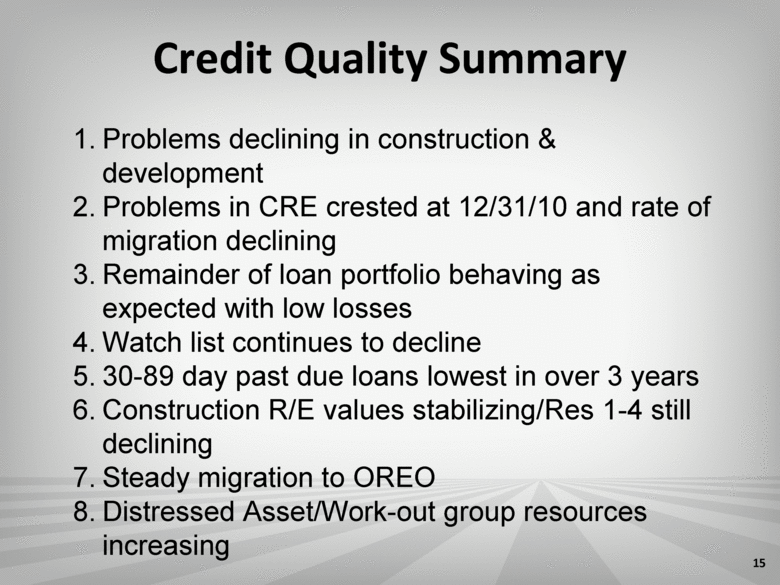
Credit Quality Summary 1. Problems declining in construction & development 2. Problems in CRE crested at 12/31/10 and rate of migration declining 3. Remainder of loan portfolio behaving as expected with low losses 4. Watch list continues to decline 5. 30-89 day past due loans lowest in over 3 years 6. Construction R/E values stabilizing/Res 1-4 still declining 7. Steady migration to OREO 8. Distressed Asset/Work-out group resources increasing 15 |
|
|
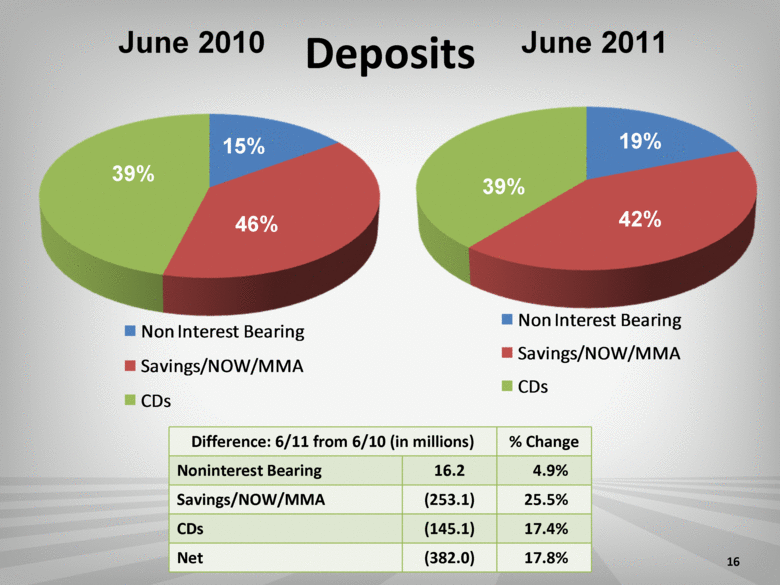
16 Deposits June 2010 15% 42% 39% 19% 46% 39% Difference: 6/11 from 6/10 (in millions) % Change Noninterest Bearing 16.2 4.9% Savings/NOW/MMA (253.1) 25.5% CDs (145.1) 17.4% Net (382.0) 17.8% June 2011 Non Interest Bearing Savings/NOW/MMA CDs Non Interest Bearing Savings/NOW/MMA CDs |
|
|
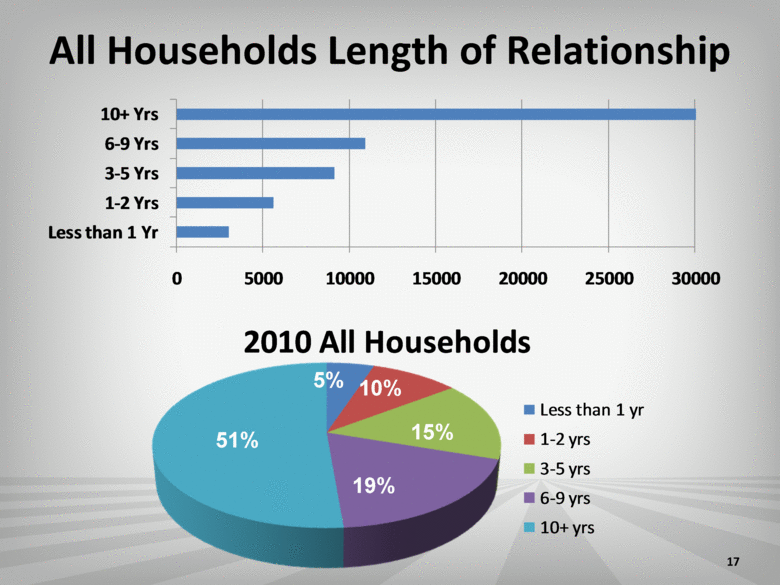
17 51% 5% 10% 15% 19% All Households Length of Relationship 2010 All Households Less than 1 yr 1-2 yrs 3-5 yrs 6-9 yrs 10+ yrs 0 5000 10000 15000 20000 25000 30000 Less than 1 Yr 1-2 Yrs 3-5 Yrs 6-9 Yrs 10+ Yrs |
|
|
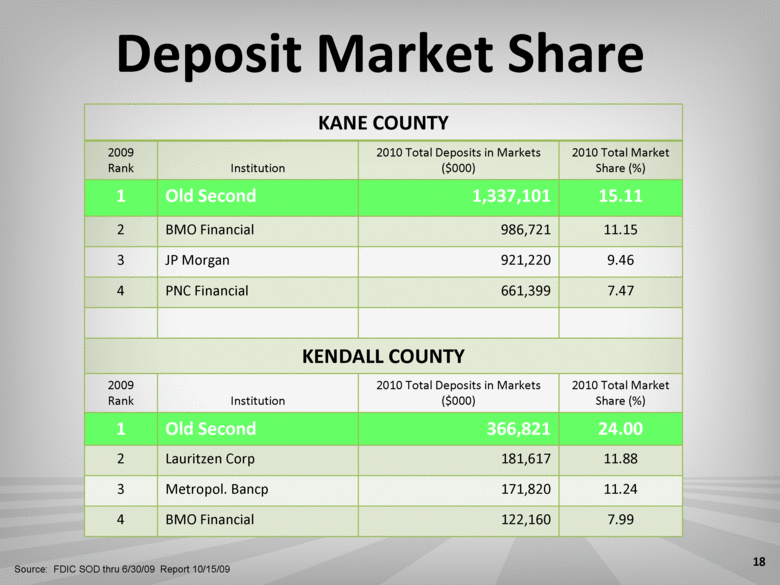
Deposit Market Share Source: FDIC SOD thru 6/30/09 Report 10/15/09 KANE COUNTY 2009 Rank Institution 2010 Total Deposits in Markets ($000) 2010 Total Market Share (%) 1 Old Second 1,337,101 15.11 2 BMO Financial 986,721 11.15 3 JP Morgan 921,220 9.46 4 PNC Financial 661,399 7.47 KENDALL COUNTY 2009 Rank Institution 2010 Total Deposits in Markets ($000) 2010 Total Market Share (%) 1 Old Second 366,821 24.00 2 Lauritzen Corp 181,617 11.88 3 Metropol. Bancp 171,820 11.24 4 BMO Financial 122,160 7.99 18 |
|
|
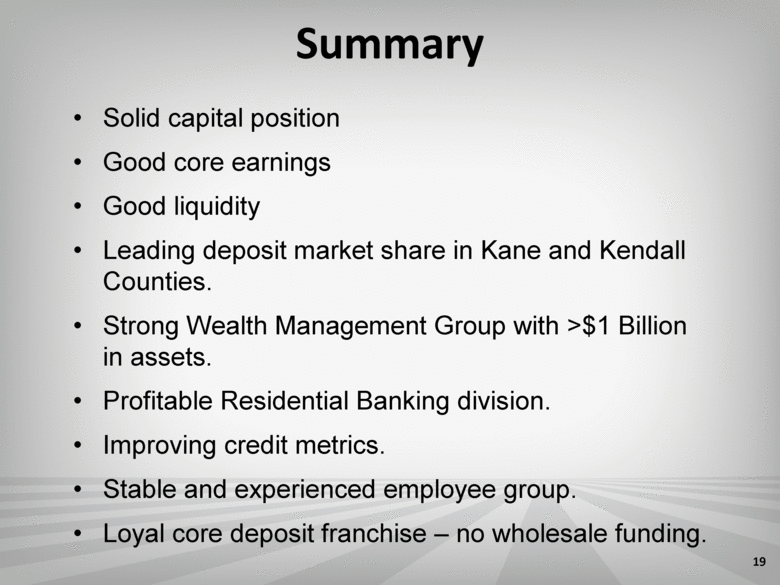
19 Solid capital position Good core earnings Good liquidity Leading deposit market share in Kane and Kendall Counties. Strong Wealth Management Group with >$1 Billion in assets. Profitable Residential Banking division. Improving credit metrics. Stable and experienced employee group. Loyal core deposit franchise – no wholesale funding. Summary |

