Attached files
| file | filename |
|---|---|
| 8-K - ROCK-TENN COMPANY 8-K - Rock-Tenn CO | a6817501.htm |
Exhibit 99.1
Fiscal Year 2011 3rd Quarter Earnings Conference Call Presentation August 3, 2011 Jim Rubright – Chairman and Chief Executive Officer Steve Voorhees – EVP, Chief Financial Officer and Chief Administrative Officer
Cautionary Statement Regarding Forward-Looking Information Statements in this presentation that do not relate strictly to historical facts are forward-looking statements within the meaning of the Private Securities Litigation Reform Act of 1995. Forward-looking statements are based on our current expectations, beliefs, plans or forecasts and use words in this presentation such as will, estimate, trending, or refer to future time periods. You should not place undue reliance on any forward-looking statements as such statements involve risks, uncertainties, assumptions and other factors that could cause actual results to differ materially, including the following: our ability to integrate Smurfit-Stone or to achieve benefits from the Smurfit Acquisition, including, without limitation, synergies and performance improvements; the level of demand for our products; our ability to successfully identity and make performance improvements; anticipated returns on our capital investments; possible increases in energy, raw materials, shipping and capital equipment costs; any reduction in the supply of raw materials; fluctuations in selling prices and volumes; intense competition; the potential loss of certain customers; adverse changes in general market and industry conditions and other risks, uncertainties and factors discussed in Item 1A "Risk Factors" and under the caption "Business — Forward-Looking Information" in our 2010 Annual Report on Form 10-K and by similar disclosures in any of our subsequent SEC filings. The information contained herein speaks as of the date hereof and we do not have or undertake any obligation to update such information as future events unfold.
Use of Non-GAAP Financial Measures and Reconciliations We have included financial measures that are not prepared in accordance with accounting principles generally accepted in the United States ("GAAP"). The non-GAAP financial measures presented are not intended to be a substitute for GAAP financial measures, and any analysis of non-GAAP financial measures should be used only in conjunction with results presented in accordance with GAAP reconciliations of non-GAAP financial measures to GAAP financial measures included in the Appendix to this presentation.
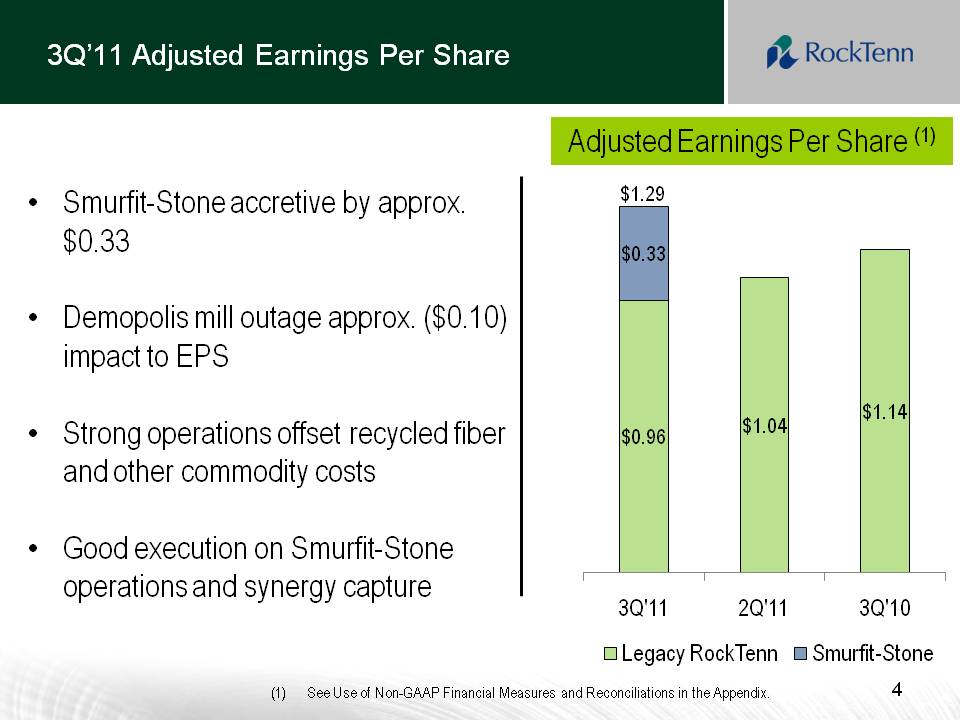
3Q’11 Adjusted Earnings Per Share Other Placeholder: 4 Smurfit-Stone accretive by approx. $0.33 Demopolis mill outage approx. ($0.10) impact to EPS Strong operations offset recycled fiber and other commodity costs Good execution on Smurfit-Stone operations and synergy capture $1.29 Adjusted Earnings Per Share (1) See Use of Non-GAAP Financial Measures and Reconciliations in the Appendix.
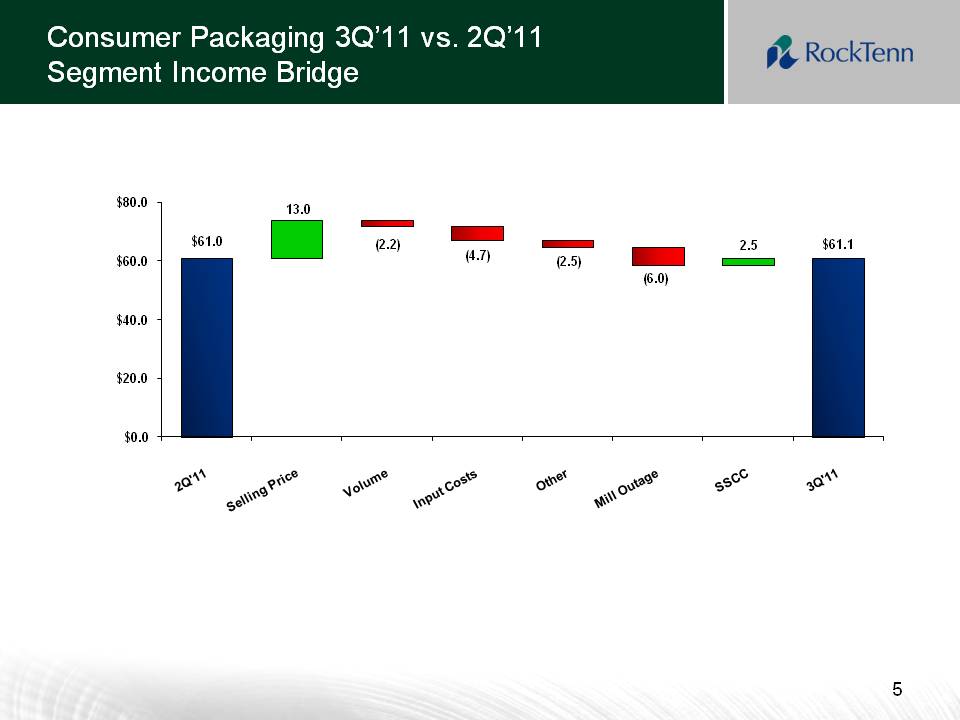
Consumer Packaging 3Q’11 vs. 2Q’11 Segment Income Bridge
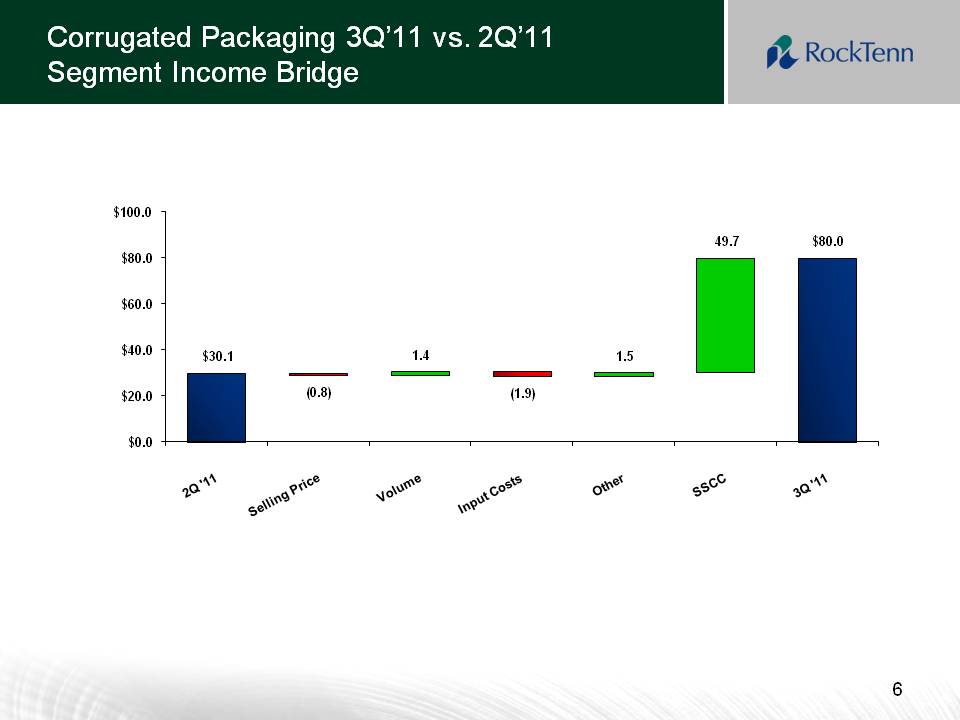
Corrugated Packaging 3Q’11 vs. 2Q’11 Segment Income Bridge
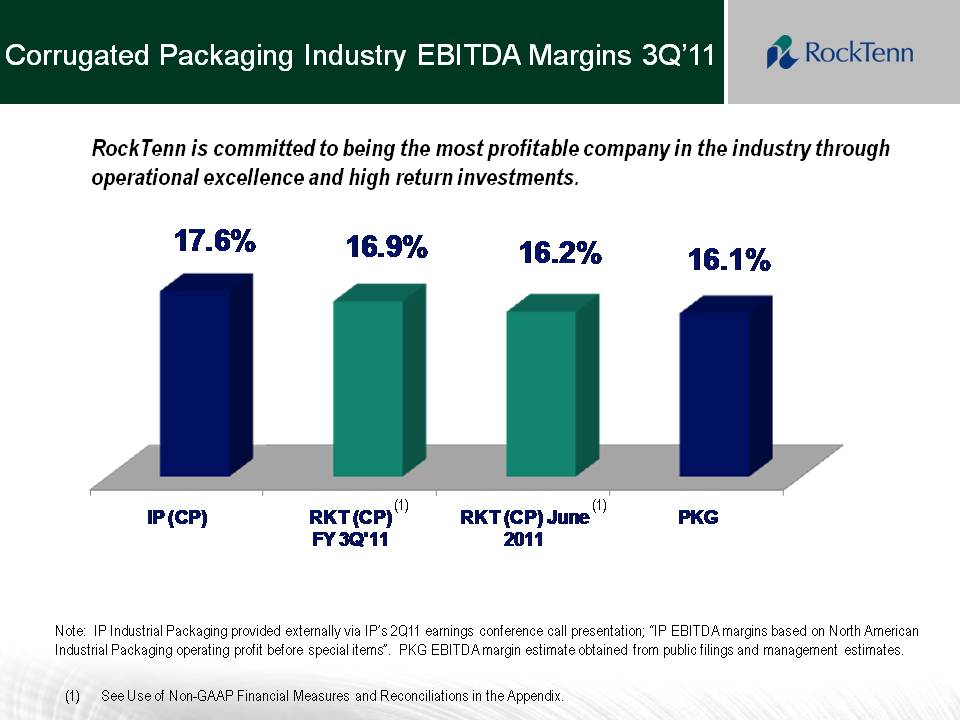
Corrugated Packaging Industry EBITDA Margins 3Q’11 RockTenn is committed to being the most profitable company in the industry through operational excellence and high return investments. Note: IP Industrial Packaging provided externally via IP’s 2Q11 earnings conference call presentation; “IP EBITDA margins based on North American Industrial Packaging operating profit before special items”. PKG EBITDA margin estimate obtained from public filings and management estimates. (1) See Use of Non-GAAP Financial Measures and Reconciliations in the Appendix.
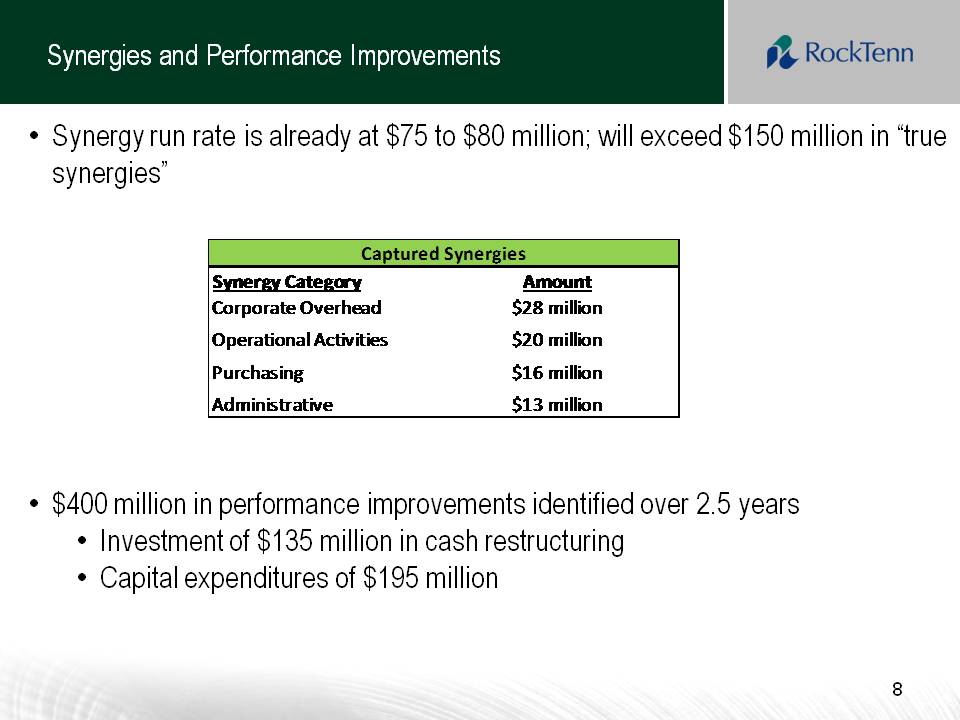
Synergies and Performance Improvements Other Placeholder: 8 Synergy run rate is already at $75 to $80 million; will exceed $150 million in “true synergies”$400 million in performance improvements identified over 2.5 years Investment of $135 million in cash restructuring Capital expenditures of $195 million
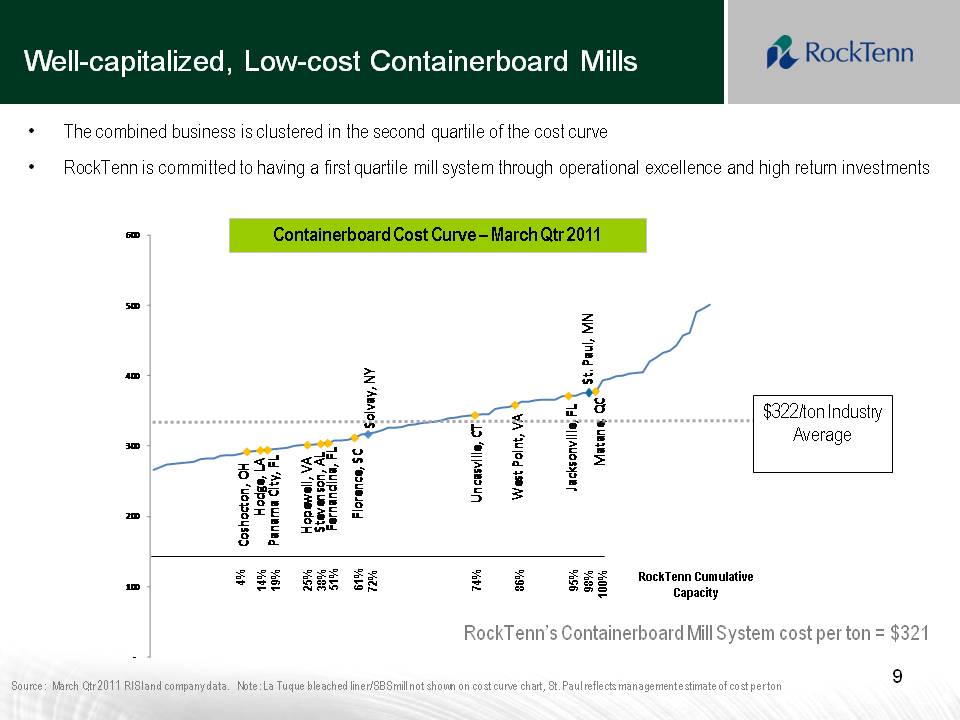
Well-capitalized, Low-cost Containerboard Mills $322/ton Industry Average Source: March Qtr 2011 RISI and company data. Note: La Tuque bleached liner/SBS mill not shown on cost curve chart, St. Paul reflects management estimate of cost per ton Containerboard Cost Curve – March Qtr 2011 RockTenn’s Containerboard Mill System cost per ton = $321 RockTenn Cumulative Capacity 19% 14% 25% 100% 4% 72% 61% 51% 38% 98% 95% 86% 74% Other Placeholder: 9 The combined business is clustered in the second quartile of the cost curve RockTenn is committed to having a first quartile mill system through operational excellence and high return investments
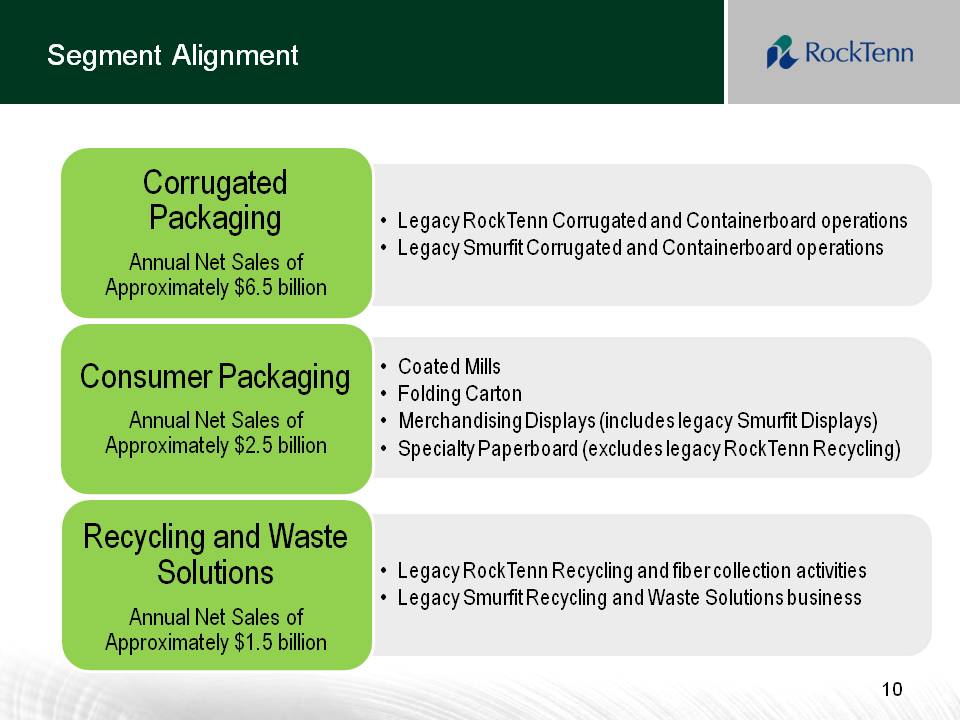
Segment Alignment Consumer Packaging Annual Net Sales of Approximately $2.5 billion Coated Mills Folding Carton Merchandising Displays (includes legacy Smurfit Displays) Specialty Paperboard (excludes legacy RockTenn Recycling) Corrugated Packaging Annual Net Sales of Approximately $6.5 billion Legacy RockTenn Corrugated and Containerboard operations Legacy Smurfit Corrugated and Containerboard operations Recycling and Waste Solutions Annual Net Sales of Approximately $1.5 billion Legacy RockTenn Recycling and fiber collection activities Legacy Smurfit Recycling and Waste Solutions business
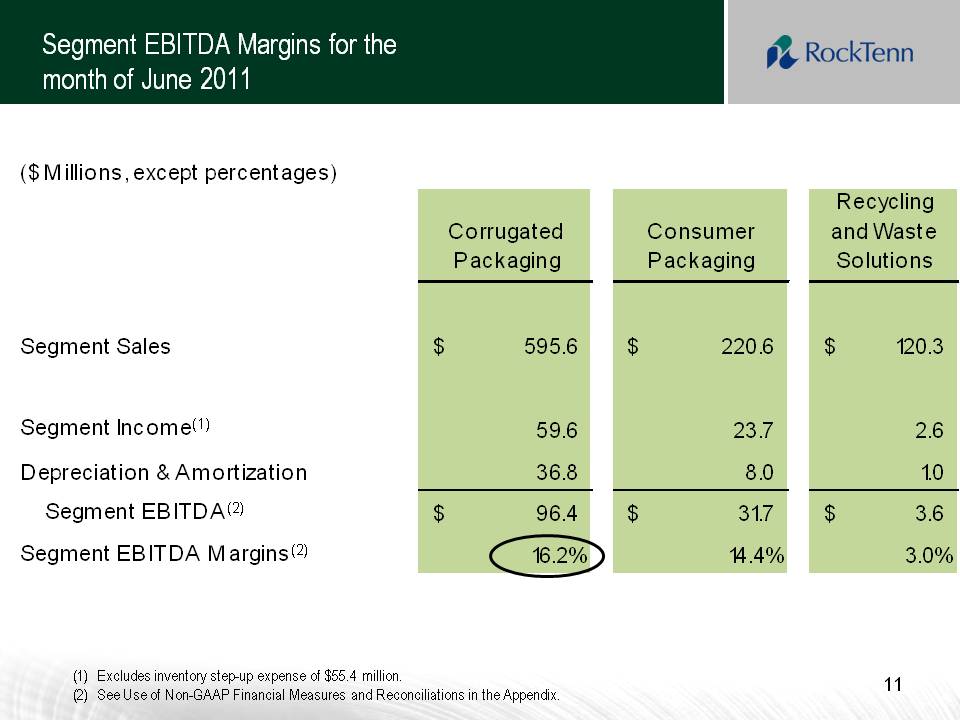
Segment EBITDA Margins for the month of June 2011 Other Placeholder: 11 Excludes inventory step-up expense of $55.4 million. ($Millions, except percentages) Corrugated Packaging Consumer Packaging Recycling and Waste Solutions Segment Sales $ 595.6 $ 220.6 $ 120.3 Segment Income(1) 59.6 23.7 2.6 Depreciation & Amortization 36.8 8.0 1.0 Segment EBITDA(2) $ 96.4 $ 31.7 $ 3.6 Segment EBITDA Margins(2) 16.2% 14.4% 3.0% See Use of Non-GAAP Financial Measures and Reconciliations in the Appendix.
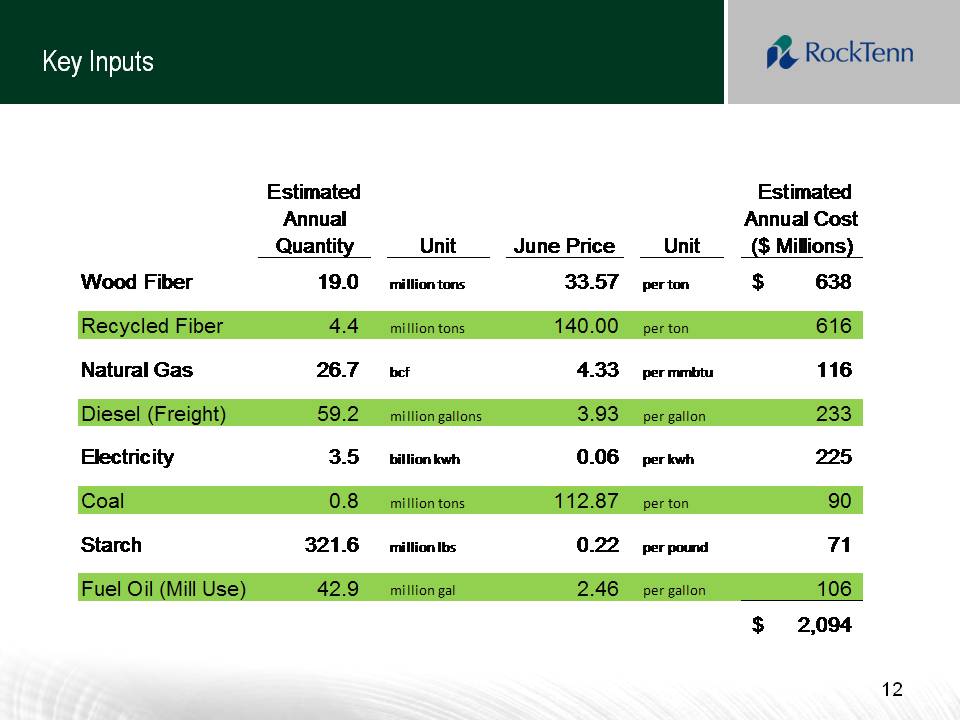
Estimated Annual Quantity Unit June Price Unit Estimated Annual Cost ($ Millions) Wood Fiber 19.0 million tons 33.57 per ton $ 638 Recycled Fiber 4.4 million tons 140.00 per ton 616 Natural Gas 26.7 bcf 4.33 per mmbtu 116 Diesel (Freight) 59.2 million gallons 3.93 per gallon 233 Electricity 3.5 billion kwh 0.06 per kwh 225 Coal 0.8 million tons 112.87 per ton 90 Starch 321.6 million lbs 0.22 per pound 71 Fuel Oil (Mill Use) 42.9 million gal 2.46 per gallon 106 $ 2,094
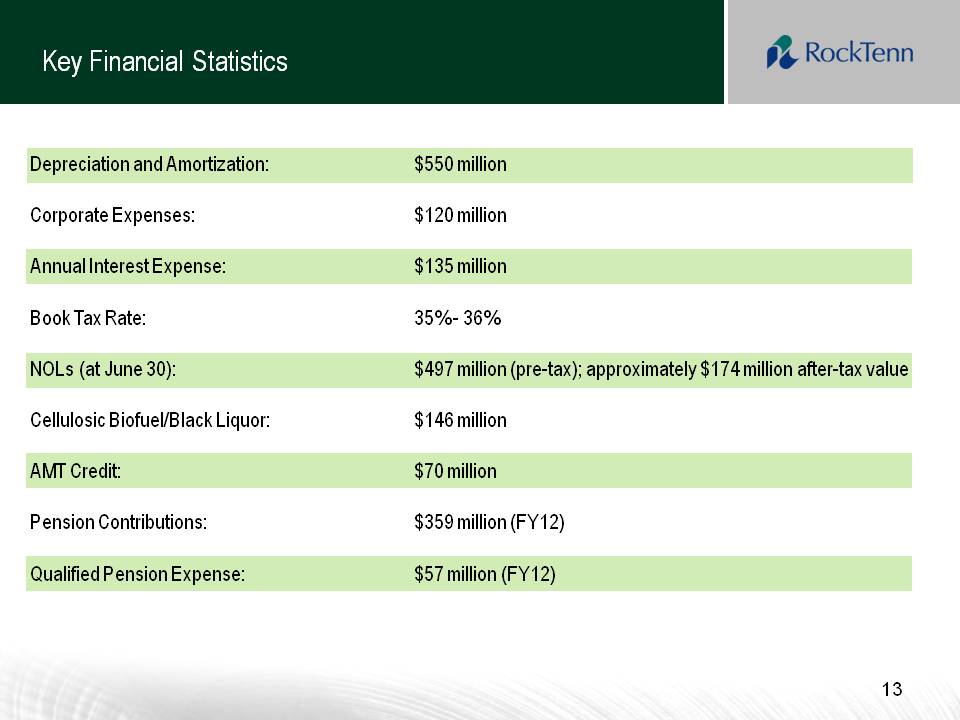
Key Financial Statistics Other Placeholder: 13 Depreciation and Amortization: $550 million Corporate Expenses: $120 million Annual Interest Expense: $135 million Book Tax Rate: 35% - 36% NOLs (at June 30): $497 million (pre-tax); approximately $174 million after-tax value Cellulosic Biofuel/Black Liquor: $146 million AMT Credit: $70 million Pension Contributions: $359 million (FY12) Qualified Pension Expense: $57 million (FY12)
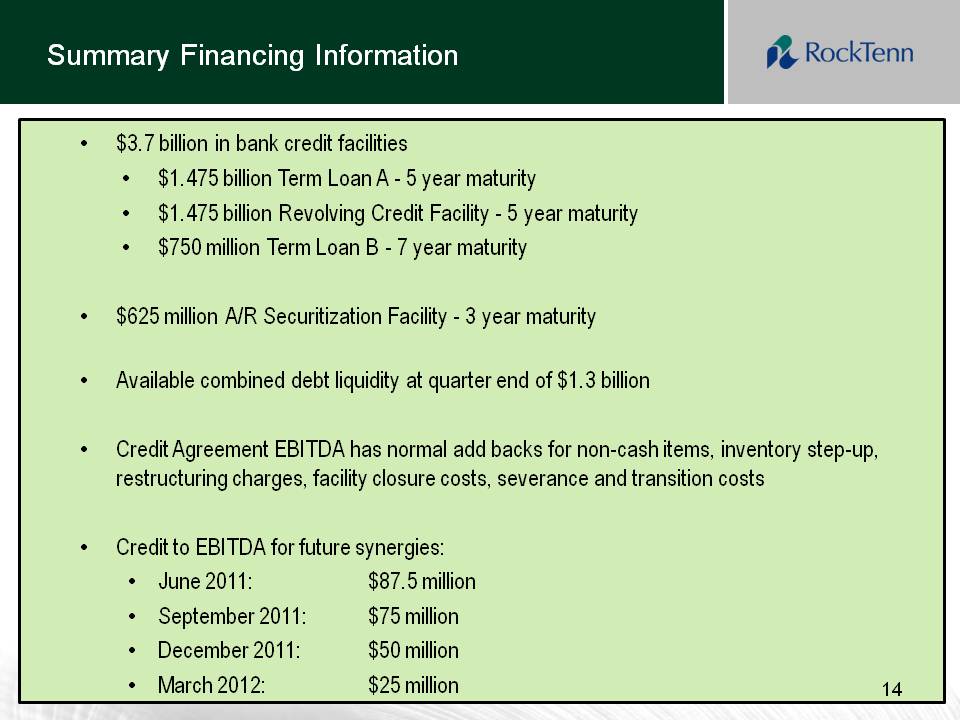
Summary Financing Information Other Placeholder: $3.7 billion in bank credit facilities $1.475 billion Term Loan A - 5 year maturity $1.475 billion Revolving Credit Facility - 5 year maturity $750 million Term Loan B - 7 year maturity $625 million A/R Securitization Facility - 3 year maturity Available combined debt liquidity at quarter end of $1.3 billion Credit Agreement EBITDA has normal add backs for non-cash items, inventory step-up, restructuring charges, facility closure costs, severance and transition costs Credit to EBITDA for future synergies:June 2011: $87.5 million September 2011: $75 million December 2011: $50 million March 2012: $25 million


Appendix
Use of Non-GAAP Financial Measures and Reconciliations Body: Below, we define the non-GAAP financial measures, provide a reconciliation of each non-GAAP financial measure to the most directly comparable financial measure calculated in accordance with GAAP, and discuss the reasons that we believe this information is useful to management and may be useful to investors. These measures may differ from similarly captioned measures of other companies in our industry. Non-GAAP Measures Our definitions of Credit Agreement EBITDA and Segment EBITDA may differ from other similarly titled measures at other companies. Credit Agreement EBITDA (as defined) and Adjusted EBITDA (as defined) are not defined in accordance with GAAP and should not be viewed as alternatives to GAAP measures of operating results or liquidity. RockTenn management believes that net income is the most directly comparable GAAP measure to Credit Agreement EBITDA (as defined) and Segment Income is the most directly comparable GAAP measure to Segment EBITDA.
Non-GAAP Measures: Credit Agreement EBITDA and Total Funded Debt (as defined) Body: “Credit Agreement EBITDA” is calculated in accordance with the definition of “EBITDA” contained in the Company’s Credit Agreement. Credit Agreement EBITDA is generally defined as Consolidated Net Income plus: consolidated interest expense; consolidated tax expenses; depreciation and amortization expenses; various charges and expenses related to, or incurred in connection with, the Smurfit-Stone acquisition; costs and expenses relating to the integration of Smurfit-Stone and the achievement of synergies relating to the Smurfit-Stone acquisition; certain run-rate synergies expected to be achieved due to the Smurfit-Stone acquisition; all non-cash charges; all cash charges and expenses for plant and other facility closures and other cash restructuring charges; labor disruption charges; officer payments associated with any permitted acquisitions; “black liquor” expenses; and cash charges and expenses incurred in respect of the Chapter 11 bankruptcy proceeding and plan of reorganization of Smurfit-Stone; and all non-recurring cash expenses taken in respect of any multi-employer and defined benefit pension plan obligations that are related to plant and other facilities closures. For additional information on the calculation see our Credit Agreement, dated as of May 27, 2011, filed as Exhibit 10.1 to our Form 8-K. “Total Funded Debt” is calculated in accordance with the definition contained in the Company’s Credit Agreement. Total Funded Debt is generally defined as aggregate debt obligations reflected in our balance sheet, less the hedge adjustments resulting from terminated and existing fair value interest rate derivatives or swaps, plus additional outstanding letters of credit not already reflected in debt, plus debt guarantees.
Non-GAAP Measures: Credit Agreement EBITDA and Total Funded Debt Body: Our management uses Credit Agreement EBITDA and Total Funded Debt to evaluate compliance with RockTenn’s debt covenants and borrowing capacity available under its Credit Agreement. Management also uses Credit Agreement EBITDA as a measure of our Company’s core operating performance. Management believes that investors also use these measures to evaluate the Company’s compliance with its debt covenants and available borrowing capacity. Management also believes that investors use Credit Agreement EBITDA as a measure of our Company’s core operating performance. Borrowing capacity is dependent upon, in addition to other measures, the “Total Funded Debt/EBITDA ratio” or the “Leverage Ratio,” which is defined as Total Funded Debt divided by Credit Agreement EBITDA.
Non-GAAP Measures: Net Debt Body: We have defined the non-GAAP measure Net Debt to include the aggregate debt obligations reflected in our balance sheet, less the hedge adjustments resulting from terminated and existing fair value interest rate derivatives or swaps, the balance of our cash and cash equivalents, restricted cash (which includes the balance sheet line items restricted cash and restricted cash and marketable debt securities) and certain other investments that we consider to be readily available to satisfy such debt obligations. Our management uses Net Debt, along with other factors, to evaluate our financial condition. We believe that Net Debt is an appropriate supplemental measure of financial condition and may be useful to investors because it provides a more complete understanding of our financial condition before the impact of our decisions regarding the appropriate use of cash and liquid investments.
Non-GAAP Measures: Adjusted Net Income and Adjusted Earnings Per Diluted Share Body: We also use the non-GAAP measures “adjusted net income” and “adjusted earnings per diluted share”. Management believes these non-GAAP financial measures provide our board of directors, investors, potential investors, securities analysts and others with useful information to evaluate the performance of the Company because it excludes restructuring and other costs, net, the alternative fuel mixture credit and cellulosic biofuel producer credit and other specific items that management believes are not indicative of the ongoing operating results of the business. The Company and the board of directors use this information to evaluate the Company’s performance relative to other periods.
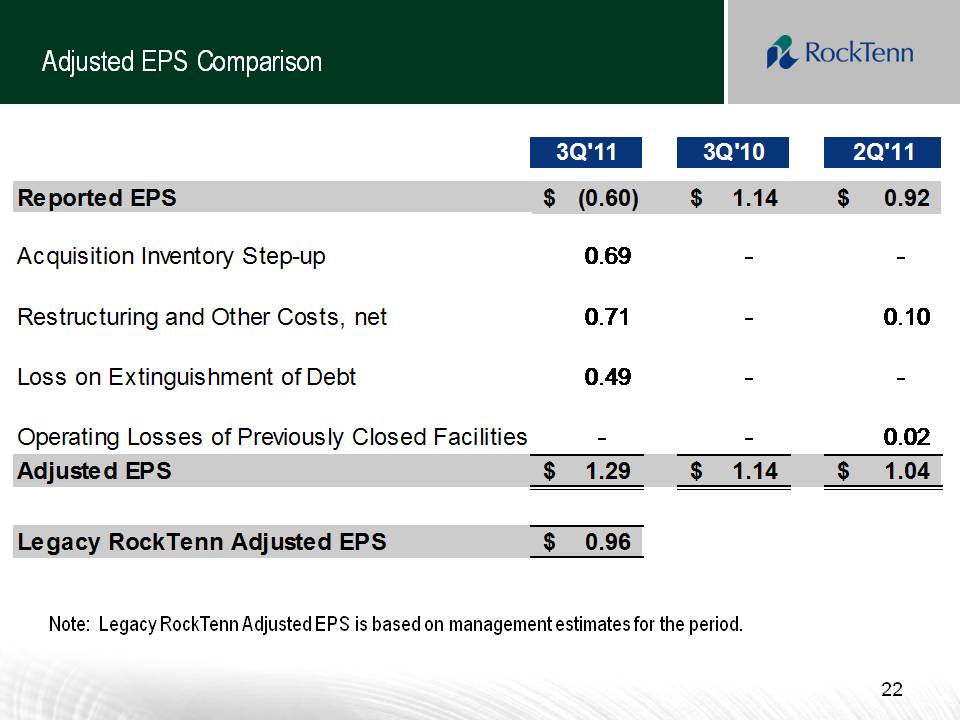
Adjusted EPS Comparison Other Placeholder: 22 Note: Legacy RockTenn Adjusted EPS is based on management estimates for the period. Reported EPS $ (0.60) $ 1.14 $ 0.92 Acquisition Inventory Step-up 0.69 - - Restructuring and Other Costs, net 0.71 - 0.10 Loss on Extinguishment of Debt 0.49 - - Operating Losses of Previously Closed Facilities - - 0.02 Adjusted EPS $ 1.29 $ 1.14 $ 1.04 Legacy RockTenn Adjusted EPS $ 0.96
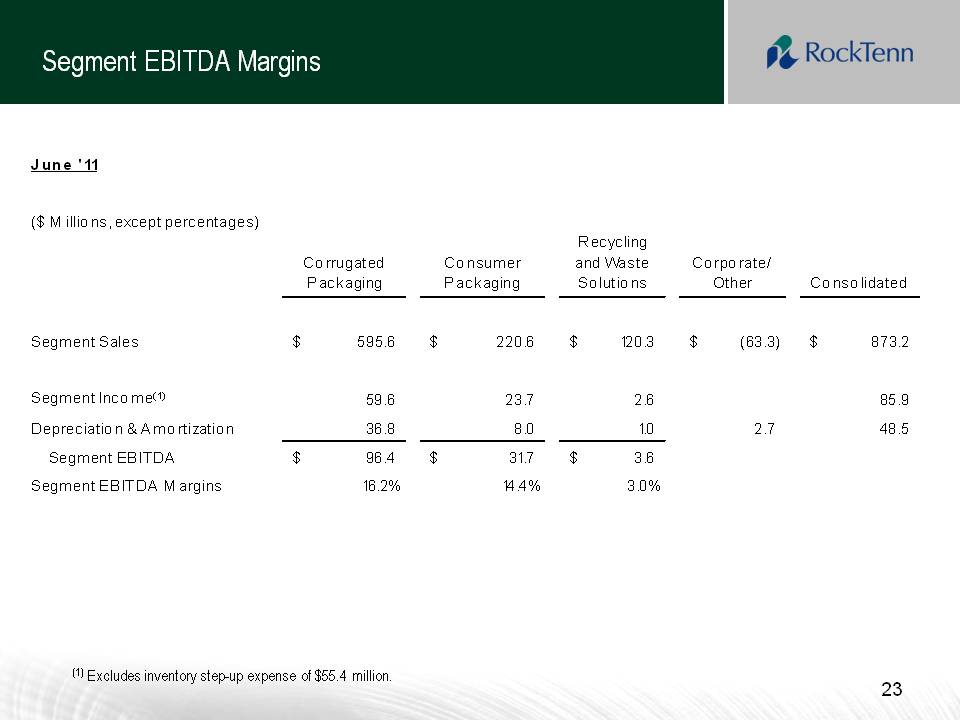
June '11 ($ Millions, except percentages) Corrugated Packaging Consumer Packaging Recycling and Waste Solutions Corporate/ Other Consolidated Segment Sales $ 595.6 $ 220.6 $ 120.3 $ (63.3) $ 873.2 Segment Income(1) 59.6 23.7 2.6 85.9 Depreciation & Amortization 36.8 8.0 1.0 2.7 48.5 Segment EBITDA $ 96.4 $ 31.7 $ 3.6 Segment EBITDA Margins 16.2% 14.4% 3.0% (1) Excludes inventory step-up expense of $55.4 million.
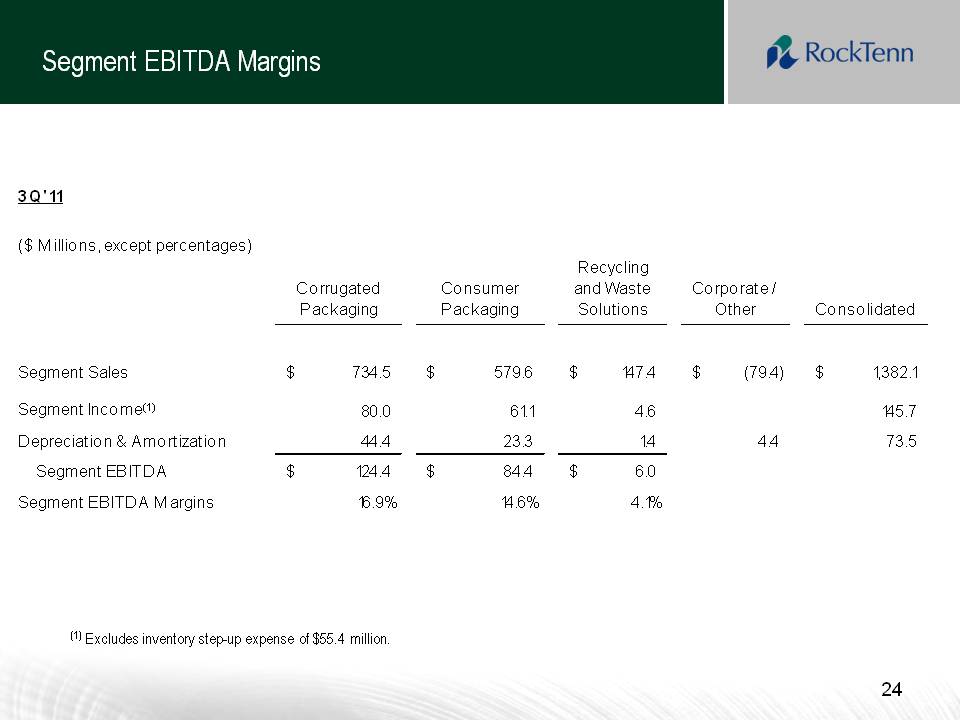
Segment EBITDA Margins 3Q'11 ($ Millions, except percentages) Corrugated Packaging Consumer Packaging Recycling and Waste Solutions Corporate / Other Consolidated Segment Sales $ 734.5 $ 579.6 $ 147.4 $ (79.4) $ 1,382.1 Segment Income(1) 80.0 61.1 4.6 145.7 Depreciation & Amortization 44.4 23.3 1.4 4.4 73.5 Segment EBITDA $ 124.4 $ 84.4 $ 6.0 Segment EBITDA Margins 16.9% 14.6% 4.1% (1) Excludes inventory step-up expense of $55.4 million.
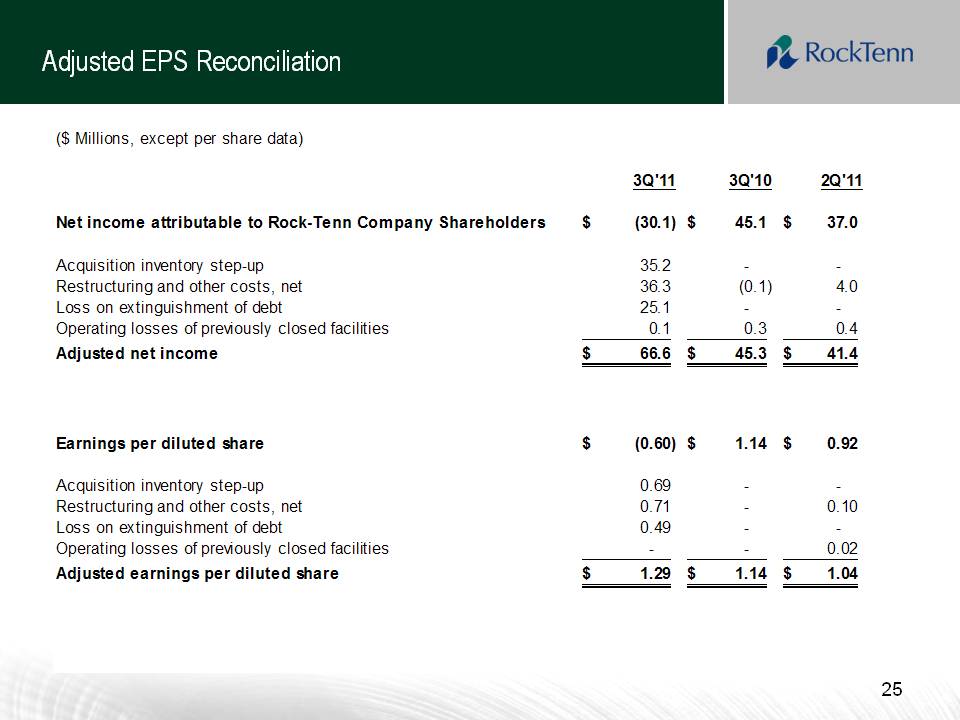
Adjusted EPS Reconciliation ($ Millions, except per share data) 3Q'11 3Q'10 2Q'11 Net income attributable to Rock-Tenn Company Shareholders $ (30.1) $ 45.1 $ 37.0 Acquisition inventory step-up 35.2 - - Restructuring and other costs, net 36.3 (0.1) 4.0 Loss on extinguishment of debt 25.1 - - Operating losses of previously closed facilities 0.1 0.3 0.4 Adjusted net income $ 66.6 $ 45.3 $ 41.4 Earnings per diluted share $ (0.60) $ 1.14 $ 0.92 Acquisition inventory step-up 0.69 - - Restructuring and other costs, net 0.71 - 0.10 Loss on extinguishment of debt 0.49 - - Operating losses of previously closed facilities - - 0.02 Adjusted earnings per diluted share $ 1.29 $ 1.14 $ 1.04
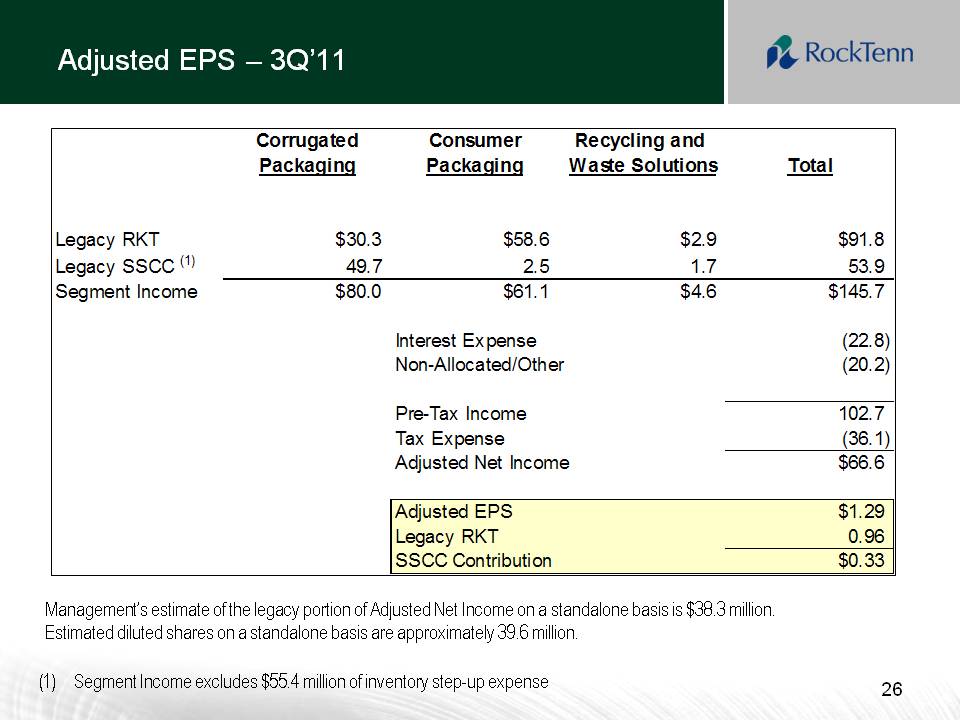
Adjusted EPS – 3Q’11 Corrugated Consumer Recycling and Packaging Packaging Waste Solutions Total Legacy RKT $30.3 $58.6 $2.9 $91.8 Legacy SSCC (1) 49.7 2.5 1.7 53.9 Segment Income $80.0 $61.1 $4.6 $145.7 Interest Expense (22.8) Non-Allocated/Other (20.2) Pre-Tax Income 102.7 Tax Expense (36.1) Adjusted Net Income $66.6 Adjusted EPS $1.29 Legacy RKT 0.96 SSCC Contribution $0.33 Segment Income excludes $55.4 million of inventory step-up expense Management’s estimate of the legacy portion of Adjusted Net Income on a standalone basis is $38.3 million. Estimated diluted shares on a standalone basis are approximately 39.6 million.
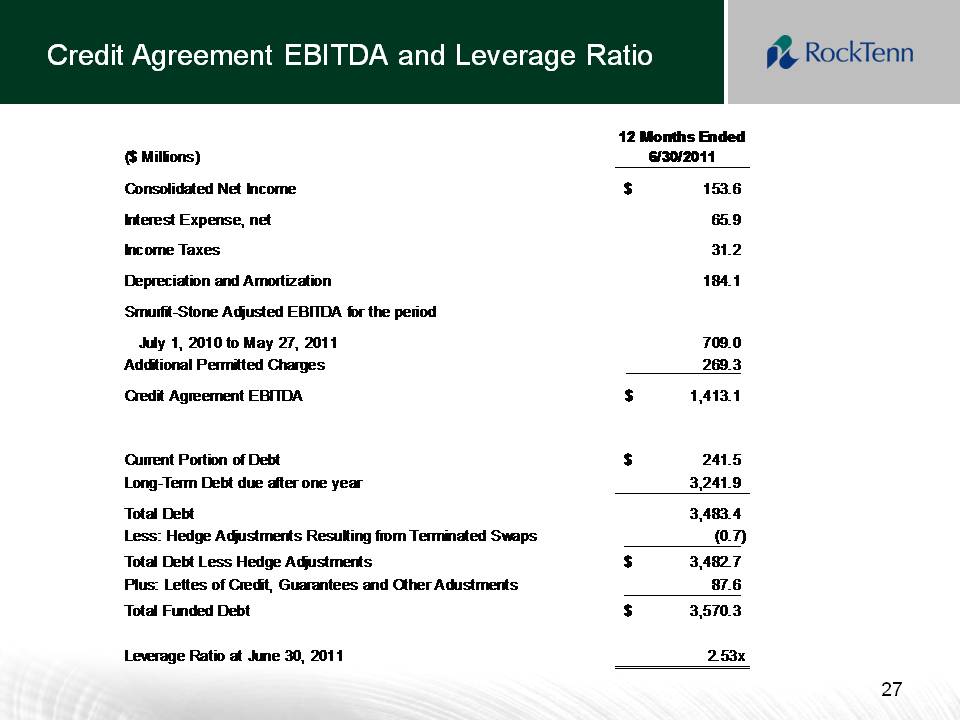
Credit Agreement EBITDA and Leverage Ratio ($ Millions) 12 Months Ended 6/30/2011 Consolidated Net Income $ 153.6 Interest Expense, net 65.9 Income Taxes 31.2 Depreciation and Amortization 184.1 Smurfit-Stone Adjusted EBITDA for the period July 1, 2010 to May 27, 2011 709.0 Additional Permitted Charges 269.3 Credit Agreement EBITDA $ 1,413.1 Current Portion of Debt $ 241.5 Long-Term Debt due after one year 3,241.9 Total Debt 3,483.4 Less: Hedge Adjustments Resulting from Terminated Swaps (0.7) Total Debt Less Hedge Adjustments $ 3,482.7 Plus: Lettes of Credit, Guarantees and Other Adustments 87.6 Total Funded Debt $ 3,570.3 Leverage Ratio at June 30, 2011 2.53x
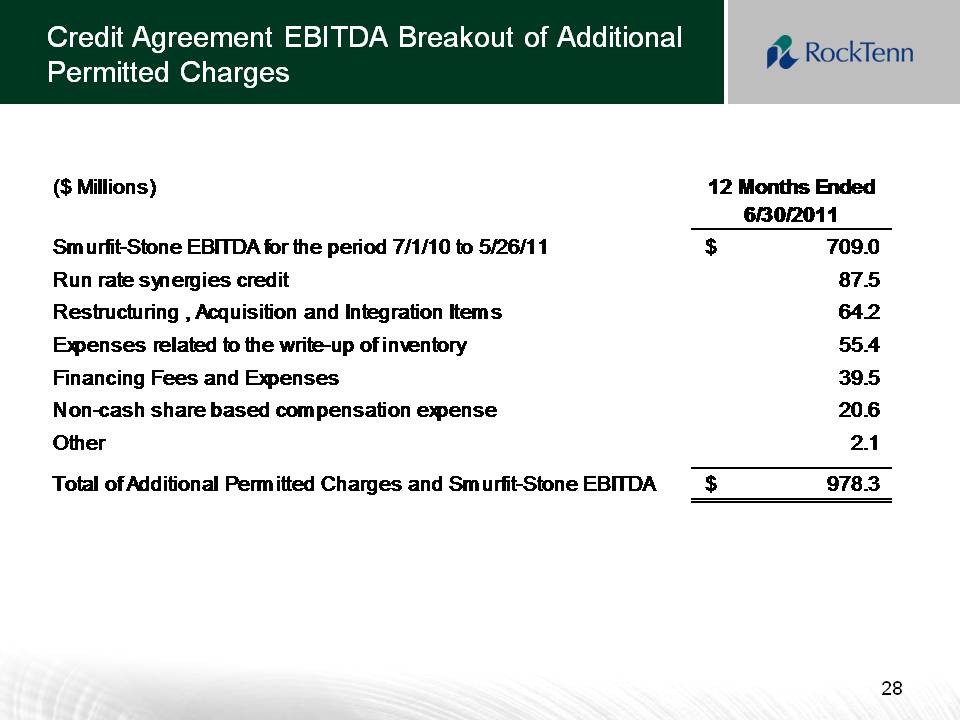
Title: Credit Agreement EBITDA Breakout of Additional Permitted Charges ($ Millions) 12 Months Ended 6/30/2011 Smurfit-Stone EBITDA for the period 7/1/10 to 5/26/11 $ 709.0 Run rate synergies credit 87.5 Restructuring , Acquisition and Integration Items 64.2 Expenses related to the write-up of inventory 55.4 Financing Fees and Expenses 39.5 Non-cash share based compensation expense 20.6 Other 2.1 Total of Additional Permitted Charges and Smurfit-Stone EBITDA $ 978.3