Attached files
| file | filename |
|---|---|
| 8-K - FORM 8-K - Kraton Corp | d8k.htm |
 KRATON
PERFORMANCE POLYMERS, INC. SECOND QUARTER 2011 EARNINGS CONFERENCE CALL
August 3, 2011
Exhibit 99.1 |
 Forward-Looking Statement Disclaimer
2
This presentation may include “forward-looking statements” that reflect our
plans, beliefs, expectations and current views with respect to, among other things,
future events and financial performance. Forward-looking statements are often characterized by the use of
words such as “believes,” “estimates,” “expects,”
“projects,” “may,” “intends,” “plans” or “anticipates,” or by discussions of strategy,
plans or intentions and include statements regarding our ability to obtain raw materials;
costs, timing and plans related to our planned joint venture with Formosa Petrochemical
Corporation and the related manufacturing facility; estimated future contributions to our
benefit plans; anticipated capital expenditures; and estimated future pension contributions.
All forward-looking statements in this presentation are made based on management's
current expectations and estimates, which involve risks, uncertainties and other factors
that could cause actual results to differ materially from those expressed in
forward-looking statements. Readers are cautioned not to place undue reliance on
forward-looking statements. These risks and uncertainties are more fully described in “Part I. Item 1A. Risk
Factors” contained in our Annual Report on 10-K, as filed with the Securities and
Exchange Commission and as subsequently updated in our Quarterly Reports on Form
10-Q, and include risks related to: conditions in the global economy and capital markets; our reliance on
LyondellBasell Industries for the provision of significant operating and other services; the
failure of our raw materials suppliers to perform their obligations under long-term
supply agreements, or our inability to replace or renew these agreements when they expire;
limitations in the availability of raw materials we need to produce our products in the
amounts or at the prices necessary for us to effectively and profitably operate our
business; competition in our end-use markets, by other producers of SBCs and by producers of
products that can be substituted for our products; our ability to produce and commercialize
technological innovations; our ability to protect our intellectual property, on which
our business is substantially dependent; infringement of our products on the intellectual
property rights of others; seasonality in our Paving and Roofing business; financial and
operating constraints related to our substantial level of indebtedness; the inherently
hazardous nature of chemical manufacturing; product liability claims and other lawsuits arising from
environmental damage or personal injuries associated with chemical manufacturing; political
and economic risks in the various countries in which we operate; health, safety and
environmental laws, including laws that govern our employees’ exposure to chemicals deemed
harmful to humans; regulation of our customers, which could affect the demand for our products
or result in increased compliance costs; customs, international trade, export control,
antitrust, zoning and occupancy and labor and employment laws that could require us to
modify our current business practices and incur increased costs; fluctuations in currency
exchange rates; our relationship with our employees; loss of key personnel or our
inability to attract and retain new qualified personnel; the fact that we do not enter into long-
term contracts with our customers; a decrease in the fair value of our pension assets, which
could require us to materially increase future funding of the pension plan; future
sales of our shares could adversely affect the market price of our common stock; and Delaware
law and some provisions of our organizational documents make a takeover of our company more
difficult. We assume no obligation to update such information. Further information
concerning issues that could materially affect financial performance related to forward
looking statements can be found in our periodic filings with the Securities and Exchange
Commission. |
 GAAP
Disclaimer 3
This presentation includes the use of both GAAP (generally accepted accounting principles) and
non- GAAP financial measures. The non-GAAP financial measures are EBITDA and
Adjusted EBITDA. The most directly comparable GAAP financial measure is net
income/loss. A reconciliation of the non- GAAP financial measures used in this
presentation to the most directly comparable GAAP measure is included herein. We
consider EBITDA and Adjusted EBITDA important supplemental measures of our performance
and believe they are frequently used by investors and other interested parties in the
evaluation of companies in our industry. EBITDA and Adjusted EBITDA have limitations as
analytical tools and should not be considered in isolation or as a substitute for
analysis of our results under GAAP in the United States. |
 Update on
2011 Business Priorities 4
Capital Investment
Earnings Growth
Innovation-led Top-line
Growth
Paulinia IRL expansion complete
Belpre IR conversion complete
Belpre DCS upgrade ongoing
Finalized agreement with our supplier in Japan for next IRL
capacity addition
Announced Framework Agreement with Formosa
Q2 TTM vitality index of 14%
Q2’11 innovation revenue up 25% compared to Q2’10
Q2 sales volume of 82 kT
Q2 revenue of $386 million, up 16% year-on-year
Q2 GAAP net income of $47 million or $1.44 per share
Q2 Adjusted EBITDA of $74 million
Q2 LIFO to FIFO benefit of $50 million
JV to build, own and operate 30 kT HSBC plant in Taiwan |
  11%
-3%
Q2'11 vs. Q2'10
Q2'11 vs. Q1'11
30%
$98
$111
$108
Q2 10
Q1 11
Q2 11
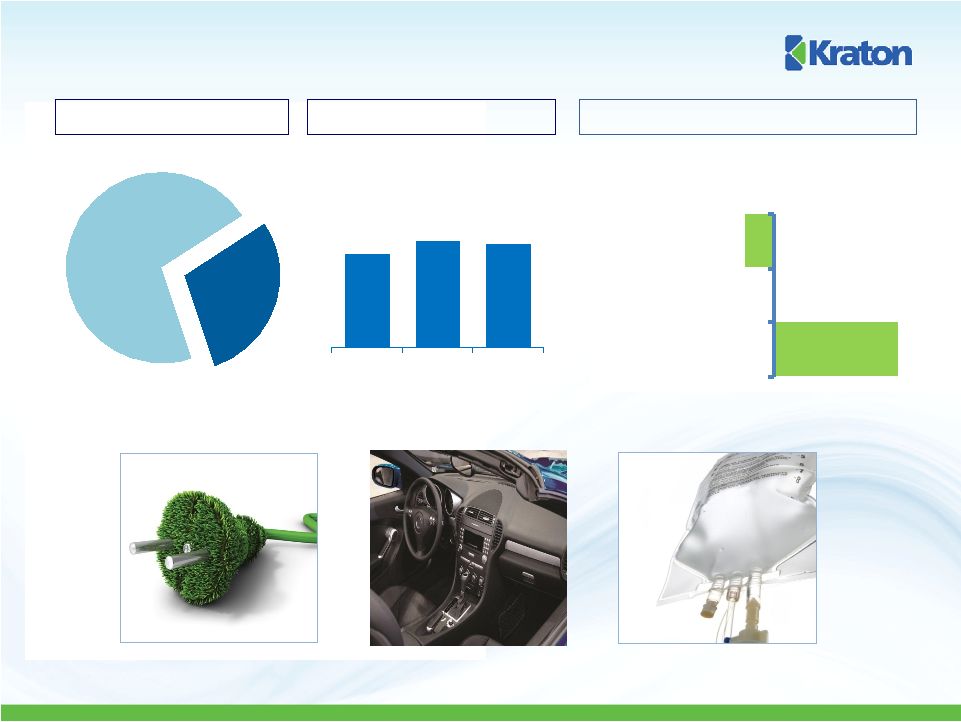
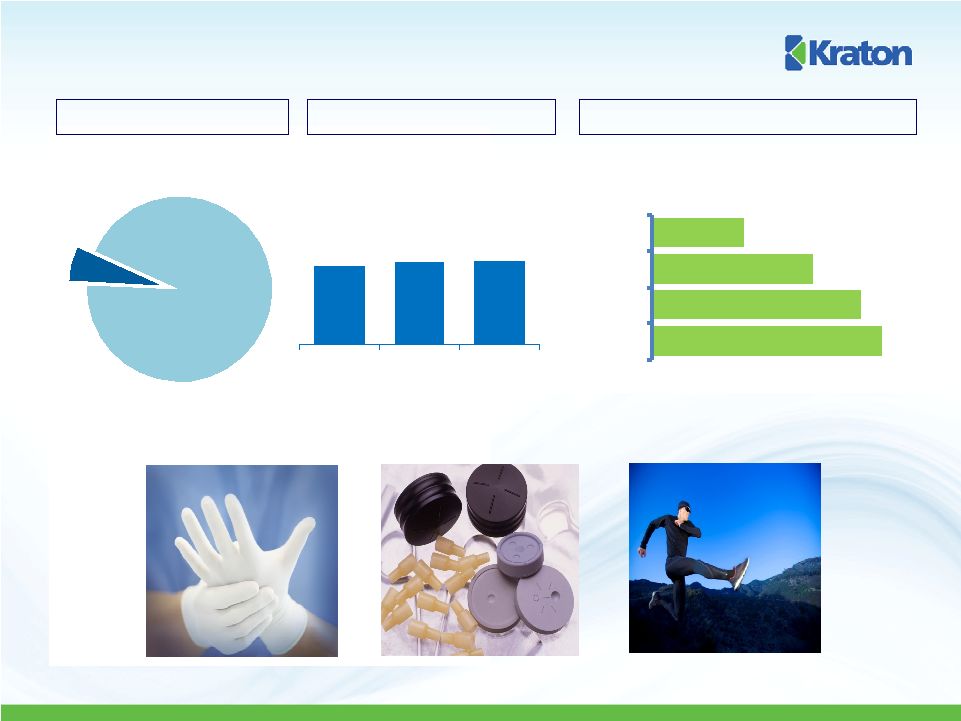
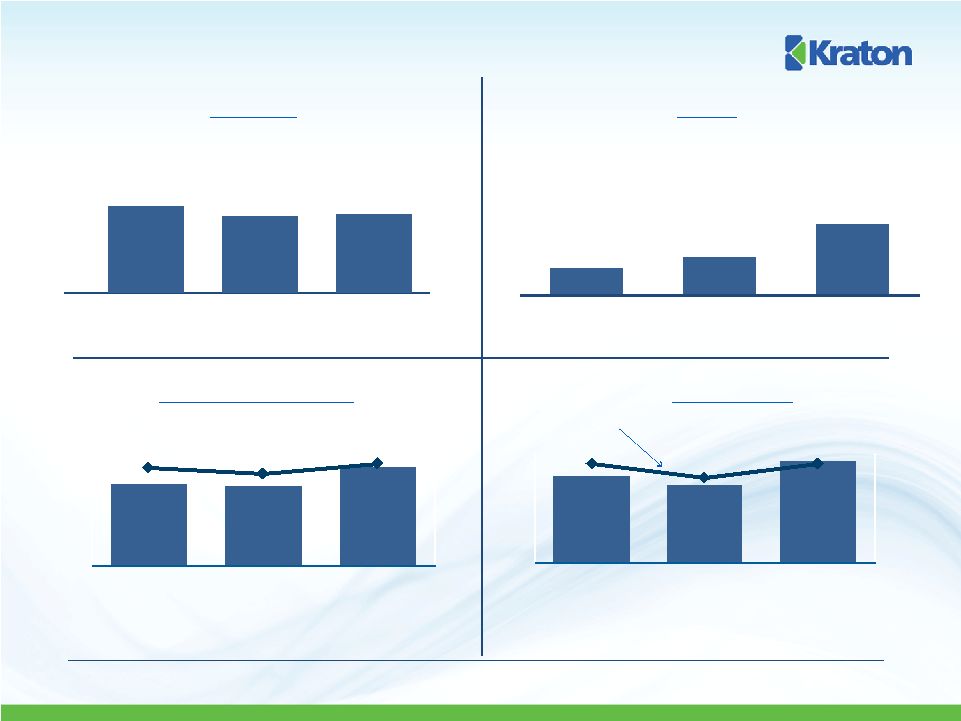
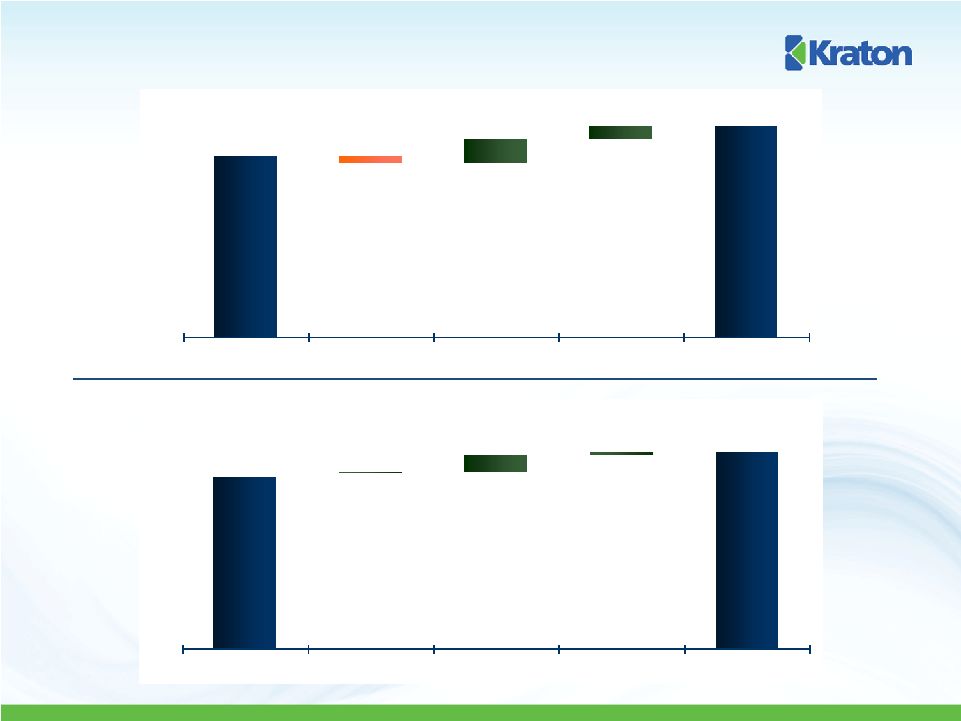
Advanced Materials End Use Review
5
TTM Revenue Profile
Change in Sales Revenue
End Use Revenue
US $ in millions
AM |
 17%
11%
Q2'11 vs. Q2'10
Q2'11 vs. Q1'11
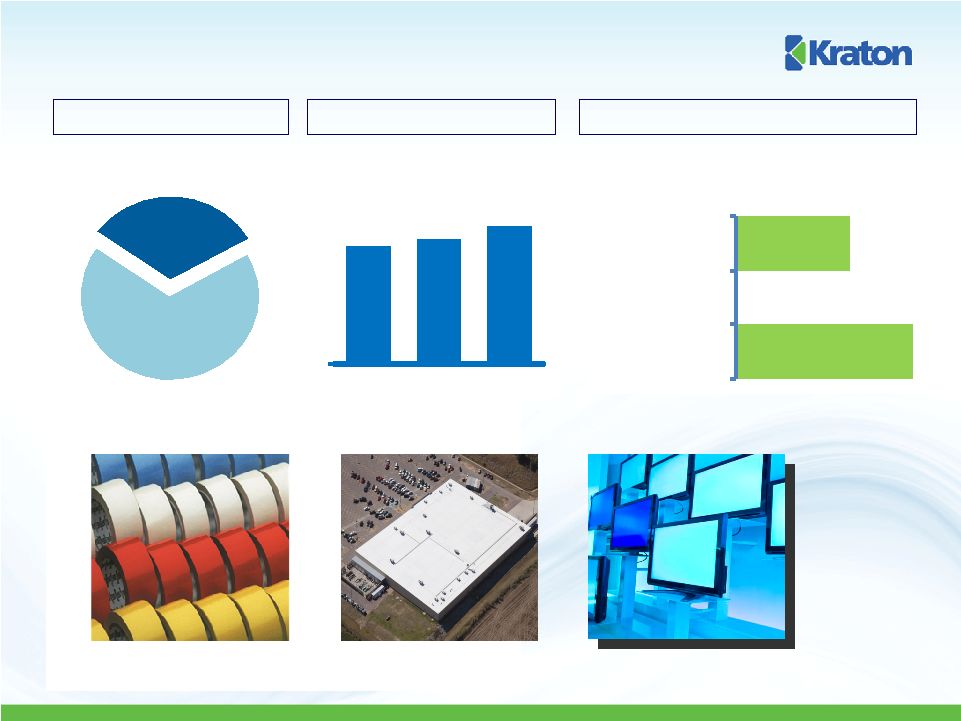
Adhesives, Sealants and Coatings End Use Review
32%
6
TTM Revenue Profile
Change in Sales Revenue
End Use Revenue
US $ in millions
ASC
$104
$110
$122
Q2 10
Q1 11
Q2 11 |
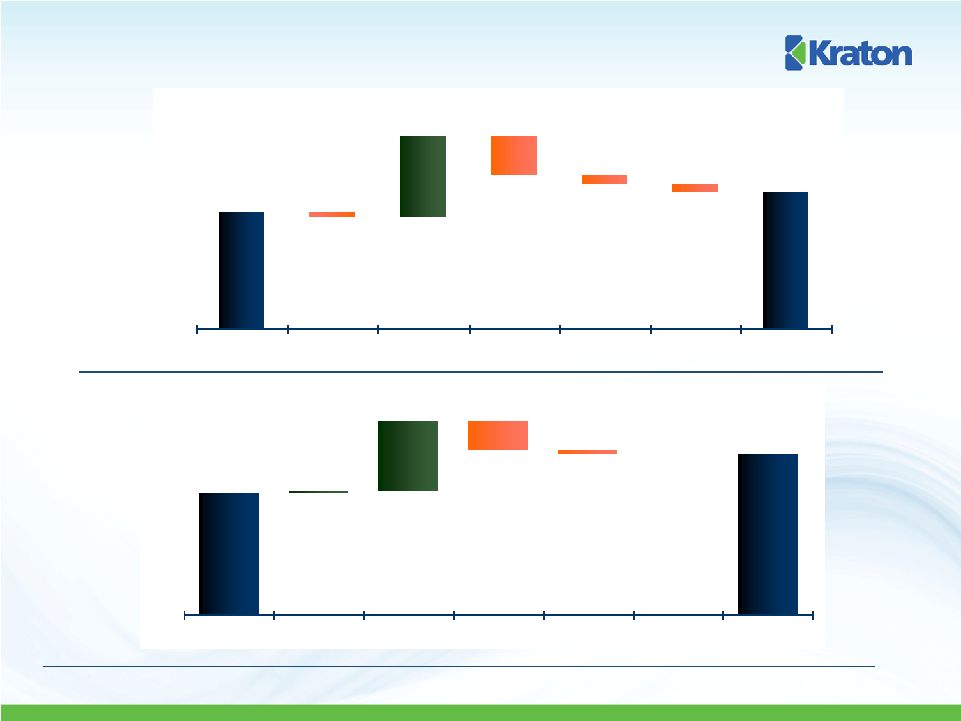
 19%
36%
Q2'11 vs. Q2'10
Q2'11 vs. Q1'11
29%
$107
$94
$128
Q2 10
Q1 11
Q2 11
Paving and Roofing End-Use Review
7
TTM Revenue Profile
Change in Sales Revenue
End Use Revenue
US $ in millions
P&R |
 $87
$79
$61
$35
TTM Q2'11
2010
2009
2008
6%
EB
$19
$20
$20
Q2 10
Q1 11
Q2 11
Emerging Businesses End Use Review
8
TTM Revenue Profile
Sales Revenue
End Use Revenue
US $ in millions
US $ in millions |
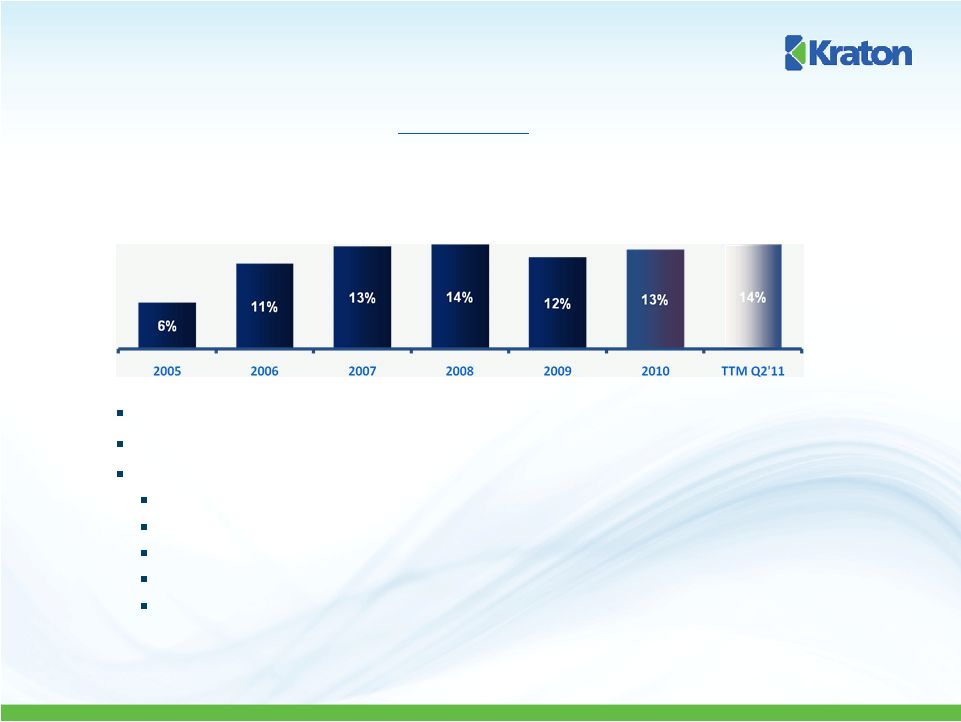 Innovation-led Top Line Growth
9
Goal -
20% of revenue from innovation
Vitality Index
Q2 TTM vitality index 14%
Innovation revenue up 25% year-on-year, YTD innovation revenue up 38%
Strong
year-on-year revenue growth in key innovations
PVC replacement up 114%
Potable water tubing up 83%
Roofing innovations up 56%
Reactive SBS for printing plates up 46%
Key adhesives applications up 45% |
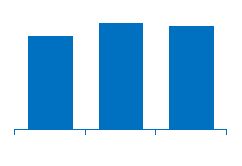
 Volume (kT)
Selected Financial Trends –
Q2 2011
(1)
Adjusted EBITDA is GAAP EBITDA excluding restructuring and related charges,
non-cash compensation expenses, and loss on the extinguishment of
debt. 10
Revenue
(US $ in Millions)
Gross Profit and Gross Margin
(US $ in Millions)
Adjusted EBITDA
(1)
(US $ in Millions)
Adjusted
EBITDA
Margin
$332
$345
$386
$300
$350
$400
Q2 10
Q1 11
Q2 11
82
81
86
Q2 10
Q1 11
Q2 11
$89
$87
$108
26.8%
25.2%
28.1%
0
20
40
60
80
100
120
Q2 10
Q1 11
Q2 11
$63
$56
$74
19.0%
16.2%
19.0%
0
10
20
30
40
50
60
70
80
Q2 10
Q1 11
Q2 11
40
60
80
100
120
140 |
 Impact of
Monomer Volatility 11
$5.2
$11.9
$22.3
-$2.3
-$34.3
-$9.3
$12.8
$13.3
$7.3
$14.7
-$1.7
-$8.1
$21.0
$49.8
Q1 08
Q2 08
Q3 08
Q4 08
Q1 09
Q2 09
Q3 09
Q4 09
Q1 10
Q2 10
Q3 10
Q4 10
Q1 11
Q2 11
$568
$537
$805
$976
$918
$632
$707
$781
$849
$864
$1,046
$970
$810
$712
Q1 08
Q2 08
Q3 08
Q4 08
Q1 09
Q2 09
Q3 09
Q4 09
Q1 10
Q2 10
Q3 10
Q4 10
Q1 11
Q2 11
$636
$664
$1,054
$932
$190
$501
$865
$998
$949
$1,034
$1,024
$885
$1,068
$1,318
Q1 08
Q2 08
Q3 08
Q4 08
Q1 09
Q2 09
Q3 09
Q4 09
Q1 10
Q2 10
Q3 10
Q4 10
Q1 11
Q2 11
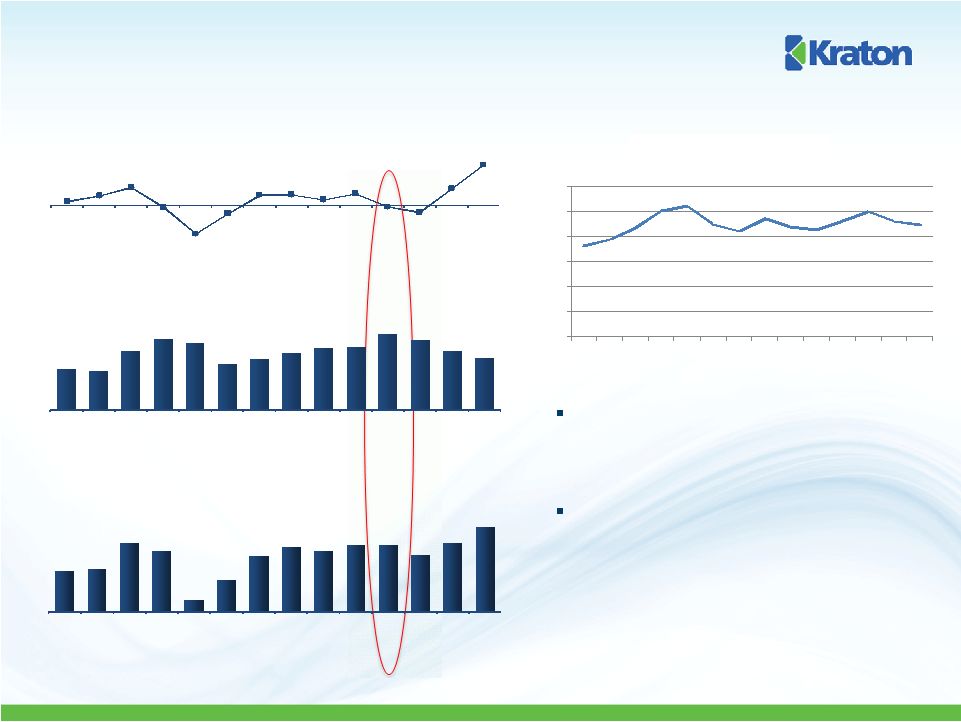
Quarterly Impact of LIFO to FIFO
Adjustment
Gross Profit per Ton
@ LIFO
Gross Profit per Ton
@ FIFO (GAAP)
In periods where LIFO to FIFO impact is
minimal, profit per ton on a LIFO basis and a
FIFO basis converge, demonstrating pass
through of raw material price increases
Spread between revenue per ton and raw
material cost per ton (LIFO basis) also
demonstrates pass through of raw material
price increases
$-
$500
$1,000
$1,500
$2,000
$2,500
$3,000
Q1
08
Q2
08
Q3
08
Q4
08
Q1
09
Q2
09
Q3
09
Q4
09
Q1
10
Q2
10
Q3
10
Q4
10
Q1
11
Q2
11
Spread Between Revenue/Ton and
Raw Material Cost/Ton (@LIFO) |
 Q2 2011
Sales Revenue Walk 12
Q2 2011 vs. Q1 2011
Q2 2011 vs. Q2 2010
US $ in millions
$332
$386
$(13)
$44
$23
Q2 2010
Volume
Price
FX
Q2 2011
$345
$386
$1
$32
$8
Q1 2011
Volume
Price
FX
Q2 2011 |
 Q2 2011
Adjusted EBITDA (1)
Walk
13
Q2 2011 vs. Q1 2011
US $ in millions
(1)
Adjusted EBITDA
is GAAP EBITDA excluding restructuring and related charges, non-cash
compensation expenses, and loss on the extinguishment of debt.
Q2 2011 vs. Q2 2010
$63
$74
$(3)
$44
$(21)
$(5)
$(4)
Q2 2010
Volume
Price
COGS
R&D/SG&A
FX/Other
Q2 2011
$56
$74
$1
$32
$(13)
$(2)
$-
Q1 2011
Volume
Price
COGS
R&D/SG&A
FX/Other
Q2 2011 |
 Q2 2011
Financial Overview (1)
Adjusted EBITDA is GAAP EBITDA excluding restructuring and related charges,
non-cash compensation expenses, and loss on the extinguishment of
debt. US $ in Thousands except per share data
14
Three months Ended
Three months Ended
Three months Ended
6/30/2011
3/31/2011
6/30/2010
Sales Volume (kt)
82
81
86
Total Operating Revenues
$
386,428
$
344,828
$
332,086 Cost of Goods Sold
278,033
257,977
242,973
Gross Profit
108,395
86,851
89,113
Operating expenses
Research and Development
6,966
6,602
5,572
Selling, General and Administrative
27,912
27,171
21,772
Depreciation and Amortization of Identifiable Intangibles
15,604
14,626
11,969
Loss on Extinguishment of Debt
-
2,985
-
Earnings (loss) of Unconsolidated Joint Venture
(880)
141
162
Interest Expense, net
5,915
11,181
6,272
Income Before Income Taxes
51,118
24,427
43,690
Income Tax Expense
4,141
2,550
5,095
Net Income
$
46,977
$
21,877
$
38,595 Earnings
per
Common
Share
-
Diluted
$
1.44
$
0.68
$
1.24 Adjusted EBITDA
(1)
$
74,199
$
56,018
$
63,025 |
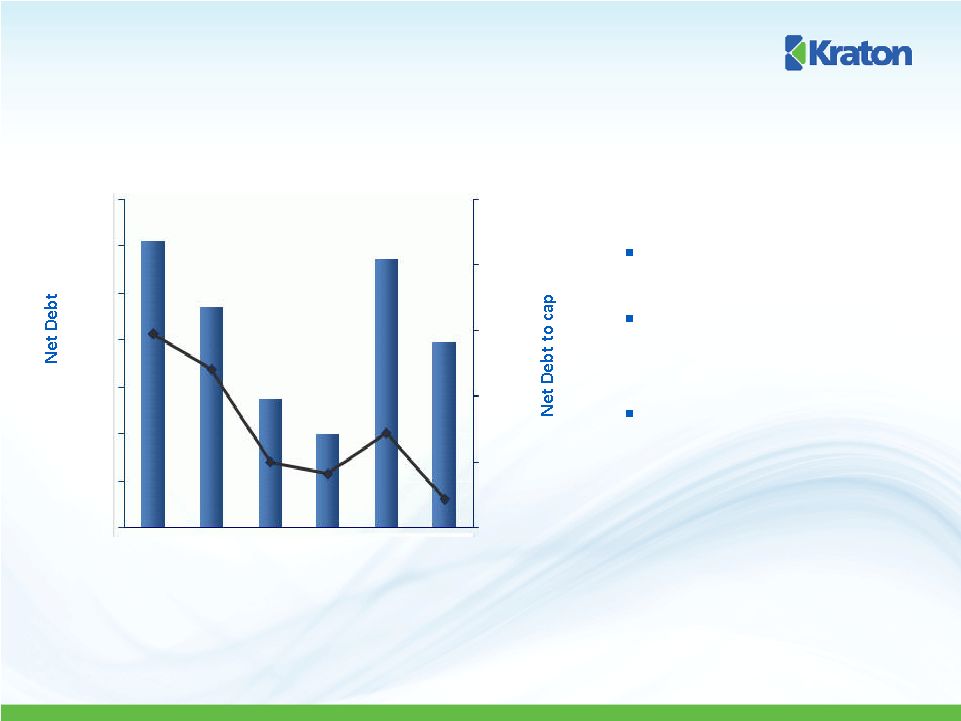 US $
in millions 15
Cash at quarter end of
$67 million.
Net Debt-to-Capitalization
ratio of 37.2% at quarter
end.
Net Debt to TTM Adjusted
EBITDA was 1.5x at
6/30/11.
(1)
Net debt is equal to total debt, less cash and cash equivalents.
Balance Sheet
49.7%
47.0%
40.0%
39.1%
42.2%
37.2%
35%
40%
45%
50%
55%
60%
$250
$270
$290
$310
$330
$350
$370
Q1'10
Q2'10
Q3'10
Q4'10
Q1'11
Q2'11
Net Debt
and Net Debt to Capitalization
(1)
$390 |
 Selected
2011 Estimates Working capital (excluding cash) as a % of revenue
25% to 27%
Capital spending
$80 to $85 million
Interest expense
(1)
~$31 million
Research & development
~$28 million
SG&A
~ $103 million
Depreciation and amortization
~$61 million
Book tax rate
~9%
16
(1)
Includes accelerated write-off of deferred financing costs associated with the debt
refinancing of $5 million. |
 APPENDIX
August 3, 2011 |
 Reconciliation of Net Income to EBITDA and Adjusted EBITDA
18
US $ in Thousands
(1)
The EBITDA measure is used by management to evaluate operating performance. Management
believes that EBITDA is useful to investors because it is frequently used by investors
and other interested parties in the evaluation of companies in our industry.
EBITDA is not a recognized term under GAAP and does not purport to be an alternative to net
income (loss) as an indicator of operating performance or to cash flows from operating
activities as a measure of liquidity. Since not all companies use identical calculations, this presentation of EBITDA may not be comparable to other similarly titled
measures of other companies. Additionally, EBITDA is not intended to be a measure of free
cash flow for management's discretionary use, as it does not consider certain cash
requirements such as interest payments, tax payments and debt service requirements.
(2) Adjusted EBITDA is GAAP EBITDA excluding restructuring
and related charges, non-cash compensation expenses, and loss on the extinguishment of debt.
Three months Ended
Three months Ended
Three months Ended
6/30/2011
3/31/2011
6/30/2010
Net Income
$ 46,977
$
21,877
$
38,595 Add(deduct):
Interest expense, net
5,915
11,181
6,272
Income tax expense
4,141
2,550
5,095
Depreciation and amortization expenses
15,604
14,626
11,969
EBITDA
(1)
$ 72,637
$
50,234
$
61,931 EBITDA
(1)
$
72,637
$
50,234
$
61,931 Add:
Restructuring and related charges
(93)
1,505
655
Other non-cash expenses
1,655
1,294
439
Loss on extinguishment of debt
-
2,985
-
Adjusted EBITDA
(2)
$ 74,199
$
56,018
$
63,025 Restructuring and related detail:
Selling, general and administrative
(93)
1,505
655
Total restructuring and related charges
(93)
$
1,505 655
$
$ |
 KRATON
PERFORMANCE POLYMERS, INC. SECOND QUARTER 2011 EARNINGS CONFERENCE CALL
August 3, 2011 |