Attached files
Table of Contents
As filed with the Securities and Exchange Commission on August 3, 2011
File No. 333-175458
UNITED STATES
SECURITIES AND EXCHANGE COMMISSION
Washington, D.C. 20549
Amendment No. 1
to
FORM S-1
REGISTRATION STATEMENT
UNDER
THE SECURITIES ACT OF 1933
GENERAL FINANCE CORPORATION
(Exact name of registrant as specified in its charter)
| Delaware | 7359 | 32-0163571 | ||
| (State or other jurisdiction of incorporation or organization) |
(Primary Standard Industrial Classification Code Number) |
(I.R.S. Employer Identification Number) |
39 East Union Street
Pasadena, California 91103
(626) 584-9722
(Address, including zip code, and telephone number, including area code, of registrant’s principal executive offices)
Ronald F. Valenta,
Chief Executive Officer
39 East Union Street
Pasadena, California 91103
(626) 584-9722
(Name, address, including zip code, and telephone number, including area code, of agent for service)
Copies to:
Christopher A. Wilson, Esq.
General Counsel, Vice President & Secretary
39 East Union Street
Pasadena, California 91103
(626) 584-9722
(626) 795-8090 — Facsimile
Approximate date of commencement of proposed sale to the public: As soon as practicable after the effective date of this registration statement.
If any of the securities being registered on this Form are to be offered on a delayed or continuous basis pursuant to Rule 415 under the Securities Act of 1933 check the following box. þ
If this Form is filed to register additional securities for an offering pursuant to Rule 462(b) under the Securities Act, please check the following box and list the Securities Act registration statement number of the earlier effective registration statement for the same offering. ¨
If this Form is a post-effective amendment filed pursuant to Rule 462(c) under the Securities Act, check the following box and list the Securities Act registration statement number of the earlier effective registration statement for the same offering. ¨
If this Form is a post-effective amendment filed pursuant to Rule 462(d) under the Securities Act, check the following box and list the Securities Act registration statement number of the earlier effective registration statement for the same offering. ¨
Indicate by check mark whether the registrant is a large accelerated filer, an accelerated filer, a non-accelerated filer, or a smaller reporting company. See the definitions of “large accelerated filer,” “accelerated filer,” and “smaller reporting company” in Rule 12b-2 of the Exchange Act. (Check one):
| Large accelerated filer | ¨ | Accelerated filer | ¨ | |||
| Non-accelerated filer | ¨ (Do not check if a smaller reporting company) | Smaller reporting company | þ | |||
CALCULATION OF REGISTRATION FEE
|
| ||||||||
| Title of Each Class of Securities to be Registered |
Amount to be |
Proposed Maximum Offering Price Per Security(2) |
Proposed Offering Price(1) |
Amount of Registration Fee | ||||
| Common stock, par value $.0001 per share(2) |
100,000 | $2.73 | $273,000 | $31.70 | ||||
|
| ||||||||
|
| ||||||||
| (1) | Consists of shares of common stock issued to the selling stockholder in connection with the acquisition of Mobile Office Acquisition Corp. on October 1, 2008. |
| (2) | Estimated, pursuant to Rule 457(c), solely for the purpose of calculating the amount of the registration fee based upon the average of the high and the low sales prices for shares of the common stock on August 3, 2011, as reported on the NASDAQ Global Market. |
The Registrant hereby amends this Registration Statement on such date or dates as may be necessary to delay its effective date until the Registrant shall file a further amendment which specifically states that this Registration Statement shall thereafter become effective in accordance with Section 8(a) of the Securities Act of 1933 or until the Registration Statement shall become effective on such date as the Commission, acting pursuant to said Section 8(a), may determine.
Table of Contents
The information in this prospectus is not complete and may be changed. This prospectus is not an offer to sell these securities and is not soliciting an offer to buy these securities in any state where the offer or sale is not permitted.
Subject to Completion, dated August 3, 2011
PROSPECTUS
GENERAL FINANCE CORPORATION
100,000 Shares of Common Stock
The selling stockholder listed in this prospectus is offering for sale up to 100,000 shares of our common stock.
We will not receive any proceeds from the sale of common stock by the selling stockholder. We are registering the offer and sale of these shares pursuant to certain registration rights granted to the selling stockholder. We will pay the expenses incurred in connection with the registration of the shares, including all registration, listing and qualification fees, printer and accounting fees, our legal fees and up to $50,000 of the selling stockholder’s legal fees and legal counsel to the selling stockholder. The selling stockholder will pay any underwriting fees, discounts, concessions, or brokerage commissions associated with the sale of its shares of common stock.
The selling stockholder will determine when it will sell its shares, and in all cases will sell its shares at the current market price or at negotiated prices at the time of the sale. Securities laws and Securities and Exchange Commission regulations may require the selling stockholder to deliver this prospectus to purchasers when it resells its shares of common stock.
Our units, warrants and common stock are listed on the NASDAQ Global Market under the symbols “GFNCL,” “GFNCZ” and “GFN,” respectively. On August 2, 2011 on the NASDAQ Global Market, the closing price of the units was $3.50 per unit, the bid price of the warrants was $0.17 per warrant and the closing price of the common stock was $2.82 per share.
The purchase of our common stock, warrants and units involves a high degree of risk. You are urged to carefully read the “Risk Factors” section beginning on page 15 of this prospectus which describes specific risks and certain other information associated with an investment in our securities that you should consider before you make your investment decision.
Neither the Securities and Exchange Commission nor any state securities commission has approved or disapproved of these securities or passed upon the adequacy or accuracy of this prospectus. Any representation to the contrary is a criminal offense.
The date of this prospectus is , 2011.
Table of Contents
| Page | ||||
| ii | ||||
| ii | ||||
| 1 | ||||
| 9 | ||||
| 10 | ||||
| 12 | ||||
| 14 | ||||
| 15 | ||||
| 23 | ||||
| Management’s Discussion and Analysis of Financial Condition and Results of Operations |
39 | |||
| 54 | ||||
| 59 | ||||
| Security Ownership of Certain Beneficial Owners and Management |
63 | |||
| 66 | ||||
| 68 | ||||
| 71 | ||||
| 71 | ||||
| 71 | ||||
| Index to Unaudited Interim Condensed Consolidated Financial Statements |
I-1 | |||
| F-1 | ||||
i
Table of Contents
You should rely only on the information contained in or incorporated by reference into this prospectus or any supplement. We have not authorized anyone else to provide you with different information. You should not assume that the information in this prospectus or any supplement is accurate as of any date other than the date on the front of those documents.
References in this prospectus to “we,” “us,” “our” or the “Company” refer to General Finance Corporation, a Delaware corporation, and its direct and indirect subsidiaries, including GFN North America Corp., a Delaware corporation, which we refer to as “GFNNA,” and its subsidiary Pac-Van, Inc., an Indiana corporation which we refer to as "Pac-Van," GFN Mobile Storage Inc., a Delaware corporation which we refer to as "GFNMS," GFN U.S. Australasia Holdings, Inc., a Delaware corporation which we refer to as “GFN U.S.,” its majority-owed subsidiary Royal Wolf Holdings Limited, an Australian corporation which we refer to as “Royal Wolf Holdings,” its subsidiary GFN Australasia Finance Pty Limited, an Australian corporation, which we refer to as “GFN Finance,” its subsidiary RWA Holdings Pty Limited, an Australian corporation which we refer to as “RWA,” and Royal Wolf Trading Australia Pty Limited, which we refer to as “Royal Wolf Trading.” Royal Wolf Holdings and its subsidiaries are collectively referred to herein as “Royal Wolf.”
References in this prospectus to “$” are to United States Dollars, and references to “A$” are to Australian Dollars.
This prospectus is part of a resale registration statement that we filed with the United States Securities and Exchange Commission, which we refer to as the SEC. The selling stockholder may offer and sell, from time to time, an aggregate of up to 100,000 shares of our common stock under this prospectus.
This prospectus, including the documents incorporated by reference into this prospectus, contains forward-looking statements within the meaning of Section 27A of the Securities Act of 1933, as amended, referred to in this prospectus as the Securities Act, and Section 21E of the Securities Exchange Act of 1934, as amended, referred to in this prospectus as the Exchange Act. Forward-looking statements involve risks and uncertainties that could cause results or outcomes to differ materially from those expressed in the forward-looking statements. Forward-looking statements may include, without limitation, statements relating to our plans, strategies, objectives, expectations and intentions and are intended to be made pursuant to the safe harbor provisions of the Private Securities Litigation Reform Act of 1995. Some of the forward-looking statements can be identified by the use of forward-looking terms such as “believes,” “expects,” “may,” “will,” “should,” “could,” “seek,” “intends,” “plans,” “estimates,” “anticipates” or other comparable terms. A number of important factors could cause actual results to differ materially from those in the forward-looking statements. The risks and uncertainties discussed in “Risk Factors” should be considered in evaluating the Company’s forward-looking statements. You should not place undue reliance on our forward-looking statements. Further, any forward-looking statement speaks only as of the date on which it is made, and we undertake no obligation to update or revise any forward-looking statements.
ii
Table of Contents
PROSPECTUS SUMMARY
The following summary contains information about General Finance Corporation and the offering of our common stock. For a more complete understanding of this offering, you should read the entire prospectus carefully, including the risk factors. You should rely only on the information contained in this prospectus. We have not authorized anyone to provide you with different information. We are not making an offer of these securities in any jurisdiction where the offer is not permitted. It does not contain all of the information that may be important to you in making a decision to purchase our common stock. For a more complete understanding of General Finance Corporation and the offering of its common stock, we urge you to read this entire prospectus and the documents incorporated by reference carefully, including the “Risk Factors” sections and our financial statements and the notes to those statements incorporated by reference herein.
References in this prospectus to “we”, “us,” “General Finance,” “GFN” or the “Company” refer to General Finance Corporation and its consolidated subsidiaries. These subsidiaries include: GFN North America Corp., a Delaware corporation which we refer to as “GFNNA;” Pac-Van, Inc., an Indiana corporation which we refer to as “Pac-Van;” GFN Mobile Storage Inc., a Delaware corporation which we refer to as “GFNMS;” GFN U.S. Australasia Holdings, Inc., a Delaware corporation which we refer to as “GFN U.S.;” Royal Wolf Holdings Limited, an Australian corporation which we refer to as “Royal Wolf Holdings;” GFN Australasia Finance Pty Ltd, an Australian corporation which we refer to as “GFN Finance;” RWA Holdings Pty Limited, an Australian corporation which we refer to as “RWA;” and Royal Wolf Trading Australia Pty Limited, an Australian corporation which we refer to as “Royal Wolf Trading.” We refer to Royal Wolf Holdings and its subsidiaries collectively as “Royal Wolf.”
Company Overview
Our strategy and business plan is to acquire rental services and specialty finance businesses in North America, Europe and the Asia-Pacific area. We currently have two operating subsidiaries, Royal Wolf and Pac-Van, that lease and sell storage container products, modular buildings and mobile offices through 23 customer service centers, which we refer to as “CSCs,” in Australia and New Zealand and 26 branch locations across 18 states in the United States. Royal Wolf and Pac-Van operate in two distinct, but related industries, modular space and mobile storage, which we collectively refer to as the “portable services industry.”
In September 2007, we acquired Royal Wolf. We paid $64.3 million to acquire Royal Wolf. The purchase price consisted of $44.7 million of cash and shares of common stock of GFN U.S., constituting 13.8% of the capital stock of GFN U.S. following the issuance. We issued the shares of common stock of GFN U.S. to Bison Capital Australia, L.P., which we refer to as “Bison Capital,” as one of the sellers of Royal Wolf. Following the acquisition, we owned 86.2% of the outstanding capital stock of GFN U.S., and Bison Capital owned the remaining 13.8% of the capital stock of GFN U.S.
In October 2008, we acquired Pac-Van through a merger in which Mobile Office Acquisition Corp., or MOAC, the parent company of Pac-Van, merged with and into the Company’s wholly-owned subsidiary, GFNNA. To purchase all of the capital stock of MOAC we paid $19.4 million in cash, issued 4,000,000 shares of restricted General Finance common stock valued at $7.50 per share under the merger agreement and caused GFNNA to issue a $1.5 million 20-month subordinated promissory note. We also assumed the outstanding senior indebtedness of Pac-Van.
In May 2011, Royal Wolf Holdings completed an initial public offering on the Australian Securities Exchange which raised gross proceeds of A$91.5 million from the issuance of 50 million new ordinary shares. Royal Wolf used a portion of the net proceeds of the offering to prepay in full $22.3 million of Bison Capital subordinated notes and to reduce borrowings under its senior credit facility, and General Finance used a portion of the net proceeds from the offering to repurchase the 13.8% of the capital stock of GFN U.S., to reduce borrowings under the senior credit facility of Pac-Van and the remaining amount of the net proceeds was used for general working capital purposes. At the completion of the offering, General Finance still owned a majority of the ordinary shares of Royal Wolf Holdings.
ROYAL WOLF
Royal Wolf’s lease fleet, nationwide presence and experienced management team position it as the leading provider in Australia and New Zealand of portable storage containers, portable container buildings and freight containers, which we refer to collectively as “storage container products.” Royal Wolf leases and sells storage container products through its 23 Customer Service Centers, which we refer to as “CSCs,” in every state in Australia and New Zealand.
Royal Wolf’s storage container products are used by a diverse client base of approximately 21,000 customers who conduct business in a broad range of industries that include mining, road and rail, construction, moving and storage, manufacturing, transportation, defense and in the support of small and medium-size entities. Our customers use our products for a wide variety of storage applications, including retail and manufacturing inventory, construction materials and equipment, documents and records and household goods.
1
Table of Contents

Business Strengths
Royal Wolf believes it possesses the following principal strengths:
Leading Market Share in Australia and New Zealand. Royal Wolf believes its lease fleet of storage container products is the largest in Australia and New Zealand.
CSC Branch Network. Royal Wolf is the only portable container lease and sales company with CSCs in all major business centers in Australia and New Zealand.
Broad Product Range and Young Fleet. Royal Wolf believes it has the broadest product range and youngest lease fleet in Australia and New Zealand.
Diversified Blue Chip Customer Base. Royal Wolf has a broad base of approximately 21,000 active customers, with only one customer constituting more than 2% of our annual revenue for the fiscal year ended June 30, 2010. Our customer base includes the retail and manufacturing sectors, councils and government departments, the farming and agricultural community, the building and construction industry, clubs and sporting associations, the mining sector and the general public.
Experienced Management Team. Royal Wolf’s experienced management team is lead by Robert Allan, the chief executive officer of Royal Wolf, who has 25 years of experience in the industry. The senior management team of Royal Wolf has an average of over 14 years of experience in the industry. We believe the experience of this management team will be critical to growing Royal Wolf’s business.
Business Strategy
We are pursuing a business strategy focused on growing our leasing operations, generating strong internal growth and eventually leveraging our infrastructure through acquisitions, as follows:
Focus on Mobile Storage Leasing Business. We focus on growing our core leasing business because it provides predictable, recurring revenue and high margins. We believe that we can generate substantial demand for our storage container products as the container storage and portable container building industry is relatively underdeveloped in Australia and New Zealand. We believe the underdeveloped nature of the market presents significant growth opportunities for Royal Wolf. Although mobile storage, domestic freight movement and portable building applications are increasing, we believe many more uses for our storage container products are still to be developed. Royal Wolf’s market opportunity is to fully develop and service these applications.
Generate Strong Internal Growth. We define internal growth as an increase in lease revenues on a year-over-year basis at our CSCs in operation for at least one year, without inclusion of leasing revenue attributed to same-market acquisitions. We continue to focus on increasing the number of storage containers we lease from our existing branches to both new and repeat customers as well as changing the billing methodologies used in the U.S. market, such as advance billing, a 28-day billing cycle, fuel surcharges and a damage waiver program. Historically, we have been able to generate strong internal growth within our existing markets through sales and marketing programs designed to increase brand recognition, expand market awareness of the uses of mobile storage and differentiate our products from our competitors.
Leverage our Infrastructure through Acquisitions. Our branch network infrastructure serves a broad geographic area and is capable of serving additional volume at minimal levels of additional fixed costs. Our long-term objective is to add volume by organically growing the lease fleet in these locations and through acquisitions. Asset purchases of “tuck in” competitors to existing branches or adding newly acquired fleet with branches in better locations can be very effective. In addition, the corporate infrastructure of Royal Wolf is capable of managing existing fleets and locations in geographies outside of Australia and New Zealand, but within the Asia-Pacific area.
2
Table of Contents
Products and Services
Royal Wolf is the only storage container product company in Australia and New Zealand with both the national presence and product range capable of servicing all sectors of the domestic rental and sales market. The Company’s key products include:
| Mobile storage containers: |
10-foot, 20-foot and 40-foot general purpose units | |
| Double pallet-wide high cube units | ||
| Hazardous goods containers | ||
| Refrigerated containers | ||
| Portable container: buildings: |
Site offices and cabins | |
| Workforce accommodation units | ||
| Luxury accommodation units | ||
| Restroom blocks | ||
| Blast-resistant units | ||
| Specialized office and infrastructure suites | ||
| Freight Containers: |
Curtain-side containers | |
| 20-foot and 40-foot Hi-cube containers | ||
| 20-foot and 40-foot two pallet-wide containers | ||
| Side-opening door containers | ||
Mobile Storage Containers. Royal Wolf leases and sells mobile storage containers, some of which are customized for specific customers, for on-site storage by customers. These customers include retail outlets and manufacturers, government departments, farming and agricultural concerns, building and construction companies, clubs and sporting associations, mine operators and the general public. Royal Wolf’s products include general purpose dry storage containers, refrigerated containers and hazardous goods containers in a range of standard and modified sizes, designs and storage capacities.
Portable Container Buildings. Royal Wolf also leases and sells portable container buildings as site offices and for temporary accommodations. Royal Wolf customizes mobile storage container buildings for some customers. Royal Wolf entered the portable building market in August 2005 with 20-foot and 40-foot portable buildings manufactured from steel container platforms which it markets to a subset of its mobile storage container customer base.
Freight Containers. Royal Wolf leases and sells freight containers specifically designed for transport of products by road and rail. Customers include national moving and storage companies, distribution and logistics companies, freight forwarders, transport companies, rail freight operators and the Australian military. Royal Wolf’s freight container products include curtain-side, refrigerated and bulk cargo containers, together with a range of standard and industry-specific dry freight containers.
Branch network
Royal Wolf leases and sells its storage container products from its network of 23 CSCs, the largest branch network of any storage container company in Australia and New Zealand. Royal Wolf is represented in all major metropolitan areas, and Royal Wolf is the only container leasing and sales company with a nationally integrated infrastructure and work force.
A typical Royal Wolf CSC consists of a leased site of approximately two to five acres with a sales office, forklifts and all-weather container repair workshop. CSC office staffing ranges from two to 15 people and include a branch manager supported by the appropriate level of sales, operations and administrative personnel. Yard and workshop staffing usually ranges between one and 12 people and can consist of welders, spray painters, boilermakers, forklift drivers and production supervisors. CSC inventory holding usually ranges between 150 and 700 storage containers at any one time, depending on market size and throughput demand.
3
Table of Contents
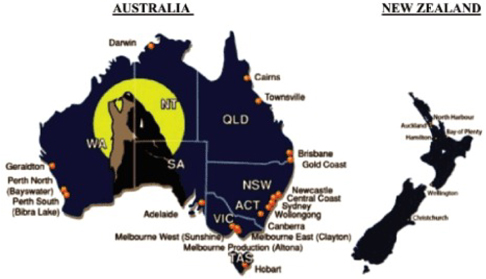
The following map shows Royal Wolf’s existing CSC locations at June 30, 2010:
Customers
Royal Wolf has a broad base of approximately 21,000 active customers, with only one customer constituting more than 2% of our annual revenue for the fiscal year ended June 30, 2010. Our customer base includes the retail and manufacturing sectors, councils and government departments, the farming and agricultural community, the building and construction industry, clubs and sporting associations, the mining sector and the general public. We believe the diversity of Royal Wolf’s customer base reduces the business exposure to a significant downturn in any particular industry.
Royal Wolf storage container products provide its customers with a solutions-oriented approach with high quality equipment, superior service and product knowledge. This is supported by a highly responsive national marketing team, in-house finance, and control and engineering expertise and nationally linked fleet management and accounting systems. Royal Wolf is the largest and only truly national supplier of container products in Australia and New Zealand, and the only container company with the scale and capacity to service a full range of customers, from small local accounts right through to the largest national businesses. Royal Wolf’s diverse customer base is depicted in the following chart for the fiscal year ended June 30, 2010:
PAC-VAN
Pac-Van competes in the modular space and the mobile storage industries. Modular space includes mobile offices and modular buildings and involves the rental and sales of factory built structures and the delivery and installation of the equipment at customer properties. Mobile storage generally includes providing customers with secure, temporary storage at their site locations. Both lines of business serve a broad range of industries, including construction, services, retail, manufacturing, transportation, utilities and government.
4
Table of Contents

Business Strengths
Pac-Van is a recognized provider of modular buildings, mobile offices and mobile storage products on a national, regional and local basis in the United States. Pac-Van believes it possesses the following strengths:
Extensive Geographic Coverage. With a lease fleet of approximately 11,000 units, Pac-Van is a national participant in the mobile and modular sectors of the portable services industry. Pac-Van’s branch offices serve 17 of the 50 largest Metropolitan Statistical Areas, or MSAs, in the United States. Pac-Van serves a diverse base of national, regional and local customers. The size of Pac-Van’s fleet also allows Pac-Van to offer a wide selection of products to its customers and to achieve purchasing efficiencies.
Diversified Customer Base. Pac-Van has established strong relationships with a diverse customer base in the U.S., ranging from large companies with a national presence to small local businesses. During the fiscal year ended June 30, 2010, which we refer to as “FY 2010,” Pac-Van leased or sold its equipment to over 6,200 customers. In FY 2010, Pac-Van’s largest customer accounted for approximately 5% of its total revenues and Pac-Van’s top ten customers accounted for approximately 15% of its total revenues. Pac-Van believes that the diversity of its business limits the impact on Pac-Van of changes in any given customer, geography or market.
Focus On Customer Service and Support. Pac-Van’s operating infrastructure in the U.S. is designed to ensure that Pac-Van consistently meets or exceeds customer expectations. On the national and regional level, Pac-Van’s administrative support services and scalable management information systems enhance its service by enabling Pac-Van to access real-time information on product availability, customer reservations, customer usage history and rates. Pac-Van believes this focus on customer service attracts new and retains existing customers. In FY 2010, more than 90% of its lease and lease-related revenues were generated from customers who leased from Pac-Van in prior years.
Significant Cash Flow Generation and Discretionary Capital Expenditures. Pac-Van has consistently generated significant cash flow from operations by maintaining high utilization rates and leasing margins and controlling capital expenditures. A significant portion of Pac-Van’s capital expenditures are discretionary in nature, thus providing Pac-Van with the flexibility to readily adjust the amount that it spends based on its business needs and prevailing economic conditions.
High Quality Fleet. Pac-Van’s branches maintain their lease fleet to consistent quality standards. Maintenance is expensed as incurred and branch managers and operations staff are responsible for managing a maintenance program aimed at providing equipment to customers that meets or exceed customer expectations and industry standards.
Experienced Management Team. Pac-Van has an experienced and proven senior management team, with its seven most senior managers having worked at Pac-Van for an average of more than ten years. Pac-Van’s President, Theodore M. Mourouzis, joined Pac-Van in 1997 and the consistency of the senior management, corporate and branch management teams has been integral in developing and maintaining its high level of customer service, deploying technology to improve operational efficiencies and integrating acquisitions.
Business Strategy
We are pursuing a business strategy focused on growing our leasing operations, diversifying our product offerings in storage containers and modular buildings, maintaining disciplined cost controls, reducing indebtedness and eventually completing accretive acquisitions, as follows:
Focus on Leasing Business. We focus on increasing our core leasing business because it generates predictable, recurring revenues and high profit margins. Pac-Van’s management team strives to optimize leasing rates and lease fleet utilization in the 26 core markets it serves. Pac-Van branch office system permits it to shift its fleet to branches where customer demand is greatest, and Pac-Van’s planning and sourcing expertise permits it to procure new product on an as needed basis.
Diversifying Our Product Offerings. We plan to continue to expand the size and breadth of our lease fleet. We will emphasize expansion of our higher return products, particularly storage containers. In addition, we will continue to pursue the introduction of specialty storage and office products that can attain long lease durations and high leasing operating margins.
5
Table of Contents
Disciplined Cost Controls. Pac-Van’s size permits it to more rapidly adjust to changing market conditions than many of its larger competitors. This size enables Pac-Van to quickly introduce storage container products demanded by customers, adjust capital expenditures and other spending and maintain more disciplined cost controls than competitors whose cost structures include manufacturing, large payrolls and large investments in outdated product classes, such as storage trailers.
Reducing Indebtedness. We continue to focus on reducing the indebtedness of Pac-Van. We believe this focus on debt reduction will provide great flexibility in the future and will position Pac-Van to capture future growth opportunities. In down or recovering economic cycles, such as we are experiencing in the United States, Pac-Van focuses on optimizing lease fleet utilization, lease rates and collections.
Accretive Acquisitions. Pac-Van plans to complete acquisitions that are accretive or offer other benefits such as expanded customer service or product offerings. Acquisitions, especially “tuck in” acquisitions, also allow Pac-Van to leverage the fixed costs of its branch offices with additional lease fleet that deliver scale and increased profitability.
Products and Services
Pac-Van provides a broad range of products to meet the needs of its customer base. These products include modular buildings, mobile offices and storage containers. The following provides a description of Pac-Van’s product lines:
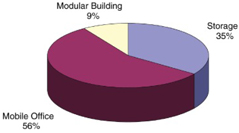
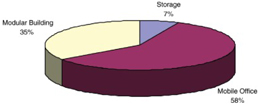
Modular Buildings. Modular buildings are factory-built, portable structures generally consisting of two or more floors and are used in a wide variety of applications, ranging from schools to restaurants to medical offices. Ranging in size from 1,000 to more than 30,000 square feet, the company’s modular buildings are constructed in many sizes and are usually designed to satisfy unique customer requirements. Pac-Van procures modular buildings from an established network of manufacturing partners to meet state building requirements. Modular buildings represent 34% of Pac-Van’s lease fleet.
Mobile Offices. Sales and construction offices, also known as field offices, are relocatable, single-unit structures primarily used for temporary office space. These units are generally built on frames that are connected to axles and wheels and have either a fixed or removable hitch for easy transportation. Standard construction office models range in size from approximately 160 square feet to 1,000 square feet, and are available in standard 8, 10, 12, and 14 foot widths, and include air conditioning and heating, lighting, plan tables, shelving, electrical wiring, phone jacks, and other features normally associated with basic office space. Sales offices range in size from 384 to 672 square feet and typically come in 12 foot widths. Sales offices generally have wood siding, carpeting, high ceilings, custom windows, and glass storefront doors, which provide a professional, customer-friendly building in which to conduct business. Ground offices are storage containers that have been modified to include office space with feature similar to those found in construction offices. Like storage containers, ground level offices (GLOs) typically come in lengths of 20 feet and 40 feet. Some models combine both office and storage functions. All of Pac-Van’s mobile offices are built, or modified as with ground offices, by an established network of manufacturing partners to standard specification, which may vary depending on regional preferences. In addition, Pac-Van builds these units to meet state building code requirements and generally obtains multi-state codes enabling the company to move equipment among its branch network to meet changing demand and supply conditions. Mobile offices comprise approximately 59% of Pac-Van’s lease fleet.
Mobile Storage Equipment. Mobile storage equipment is generally classified into the following product groupings: storage containers, domestic storage containers and storage trailers. Storage containers vary in size from 10 feet to 48 feet in length, with 20-foot and 40-foot length containers being the most common. Storage containers are steel units, which are generally eight feet wide and eight and one-half feet high, and are built to the International Organization for Standardization standards for carrying ocean cargo. Pac-Van purchases new and used storage containers. Domestic storage containers are generally eight feet wide, ten feet in width and come in lengths ranging from 40 to 53 feet. Storage trailers, which vary in size from 28 to 53 feet in length, have wheels and hitches and provide dock height storage. Mobile storage equipment comprises approximately 7% of Pac-Van’s rental fleet.
Delivery and Installation, Return and Dismantle, and Other Site Services. Pac-Van delivers and where necessary installs all three product lines directly to its customers’ premises. Installation services range from simple leveling for portable storage to complex seaming and joining for modular buildings. Pac-Van will also provide skirting and ramps as needed by the customer. Depending on the type of unit some states will also require tie downs and other features to secure the unit. Once a unit is on site at a customer location, Pac-Van’s site services include relocating the unit.
Ancillary Products and Services. In addition to leasing it core product line, Pac-Van provides ancillary products such as steps, furniture, portable toilets, security systems, and other items to its customers for their use in connection with its equipment. Pac-Van also offers its lease customers a damage waiver program that protects them in case the leased unit is damaged. For customers who do not select the damage waiver program, Pac-Van bills them for the cost of any repairs.
6
Table of Contents
Pac-Van complements its core leasing business by selling either existing rental fleet assets or assets purchased specifically for resale. In FY 2010, management estimates that nearly 29% of the sales came from existing fleet units. The sale of- lease fleet units has historically been a cost-effective method of replenishing and upgrading the lease fleet. As with the leasing business, Pac-Van provides additional services when selling units. These services range from delivery to full scale turnkey solutions. In a turnkey solution, Pac-Van provides not only the underlying equipment but also a full range of ancillary services, such as a foundation, specialty interior finishes, and landscaping, necessary to make the equipment fully operational for the customer.
Lease Fleet Summary by Number of Units as June 30, 2010:
Lease Fleet Summary by Gross Dollar Value (thousands) at June 30, 2010:
Leasing. Leasing revenue is a function of average monthly rental rate, fleet size and utilization. Pac-Van monitors fleet utilization at each branch. For FY 2010, average unit utilization of the lease al fleet was approximately 71% on a gross dollar basis and 69% on a unit basis. While Pac-Van adjusts its pricing to respond to local market conditions, management believes that it generally achieves a rental rate equal to or above that of competitors because of the quality of Pac-Van’s products and its high level of customer service. As part of its leasing operations, Pac-Van sells used units from its rental fleet at fair market value or, to a much lesser extent, pursuant to pre-established lease purchase options included in the terms of its lease agreements. Due in part to an active fleet maintenance program, Pac-Van’s units maintain a substantial portion of their initial value which includes the cost of the units as well as costs of significant improvements made to the units.
Sales. Pac-Van will sell units out of its sale inventory as well as its lease fleet. Pac-Van does not generally purchase new units for resale until it has obtained firm purchase orders (which are generally non-cancelable) for such units.
Delivery and Installation. Pac-Van provides delivery, site-work, installation and other services to its customers as part of its leasing and sales operations. Revenues from delivery, site-work and installation result from the transportation of units to a customer’s location, site-work required prior to installation and installation of the units which have been leased or sold. Typically units are placed on temporary foundations constructed by service technicians, and service personnel will also generally install ancillary products. Pac-Van also derives revenues from dismantling and transporting units upon lease expiration.
7
Table of Contents
Branch Network
The following map shows Pac-Van’s existing branch network as of June 30, 2010:
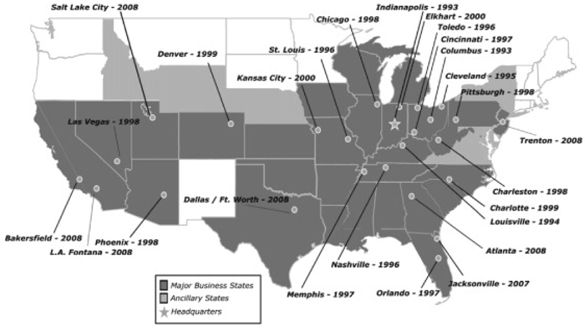
As a key element to its market strategy, Pac-Van maintains a network of 26 branch offices throughout the United States. This network enables it to maintain product availability and provide customer service within regional and local markets. Customers benefit because they are provided with improved service availability, reduced time to occupancy, better access to sales representatives, the ability to inspect units prior to rental and lower freight costs which are typically paid by the customer. Pac-Van benefits because it is able to spread regional overhead and marketing costs over a larger lease base, redeploy units within its branch network to optimize utilization.
Customers
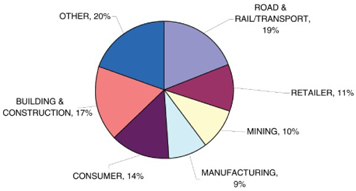
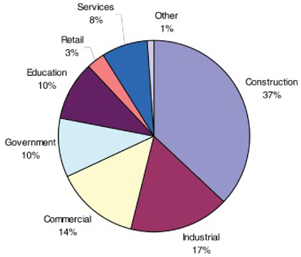
Pac-Van has established strong relationships with a diverse set of customers, ranging from large national retailers and manufacturers to local sole proprietors. During FY2010, Pac-Van provided its portable storage, mobile office and modular building products to a diversified base of approximately 6,200 national, regional and local companies in a variety of industries including construction, industrial, manufacturing, education, service, and government sectors.
In fiscal year 2010, Pac-Van generated 65% of its revenues from leasing and 35% of its revenues from sales. Pac-Van’s largest leasing customer accounted for approximately 2% of total leasing revenues and its top ten customers accounted for approximately 8% of its total leasing revenues. The following chart shows the percentage of revenues generated by different industries in FY 2010:
Additional Information
Our principal executive offices are located at 39 East Union Street, Pasadena, California 91103 and our telephone number is (626) 584-9722.
8
Table of Contents
On October 1, 2008, in connection with our acquisition of Mobile Office Acquisition Corp., or MOAC, we issued 100,000 shares of common stock to D. E. Shaw Laminar Portfolios, L.L.C. We also issued 3,900,000 shares of our common stock to Ronald F. Valenta, Ronald L. Havner, Jr. and other former stockholders of MOAC in the same acquisition.
We are only registering the 100,000 shares of our common stock issued to D. E. Shaw Laminar Portfolios, L.L.C. with this prospectus pursuant to the registration rights granted to the selling stockholders under the terms of a stockholders agreement entered into in connection with the acquisition of MOAC. Once this registration statement is declared effective, D. E. Shaw Laminar Portfolios, L.L.C. may elect to resell or otherwise dispose of these shares of common stock from time to time. The beneficial ownership information in the below table is based solely on information provided to General Finance Corporation by D. E. Shaw Laminar Portfolios, L.L.C.
Pursuant to this prospectus, D. E. Shaw Laminar Portfolios, L.L.C. may offer an aggregate of 100,000 shares of our common stock for resale. The shares are being offered for the account of D. E. Shaw Laminar Portfolios, L.L.C. as identified in the table below.
D. E. Shaw Laminar Portfolios, L.L.C. is an affiliate of the registered broker-dealer, D. E. Shaw Securities, L.L.C. D. E. Shaw Laminar Portfolios, L.L.C. acquired the 100,000 shares of common stock in the ordinary course of business. On October 1, 2008, D. E. Shaw Laminar Portfolios, L.L.C. entered into a Stockholders Agreement under which we agreed to register the 100,000 shares of common stock issued to D. E. Shaw Laminar Portfolios, L.L.C. On October 1, 2008, the date of the issuance of 100,000 shares of General Finance Corporation common stock, D. E. Shaw Laminar Portfolios, L.L.C. was not a party to any agreement to distribute the 100,000 shares of General Finance Corporation common stock.
The following table sets forth information as of August 3, 2011 and includes the number of shares of our common stock beneficially owned by D. E. Shaw Laminar Portfolios, L.L.C. prior to the offering, the number of shares of common stock offered by D. E. Shaw Laminar Portfolios, L.L.C., and the number of shares of common stock that will be owned by D. E. Shaw Laminar Portfolios, L.L.C. upon completion of the offering or offerings pursuant to this prospectus, assuming D. E. Shaw Laminar Portfolios, L.L.C. sells all of the shares of common stock offered hereby. Only D. E. Shaw Laminar Portfolios, L.L.C. or its transferees, pledgees, donees, assignees, distributees, successors and others who later come to hold the interest of D. E. Shaw Laminar Portfolios, L.L.C. may offer and sell the common stock pursuant to this prospectus and any accompanying prospectus supplement. D. E. Shaw Laminar Portfolios, L.L.C. may offer for sale pursuant to this prospectus and any accompanying prospectus supplement from time to time, any or all of the common stock listed below. Accordingly, no estimate can be given as to the shares of common stock that D. E. Shaw Laminar Portfolios, L.L.C. will hold upon consummation of any such sales.
Applicable percentages are based on 22,013,299 shares of our common stock outstanding on August 3, 2011, adjusted as required by rules promulgated by the Securities and Exchange Commission.
Beneficial ownership is determined in accordance with the rules of the Securities and Exchange Commission.
There are no material relationships between D. E. Shaw Laminar Portfolios, L.L.C. and us other than as disclosed herein and the documents we incorporate by reference.
| Common Stock Beneficially Owned Before the Offering |
Shares of Common |
Common Stock Beneficially Owned After Completion of Offering (1) |
||||||||||||||||||
| Number of | Stock Being | Number of | ||||||||||||||||||
| Name | Shares | Percentage | Offered | Shares | Percentage | |||||||||||||||
| D. E. Shaw Laminar Portfolios, L.L.C. |
100,000 | * | 100,000 | -0- | * | |||||||||||||||
| * | Less than 1% |
| (1) | Assumes that D. E. Shaw Laminar Portfolios, L.L.C. sells all of the shares being offered. |
9
Table of Contents
The selling stockholder and any transferees, pledgees, donees, assignees, distributees or other successors in interest to the selling stockholder may, from time to time, sell, transfer or otherwise dispose of any or all of their shares of our common stock covered by this prospectus on the NASDAQ Global Market or any other stock exchange, market or trading facility on which the shares are traded or in private transactions. These dispositions may be at fixed prices, at prevailing market prices at the time of sale, at prices related to the prevailing market price, at varying prices determined at the time of sale, or at negotiated prices. A selling stockholder may use any one or more of the following methods when disposing of shares:
| • | ordinary brokerage transactions and transactions in which the broker-dealer solicits purchasers; |
| • | block trades in which the broker-dealer will attempt to sell the shares as agent but may position and resell a portion of the block as principal to facilitate the transaction; |
| • | purchases by a broker-dealer as principal and resale by the broker-dealer for its account; |
| • | an exchange distribution in accordance with the rules of the applicable exchange; |
| • | privately negotiated transactions; |
| • | settlement of short sales entered into after the effective date of the registration statement of which this prospectus is a part; |
| • | broker-dealers may agree with the selling stockholder to sell a specified number of such shares at a stipulated price per share; |
| • | through the writing or settlement of options or other hedging transactions, whether through an options exchange or otherwise; |
| • | a combination of any such methods of sale; or |
| • | any other method permitted pursuant to applicable law (including underwritten transactions). |
The selling stockholder may also sell shares under Rule 144 under the Securities Act, if available, rather than under this prospectus.
Broker-dealers, underwriters and agents engaged by the selling stockholder may arrange for other brokers dealers, underwriters or agents to participate in sales. Broker-dealers, underwriters or agents may receive commissions, discounts or concessions from the selling stockholder (or, if any broker-dealer acts as agent for the purchaser of shares, from the purchaser) in amounts to be negotiated, but, except as set forth in a supplement to this prospectus, in the case of an agency transaction not in excess of a customary brokerage commission in compliance with FINRA NASD Rule 2440; and in the case of a principal transaction a markup or markdown in compliance with NASD IM-2440.
In connection with the sale of the common stock or interests therein, the selling stockholder may enter into hedging transactions with broker-dealers or other financial institutions, which may in turn engage in short sales of the common stock in the course of hedging the positions they assume. The selling stockholder may also sell shares of the common stock short and deliver these securities to close out their short positions, or loan or pledge the common stock to broker-dealers that in turn may sell these securities. The selling stockholder may also enter into option or other transactions with broker-dealers or other financial institutions or the creation of one (1) or more derivative securities which require the delivery to such broker-dealer or other financial institution of shares offered by this prospectus, which shares such broker-dealer or other financial institution may resell pursuant to this prospectus (as supplemented or amended to reflect such transaction).
10
Table of Contents
The selling stockholder and any broker-dealers, underwriters or agents that are involved in selling the shares may be deemed to be “underwriters” within the meaning of the Securities Act in connection with such sales. In such event, any commissions received by such broker-dealers, underwriters or agents and any profit on the resale of the shares purchased by them may be deemed to be underwriting commissions or discounts under the Securities Act.
We will pay the expenses incurred in connection with the registration of the shares, including all registration, listing and qualification fees, printer and accounting fees, our legal fees and up to $50,000 of the selling stockholder’s legal fees, and legal counsel to the selling stockholder. The selling stockholder will pay any underwriting fees, discounts, concessions, or brokerage commissions associated with the sale of their shares of common stock.
Because the selling stockholder may be deemed to be an “underwriter” within the meaning of the Securities Act, it will be subject to the prospectus delivery requirements of the Securities Act including Rule 172 thereunder. In addition, any securities covered by this prospectus which qualify for sale pursuant to Rule 144 under the Securities Act may be sold under Rule 144 rather than under this prospectus.
To the extent required, the shares of our common stock to be sold; the names of the selling stockholder; the respective purchase prices and public offering prices; the names of any agents, dealers or underwriters; and any applicable commissions or discounts with respect to a particular offer will be set forth in an accompanying prospectus supplement or, if appropriate, a post-effective amendment to the registration statement that includes this prospectus. The resale shares will be sold only through registered or licensed brokers or dealers if required under applicable state securities laws. In addition, in certain states, the resale shares may not be sold unless they have been registered or qualified for sale in the applicable state or an exemption from the registration or qualification requirement is available and is complied with.
Under applicable rules and regulations under the Exchange Act, any person engaged in the distribution of the resale shares may not simultaneously engage in market making activities with respect to the common stock for the applicable restricted period, as defined in Regulation M, prior to the commencement of the distribution. In addition, the selling stockholder will be subject to applicable provisions of the Exchange Act and the rules and regulations thereunder, including Regulation M, which may limit the timing of purchases and sales of shares of our common stock by the selling stockholder or any other person. We will make copies of this prospectus available to the selling stockholder and have informed the selling stockholder of the need to deliver a copy of this prospectus to each purchaser at or prior to the time of the sale (including by compliance with Rule 172 under the Securities Act).
11
Table of Contents
Our summary historical consolidated financial data set forth below as of and for the year ended June 30, 2010 and 2009 (as Successor) was derived from the audited consolidated financial statements included elsewhere in this prospectus. Our summary historical consolidated financial data set forth below as of and for the year ended June 30, 2008 (as Successor), the summary historical consolidated financial data for Royal Wolf (as our Predecessor) for the period from July 1 to September 13, 2007 and as of and for the year ended June 30, 2007 and 2006, was derived from the audited financial statements of Royal Wolf. Our summary consolidated financial data as of and for the quarter ended March 31, 2011 was derived from the unaudited interim condensed financial statements included elsewhere in this prospectus.
Consolidated Statement of Operations Information:
| Predecessor | Successor | |||||||||||||||||||||||||||||||
| Year Ended June 30, |
Period from July 1 to September 13, 2007 |
Year Ended June 30, |
(Unaudited) Nine Months Ended March 31 |
|||||||||||||||||||||||||||||
| 2006 | 2007 | 2008 | 2009 | 2010 | 2010 | 2011 | ||||||||||||||||||||||||||
| Sales |
$ | 34,473 | $ | 52,929 | $ | 10,944 | $ | 68,029 | $ | 75,528 | $ | 79,207 | $ | 55,135 | $ | 66,087 | ||||||||||||||||
| Leasing |
15,921 | 21,483 | 4,915 | 27,547 | 70,932 | 77,102 | 57,715 | 65,597 | ||||||||||||||||||||||||
|
|
|
|
|
|
|
|
|
|
|
|
|
|
|
|
|
|||||||||||||||||
| 50,394 | 74,412 | 15,859 | 95,575 | 146,460 | 156,309 | 112,850 | 131,684 | |||||||||||||||||||||||||
|
|
|
|
|
|
|
|
|
|
|
|
|
|
|
|
|
|||||||||||||||||
| Operating income |
2,412 | 4,672 | 1,530 | 8,373 | 14,058 | 3,575 | 7,695 | 12,293 | ||||||||||||||||||||||||
| Other expense, net |
(2,626 | ) | (3,870 | ) | (1,062 | ) | (1,785 | ) | (25,177 | ) | (13,792 | ) | (7,877 | ) | (8,527 | ) | ||||||||||||||||
| Income (loss) before provision for income taxes and noncontrolling interest |
(214 | ) | 802 | 468 | 6,588 | (11,119 | ) | (10,217 | ) | (182 | ) | (3,766 | ) | |||||||||||||||||||
| Net income (loss) |
(428 | ) | 312 | 288 | 4,554 | (6,745 | ) | (8,956 | ) | (116 | ) | 2,341 | ||||||||||||||||||||
|
|
|
|
|
|
|
|
|
|
|
|
|
|
|
|
|
|||||||||||||||||
| Net income (loss) per common share: |
||||||||||||||||||||||||||||||||
| Basic |
$ | 0.40 | $ | (0.22 | ) | $ | (0.64 | ) | $ | (0.11 | ) | $ | (0.06 | ) | ||||||||||||||||||
| Diluted |
0.39 | (0.22 | ) | (0.64 | ) | (0.11 | ) | (0.06 | ) | |||||||||||||||||||||||
|
|
|
|
|
|
|
|
|
|
|
|||||||||||||||||||||||
Consolidated Balance Sheet Information:
| Predecessor | Successor | |||||||||||||||||||||||
| June 30, | (Unaudited) March 31 2011 |
|||||||||||||||||||||||
| 2006 | 2007 | 2008 | 2009 | 2010 | ||||||||||||||||||||
| Trade and other receivables, net |
$ | 7,451 | $ | 13,322 | $ | 18,327 | $ | 26,402 | $ | 25,667 | $ | 27,363 | ||||||||||||
| Inventories |
5,460 | 5,472 | 21,084 | 22,511 | 19,063 | 20,049 | ||||||||||||||||||
| Lease fleet, net |
27,773 | 40,928 | 87,748 | 188,915 | 188,410 | 213,946 | ||||||||||||||||||
| Total assets |
47,903 | 68,788 | 207,861 | 358,696 | 346,880 | 376,467 | ||||||||||||||||||
| Trade payables and accrued liabilities |
10,789 | 10,452 | 18,731 | 24,657 | 25,246 | 28,867 | ||||||||||||||||||
| Senior and other debt |
33,681 | 44,170 | 81,252 | 200,304 | 186,183 | 196,083 | ||||||||||||||||||
| Stockholders’ equity |
3,018 | 13,040 | 93,731 | 103,174 | 101,734 | 111,143 | ||||||||||||||||||
|
|
|
|
|
|
|
|
|
|
|
|
|
|||||||||||||
12
Table of Contents
Selected Unaudited Quarterly Financial Data
The following table sets forth unaudited operating data for each quarter of the years ended June 30, 2010 and June 30, 2009. This quarterly information has been prepared on the same basis as the annual consolidated financial statements and, in the opinion of management, contains all significant adjustments necessary to state fairly the information set forth herein. These quarterly results are not necessarily indicative of future results, growth rates or quarter-to-quarter comparisons.
| First | Second | Third | Fourth | |||||||||||||
| Quarter | Quarter | Quarter | Quarter | |||||||||||||
| (in thousands, except per share data) | ||||||||||||||||
| Successor | ||||||||||||||||
| For the Fiscal Year Ended June 30, 2010: |
||||||||||||||||
| Revenues |
$ | 35,219 | $ | 39,146 | $ | 38,485 | $ | 43,459 | ||||||||
| Gross profit |
4,088 | 4,259 | 3,923 | 5,571 | ||||||||||||
| Operating income (a) |
2,075 | 2,641 | 2,979 | (4,120 | ) | |||||||||||
| Net income (loss) |
648 | (561 | ) | (203 | ) | (8,840 | ) | |||||||||
|
|
|
|
|
|
|
|
|
|||||||||
| Net income (loss) per common share: |
||||||||||||||||
| Basic |
$ | 0.00 | $ | (0.07 | ) | $ | (0.05 | ) | $ | (0.53 | ) | |||||
| Diluted |
0.00 | (0.07 | ) | (0.05 | ) | (0.53 | ) | |||||||||
|
|
|
|
|
|
|
|
|
|||||||||
| For the Fiscal Year Ended June 30, 2009: |
||||||||||||||||
| Revenues |
$ | 31,653 | $ | 42,601 | $ | 34,455 | $ | 37,751 | ||||||||
| Gross profit |
4,819 | 4,648 | 3,654 | 4,034 | ||||||||||||
| Operating income |
1,727 | 5,275 | 5,253 | 1,803 | ||||||||||||
| Net income (loss) |
(6,668 | ) | (2,204 | ) | 93 | 2,034 | ||||||||||
|
|
|
|
|
|
|
|
|
|||||||||
| Net income (loss) per common share: |
||||||||||||||||
| Basic |
$ | (0.36 | ) | $ | (0.06 | ) | $ | 0.01 | $ | 0.11 | ||||||
| Diluted |
(0.36 | ) | (0.06 | ) | 0.01 | 0.11 | ||||||||||
|
|
|
|
|
|
|
|
|
|||||||||
| (a) | Includes a non-cash impairment charge to the goodwill recorded in the Pac-Van acquisition of $7,633 in the fourth quarter. |
13
Table of Contents
Our units, common stock and warrants are listed on The NASDAQ Global Market (NASDAQ) under the symbols “GFNCL,” “GFN” and “GFNCZ,” respectively. The following table sets forth for the periods indicated the range of high and low closing sales prices for the units, common stock and warrants:
| Units | Common Stock | Warrants | ||||||||||||||||||||||
| High | Low | High | Low | High | Low | |||||||||||||||||||
| FY 2012: |
||||||||||||||||||||||||
| First Quarter (through August 2, 2011) |
$ | 3.50 | $ | 3.50 | $ | 3.05 | $ | 2.63 | $ | 0.12 | $ | 0.00 | ||||||||||||
| FY 2011: |
||||||||||||||||||||||||
| Fourth Quarter |
$ | 4.40 | $ | 2.80 | $ | 3.40 | $ | 2.61 | $ | 0.12 | $ | 0.12 | ||||||||||||
| Third Quarter |
3.51 | 2.22 | 3.65 | 2.01 | 0.12 | 0.12 | ||||||||||||||||||
| Second Quarter |
4.00 | 1.50 | 2.60 | 1.30 | 0.12 | 0.12 | ||||||||||||||||||
| First Quarter |
2.70 | 0.05 | 1.28 | 1.01 | 0.12 | 0.12 | ||||||||||||||||||
|
|
|
|
|
|
|
|
|
|
|
|
|
|||||||||||||
| FY 2010: |
||||||||||||||||||||||||
| Fourth Quarter |
$ | 3.75 | $ | 0.80 | $ | 1.65 | $ | 1.06 | $ | 0.09 | $ | 0.01 | ||||||||||||
| Third Quarter |
1.15 | 1.00 | 1.40 | 1.15 | 0.09 | 0.01 | ||||||||||||||||||
| Second Quarter |
2.25 | 1.05 | 1.65 | 1.11 | 0.20 | 0.02 | ||||||||||||||||||
| First Quarter |
2.80 | 1.07 | 1.60 | 1.22 | 0.15 | 0.05 | ||||||||||||||||||
|
|
|
|
|
|
|
|
|
|
|
|
|
|||||||||||||
| FY 2009: |
||||||||||||||||||||||||
| Fourth Quarter |
$ | 3.80 | $ | 1.00 | $ | 2.16 | $ | 1.05 | $ | 0.34 | $ | 0.08 | ||||||||||||
| Third Quarter |
3.12 | 0.92 | 2.50 | 0.85 | 0.13 | 0.02 | ||||||||||||||||||
| Second Quarter |
6.49 | 1.88 | 6.40 | 1.59 | 0.75 | 0.03 | ||||||||||||||||||
| First Quarter |
8.05 | 5.90 | 7.10 | 4.90 | 1.20 | 0.50 | ||||||||||||||||||
|
|
|
|
|
|
|
|
|
|
|
|
|
|||||||||||||
Record Holders
As of August 2, 2011, there were 28 stockholders of record for our common stock, 59 holders of record for our units and 12 holders of record for our warrants. We believe that there are thousands of beneficial owners of our common stock, units and warrants.
Dividend Policy
We have not paid any dividends on our common stock to date. The payment of dividends in the future will be contingent upon our revenues and earnings, if any, capital requirements and general financial condition. The payment of any dividends will be within the discretion of our board of directors. It is the present intention of our Board of Directors to retain all earnings, if any, for use in our business operations and, accordingly, our board does not anticipate declaring any dividends in the foreseeable future.
14
Table of Contents
An investment in our common stock involves a high degree of risk. You should consider carefully all the risks described below, together with the other information contained in this prospectus, before making a decision to invest in the common stock.
Risks Relating to Our Businesses in Australia and in the United States
Our inability to raise capital.
Our inability to obtain capital in the amounts and at the times when needed, may have a material adverse affect on our business, financial condition and results of operations, including substantially increasing our cost of borrowing and restricting our future operations. These events may significantly reduce the value of your investment.
Global economic conditions and market disruptions may adversely affect our business, financial condition and results of operations.
Financial markets and economic conditions throughout the world have been experiencing disruption, including, among other things, volatility in security prices, diminished liquidity and credit availability, rating downgrades of certain investments and declining valuations of others, failure and potential failures of major financial institutions, unprecedented government support of financial institutions and high unemployment rates. These developments and the related general global economic downturn has and may continue to adversely affect our business and financial condition, as well as the ability of our customers and suppliers to obtain financing to perform their obligations to us. Though we are strengthening our efforts in collections and inventory control, continued worsening of conditions could adversely affect the collection of trade receivables on a timely basis, could result in additional reserves for uncollectible accounts and, in the event of continued contraction in container and modular unit sales and leasing, could lead to a further build-up of inventory and lease fleet levels. These factors would have a further adverse impact on operating results and cash flows. In addition, fluctuations in the rates of exchange for the U.S. dollar against the Australian and New Zealand dollars could significantly affect our results of operations through lower than anticipated reported revenues and profitability as a result of the translation of Royal Wolf’s financial results into U.S. dollars.
If the results of our operations continue to be weak or worsen, we may be unable to meet the covenants governing the indebtedness of GFN, Pac-Van and Royal Wolf, which may require our seeking amendments, waivers of covenant compliance or alternative borrowing arrangements. While we believe our relationships with our senior lenders are good, there is no assurance that they would consent to such an amendment or waiver in the event of noncompliance, or that such consent would not be conditioned upon the receipt of a cash payment, revised principal payout terms, increased interest rates, or restrictions in the expansion of the credit facilities for the foreseeable future, or that our senior lenders would not exercise rights that would be available to them; including, among other things, demanding payment of outstanding borrowings. In addition, our ability to obtain additional capital or alternative borrowing arrangements at reasonable rates, including through the issuance of our preferred stock, has been and may continue to be adversely affected by the current conditions in the financial markets. All or any of these adverse events would further limit our flexibility in planning for or reacting to downturns in our business.
We are unable to predict the duration and severity of the current economic downturn and disruption in financial markets or their effects on our business and results of operations, but the consequences may be materially adverse and more severe than other recent economic slowdowns.
We operate with a significant amount of indebtedness, which is secured by all or substantially all of our assets, subject to variable interest rates and contain restrictive covenants.
Our substantial indebtedness could have adverse consequences, such as:
| • | require us to dedicate a substantial portion of our cash flow from operations at Royal Wolf and Pac-Van to payments on our indebtedness, which could reduce the availability of our cash flow to fund future operating capital, capital expenditures, acquisitions and other general corporate purposes; |
| • | expose us to the risk of increased interest rates, as our borrowings on our secured senior credit facilities are at variable rates of interest; |
| • | require us to sell assets to reduce indebtedness or influence our decisions about whether to do so; |
| • | increase our vulnerability to general adverse economic and industry conditions; |
15
Table of Contents
| • | limit our flexibility in planning for, or reacting to, changes in our business and our industry; |
| • | restrict us from making strategic acquisitions or pursuing business opportunities; |
| • | limit, along with the financial and other restrictive covenants in our indebtedness, among other things, our ability to borrow additional funds; and |
| • | violating covenants in these agreements could have a material adverse effect on our business, financial condition and results of operations; including substantially increasing our cost of borrowing and restricting our future operations, if not cured or waived. In addition, the lenders may be able to terminate any commitments they had made to supply us with further funds. Accordingly, we may not be able to fully repay our debt obligations, if some or all of our debt obligations are accelerated upon an event of default. |
Our senior credit and subordinated notes agreements also contain various restrictive covenants that limit the operations of our business. In particular, these agreements include covenants and restrictions relating to:
| • | payments and distributions to GFN; |
| • | liens and sale-leaseback transactions; |
| • | loans and investments; |
| • | debt and hedging arrangements; |
| • | mergers, acquisitions and asset sales; |
| • | transactions with affiliates; and |
| • | changes in business activities. |
Reference is made to Notes 5 and 13 of Notes to the Annual Consolidated Financial Statements included in this prospectus for more information regarding our indebtedness.
Our overall financial results will be affected by the relative value of the Australian dollar and/or the New Zealand dollar to the U.S. dollar and may be affected by other currencies with future acquisitions.
We purchase a portion of our lease fleet in Australia in U.S. dollars and unrealized gains and losses resulting from the Australian exchange rate to the U.S. dollar not hedged could have a significant impact in our reported results of operations. In addition, a weakening in the Australian or New Zealand dollars could result in lower than anticipated reported revenues and profitability as a result of the translation of Royal Wolf’s financial results into U.S. dollars.
A write-off of all or a part of our goodwill and intangibles would hurt our operating results and reduce our stockholders’ equity.
As a result of our acquisitions of Royal Wolf, Pac-Van and other smaller businesses, we have recorded significant amounts of goodwill and intangible assets. Goodwill represents the excess of the total purchase price of these acquisitions over the fair value of the net assets acquired. We are not permitted to amortize goodwill under U.S. accounting standards and instead we review goodwill, as well as intangible assets, at least annually for impairment. Impairment may result from, among other things, deterioration in the performance of acquired businesses, adverse market conditions and adverse changes in applicable laws or regulations, including changes that restrict the activities of the acquired business. In the event impairment is identified, a charge to earnings would be recorded. Although it does not affect our cash flow, a write-off of all or a part of our goodwill or intangibles would adversely affect our operating results and stockholders’ equity.
During the fiscal year ended June 30, 2010, we recognized an impairment charge to the goodwill recorded in the Pac-Van acquisition of $7,633,000. Reference is made to Note 2 of Notes to the Annual Consolidated Financial Statements included in this prospectus for more information regarding goodwill and intangible assets.
16
Table of Contents
Future acquisitions of businesses could subject us to additional business, operating and industry risks, the impact of which cannot presently be evaluated, and could adversely impact our capital structure.
The global economic downturn discussed above is having a negative impact upon our business and we have responded by making a determined effort to reduce personnel costs, capital expenditures, discretionary spending and curtail acquisition activity. While this is our approach for the foreseeable future, we intend to eventually commence pursuing additional acquisition opportunities in an effort to diversify our investments and grow our business. Any business we acquire may cause us to be affected by numerous risks inherent in the acquired business’s operations. If we acquire a business in an industry characterized by a high level of risk, we may be affected by the currently unascertainable risks of that industry. Although we will endeavor to evaluate the risks inherent in a particular industry or target business, we cannot assure that we will be able to properly ascertain or assess all of the significant risk factors.
In addition, the financing of any acquisition we complete could adversely impact our capital structure as any such financing would likely include the issuance of additional equity securities and/or the borrowing of additional funds. The issuance of additional equity securities may significantly reduce the equity interest of our stockholders and/or adversely affect prevailing market prices for our common stock. Increasing our indebtedness could increase the risk of a default that would entitle the holder to declare all of such indebtedness due and payable and/or to seize any collateral securing the indebtedness. In addition, default under one debt instrument could in turn permit lenders under other debt instruments to declare borrowings outstanding under those other instruments to be due and payable pursuant to cross default clauses. Accordingly, the financing of future acquisitions could adversely impact our capital structure and any equity interests in our company.
While part of our long-term business strategy is to acquire additional businesses, there is no assurance that we will be able to identify businesses that we can acquire upon terms we believe acceptable, or if such acquisitions require additional financing, that we could obtain such additional financing.
If we do seek to complete other acquisitions, we cannot ascertain the capital requirements for other future transactions. We cannot assure that, if required, additional financing will be available on acceptable terms, if at all. To the extent that additional financing proves to be unavailable when needed to consummate a particular acquisition, we would be compelled to either restructure the transaction or abandon that particular acquisition. In addition, if we consummate a future acquisition, we may require additional financing to fund the operations or growth of the target business. The failure to secure additional financing may impact the continued development or growth of the target business.
Our long-term growth could strain our management resources.
Our future performance will depend in large part on our ability to manage our long-term planned growth that could strain our existing management, human and other resources. To successfully manage this growth, we must continue to add managers and employees and improve our operating, financial and other internal procedures and controls. We also must effectively motivate, train and manage employees. If we do not manage our growth effectively, it would adversely affect our future operating results.
Our long-term growth plan includes the expansion of operations into markets outside of the United States, Australia and New Zealand, including Asia/Pacific and European markets. Such international expansion may not prove successful, and may divert significant capital, resources and management’s time and attention and adversely affect our on-going operations.
To date, we have conducted all of our business within the United States, Australia and New Zealand. However, we have intentions to enter international markets, including the Asia/Pacific and European markets, in the future, which will require substantial amounts of management time and attention. Our products and overall marketing approach may not be accepted in other markets to the extent needed to make our international expansion profitable. In addition, the additional demands on management from these activities may detract from our efforts in the United States, Australian and New Zealand markets and adversely affect our operating results in these principal markets. Any international expansion will expose us to the risks normally associated with conducting international business operations, including unexpected changes in regulatory requirements, changes in foreign legislation, possible foreign currency controls, currency exchange rate fluctuations or devaluations, tariffs, difficulties in staffing and managing foreign operations, difficulties in obtaining and managing vendors and distributors, potential negative tax consequences and difficulties collecting accounts receivable.
To complete future business combinations, we may issue shares of our capital stock that would reduce the equity interest of our stockholders and could cause a change in control of our ownership, or incur debt, which could adversely affect our financial condition.
Our certificate of incorporation authorizes the issuance of up to 100,000,000 shares of common stock and up to 1,000,000 shares of preferred stock. At March 31, 2011, there were 72,478,008 authorized shares of our common stock available for issuance (after appropriate reservation for the issuance of shares upon full exercise of our outstanding warrants and options issued under our 2006 Stock Option Plan and 2009 Stock Incentive Plan.
17
Table of Contents
If we seek to consummate future business combinations, we may be required to issue a substantial number of additional shares of our common or preferred stock, or a combination of common and preferred stock, to complete the other business combination. The issuance of additional shares of our common stock or any number of shares of our preferred stock:
| • | may significantly reduce the equity interest of investors; |
| • | may subordinate the rights of holders of common stock if preferred stock is issued with rights senior to those afforded to our common stock; |
| • | may cause a change in control if a substantial number of our shares of common stock are issued, which may affect, among other things, our ability to use our net operating loss carry forwards, if any, and could result in the resignation or removal of our present officers and directors; and |
| • | may adversely affect prevailing market prices for our common stock. |
In addition, we may incur substantial debt to complete another business combination. The incurrence of debt could result in:
| • | default and foreclosure on our assets if our operating revenues after a business combination are insufficient to repay our debt obligations; |
| • | our immediate payment of all principal and accrued interest, if any, if the debt security is payable on demand; and |
| • | our inability to obtain necessary additional financing if the debt security instrument covenants restricting our ability to obtain such financing while the debt instrument is outstanding. |
The price of our common stock may fluctuate significantly, which may make it difficult for stockholders to resell common stock when they want or at a price they find attractive.
We expect that the market price of our common stock will fluctuate. Our common stock price can fluctuate as a result of a variety of factors, many of which are beyond our control. These factors include:
| • | actual or anticipated variations in our quarterly operating results; |
| • | changes in interest rates and other general economic conditions; |
| • | significant acquisitions or business combinations, strategic partnerships, joint ventures or capital commitments by or involving us or our competitors; |
| • | operating and stock price performance of other companies that investors deem comparable to us; |
| • | news reports relating to trends, concerns, litigation, regulatory changes and other issues in our industry; |
| • | geopolitical conditions such as acts or threats of terrorism or military conflicts; |
| • | relatively low trading volume; and |
| • | significant concentration of ownership in our common stock. |
If equity research analysts do not publish research or reports about our business or if they issue unfavorable commentary or downgrade our common stock, the price of our common stock could decline.
The trading market for our common stock will rely in part on the research and reports that equity research analysts publish about us and our business. We do not control these analysts. The price of our stock could decline if one or more equity analysts downgrade our stock or if those analysts issue other unfavorable commentary or cease publishing reports about us or our business.
18
Table of Contents
We do not currently intend to pay dividends on our common stock, which may limit the return on your investment in us.
Except for payment of dividends on our preferred stock, we currently intend to retain all available funds and any future earnings for use in the operation and expansion of our business and do not anticipate paying any cash dividends on our common stock in the foreseeable future.
Our outstanding options and warrants may have an adverse effect on the market price of common stock and increase the difficulty of effecting future business combinations.
At March 31, 2011, we had outstanding options and warrants to purchase 5,508,693 shares of common stock. The potential for the issuance of substantial numbers of additional shares of common stock upon exercise of these warrants and options could make us a less attractive acquisition vehicle in the eyes of a target business. Such securities, when exercised, will increase the number of issued and outstanding shares of our common stock and reduce the value of the shares issued. Additionally, the sale, or even the possibility of sale, of the shares underlying the warrants and options could have an adverse effect on the market price for our securities or on our ability to obtain future financing.
Significant Risks Related Primarily to Our Operations in the Asia-Pacific Area
Sales of container units constitute a significant portion of Royal Wolf’s revenues. Failure to continue to sell units at historic levels could adversely affect our financial results and our ability to grow.
Sales of container units and related modification revenues constituted approximately 60% of Royal Wolf total revenues for the year ended June 30, 2010. Sales are strongly correlated with overall economic conditions, especially the natural resources sectors. Revenues from sales of container units have a material impact on our financial results and our ability to service our debt. Further, the funding of the growth of the lease fleet is dependent upon the sales of container units to take advantage of business and growth opportunities available to it.
The failure of Royal Wolf to achieve its business strategy of increasing its leasing revenue could adversely affect the predictability of our quarterly earnings results and adversely affect our results of operations.
Prior to the year ended June 30, 2009, sales generated approximately 70% of Royal Wolf’s revenue and leasing generated approximately 30% of Royal Wolf’s revenue. We are pursuing a strategy of increasing revenue generated from leasing operations. Revenues generated from sales can vary greatly from quarter to quarter, while revenue from leasing operations is more predictable and has better margins. If we are not successful in increasing the percentage of our revenues generated by our leasing operations, our results of operations may vary greatly quarter to quarter, and would therefore be less predictable. In addition, if we are not successful in increasing the percentage of our revenues from our leasing operations, our results of operations may be adversely affected.
General or localized economic downturns or weakness may adversely affect Royal Wolf’s customers, in particular those in the mining and moving and storage industries, which may reduce demand for Royal Wolf’s products and services which would negatively impact our future revenues and results of operations.
A significant portion of Royal Wolf’s revenues is derived from customers in industries and businesses that are cyclical in nature and subject to changes in general economic conditions, including the mining, transport (road and rail) and construction industries, which aggregated approximately 43% of Royal Wolf’s revenues during the fiscal year ended June 30, 2010. Although we believe the variety of Royal Wolf’s products, the breadth of its customer base and its geographic diversity throughout Australia reduces its exposure to economic downturns, general economic downturns or localized downturns in markets where its operates could reduce demand for Royal Wolf’s products and negatively impact our future revenues and results of operations.
Royal Wolf faces significant competition in the portable buildings industry and regional competition in the portable storage market. Royal Wolf also faces potentially significant competition from modular industry companies who have portable storage offerings, especially from several national competitors in Australia who have greater financial resources and pricing flexibility than Royal Wolf does. If Royal Wolf is unable to compete successfully in these industries, it could lose customers and our future revenues could decline.
Although Royal Wolf’s competition varies significantly by market, the portable buildings market in which Royal Wolf competes is dominated by three or four large participants and is highly competitive. In addition, Royal Wolf competes with a number of large to mid-sized regional competitors, as well as many smaller, full and part-time operators in many local regions. The modular space industry is highly competitive and almost all of the competitors have portable storage product offerings. The primary modular national competitors with portable storage offerings are less leveraged than Royal Wolf, and have greater financial resources and pricing flexibility than Royal Wolf does. If they focus on portable storage, Royal Wolf could lose customers and our future revenues could decline. If Royal Wolf is unable to compete successfully in these markets, it could lose customers and our future revenues could decline.
19
Table of Contents
Our customers lease our storage container products on primarily a month-to-month basis, and our results of operations could be adversely affected by a downturn in economic activity.
Should a significant number of Royal Wolf’s container products be returned by customers during a short period of time, Royal Wolf would have to lease to new customers a large supply of units at similar rates in order to maintain historic revenues from these operations. Royal Wolf’s failure to effectively lease to new customers a large influx of units returned by customers from leases could have a material adverse effect on our results of operations.
Failure to retain key personnel could adversely affect Royal Wolf’s operations and could impede our ability to execute our business plan and growth strategy.
Royal Wolf is managed largely by its existing officers, including Robert Allan, its Chief Executive Officer. The continued success of Royal Wolf will depend largely on the efforts and abilities of these executive officers and certain other key employees. The members of the senior management team of Royal Wolf have substantial experience in the equipment leasing industry. These key employees have knowledge and an understanding of Royal Wolf and its industry that cannot be readily duplicated. Mr. Allan has an employment agreement which is terminable under certain circumstances upon notice to him. However, we do not have key-man insurance on any of these key personnel. The loss of Mr. Allan or any member of Royal Wolf’s senior management team could impair our ability to execute our business plan and growth strategy, cause a loss of customers, reduce revenues and adversely affect employee morale.
Failure by container suppliers to deliver container products to Royal Wolf could adversely affect its operations.
The failure of one or more container suppliers to deliver or timely deliver containers to Royal Wolf could harm its reputation with customers. If Royal Wolf is unable to fulfill customer orders due to delivery failures by its suppliers, Royal Wolf’s results of operations could be harmed.
Significant Risks Related to Primarily Our Business and Operations in the United States
General or localized economic downturns or weakness may adversely affect Pac-Van’s customers, in particular those in the construction industry, which may reduce demand for Pac-Van’s products and services and negatively impact our future revenues and results of operations.
A significant portion of Pac-Van’s revenues is derived from customers who are in industries and businesses that are cyclical in nature and subject to changes in general economic conditions, including the construction industry, which constituted approximately 37% of Pac-Van’s revenues for the fiscal year ended June 30, 2010. Although the variety of Pac-Van’s products, the breadth of its customer base and the number of markets it serves throughout the United States limit its exposure to economic downturns, general economic downturns or localized downturns in markets where its operates could reduce demand for Pac-Van’s products, especially in the construction industry, and negatively impact our future revenues and results of operations.
Pac-Van faces significant competition in the modular buildings and portable storage industries. Pac-Van also faces potentially significant competition from modular buildings companies who have portable storage product offerings, especially from several national competitors in the United States who have greater financial resources and pricing flexibility than Pac-Van does. If Pac-Van is unable to compete successfully, it could lose customers and our future revenues could decline.
Although Pac-Van’s competition varies significantly by market, the modular buildings markets in which Pac-Van competes are dominated by two large participants and are highly competitive. In addition, Pac-Van competes with a number of large to mid-sized regional competitors, as well as many smaller, full and part-time operators in many local regions. The modular building industry is highly competitive, subject to stiff pricing competition and almost all of the competitors have portable storage product offerings. The primary modular national competitors with portable storage product offerings are less leveraged than Pac-Van, and have greater financial resources and pricing flexibility than Pac-Van does. If they focus on portable storage, Pac-Van could lose customers and our future revenues could decline. If Pac-Van is unable to compete successfully, it could lose customers and our future revenues could decline.
20
Table of Contents
Because Pac-Van has depended to a large extent on the success of its leasing operations, the failure of Pac-Van to effectively and quickly remarket lease units that are returned could materially and adversely affect our results of operations.
The current economic recession in the U.S. has reduced utilization rates at Pac-Van to levels at approximately 72% as of June 30, 2010, but historically Pac-Van’s average monthly lease fleet utilization has averaged between 70% and 85%; with the typical lease term being for an average period of over twelve months. The high utilization rate and the length of the average lease have provided Pac-Van with a predictable revenue stream. However, if utilization rates continue to decline or should a significant number of Pac-Van’s lease units be returned during any short period of time, Pac-Van would have to re-lease a large supply of units at similar rates to maintain historic revenues from these operations. Pac-Van’s failure to effectively maintain historical utilization rates or remarket a large influx of units returning from leases could have a material adverse effect on our results of operations.
Sales of modular buildings, mobile offices and storage units constitute a significant portion of Pac-Van’s revenues and the failure to continue to sell units at historic rates could adversely affect our ability to grow Pac-Van’s lease fleet.
Sales of modular buildings, mobile offices and storage units constituted approximately 35% of Pac-Van’s total revenues for the fiscal year ended June 30, 2010. Revenues from sales of modular buildings, mobile offices and storage units have been used to fund increases in the size of our lease fleet. As a result, the failure to continue to sell a significant number of units may adversely affect our ability to increase the size of Pac-Van’s lease fleet or to otherwise take advantage of business and growth opportunities available to it.
Governmental regulations could impose substantial costs and restrictions on Pac-Van’s operations that could harm our future results of operations.
Pac-Van is subject to various federal, state and local environmental, transportation, health and safety laws and regulations in connection with its operations. Any failure to comply with these laws or regulations could result in capital or operating expenditures or the imposition of severe penalties or restrictions on its operations. In addition, these laws and regulations could change in a manner that materially and adversely affects Pac-Van’s ability to conduct its business. More burdensome regulatory requirements in these or other areas may increase our general and administrative costs. If Pac-Van is unable to pass these increased costs on to its customers, our future operating results could be negatively impacted.
Significant increases in raw material costs could increase our operating costs significantly and harm our future results of operations.
Pac-Van purchases raw materials, including metals, lumber, siding and roofing and other products, to construct and modify modular buildings and to modify containers to its customers’ requirements. Pac-Van also maintains a truck fleet to deliver units to and return units from customers. During periods of rising prices for raw materials, especially oil and fuel for delivery vehicles, and in particular when the prices increase rapidly or to levels significantly higher than normal, Pac-Van may incur significant increases in operating costs and may not be able to pass price increases through to customers in a timely manner, which could harm our future results of operations.
Failure to retain key personnel could adversely affect Pac-Van’s operations and could impede our ability to execute our business plan and growth strategy.
Pac-Van is managed largely by its seven existing officers, including its President, Theodore M. Mourouzis. The continued success of Pac-Van will depend largely on the efforts and abilities of Mr. Mourouzis and these senior managers. These officers and employees have an understanding of Pac-Van and its industry that cannot be readily duplicated. Mr. Mourouzis has an employment agreement which is terminable under certain circumstances upon notice to or by him. The loss of any member of Pac-Van’s senior management team could impair our ability to execute our business plan and growth strategy, cause a loss of customers, reduce revenues and adversely affect employee morale.
Any failure of Pac-Van’s management information systems could disrupt our business and result in decreased rental or sale revenues and increased overhead costs, which could negatively impact our results of operations.
Pac-Van depends on its management information systems to actively manage its lease fleet, control new unit capital spending and provide fleet information, including leasing history, condition and availability of our units. These functions enhance Pac-Van’s ability to optimize fleet utilization, rent ability and redeployment. The failure of Pac-Van’s management information systems to perform as we anticipate could disrupt its business and could result in, among other things, decreased leases or sales and increased overhead costs, which could negatively impact our results of operations.
21
Table of Contents
Failure by Pac-Van’s manufacturers to sell and deliver products to Pac-Van in timely fashion may harm Pac-Van’s reputation and our financial condition.
Pac-Van currently purchases new modular buildings and components, mobile offices and storage container products directly from manufacturers. Although Pac-Van is not dependent on any one manufacturer and is able to purchase products from a variety of suppliers, the failure of one or more of its suppliers to timely manufacture and deliver storage containers to Pac-Van could adversely affect its operations. Pac-Van purchases new modular buildings and components, mobile offices and storage containers under purchase orders issued to various manufacturers, which the manufacturers may or may not accept or be able to fill. Pac-Van has no contracts with any supplier. If these suppliers do not timely fill Pac-Van’s purchase orders, or do not properly manufacture the ordered products, our reputation and financial condition also could be harmed.
Unionization by some or all of Pac-Van’s employees could cause increases in operating costs.
Pac-Van’s employees are not presently covered by collective bargaining agreements. Unions may attempt to organize Pac-Van’s employees in the future. We are unable to predict the outcome of any continuing or future efforts to organize Pac-Van’s employees, the terms of any future labor agreements, or the effect, if any, those agreements might have on our operations or financial performance.
Some zoning laws restrict the use of Pac-Van’s storage units and therefore limit its ability to offer its products in all markets.
Many of Pac-Van’s customers use Pac-Van’s storage units to store goods on their own properties. Local zoning laws in some of Pac-Van’s markets prohibit customers from maintaining mobile offices or storage containers on their properties or require that mobile offices or storage containers be located out of sight from the street. If local zoning laws in one or more of Pac-Van’s geographic markets were to ban or restrict its products from being stored on customers’ sites, Pac-Van’s business in that market could suffer.
22
Table of Contents
The following summary contains information about General Finance Corporation and the offering of our common stock. For a more complete understanding of this offering, you should read the entire prospectus carefully, including the risk factors. You should rely only on the information contained in this prospectus. We have not authorized anyone to provide you with different information. We are not making an offer of these securities in any jurisdiction where the offer is not permitted. It does not contain all of the information that may be important to you in making a decision to purchase our common stock. For a more complete understanding of General Finance Corporation and the offering of its common stock, we urge you to read this entire prospectus and the documents incorporated by reference carefully, including the “Risk Factors” sections and our financial statements and the notes to those statements incorporated by reference herein.
References in this prospectus to “we”, “us,” “General Finance,” “GFN” or the “Company” refer to General Finance Corporation and its consolidated subsidiaries. These subsidiaries include: GFN North America Corp., a Delaware corporation which we refer to as “GFNNA;” Pac-Van, Inc., an Indiana corporation which we refer to as “Pac-Van;” GFN Mobile Storage Inc., a Delaware corporation which we refer to as “GFNMS;” GFN U.S. Australasia Holdings, Inc., a Delaware corporation which we refer to as “GFN U.S.;” Royal Wolf Holdings Limited, an Australian corporation which we refer to as “Royal Wolf Holdings;” GFN Australasia Finance Pty Ltd, an Australian corporation which we refer to as “GFN Finance;” RWA Holdings Pty Limited, an Australian corporation which we refer to as “RWA;” and Royal Wolf Trading Australia Pty Limited, an Australian corporation which we refer to as “Royal Wolf Trading.” We refer to Royal Wolf Holdings and its subsidiaries collectively as “Royal Wolf.”
Company Overview
Our strategy and business plan is to acquire rental services and specialty finance businesses in North America, Europe and the Asia-Pacific area. We currently have two operating subsidiaries, Royal Wolf and Pac-Van, that lease and sell storage container products, modular buildings and mobile offices through 23 customer service centers, which we refer to as “CSCs,” in Australia and New Zealand and 26 branch locations across 18 states in the United States. Royal Wolf and Pac-Van operate in two distinct, but related industries, modular space and mobile storage, which we collectively refer to as the “portable services industry.”
In September 2007, we acquired Royal Wolf. We paid $64.3 million to acquire Royal Wolf. The purchase price consisted of $44.7 million of cash and shares of common stock of GFN U.S., constituting 13.8% of the capital stock of GFN U.S. following the issuance. We issued the shares of common stock of GFN U.S. to Bison Capital Australia, L.P., which we refer to as “Bison Capital,” as one of the sellers of Royal Wolf. Following the acquisition, we owned 86.2% of the outstanding capital stock of GFN U.S., and Bison Capital owned the remaining 13.8% of the capital stock of GFN U.S.
In October 2008, we acquired Pac-Van through a merger in which Mobile Office Acquisition Corp., or MOAC, the parent company of Pac-Van, merged with and into the Company’s wholly-owned subsidiary, GFNNA. To purchase all of the capital stock of MOAC we paid $19.4 million in cash, issued 4,000,000 shares of restricted General Finance common stock valued at $7.50 per share under the merger agreement and caused GFNNA to issue a $1.5 million 20-month subordinated promissory note. We also assumed the outstanding senior indebtedness of Pac-Van.
In May 2011, Royal Wolf Holdings completed an initial public offering on the Australian Securities Exchange which raised gross proceeds of A$91.5 million from the issue of 50 million new ordinary shares. Royal Wolf used the net proceeds of the offering to prepay in full $22.3 million of Bison Capital subordinated notes and to reduce borrowings under its senior credit facility, and General Finance used net proceeds from the offering to repurchase the 13.8% of the capital stock of GFN U.S., to reduce borrowings under the senior credit facility of Pac-Van and for general working capital purposes. At the completion of the offering, General Finance owned a majority of the ordinary shares of Royal Wolf Holdings.
Products
Our products include the following:
Modular Space
Modular Buildings. Also known as manufactured buildings, modular buildings provide customers with additional space and are often modified to customer specifications. Modular buildings range in size from 1,000 to more than 30,000 square feet and may be highly customized.
Mobile Offices and Portable Container Buildings. Also known as trailers or construction trailers, mobile offices are re-locatable units with aluminum or wood exteriors on wood (or steel) frames on a steel carriage fitted with axles, allowing for an assortment of “add-ons” to provide comfortable and convenient temporary space solutions. We also offer portable container buildings, ground level offices (“GLOs”), or office containers (which are either modified or specifically-manufactured shipping containers that are used as mobile offices), and in-plant units, which are manufactured structures that provide self-contained office space with maximum design flexibility.
23
Table of Contents
Mobile Storage
Storage Containers. Storage containers consist of new and used shipping containers that provide a flexible, low cost alternative to warehousing, while offering greater security, convenience, and immediate accessibility. Our storage products include general purpose dry storage containers, refrigerated containers and specialty containers in a range of standard and modified sizes, designs and storage capacities. Specialty containers include blast-resistant units, hoarding units and hazardous-waste units. We also offer storage vans, also known as storage trailers or dock-height trailers.
Freight Containers. Freight containers are specifically designed for transport of products by road and rail. Our freight container products include curtain-side, refrigerated and bulk cargo containers, together with a range of standard and industry-specific dry freight containers.
ROYAL WOLF
Royal Wolf’s lease fleet, nationwide presence and experienced management team position it as the leading provider in Australia and New Zealand of portable storage containers, portable container buildings and freight containers, which we refer to collectively as “storage container products.” Royal Wolf leases and sells storage container products through its 23 (Customer Service Centers (“CSCs”) located in every state in Australia and New Zealand. We believe Royal Wolf has the largest lease fleet of storage container products in Australia and New Zealand. Royal Wolf is the only portable container lease and sales company with CSCs in all major business centers in Australia and New Zealand. Royal Wolf’s experienced management team is lead by Robert Allan, the chief executive officer of Royal Wolf, who has 25 years of experience in the industry. The members of the senior management team of Royal Wolf have an average of over 14 years of experience in the industry. We believe the experience of this management team will be critical to growing Royal Wolf’s business.
Royal Wolf’s storage container products are used by a diverse client base of nearly 21,000 customers who conduct business in a broad range of industries that include mining, road and rail, construction, moving and storage, manufacturing, transportation, defense and in the support of small and medium-size entities. Our customers use our products for a wide variety of storage applications, including retail and manufacturing inventory, construction materials and equipment, documents and records and household goods.
Business Strengths
Royal Wolf believes it possesses the following principal strengths:
Leading Market Share in Australia and New Zealand. Royal Wolf believes its lease fleet of storage container products is the largest in Australia and New Zealand.
CSC Branch Network. Royal Wolf is the only portable container lease and sales company with CSCs in all major business centers in Australia and New Zealand.
Broad Product Range and Young Fleet. Royal Wolf believes it has the broadest product range and youngest lease fleet in Australia and New Zealand.
Diversified Blue Chip Customer Base. Royal Wolf has a broad base of approximately 21,000 active customers, with only one customer constituting more than 2% of our annual revenue for the fiscal year ended June 30, 2010. Our customer base includes the retail and manufacturing sectors, councils and government departments, the farming and agricultural community, the building and construction industry, clubs and sporting associations, the mining sector and the general public.
Experienced Management Team. Royal Wolf’s experienced management team is lead by Robert Allan, the chief executive officer of Royal Wolf, who has 25 years of experience in the industry. The senior management team of Royal Wolf has an average of over 14 years of experience in the industry. We believe the experience of this management team will be critical to growing Royal Wolf’s business.
24
Table of Contents
Business Strategy
We are pursuing a business strategy focused on growing our leasing operations, generating strong internal growth and eventually leveraging our infrastructure through acquisitions, as follows:
Focus on Mobile Storage Leasing Business. We focus on growing our core leasing business because it provides predictable, recurring revenue and high margins. We believe that we can generate substantial demand for our storage container products as the container storage and portable container building industry is relatively underdeveloped in Australia and New Zealand. We believe the underdeveloped nature of the market presents significant growth opportunities for Royal Wolf. Although mobile storage, domestic freight movement and portable building applications are increasing, we believe many more uses for our storage container products are still to be developed. Royal Wolf’s market opportunity is to fully develop and service these applications.
Generate Strong Internal Growth. We define internal growth as an increase in lease revenues on a year-over-year basis at our CSCs in operation for at least one year, without inclusion of leasing revenue attributed to same-market acquisitions. We continue to focus on increasing the number of storage containers we lease from our existing branches to both new and repeat customers as well as changing the billing methodologies used in the U.S. market, such as advance billing, a 28-day billing cycle, fuel surcharges and a damage waiver program. Historically, we have been able to generate strong internal growth within our existing markets through sales and marketing programs designed to increase brand recognition, expand market awareness of the uses of mobile storage and differentiate our products from our competitors.
Leverage our Infrastructure through Acquisitions. Our branch network infrastructure serves a broad geographic area and is capable of serving additional volume at minimal levels of additional fixed costs. Our long-term objective is to add volume by organically growing the lease fleet in these locations and through acquisitions. Asset purchases of “tuck in” competitors to existing branches or adding newly acquired fleet with branches in better locations can be very effective. In addition, the corporate infrastructure of Royal Wolf is capable of managing existing fleets and locations in geographies outside of Australia and New Zealand, but within the Asia-Pacific area.
Industry Overview
The storage industry includes two principal markets, fixed self-storage and mobile storage. The fixed self-storage market consists of permanent structures located away from customer locations used primarily to temporarily store excess goods. Although we have containers that are used for self-storage on our sites and have sites that are focused on self-storage such as Auckland and Christchurch in New Zealand and Tomago in Australia, we do not participate in the fixed self-storage market with permanent structures.
The portable storage market differs from the fixed self-storage market in that it brings the storage solution to the customer’s location and addresses the need for secure, temporary storage with immediate access to the storage unit. The advantages of portable storage include convenience, immediate accessibility, better security and lower costs. In contrast to fixed self-storage, which is used by retail customers, the portable storage market is primarily used by businesses.
Mobile Storage Container Market
Since the mid-1990s, the storage container industry in Australia and New Zealand has developed into a stable market analogous to the marine container business of 20 or 25 years ago. Marine containerization displaced less efficient and more expensive specialized equipment. We believe mobile storage containers are achieving increased market share due to an increasing awareness of container storage benefits: convenience and ground level access at the customer location, security and low cost.
We are not aware of any published third-party analysis of the Australia and New Zealand mobile storage container markets. Based upon internal analysis, Royal Wolf’s management team estimates that the mobile storage market in Australia and New Zealand currently generates annual revenues of approximately $167 million (AUS$195 million), with an estimated 60% derived from sales of mobile storage containers. Royal Wolf’s management team also anticipates that, as the market matures, rental revenue will account for an increasing proportion of the total revenue.
The mobile storage market has experienced steady growth since the mid-1990s. Although there is no official forecast of industry growth rates or the future potential size market for mobile storage in Australia and New Zealand, we believe that a number of factors suggest that the market will continue to grow:
| • | Customer familiarity with mobile storage benefits is still relatively low; |
| • | Suppliers and customers continue to develop further uses for mobile storage containers; and |
| • | Industries which use portable storage products continue to grow. |
25
Table of Contents
The mobile storage markets in Australia and New Zealand are highly fragmented. In most locations in Australia, Royal Wolf competes with several national and regional competitors, including, Cronos and CGM-CMA, as well as smaller, full and part-time operators. Local competitors are regionally focused, and are usually more capital-constrained. Therefore, in general, most are heavily reliant on monthly sales performance, have slowly growing rental fleets and have limited ability to transact larger deals. The New Zealand market is even more fragmented.
The following table lists Royal Wolf’s principal competitors in the mobile storage container market in Australia. This information was compiled by Royal Wolf’s management team based upon informal estimates and internal surveys of competitor rental fleet size, annual sales volumes and, where possible, external information such as competitor newsletters and advertising. We have no independent corroboration of this market information, and there is no assurance that this internally-generated information is accurate or complete.
| Competitor |
Scope of Operations | |
| Cronos | National | |
| CGM-CMA | National |
Portable Container Buildings Market
The portable container buildings market in Australia was estimated to have generated revenue totaling $848 million (AUS$990 million) during the year ended June 30, 2009, of which approximately $502 million (AUS$586 million) relates to the markets in which Royal Wolf offers a competing product, according to reports from IBIS World Industry Report published in January 2010. The portable buildings market consists of the following:
| • | Engineering, construction and resources — approximately 30%. |
| • | Household — approximately 30% |
| • | Non-residential building construction — approximately 17%. |
| • | Recreation and holiday — approximately 15%. |
| • | Agriculture and export — approximately 8% |
Within the engineering, construction and resources market, portable container buildings are used for site offices, toilet and shower facilities, and worker housing and temporary accommodation blocks. This market is influenced by trends in public and private sector spending on infrastructure, generally, and, particularly, mine development and road and pipeline construction.
Demand from the non-residential buildings market principally stems from the demand for work sheds, site offices, industrial garages and temporary warehousing.
We believe the recreation and holiday market is increasingly becoming an important source of demand, particularly for the supply of fitted out cabins to be used as rental accommodations and second homes on purchased blocks of land. Growth in demand has been driven by growth in disposable income and increased leisure time associated with an aging population.
We believe that the portable container buildings market will grow over the long-term term, driven in part by a cyclical expansion in the mining and construction markets, which represent a significant growth opportunity for Royal Wolf. The transportability, security and flexibility of portable container buildings are highly valued in the mining and construction markets.
In the portable container buildings markets, Royal Wolf competes with three or four other large participants who manufacture their own units and most of whom offer units for both lease and sale to customers. These competitors include Coates, Atco, Ausco and Nomad. At present, Royal Wolf has a small presence in this market. The major barrier to entry for new participants is the degree of market penetration necessary to create a wide profile with contractors and clients. Penetrating and competing with the range of products and number of depots and agencies offered by incumbent operators tends to inhibit new entrants. As Royal Wolf already has a national sale and distribution network, established supply channels and a strong profile in its target markets, many of the barriers to entry applicable to other new entrants are not applicable to it.
26
Table of Contents
The following table lists Royal Wolf’s principal competitors in the Australian portable buildings market:
| Competitor |
Scope of Operations | |
| Coates | National | |
| Ausco | National | |
| Nomad | National | |
| Atco | National |
Freight Container Market
Royal Wolf’s management team estimates that the freight container market in Australia generates approximately $33 million (AUS $38 million) in aggregate annual lease and sales revenues. The growth rate in this industry has been slow compared with the portable container storage and portable container buildings market, which reflects the relative maturity of this industry. Royal Wolf’s present strategy is to maintain rather than grow its container fleet in this sector. Competitors include, Cronos and Simply Containers.
The following table lists Royal Wolf’s principal competitors in the Australian freight container market:
| Competitor |
Scope of Operations | |
| Cronos | National | |
| Simply Containers | National |
Products and Services
Royal Wolf is the only storage container product company in Australia and New Zealand with both the national presence and product range capable of servicing all sectors of the domestic rental and sales market. The Company’s key products include:
| Mobile storage containers: | 10-foot, 20-foot and 40-foot general purpose units | |
| Double pallet-wide high cube units | ||
| Hazardous goods containers | ||
| Refrigerated containers | ||
| Portable container: buildings: | Site offices and cabins | |
| Workforce accommodation units | ||
| Luxury accommodation units | ||
| Restroom blocks | ||
| Blast-resistant units | ||
| Specialized office and infrastructure suites | ||
| Freight Containers: | Curtain-side containers | |
| 20-foot and 40-foot Hi-cube containers | ||
| 20-foot and 40-foot two pallet-wide containers | ||
| Side-opening door containers | ||
| 20-foot bulk containers | ||
Mobile Storage Containers. Royal Wolf leases and sells mobile storage containers, some of which are customized for specific customers, for on-site storage by customers. These customers include retail outlets and manufacturers, government departments, farming and agricultural concerns, building and construction companies, clubs and sporting associations, mine operators and the general public. Royal Wolf’s products include general purpose dry storage containers, refrigerated containers and hazardous goods containers in a range of standard and modified sizes, designs and storage capacities.
The amount and percentage of Royal Wolf’s total sales and leasing revenues of mobile storage containers for the fiscal year ended June 30, 2010 were as follows ($ in millions):
| Dollars | Percentage | |||||||
| Sales |
$ | 53.0 | 89 | % | ||||
| Leasing |
27.8 | 70 | % | |||||
|
|
|
|
|
|||||
27
Table of Contents
Portable Container Buildings. Royal Wolf also leases and sells portable container buildings as site offices and for temporary accommodations. Royal Wolf customizes mobile storage container buildings for some customers. Royal Wolf entered the portable building market in August 2005 with 20-foot and 40-foot portable buildings manufactured from steel container platforms which it markets to a subset of its mobile storage container customer base.
The amount and percentage of Royal Wolf’s total sales and leasing of portable container building revenues for the fiscal year ended June 30, 2010 were as follows ($ in millions):
| Dollars | Percentage | |||||||
| Sales |
$ | 4.4 | 8 | % | ||||
| Leasing |
5.4 | 13 | % | |||||
|
|
|
|
|
|||||
Freight Containers. Royal Wolf leases and sells freight containers specifically designed for transport of products by road and rail. Customers include national moving and storage companies, distribution and logistics companies, freight forwarders, transport companies, rail freight operators and the Australian military. Royal Wolf’s freight container products include curtain-side, refrigerated and bulk cargo containers, together with a range of standard and industry-specific dry freight containers.
The amount and percentage of Royal Wolf’s total sales and leasing of freight container revenues for the fiscal year ended June 30, 2010 were as follows ($ in millions):
| Dollars | Percentage | |||||||
| Sales |
$ | 1.9 | 3 | % | ||||
| Leasing |
6.7 | 17 | % | |||||
|
|
|
|
|
|||||
Most of our fleet is comprised of new and refurbished and customized storage containers, manufactured steel containers and record storage units, along with our freight and accommodation units. These products are designed for long useful lives.
We maintain our steel containers on a regular basis by painting them on average once every three to five years, removing rust, and occasionally replacing the wooden floor or other parts. This periodic maintenance keeps the container in good condition and is designed to maintain the unit’s value and rental rates comparable to new units.
Product Procurement
Royal Wolf purchases marine cargo containers from a wide variety of international shipping lines and container leasing companies and new container products directly from storage container manufacturers in China. We believe Royal Wolf is the largest buyer of both new and used storage container products for the Australia and New Zealand markets. The majority of used storage containers purchased are standard 20-foot and 40-foot units which Royal Wolf converts, refurbishes or customizes. Royal Wolf purchases new storage containers directly from container manufacturers.
Each of the following material suppliers was the source of five percent or more of Royal Wolf’s container purchases during the year ended June 30, 2010:
| Suppliers |
Type of Product Purchased |
Percentage of Container Purchases |
||||||
| Nantong CIMC |
New | 10 | % | |||||
| Flex Box |
New | 8 | ||||||
| Singamas |
New | 6 | ||||||
| Eastern Container Alliance |
New | 5 | ||||||
|
|
|
|||||||
Royal Wolf purchases new storage container products under purchase orders issued to container manufacturers. There are several alternative sources of supply for storage containers. Though Royal Wolf is not dependent upon any one manufacturer in purchasing storage container products, the failure of one or more of its suppliers to timely deliver containers to Royal Wolf could adversely affect its operations. If these suppliers do not timely fill Royal Wolf’s purchase orders or do not properly manufacture the ordered products, Royal Wolf’s reputation and financial condition also could be harmed.
28
Table of Contents
In November 2007, Royal Wolf entered into a preferred supply agreement with GE SeaCo. Under the preferred supply agreement, GE SeaCo has agreed to sell to Royal Wolf all of GE SeaCo’s containers that GE SeaCo determines to sell, up to a maximum of 5,000 containers each year. The purchase price for the containers will be based on their condition and is specified in the agreement, subject to annual adjustment. In addition, Royal Wolf received a right of first refusal to purchase any additional containers that GE SeaCo desires to sell in Australia, New Zealand and Papua New Guinea. Either party may terminate the agreement upon no less than 90 days’ prior notice at any time after November 15, 2012. Approximately 360 units were purchased under this contract during the year ended June 30, 2010.
Branch network
Royal Wolf leases and sells its storage container products from its network of 23 CSCs, the largest branch network of any storage container company in Australia and New Zealand. Royal Wolf is represented in all major metropolitan areas, and Royal Wolf is the only container leasing and sales company with a nationally integrated infrastructure and work force.
A typical Royal Wolf CSC consists of a leased site of approximately two to five acres with a sales office, forklifts and all-weather container repair workshop. CSC office staffing ranges from two to 15 people and include a branch manager supported by the appropriate level of sales, operations and administrative personnel. Yard and workshop staffing usually ranges between one and 12 people and can consist of welders, spray painters, boilermakers, forklift drivers and production supervisors. CSC inventory holding usually ranges between 150 and 700 storage containers at any one time, depending on market size and throughput demand.
The following map shows Royal Wolf’s existing CSC locations at June 30, 2010:
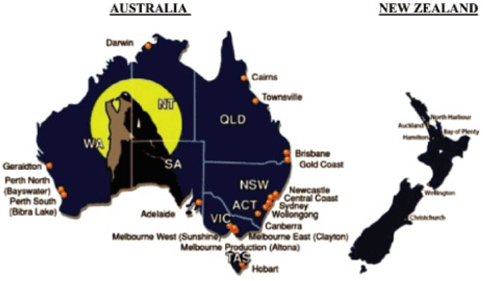
Each CSC has a branch manager who has overall supervisory responsibility for all activities of the CSC. Branch managers report to one of our six regional managers. Our regional managers, in turn, report to our CSC or retail manager. Performance based incentive bonuses are a portion of the compensation for the CSC, regional and branch managers.
Each branch has its own sales force, and we are introducing a transportation department that will deliver and pick up mobile storage units from customers in certain hub areas. Each branch has forklifts to load, transport and unload units and a storage yard staff responsible for unloading and stacking units. Steel units can be stored by stacking them to maximize usable ground area. Our larger branches also have a fleet maintenance department to make modifications to the containers and maintain the branch’s forklifts and other equipment. Our smaller branches perform preventative maintenance tasks and outsource major repairs.
Except for the Auckland, New Zealand self-storage and regional office site, we lease all of our branch locations and Royal Wolf’s corporate and administrative offices in Hornsby, New South Wales. All of our major leased properties have remaining lease terms of between one month and 15 years, and we believe that satisfactory alternative properties can be found in all of our markets. Reference is made to “Item. 2 Properties” for a more detailed description of our leased facilities.
29
Table of Contents
Customers
Royal Wolf has a broad base of approximately 21,000 active customers, with only one customer constituting more than 2% of our annual revenue for the fiscal year ended June 30, 2010. Our customer base includes the retail and manufacturing sectors, councils and government departments, the farming and agricultural community, the building and construction industry, clubs and sporting associations, the mining sector and the general public. We believe the diversity of Royal Wolf’s customer base reduces the business exposure to a significant downturn in any particular industry.
Royal Wolf storage container products provide its customers with a solutions-oriented approach with high quality equipment, superior service and product knowledge. This is supported by a highly responsive national marketing team, in-house finance, and control and engineering expertise and nationally linked fleet management and accounting systems. Royal Wolf is the largest and only truly national supplier of container products in Australia and New Zealand, and the only container company with the scale and capacity to service a full range of customers, from small local accounts right through to the largest national businesses. Royal Wolf’s diverse customer base is depicted in the following chart for the fiscal year ended June 30, 2010:
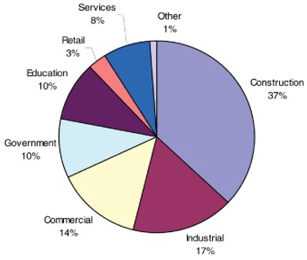
Royal Wolf customers use its storage containers for a wide variety of purposes, which include:
| • | Temporary storage of excess inventory for the retail and wholesale industries; |
| • | Offices, workshops or storerooms; |
| • | Portable work camps for the resources industry, including accommodations, ablution and kitchen containers; |
| • | Blast resistant containers for refineries; |
| • | Rapid deployment storage for the military, emergency services and disaster relief; |
| • | Low-cost accommodations for remote communities and caravan parks; and |
| • | Farm storage for cattle feed, farm equipment, fertilizers and other items. |
Sales and Marketing
Royal Wolf’s sales and marketing strategy is designed to reach thousands of potential customers. Communication with potential customers is predominantly generated through a combination of Yellow Pages, internal advertising and SEO (search engine optimization) and print media advertising, telemarketing, web-site, customer referrals, signage and decal awareness, direct mail and radio. The customer hiring or buying process is being driven by customer awareness of the products combined with price shopping. We believe that while a typical customer may shop a limited number of suppliers, the customer does not spend much time doing so because the potential cost savings is relatively low compared to the value of their time. Our goal is for Royal Wolf to be the market leader in identifying and closing new customers.
30
Table of Contents
Fleet Management
Royal Wolf regularly re-locates containers between its CSCs to meet peaks in regional demand and optimize inventory levels. Royal Wolf has close relationships with the national road and rail hauling companies that enable it to transport the majority of containers interstate at attractive rates.
Royal Wolf’s management information systems are instrumental to its fleet management and targeted marketing. Fleet information is updated daily at the CSC level which provides management with on-line access to utilization, leasing and sale fleet unit levels and revenues by branch or geographic region.
Management Information and Back Office Systems
Our management information systems, including the RMI and Navision software programs provide us with critical information to manage our business. Utilizing our systems, we track a number of key operating and financial metrics including utilization, lease rates, customer trends and fleet data. All our branches use RMI/Navision and our support office provides financial, inventory and customer reports for branch managers.
Employees
As of June 30, 2010, Royal Wolf employed 226 full-time employees in the following major categories:
| Senior and CSC management |
16 | |||
| Corporate staff |
21 | |||
| Sales and marketing |
76 | |||
| CSC operations and administration |
113 | |||
|
|
|
None of our employees is covered by a collective bargaining agreement. We believe our relationship with our employees is good. We have never experienced any material labor disruption, and we are not aware of any efforts or plans to unionize our employees.
PAC-VAN
Pac-Van competes in the modular space and the mobile storage industries. Modular space includes mobile offices and modular buildings and involves the rental and sales of factory built structures and the delivery and installation of the equipment at customer properties. Mobile storage generally includes providing customers with secure, temporary storage at their site locations. Both lines of business serve a broad range of industries, including construction, services, retail, manufacturing, transportation, utilities and government.
Business Strengths
Pac-Van is a recognized provider of modular buildings, mobile offices and mobile storage products on a national, regional and local basis in the United States. Pac-Van believes it possesses the following strengths:
Extensive Geographic Coverage. With growing lease fleet of approximately 11,000 units, Pac-Van is a national participant in the mobile and modular sectors of the portable services industry. Pac-Van’s branch offices serve 17 of the 50 largest Metropolitan Statistical Areas, or MSAs, in the United States. Pac-Van serves a diverse base of national, regional and local customers. The size of Pac-Van’s fleet also allows Pac-Van to offer a wide selection of products to its customers and to achieve purchasing efficiencies.
31
Table of Contents
Diversified Customer Base. Pac-Van has established strong relationships with a diverse customer base in the U.S., ranging from large companies with a national presence to small local businesses. During the fiscal year ended June 30, 2010 (“FY 2010”), Pac-Van leased or sold its equipment to over 6,200 customers. In FY 2010, Pac-Van’s largest customer accounted for approximately 5% of its total revenues and Pac-Van’s top ten customers accounted for approximately 15% of its total revenues. Pac-Van believes that the diversity of its business limits the impact on Pac-Van of changes in any given customer, geography or market.
Focus On Customer Service and Support. Pac-Van’s operating infrastructure in the U.S. is designed to ensure that Pac-Van consistently meets or exceeds customer expectations. On the national and regional level, Pac-Van’s administrative support services and scalable management information systems enhance its service by enabling Pac-Van to access real-time information on product availability, customer reservations, customer usage history and rates. Pac-Van believes this focus on customer service attracts new and retains existing customers. In FY 2010, more than 90% of its lease and lease-related revenues were generated from customers who leased from Pac-Van in prior years.
Significant Cash Flow Generation and Discretionary Capital Expenditures. Pac-Van has consistently generated significant cash flow from operations by maintaining high utilization rates and leasing margins and controlling capital expenditures. A significant portion of Pac-Van’s capital expenditures are discretionary in nature, thus providing Pac-Van with the flexibility to readily adjust the amount that it spends based on its business needs and prevailing economic conditions.
High Quality Fleet. Pac-Van’s branches maintain their lease fleet to consistent quality standards. Maintenance is expensed as incurred and branch managers and operations staff are responsible for managing a maintenance program aimed at providing equipment to customers that meets or exceed customer expectations and industry standards.
Experienced Management Team. Pac-Van has an experienced and proven senior management team, with its seven most senior managers having worked at Pac-Van for an average of more than ten years. Pac-Van’s President, Theodore M. Mourouzis, joined Pac-Van in 1997 and the consistency of the senior management, corporate and branch management teams has been integral in developing and maintaining its high level of customer service, deploying technology to improve operational efficiencies and integrating acquisitions.
Business Strategy
We are pursuing a business strategy focused on growing our leasing operations, diversifying our product offerings in storage containers and modular buildings, maintaining disciplined cost controls, reducing indebtedness and eventually completing accretive acquisitions, as follows:
Focus on Leasing Business. We focus on increasing our core leasing business because it generates predictable, recurring revenues and high profit margins. Pac-Van’s management team strives to optimize leasing rates and lease fleet utilization in the 26 core markets it serves. Pac-Van branch office system permits it to shift its fleet to branches where customer demand is greatest, and Pac-Van’s planning and sourcing expertise permits it to procure new product on an as needed basis.
Diversifying Our Product Offerings. We plan to continue to expand the size and breadth of our lease fleet. We will emphasize expansion of our higher return products, particularly storage containers. In addition, we will continue to pursue the introduction of specialty storage and office products that can attain long lease durations and high leasing operating margins.
Disciplined Cost Controls. Pac-Van’s size permits it to more rapidly adjust to changing market conditions than many of its larger competitors. This size enables Pac-Van to quickly introduce storage container products demanded by customers, adjust capital expenditures and other spending and maintain more disciplined cost controls than competitors whose cost structures include manufacturing, large payrolls and large investments in outdated product classes, such as storage trailers.
Reducing Indebtedness. We continue to focus on reducing the indebtedness of Pac-Van. We believe this focus on debt reduction will provide great flexibility in the future and will position Pac-Van to capture future growth opportunities. In down or recovering economic cycles, such as we are experiencing in the United States, the Company focuses on optimizing lease fleet utilization, lease rates and collections.
Accretive Acquisitions. Pac-Van plans to complete acquisitions that are accretive or offer other benefits such as expanded customer service or product offerings. Acquisitions, especially “tuck in” acquisitions, also allow Pac-Van to leverage the fixed costs of its branch offices with additional lease fleet that deliver scale and increased profitability.
Industry Overview
Pac-Van competes in two different, but related, segments of the portable services industry: the modular space segment and the mobile storage segment.
32
Table of Contents
The Modular Building Institute, in its State of the Industry 2006 report, estimated that U.S. modular space industry dealers earned in excess of $3.0 billion of leasing and sales revenues in 2005. The industry has expanded rapidly over the last thirty years as the number of applications for modular space has increased and recognition of the product’s positive attributes has grown. We believe modular space delivers four core benefits: lower costs, flexibility, reusability and timely solutions. Modular buildings offer customers significant cost savings over permanent construction. Flexibility and reusability are the hallmarks of modular buildings. Modular products are not site specific and can be reutilized. It is not unusual to have modular buildings serve a wide variety of users during their life spans. We believe we are well-positioned to benefit from growth in the modular space industry.
Pac-Van also competes in the mobile storage industry. Mobile storage is used primarily by businesses for secure, temporary storage at the customer’s location. The mobile storage industry serves a broad range of other industries, including construction, services, retail, manufacturing, transportation, utilities and government. Mobile storage offers customers a flexible, secure, cost-effective and convenient alternative to constructing permanent warehouse space or storing items at a fixed-site self-storage facility by providing additional space for higher levels of inventory, equipment or other goods on an as-needed basis. Although Pac-Van is not aware of any published estimates, Pac-Van believes the mobile storage industry is growing due to an increasing awareness of its convenience and cost benefits.
The modular space industry is highly competitive. Pac-Van competes with service, quality, customer relationships and price. Pac-Van believes that its reputation for customer service and a wide selection of units allow it to compete effectively. However, Pac-Van’s largest North American competitors, ModSpace, Williams-Scotsman, and Mobile Mini have greater market share or product availability in some markets and have greater financial resources and pricing flexibility than it. Other regional competitors include Acton Mobile, Vanguard Modular, and Satellite Shelters.
The portable storage industry is highly fragmented, with numerous participants in local markets leasing and selling storage containers, storage trailers and other structures. Pac-Van believes that participants in its industry compete on the basis of customer relationships, price, service, delivery speed and breadth and quality of equipment offered. In every area Pac-Van serves, Pac-Van competes with multiple local, regional, and national portable storage providers. Some of Pac-Van’s competitors may have greater market share, less indebtedness, greater pricing flexibility or superior marketing and financial resources. Pac-Van’s largest competitors in the storage container and storage trailer markets in the U.S. are Mobile Mini, Williams Scotsman, Allied Leasing, Haulaway, Eagle Leasing and National Trailer Storage.
Products and Services
Pac-Van provides a broad range of products to meet the needs of its customer base. These products include modular buildings, mobile offices and storage containers. The following provides a description of Pac-Van’s product lines:
Modular Buildings. Modular buildings are factory-built, portable structures generally consisting of two or more floors and are used in a wide variety of applications, ranging from schools to restaurants to medical offices. Ranging in size from 1,000 to more than 30,000 square feet, the company’s modular buildings are constructed in many sizes and are usually designed to satisfy unique customer requirements. Pac-Van procures modular buildings from an established network of manufacturing partners to meet state building requirements. Modular buildings represent 34% of Pac-Van’s lease fleet.
Mobile Offices. Sales and construction offices, also known as field offices, are relocatable, single-unit structures primarily used for temporary office space. These units are generally built on frames that are connected to axles and wheels and have either a fixed or removable hitch for easy transportation. Standard construction office models range in size from approximately 160 square feet to 1,000 square feet, and are available in standard 8, 10, 12, and 14 foot widths, and include air conditioning and heating, lighting, plan tables, shelving, electrical wiring, phone jacks, and other features normally associated with basic office space. Sales offices range in size from 384 to 672 square feet and typically come in 12 foot widths. Sales offices generally have wood siding, carpeting, high ceilings, custom windows, and glass storefront doors, which provide a professional, customer-friendly building in which to conduct business. Ground offices are storage containers that have been modified to include office space with feature similar to those found in construction offices. Like storage containers, ground level offices (GLOs) typically come in lengths of 20 feet and 40 feet. Some models combine both office and storage functions. All of Pac-Van’s mobile offices are built, or modified as with ground offices, by an established network of manufacturing partners to standard specification, which may vary depending on regional preferences. In addition, Pac-Van builds these units to meet state building code requirements and generally obtains multi-state codes enabling the company to move equipment among its branch network to meet changing demand and supply conditions. Mobile offices comprise approximately 59% of Pac-Van’s lease fleet.
33
Table of Contents
Mobile Storage Equipment. Mobile storage equipment is generally classified into the following product groupings: storage containers, domestic storage containers and storage trailers. Storage containers vary in size from 10 feet to 48 feet in length, with 20-foot and 40-foot length containers being the most common. Storage containers are steel units, which are generally eight feet wide and eight and one-half feet high, and are built to the International Organization for Standardization standards for carrying ocean cargo. Pac-Van purchases new and used storage containers. Domestic storage containers are generally eight feet wide, ten feet in width and come in lengths ranging from 40 to 53 feet. Storage trailers, which vary in size from 28 to 53 feet in length, have wheels and hitches and provide dock height storage. Mobile storage equipment comprises approximately 7% of Pac-Van’s rental fleet.
Delivery and Installation, Return and Dismantle, and Other Site Services. Pac-Van delivers and where necessary installs all three product lines directly to its customers’ premises. Installation services range from simple leveling for portable storage to complex seaming and joining for modular buildings. Pac-Van will also provide skirting and ramps as needed by the customer. Depending on the type of unit some states will also require tie downs and other features to secure the unit. Once a unit is on site at a customer location, Pac-Van’s site services include relocating the unit.
Ancillary Products and Services. In addition to leasing it core product line, Pac-Van provides ancillary products such as steps, furniture, portable toilets, security systems, and other items to its customers for their use in connection with its equipment. Pac-Van also offers its lease customers a damage waiver program that protects them in case the leased unit is damaged. For customers who do not select the damage waiver program, Pac-Van bills them for the cost of any repairs.
Pac-Van complements its core leasing business by selling either existing rental fleet assets or assets purchased specifically for resale. In FY 2010, management estimates that nearly 29% of the sales came from existing fleet units. The sale of- lease fleet units has historically been a cost-effective method of replenishing and upgrading the lease fleet. As with the leasing business, Pac-Van provides additional services when selling units. These services range from delivery to full scale turnkey solutions. In a turnkey solution, Pac-Van provides not only the underlying equipment but also a full range of ancillary services, such as a foundation, specialty interior finishes, and landscaping, necessary to make the equipment fully operational for the customer.
Lease Fleet Summary by Number of Units as June 30, 2010:
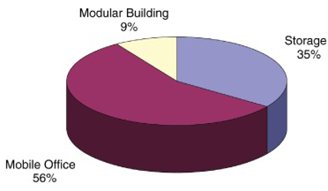
Lease Fleet Summary by Gross Dollar Value (thousands) at June 30, 2010:
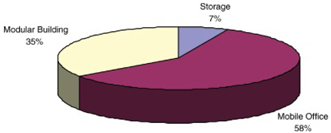
Leasing. Leasing revenue is a function of average monthly rental rate, fleet size and utilization. Pac-Van monitors fleet utilization at each branch. For FY 2010, average unit utilization of the lease al fleet was approximately 71% on a gross dollar basis and 69% on a unit basis. While Pac-Van adjusts its pricing to respond to local market conditions, management believes that it generally achieves a rental rate equal to or above that of competitors because of the quality of Pac-Van’s products and its high level of customer service. As part of its leasing operations, Pac-Van sells used units from its rental fleet at fair market value or, to a much lesser extent, pursuant to pre-established lease purchase options included in the terms of its lease agreements. Due in part to an active fleet maintenance program, Pac-Van’s units maintain a substantial portion of their initial value which includes the cost of the units as well as costs of significant improvements made to the units.
Sales. Pac-Van will sell units out of its sale inventory as well as its lease fleet. Pac-Van does not generally purchase new units for resale until it has obtained firm purchase orders (which are generally non-cancelable) for such units.
34
Table of Contents
Delivery and Installation. Pac-Van provides delivery, site-work, installation and other services to its customers as part of its leasing and sales operations. Revenues from delivery, site-work and installation result from the transportation of units to a customer’s location, site-work required prior to installation and installation of the units which have been leased or sold. Typically units are placed on temporary foundations constructed by service technicians, and service personnel will also generally install ancillary products. Pac-Van also derives revenues from dismantling and transporting units upon lease expiration.
Product Procurement and Capital Expenditures
Pac-Van closely monitors fleet capital expenditures, which include fleet purchases and any capitalized improvements to existing units. Generally, fleet purchases require corporate approval and must pass purchasing guidelines (primarily based on minimum return on investment requirements and utilization requirement). Pac-Van purchases storage equipment and modular and mobile offices from a network of third-party suppliers. The top three suppliers of units for FY 2010 represented approximately 53% of all fleet purchases and the top ten suppliers represented approximately 81% of all fleet purchases
Pac-Van can adjust capital expenditures to match business needs and prevailing economic conditions. Pac-Van does not generally enter into long-term purchase contracts with manufacturers and can modify its capital spending activities to correspond to market conditions.
We supplement our fleet spending with acquisitions. Although the timing and amount of acquisitions are difficult to predict, management considers its acquisition strategy to be opportunistic and will adjust its fleet spending patterns as favorable acquisition opportunities become available.
Fleet Maintenance
Ongoing maintenance to Pac-Van’s lease fleet is performed on an as-needed basis and is intended to maintain the value and rental-ready condition of its units. We use both in-house fleet technicians and third-party vendors to perform maintenance depending on the branch and complexity of the work. Maintenance requirements on containers are generally minor and include removing rust and dents, patching small holes, repairing floors, painting and replacing seals around the doors. Storage trailer maintenance may also include repairing or replacing brakes, lights, doors and tires. Maintenance requirements for mobile offices and modular buildings tend to be more significant than for storage equipment and may involve repairs of floors, doors, air conditioning units, windows, roofs and electric wiring. Major office repairs are sometimes outsourced. Whether performed by Pac-Van or a third party, the cost of maintenance and repair of Pac-Van’s lease fleet is included as direct costs of leasing operations and is expensed as incurred. We believe that Pac-Van’s maintenance program ensures a high quality fleet.
Branch Network
The following map shows Pac-Van’s existing branch network as of June 30, 2010:
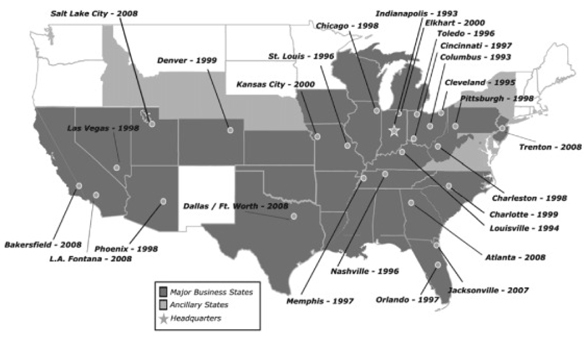
35
Table of Contents
As a key element to its market strategy, Pac-Van maintains a network of 26 branch offices throughout the United States. This network enables it to maintain product availability and provide customer service within regional and local markets. Customers benefit because they are provided with improved service availability, reduced time to occupancy, better access to sales representatives, the ability to inspect units prior to rental and lower freight costs which are typically paid by the customer. Pac-Van benefits because it is able to spread regional overhead and marketing costs over a larger lease base, redeploy units within its branch network to optimize utilization.
Branches are generally headed by a branch manager and branch operations are led by three regional vice presidents who collectively average more than 10 years of experience with Pac-Van. Management believes it is important to encourage employees to achieve specified revenue and profit levels and to provide a high level of service to customers. Regional and branch managers’ compensation is based upon the financial performance of their branches and overall corporate performance and, in some cases, sales commissions. Sales representatives compensation includes both base and commission elements.
Customers
Pac-Van has established strong relationships with a diverse set of customers, ranging from large national retailers and manufacturers to local sole proprietors. During FY2010, Pac-Van provided its portable storage, mobile office and modular building products to a diversified base of approximately 6,200 national, regional and local companies in a variety of industries including construction, industrial, manufacturing, education, service, and government sectors.
In FY2010, Pac-Van generated 65% of its revenues from leasing and 35% of its revenues from sales. Pac-Van’s largest leasing customer accounted for approximately 2% of total leasing revenues and its top ten customers accounted for approximately 8% of its total leasing revenues. The following chart shows the percentage of revenues generated by different industries in FY 2010:
Construction. Construction customers include a diverse group of contractors and subcontractors who work on commercial and residential projects. Pac-Van believes its construction customer base is characterized by a wide variety of contractors and subcontractors, including general contractors, mechanical contractors, plumbers, electricians and roofers. In FY 2010, revenue generated from construction customers was 37% of total revenue, a decrease from 45% in the year ended June 30, 2009. Contractors typically use Pac-Van’s products to provide on-site office facilities and to securely store construction materials and supplies at construction sites. Nevertheless, Pac-Van believes the majority of its lease and lease-related revenue is derived from the commercial construction market. Demand from Pac-Van’s construction customers tends to be higher in the second and third quarters when the weather is warmer, particularly in the central and northern United States.
Services. Service customers include businesses that provide medical care or veterinary services, equipment leasing companies that sublease Pac-Van’s equipment, entertainment companies including those conducting sporting events, and religious institutions, other than for their classroom needs. These customers may use any or all of Pac-Van’s products and services.
Retail. Retail customers include both large national chains and small local stores. These customers typically lease storage containers and storage trailers to store excess inventory and supplies. Retail customers also use Pac-Van’s storage products during store remodeling or refurbishment. Demand from these customers can be seasonal and tends to peak during the winter holidays.
Industrial. Industrial and manufacturing customers include a broad array of manufacturers, including oil refineries, petrochemical refineries, carpet manufacturers, textile manufacturers and bottling companies. They generally lease storage containers and storage trailers to store both inventory and raw materials. They lease mobile offices and modular buildings for extra office space, cafeterias, changing rooms and other interior space needs.
36
Table of Contents
Commercial. The commercial customer segment includes a wide variety of businesses, usually businesses that sell services, but excludes businesses that have customers who shop at their location. These customers may use Pac-Van’s modular products as their place of business, Pac-Van’s mobile offices as supplemental office space and Pac-Van’s storage products to store their inventory, goods or supplies.
Government. Government customers include public schools, correctional institutions, fire departments as well as the U.S. military. These customers generally lease storage containers and storage trailers to safeguard materials used in their day-to-day operations and various government projects. They lease mobile offices and modular buildings for classrooms, training offices and general office space.
Education. The education customer segment includes both public and private schools and day care facilities, and includes classroom space for religious institutions. Pac-Van provides space to this customer group ranging from entire school facilities to supplemental classroom space, to portable storage equipment for storing athletic gear.
Sales and Marketing
As of June 30, 2010, Pac-Van’s sales and marketing team consisted of 33 employees. Members of Pac-Van’s sales group act as its primary customer service representatives and are responsible for fielding calls, obtaining credit applications, quoting prices, following up on quotes and handling orders. Pac-Van’s marketing group is primarily responsible for coordinating direct mail, Internet marketing and other advertising campaigns, producing company literature, creating promotional sales tools and managing its sales management system. Pac-Van’s centralized support services group handles all billing, collections and other support functions, allowing its sales and marketing team to focus on addressing the needs of its customers. Pac-Van’s marketing programs emphasize the cost-savings and convenience of using its products versus constructing temporary or permanent offices or storage facilities. Pac-Van markets its services through a number of promotional vehicles, including the Internet, yellow pages, prominent branding of its equipment, telemarketing, targeted mailings, trade shows and limited advertising in publications.
The development of Pac-Van’s marketing programs are developed by branch managers, regional vice presidents and senior management, all of whom participate in devising branch-by-branch marketing strategies based on fleet availability and forecasted demand. Pac-Van’s branch managers, working with its corporate marketing team, determine the timing, content and target audience of direct mailings, specials and promotional offers, while the corporate office manages the marketing process itself to ensure the consistency of its message, achieve economies of scale and relieve its local branches of the administrative responsibility of running its marketing programs. Pac-Van believes that its approach to marketing is consistent with the local nature of its business and allows each branch to employ a customized marketing plan that fosters growth within its particular market.
Management Information Systems
Pac-Van’s management information systems are instrumental to its lease fleet management and targeted marketing efforts and allow management to monitor operations at branches on a daily, weekly, and monthly basis. Lease fleet information is updated daily at the branch level and verified through routine physical inventories by branch personnel. This provides management with on-line access to utilization, lease fleet unit levels and rental revenues by branch or geographic region. In addition, an electronic file for each unit showing its lease history and current location and status is maintained in the information system. Branch sales people utilize the system to obtain information regarding unit condition and availability. The database tracks individual units by serial number and provides comprehensive information including cost, condition and other financial and unit specific information.
Employees
As of June 30, 2010, Pac-Van had 181 employees. None of our employees are covered by a collective bargaining agreement. Management believes its relationship with employees is good. We have never experienced any material labor disruption and are unaware of any efforts or plans to organize our employees. The employees are grouped accordingly:
| Senior and branch management |
26 | |||
| Corporate staff |
20 | |||
| Sales and marketing |
33 | |||
| CSC operations and administration |
102 | |||
|
|
|
In addition, we have three full-time employees at our GFN corporate office in Pasadena, California.
37
Table of Contents
Regulatory Matters
We must comply with various federal, state and local laws and regulations in connection with our operations. We believe that we are in substantial compliance with these laws and regulations. In addition to compliance costs, we may incur costs related to alleged environmental damage associated with past or current properties owned or leased. We believe that our liability, if any, for any environmental remediation will not have a material adverse effect on our results of operations or financial condition. However, we cannot be certain that the discovery of currently unknown matters or conditions, new laws and regulations, or stricter interpretations of existing environmental laws will not have a material adverse effect on our business or operations in the future.
A portion of Pac-Van’s units are subject to regulation in certain states under motor vehicle and similar registrations and certificate of title statutes. We believe that we have complied in all material respects with all motor vehicle registration and similar certificate of title statutes in states where such statutes clearly apply to modular space units. However, in certain states, the applicability of such statutes to its modular space units is not clear beyond doubt. If additional registration and related requirements are deemed to be necessary in such states or if the laws in such states or other states were to change to require compliance with such requirements, Pac-Van could be subject to additional costs, fees and taxes as well as administrative burdens in order to comply with such statutes and requirements. We do not believe the effect of such compliance will be material to our business, results of operations or financial condition.
Trademarks
General Finance sold the “Royal Wolf” name and trademark to Royal Wolf Trading in May 2011 in connection with the initial public offering of Royal Wolf Holdings. There are no claims pending against Royal Wolf challenging its right to use the “Royal Wolf” name and trade mark within Royal Wolf’s region of business.
Pac-Van owns a number of trademarks important to its business, including Pac-Van® and “We’ve Put Thousands of U.S. Businesses In Space ®.” Material trademarks are registered in the U.S. Patent and Trademark Office. Registrations for such trademarks in the United States will last indefinitely as long as Pac-Van continues to use and maintain the trademarks and renew filings with the applicable governmental offices.
38
Table of Contents
MANAGEMENT’S DISCUSSION AND ANALYSIS OF FINANCIAL CONDITION
AND RESULTS OF OPERATIONS
The following discussion of our financial condition and results of operations should be read together with the audited consolidated financial statements and the accompanying notes thereto; and the unaudited condensed consolidated financial statements and the accompanying notes thereto included elsewhere in this prospectus.
Background and Overview
We incorporated in Delaware on October 14, 2005 and completed our initial public offering (the “IPO”) in April 2006.
On September 13, 2007 (September 14 in Australia), we acquired Royal Wolf by purchasing the outstanding shares of RWA. The purchase price paid to the former shareholders of RWA was $64.3 million, which consisted of cash, the issuance to Bison Capital Australia, L.P., (“Bison Capital”), one of the sellers, of shares of common stock of GFN U.S. and the issuance of a note to Bison Capital. Following the acquisition, we own 86.2% of the outstanding capital stock of GFN U.S. and Bison Capital owns 13.8% of the outstanding capital stock of GFN U.S. Royal Wolf leases and sells storage containers, portable container buildings and freight containers in Australia and New Zealand, which is considered geographically by the Company to be the Asia-Pacific area.
On October 1, 2008, we acquired Pac-Van through a merger with Mobile Office Acquisition Corp. (“MOAC”), the parent of Pac-Van, and our wholly-owned subsidiary formed in July 2008, GFNNA. In addition to assuming Pac-Van’s senior and other debt, we paid $46.5 million to the stockholders of MOAC by a combination of cash, GFN restricted common stock and a 20-month subordinated promissory note. Pac-Van leases and sells modular buildings, mobile offices and storage containers in the United States.
The economic downturn in the United States, particularly in the construction –related industries (where Pac-Van has currently over 30% of its business and historically has had over 40%), and, until recently, the global economy in general, have had an adverse impact on the Company’s operating results. We responded by reducing indebtedness, personnel costs, capital expenditures, discretionary spending and curtailing acquisition activity. We continuously monitor our performance and customer demand levels by identifying and applying best practices to make our business more efficient. Accordingly, we may continue to reduce headcount or employee compensation in the areas in which we believe we can achieve greater efficiencies without affecting customer service or our sales efforts. While this is our approach for the foreseeable future, our long-term strategy and business plan is to acquire and operate rental services and specialty finance businesses in North America, Europe and the Asia-Pacific area.
Our two operating subsidiaries, Royal Wolf and Pac-Van, lease and sell storage container products, modular buildings and mobile offices through seventeen customer service centers (“CSCs”) in Australia, six CSCs in New Zealand and twenty-six branch locations across eighteen states in the United States. As of March 31, 2011, we had 232 and 181 employees and 29,677 and 11,073 lease fleet units in the Asia-Pacific area and United States, respectively. We do business in two distinct, but related industries, modular space and mobile storage, which we collectively refer to as the “portable services industry.” Our revenue mix was approximately 50% each for sales and leasing during the nine months ended March 31, 2011.
Our products include the following:
Modular Space
Modular Buildings. Also known as manufactured buildings, modular buildings provide customers with additional space and are often modified to customer specifications. Modular buildings range in size from 1,000 to more than 30,000 square feet and may be highly customized.
Mobile Offices and Portable Container Buildings. Also known as trailers or construction trailers, mobile offices are re-locatable units with aluminum or wood exteriors on wood (or steel) frames on a steel carriage fitted with axles, allowing for an assortment of “add-ons” to provide comfortable and convenient temporary space solutions. We also offer portable container buildings, ground level offices (“GLOs”), or office containers (which are either modified or specifically-manufactured shipping containers that are used as mobile offices), and in-plant units, which are manufactured structures that provide self-contained office space with maximum design flexibility.
Mobile Storage
Storage Containers. Storage containers consist of new and used shipping containers that provide a flexible, low cost alternative to warehousing, while offering greater security, convenience, and immediate accessibility. Our storage products include general purpose dry storage containers, refrigerated containers and specialty containers in a range of standard and modified sizes, designs and storage capacities. Specialty containers include blast-resistant units, hoarding units and hazardous-waste units.
39
Table of Contents
Freight Containers. Freight containers are specifically designed for transport of products by road and rail. Our freight container products include curtain-side, refrigerated and bulk cargo containers, together with a range of standard and industry-specific dry freight containers.
Quarter Ended March 31, 2011 (“QE FY 2011”) Compared to Quarter March 31, 2010 (“QE FY 2010”)
The following compares our QE FY 2011 results of operations with our QE FY 2010 results of operations.
Revenues. Revenues increased by approximately 12% to $43.3 million in QE FY 2011 from $38.5 in QE FY 2010. This consisted of an increase of $8.0 million, or 33%, in revenues at Royal Wolf and a $3.2 million decrease, or 22%, in revenues at Pac-Van. The translation effect of the average currency exchange rate, driven by the strengthening in the Australian dollar to the U.S. dollar in QE FY 2011 versus QE FY 2010, caused a portion of the increase in total revenues at Royal Wolf which otherwise would have shown an increase of 20%. This increase at Royal Wolf was substantially due to the growth in the mining sector, which revenues increased by approximately $6.0 million in QE FY 2011 from QE FY 2010. Since the second half of our fiscal year ended June 30, 2009 (“FY 2009”), the economic downturn, particularly in the construction-related sector, has resulted in a significant reduction in our overall business in United States. In QE FY 2011, when compared to QE FY 2010, revenues in this sector decreased by $0.9 million. Sales and leasing revenues represented 47% and 53% of total revenues in QE FY 2011 and 50% each in QE FY 2010.
Sales during QE FY 2011 amounted to $20.5 million, compared to $19.2 million during QE FY 2010; representing an increase of $1.3 million, or 7%. This consisted of an increase of $4.8 million, or 36%, in sales at Royal Wolf and a $3.5 million decrease, or 60%, in sales at Pac-Van. The translation effect of the average currency exchange rate, driven by the strengthening in the Australian dollar to the U.S. dollar in QE FY 2011 versus QE FY 2010, caused a portion of the increase in sales revenues at Royal Wolf which otherwise would have shown an increase of 22%. In QE FY 2011, sales in the Asia-Pacific area increased $1.9 million in our CSC retail operations and $2.9 million in our national accounts group (or non-retail operations). In the United States, the lower sales revenues in QE FY 2011 from QE FY 2010 were primarily from modular building and mobile office projects in the educational, construction and government sectors. Sales revenues in these sectors decreased in QE FY 2011 by $3.1 million from QE FY 2010.
The $1.9 million revenue increase at Royal Wolf in the retail operations resulted from a $1.4 million increase due to higher prices and a favorable foreign exchange rate effect of $1.2 million, offset somewhat by a $0.7 million decrease in unit sales. The higher sales revenues were primarily due to increased demand in our CSCs in the Queensland and Victoria regions.
The $2.9 million revenue increase at Royal Wolf in the national accounts group resulted from a $0.7 million increase in unit sales, a $1.9 million increase due to higher prices and a favorable foreign exchange rate effect of $0.3 million. QE FY 2011 revenues included the sales of 198 mining container units (versus 37 units in QE FY 2010) for $3.9 million to one customer. While not necessarily of the same magnitude, we believe that the opportunity for future sales of these container units to this and other customers exist.
Leasing revenues during QE FY 2011 totaled $22.8 million, as compared to $19.3 million during QE FY 2010, representing an increase of $3.5 million, or 18%. Leasing revenues increased slightly at Pac-Van by $0.3 million, or 3%, and increased by $3.2 million, or 30%, at Royal Wolf. The translation effect of the average currency exchange rate, driven by the strengthening in the Australian dollar to the U.S. dollar in QE FY 2011 versus QE FY 2010, caused a portion of the increase in total revenues at Royal Wolf which otherwise would have shown an increase of 17%. The favorable foreign exchange rate effect at Royal Wolf in QE FY 2011 totaled $1.2 million ($0.9 million and $0.3 million in our retail business and national accounts group, respectively) from QE FY 2010.
At Royal Wolf, average utilization in the retail operations was 88% during QE FY 2011, as compared to 82% during QE FY 2010; and average utilization in the national accounts group operations was 87% during QE FY 2011, as compared to 82% during QE FY 2010. Overall average utilization at Royal Wolf was 87% in QE FY 2011 and 81% in QE FY 2010; and the average monthly lease rate of containers was AUS$154 in both QE FY 2011 and QE FY 2010. Leasing revenues in QE FY 2011 increased in part as a result of demand for storage and accommodation units caused by the Queensland, Australia flooding and the Christchurch, New Zealand earthquake. However, we believe the primary reasons we were able to both increase our overall average utilization and maintain our composite monthly lease rate between the periods at Royal Wolf were because of the improving economy in the Asia-Pacific area and because of our position as the only national company in the mobile storage industry in Australia and New Zealand. We continually review each local market in which we do business to determine if local factors justify increases or decreases in lease rates and the effect these changes would have on utilization and revenues.
At Pac-Van, average utilization rates were 88%, 64% and 76% and monthly lease rates were $91, $219 and $809 for containers, mobile offices and modular units, respectively, during QE FY 2011; as compared to 76%, 61% and 76% and $90, $228 and $884 for containers, mobile offices and modular units in QE FY 2010, respectively. The generally lower monthly lease rates resulted from lower demand and increased competition, particularly in the construction-related industry. Pac-Van is required to maintain a minimum average composite utilization rate, as defined, of over 60% for each quarter. For QE FY 2011, the average composite utilization rate was 73%.
40
Table of Contents
The average value of the Australian dollar against the U.S. dollar strengthened during QE FY 2011 as compared to QE FY 2010. The average currency exchange rate of one Australian dollar during QE FY 2011 was $1.00562 U.S. dollar compared to $0.90363 U.S. dollar during QE FY 2010. This fluctuation in foreign currency exchange rates resulted in an increase to our total revenues at Royal Wolf of $2.7 million in QE FY 2011 when compared to QE FY 2010.
Cost of Sales. Cost of sales (which is the cost related to our sales revenues only and exclusive of the line items discussed below) increased by $0.5 million to $15.8 million during QE FY 2011 from $15.3 million during QE FY 2010, but was proportionately more profitable. Our gross profit percentage from sales revenues was 23% in QE FY 2011 versus 20% in QE FY 2010.
Direct Costs of Leasing Operations and Selling and General Expenses. Direct costs of leasing operations (which excludes depreciation and amortization) and selling and general expenses aggregately increased, by $2.9 million ($2.4 million of which was at Royal Wolf), to $18.5 million during QE FY 2011 from $15.6 million during QE FY 2010. As a percentage of revenues, these operating expenses were 43% during QE FY 2011 and 41% during QE FY 2010; reflecting the adverse impact of the reduced revenues at Pac-Van in QE FY 2011 from QE FY 2010 despite implementing cost-cutting measures in the United States since the second half of FY 2009 to offset the effects of the economic downturn. This cost cutting involved: (1) salaries and related payroll costs as a result of staff reductions and lower bonuses, (2) less discretionary spending and (3) better control of our professional costs.
In general, with respect to our operating segments, Pac-Van’s operating expenses as a percentage of revenues are higher than Royal Wolf’s percentage as: (1) Royal Wolf’s mix of QE FY 2011 sales to total revenues at 57% is higher than the 20% at Pac-Van, (2) Pac-Van has an office modular fleet which is a lower margin product line; and (3) Pac-Van has less density in its retail markets.
Depreciation and Amortization. Depreciation and amortization decreased slightly by $0.1 million to $4.7 million during QE FY 2011 from $4.6 million during QE FY 2010. The decrease was primarily due to the completion of the amortization period of certain intangible assets that were recorded in connection with our acquisition of Royal Wolf in September 2007.
Interest Expense. Interest expense of $4.8 million in QE FY 2011 was $0.9 million higher than the $3.9 million in QE FY 2010. This was comprised of an increase of $0.8 million at Royal Wolf and $0.1 million in the United States. Royal Wolf’s weighted-average interest rate (without the effect of the interest rate swap and option contracts) was 11.3% in QE FY 2011, as compared to 10.1% in QE FY 2010; and the weighted-average rate in the United States was 6.1% in QE FY 2011, as compared to 5.7% in QE FY 2010.
Foreign Currency Exchange. We have certain U.S. dollar-denominated debt at Royal Wolf, including intercompany borrowings, which are remeasured at each financial reporting date with the impact of the remeasurement being recorded in our consolidated statements of operations. Unrealized gains and losses resulting from such remeasurement due to changes in the Australian exchange rate to the U.S. dollar could have a significant impact in our reported results of operations, as well as any realized gains and losses from the payments on such U.S. dollar-denominated debt and intercompany borrowings. As noted above, the average value of the U.S. dollar against the Australian dollar weakened during QE FY 2011 as compared to QE FY 2010 and from December 31, 2010 to March 31, 2011. The currency exchange rate of one Australian dollar at December 31, 2010 was $1.0163 U.S. dollar compared to $1.0311 U.S. dollar at March 31, 2011. In QE FY 2011, net unrealized and realized foreign exchange gains (losses) totaled under ($0.1) million and $0.2 million, respectively, and net unrealized losses on forward currency exchange contracts totaled under $0.1 million. In QE FY 2010, net unrealized and realized foreign exchange gains totaled $0.7 million and under $0.1 million, respectively, and net unrealized losses on forward currency exchange contracts totaled under $0.1 million in QE FY 2010.
Income Taxes. Our effective income tax rate was 37.2% and 36.4% during QE FY 2011 and QE FY 2010, respectively. The effective rate in both periods is greater than the U.S. federal rate of 34% primarily because of state income taxes from the filing of tax returns in multiple U.S. states and because a portion of the depreciation and amortization on the fixed and intangible assets recorded in the Pac-Van acquisition is not deductible for U.S. federal income tax purposes, offset somewhat by the favorable income tax impact of the amortization of goodwill acquired in acquisitions made in the Asia-Pacific area, which is deductible for U.S. income tax reporting purposes.
Noncontrolling Interest. Noncontrolling interest, which represents Bison Capital’s 13.8% interest in Royal Wolf, was a charge of $2.3 million in QE FY 2011, as compared to $0.6 million in QE FY 2010, reflecting the enhanced redemption value of the put option as Royal Wolf’s profitability increases. As discussed in Note 8 of Notes to the Unaudited Interim Consolidated Financial Statements, we commenced accreting the redemption value of the Bison Capital put option over the period from July 1, 2009 through June 30, 2011.
Net Loss Attributable to Common Stockholders. We had a net loss attributable to common stockholders of $2.5 million in QE FY 2011, as compared to a net loss of $0.8 million in QE FY 2010, primarily as a result of the increased accretion of the Bison Capital put option and higher interest expense in QE FY 2011 from QE FY 2010, offset somewhat by the increased profitability in the Asia-Pacific area.
41
Table of Contents
Nine Months Ended March 31, 2011 (“YTD FY 2011”) Compared to Nine Months March 31, 2010 (“YTD FY 2010”)
The following compares our YTD FY 2011 results of operations with our YTD FY 2010 results of operations.
Revenues. Revenues increased approximately 17% to $131.7 million in YTD FY 2011 from $112.8 in YTD FY 2010. This consisted of an increase of $20.5 million, or 29%, in revenues at Royal Wolf and a $1.6 million decrease, or 4%, in revenues at Pac-Van. The translation effect of the average currency exchange rate, driven by the strengthening in the Australian dollar to the U.S. dollar in YTD FY 2011 versus YTD FY 2010, caused a portion of the increase in total revenues at Royal Wolf which otherwise would have shown an increase of 19%. This increase at Royal Wolf was substantially due to the growth in the mining sector, which revenues increased by approximately $8.4 million in YTD FY 2011 from QE FY 2010. Since the second half of our FY 2009, the economic downturn, particularly in the construction-related sector, has resulted in a significant reduction in our overall business in United States. In YTD FY 2011, when compared to YTD FY 2010, revenues in this sector decreased by $1.6 million. Sales and leasing revenues represented 50% each of total revenues in YTD FY 2011 and 49% and 51% of total revenues in YTD FY 2010, respectively.
Sales during YTD FY 2011 amounted to $66.1 million, compared to $55.1 million during YTD FY 2010; representing an increase of $11.0 million, or 20%. This included an increase of $12.6 million, or 31% in sales at Royal Wolf and a $1.6 million decrease, or 11%, in sales at Pac-Van. The translation effect of the average currency exchange rate, driven by the strengthening in the Australian dollar to the U.S. dollar in YTD FY 2011 versus YTD FY 2010, caused a portion of the increase in sales revenues at Royal Wolf which otherwise would have shown an increase of 22%. In YTD FY 2011, sales in the Asia-Pacific area increased $5.1 million in our national accounts group (or non-retail operations), primarily because of the enhanced activity in the mining, defense and building and construction sectors; and increased $7.5 million in our CSC retail operations from YTD FY 2010. In the United States, the lower sales revenues in YTD FY 2011 from YTD FY 2010 were primarily from modular building and mobile office projects in the commercial, construction and government sectors.
The $7.5 million revenue increase at Royal Wolf in the retail operations resulted from a $4.0 million increase due to higher prices and a favorable foreign exchange rate effect of $3.7 million, offset somewhat by a $0.2 million decrease in unit sales. The higher sales revenues were primarily due to increased demand in our CSCs in Western Australia because of increased activities in the oil and gas exploration and defense sectors in that region, as well as increased business in our CSCs in the Queensland and Victoria regions.
The $5.1 million revenue increase at Royal Wolf in the national accounts group resulted from a $7.1 million increase due to higher prices and a favorable foreign exchange rate effect of $0.7 million, offset somewhat by a $2.7 million decrease in unit sales. YTD FY 2011 revenues included the sales of 198 mining container units (versus 43 units in YTD FY 2010) for $3.9 million to one customer. While not necessarily of the same magnitude, we believe that the opportunity for future sales of these container units to this and other customers exist.
Leasing revenues during YTD FY 2011 totaled $65.6 million, as compared to $57.7 million during YTD FY 2010, representing an increase of $7.9 million, or 14%. Leasing revenues increased at Royal Wolf by $7.9 million, or 26%, and remained flat at Pac-Van. The translation effect of the average currency exchange rate, driven by the strengthening in the Australian dollar to the U.S. dollar in YTD FY 2011 versus YTD FY 2010, caused a portion of the increase in total revenues at Royal Wolf which otherwise would have shown an increase of 15%. The favorable foreign exchange rate effect at Royal Wolf in YTD FY 2011 totaled $3.4 million ($2.9 million and $0.5 million in our retail business and national accounts group, respectively) from YTD FY 2010.
At Royal Wolf, average utilization in the retail operations was 88% during YTD FY 2011, as compared to 79% during YTD FY 2010; and average utilization in the national accounts group operations was 81% during YTD FY 2011, as compared to 74% during YTD FY 2010. Overall average utilization at Royal Wolf was 85% in YTD FY 2011 and 77% in YTD FY 2010; and the average monthly lease rate of containers was A$155 in both YTD FY 2011 and YTD FY 2010. Leasing revenues in YTD FY 2011 increased in part as a result of demand for storage and accommodation units caused by the Queensland, Australia flooding and the Christchurch, New Zealand earthquake. However, we believe the primary reasons we were able to both increase our overall average utilization and maintain our composite monthly lease rate between the periods at Royal Wolf were because of the improving economy in the Asia-Pacific area and because of our position as the only national company in the mobile storage industry in Australia and New Zealand. We continually review each local market in which we do business to determine if local factors justify increases or decreases in lease rates and the effect these changes would have on utilization and revenues.
At Pac-Van, average utilization rates were 86%, 65% and 74% and monthly lease rates were $95, $223 and $835 for containers, mobile offices and modular units, respectively, during YTD FY 2011; as compared to 76%, 62% and 76% and $94, $239 and $926 for containers, mobile offices and modular units in YTD FY 2010, respectively. The generally lower monthly lease rates resulted from lower demand and increased competition, particularly in the construction-related industry. Pac-Van is required to maintain a minimum average composite utilization rate, as defined, of over 60% for each quarter. For YTD FY 2011, the average composite utilization rate was 73%.
42
Table of Contents
The average value of the Australian dollar against the U.S. dollar strengthened during YTD FY 2011 as compared to YTD FY 2010. The average currency exchange rate of one Australian dollar during YTD FY 2011 was $0.96510 U.S. dollar compared to $0.88132 U.S. dollar during YTD FY 2010. This fluctuation in foreign currency exchange rates resulted in an increase to our total revenues at Royal Wolf of $7.8 million in YTD FY 2011 when compared to YTD FY 2010.
Cost of Sales. Cost of sales (which is the cost related to our sales revenues only and exclusive of the line items discussed below) increased by $7.2 million to $50.1 million during YTD FY 2011 from $42.9 million during YTD FY 2010, but was proportionately more profitable. Our gross profit percentage from sales revenues was 24% in YTD FY 2011 versus 22% in YTD FY 2010.
Direct Costs of Leasing Operations and Selling and General Expenses. Direct costs of leasing operations (which excludes depreciation and amortization) and selling and general expenses aggregately increased, by $7.7 million ($5.7 million of which was at Royal Wolf), to $55.1 million during YTD FY 2011 from $47.4 million during YTD FY 2010. However, as a percentage of revenues, these operating expenses were 42% in both YTD FY 2011 and YTD FY 2010. Since the second half of FY 2009, we implemented cost-cutting measures in primarily the United States to offset the effects of the economic downturn. This cost cutting involved: (1) salaries and related payroll costs as a result of staff reductions and lower bonuses, (2) less discretionary spending and (3) better control of our professional costs.
In general, with respect to our operating segments, Pac-Van’s operating expenses as a percentage of revenues are higher than Royal Wolf’s percentage as: (1) Royal Wolf’s mix of YTD FY 2011 sales to total revenues at 58% is higher than the 33% at Pac-Van, (2) Pac-Van has an office modular fleet which is a lower margin product line; and (3) Pac-Van has less density in its retail markets.
Depreciation and Amortization. Depreciation and amortization decreased by $0.6 million to $14.3 million during YTD FY 2011 from $14.9 million during YTD FY 2010. The decrease was primarily due to (1) an adjustment of $0.5 million in YTD FY 2010 related to the amortization period of certain intangible assets and (2) the completion of the amortization period of certain intangible assets; all of which were recorded in connection with our acquisition of Royal Wolf in September 2007.
Interest Expense. Interest expense of $13.4 million in YTD FY 2011 was $1.6 million higher than the $11.8 million in QE FY 2010. This was comprised of an increase of $1.2 million at Royal Wolf and $0.4 million in the United States. Royal Wolf’s weighted-average interest rate (without the effect of the interest rate swap and option contracts) was 11.0% in YTD FY 2011, as compared to 10.1% in YTD FY 2010; and the weighted-average rate in the United States was 6.1% in YTD FY 2011, as compared to 5.4% in YTD FY 2010.
Foreign Currency Exchange. We have certain U.S. dollar-denominated debt at Royal Wolf, including intercompany borrowings, which are remeasured at each financial reporting date with the impact of the remeasurement being recorded in our consolidated statements of operations. Unrealized gains and losses resulting from such remeasurement due to changes in the Australian exchange rate to the U.S. dollar could have a significant impact in our reported results of operations, as well as any realized gains and losses from the payments on such U.S. dollar-denominated debt and intercompany borrowings. As noted above, the average value of the U.S. dollar against the Australian dollar weakened during YTD FY 2011 as compared to YTD FY 2010 and from June 30, 2010 to March 31, 2011. The currency exchange rate of one Australian dollar at June 30, 2010 was $0.8567 U.S. dollar compared to $1.0311 U.S. dollar at March 31, 2011. In YTD FY 2011, net unrealized and realized foreign exchange gains totaled $4.5 million and $0.5 million, respectively, and net unrealized losses on forward currency exchange contracts totaled $0.4 million. In YTD FY 2010, net unrealized and realized foreign exchange gains totaled $2.6 million and $0.4 million, respectively, and net unrealized gains on forward currency exchange contracts totaled $0.7 million in YTD FY 2010.
Income Taxes. Our effective income tax rate was 37.8% and 36.3% during YTD FY 2011 and YTD FY 2010, respectively. The effective rate in both periods is greater than the U.S. federal rate of 34% primarily because of state income taxes from the filing of tax returns in multiple U.S. states and because a portion of the depreciation and amortization on the fixed and intangible assets recorded in the Pac-Van acquisition is not deductible for U.S. federal income tax purposes, offset somewhat by the favorable income tax impact of the amortization of goodwill acquired in acquisitions made in the Asia-Pacific area, which is deductible for U.S. income tax reporting purposes. At June 30, 2010, we had a U.S. federal net operating loss carryforward of approximately $47 million, which expires if unused during our fiscal years ending June 30, 2020 – 2030.
Noncontrolling Interest. Noncontrolling interest, which represents Bison Capital’s 13.8% interest in Royal Wolf, was a charge of $3.4 million in YTD FY 2011, as compared to $1.7 million in YTD FY 2010, reflecting the enhanced redemption value of the put option as Royal Wolf’s profitability increases. As discussed in Note 8 of Notes to the Unaudited Interim Consolidated Financial Statements, we commenced accreting the redemption value of the Bison Capital put option over the period from July 1, 2009 through June 30, 2011.
Net Loss Attributable to Common Stockholders. We had a net loss attributable to common stockholders of $12 million in YTD FY 2011, as compared to a net loss of $2.0 million in YTD FY 2010, primarily as a result of increased profitability in the Asia-Pacific area, offset somewhat by the increased accretion of the Bison Capital put option and higher interest expense in YTD FY 2011 from YTD FY 2010.
43
Table of Contents
Year Ended June 30, 2010 (“FY 2010”) Compared to Year Ended June 30, 2009 (“FY 2009”)
The following compares our FY 2010 results of operations with our FY 2009 results of operations.
Revenues. Revenues increased 7% to $156.3 million in FY 2010 versus $146.4 in FY 2009. This included an increase of a $2.7 million in revenues at Pac-Van, which we acquired on October 1, 2008, and a $7.2 million increase in revenues in FY 2010 from FY 2009 at Royal Wolf. The translation effect of the average currency exchange rate, driven by the strengthening in the Australian dollar to the U.S. dollar in FY 2010 versus FY 2009, caused the increase in total revenues at Royal Wolf, which otherwise would have shown a reduction of approximately 9% in total revenues. The economic downturn in both our geographic segments during FY 2010 resulted in a significant reduction in our overall business, but particularly in the construction-related sector in the United States and in the mining and defense and transportation sectors in the Asia-Pacific area. These sectors had an aggregate decline in revenues of approximately $9.9 million and $6.5 million from FY 2009, respectively. Sales and leasing revenues represented 51% and 49% of total revenues in FY 2010 and 52% and 48% of total revenues in FY 2009, respectively; the more favorable leasing revenue mix in FY 2010 resulting primarily from our acquisition of Pac-Van.
Sales during FY 2010 amounted to $79.2 million, compared to $75.5 million during FY 2009; representing an increase of $3.7 million, or 5%. The increase was primarily because sales at Royal Wolf were $3.4 million higher in FY 2010 from FY 2009 due to the strengthening of the Australian dollar between periods and by a net sales increase in FY 2010 from FY 2009 of $0.3 million as a result of the acquisition of Pac-Van. Without the benefit of the translation effect as a result of the stronger Australian dollar in FY 2010 from FY 2009, Royal Wolf’s sales revenues would have decreased by 10%. In FY 2010, sales in the Asia-Pacific area declined $3.8 million in our national accounts group (or non-retail operations); primarily because of the reduced activity in the mining and defense and transportation sectors, and increased $7.2 million in our CSC retail operations from FY 2009.
The $3.8 million decrease in our national accounts group consisted of a $6.0 million reduction due to lower prices, which was offset somewhat by a $1.3 million increase due to higher unit sales and a favorable foreign exchange rate effect of $0.9 million. The decrease in our sales prices was primarily due to sales of certain mining container units that remain in inventory as a result of a cancelled leasing order in FY 2009. There are 127 of these units available for sale at June 30, 2010, at a cost of approximately $17,000 each, which we anticipate selling in the range of $19,000 per unit.
The $7.2 million increase in our retail operations consisted of a favorable foreign exchange rate effect of $7.0 million and a $1.2 million increase from higher unit sales; offset somewhat by a $1.0 million reduction due to lower prices, reflecting our efforts to reduce fleet inventories in the current economic environment . The higher unit sales were primarily due to increased demand in our CSCs in Western Australia and the Northern Territory because of increased oil exploration activities in those regions.
Leasing revenues during FY 2010 amounted to $77.1 million compared to $70.9 million during FY 2009, representing an increase of $6.2 million, or 9%. The increase was primarily due to net leasing revenue increases in FY 2010 from FY 2009 of $2.4 million as result of the acquisition of Pac-Van and $3.8 million at Royal Wolf; which was the result of a favorable foreign exchange rate effect of $6.2 million ($5.1 million and $1.1 million in our retail business and national accounts group, respectively) and a $0.3 million increase in lease rates ($0.2 million and $0.1 million in our retail business and national accounts group, respectively), offset somewhat by a decrease of $2.7 million in the average total number of units on lease per month ($1.2 million and $1.5 million in our retail business and national accounts group, respectively). Without the benefit of the translation effect as a result of the stronger Australian dollar in FY 2010 from FY 2009, Royal Wolf’s leasing revenues would have decreased by 7%.
At Royal Wolf, average utilization in the retail operations was 80% during FY 2010, as compared to 77% during FY 2009; and average utilization in the national accounts group operations was 74% during FY 2010, as compared to 63% during FY 2009. Overall average utilization at Royal Wolf was 78% in FY 2010 and 76% in FY 2009. The average monthly lease rate of containers in FY 2010 for Royal Wolf was AUS$154, as compared to AUS$150 in FY 2009. Though leasing revenues at Royal Wolf decreased between the periods primarily because the unit size of our lease fleet has decreased by 5% since June 30, 2009 as a result of our efforts to curtail expenditures, our overall average utilization remained steady and our monthly lease rate increased. We believe this is reflective of our position as the only national company in the mobile storage industry in Australia and New Zealand. Royal Wolf continually reviews each local market in which it does business to determine if local factors justify increases or decreases in lease rates and the effect these changes would have on utilization and revenues.
At Pac-Van, average utilization rates were 80%, 67% and 77% and monthly lease rates were $94, $234 and $909 for containers, mobile offices and modular units, respectively, during FY 2010; as compared to 84%, 74% and 83% and $107, $268 and $1,084 for containers, mobile offices and modular units, respectively. The lower monthly lease rates resulted from lower demand and increased competition, particularly in the construction-related industry in which Pac-Van has approximately 40% of its business. Maintaining utilization rates was of particular importance as under its senior secured credit facility led by BOA, Pac-Van was required to maintain a minimum composite utilization rate, as defined, of over 70% at each quarter end. At June 30, 2010, the composite utilization rate was 72%.
44
Table of Contents
The average value of the Australian dollar against the U.S. dollar strengthened during FY 2010 as compared to FY 2009. The average currency exchange rate of one Australian dollar during FY 2009 was $0.74803 U.S. dollar compared to $0.88219 U.S. dollar during FY 2010. This fluctuation in foreign currency exchange rates resulted in an increase to our total revenues at Royal Wolf of $14.1 million in FY 2010 when compared to FY 2009.
Cost of Sales. Cost of sales (which is the cost related to our sales revenues only and exclusive of the line items discussed below) increased by a net $3.0 million to $61.4 million during FY 2010 from $58.4 million during FY 2009, which was not proportionate with the increase in sales of $3.7 million. Our gross profit percentage from sales revenues was 22% during FY 2010, which deteriorated slightly from 23% in FY 2009, but did receive the benefit of a favorable foreign currency exchange rate effect on the greater proportion of sales in the Asia-Pacific area. Otherwise there would have been a greater deterioration in FY 2010 because of the downward pressures on our margins in the current economic environment.
Direct Costs of Leasing Operations and Selling and General Expenses. Direct costs of leasing operations (which excludes depreciation and amortization) and selling and general expenses increased by $7.1 million during FY 2010 to $64.1 million from $57.0 million during FY 2009. This increase included $7.4 million incurred at Pac-Van during the quarter ended September 30, 2009, to which there was no comparable cost in the quarter ended September 30, 2008 of the prior year since Pac-Van was not acquired until October 1, 2008. As a percentage of revenues, these operating expenses increased to 41% in FY 2010 from 39% in FY 2009, reflecting the foreign exchange effect of the stronger Australian dollar against the U.S. dollar. On an absolute basis, excluding the $7.4 million incurred at Pac-Van during the quarter ended September 30, 2009, the net decrease of $0.3 million was primarily due to our cost-cutting measures implemented during the second half of FY 2009. This cost cutting involved: (1) salaries and related payroll costs as a result of staff reductions and lower bonuses, (2) less discretionary spending and (3) better control of our professional costs.
In general, Pac-Van’s operating expenses as a percentage of revenues are higher than Royal Wolf’s percentage as: (1) Royal Wolf’s mix of FY 2010 sales to leasing revenue at 60% is higher than the 35% at Pac-Van, (2) Pac-Van has invested in an office modular fleet which is a lower margin product line; and (3) Pac-Van has less density in its retail markets.
Impairment of Goodwill. In the fourth quarter of FY2010 we recognized a non-cash impairment charge of $7.6 million to the goodwill recorded in the Pac-Van acquisition. Reference is made to Note 2 of Notes to Consolidated Financial Statements for further discussion regarding goodwill.
Depreciation and Amortization. Depreciation and amortization increased by $2.6 million to $19.6 million during FY 2010 from $17.0 million during FY 2009. The increase was primarily due to adjustments to fixed assets and identifiable intangible assets as a result of the Pac-Van acquisition, the effect of net capital expenditures since June 30, 2009 and the translation effect of the stronger Australian dollar in FY 2010 versus FY 2009. Depreciation and amortization at Pac-Van during the quarter ended September 30, 2009 totaled $1.4 million. In addition, depreciation and amortization includes impairment charges to certain intangible assets recorded in the Pac-Van acquisition of $0.5 million in FY 2010 and $0.7 million in FY 2009. Reference is made to Note 2 of Notes to Consolidated Financial Statements for further discussion regarding intangible assets.
Interest Expense. Interest expense of $16.0 million in FY 2010 was $0.2 million lower than the $16.2 million in FY 2009. This was due primarily to an overall $1.0 million interest reduction (including foreign translation effect) at Royal Wolf, caused by a lower effective interest rate and an unrealized gain on interest rate swap and option contracts totaling $0.2 million in FY 2010 versus an unrealized loss of $2.1 million in FY 2009. Royal Wolf’s weighted-average interest rate (without the effect of the interest rate swap and option contracts) was 10.3% in FY 2010, as compared to 10.9% in FY 2009. Two small acquisitions in FY 2009 and capital expenditure requirements for FY 2010 and FY 2009 in the Asia-Pacific area were funded primarily by borrowings under the senior credit facility with Australia and New Zealand Banking Group Limited (“ANZ”). The Pac-Van acquisition, another small acquisition in FY 2009 and capital requirements for FY 2010 and FY 2009 in the U.S. were funded principally with the assumption of and borrowings under the BOA senior credit facility and the senior subordinated secured note payable to SPV Capital Funding, L.L.C. (“SPV”). Interest expense at Pac-Van, with a weighted-average rate of 5.5%, totaled $5.2 million in FY 2010 (of which $1.3 million was incurred in the quarter ended September 30, 2009); as compared to 7.0% in FY 2009, including the quarter prior to our acquisition of Pac-Van.
Foreign Currency Exchange. We have certain U.S. dollar-denominated debt at Royal Wolf, including intercompany borrowings, which are remeasured at each financial reporting date with the impact of the remeasurement being recorded in our consolidated statements of operations. Unrealized gains and losses resulting from such remeasurement due to changes in the Australian exchange rate to the U.S. dollar could have a significant impact in our reported results of operations, as well as any realized gains and losses from the payments on such U.S. dollar-denominated debt and intercompany borrowings. As noted above, the average value of the U.S. dollar against the Australian dollar weakened during FY 2010 as compared to FY 2009 and from June 30, 2009 to June 30, 2010. The currency exchange rate of one Australian dollar at June 30, 2009 was $0.8048 U.S. dollar compared to $0.8567 U.S. dollar at June 30, 2010. In FY 2010, net unrealized and realized foreign exchange gains totaled $0.6 million and $0.5 million, respectively, and net unrealized gains on forward currency exchange contracts totaled $1.0 million. In FY 2009, net unrealized foreign exchange losses totaled $6.6 million and realized exchange losses totaled $2.8 million; primarily because of a realized exchange loss of $2.8 million as
45
Table of Contents
a result of Royal Wolf’s repayment of intercompany advances totaling $21.5 million in September 2008. We advanced $20.0 million of the proceeds received from our warrant exercise program in May 2008 to Royal Wolf for the temporary reduction of long-term borrowings prior to the ultimate use of these proceeds in the acquisition of Pac-Van on October 1, 2008. Net unrealized gains on forward currency exchange contracts totaled $0.2 million in FY 2009.
Income Taxes. Our effective income tax benefit rate decreased to 12.3% during FY 2010 from the FY 2009 effective rate of 39.3% rate, primarily because of the non-deductibility charge for U.S. federal income tax purposes of the goodwill impairment charge and a portion of the depreciation and amortization on the fixed and intangible assets recorded in the Pac-Van acquisition, offset somewhat by the favorable income tax impact of the amortization of goodwill acquired in acquisitions made in the Asia-Pacific area, which is deductible for U.S. income tax reporting purposes. We are now required to file tax returns in multiple U.S. states as a result of the Pac-Van acquisition. Reference is made to Note 7 of Notes to the Annual Consolidated Financial Statements for further discussion regarding income taxes.
Noncontrolling Interest. Noncontrolling interest, which represents Bison Capital’s 13.8% interest in Royal Wolf, was a charge of $2.3 million in FY 2010, as compared to a benefit of $3.0 million in FY 2009. As discussed in Note 10 of Notes to the Annual Consolidated Financial Statements, we commenced accreting the redemption value of the Bison Capital put option over the period from July 1, 2009 through June 30, 2011, which resulted in a charge to noncontrolling interest in FY 2010. In FY 2009, the benefit was due to the substantial net loss incurred at Royal Wolf in FY 2009; primarily as a result of the unrealized losses on foreign exchange and interest rate swap an option contracts discussed above.
Net Income Attributable to Common Stockholders. We had a net loss attributable to common stockholders of $11.4 million during FY 2010, as compared to a net loss of $3.8 million during FY 2009, primarily as a result of the impairment of goodwill and the accretion of the Bison put option; offset somewhat by the operating profit from Pac-Van in the quarter ended September 30, 2009, the favorable impact of the foreign exchange and forward currency exchange contract gains and reduced interest expense in FY 2010 versus FY 2009.
Measures not in Accordance with Generally Accepted Accounting Principles in the United States (“U.S. GAAP”)
Earnings before interest, income taxes, impairment, depreciation and amortization and other non-operating costs and income (“EBITDA”) and adjusted EBITDA are supplemental measures of our performance that are not required by, or presented in accordance with U.S. GAAP. These measures are not measurements of our financial performance under U.S. GAAP and should not be considered as alternatives to net income, income from operations or any other performance measures derived in accordance with U.S. GAAP or as an alternative to cash flow from operating, investing or financing activities as a measure of liquidity.
Adjusted EBITDA is a non-U.S. GAAP measure. We calculate adjusted EBITDA to eliminate the impact of certain items we do not consider to be indicative of the performance of our ongoing operations. You are encouraged to evaluate each adjustment and whether you consider each to be appropriate. In addition, in evaluating adjusted EBITDA, you should be aware that in the future, we may incur expenses similar to the adjustments in the presentation of adjusted EBITDA. Our presentation of adjusted EBITDA should not be construed as an inference that our future results will be unaffected by unusual or non-recurring items. We present adjusted EBITDA because we consider it to be an important supplemental measure of our performance and because we believe it is frequently used by securities analysts, investors and other interested parties in the evaluation of companies in our industry, many of which present EBITDA and a form of our adjusted EBITDA when reporting their results. Adjusted EBITDA has limitations as an analytical tool, and should not be considered in isolation, or as a substitute for analysis of our results as reported under U.S. GAAP. Because of these limitations, adjusted EBITDA should not be considered as a measure of discretionary cash available to us to invest in the growth of our business or to reduce our indebtedness. We compensate for these limitations by relying primarily on our U.S. GAAP results and using adjusted EBITDA only supplementally. The following table shows our adjusted EBITDA and the reconciliation from net income (loss) (in thousands):
| Quarter Ended March 31, | Nine Months Ended March 31, | |||||||||||||||
| 2010 | 2011 | 2010 | 2011 | |||||||||||||
| Net income (loss) |
$ | (203 | ) | $ | (196 | ) | $ | (116 | ) | $ | 2,341 | |||||
| Add (deduct) — |
||||||||||||||||
| Provision (benefit) for income taxes |
(116 | ) | (116 | ) | (66 | ) | 1,425 | |||||||||
| Foreign currency exchange (gain) loss and other |
(578 | ) | (108 | ) | (3,716 | ) | (4,573 | ) | ||||||||
| Interest expense |
3,932 | 4,822 | 11,771 | 13,454 | ||||||||||||
| Interest income |
(56 | ) | (124 | ) | (178 | ) | (354 | ) | ||||||||
| Depreciation and amortization |
4,578 | 4,720 | 14,929 | 14,252 | ||||||||||||
| Share-based compensation expense |
199 | 212 | 615 | 581 | ||||||||||||
|
|
|
|
|
|
|
|
|
|||||||||
| Adjusted EBITDA |
$ | 7,756 | $ | 9,210 | $ | 23,239 | $ | 27,126 | ||||||||
|
|
|
|
|
|
|
|
|
|||||||||
46
Table of Contents
| Year Ended June 30, | ||||||||
| 2009 | 2010 | |||||||
| Net loss |
$ | (6,745 | ) | $ | (8,956 | ) | ||
| Add — |
||||||||
| Provision (benefit) for income taxes |
(4,374 | ) | (1,261 | ) | ||||
| Foreign currency exchange (gain) loss and other |
9,312 | (1,948 | ) | |||||
| Interest expense |
16,161 | 15,974 | ||||||
| Interest income |
(296 | ) | (234 | ) | ||||
| Depreciation and amortization |
17,045 | 19,619 | ||||||
| Impairment of goodwill |
— | 7,633 | ||||||
| Share-based compensation expense |
902 | 629 | ||||||
|
|
|
|
|
|||||
| Adjusted EBITDA |
$ | 32,005 | $ | 31,456 | ||||
|
|
|
|
|
|||||
Our business is capital intensive, so from an operating level we focus primarily on EBITDA and adjusted EBITDA to measure our results. These measures provide us with a means to track internally generated cash from which we can fund our interest expense and fleet growth objectives. In managing our business, we regularly compare our adjusted EBITDA margins on a monthly basis. As capital is invested in our established branch locations, we achieve higher adjusted EBITDA margins on that capital than we achieve on capital invested to establish a new branch (or CSC), because our fixed costs are already in place in connection with the established branches. The fixed costs are those associated with yard and delivery equipment, as well as advertising, sales, marketing and office expenses. With a new market or branch, we must first fund and absorb the start-up costs for setting up the new branch facility, hiring and developing the management and sales team and developing our marketing and advertising programs. A new branch will have low adjusted EBITDA margins in its early years until the number of units on rent increases. Because of our higher operating margins on incremental lease revenue, which we realize on a branch-by-branch basis, when the branch achieves leasing revenues sufficient to cover the branch’s fixed costs, leasing revenues in excess of the break-even amount produces large increases in profitability. Conversely, absent significant growth in leasing revenues, the adjusted EBITDA margin at a branch will remain relatively flat on a period by period comparative basis.
Liquidity and Financial Condition
Each of our two operating units, Royal Wolf and Pac Van, fund their operations substantially through secured bank credit facilities that require compliance with various covenants. These covenants require them to, among other things, maintain certain levels of interest coverage, EBITDA (as defined), utilization rate and overall leverage. In addition, we have certain obligations and subordinated notes payable to Bison Capital (with our purchase of Royal Wolf) and a subordinated note payable by GFN to Laminar Direct Capital, L.L.C. (“Laminar”), that was issued in connection with the refinancing at Pac-Van in YTD FY 2011 (see below). We also have a $1.0 million credit facility with Union Bank at GFN under which no borrowings were outstanding as of March 31, 2011.
The economic downturn in the United States, particularly in the construction –related industries (where Pac-Van has currently over 30% of its business and historically has had over 40%), and, until recently, the global economy in general, have had an adverse impact on the Company’s operating results. To offset this adverse effect, we undertook cost-reduction and other measures to reduce our indebtedness and continue complying with the financial loan covenants of our senior lenders. In addition, on June 25, 2010, we completed a rights offering for the issuance and sale of units at $1.50 each (with each unit consisting of one share of GFN common stock and a three-year warrant to purchase 0.5 additional shares of GFN common stock at an exercise price of $4.00 per share). We utilized $4,800,000 of the approximately $5,900,000 net proceeds from the rights offering in the refinancing at Pac-Van in YTD FY 2011 (see below).
Prior to July 16, 2010, Pac-Van had a senior credit facility, as amended, with a syndicate of four financial institutions led by Bank of America, N.A. (“BOA”), as administrative and collateral agent, and a $25,000,000 senior subordinated secured note payable to SPV Capital Funding, L.L.C. (“SPV”). On July 16, 2010, we entered into several agreements relating to: (a) a new $85,000,000 senior secured revolving credit facility at Pac-Van with a syndicate led by PNC Bank, National Association (“PNC”) and including Wells Fargo Bank, National Association and Union Bank (the “PNC Credit Facility”); and (b) a new $15,000,000 senior subordinated note with Laminar issued by GFN (the “Laminar Note”). Borrowings under the PNC Credit Facility and proceeds from both the issuance of the Laminar Note and our rights offering (see above) were used to prepay in full all borrowings under the BOA credit facility and the $25,000,000 senior subordinated secured note payable to SPV. The PNC Credit Facility matures on January 16, 2013 and the Laminar Note matures on July 16, 2013.
47
Table of Contents
At March 31, 2011, we were, among other things, not in compliance with the senior leverage ratio financial covenant under the PNC Credit Facility. The senior lenders have amended the PNC Credit Facility to waive this covenant noncompliance at the March 31, 2011 measurement date and to require a cash equity infusion of not less than $5,000,000 by July 31, 2011. This cash equity infusion was satisfied with the completion of the Royal Wolf initial public offering discussed below.
As of March 31, 2011, our required principal and other obligations payments (including Bison Capital’s put option exercisable in July 2011) for the twelve months ending March 31, 2012 and the subsequent three twelve-month periods are as follows (in thousands):
| Twelve Months Ending March 31, | ||||||||||||||||
| 2012 | 2013 | 2014 | 2015 | |||||||||||||
| ANZ Credit Facility (a) |
$ | 18,339 | $ | 68,854 | $ | 748 | $ | 320 | ||||||||
| Bison Capital Subordinated Notes |
5,500 | 16,356 | — | — | ||||||||||||
| Bison Capital Put Option |
15,165 | — | — | — | ||||||||||||
| PNC Credit Facility (b) |
— | 68,546 | — | — | ||||||||||||
| Laminar Note (c) |
— | — | 15,000 | — | ||||||||||||
| Other |
817 | 496 | 731 | 48 | ||||||||||||
|
|
|
|
|
|
|
|
|
|||||||||
| $ | 39,821 | $ | 154,252 | $ | 16,479 | $ | 368 | |||||||||
|
|
|
|
|
|
|
|
|
|||||||||
| (a) | Reflects the overdraft facilities totaling $5,302 as due within the next twelve months. These should continually roll over and would be fully repaid at the maturity of the ANZ credit facility in September 2012. |
| (b) | Scheduled to mature in January 2013. |
| (c) | Scheduled to mature in July 2013. |
In the foreseeable future, we have two principal objectives with respect to our liquidity:
1. Reduce overall senior and other debt leverage at Pac-Van to meet loan covenant requirements by minimizing capital and other expenditures and using operating cash flow to pay interest and outstanding borrowings.
2. Generate sufficient capital, either through operations or external sources, including debt or equity, to (a) meet required principal and other obligations payments and (b) procure inventory and lease fleet to meet the increasing business in the Asia-Pacific area.
On April 11, 2011, we announced that Royal Wolf is considering a proposal to undertake an initial public offering in Australia and apply for listing on the Australian Securities Exchange (“Australian IPO”). In May 2011, Royal Wolf completed the Australian IPO which raised gross proceeds of A$91.5 million from the issuance of 50 million new ordinary shares. Royal Wolf used a portion of the net proceeds of the offering to prepay in full $22.3 million of Bison Capital subordinated notes and to reduce borrowings under its senior credit facility, and GFN used a portion of the net proceeds from the offering to satisfy the Bison Capital put option, to reduce borrowings under the senior credit facility of Pac-Van and the remaining amount of the net proceeds was used for general working capital purposes. At the completion of the offering, GFN still owned a majority of the ordinary shares of Royal Wolf Holdings.
We currently do not pay a dividend on our common stock and do not intend on doing so in the foreseeable future.
Cash Flow for YTD FY 2011 Compared to YTD FY 2010
Our leasing business is capital intensive, and we acquire leasing assets before they generate revenues, cash flow and earnings. These leasing assets have long useful lives and require relatively minimal maintenance expenditures. Most of the capital we deploy into our leasing business historically has been used to expand our operations geographically, to increase the number of units available for lease at our retail locations and to add to the breadth of our product mix. Our operations have generated annual cash flow that exceeds our reported earnings, which would include, even in profitable periods, the deferral of income taxes caused by accelerated depreciation that is used for tax accounting.
48
Table of Contents
As we discussed above, our principal source of capital for operations consists of funds available from the senior secured credit facility with ANZ and the PNC Credit Facility. We also finance a smaller portion of capital requirements through finance leases and lease-purchase contracts, have a $1.0 million line of credit with Union Bank and have outstanding senior subordinated notes with Bison Capital and SPV. Supplemental information pertaining to our combined sources and uses of cash is presented in the table below (in thousands):
| Nine Months Ended March 31, | ||||||||
| 2010 | 2011 | |||||||
| Net cash provided by operating activities |
$ | 18,762 | $ | 21,803 | ||||
|
|
|
|
|
|||||
| Net cash provided (used ) by investing activities |
$ | 1,058 | $ | (18,665 | ) | |||
|
|
|
|
|
|||||
| Net cash used by financing activities |
$ | (21,951 | ) | $ | (6,796 | ) | ||
|
|
|
|
|
|||||
Operating activities. Our operations provided net cash flow of $21.8 million during YTD FY 2011, an increase of $3.0 million from the $18.8 million provided during YTD FY 2010. This was primarily because net income increased to $2.3 million in YTD FY 2011 from a net loss of $0.1 million in YTD FY 2010; offset somewhat by cash flow from the management of operating assets and liabilities decreasing by $1.2 million in YTD FY 2011 from YTD FY 2010. In both YTD FY 2011 and YTD FY 2010, operating cash flow was enhanced by non-cash adjustments of depreciation and amortization on fixed and intangible assets of $14.3 million and $14.9 million; and was offset somewhat by reductions of unrealized foreign exchange gains totaling $4.5 million and $2.6 million, respectively. In addition, during both periods, operating cash flows were reduced by gains on the sales of lease fleet totaling $3.9 million in YTD FY 2011 and $5.6 million in YTD FY 2010. Historically, our cash provided by operating activities is also enhanced by the deferral of most income taxes due to the rapid tax depreciation rate of our assets and our federal and state net operating loss carryforwards.
Investing Activities. Net cash used by investing activities was $18.7 million during YTD FY 2011, as compared to $1.1 million provided during YTD FY 2010. During YTD FY 201, purchases of property, plant and equipment, or rolling stock, were approximately $2.6 million in YTD FY 2011 and $1.4 million in YTD FY 2010; and net capital expenditures of lease fleet (purchases, net of proceeds from sales of lease fleet) were $15.3 million in YTD FY 2011 and a negative $2.4 million in YTD FY 2010. We have increased our lease fleet investing in the Asia-Pacific area during YTD FY 2011 to meet the demands of the additional business from its improving economy. However, we continue to minimize capital expenditures in the United States and anticipate our near term investing activities domestically will be primarily focused on acquiring (a) specific types of units that are not in our fleet and are placed on-rent, (b) technology and communication improvements for our telephone and computer systems and (c) delivery equipment whereby we would derive improved customer service levels and cost savings. The amount of cash that we use during any period in investing activities is almost entirely within management’s discretion and, other than a preferred supply agreement which requires us to purchase yearly up to 5,000 containers, if offered to us, and the put option pertaining to Bison Capital’s minority interest of 13.8% in GFN U.S. (see Note 8 of Notes to Condensed Consolidated Financial Statements), we have no significant long-term contracts or other arrangements pursuant to which we may be required to purchase at a certain price or a minimum amount of goods or services.
Financing Activities. Net cash used by financing activities was $6.8 million during YTD FY 2011, as compared to $22.0 million provided during YTD FY 2010. In YTD FY 2011, we acquired through Pac-Van, in two separate transactions, the business of Advanced Mobile Storage for a total of $0.9 million in cash. We also reduced our outstanding borrowings in YTD FY 2011 by $6.2 million, as compared to $21.7 million in YTD FY 2010, and incurred deferred financing costs of $1.3 million during the refinancing at Pac-Van in July 2010 (see Note 4 of Notes to the Unaudited Interim Condensed Consolidated Financial Statements). These investing uses in YTD FY 2011 were offset somewhat by net proceeds received on capital leasing activities of $0.9 million. Since the second half of our fiscal year ended June 30, 2009, reducing the overall senior and other debt leverage, particularly in the United States, has been a principal objective.
Cash Flow for FY 2010 Compared to FY 2009
Our leasing business is capital intensive, and we acquire leasing assets before they generate revenues, cash flow and earnings. These leasing assets have very long useful lives and require relatively minimal maintenance expenditures. Most of the capital we deploy into our leasing business historically has been used to expand our operations geographically, to increase the number of units available for lease at our retail locations and to add to our breadth of product mix. Our operations have generated annual cash flow that exceeds our reported earnings, which would include, even in profitable periods, the deferral of income taxes caused by accelerated depreciation that is used for tax accounting.
49
Table of Contents
As we discussed above, during FY 2010 our principal sources of capital consisted of funds available from the senior secured credit facilities at each of our operating units. We also have a $1.0 million line of credit with Union Bank and have outstanding senior subordinated notes. In addition, during FY 2010, we completed a rights offering that resulted in net proceeds of $5.8 million. Supplemental information pertaining to our combined sources and uses of cash is presented in the table below (in thousands):
| Year Ended June 30, | ||||||||
| 2009 | 2010 | |||||||
| Net cash provided by operating activities |
$ | 23,332 | $ | 23,818 | ||||
|
|
|
|
|
|||||
| Net cash used by investing activities |
$ | (38,793 | ) | $ | (6,487 | ) | ||
|
|
|
|
|
|||||
| Net cash provided (used) by financing activities |
$ | 17,831 | $ | (14,839 | ) | |||
|
|
|
|
|
|||||
Operating activities. Our operations provided net cash flow of $23.8 million during FY 2010, as compared to $23.3 million during FY 2009. The increase in operating cash flows of $0.5 million in FY 2010 from FY 2009 was primarily due to non-cash adjustments for: (i) the impairment of goodwill of $7.6 million in FY 2010, (ii) depreciation and amortization of $19.6 million in FY 2010 versus $17.0 million in FY 2009 and (iii) the additional benefit in deferred income taxes of $3.9 million in FY 2010 versus FY 2009. Cash provided by operating activities is typically enhanced by the deferral of most income taxes due to the rapid tax depreciation rate of our assets and our federal and state net operating loss carryforwards. At June 30, 2010 we had a net deferred tax liability of $13.4 million. Reference is made to Note 7 of Notes to Consolidated Financial Statements for further discussion regarding income taxes.
These increases were substantially offset by (1) a greater net loss of $9.0 million in FY 2010 versus $6.7 million in FY 2009, (2) non-cash adjustments for: (i) unrealized foreign exchange gains of $0.6 million in FY 2010 versus an unrealized loss of $6.6 million in FY 2009, (ii) unrealized gains on interest rate swaps and options of $0.2 million in FY 2010 versus an unrealized loss of $2.1 million in FY 2009, and (iii) unrealized gains on forward exchange contracts of $1.0 million in FY 2010 versus $0.2 million in FY 2009, and (3) management of cash flows from operating assets and liabilities of $6.3 million in FY 2010 versus $7.2 million in FY 2009.
Investing Activities. Net cash used by investing activities was $6.5 million for FY 2010, as compared to $38.8 million for FY 2009. In FY 2009, we used $21.0 million to acquire Pac-Van and to complete three other small acquisitions. Purchases of property, plant and equipment, or rolling stock, were reduced to approximately $2.3 million in FY 2010 from $3.5 million in FY 2009, and purchases of lease fleet declined significantly from $14.3 million in FY 2009 to $4.3 million in FY 2010; despite the acquisition of Pac-Van in the first quarter of FY 2009 and its capital requirements. In the current economic environment, we are minimizing capital expenditures to reduce our overall leverage and anticipate our near term investing activities will be primarily focused on acquiring (a) specific types of units that are not in our fleet and are placed on-rent, (b) technology and communication improvements for our telephone and computer systems and (c) delivery equipment whereby we would derive improved customer service levels and cost savings. The amount of cash that we use during any period in investing activities is almost entirely within management’s discretion. Other than a preferred supply agreement, which requires us to purchase up to 5,000 containers if offered to us, and the put and call options pertaining to Bison Capital’s minority interest of 13.8% in GFN U.S., we have no significant long-term contracts or other arrangements pursuant to which we may be required to purchase at a certain price or a minimum amount of goods or services. Reference is made to Note 10 of Notes to Condensed Consolidated Financial Statements for a further discussion of our commitments and contingencies.
Financing Activities. Net cash used by financing activities was $14.8 million for FY 2010, as compared to $17.8 million provided in FY 2009. During the second half of FY 2009, we made debt reduction a principal objective. In FY 2010, we reduced our outstanding borrowings by $20.3 million, as compared to borrowing $16.4 million in FY 2009. In FY 2010, we completed a rights offering that resulted in net proceeds of $5.8 million, $4.8 million of which was used in the Pac-Van refinancing subsequent to June 30, 2010. Reference is made to Note 13 of Notes to Annual Consolidated Financial Statements for a further discussion of the Pac-Van refinancing. Proceeds from our capital issuances and net borrowings were used together with cash flow generated from operations to primarily fund the acquisition of Pac-Van, as well as three smaller acquisitions and the expansion of our lease fleet, during FY 2009.
50
Table of Contents
Asset Management
Receivables and inventories (including foreign translation effect) were $27.4 million and $20.0 million at March 31, 2011 and $27.4 million and $19.1 million at June 30, 2010, respectively. Inventory levels have increased at March 31, 2011 from June 30, 2010, due primarily to the improving economy in the Asia-Pacific area; but effective asset management remains a significant focus, as we strive to continue to apply appropriate credit and collection controls and reduce inventory levels to maintain and enhance cash flow and profitability. At March 31, 2011, days sales outstanding (“DSO”) in trade receivables were 41 days and 63 days for Royal Wolf and Pac-Van, as compared to 43 days and 53 days at June 30, 2010, respectively. The lengthening of DSO at Pac-Van was primarily due to a greater proportion of unbilled receivables for in-process projects at March 31, 2011 when compared to June 30, 2011.
The net book value of our total lease fleet increased (including foreign translation effect) from $188.4 million at June 30, 2010 to $213.9 million at March 31, 2011. At March 31, 2011, we had 40,750 units (16,678 units in retail operations in Australia, 7,455 units in national account group operations in Australia, 5,544 units in New Zealand, which are considered retail; and 11,073 units in the United States) in our lease fleet, as compared 37,862 units (15,945 units in retail operations in Australia, 6,444 units in national account group operations in Australia, 4,538 units in New Zealand, which are considered retail; and 10,935 units in the United States) at June 30, 2010. At those dates, 33,118 units (13,902 units in retail operations in Australia, 5,767 units in national account group operations in Australia, 5,166 units in New Zealand, which are considered retail; and 8,283 units in the United States) and 29,735 units (12,997 units in retail operations in Australia, 4,875 units in national account group operations in Australia, 3,954 units in New Zealand, which are considered retail; and 7,909 units in the United States) were on lease, respectively.
In the United States, the lease fleet was comprised of 3,966 containers, 6,119 mobile offices and 988 modular units at March 31, 2011; and 3,800 containers, 6,144 mobile offices and 991 modular units at June 30, 2010. At those dates, in the United States, units on lease were comprised of 3,516 containers, 4,011 mobile offices and 756 modular units; and 3,205 containers, 3,973 mobile offices and 731 modular units, respectively.
Off-Balance Sheet Arrangements
We do not maintain any off-balance sheet transactions, arrangements, obligations or other relationships with unconsolidated entities or others that are reasonably likely to have a material current or future effect on our financial condition, changes in financial condition, revenues or expenses, results of operations, liquidity, capital expenditures or capital resources.
Seasonality
Although demand from certain customer segments can be seasonal, our operations as a whole are not seasonal to any significant extent. We experience a reduction in sales volumes at Royal Wolf during Australia’s summer holiday break from mid-December to the end of January, followed by February being a short working day month. However, this reduction in sales typically is counterbalanced by the increased lease revenues derived from the removals or moving and storage industry, which experiences its seasonal peak of personnel relocations during this same summer holiday break. Demand from some of Pac-Van’s customers can be seasonal, such as in the construction industry, which tends to increase leasing activity in the first and fourth quarters; while customers in the retail industry tend to lease more units in the second quarter.
Impact of Inflation
We believe that inflation has not had a material effect on our business. However, during periods of rising prices and, in particular when the prices increase rapidly or to levels significantly higher than normal, we may incur significant increases in our operating costs and may not be able to pass price increases through to our customers in a timely manner, which could harm our future results of operations.
Critical Accounting Estimates
Our discussion and analysis of our financial condition and results of operations are based upon our consolidated financial statements, which have been prepared in accordance with U.S. GAAP. The preparation of these financial statements requires us to make estimates and judgments that affect the reported amounts of assets, liabilities, revenues and expenses. On an ongoing basis, we re-evaluate all of our estimates. We base our estimates on historical experience and on various other assumptions that are believed to be reasonable under the circumstances, the results of which form the basis for making judgments about the carrying values of assets and liabilities that are not readily apparent from other sources. Actual results may materially differ from these estimates under different assumptions or conditions as additional information becomes available in future periods. We believe the following are the more significant judgments and estimates used in the preparation of our consolidated financial statements.
51
Table of Contents
We are required to estimate the collectability of our trade receivables. Accordingly, we maintain allowances for doubtful accounts for estimated losses that may result from the inability of our customers to make required payments. On a recurring basis, we evaluate a variety of factors in assessing the ultimate realization of these receivables, including the current credit-worthiness of our customers, days outstanding trends, a review of historical collection results and a review of specific past due receivables. If the financial conditions of our customers were to deteriorate, resulting in an impairment of their ability to make payments, additional allowances may be required, resulting in decreased net income. To date, uncollectible accounts have been within the range of our expectations.
We lease and sell storage container products, modular buildings and mobile offices to our customers. Leases to customers generally qualify as operating leases unless there is a bargain purchase option at the end of the lease term. Revenue is recognized as earned in accordance with the lease terms established by the lease agreements and when collectability is reasonably assured. Revenue is recognized as earned in accordance with the lease terms established by the lease agreements and when collectability is reasonably assured. Revenue from sales of equipment is recognized upon delivery and when collectability is reasonably assured.
We have a fleet of storage containers, mobile offices, modular buildings and steps that we lease to customers under operating lease agreements with varying terms. The lease fleet (or lease or rental equipment) is recorded at cost and depreciated on the straight-line basis over the estimated useful life (5 - 20 years), after the date the units are put in service, and are depreciated down to their estimated residual values (up to 70% of cost). In our opinion, estimated residual values are at or below net realizable values. We periodically review these depreciation policies in light of various factors, including the practices of the larger competitors in the industry, and our own historical experience.
For the issuances of stock options, we follow the fair value provisions of Financial Accounting Standards Board (“FASB”) Accounting Standards Codification (“ASC”) Topic 718, Compensation — Stock Compensation. FASB ASC Topic 718 requires recognition of employee share-based compensation expense in the statements of income over the vesting period based on the fair value of the stock option at the grant date. The pricing model we use for determining fair values of the purchase option is the Black-Scholes Pricing Model. Valuations derived from this model are subject to ongoing internal and external verification and review. The model uses market-sourced inputs such as interest rates, market prices and volatilities. Selection of these inputs involves management’s judgment and may impact net income. In particular, prior to July 1, 2009, we used volatility rates based upon a sample of comparable companies our industry and we now use a volatility rate based on the performance of our common stock; which yields a higher rate. In addition we use a risk-free interest rate, which is the rate on U.S. Treasury instruments, for a security with a maturity that approximates the estimated remaining expected term of the stock option.
We account for goodwill in accordance with FASB ASC Topic 350, Intangibles — Goodwill and Other. FASB ASC Topic 350 prohibits the amortization of goodwill and intangible assets with indefinite lives and requires these assets be reviewed for impairment at least annually. We operate two reportable and operating segments (Pac-Van and Royal Wolf). All of our goodwill was allocated between these two reporting units. We perform an annual impairment test on goodwill at June 30 using the two-step process required under FASB ASC Topic 350. The first step is a screen for potential impairment, while the second step measures the amount of the impairment, if any.
At June 30, 2010, we performed the first step of the two-step impairment test and compared the fair value of each reporting unit to its carrying value. In assessing the fair value of the reporting units, we considered both the market approach and the income approach. Under the market approach, the fair value of the reporting unit was determined on a weighted-average range of multiples to adjusted EBITDA. Under the income approach, the fair value of the reporting unit was based on the present value of estimated cash flows. The income approach was dependent on a number of significant management assumptions, including estimated future revenue growth rates, gross margins on sales, operating margins, capital expenditures and discount rates. Each approach was given equal weight in arriving at the fair value of the reporting unit. If the carrying value of the net assets of any reporting unit would have exceeded its fair value, a step-two impairment test would have been performed. In a step-two test, we would be required to determine the implied fair value of the goodwill and compare it to the carrying value of the goodwill. Generally, this would involve allocating the fair value of the reporting unit to the respective assets and liabilities (as if the reporting unit had been acquired in separate and individual business combination and the fair value was the price paid to acquire it) with the excess of the fair value of the reporting unit over the amounts assigned to their respective assets and liabilities being the implied fair value of goodwill. It was determined that the fair value of the Royal Wolf reporting unit exceeded the carrying values of the net assets at June 30, 2010. However, the fair value of the Pac-Van reporting unit was less than the carrying values the net assets at June 30, 2010 and, therefore, we performed a step-two impairment test for Pac-Van. In the step-two test for Pac-Van, the implied value of its goodwill was less than the carrying value of goodwill, resulting in an impairment charge of $7,633,000 at June 30, 2010. The Company had not recorded an impairment charge to goodwill prior to June 30, 2010.
52
Table of Contents
We would also consider performing impairment tests during an interim reporting period in which significant events or changes in circumstances indicate that a permanent impairment may have occurred. Some factors we consider important which could trigger such an impairment review include (1) significant underperformance relative to historical, expected or projected future operating results; (2) significant changes in the manner of our use of the acquired assets or the strategy for our overall business; (3) significant changes during the period in our market capitalization relative to net book value; and (4) significant negative industry or general economic trends. At March 31, 2011, there were no significant changes in events or circumstances that were not existing or considered since the last annual test at Royal Wolf or Pac-Van. However, if Pac-Van’s operating results worsen for the remainder of the current fiscal year, a potential step-one impairment would most likely exist again at year-end. The range of the potential impairment would vary depending on the range of valuation assumptions used and could be significant.
Intangible assets include those with indefinite (trademark and trade name), and finite (primarily customer base and lists, non-compete agreements and deferred financing costs) useful lives. Customer base and lists and non-compete agreements are amortized on the straight-line basis over the expected period of benefit which range from one to ten years. Costs to obtaining long-term financing are deferred and amortized over the term of the related debt using the straight-line method. Amortizing the deferred financing costs using the straight-line method does not produce significantly different results than that of the effective interest method. We review intangibles (those assets resulting from acquisitions) at least annually for impairment or when events or circumstances indicate these assets might be impaired. We test impairment using historical cash flows and other relevant facts and circumstances as the primary basis for its estimates of future cash flows. This process requires the use of estimates and assumptions, which are subject to a high degree of judgment.
We determined that, as a result of changes in market conditions and other factors in the U.S., an impairment charge to the customer base acquired in the Pac-Van acquisition was required to be recorded at both June 30, 2009 and June 30, 2010; and, as of June 30, 2010, to the trade name. To be more in line with the expected revenue stream of the customer base, we recorded the June 30, 2009 impairment charge of $689,000 by revising the method of amortization from a straight-line to an accelerated basis. The June 30, 2010 impairment charge to the customer base and trade name of $329,000 and $190,000, respectively, was recorded pursuant to an evaluation, which determined that the respective fair values were less than the carrying values. These impairment charges were included as a part of depreciation and amortization.
In preparing our consolidated financial statements, we recognize income taxes in each of the jurisdictions in which we operate. For each jurisdiction, we estimate the actual amount of taxes currently payable or receivable as well as deferred tax assets and liabilities attributable to temporary differences between the financial statement carrying amounts of existing assets and liabilities and their respective tax bases. Deferred income tax assets and liabilities are measured using enacted tax rates expected to apply to taxable income in the years in which these temporary differences are expected to be recovered or settled. The effect on deferred tax assets and liabilities of a change in tax rates is recognized in income in the period that includes the enactment date. A valuation allowance would be provided for those deferred tax assets for which it is more likely than not that the related benefits will not be realized. In determining the amount of the valuation allowance, we consider estimated future taxable income as well as feasible tax planning strategies in each jurisdiction. If we determine that we will not realize all or a portion of our deferred tax assets, we would increase our valuation allowance with a charge to income tax expense or offset goodwill if the deferred tax asset was acquired in a business combination. Conversely, if we determine that we will ultimately be able to realize all or a portion of the related benefits for which a valuation allowance has been provided, all or a portion of the related valuation allowance would be reduced with a credit to income tax expense except if the valuation allowance was created in conjunction with a tax asset in a business combination.
Reference is made to Note 2 of Notes to both the Unaudited Interim Condensed Consolidated Financial Statements and the Annual Consolidated Financial Statements for a further discussion of our significant accounting policies.
Impact of Recently Issued Accounting Pronouncements
Reference is made to Note 2 of Notes to both the Unaudited Interim Condensed Consolidated Financial Statements and the Annual Consolidated Financial Statements included in this prospectus for a discussion of recently issued accounting pronouncements that could potentially impact us.
Quantitative and Qualitative Disclosures about Market Risk
Market risk is the sensitivity of income to changes in interest rates, foreign exchanges and other market-driven rates or prices. Exposure to interest rates and currency risks arises in the normal course of our business and we may use derivative financial instruments to hedge exposure to fluctuations in foreign exchange rates and interest rates. We believe we have no material market risks to our operations, financial position or liquidity as a result of derivative activities, including forward-exchange contracts.
Reference is made to Note 5 of Notes to the Unaudited Interim Condensed Consolidated Financial Statements and Note 6 of the Annual Consolidated Financial Statements included in this prospectus for a discussion of financial instruments.
53
Table of Contents
DIRECTORS AND EXECUTIVE OFFICERS
The following information is provided regarding our directors and executive officers as of August 2, 2011. No family relationship exists between any director or executive officer:
| Name | Age | Position | ||||
| Ronald F. Valenta |
52 | Chief Executive Officer and Director | ||||
| Charles E. Barrantes |
59 | Executive Vice President and Chief Financial Officer | ||||
| Christopher A. Wilson |
44 | General Counsel, Vice President & Secretary | ||||
| Robert Allan |
55 | Chief Executive Officer, Royal Wolf | ||||
| Theodore Mourouzis |
48 | President, Pac-Van | ||||
| Lawrence Glascott |
77 | Chairman of the Board of Directors | ||||
| David M. Connell |
67 | Director | ||||
| Susan L. Harris |
54 | Director | ||||
| Manuel Marrero |
53 | Director | ||||
| James B. Roszak |
70 | Director | ||||
Ronald F. Valenta has served as a director and as our Chief Executive Officer since our inception and as a director of Royal Wolf Holdings since 2007. He served as our Chief Financial Officer from inception through September 2006 and as our Secretary from inception through December 2007. Mr. Valenta has been the Chairman of General Finance Group, Inc. since 2008. From 1988 to 2003 Mr. Valenta served as the President and Chief Executive Officer of Mobile Services Group, Inc., a portable storage company he founded. From 2003 to 2006 Mr. Valenta was a director of the National Portable Storage Association, a storage industry non-profit organization. From 1985 to 1989, Mr. Valenta was a Senior Vice President of Public Storage, Inc.
Charles E. Barrantes has served as our Executive Vice President and Chief Financial Officer since September 2006. Prior to joining us, Mr. Barrantes was vice president and chief financial officer for Royce Medical Company from early 2005 to its sale in late 2005. From 1999 to early 2005, he was chief financial officer of Earl Scheib, Inc., a public company that operated over 100 retail paint and body shops. Mr. Barrantes has over 25 years of experience in accounting and finance, starting with more than a decade with Arthur Andersen & Co.
Christopher A. Wilson became our General Counsel, Vice President & Secretary in December 2007. Prior to joining us, Mr. Wilson was the general counsel and assistant secretary of Mobile Services Group, Inc. from February 2002 to December 2007. Mr. Wilson practiced corporate law as an associate at Paul, Hastings, Janofsky & Walker LLP from 1998 to February 2002. Mr. Wilson graduated with a B.A. from Duke University in 1989 and a J.D. from Loyola Law School of Los Angeles in 1993.
Robert Allan has been the Chief Executive Officer of Royal Wolf since February 2006 and since September 2007 a director of Royal Wolf Holdings and one of our executive officers. Mr. Allan joined Royal Wolf in April 2004 as its Executive General Manager. From 2000 until joining Royal Wolf, he served as Group General Manager of IPS Logistics Pty Ltd, a shipping and logistics company. From 1997 until 2000, Mr. Allan was employed as a Regional Director of Triton Container International, the world’s largest lessor of marine cargo containers to the international shipping industry. Mr. Allan has more than 30 years of experience in the container leasing and logistics industries.
54
Table of Contents
Theodore Mourouzis has been President of Pac-Van, Inc. since August 2006. He previously served as its Chief Operating Officer since 1999 and as its Vice President of Finance from 1997 until 1999. Prior to his employment with Pac-Van, Mr. Mourouzis, among other things, was a controller for a 3M joint venture, served four years in management consulting with Deloitte & Touche (focusing in operations and business process consulting), and was president of a picture framing distributor and the chief financial officer of its holding company. He received his undergraduate degree from Stanford University in 1985 and a Masters of Business Administration from The Wharton School of the University of Pennsylvania in 1991.
Lawrence Glascott has been our Chairman of the Board of Directors since November 2005. Mr. Glascott has served as a director of 99¢ Only Stores since 1996 where he currently serves on its Audit, Compensation and Nominating and Corporate Governance Committees. From 1991 to 1996 he was the Vice President — Finance of Waste Management International, an environmental services company. Prior thereto, Mr. Glascott was a partner at Arthur Andersen LLP and was in charge of the Los Angeles-based Arthur Andersen LLP Enterprise Group practice for over 15 years.
David M. Connell has been a director since November 2005. In 1999 Mr. Connell founded Cornerstone Corporate Partners, LLC, a consulting and advisory firm. Prior to establishing Cornerstone Corporate Partners in 1999, Mr. Connell served as President and a member of the Board of Directors for Data Processing Resources Corporation, or DPRC, from 1992 to 1999. DPRC was a NASDAQ listed provider of information technology consulting services to Fortune 500 companies. Prior to his services with DPRC, from 1988 to 1993, Mr. Connell was engaged by Welsh, Carson, Anderson; Stowe, a New York private equity firm, to manage a group of portfolio companies. From 1990 to 1993, Mr. Connell served as Chairman and Chief Executive Officer of Specialized Mortgage Service, Inc., an information technology company serving the real estate, banking, and credit rating industries. From 1988 to 1990, he served as Chairman and Chief Executive Officer of Wold Communications, Inc., which later merged and became Keystone Communications, a leading satellite communications service provider.
Susan Harris has been a director since November 2008. Ms. Harris served as a director of Mobile Services Group, Inc. and Mobile Storage Group, Inc., portable storage companies, from May 2004 to August 2006 and from May 2002 to August 2006, respectively. Ms. Harris retired from Sun America, Inc. where she served in a variety of positions between 1985 and 2000, including Senior Vice President and General Counsel.
Manuel Marrero has been a director since November 2005. Since March 2009 Mr. Marrero has served as the Chief Executive Officer of ACAC, Inc., a company controlled by Ronald Valenta. From January 2004 to March 2009, Mr. Marrero has worked as a financial and operations management consultant with several companies, principally focused in consumer products brand management. From May 2002 until January 2004, Mr. Marrero served as the Chief Financial Officer of Mossimo, Inc., a designer and licensor of apparel and related products. From 1999 to 2001, Mr. Marrero was the Chief Operating Officer and Chief Financial Officer of Interplay Entertainment Corp., a developer, publisher and distributor of interactive entertainment software, and the Chief Financial Officer of Precision Specialty Metals, Inc. from 1996 to 1999, a light gauge conversion mill for flat rolled stainless steel and high performance alloy. He has served on the boards of Interplay OEM, Inc., Shiney Entertainment, Inc., Seed Internet Ventures, Inc., L.A. Top Producers, LLC, Friends of Rancho San Pedro and Tree People.
James B. Roszak has been a director since November 2005. Mr. Roszak has been a director of National RV Holdings, Inc. since June 2003. Mr. Roszak was employed by the Life Insurance Division of Transamerica Corporation, a financial services organization engaged in life insurance, commercial lending, leasing and real estate services, from June 1962 through his retirement as President of such division in June 1997. Mr. Roszak also served as interim Chief Executive Officer and a director of buy.com, an Internet retailer, from February 2001 through August 2001. He is a member of the Board of Trustees of Chapman University.
55
Table of Contents
Director Independence
The NASDAQ requires that a majority of the Board of Directors must be composed of “independent directors,” which is defined generally as a person other than an officer or employee of the Company or its subsidiaries or any other individual having a relationship, which, in the opinion of the Company’s Board of Directors, would interfere with the director’s exercise of independent judgment in carrying out the responsibilities of a director.
Ms. Harris and Messrs. Connell, Glascott and Roszak are “independent directors.”
Board Committees
The Board of Directors has an Audit Committee, a Compensation Committee and a Nominating and Governance Committee.
Audit Committee. The Audit Committee consists of Mr. Roszak, as Chairman, Ms. Harris and Mr. Glascott. Mr. Roszak and Mr. Glascott each qualify as an “audit committee financial expert,” as defined in the rules and regulations of the Securities and Exchange Commission. In addition, we have certified to NASDAQ that the committee has, and will continue to have, at least one member who has past employment experience in finance or accounting, requisite professional certification in accounting, or other comparable experience or background that results in the individual’s financial sophistication. Each member of the Audit Committee is an independent director under NASDAQ listing standards.
Compensation Committee. The Compensation Committee consists of Mr. Connell, as Chairman, Mr. Harris and Mr. Roszak.
The purposes of the Compensation Committee are: (i) to determine and approve the goals, objectives and compensation structure for our executive officers; (ii) to review the performance of our executive officers; and (iii) to review the Company’s management resources, succession planning and development activities.
Nominating and Governance Committee. The Nominating and Governance Committee consists of Ms. Harris, as Chairwoman, Mr. Connell and Mr. Roszak, each of whom is an independent director under NASDAQ listing standards.
The Nominating and Governance Committee is responsible for certain matters which include reviewing the size and composition of the Board of Directors, overseeing the selection of persons to be nominated to serve on our Board of Directors and maintaining and overseeing the corporate governance of the Company.
Compensation Committee Interlocks and Insider Participation
No person who served on the Compensation Committee in fiscal year 2010 was during the year or previously an officer or employee of the Company or had a relationship with the Company requiring disclosure under Item 404 of Regulation S-K. Since March 2009 Mr. Marrero has served as the Chief Executive Officer of the specialty finance companies of General Finance Group, Inc., a company controlled by Ronald Valenta. No other interlocking relationship exists between any member of the Board of Directors and any member of any other company’s board of directors or compensation committee.
56
Table of Contents
Compensation of Directors
We currently have six non-employee directors that qualify for compensation.
The following table provides information concerning the compensation of the directors for fiscal year 2010:
Director Compensation
| Name |
Fees Earned or Paid in Cash ($) |
Total ($) | ||||||
| Lawrence Glascott |
$ | 54,000 | $ | 54,000 | ||||
| David M. Connell |
50,000 | 50,000 | ||||||
| Manuel Marrero |
36,500 | 36,500 | ||||||
| James B. Roszak |
51,250 | 51,250 | ||||||
| Susan Harris |
44,000 | 44,000 | ||||||
| Ronald F. Valenta |
— | — | ||||||
In September 2009, the Compensation Committee approved a new schedule of compensation of our non-employee directors effective January 1, 2010 which, as reflected by the table below, reduced by ten percent the annual retainer payable to directors and established that if multiple committee meetings were held on the same day, the highest fee payable to a committee member for any meeting on such day would constitute the entire fee payable to such committee member for all meetings attended on a single day. These reductions do not apply to the fees payable to the committee chairs. The following table summarizes the schedule of compensation of our non-employee directors (directors who also serve as officers currently receive no additional compensation for their services as directors). In addition to the compensation set forth below, each director is also eligible for reimbursement of reasonable expenses incurred in connection with the director’s services.
| Annual Retainer—Chairman of the Board |
$ | 36,000 | ||
| Annual Retainer—Other Directors |
27,000 | |||
| Additional Annual Retainer — Audit Committee Chair |
10,000 | |||
| Additional Annual Retainer — Compensation Committee Chair |
7,500 | |||
| Additional Annual Retainer — Nominating Committee Chair |
3,000 | |||
| Board Meeting Attendance Fee—Chairman of the Board |
2,000 | |||
| Board Meeting Attendance Fee—Other Directors |
1,500 | |||
| Committee Meeting Attendance Fee |
750 | |||
| Telephonic Meeting Attendance Fee |
500 |
The annual retainers are payable in advance in semiannual increments on June 30 and December 31.
Code of Ethics
We have adopted a code of ethics that applies to all of our executive officers, directors and employees. The code of ethics codifies the business and ethical principles that govern all aspects of our business.
Conflicts of Interest
Stockholders should be aware of the following potential conflicts of interest:
| • | Our chief executive officer is not required to commit his full time to our affairs and, accordingly, he may have conflicts of interest in allocating their time among various business activities. |
| • | In the course of their other business activities, our officers and directors may become aware of investment and business opportunities that may be appropriate for presentation to our company and the other entities with which they are affiliated. Our management may have conflicts of interest in determining to which entity a particular business opportunity should be presented. |
| • | Our officers and directors may in the future become affiliated with entities, including other blank check companies, engaged in business activities similar to those in which our company intends to engage. |
57
Table of Contents
In general, officers and directors of a corporation incorporated under the laws of the State of Delaware are required to present business opportunities to a corporation if:
| • | the corporation could financially undertake the opportunity; |
| • | the opportunity is within the corporation’s line of business; and |
| • | it would not be fair to the corporation and its stockholders for the opportunity not to be brought to the attention of the corporation. |
Accordingly, as a result of multiple business affiliations, our officers and directors may have similar legal obligations relating to presenting business opportunities meeting the above-listed criteria to multiple entities. In addition, conflicts of interest may arise when our board evaluates a particular business opportunity with respect to the above-listed criteria. We cannot assure you that any of the above mentioned conflicts will be resolved in our favor.
58
Table of Contents
Summary Compensation Table
The following table contains summary compensation information of the following executive officers, or our “Named Executive Officers,” for fiscal years 2010, 2009 and the year ended June 30, 2008, or fiscal year 2008.
Summary Compensation Table
| Option | ||||||||||||||||||||||||||
| Awards | All Other | |||||||||||||||||||||||||
| Name and Principal Position |
Year | Salary | Bonus | (4) | Compensation | Total | ||||||||||||||||||||
| Ronald F. Valenta |
2010 | $ | 200,000 | $ | — | $ | — | $ | — | $ | 200,000 | |||||||||||||||
| Chief Executive Officer (6) |
2009 | 77,778 | — | — | 25,000 | 102,778 | ||||||||||||||||||||
| Charles E. Barrantes |
2010 | $ | 200,000 | $ | 50,000 | $ | 142,700 | $ | — | $ | 392,700 | |||||||||||||||
| Chief Financial Officer and |
2009 | 200,000 | 42,000 | 137,600 | 5,250 | 384,850 | ||||||||||||||||||||
| Executive Vice President (1)(5) |
2008 | 200,000 | 90,000 | 137,600 | 10,533 | 438,133 | ||||||||||||||||||||
| Christopher A. Wilson |
2010 | $ | 200,000 | $ | 50,000 | $ | 173,700 | $ | — | $ | 423,700 | |||||||||||||||
| General Counsel, Vice President and |
2009 | 200,000 | 42,000 | 168,600 | 9,598 | 420,198 | ||||||||||||||||||||
| Secretary (2)(5) |
2008 | 109,167 | 108,133 | 92,100 | 11,335 | 321,435 | ||||||||||||||||||||
| Robert Allan |
2010 | $ | 303,752 | $ | 89,954 | $ | 90,500 | $ | — | $ | 484,206 | |||||||||||||||
| Chief Executive Officer, |
2009 | 261,813 | 21,468 | 128,500 | — | 411,781 | ||||||||||||||||||||
| Royal Wolf (3) |
2008 | 313,764 | 107,575 | 71,600 | — | 492,939 | ||||||||||||||||||||
| Theodore Mourouzis President and Chief Operating Officer, |
2010 | $ | 175,049 | $ | 17,000 | $ | 62,400 | $ | 1,051 | $ | 255,500 | |||||||||||||||
| Pac-Van, Inc. (7)(8) |
2009 | 163,221 | 50,042 | 42,700 | 3,450 | 259,413 | ||||||||||||||||||||
| (1) | The employment of Mr. Barrantes commenced in September 2006. |
| (2) | The employment of Mr. Wilson commenced in December 2007. Fiscal year 2008 included a signing bonus of $70,833. |
| (3) | Mr. Allan became a Named Executive Officer in conjunction with our acquisition of Royal Wolf effective September 13, 2007. The salary reflected in this table was for the full fiscal year 2008. Australian dollar to U.S. dollar exchange rates used were 0.8567 in fiscal year 2010, 0.7480 in fiscal year 2009 and 0.8965 in fiscal year 2008. |
| (4) | The amounts shown are the amounts of compensation expense recognized by us relating to the grants of stock options, as described in FASB ASC Topic 718. For a discussion of valuation assumptions used in the calculation of these amounts, see Note 2, “ Summary of Significant Accounting Policies,” and Note 9, “Stock Option Plans,” of the Notes to the Annual Consolidated Financial Statements included in our Annual Report on Form 10-K for the year ended June 30, 2010 filed with the SEC on September 24, 2010. |
| (5) | Other compensation represents reimbursement of medical and dental insurance premiums. |
| (6) | The employment of Mr. Valenta commenced in February 2009. Other compensation represents a one-time expense allowance. |
| (7) | Mr. Mourouzis became a Named Executive Officer in conjunction with our acquisition of Pac-Van, Inc. effective October 1, 2008. Included in the bonus paid in fiscal year 2009 was $45,042, which pertained to periods prior to our acquisition of Pac-Van. |
| (8) | Other compensation represents 401(k) plan contributions by Pac-Van, Inc. |
59
Table of Contents
Plan-Based Awards
We have two compensation plans, our 2006 Stock Option Plan and our 2009 Stock Incentive Plan. Subsequent to December 2009, grants of stock options will be made only from the 2009 Stock Incentive Plan. The following table provides information concerning each grant of an award made to the Named Executive Officers in fiscal year 2010.
Option Grants in Fiscal Year 2010
| All Other | ||||||||||||||||||||
| Date of | Option Awards: | Exercise or | ||||||||||||||||||
| Approval of | Number of | Base Price of | Grant Date | |||||||||||||||||
| Grants by | Securities | Option | Fair Value of | |||||||||||||||||
| Compensation | Underlying | Awards | Option | |||||||||||||||||
| Name |
Grant Date | Committee | Options (#) | ($/Shares) | Awards ($) | |||||||||||||||
| Charles E. Barrantes |
1/26/10 | 1/26/10 | 20,000 | (1) | $ | 1.28 | $ | 19,800 | ||||||||||||
| Christopher A. Wilson |
1/26/10 | 1/26/10 | 20,000 | (1) | 1.28 | 19,800 | ||||||||||||||
| Theodore M. Mourouzis |
1/26/10 | 1/26/10 | 30,000 | (1) | 1.28 | 29,700 | ||||||||||||||
| (1) | These options vest over 20 months subject to performance conditions based on, among other things, achieving a certain EBITDA target per fiscal year 2010. |
The following table provides information concerning outstanding options as of June 30, 2010.
Outstanding Equity Awards at Fiscal Year-End
| Number of | Number of | |||||||||||||||||||
| Securities | Securities | Equity Incentive Plan | ||||||||||||||||||
| Underlying | Underlying | Awards: Number of | ||||||||||||||||||
| Unexercised | Unexercised | Securities Underlying | ||||||||||||||||||
| Options | Options | Unexercised Unearned | ||||||||||||||||||
| (#) | (#) | Options | Exercise Price | Expiration | ||||||||||||||||
| Name |
Exercisable | Unexercisable | (#) | ($/Sh) | Date | |||||||||||||||
| Charles E. Barrantes |
135,000 | 90,000 | (1) | — | $ | 7.30 | 9/11/16 | |||||||||||||
| — | 20,000 | (6) | — | 1.28 | 1/26/20 | |||||||||||||||
| Christopher A. Wilson |
90,000 | 135,000 | (2) | — | 9.05 | 12/14/17 | ||||||||||||||
| — | 20,000 | (6) | — | 1.28 | 1/26/20 | |||||||||||||||
| Robert Allan |
58,000 | 27,000 | (3) | — | 8.80 | 1/22/18 | ||||||||||||||
| — | 20,000 | (4) | 20,000 | 5.35 | 7/23/18 | |||||||||||||||
| Theodore Mourouzis |
10,000 | 100,000 | (5) | 60,000 | 6.40 | 10/1/18 | ||||||||||||||
| — | 30,000 | (6) | 30,000 | 1.28 | 1/26/20 | |||||||||||||||
| (1) | These options vest in five equal annual installments on September 11 of each of 2007, 2008, 2009, 2010 and 2011, subject to continued service with us, and have a ten-year term. |
| (2) | These options vest in five equal annual installments on December 14 of each of 2008, 2009, 2010, 2011 and 2012, subject to continued service with us, and have a ten-year term. |
| (3) | These options vest in five equal annual installments on January 22 of each of 2009, 2010, 2011, 2012 and 2013. These stock options are subject to continued service with us and have a ten-year term. |
| (4) | These options vest over 38 months subject to performance conditions based on achieving a certain EBITDA target for fiscal year 2010. These stock options are subject to continued service with us and have a ten-year term. |
| (5) | 50,000 of these options vest in five equal installments beginning October 1, 2009 and 60,000 of these options vest in varying periods over 71 months subject to performance conditions based on Pac-Van, Inc. achieving certain EBITDA targets for the fiscal years 2010 through 2013. These stock options are subject to continued service with us and hold a ten-year term. |
| (6) | These options vest over 20 months subject to performance conditions based on, among other things, achieving a certain EBITDA target for fiscal year 2010. These stock options are subject to continued service with us and hold a ten-year term. |
No Named Executive Officer exercised any stock options during fiscal year 2010.
60
Table of Contents
Employment Agreements
On February 11, 2009, we entered into an employment agreement with Ronald Valenta, under which he agreed to serve to serve as our Chief Executive Officer. Under the employment agreement, Mr. Valenta receives a base annual salary of $200,000 and is eligible to receive an annual bonus each fiscal year of up to 35% of his base salary, provided he is employed on the last day of such year. We reimburse Mr. Valenta up to $2,500 per month for a car allowance and health, dental, vision and supplemental disability premiums for Mr. Valenta and his family. Mr. Valenta is entitled to a severance payment equal to one year’s salary if his employment is terminated without cause, as defined in the employment agreement.
On September 11, 2006, we entered into an employment agreement with Charles E. Barrantes, under which he agreed to serve as our Executive Vice President and Chief Financial Officer. Under the employment agreement, Mr. Barrantes receives a base annual salary of $200,000 and is eligible to receive an annual bonus each fiscal year of up to 35% of his base salary, provided he is employed on the last day of such year. We reimburse Mr. Barrantes up to $750 per month for health, dental, vision and supplemental disability premiums for himself and his family. Mr. Barrantes is entitled to participate on the same basis in all offered benefits or programs as any other employee. On June 30, 2009, we entered into an amended and restated employment agreement with Mr. Barrantes that provides that Mr. Barrantes is entitled to a severance payment equal to one year’s salary if his employment is terminated without cause, as defined in the employment agreement.
On December 14, 2007, we entered into an employment agreement with Christopher A. Wilson, under which he agreed to serve as our General Counsel, Vice President and Secretary. Under the employment agreement, Mr. Wilson receives a base annual salary of $200,000, and is eligible to receive an annual bonus each fiscal year of up to 35% of his base salary, provided he is employed on the last day of such year. Mr. Wilson is entitled to a severance payment equal to one year’s salary if his employment is terminated without cause, as defined in the employment agreement. We reimburse Mr. Wilson for up to $1,150 per month for health, dental, vision and supplemental disability premiums for himself and his family. Mr. Wilson is entitled to participate on the same basis in all offered benefits or programs as any other employee.
Mr. Valenta, at his recommendation, has not been granted stock options. Mr. Barrantes and Mr. Wilson each received options to purchase an aggregate of 225,000 shares of common stock under our 2006 Stock Option Plan as of the respective dates of commencement of their employment. Mr. Barrantes’ and Mr. Wilson’s stock options have an exercise price of $7.30 and $9.05 per share, respectively (the closing sales price of the common stock on the date of grant), vest in five equal annual installments and expire ten years from the date of grant.
The employment agreements of Mr. Valenta, Mr. Barrantes and Mr. Wilson will terminate upon the date of their death or in the event of a physical or mental disability that renders either of them unable to perform his duties for 60 consecutive days or 120 days in any twelve-month period. Mr. Valenta, Mr. Barrantes and Mr. Wilson may terminate their respective employment agreements at any time upon 30 days notice to us, and we may terminate these agreements at any time upon notice to Mr. Valenta, Mr. Barrantes or Mr. Wilson.
On May 13, 2011 Robert Allan, the Chief Executive Officer of Royal Wolf Trading and Royal Wolf Trading entered into an employment agreement. Under this employment agreement Mr. Allan will receive a base salary of A$350,000 per year, which includes superannuation and other salary packaged benefits, and is eligible to receive an annual performance bonus of up to A$160,000 based upon the achievement of specific performance targets. Royal Wolf Trading may terminate this employment agreement on six months’ prior notice; if Royal Wolf Trading fails to deliver this notice, Royal Wolf Trading must pay Mr. Allan six months’ compensation.
In connection with the Employment Agreement and the closing of the initial public offering by Royal Wolf Holdings in May 2011, Mr. Allan received a grant of ordinary shares Royal Wolf Holdings whose aggregate value is A$150,000 in exchange for Mr. Allan’s agreement that he would not solicit the employment of any Royal Wolf Trading employees or solicit business in competition with Royal Wolf Trading in the two year period commencing upon termination of his employment of Royal Wolf Trading. In addition, Mr. Allan will receive a loyalty bonus of A$500,000 payable within 30 days of the closing of the initial public offering by Royal Wolf Holdings.
Ronald Valenta, Charles Barrantes and Christopher Wilson are the only employees who received compensation for services to the Company in fiscal year 2010. Robert Allan received compensation as Chief Executive Officer of GFN Australasia Holdings Pty Limited, which, with its subsidiaries, we refer to as “Royal Wolf,” an indirectly-owned Australian subsidiary.
61
Table of Contents
In approving Mr. Valenta's, Mr. Barrantes’ and Mr. Wilson’s compensation, the Board of Directors reviewed information provided by management regarding the compensation of comparable level officers of public companies, including companies in the equipment leasing business. The Board also considered the size and stage of development of the Company, Mr. Valenta's, Mr. Barrantes’ and Mr. Wilson’s experience and prior compensation, and the scope of the services that each would be required to render (particularly given the lack of support staff and the need to implement policies and procedures). The Board of Directors determined that Mr. Valenta's, Mr. Barrantes’ and Mr. Wilson’s compensation should consist of a base salary, the opportunity for a material performance-based bonus and stock options under the 2006 Stock Option Plan.
Potential Payments Upon Termination of Employment or Change in Control
We have no agreements or arrangement with any executive officer that provides for payments upon termination of employment except that to the employment agreements of Mr. Valenta, Mr. Barrantes and Mr. Wilson under which each is entitled to a lump sum severance payment of twelve months base salary if we terminate their employment without “cause” or he terminates his employment for “good reason”. We have no other agreements or arrangements with any executive officer that provide for payments upon a change of control.
62
Table of Contents
SECURITY OWNERSHIP OF CERTAIN BENEFICIAL OWNERS AND MANAGEMENT
The following table sets forth information regarding the beneficial ownership of our common stock as of August 2, 2011, by (i) each person known by us to be the beneficial owner of more than 5% of our outstanding shares of common stock; (ii) each of our executive officers and directors; and (iii) all of our executive officers and directors as a group. Unless otherwise noted, we believe that each beneficial owner named in the table has sole voting and investment power with respect to the shares shown, subject to community property laws where applicable. An asterisk (*) denotes beneficial ownership of less than one percent.
| Beneficial Ownership | ||||||||
| Number of | Percent of | |||||||
| Name | Shares(1) | Class(1) | ||||||
| Ronald F. Valenta(2)(3) |
4,387,667 | 20.0 | % | |||||
| James B. Roszak(2)(4) |
55,875 | (*) | ||||||
| Lawrence Glascott(2)(5) |
97,850 | (*) | ||||||
| Manuel Marrero(2)(6) |
89,125 | (*) | ||||||
| David M. Connell(2)(7) |
55,499 | (*) | ||||||
| Susan Harris(2)(8) |
7,500 | (*) | ||||||
| Charles E. Barrantes(2)(9) |
213,250 | 1.0 | % | |||||
| Christopher Wilson(2)(10) |
178,450 | (*) | ||||||
| Robert Allan(11)(12) |
102,297 | (*) | ||||||
| Theodore M. Mourouzis(13)(14) |
406,330 | 1.9 | % | |||||
| Gilder, Gagnon, Howe & Co. LLC(15) |
909,736 | 4.1 | % | |||||
| Olowalu Holdings, LLC(16) |
2,370,498 | 10.8 | % | |||||
| Jonathan Gallen(17) |
250,000 | 1.1 | % | |||||
| Neil Gagnon(18) |
4,662,991 | 21.2 | % | |||||
| Jack Silver(19) |
765,000 | 3.5 | % | |||||
| Brencourt Advisors, LLC(20) |
231,117 | 1.0 | % | |||||
| Halcyon Asset Management LLC Halcyon Offshore Asset Management LLC (21) |
875,842 | 4.0 | % | |||||
| Ronald L. Havner, Jr.(22) |
2,479,675 | 11.3 | % | |||||
| LeeAnn R. Havner |
||||||||
| Kaiser Investments Limited(23) |
1,369,336 | 6.2 | % | |||||
| All executive officers and directors as a group (ten persons) |
5,538,843 | 25.2 | % | |||||
63
Table of Contents
| (1) | Based on 22,013,299 shares of common stock outstanding. In accordance with the rules of the SEC, person is deemed to be the beneficial owner of shares that the person may acquire within the following 60 days (such as upon exercise of options or warrants or conversion of convertible securities). These shares are deemed to be outstanding for purposes of computing the percentage ownership of the person beneficially owning such shares but not for purposes of computing the percentage of any other holder. |
| (2) | Business address is c/o General Finance Corporation, 39 East Union Street, Pasadena, California 91103. |
| (3) | Includes: (i) 3,963,292 shares owned and 370,000 shares that may be acquired upon the exercise of warrants and (ii) 45,250 shares owned by Mr. Valenta’s wife and minor children and 9,125 shares that may be acquired upon the exercise of warrants owned by Mr. Valenta’s wife and minor children. |
| (4) | Includes 42,750 shares owned, 6,000 shares that may be acquired upon exercise of options and 7,125 shares that may be acquired upon the exercise of warrants. |
| (5) | Includes 66,300 shares owned, 6,000 shares that may be acquired upon exercise of options and 25,550 shares that may be acquired upon the exercise of warrants. |
| (6) | Includes 71,250 shares owned, 6,000 shares that may be acquired upon exercise of options and 11,875 shares that may be acquired upon the exercise of warrants. |
| (7) | Includes 41,166 shares owned, 6,000 shares that may be acquired upon exercise of options and 8,333 shares that may be acquired upon the exercise of warrants. |
| (8) | Includes 1,000 shares owned, 6,000 shares that may be acquired upon exercise of options and 500 shares that may be acquired upon the exercise of warrants. |
| (9) | Includes 28,500 shares owned, 180,000 shares that may be acquired upon exercise of stock options and 4,750 shares that may be acquired upon the exercise of warrants. |
| (10) | Includes 37,300 shares owned, 135,000 shares that may be acquired upon exercise of stock options and 6,150 shares that may be acquired upon the exercise of warrants. |
| (11) | Business address is Suite 201, Level 2, 22-28 Edgeworth David Avenue, Hornsby, New South Wales, Australia 2077 |
| (12) | Includes 30,255 shares owned, 67,000 shares that may be acquired upon the exercise of stock options and 5,042 shares that may be acquired upon the exercise of warrants. |
| (13) | Business address is 9155 Harrison Park Court, Indianapolis, IN 46216. |
| (14) | Includes 341,708 shares owned, 20,000 shares that may be acquired upon exercise of stock options and 44,622 shares that may be acquired upon the exercise of warrants. |
| (15) | Information is based upon an Amendment to Schedule 13G filed on July 12, 2010. Gilder, Gagnon, Howe & Co. LLC is a New York limited liability and broker or dealer registered under the Securities Exchange Act of 1934. The shares shown include 28,865 shares as to which Gilder, Gagnon, Howe & Co. LLC has sole voting power and 880,871 shares as to which it has investment power. Of these 880,871 shares, 772,678 shares are held in customer accounts under which partners or employees of Gilder, Gagnon, Howe & Co. LLC have discretionary authority to dispose or direct the disposition of the shares, 108,193 shares are held in accounts of its partners and 28,865 shares are held in its profit-sharing plan. |
| (16) | Information is based upon an Amendment to Schedule 13G filed on July 2, 2010. Olowalu Holdings, LLC (“Olowalu”), is a Hawaiian limited liability company, of which Rick Pielago and Marc Perez are the managers. Olowalu shares voting and investment power as to all of the shares shown with Lighthouse Capital Insurance Company, a Cayman Islands exempted limited company, and the Ronald Valenta Irrevocable Life Insurance Trust No. 1, a California trust, of which Mr. Pielago is trustee. The Ronald Valenta Irrevocable Life Insurance Trust No. 1 is an irrevocable family trust established by Ronald F. Valenta in December 1999 for the benefit of his wife at the time, any future wife, and their descendants. Mr. Valenta, himself, is not a beneficiary of the Trust, and neither he nor his wife or their descendants has voting or investment power, or any other legal authority, with respect to the shares shown. Mr. Valenta disclaims beneficial ownership of the shares held by the Trust. Mr. Pielago and Mr. Perez may be deemed to be the control persons of Olowalu, and Mr. Pielago may be deemed to be the control person of the Ronald Valenta Irrevocable Life Insurance Trust No. 1. |
| (17) | Information is based upon an Amendment to Schedule 13G filed on February 16, 2010. The shares shown are held by Ahab Opportunities, L.P. and Ahab Opportunities, Ltd. |
64
Table of Contents
| (18) | Information is based upon a Schedule 13G filed on February 18, 2009. The shares shown include: (i) 2,423,544 shares beneficially owned by Mr. Gagnon; (ii) 901,598 shares beneficially owned by Mr. Gagnon over which he has sole voting power and shared dispositive power; and (iii) 1,760,502 shares held for certain customers of Gagnon Securities LLC, of which Mr. Gagnon is the managing member and the principal owner and over which he has shared dispositive power but no voting power. |
| (19) | Information is based upon an Amendment to Schedule 13G filed on December 11, 2009. The shares shown are held by Sherleigh Associates Inc. Profit Sharing Plan, a trust of which Mr. Silver is a trustee. |
| (20) | Information is based upon a Schedule 13G filed on February 12, 2009 as an Investment Advisor with the Sole dispositive and power to vote or to direct the vote of 231,117 shares. |
| (21) | Information is based upon an Amendment to Schedule 13G filed on February 13, 2009. The shares shown consist of 875,842 shares beneficially owned by Halcyon Asset Management LLC and Halcyon Offshore Asset Management LLC over which they have sole voting power and dispositive power. |
| (22) | Information is based upon Amendment No. 2 to Schedule 13D filed on October 8, 2008. The shares shown include 2,000 shares as to which Ronald L. Havner has sole voting power and 3,000 shares as to which his wife, LeeAnn R. Havner, has sole voting power. Mr. and Mrs. Havner are Co-Trustees of The Havner Family Trust. The Trust owns 2,517,425 shares. As Co-Trustees of the Trust, Mr. and Mrs. Havner may he deemed to beneficially own all of the shares held by the Trust. |
| (23) | Information is based on a Schedule 13G filed July 2, 2010. Kaiser Investments Limited (“Kaiser”) is a Bermuda limited company, of which Colin James is the director. Kaiser shares voting power with Magna Carta Life Insurance Ltd. (“Magna Carta”), a Bermuda limited company. Kaiser, Magna Carta and HFD Family Trust (“HFD Trust”), a Cayman Islands Trust of which Rick J. Pielago is the protector. The HFD Trust is an irrevocable family trust established by Ronald F. Valenta in August 2008 for the benefit of his minor children and their descendants. Mr. Valenta, himself, is not the beneficiary of the HFD Trust, and neither he nor his minor children nor their descendants have voting or investment power, of any other legal authority, with respect to the shares shown. Mr. Valenta disclaims beneficial ownership of the shares held by Kaiser, Magna Carta and the HFD Trust. Colin James may be deemed to be the control person of Magna Carta, and Mr. Pielago may be deemed to be the control person of Kaiser and the HFD Trust. |
65
Table of Contents
TRANSACTIONS WITH RELATED PERSONS
Royal Wolf Holdings, Royal Wolf Trading, General Finance and GFN U.S. entered into a Separation Agreement dated May 13, 2011, which we refer to as the Separation Agreement. Pursuant to the Separation Agreement, the parties agreed:
(i) to terminate the Management Agreement between Royal Wolf Holdings and GFN and in consideration for the payment of accrued management fees, to issue 1.3 million Shares of Royal Wolf Holdings to GFN U.S.;
(ii) Royal Wolf would pay A$3.3 million to GFN over 22 equal monthly installments in consideration for the transfer to Royal Wolf Holdings of the “Royal Wolf” trademark and the termination of a trademark license agreement;
(iii) GFN would use proceeds of the Offering to repay in full the GFN intercompany Mezzanine B note, the Bison Capital senior secured subordinated notes and to obtain the release of related liens;
(iv) GFN would use proceeds to the Offering to prepay an estimated A$25 million – A$27 million of outstanding borrowings under the Royal Wolf senior credit facility with Australia and New Zealand Bank, which we refer to as ANZ;
(v) Provide certain information to GFN including ongoing information sharing arrangements relating to the provision of financial or other information by Royal Wolf Holdings and its subsidiaries to GFN to enable GFN to comply with its obligations under applicable laws, financial and tax reporting obligations and other compulsory requirements of applicable legal, governmental, taxation, regulatory (including stock exchange) or licensing authorities, and in connection with acquisition, debt and equity finance from time to time, subject at all times to any applicable laws, undertakings given to regulators by Royal Wolf Holdings and its subsidiaries, and any contractual commitments of Royal Wolf Holdings and its subsidiaries;
(vi) While GFN holds more than 50% of the Shares:
1. Royal Wolf Holdings will ensure its audit, risk and compliance committee will:
a. take into account the views of the GFN Audit Committee where the committee considers those views to be appropriate in Royal Wolf Holdings’ circumstances;
b. subject to law (including director’s duties), recommend the appointment of the same external auditor for A-IFRS public reporting purposes as the auditor appointed by GFN for US GAAP public reporting purposes, provided that the committee considers that to be appropriate in Royal Wolf Holdings’ circumstances; and
c. to the extent that the United States Sarbanes–Oxley Act of 2002, as amended, or other applicable laws impose requirements applicable to GFN which require steps to be taken by Royal Wolf Holdings, the committee will ensure that those steps are taken to the extent permitted by law (including directors duties);
2. Prior to proposing or entering into any agreement or arrangement relating to employment or remuneration with any person deemed to be a “named executive officer” under U.S. securities laws (or any amendment to any such existing or future agreement or arrangement) (a “Relevant Proposal”), Royal Wolf Holdings will take into account the views of GFN where GFN considers those views to be appropriate in Royal Wolf Holdings’ circumstances, and following that consultation a Relevant Proposal must not be implemented unless it has been approved:
a. unanimously by the directors of Royal Wolf Holdings entitled to vote on the resolution; or
b. by an ordinary resolution of the shareholders of Royal Wolf Holdings.
3. Royal Wolf Holdings will obtain the approval of GFN prior to entering into any agreement to (i) complete an asset acquisition or business combination involving the payment or receipt of consideration equal to or greater than US$10 million or (ii) sell or dispose of assets other than in the ordinary course of business. This does not apply to the acquisition of inventory, lease fleet and maintenance equipment in the ordinary course of business;
66
Table of Contents
4. Unless GFN agrees otherwise, any “equity securities” (as defined in the Listing Rules of the ASX) which are to be allocated under any employee or executive incentive plan will be sourced by purchasing them in the market rather than by issuing them (provided that Royal Wolf Holdings may issue options or similar rights to receive “equity securities” where those underlying “equity securities” will be purchased in the market); and
5. Unless GFN agrees otherwise, and except as permitted under the separation agreement, any “equity securities” issued by Royal Wolf Holdings must have been offered to shareholders on a pro rata basis.
(vii) GFN and Royal Wolf Holdings will endeavor to purchase directors and officers insurance jointly and pay their share of the premiums for such insurance in proportion to their respective market capitalizations as of the commencement date of each policy period for the directors and officers insurance;
(viii) Royal Wolf Holdings will implement a corporate restructuring as soon as practicable after completion of the Offer which will de-register and wind up as dormant the following companies: GFN Finance, RWA and Royal Wolf Hi-Tech Ltd.
(ix) Royal Wolf Trading will pay the costs and expenses of the Offer from the Offer proceeds.
The Company has utilized certain accounting, administrative and secretarial services from affiliates of officers; as well as office space provided by an affiliate of Mr. Valenta. Effective January 31, 2008, the Company entered into a lease with an affiliate of Mr. Valenta for its new corporate headquarters in Pasadena, California. The rent is $7,393 per month, effective March 1, 2009, plus allocated charges for common area maintenance, real property taxes and insurance, for approximately 3,000 square feet of office space. The term of the lease is five years, with two five-year renewal options, and the rent is adjusted yearly based on the consumer price index. Rental payments were $113,000 in fiscal year 2009 and $110,000 in fiscal year 2010.
On October 1, 2008 we acquired Mobile Office Acquisition Corp., or MOAC, through a merger, or Merger. Pursuant to the Merger Agreement, the former stockholders of MOAC received approximately $19.4 million in cash, four million shares of restricted common stock of GFN (valued pursuant to the Merger Agreement at $7.50 per share with an aggregate value of $30 million) and a 20-month subordinated promissory note in the principal amount of $1.5 million issued by GFN North America Corp., our wholly-owned subsidiary. A special committee of independent directors of the Company was formed to determine whether to acquire MOAC because Ronald F. Valenta, our President, Chief Executive Officer and director, is a stockholder of MOAC. The stockholders of the Company approved the acquisition of MOAC on September 30, 2008, and the acquisition was completed on October 1, 2008.
Effective October 1, 2008, the Company entered into a services agreement through June 30, 2009 (the "Termination Date") with an affiliate of Mr. Valenta for certain accounting, administrative and secretarial services to be provided at the corporate offices and for certain operational, technical, sales and marketing services to be provided directly to the Company's operating subsidiaries. Charges for services rendered at the corporate offices will be, until further notice, at $7,000 per month and charges for services rendered to the Company's subsidiaries will vary depending on the scope of services provided. The services agreement provides for, among other things, mutual modifications to the scope of services and rates charged and automatically renews for successive one-year terms, unless terminated in writing by either party not less than 30 days prior to the Termination Date. Total charges to the Company for services rendered under this agreement totaled $234,000 ($63,000 at the corporate office and $155,000, plus out-of-pocket expenses of $16,000, at the operating subsidiaries) in fiscal year 2009 and $114,000 ($84,000 at the corporate office and $30,000 at the operating subsidiaries) in fiscal year 2010.
We have not adopted a formal written policy regarding transactions with related persons. However, in general, any such material transaction would require approval of the Board of Directors, with any interested director abstaining.
67
Table of Contents
General
We are authorized to issue 100,000,000 shares of common stock, par value $.0001, and 1,000,000 shares of preferred stock, par value $.0001. As of the date of this prospectus, 22,013,299 shares of common stock are outstanding, held by 12 stockholders of record. 25,900 shares of Series A 12.5% Cumulative Preferred Stock are outstanding held by 16 stockholders of record and 200 shares of Series B 8% Cumulative Preferred Stock are outstanding held by two stockholders of record.
Units
Each unit consists of one share of GFN common stock and a three-year warrant to purchase 0.5 additional shares of GFN common stock at an exercise price of $4.00 per share.
Common Stock
Common stockholders of record are entitled to one vote for each share held on all matters to be voted on by stockholders.
Pursuant to our Amended and Restated Certificate of Incorporation, the Board of Directors must consist of no less than three members, the exact number of which is determined from time to time by the Board of Directors, divided into three classes designated Class A, Class B and Class C, respectively. The Board of Directors has presently fixed the number of directors at six. The terms of the Class B Directors will expire as of the annual meeting of stockholders in 2011 and the term of the Class C Directors will expire as of the 2012 and the terms of the Class A directors will expire as of the annual meeting of stockholders in 2013. Upon expiration of the terms of the Directors of each class as set forth above, the terms of their successors in that class will continue until the end of their terms and until their successors are duly elected and qualify.
Our stockholders are entitled to receive ratable dividends when, as and if declared by the Board of Directors out of funds legally available therefor. In the event of a liquidation, dissolution or winding up of the company after a business combination, our stockholders are entitled, subject to the rights of holders of preferred stock, if any, to share ratably in all assets remaining available for distribution to them after payment of liabilities and after provision is made for each class of stock, if any, having preference over the common stock. Our stockholders have no conversion, preemptive or other subscription rights. There are no sinking fund or redemption provisions applicable to the common stock.
Preferred Stock
Our certificate of incorporation authorizes the issuance of 1,000,000 shares of blank check preferred stock with such designation and our board of directors may determine its rights and preferences from time to time. No shares of preferred stock are being issued or registered in this offering. Accordingly, our board of directors is empowered, without stockholder approval, to issue preferred stock with dividend, liquidation, conversion, voting or other rights that could adversely affect the voting power or other rights of the holders of common stock. We may issue some or all of the preferred stock to effect a business combination. In addition, the preferred stock could be utilized as a method of discouraging, delaying or preventing a change in control.
The Company is offering private placements of Series A 12.5% Cumulative Preferred Stock, liquidation preference of $50 per share, or Series A Preferred Stock, and Series B 8% Cumulative Preferred Stock, liquidation value of $1,000 per share, Series B Preferred Stock. The Series B Preferred Stock is offered primarily in connection with business combinations. As of June 30, 2010, the Company had issued 25,900 shares and 100 shares of Series A Preferred Stock and Series B Preferred Stock for total proceeds of $1,295,000 and $100,000, respectively.
The Series A Preferred Stock and Series B Preferred Stock, or collectively the Cumulative Preferred Stock, are not convertible into GFN common stock, have no voting rights, except as required by Delaware law, and are not redeemable prior to February 1, 2014; at which time it may be redeemed at any time, in whole or in part, at the Company’s option. Holders of the Cumulative Preferred Stock are entitled to receive, when declared by the Company’s Board of Directors, annual dividends payable quarterly in arrears on the 31st day of January, July and October of each year and the 30th day of April of each year. In the event of any liquidation or winding up of the Company, the holders of the Cumulative Preferred Stock will have preference to holders of common stock; with the holders of the Series A Preferred Stock having preference over holders of the Series B Preferred Stock. The Company has agreed to register for public trading the Cumulative Preferred Stock no later than one year from issuance.
68
Table of Contents
Warrants
Each warrant included in the units issued in the rights offering entitles the holder to purchase 0.5 shares of common stock at a price of $4.00 per share, subject to adjustment as discussed below. The warrants will expire on May 14, 2013 at 5:00 p.m., Los Angeles time.
We have established the above conditions to our exercise of redemption rights to provide (i) warrant holders with adequate notice of exercise only after the then-prevailing common stock price is substantially above the warrant exercise price, and (ii) a sufficient differential between the then-prevailing common stock price and the warrant exercise price so there is a buffer to absorb the market reaction, if any, to our redemption of the warrants. If the foregoing conditions are satisfied and we call the warrants for redemption, each warrant holder shall then be entitled to exercise his or her warrant prior to the date scheduled for redemption; however, there can be no assurance that the price of the common stock will exceed the call trigger price or the warrant exercise price after the redemption call is made.
Since we may redeem the warrants only with the prior written consent of the representative and the representative may hold warrants subject to redemption, the representative may have a conflict of interest in determining whether or not to consent to such redemption. We cannot assure you that the representative will consent to such redemption if it is not in their best interest, even if it is in our best interest.
The warrants will be issued in registered form under a warrant agreement between Continental Stock Transfer & Trust Company, as warrant agent, and us. You should review a copy of the warrant agreement, which has been filed as an exhibit to the registration statement of which this prospectus is a part, for a complete description of the terms and conditions applicable to the warrants.
The exercise price and number of shares of common stock issuable on exercise of the warrants may be adjusted in certain circumstances including in the event of a stock dividend or our recapitalization, reorganization, merger or consolidation. However, the warrants will not be adjusted for issuances of common stock at a price below their respective exercise prices.
The warrants may be exercised upon surrender of the warrant certificate on or prior to the expiration date at the offices of the warrant agent, with the exercise form on the reverse side of the warrant certificate completed and executed as indicated, accompanied by full payment of the exercise price, by certified or official bank check payable to us, for the number of warrants being exercised. A warrant holder does not have the rights or privileges of a holder of common stock, including any voting rights, until the warrant holder exercises the warrants and receive shares of common stock.
No warrants will be exercisable unless a prospectus relating to common stock issuable upon exercise of the warrants is current and the common stock has been registered, qualified or deemed to be exempt under the securities laws of the state of residence of the holder of the warrants. Under the terms of the warrant agreement, we have agreed to use our best efforts to maintain a current prospectus relating to common stock issuable upon exercise of the warrants until the expiration of the warrants and to take such action as is necessary to qualify for sales in those states in which the warrants were initially offered by us, the common stock issuable upon exercise of the warrants. However, we cannot assure you that we will be able to do so. The warrants may be deprived of any value and the market for the warrants may be limited if the prospectus relating to the common stock issuable upon the exercise of the warrants is not current or if the common stock is not qualified or exempt from qualification in the jurisdictions in which the warrant holders reside.
No fractional shares will be issued upon exercise of the warrants. If, upon exercise of the warrants, a warrant holder would be entitled to receive a fractional interest in a share, we will round up to the nearest whole number the number of shares of common stock to be issued to the warrant holder.
Dividends
We have not paid any cash dividends on our common stock to date. The payment of cash dividends will be dependent upon our revenues and earnings, if any, capital requirements and general financial condition subsequent to completion of a business combination. The payment of any dividends will be within the discretion of our then board of directors. It is the present intention of our board of directors to retain all earnings, if any, for use in our business operations and, accordingly, our board does not anticipate declaring any dividends in the foreseeable future. Further, our ability to declare dividends may to limited by restrictive covenants if we incur any indebtedness.
Our Transfer Agent and Warrant Agent
The transfer agent for our securities and warrant agent for our warrants is Continental Stock Transfer & Trust Company, 17 Battery Place, New York, New York 10004.
69
Table of Contents
NASDAQ Global Market Listing
The units are listed on the NASDAQ Global Market under the symbol “GFNCL.” The common stock and warrants are listed on the NASDAQ Global Market under the symbols “GFN” and “GFNCZ,” respectively.
Shares Eligible for Future Sale
As of August 3, 2011 we had 22,013,299 shares of common stock outstanding, 5,513,172 of which are restricted securities under Rule 144 in that they were issued in private transactions not involving a public offering. The remaining 12,312,880 shares are freely tradable, without further registration under the Securities Act, and consist of 7,815,099 shares sold in the IPO and through the exercise by the underwriters’ representative of the over-allotment option, 3,669,286 shares issued in our May 2008 warrant tender offer and 828,495 shares whose restrictive legend has been removed pursuant to Rule 144. 6,205,550 of the outstanding shares were purchased by our affiliates within the meaning of Rule 144 under the Securities Act and are eligible for sale under Rule 144.
We are registering hereby 100,000 shares of common stock issued in connection with the acquisition of Mobile Office Acquisition Corporation.
Rule 144
In general, under Rule 144 as currently in effect, a person who has beneficially owned restricted shares of our common stock for at least one year would be entitled to sell within any three-month period a number of shares that does not exceed the greater of either of the following:
| • | 1% of the number of shares of common stock then outstanding; and |
| • | if the common stock is listed on a national securities exchange or on The Nasdaq Stock Market, the average weekly trading volume of the common stock during the four calendar weeks preceding the filing of a notice on Form 144 with respect to the sale. |
Sales under Rule 144 are also limited by manner of sale provisions and notice requirements and to the availability of current public information about us.
Rule 144(k)
Under Rule 144(k), a person who is not deemed to have been one of our affiliates at the time of or at any time during the three months preceding a sale, and who has beneficially owned the restricted shares proposed to be sold for at least two years including the holding period of any prior owner other than an affiliate, is entitled to sell his or her shares without complying with the manner of sale, public information, volume limitation or notice provisions of Rule 144.
SEC Position on Rule 144 Sales
The Securities and Exchange Commission has taken the position that promoters or affiliates of a blank check company and their transferees, both before and after a business combination, act as “underwriters” under the Securities Act when reselling the securities of a blank check company acquired prior to the consummation of its initial public offering. Accordingly, the Securities and Exchange Commission believes that those securities can be resold only through a registered offering and that Rule 144 would not be available for those resale transactions despite technical compliance with the requirements of Rule 144.
Registration Rights
Pursuant to a registration rights agreement, our existing stockholders have two demand and unlimited piggyback registration rights with respect to the shares of common stock they held prior to this offering following the release of such shares from escrow, and with respect to shares they may acquire upon exercise of the warrants issued in the private placement.
70
Table of Contents
The validity of the securities offered in this prospectus is being passed upon for us by Christopher A. Wilson.
The audited consolidated financial statements of General Finance Corporation, included in this registration statement for the years ended June 30, 2010 and 2009, have been so included in the reliance on the report of Crowe Horwath LLP, independent registered public accountants, given on the authority of that firm as experts in accounting and auditing.
WHERE YOU CAN FIND ADDITIONAL INFORMATION
Our Internet website, which is located at http://www.generalfinance.com, is under construction. This reference to our Internet website does not constitute incorporation by reference in this report of the information contained on or hyperlinked from our Internet website and such information should not be considered part of this report.
We are required to file Annual Reports on Form 10-K and Quarterly Reports on Form 10-Q with the Securities and Exchange Commission (“SEC”) on a regular basis, and are required to disclose certain material events (e.g., changes in corporate control; acquisitions or dispositions of a significant amount of assets other than in the ordinary course of business and bankruptcy) in a current report on Form 8-K. The public may read and copy any materials we file with the SEC at the SEC’s Public Reference Room at 450 Fifth Street, N.W., Washington, D.C. 20549. The public may obtain information on the operation of the Public Reference Room by calling the SEC at 1-800-SEC-0330. The SEC also maintains an Internet website that contains reports, proxy and information statements and other information regarding issuers that file electronically with the SEC. The SEC’s Internet website is located at http://www.sec.gov.
We have filed with the SEC a registration statement on Form S-1, which includes exhibits, schedules and amendments, under the Securities Act, with respect to this offering of our securities. Although this prospectus, which forms a part of the registration statement, contains all material information included in the registration statement, parts of the registration statement have been omitted as permitted by rules and regulations of the SEC. We refer you to the registration statement and its exhibits for further information about us, our securities and this offering. The registration statement and its exhibits, as well as our other reports filed with the SEC, can be inspected and copied at the SEC’s public reference room at 100 F Street, N.E., Washington, D.C. 20549-1004. The public may obtain information about the operation of the public reference room by calling the SEC at 1-800-SEC-0330. In addition, the SEC maintains a web site at http://www.sec.gov, which contains the Form S-1 and other reports, proxy and information statements and information regarding issuers that file electronically with the SEC.
Until , 2011, all dealers that effect transactions in these securities, whether or not participating in this offering, may be required to deliver a prospectus. This is in addition to the dealers’ obligation to deliver a prospectus when acting as underwriters and with respect to their unsold allotments or subscriptions.
No dealer, salesperson or any other person is authorized to give any information or make any representations in connection with this offering other than those contained in this prospectus and, if given or made, the information or representations must not be relied upon as having been authorized by us. This prospectus does not constitute an offer to sell or a solicitation of an offer to buy any security other than the securities offered by this prospectus, or an offer to sell or a solicitation of an offer to buy any securities by anyone in any jurisdiction in which the offer or solicitation is not authorized or is unlawful.
71
Table of Contents
INDEX TO UNAUDITED INTERIM CONDENSED CONSOLIDATED FINANCIAL STATEMENTS
I-1
Table of Contents
GENERAL FINANCE CORPORATION AND SUBSIDIARIES
Condensed Consolidated Balance Sheets
(In thousands, except share and per share data)
| June 30, 2010 | March 31, 2011 | |||||||
| (Unaudited) | ||||||||
| Assets |
||||||||
| Cash and cash equivalents |
$ | 4,786 | $ | — | ||||
| Trade and other receivables, net of allowance for doubtful accounts of $2,328 and $2,282 at June 30, 2010 and March 31, 2011, respectively |
27,449 | 27,363 | ||||||
| Income taxes receivable |
1,071 | — | ||||||
| Subscription receivables |
1,211 | — | ||||||
| Inventories |
19,063 | 20,049 | ||||||
| Prepaid expenses and other |
2,206 | 4,633 | ||||||
| Property, plant and equipment, net |
10,182 | 11,722 | ||||||
| Lease fleet, net |
188,410 | 213,946 | ||||||
| Goodwill |
67,919 | 73,953 | ||||||
| Intangible assets, net |
24,583 | 24,801 | ||||||
|
|
|
|
|
|||||
| Total assets |
$ | 346,880 | $ | 376,467 | ||||
|
|
|
|
|
|||||
| Liabilities |
||||||||
| Trade payables and accrued liabilities |
$ | 25,246 | $ | 28,867 | ||||
| Income taxes payable |
— | 90 | ||||||
| Unearned revenue and advance payments |
9,468 | 10,473 | ||||||
| Senior and other debt |
186,183 | 196,083 | ||||||
| Deferred tax liabilities |
13,409 | 14,646 | ||||||
|
|
|
|
|
|||||
| Total liabilities |
234,306 | 250,159 | ||||||
|
|
|
|
|
|||||
| Commitments and contingencies (Note 8) |
— | — | ||||||
| Redeemable noncontrolling interest (Note 8) |
10,840 | 15,165 | ||||||
| Stockholders’ equity |
||||||||
| Cumulative preferred stock, $.0001 par value: 1,000,000 shares authorized; 26,000 shares issued and outstanding (in series) and liquidation value of ($1,438) at June 30, 2010 and March 31, 2011 |
1,395 | 1,395 | ||||||
| Common stock, $.0001 par value: 100,000,000 shares authorized; 22,023,299 and 22,013,299 shares outstanding at June 30, 2010 and March 31, 2011, respectively |
2 | 2 | ||||||
| Additional paid-in capital |
111,783 | 112,217 | ||||||
| Subscription receivables |
(100 | ) | (60 | ) | ||||
| Accumulated other comprehensive income (loss) |
(1,571 | ) | 8,467 | |||||
| Accumulated deficit |
(9,775 | ) | (10,878 | ) | ||||
|
|
|
|
|
|||||
| Total stockholders’ equity |
101,734 | 111,143 | ||||||
|
|
|
|
|
|||||
| Total liabilities and stockholders’ equity |
$ | 346,880 | $ | 376,467 | ||||
|
|
|
|
|
|||||
The accompanying notes are an integral part of these condensed consolidated financial statements.
I-2
Table of Contents
GENERAL FINANCE CORPORATION AND SUBSIDIARIES
Condensed Consolidated Statements of Operations
(In thousands, except share and per share data)
(Unaudited)
| Quarter Ended March 31, | Nine Months Ended March 31, | |||||||||||||||
| 2010 | 2011 | 2010 | 2011 | |||||||||||||
| Revenues |
||||||||||||||||
| Sales |
$ | 19,234 | $ | 20,537 | $ | 55,135 | $ | 66,087 | ||||||||
| Leasing |
19,251 | 22,785 | 57,715 | 65,597 | ||||||||||||
|
|
|
|
|
|
|
|
|
|||||||||
| 38,485 | 43,322 | 112,850 | 131,684 | |||||||||||||
|
|
|
|
|
|
|
|
|
|||||||||
| Costs and expenses |
||||||||||||||||
| Cost of sales (exclusive of the items shown separately below) |
15,311 | 15,829 | 42,865 | 50,085 | ||||||||||||
| Direct costs of leasing operations |
6,426 | 8,193 | 19,418 | 24,160 | ||||||||||||
| Selling and general expenses |
9,191 | 10,302 | 27,943 | 30,894 | ||||||||||||
| Depreciation and amortization |
4,578 | 4,720 | 14,929 | 14,252 | ||||||||||||
|
|
|
|
|
|
|
|
|
|||||||||
| Operating income |
2,979 | 4,278 | 7,695 | 12,293 | ||||||||||||
| Interest income |
56 | 124 | 178 | 354 | ||||||||||||
| Interest expense |
(3,932 | ) | (4,822 | ) | (11,771 | ) | (13,454 | ) | ||||||||
| Foreign currency exchange gain and other |
578 | 108 | 3,716 | 4,573 | ||||||||||||
|
|
|
|
|
|
|
|
|
|||||||||
| (3,298 | ) | (4,590 | ) | (7,877 | ) | (8,527 | ) | |||||||||
|
|
|
|
|
|
|
|
|
|||||||||
| Income (loss) before provision for income taxes and noncontrolling interest |
(319 | ) | (312 | ) | (182 | ) | 3,766 | |||||||||
| Provision (benefit) for income taxes |
(116 | ) | (116 | ) | (66 | ) | 1,425 | |||||||||
|
|
|
|
|
|
|
|
|
|||||||||
| Net income (loss) |
(203 | ) | (196 | ) | (116 | ) | 2,341 | |||||||||
| Noncontrolling interest |
(576 | ) | (2,298 | ) | (1,722 | ) | (3,444 | ) | ||||||||
| Preferred stock dividends |
(42 | ) | (45 | ) | (125 | ) | (132 | ) | ||||||||
|
|
|
|
|
|
|
|
|
|||||||||
| Net loss attributable to common stockholders |
$ | (821 | ) | $ | (2,539 | ) | $ | (1,963 | ) | $ | (1,235 | ) | ||||
|
|
|
|
|
|
|
|
|
|||||||||
| Net loss per common share: |
||||||||||||||||
| Basic |
$ | (0.05 | ) | $ | (0.12 | ) | $ | (0.11 | ) | $ | (0.06 | ) | ||||
| Diluted |
(0.05 | ) | (0.12 | ) | (0.11 | ) | (0.06 | ) | ||||||||
|
|
|
|
|
|
|
|
|
|||||||||
| Weighted average shares outstanding: |
||||||||||||||||
| Basic |
17,826,052 | 22,013,299 | 17,826,052 | 22,013,299 | ||||||||||||
| Diluted |
17,826,052 | 22,013,299 | 17,826,052 | 22,013,299 | ||||||||||||
|
|
|
|
|
|
|
|
|
|||||||||
The accompanying notes are an integral part of these condensed consolidated financial statements.
I-3
Table of Contents
GENERAL FINANCE CORPORATION AND SUBSIDIARIES
Condensed Consolidated Statement of Stockholders’ Equity and Comprehensive Income (Loss)
(In thousands, except share and share data)
(Unaudited)
| Cumulative Preferred Stock |
Common Stock | Additional Paid-In Capital |
Subscription Receivables |
Other Comprehensive Income (Loss) |
Accumulated Deficit |
Total Stockholders’ Equity |
||||||||||||||||||||||||||||||
| Shares | Amount | Shares | Amount | |||||||||||||||||||||||||||||||||
| Balance at June 30, 2010 |
26,000 | $ | 1,395 | 22,023,299 | $ | 2 | $ | 111,783 | $ | (100 | ) | $ | (1,571 | ) | $ | (9,775 | ) | $ | 101,734 | |||||||||||||||||
| Cancellation of subscription receivables |
— | — | (10,000 | ) | — | (15 | ) | 15 | — | — | — | |||||||||||||||||||||||||
| Subscription receivables receipts |
— | — | — | — | — | 25 | — | — | 25 | |||||||||||||||||||||||||||
| Share-based compensation |
— | — | — | — | 581 | — | — | — | 581 | |||||||||||||||||||||||||||
| Preferred stock dividends |
— | — | — | — | (132 | ) | — | — | — | (132 | ) | |||||||||||||||||||||||||
| Net income |
— | — | — | — | — | — | — | 2,341 | 2,341 | |||||||||||||||||||||||||||
| Noncontrolling interest |
— | — | — | — | — | — | — | (3,444 | ) | (3,444 | ) | |||||||||||||||||||||||||
| Cumulative translation adjustments |
— | — | — | — | — | — | 10,038 | — | 10,038 | |||||||||||||||||||||||||||
|
|
|
|||||||||||||||||||||||||||||||||||
| Total comprehensive income |
8,935 | |||||||||||||||||||||||||||||||||||
|
|
|
|
|
|
|
|
|
|
|
|
|
|
|
|
|
|
|
|||||||||||||||||||
| Balance at March 31, 2011 |
26,000 | $ | 1,395 | 22,013,299 | $ | 2 | $ | 112,217 | $ | (60 | ) | $ | 8,467 | $ | (10,878 | ) | $ | 111,143 | ||||||||||||||||||
|
|
|
|
|
|
|
|
|
|
|
|
|
|
|
|
|
|
|
|||||||||||||||||||
Other comprehensive income:
Cumulative translation adjustments totaled $1,421, $6,680 and $799, which resulted in Total Comprehensive Income of $642, $4,842 and $(1,695) for the quarter and nine months ended March 31, 2010 and the quarter ended March 31, 2011, respectively.
The accompanying notes are an integral part of these condensed consolidated financial statements.
I-4
Table of Contents
GENERAL FINANCE CORPORATION AND SUBSIDIARIES
Condensed Consolidated Statements of Cash Flows
(In thousands)
(Unaudited)
| Nine Months Ended March 31, |
||||||||
| 2010 | 2011 | |||||||
| Net cash provided by operating activities (Note 9) |
$ | 18,762 | $ | 21,803 | ||||
|
|
|
|
|
|||||
| Cash flows from investing activities: |
||||||||
| Business acquisitions, net of cash acquired |
— | (880 | ) | |||||
| Proceeds from sales of property, plant and equipment |
37 | 89 | ||||||
| Purchases of property, plant and equipment |
(1,369 | ) | (2,618 | ) | ||||
| Proceeds from sales of lease fleet |
16,921 | 16,996 | ||||||
| Purchases of lease fleet |
(14,531 | ) | (32,252 | ) | ||||
|
|
|
|
|
|||||
| Net cash provided (used) by investing activities |
1,058 | (18,665 | ) | |||||
|
|
|
|
|
|||||
| Cash flows from financing activities: |
||||||||
| Proceeds from (repayments on) capital leasing activities |
(214 | ) | 868 | |||||
| Repayments on senior and other debt borrowings, net |
(21,662 | ) | (6,242 | ) | ||||
| Deferred financing costs |
— | (1,290 | ) | |||||
| Proceeds from issuances of preferred stock |
50 | — | ||||||
| Preferred stock dividends |
(125 | ) | (132 | ) | ||||
|
|
|
|
|
|||||
| Net cash used by financing activities |
(21,951 | ) | (6,796 | ) | ||||
|
|
|
|
|
|||||
| Net decrease in cash |
(2,131 | ) | (3,658 | ) | ||||
| Cash and equivalents at beginning of period |
3,346 | 4,786 | ||||||
| The effect of foreign currency translation on cash |
(1,215 | ) | (1,128 | ) | ||||
|
|
|
|
|
|||||
| Cash and equivalents at end of period |
$ | — | $ | — | ||||
|
|
|
|
|
|||||
Non-cash investing and financing activities:
On October 1, 2010 and January 14, 2011, the Company issued redeemable preferred stock of $100 and $10, respectively, as part of the consideration for business acquisitions (see Note 1).
The accompanying notes are an integral part of these condensed consolidated financial statements.
I-5
Table of Contents
GENERAL FINANCE CORPORATION AND SUBSIDIARIES
NOTES TO CONDENSED CONSOLIDATED FINANCIAL STATEMENTS
Note 1. Organization and Business Operations
Organization
General Finance Corporation (“GFN”) was incorporated in Delaware in October 2005. References to the “Company” in these Notes are to GFN and its consolidated subsidiaries. These subsidiaries include GFN U.S. Australasia Holdings, Inc., a Delaware corporation (“GFN U.S.”); GFN North America Corp., a Delaware corporation (“GFNNA”); GFN Mobile Storage Inc., a Delaware corporation (“GFNMS”); GFN Australasia Holdings Pty Ltd., an Australian corporation (“GFN Holdings”); GFN Australasia Finance Pty Ltd, an Australian corporation (“GFN Finance”); RWA Holdings Pty Limited (“RWA”), an Australian corporation, and its subsidiaries (collectively, “Royal Wolf”); and Pac-Van, Inc., an Indiana corporation (combined with GFNMS, “Pac-Van”).
Acquisition of Royal Wolf
On September 13, 2007 (September 14 in Australia), the Company completed the acquisition of Royal Wolf through the acquisition of all of the outstanding shares of RWA. Based upon the actual exchange rate of one Australian dollar to $0.8407 U.S. dollar realized in connection with payments made upon completion of the acquisition, the purchase price paid to the sellers for the RWA shares was $64.3 million. The Company paid the purchase price by a combination of cash, the issuance to Bison Capital Australia, L.P., (“Bison Capital”), one of the sellers, of shares of common stock of GFN U.S. and the issuance of a note to Bison Capital. As a result of this structure, the Company owns 86.2% of the outstanding capital stock of GFN U.S. and Bison Capital owns 13.8% of the outstanding capital stock of GFN U.S. Royal Wolf leases and sells storage containers, portable container buildings and freight containers in Australia and New Zealand, which is considered geographically by the Company to be the Asia-Pacific area.
Acquisition of Pac-Van
On October 1, 2008, the Company completed its acquisition of Pac-Van through a merger with Mobile Office Acquisition Corp. (“MOAC”), the parent of Pac-Van, and the Company’s wholly-owned subsidiary formed in July 2008, GFNNA. The Company, in addition to assuming Pac-Van’s senior and other debt, paid the purchase price to the stockholders of MOAC by a combination of cash, GFN restricted common stock and a 20-month subordinated promissory note. Pac-Van leases and sells modular buildings, mobile offices and storage containers in the United States.
Acquisitions in the Current Fiscal Year
In two separate transactions, on October 1, 2010 and on January 14, 2011, the Company, through Pac-Van, purchased the business of Advanced Mobile Storage (“AMS”) for a total of $990,000; which included the issuance of 110 shares of redeemable preferred stock (see Note 3). The total purchase price has been allocated to tangible (lease fleet) and intangible (customer base and non-compete agreement) assets acquired, based on their estimated fair market values, and totaled $893,000 and $193,000, respectively; less trade payables and accrued liabilities assumed of $96,000.
Note 2. Summary of Significant Accounting Policies
Basis of Presentation
The accompanying unaudited condensed consolidated financial statements have been prepared in conformity with United States generally accepted accounting principles (“U.S. GAAP”) applicable to interim financial information and the instructions to Form 10-Q and Article 10 of Regulation S-X. Accordingly, they do not include all the information and footnotes required by accounting principles generally accepted in the United States for complete financial statements. In the opinion of management, all adjustments (which include all significant normal and recurring adjustments) necessary to present fairly the financial position, results of operations and cash flows for all periods presented have been made. The accompanying results of operations are not necessarily indicative of the operating results that may be expected for the entire fiscal year ending June 30, 2011. These condensed consolidated financial statements should be read in conjunction with the consolidated financial statements and accompanying notes thereto of the Company, which are included in the Company’s Annual Report on Form 10-K for the fiscal year ended June 30, 2010 filed with the Securities and Exchange Commission (“SEC”).
Certain reclassifications have been made to conform to the current period presentation.
Unless otherwise indicated, references to “FY 2010” and “FY 2011” are to the nine months ended March 31, 2010 and 2011, respectively.
I-6
Table of Contents
GENERAL FINANCE CORPORATION AND SUBSIDIARIES
NOTES TO CONDENSED CONSOLIDATED FINANCIAL STATEMENTS
Principles of Consolidation
The consolidated financial statements include the accounts of the Company and its wholly-owned and majority-owned subsidiaries. All significant intercompany accounts and transactions have been eliminated.
Foreign Currency Translation
The Company’s functional currency for its operations in the Asia-Pacific area is the local currency, which is primarily the Australian (“AUS”) dollar. All adjustments resulting from the translation of the accompanying consolidated financial statements from the functional currency into reporting currency are recorded as a component of stockholders’ equity in accordance with Financial Accounting Standards Board (“FASB”) Accounting Standards Codification (“ASC”) Topic 830, Foreign Currency Matters. All assets and liabilities are translated at the rates in effect at the balance sheet dates; and revenues, expenses, gains and losses are translated using the average exchange rates during the periods. Transactions in foreign currencies are translated at the foreign exchange rate prevailing at the date of the transaction. Monetary assets and liabilities denominated in foreign currencies at the balance sheet date are translated to the functional currency at the foreign exchange rate prevailing at that date. Foreign exchange differences arising on translation are recognized in the statement of operations. Non-monetary assets and liabilities that are measured in terms of historical cost in a foreign currency are translated using the exchange rate at the date of the transaction. Non-monetary assets and liabilities denominated in foreign currencies that are stated at fair value are translated to the functional currency at foreign exchange rates prevailing at the dates the fair value was determined.
Segment Information
FASB ASC Topic 280, Segment Reporting, establishes standards for the way companies report information about operating segments in annual financial statements. It also establishes standards for related disclosures about products and services, geographic areas and major customers. Based on the provisions of FASB ASC Topic 280 and the manner in which the chief operating decision maker analyzes the business, the Company has determined it has two separately reportable geographic and operating segments, North America (Pac-Van, including corporate headquarters) and the Asia-Pacific area (Royal Wolf).
Use of Estimates
The preparation of consolidated financial statements in conformity with U.S. GAAP requires management to make estimates and assumptions that affect the reported amounts of assets and liabilities and disclosure of contingent assets and liabilities at the date of the consolidated financial statements, and the reported amounts of revenues and expenses during the reporting period. Actual results could differ from those estimates.
Inventories
Inventories are stated at the lower of cost or market (net realizable value). Inventories consist primarily of containers, modular buildings and mobile offices held for sale or lease and are comprised of the following (in thousands):
| June 30, 2010 | March 31, 2011 | |||||||
| Finished goods |
$ | 18,840 | $ | 19,269 | ||||
| Work in progress |
223 | 780 | ||||||
|
|
|
|
|
|||||
| $ | 19,063 | $ | 20,049 | |||||
|
|
|
|
|
|||||
Derivative Financial Instruments
The Company may use derivative financial instruments to hedge its exposure to foreign currency and interest rate risks arising from operating, financing and investing activities. The Company does not hold or issue derivative financial instruments for trading purposes. However, derivatives that do not qualify for hedge accounting are accounted for as trading instruments. Derivative financial instruments are recognized initially at fair value. Subsequent to initial recognition, derivative financial instruments are stated at fair value. The gain or loss on remeasurement to fair value is recognized immediately in the statement of operations.
I-7
Table of Contents
GENERAL FINANCE CORPORATION AND SUBSIDIARIES
NOTES TO CONDENSED CONSOLIDATED FINANCIAL STATEMENTS
Property, Plant and Equipment
Property, plant and equipment consist of the following (in thousands):
| Estimated Useful Life |
June 30, 2010 | March 31, 2011 | ||||||||||
| Land |
— | $ | 1,599 | $ | 1,932 | |||||||
| Building |
40 years | 247 | 1,007 | |||||||||
| Transportation and plant equipment (including capital lease assets) |
3 — 10 years | 11,407 | 14,353 | |||||||||
| Furniture, fixtures and office equipment |
3 — 10 years | 2,865 | 3,184 | |||||||||
|
|
|
|
|
|||||||||
| 16,118 | 20,476 | |||||||||||
| Less accumulated depreciation and amortization |
(5,936 | ) | (8,754 | ) | ||||||||
|
|
|
|
|
|||||||||
| $ | 10,182 | $ | 11,722 | |||||||||
|
|
|
|
|
|||||||||
Lease Fleet
The Company has a fleet of storage containers, mobile offices, modular buildings and steps that it primarily leases to customers under operating lease agreements with varying terms. The lease fleet (or lease or rental equipment) is recorded at cost and depreciated on the straight-line basis over the estimated useful life (5 - 20 years), after the date the units are put in service, and are depreciated down to their estimated residual values (up to 70% of cost). In the opinion of management, estimated residual values are at or below net realizable values. The Company periodically reviews these depreciation policies in light of various factors, including the practices of the larger competitors in the industry, and its own historical experience.
Units in the lease fleet are also available for sale. The cost of sales of a unit in the lease fleet is recognized at the carrying amount at the date of sale.
Income Taxes
The Company uses the asset and liability method of accounting for income taxes. Under this method, deferred tax assets and liabilities are recorded for temporary differences between the financial reporting basis and income tax basis of assets and liabilities at the balance sheet date multiplied by the applicable tax rates. Valuation allowances are established when necessary to reduce deferred tax assets to the amount expected to be realized. Income tax expense is recorded for the amount of income tax payable or refundable for the period increased or decreased by the change in deferred tax assets and liabilities during the period.
The Company files U.S. Federal tax returns, multiple U.S. state (and state franchise) tax returns and Australian and New Zealand tax returns. For U.S. Federal tax purposes, all periods subsequent to June 30, 2008 are subject to examination by the U.S. Internal Revenue Service (“IRS”). The Company believes that its income tax filing positions and deductions would be sustained on audit and does not anticipate any adjustments that would result in a material change. Therefore, no reserves for uncertain income tax positions have been recorded. In addition, the Company does not anticipate that the total amount of unrecognized tax benefit related to any particular tax position will change significantly within the next 12 months.
The Company’s policy for recording interest and penalties, if any, will be to record such items as a component of income taxes.
Net Income per Common Share
Basic net income per common share is computed by dividing net income attributable to common stockholders by the weighted-average number of shares of common stock outstanding during the periods. Diluted net income per common share reflects the potential dilution that could occur if securities or other contracts to issue common stock were exercised or converted into common stock or resulted in the issuance of common stock that then shared in the earnings of the Company. The potential dilutive securities the Company has outstanding are warrants and stock options. The following is a reconciliation of weighted average shares outstanding used in calculating earnings per common share:
| Quarter Ended March 31, | Nine Months Ended March 31, | |||||||||||||||
| 2010 | 2011 | 2010 | 2011 | |||||||||||||
| Basic |
17,826,052 | 22,013,299 | 17,826,052 | 22,013,299 | ||||||||||||
| Assumed exercise of warrants |
— | — | — | — | ||||||||||||
| Assumed exercise of stock options |
— | — | — | — | ||||||||||||
|
|
|
|
|
|
|
|
|
|||||||||
| Diluted |
17,826,052 | 22,013,299 | 17,826,052 | 22,013,299 | ||||||||||||
|
|
|
|
|
|
|
|
|
|||||||||
I-8
Table of Contents
GENERAL FINANCE CORPORATION AND SUBSIDIARIES
NOTES TO CONDENSED CONSOLIDATED FINANCIAL STATEMENTS
Potential common stock equivalents (consisting of units, warrants and stock options) totaling 8,350,040 for the quarter and nine months ended March 31, 2010 and 5,226,602 and 5,289,309 for the quarter and nine months ended March 31, 2011, respectively, have been excluded from the computation of diluted earnings per share because the effect is anti-dilutive.
Recently Issued and Adopted Accounting Pronouncements
Effective July 1, 2009, the FASB ASC became the single official source of authoritative, nongovernmental U.S. GAAP. The historical U.S. GAAP hierarchy was eliminated and the ASC became the only level of authoritative U.S. GAAP, other than guidance issued by the SEC. The Company’s accounting policies were not affected by the conversion to ASC. However, references to specific accounting standards in the notes to our consolidated financial statements have been changed to refer to the appropriate section of the ASC.
In October 2009, the FASB issued an accounting standards update to ASC Topic 605, Revenue Recognition, that impacts the determination of when the individual products or services (deliverables) included in a multiple-element arrangement may be treated as separate units of accounting. These new standards are effective for arrangements entered into subsequent to June 30, 2011 and the Company does not expect the adoption will have a material impact on its consolidated financial position or results of operations.
In July 2010, the FASB issued an accounting standards update to ASC Topic 310, Receivables, that requires disclosures about the credit quality of financing receivables (excluding short-term trade accounts receivable or receivables measured at fair value or lower of cost or fair value) and the allowance for credit losses. The disclosure requirements are effective for the periods ending on or after December 15, 2010 and its adoption did not have a significant impact on the Company’s consolidated financial position or results of operations as it does not have significant receivables that met the definition of financing receivables at March 31, 2010.
In December 2010, the FASB issued an accounting standards update to ASC Topic 805, Business Combinations, that requires public companies that enter into business combinations that are material on an individual or aggregate basis, and present comparative financial statements, to disclose revenue and earnings of the combined entity as though the business combination(s) that occurred during the current year had occurred as of the beginning of the comparable prior annual reporting period only. The update also expands the supplemental pro forma disclosures under ASC Topic 805 to include a description of the nature and amount of material, nonrecurring pro forma adjustments directly attributable to the business combination included in the reported pro forma revenue and earnings. These new standards are effective for business combinations entered into subsequent to June 30, 2011 and the Company does not expect the adoption to have any impact on its consolidated financial position or results of operations.
In August 2010, the FASB, as result of a joint project with the International Accounting Standards Board to simplify lease accounting and improve the quality of and comparability of financial information for users, published a proposal that would change the accounting and financial reporting for both lessee and lessor under ASC Topic 840, Leases. The proposal would effectively eliminate off-balance sheet accounting for most of the operating leases of lessees and would apply one of two methods to lease accounting for lessors, depending on whether the lessor retains exposure to significant risks or benefits of the underlying assets. The date of issuance of the final standards by the FASB and the effective date are to be determined. The Company believes that the final standards, if issued in substantially the same form as the published proposal, would have a material effect in the presentation of its consolidated financial position and results of operations.
Note 3. Equity Transactions
Warrants Issued in IPO
In connection with its initial public offering (“IPO”), the Company sold to the representative of the underwriters for $100 an option to purchase 750,000 units for $10.00 per unit. Each unit consisted of one share of common stock and one warrant and each warrant entitles the holder to purchase from the Company one share of common stock at an exercise price of $7.20. This option expired on April 5, 2011.
Cumulative Preferred Stock
The Company is conducting private placements of Series A 12.5% Cumulative Preferred Stock, par value $0.0001 per share and liquidation preference of $50 per share (“Series A Preferred Stock”); and Series B 8% Cumulative Preferred Stock, par value of $0.0001 per share and liquidation value of $1,000 per share (“Series B Preferred Stock”). The Series B Preferred Stock is offered primarily in connection with business combinations.
I-9
Table of Contents
GENERAL FINANCE CORPORATION AND SUBSIDIARIES
NOTES TO CONDENSED CONSOLIDATED FINANCIAL STATEMENTS
The Series A Preferred Stock and the Series B Preferred Stock are referred to collectively as the “Cumulative Preferred Stock.”
The Cumulative Preferred Stock is not convertible into GFN common stock, has no voting rights, except as required by Delaware law, and is not redeemable prior to February 1, 2014; at which time it may be redeemed at any time, in whole or in part, at the Company’s option. Holders of the Cumulative Preferred Stock are entitled to receive, when declared by the Company’s Board of Directors, annual dividends payable quarterly in arrears on the 31st day of January, July and October of each year and the 30th day of April of each year. In the event of any liquidation or winding up of the Company, the holders of the Cumulative Preferred Stock will have preference to holders of common stock; with the holders of the Series A Preferred Stock having preference over holders of the Series B Preferred Stock. The Company has agreed to register for public trading the Cumulative Preferred Stock no later than one year from issuance.
In connection with the acquisition of AMS (see Note 1), the Company issued 110 shares of Series B Preferred Stock with a liquidation value of $110,000 that is redeemable in three annual installments from the dates of issuance. As a result, these issuances are classified as a liability in the consolidated balance sheet under the caption “Senior and other debt.”
As of March 31, 2011, since issuance, dividends paid or payable totaled $340,000 and $22,000 for the Series A Preferred Stock and Series B Preferred Stock, respectively. The characterization of dividends to the recipients for Federal income tax purposes is made based upon the earnings and profits of the Company, as defined by the Internal Revenue Code.
Rights Offering
On June 25, 2010, the Company completed a rights offering to stockholders of record as of May 14, 2010. The offering entitled holders of the rights to purchase units at $1.50 per unit, with each unit consisting of one share of GFN common stock and a three-year warrant to purchase 0.5 additional shares of GFN common stock at an exercise price of $4.00 per share. The Company’s rights offering resulted in, after deducting direct offering costs and subscription receivables, net proceeds of $5,908,000.
In FY 2011, subscription receivables for 10,000 units were cancelled and, as a result, the Company now reports that it sold a total of 4,187,247 shares of common stock and 4,187,247 warrants to acquire an additional 2,095,623 shares of common stock at an exercise price of $4.00 per share. As of March 31, 2011, subscription receivables for 40,000 units totaled $60,000.
The Company used $4,800,000 of the net proceeds from the rights offering in the refinancing at Pac-Van in FY 2011 (see Note 4).
Note 4. Senior and Other Debt
The following is a discussion of the Company’s significant senior and other debt.
Royal Wolf Senior Credit Facility and Subordinated Notes
Royal Wolf has a senior credit facility, as amended, with Australia and New Zealand Banking Group Limited (“ANZ”), the substantial portion of which matures on September 14, 2012. The facility is subject to annual reviews by ANZ and is secured by substantially all of the assets of the Company’s Australian and New Zealand subsidiaries. The aggregate ANZ facility is comprised of various sub-facilities, not all of which provide additional borrowing availability. As of March 31, 2011, based upon the exchange rate of one Australian dollar to $1.0311 U.S. dollar and one New Zealand dollar to $0.7369 Australian dollar, borrowings and availability under the ANZ credit facility totaled $88,589,000 (AUS$85,917,000) and $3,470,000 (AUS$3,365,000), respectively. Principal payments are required to be a minimum of AUS$1,625,000 ($1,676,000) per quarter, with an installment equal to 80% of Free Cash Flow, as defined, paid within 60 days from the end of each fiscal year. Approximately $63,466,000 (AUS$61,552,000) and $7,515,000 (AUS$7,288,000) of the borrowings under the ANZ credit facility at March 31, 2011 bear interest at ANZ’s prime rate, plus 3.15% per annum and 4.15% per annum, respectively; with the remaining borrowings bearing interest at varying rates. As of March 31, 2011, the weighted-average interest rate was 8.7%; which includes the effect of interest rate swap contracts and options (caps).
I-10
Table of Contents
GENERAL FINANCE CORPORATION AND SUBSIDIARIES
NOTES TO CONDENSED CONSOLIDATED FINANCIAL STATEMENTS
The ANZ senior credit facility is subject to certain covenants, including compliance with specified consolidated senior and total interest coverage and senior and total debt ratios, as defined, for each financial quarter based on earnings before interest, income taxes, depreciation and amortization and other non-operating costs (“EBITDA”), as defined, on a year-to-date or trailing twelve-month (“TTM”) basis; and restrictions on the payment of dividends, loans and payments to affiliates and granting of new security interests on the assets of any of the entities who are parties to the senior credit facility. A change of control in any of GFN Holdings or its direct and indirect subsidiaries without the prior written consent of ANZ constitutes an event of default under the facility. The ANZ senior credit facility further provides, among other things, that the $5,500,000 due Bison Capital (see below) must be paid by a capital infusion from GFN and that capital expenditures of property, plant and equipment over $2,062,000 (AUS$2,000,000) in the year ending June 30, 2011 be approved by ANZ.
On September 13, 2007, in conjunction with the closing of the acquisition of Royal Wolf, the Company entered into a securities purchase agreement with Bison Capital, pursuant to which the Company issued and sold to Bison Capital, at par, a secured senior subordinated promissory note in the principal amount of $16,816,000 (the “Bison Note”). Pursuant to the securities purchase agreement, the Company issued to Bison Capital warrants to purchase 500,000 shares of common stock of GFN. The warrants issued to Bison Capital represent the right to purchase 500,000 shares of GFN’s common stock at an initial exercise price of $8.00 per share, subject to adjustment for stock splits and stock dividends. Unexercised warrants will expire September 13, 2014. The Bison Note bears interest at the annual rate of 13.5%, payable quarterly in arrears, and matures on March 13, 2013. The Company may extend the maturity date by one year, provided that it is not then in default. The Company may prepay the Bison Note at a declining price of 101% of par prior to September 13, 2011 and 100% of par thereafter. The maturity of the Bison Note may be accelerated upon an event of default or upon a change of control of GFN Finance or any of its subsidiaries. Payment of the Bison Note is secured by a lien on all or substantially all of the assets of GFN Finance and its subsidiaries, subordinated and subject to the intercreditor agreement with ANZ. If, during the 66-month period ending on the scheduled maturity date, GFN’s common stock has not traded above $10 per share for any 20 consecutive trading days on which the average daily trading volume was at least 30,000 shares (ignoring any daily trading volume above 100,000 shares), upon demand by Bison Capital, the Company will pay Bison Capital on the scheduled maturity date a premium of $1,237,000 (AUS$1,200,000), less any gains realized by Bison Capital from any prior sale of the warrants and warrant shares. This premium is also payable upon any acceleration of the Bison Note due to an event of default or change of control of GFN Finance or any of its subsidiaries. As a condition to receiving this premium, Bison Capital must surrender for cancellation any remaining warrants and warrant shares.
On May 1, 2008, the Company issued and sold to Bison Capital a second secured senior subordinated promissory note in the principal amount of $5,500,000 on terms comparable to the original Bison Note, except that the maturity of this second note is July 1, 2011 and must be paid by a capital infusion from GFN (see above). Collectively, these two notes are referred to as the “Bison Notes.” At March 31, 2011, the principal balance of the Bison Notes was $21,856,000. The Bison Notes have covenants that require the maintenance of minimum EBITDA levels, as defined, and a total debt ratio based on a TTM EBITDA basis; as well as restrictions on capital expenditures.
Pac-Van Senior Credit Facility
Prior to July 16, 2010, Pac-Van had a senior credit facility, as amended, with a syndicate of four financial institutions led by Bank of America, N.A. (“BOA”), as administrative and collateral agent, and a $25,000,000 senior subordinated secured note payable to SPV Capital Funding, L.L.C. (“SPV”). On July 16, 2010, the Company entered into several agreements relating to: (a) a new $85,000,000 senior secured revolving credit facility at Pac-Van with a syndicate led by PNC Bank, National Association (“PNC”) and including Wells Fargo Bank, National Association (“Wells Fargo”) and Union Bank, N.A. (“UB”) (the “PNC Credit Facility”); and (b) a new $15,000,000 senior subordinated note with Laminar Direct Capital, L.L.C. (“Laminar”) issued by GFN (the “Laminar Note”). Borrowings under the PNC Credit Facility and proceeds from both the issuance of the Laminar Note and the Company’s rights offering completed on June 25, 2010 (see Note 3) were used to prepay in full all borrowings under the BOA credit facility and the $25,000,000 senior subordinated secured note payable to SPV.
Under the terms of the PNC Credit Facility, Pac-Van may borrow up to $85,000,000, subject to the terms of a borrowing base, as defined, and will accrue interest, at Pac-Van’s option, either at the prime rate plus 2.75%, or the Eurodollar rate plus 3.75%. The PNC Credit Facility also provides for the issuance of irrevocable standby letters of credit in amounts totaling up to $5,000,000, contains certain financial covenants, including fixed charge coverage ratios, senior leverage ratios and lease fleet utilization ratios; and also includes customary negative and other covenants, including events of default relating to a change of control, as defined, at GFN, GFNNA (which has guaranteed the repayment of all outstanding borrowings and obligations of the PNC Credit Facility) and Pac-Van or upon the cessation of involvement of Ronald F. Valenta as a director or officer in the operations and management of GFN, GFNNA or Pac-Van.
I-11
Table of Contents
GENERAL FINANCE CORPORATION AND SUBSIDIARIES
NOTES TO CONDENSED CONSOLIDATED FINANCIAL STATEMENTS
The PNC Credit Facility matures on January 16, 2013, at which time all amounts borrowed must be repaid, but Pac-Van has the right to prepay loans in whole or in part at any time, provided that Pac-Van will be required to pay PNC a prepayment fee of $700,000 if it prepays the loans in full prior to July 16, 2011 and to pay PNC a prepayment fee of $350,000 if it prepays the loans in full after July 16, 2011 but prior to July 16, 2012. At March 31, 2011, borrowings and availability under the PNC Credit Facility totaled $68,546,000 and $7,510,000, respectively, and the weighted-average interest rate was 4.2%.
The repayment of borrowings under the PNC Credit Facility is secured by substantially all of the assets of Pac-Van and by a limited guaranty by Ronald F. Valenta and Lydia D. Valenta (the “Valenta Limited Guaranty”). Pursuant to the Valenta Limited Guaranty, the Valentas guaranteed $10,000,000 of borrowings from July 16, 2010 until June 30, 2011, $8,000,000 of borrowings from July 1, 2011 until June 30, 2012 and $6,000,000 of borrowings from July 1, 2012 until January 16, 2013. The amounts guaranteed by the Valentas will only be reduced if no event of default has occurred under the PNC Credit Facility and if Pac-Van has delivered to PNC the certificates necessary to demonstrate compliance by Pac-Van with the financial covenants at the date of each scheduled reduction. In consideration for entering into the Valenta Limited Guaranty, Pac-Van will pay the Valentas a fee equal to 1.2% of the lower of outstanding borrowings or the guaranty amount. A guarantee fee of $120,000 for the first year was paid at or near the closing of the PNC Credit Facility and, commencing with the first anniversary from the closing date, the guaranty fee will be paid in advance at a rate of 0.3% per quarter, so long as Pac-Van remains in compliance with the covenants of the PNC Credit Facility. In addition, the Valentas entered into a pledge and security agreement for the benefit of PNC whereby the Valentas pledged a deposit account maintained by PNC, and all interest accrued thereon, to secure the repayment of all loans and the performance of all obligations under the PNC Credit Facility.
Laminar Note
The $15,000,000 Laminar Note accrues interest at the floating rate of LIBOR plus 10.0% per annum, provided that LIBOR shall be not less than 3.0%, and is payable monthly in arrears commencing on August 1, 2010. The Laminar Note matures on July 16, 2013, at which time all amounts borrowed must be repaid; but it may be prepaid by GFN in part or in full at any time before the maturity date without penalty and by Pac-Van, upon prior written notice, subject to the terms of the intercreditor agreement among Pac-Van, GFNNA, PNC and Laminar.
The Laminar Note contains certain financial covenants, including a consolidated funded indebtedness-to-consolidated EBITDA leverage ratio, a minimum consolidated EBITDA covenant for the four most recently completed calendar quarters of not less than $28,000,000; and customary negative and other covenants, including events of default relating to a change of control, as defined, at GFN, GFNNA and Pac-Van (both of which have guaranteed the repayment of all outstanding borrowings and obligations of the Laminar Note) and covenants which limit the ability of GFNNA and Pac-Van to sell assets, enter into acquisitions and incur additional indebtedness. In addition, the terms of the Laminar Note prohibit GFNNA and Pac-Van from extending the maturity of the PNC Credit Facility to a date later than April 16, 2013, increasing the maximum indebtedness above $93,500,000 without the prior written consent of Laminar, entering into interest rate increases for indebtedness and from undertaking certain other actions.
Other
The Company has a credit agreement at GFN, as amended, with UB for a $1,000,000 credit facility. Borrowings or advances under this facility bear interest at UB’s “Reference Rate” (which approximates the prime rate), plus 2.0%, and are due and payable at the earlier of 60 days from the advance date or the facility maturity date of April 2, 2012. The facility is guaranteed by GFN U.S. and requires the maintenance of certain quarterly and year-end financial reporting covenants. As of March 31, 2011, there were no borrowings outstanding under the UB credit facility.
Other debt (including redeemable preferred stock – see Note 3) totaled $2,092,000 at March 31, 2011.
I-12
Table of Contents
GENERAL FINANCE CORPORATION AND SUBSIDIARIES
NOTES TO CONDENSED CONSOLIDATED FINANCIAL STATEMENTS
Loan Covenant Compliance
At March 31, 2011, the Company was not in compliance with the senior leverage ratio financial covenant under the PNC Credit Facility. In addition, a federal tax lien was filed against the personal residence of the Valentas, which violated the Valenta Limited Guaranty, creating an event of default under the PNC Credit Facility. The senior lenders have amended the PNC Credit Facility to, among other things, waive this covenant noncompliance at the March 31, 2011 measurement date, waive the event of default related to the Valenta Limited Guaranty and require a cash equity infusion of not less than $5,000,000 by July 31, 2011. The Company believes that, unless there is a significant improvement in Pac-Van’s operating results or a capital infusion of greater than the required $5,000,000 is made to reduce the outstanding borrowings under the PNC Credit Facility, it is likely that it will be noncompliant with this financial covenant at year end. In the event of noncompliance, there is no assurance that the senior lenders would again consent to a waiver or an amendment; or that such consent would not be conditioned upon the receipt of a cash payment, revised principal payout terms, increased interest rates, or restrictions in the expansion of the credit facilities, or that our senior lenders would not exercise rights that would be available to them, including, among other things, demanding payment of outstanding borrowings.
Note 5. Financial Instruments
Fair Value Measurements
The Company adopted what is now codified as FASB ASC Topic 820, Fair Value Measurements and Disclosures, effective July 1, 2008. FASB ASC Topic 820 defines fair value as the price that would be received from selling an asset or paid to transfer a liability in an orderly transaction between market participants. As such, fair value is a market-based measurement that should be determined based on assumptions that market participants would use in pricing an asset or liability. As a basis for considering such assumptions, FASB ASC Topic 820 establishes a three-tier fair value hierarchy, which prioritizes the inputs used in measuring fair value, as follows:
Level 1 - Observable inputs such as quoted prices in active markets for identical assets or liabilities;
Level 2 - Observable inputs, other than Level 1 inputs in active markets, that are observable either directly or indirectly; and
Level 3 - Unobservable inputs in which there is little or no market data, which require the reporting entity to develop its own assumptions.
Exposure to credit, interest rate and currency risks arises in the normal course of the Company’s business. The Company may use derivative financial instruments to hedge exposure to fluctuations in foreign exchange rates and interest rates. The Company’s swap contracts and options (caps) and forward-exchange contracts are not traded on a market exchange; therefore, the fair values are determined using valuation models that include assumptions about yield curve at the reporting dates as well as counter-party credit risk. The Company has consistently applied these calculation techniques to all periods presented.
I-13
Table of Contents
GENERAL FINANCE CORPORATION AND SUBSIDIARIES
NOTES TO CONDENSED CONSOLIDATED FINANCIAL STATEMENTS
Derivative instruments measured at fair value and their classification on the consolidated balances sheets and consolidated statements of operations are as follows (in thousands):
| Derivative - Fair Value (Level 2) | ||||||||||
| Type of Derivative Contract |
June 30, | March 31, | ||||||||
| Balance Sheet Classification |
2010 | 2011 | ||||||||
| Swap Contracts and Options (Caps) |
Trade payables and accrued liabilities | $ | (1,222 | ) | $ | (873 | ) | |||
| Forward-Exchange Contracts |
Trade and other receivables | 247 | — | |||||||
| Forward-Exchange Contracts |
Trade payables and accrued liabilities | — | (175 | ) | ||||||
|
|
|
|
|
|||||||
| Type of Derivative Contract |
Statement of Operations Classification |
Quarter Ended March 31, |
Nine Months Ended March 31, |
|||||||||||||||
| 2010 | 2011 | 2010 | 2011 | |||||||||||||||
| Swap Contracts and Options (Caps) |
Unrealized gain included in interest expense | $ | 132 | $ | 67 | $ | 313 | $ | 545 | |||||||||
| Forward-Exchange Contracts |
Foreign currency exchange gain (loss) and other | (74 | ) | (37 | ) | 687 | (373 | ) | ||||||||||
|
|
|
|
|
|
|
|
|
|||||||||||
Fair Value of Financial Instruments
Under the provisions of FASB ASC Topic 825, Financial Instruments, the carrying value of the Company’s financial instruments, which include cash and cash equivalents, net receivables, trade payables and accrued liabilities, borrowings under the senior credit facilities, the subordinated notes, interest rate swap and forward exchange contracts and commercial bills; approximate fair value due to current market conditions, maturity dates and other factors.
Interest Rate Swap Contracts
The Company’s exposure to market risk for changes in interest rates relates primarily to its long-term debt obligations. The Company’s policy is to manage its interest expense by using a mix of fixed and variable rate debt.
To manage this mix in a cost-efficient manner, the Company enters into interest rate swaps and interest rate options, in which the Company agrees to exchange, at specified intervals, the difference between fixed and variable interest amounts calculated by reference to an agreed-upon notional principal amount. These swaps and options are designated to hedge changes in the interest rate of a portion of the ANZ outstanding borrowings. The Company believes that financial instruments designated as interest rate hedges are highly effective. However, documentation of such, as required by FASB ASC Topic 815, Derivatives and Hedging, does not exist. Therefore, all movements in the fair values of these hedges are reported in the statement of operations in the period in which fair values change.
I-14
Table of Contents
GENERAL FINANCE CORPORATION AND SUBSIDIARIES
NOTES TO CONDENSED CONSOLIDATED FINANCIAL STATEMENTS
The Company’s interest rate swap and option (cap) contracts are not traded on a market exchange; therefore, the fair values are determined using valuation models which include assumptions about the interest rate yield curve at the reporting dates (Level 2 fair value measurement). As of June 30, 2010 and March 31, 2011, there were four open interest rate swap contracts and three open interest rate option (cap) contracts that mature between June 2011 and September 2012, as follows (dollars in thousands):
| June 30, 2010 | March 31, 2011 | |||||||||||||||
| Swap | Option (Cap) | Swap | Option (Cap) | |||||||||||||
| Notional amounts |
$ | 23,260 | $ | 13,457 | $ | 27,646 | $ | 16,046 | ||||||||
| Fixed/Strike Rates |
7.19% - 8.22% | 7.19% - 8.22% | 7.19% - 8.22% | 7.19% - 8.22% | ||||||||||||
| Floating Rates |
6.33% - 8.12% | 6.33% - 8.12% | 5.78% - 8.13% | 5.78% - 8.13% | ||||||||||||
| Fair Value of Combined Contracts |
$ | (1,235 | ) | $ | 13 | $ | (874 | ) | $ | 1 | ||||||
|
|
|
|
|
|
|
|
|
|||||||||
Foreign Currency Risk
The Company has transactional currency exposures. Such exposure arises from sales or purchases in currencies other than the functional currency. The currency giving rise to this risk is primarily U.S. dollars. Royal Wolf has a bank account denominated in U.S. dollars into which a small number of customers pay their debts. This is a natural hedge against fluctuations in the exchange rate. The funds are then used to pay suppliers, avoiding the need to convert to Australian dollars. Royal Wolf uses forward currency contracts and options to eliminate the currency exposures on the majority of its transactions denominated in foreign currencies, either by transaction if the amount is significant, or on a general cash flow hedge basis. The forward currency contracts and options are always in the same currency as the hedged item. The Company believes that financial instruments designated as foreign currency hedges are highly effective. However documentation of such as required by ASC Topic 815 does not exist. Therefore, all movements in the fair values of these hedges are reported in the statement of operations in the period in which fair values change. As of June 30, 2010, there were 15 open forward exchange contracts and three open currency option contracts; and, as of March 31, 2011, there were six open forward exchange contracts that mature between April 2011 and June 2011, as follows (dollars in thousands):
| June 30, 2010 | March 31, 2011 | |||||||||||||||
| Forward Exchange | Currency Option | Forward Exchange | Currency Option | |||||||||||||
| Notional amounts |
$ | 7,018 | $ | 9,164 | $ | 3,235 | $ | — | ||||||||
| Exchange/Strike Rates (AUD to USD) |
0.7005 – 0.8960 | 0.7000 – 0.8310 | 0.8762 – 0.9984 | — | ||||||||||||
| Fair Value of Combined Contracts |
$ | 149 | $ | 98 | $ | (175 | ) | $ | — | |||||||
|
|
|
|
|
|
|
|
|
|||||||||
The Company also has certain U.S. dollar-denominated debt at Royal Wolf, including intercompany borrowings, which are remeasured at each financial reporting date with the impact of the remeasurement being recorded in our consolidated statements of operations. Unrealized gains and losses resulting from such remeasurement due to changes in the Australian exchange rate to the U.S. dollar could have significant impact in the Company’s reported results of operations, as well as any realized gains and losses from the payments on such U.S. dollar-denominated debt and intercompany borrowings. In FY 2010 and FY 2011, net unrealized and realized foreign exchange gains totaled $2,637,000 and $423,000, and $4,498,000 and $450,000, respectively.
Note 6. Related Party Transactions
Effective January 31, 2008, the Company entered into a lease with an affiliate of Ronald F. Valenta, a director and the chief executive officer of the Company, for its new corporate headquarters in Pasadena, California. The rent is $7,393 per month, effective March 1, 2009, plus allocated charges for common area maintenance, real property taxes and insurance, for approximately 3,000 square feet of office space. The term of the lease is five years, with two five-year renewal options, and the rent is adjusted yearly based on the consumer price index. Rental payments were $83,000 and in both FY 2010 and FY 2011, respectively.
Effective October 1, 2008, the Company entered into a services agreement with an affiliate of Mr. Valenta for certain accounting, administrative and secretarial services to be provided at the corporate offices and for certain operational, technical, sales and marketing services to be provided directly to the Company’s operating subsidiaries. Charges for services rendered at the corporate offices will be, until further notice, at $7,000 per month and charges for services rendered to the Company’s subsidiaries will vary depending on the scope of services provided. The services agreement provides for, among other things, mutual modifications to the scope of services and rates charged and automatically renews for successive one-year terms, unless terminated in writing by either party not less than 30 days prior to the fiscal year end. Total charges to the Company for services rendered under this agreement totaled $86,000 ($63,000 at the corporate office and $23,000 at the operating subsidiaries) in FY 2010 and $181,000 ($63,000 at the corporate office and $118,000 at the operating subsidiaries) in FY 2011.
I-15
Table of Contents
GENERAL FINANCE CORPORATION AND SUBSIDIARIES
NOTES TO CONDENSED CONSOLIDATED FINANCIAL STATEMENTS
Note 7. Stock Option Plans
On August 29, 2006, the Board of Directors of the Company adopted the General Finance Corporation 2006 Stock Option Plan (“2006 Plan”), which was approved and amended by stockholders on June 14, 2007 and December 11, 2008, respectively. Options granted and outstanding under the 2006 Plan are either incentive stock options under Section 422 of the Internal Revenue Code of 1986, as amended, or so-called non-qualified options that are not intended to meet incentive stock option requirements. All options granted do not have a term in excess of ten years, and the exercise price of any option is not less than the fair market value of the Company’s common stock on the date of grant. After the adoption by the Board of Directors and upon the approval of the 2009 Stock Incentive Plan by the stockholders (see below), the Company suspended any further grants under the 2006 Plan.
On September 21, 2009, the Board of Directors of the Company adopted the 2009 Stock Incentive Plan (“2009 Plan”), which was approved by the stockholders at the Company’s annual meeting on December 10, 2009. The 2009 Plan is an “omnibus” incentive plan permitting a variety of equity programs designed to provide flexibility in implementing equity and cash awards, including incentive stock options, nonqualified stock options, restricted stock grants, restricted stock units, stock appreciation rights, performance stock, performance units and other stock-based awards. Participants in the 2009 Plan may be granted any one of the equity awards or any combination of them, as determined by the Board of Directors or the Compensation Committee. Upon the approval of the 2009 Plan by the stockholders, the Company suspended further grants under the 2006 Plan (see above). Any stock options which are forfeited under the 2006 Plan will become available for grant under the 2009 Plan, but the total number of shares available under the 2006 Plan and the 2009 Plan will not exceed the 2,500,000 shares reserved for grant under the 2006 Plan. Unless terminated earlier at the discretion of the Board of Directors, the 2009 Plan will terminate September 21, 2019.
The 2006 Plan and the 2009 Plan are referred to collectively as the “Stock Incentive Plan.”
There have been no grants or awards of restricted stock, restricted stock units, stock appreciation rights, performance stock or performance units under the Stock Incentive Plan. All grants to-date consist of incentive and non-qualified stock options that vest over a period of up to five years (“time-based options”) and non-qualified stock options that vest over varying periods that are dependent on the attainment of certain defined EBITDA and other targets for FY 2011 and subsequent fiscal years (“performance-based options”).
On July 14, 2010 (“July 2010 Grant”), the Company granted options to three non-employee consultants to purchase 40,000 shares of common stock at an exercise price of equal to the closing market value of the Company’s common stock as of date, or $1.22 per share, with a vesting period of three years.
On September 15, 2010 (“September 2010 Grant”), the Company granted options to three officers of GFN and 12 key employees of Pac-Van and Royal Wolf to purchase 298,000 shares of common stock at an exercise price equal to the closing market price of the Company’s common stock as of that date, or $1.06 per share. The options under the September 2010 Grant vest over four years, subject to performance conditions based on achieving cumulative EBITDA and indebtedness targets for the fiscal years ending June 30, 2011 - 2013.
On December 9, 2010 (“December 2010 Grant”), the Company granted options to two members of its Board of Directors to purchase 18,000 shares of common stock at an exercise price equal to the closing market price of the Company’s common stock as of that date, or $2.04 per share, with a vesting period of three years.
The fair value of the stock options granted under the Stock Incentive Plan was determined by using the Black-Scholes option-pricing model. The range of the fair value of the stock options granted (other than to non-employee consultants) and the assumptions used are as follows:
| Fair value of stock option |
$ | 0.81 - $3.94 | ||
|
|
|
|||
| Assumptions used: |
||||
| Risk-free interest rate |
1.99% - 4.8% | |||
| Expected life (in years) |
7.5 | |||
| Expected volatility |
26.5% - 82.5% | |||
| Expected dividends |
— | |||
|
|
|
I-16
Table of Contents
GENERAL FINANCE CORPORATION AND SUBSIDIARIES
NOTES TO CONDENSED CONSOLIDATED FINANCIAL STATEMENTS
At March 31, 2011, the weighted-average fair value of the stock options granted to non-employee consultants was $2.89, determined using the Black-Scholes option-pricing model using the following assumptions: A risk-free interest rate of 3.18% - 3.30% an expected life of 8.8 – 9.3 years, an expected volatility of 80.0%, and no expected dividend. A summary of the Company’s stock option activity and related information as of and for FY 2011 follows:
| Number of Options (Shares) |
Weighted- Average Exercise Price |
Weighted- Average Remaining Contractual Term (Years) |
||||||||||
| Outstanding at June 30, 2010 |
1,254,910 | $ | 6.65 | |||||||||
| Granted |
356,000 | 1.13 | ||||||||||
| Exercised |
— | — | ||||||||||
| Forfeited or expired |
(197,340 | ) | 3.50 | |||||||||
|
|
|
|
|
|||||||||
| Outstanding at March 31, 2011 |
1,413,570 | $ | 5.70 | 7.5 | ||||||||
|
|
|
|
|
|
|
|||||||
| Vested and expected to vest at March 31, 2011 |
1,397,638 | $ | 5.69 | 7.5 | ||||||||
|
|
|
|
|
|
|
|||||||
| Exercisable at March 31, 2011 |
576,237 | $ | 7.80 | 6.5 | ||||||||
|
|
|
|
|
|
|
|||||||
At March 31, 2011, outstanding time-based options and performance-based options totaled 895,550 and 518,020, respectively. Also at that date, the Company’s market price for its common stock was $1.98 per share, which was at or below the exercise prices of the majority of the outstanding stock options. As a result, the intrinsic value of the outstanding stock options at that date was only $352,000.
Share-based compensation of $2,732,000 related to stock options has been recognized in the statement of operations, with a corresponding benefit to additional paid-in capital, from inception through March 31, 2011. At that date, there remains $1,524,000 of unrecognized compensation expense to be recorded on a straight-line basis over the remaining weighted-average vesting period of 2.0 years.
A deduction is not allowed for U.S. income tax purposes with respect to non-qualified options granted in the United States until the stock options are exercised or, with respect to incentive stock options issued in the United States, unless the optionee makes a disqualifying disposition of the underlying shares. The amount of any deduction will be the difference between the fair value of the Company’s common stock and the exercise price at the date of exercise. Accordingly, there is a deferred tax asset recorded for the U.S. tax effect of the financial statement expense recorded related to stock option grants in the United States. The tax effect of the U.S. income tax deduction in excess of the financial statement expense, if any, will be recorded as an increase to additional paid-in capital.
Note 8. Commitments and Contingencies
Put and Call Options
In conjunction with the closing of the acquisition of Royal Wolf, the Company entered into a shareholders agreement with Bison Capital. The shareholders agreement was amended on September 21, 2009 and provides that, at any time after July 1, 2011, Bison Capital may require the Company to purchase from Bison Capital all of its 13.8% outstanding capital stock of GFN U.S. The purchase price for the capital stock (which is payable in cash or, if mutually agreeable to both the Company and Bison Capital, paid in GFN common stock or some combination thereof) is the greater of the following:
(i) the amount equal to Bison Capital’s ownership percentage in GFN U.S. (13.8%) multiplied by the result of 8.25 multiplied by the sum of Royal Wolf’s EBITDA for a twelve-month determination period, as defined, plus all administrative expense payments or reimbursements made by Royal Wolf to the Company during such period; minus the net debt of Royal Wolf, as defined; or
(ii) the amount equal to the Bison Capital’s ownership percentage in GFN U.S. multiplied by the result of the GFN trading multiple, as defined, multiplied by Royal Wolf’s EBITDA for the determination period; minus the net debt of Royal Wolf; or
(iii) the greater of (1) $12,850,000 or (2) Bison Capital’s ownership percentage in GFN U.S. (or 13.8%) multiplied by the result of 8.25 multiplied by the sum of Royal Wolf’s TTM EBITDA measured at the end of each fiscal quarter through June 30, 2011, as defined.
I-17
Table of Contents
GENERAL FINANCE CORPORATION AND SUBSIDIARIES
NOTES TO CONDENSED CONSOLIDATED FINANCIAL STATEMENTS
Also under the shareholders agreement, the Company had the option, at anytime prior to September 13, 2010, to cause Bison Capital to sell and transfer its 13.8% outstanding capital stock of GFN U.S. to the Company for a purchase price equal to the product of 2.75 and Bison Capital’s cost in the GFN U.S. capital stock. Subsequent to July 1, 2012, the Company’s call option purchase price is similar to (i) and (ii) of the Bison Capital put option, except the EBITDA multiple is 8.75.
The Company accounts for Bison Capital’s put option as a non-freestanding financial instrument classified in temporary equity, pursuant to the requirements of SEC Accounting Series Release (“ASR”) No. 268, Presentation in Financial Statements of “Redeemable Preferred Stock.” In accordance with the guidelines of ASR No. 268, the redemption value of the put option has been reflected as redeemable noncontrolling interest with, prior to July 1, 2009, the corresponding adjustment to additional paid-in capital determined after the attribution of the net income or loss of Royal Wolf to noncontrolling interest. Effective July 1, 2009, the Company adopted the provisions of a pronouncement issued in December 2007 on what is now codified as FASB ASC Topics 805, Business Combinations, and 810, Consolidation. In connection with the adoption of the provisions in these Topics, the Company now accretes the redemption value of the put option over the period from July 1, 2009 through June 30, 2011 with the corresponding adjustment to net income or loss attributable to noncontrolling interest.
Preferred Supply Agreement
In connection with a Business Sale Agreement dated November 14, 2007 with GE SeaCo Australia Pty Ltd. and GE SeaCo SRL (collectively “GE SeaCo”), Royal Wolf entered in a preferred supply agreement with GE SeaCo. Under the preferred supply agreement, GE SeaCo has agreed to sell to Royal Wolf, and Royal Wolf has agreed to purchase, all of GE SeaCo’s containers that GE SeaCo determines to sell, up to a maximum of 5,000 containers each year. The purchase price for the containers will be based on their condition and is specified in the agreement, subject to annual adjustment. In addition, Royal Wolf received a right of first refusal to purchase any additional containers that GE SeaCo desires to sell in Australia, New Zealand and Papua New Guinea. Either party may terminate the agreement upon no less than 90 days’ prior notice at any time after November 15, 2012.
Other Matters
The Company is not involved in any material lawsuits or claims arising out of the normal course of business. The nature of its business is such that disputes can occasionally arise with employees, vendors (including suppliers and subcontractors), and customers over warranties, contract specifications and contract interpretations among other things. The Company assesses these matters on a case-by-case basis as they arise. Reserves are established, as required, based on its assessment of its exposure. The Company has insurance policies to cover general liability and workers compensation related claims. In the opinion of management, the ultimate amount of liability not covered by insurance under pending litigation and claims, if any, will not have a material adverse effect on our financial position, operating results or cash flows.
I-18
Table of Contents
GENERAL FINANCE CORPORATION AND SUBSIDIARIES
NOTES TO CONDENSED CONSOLIDATED FINANCIAL STATEMENTS
Note 9. Cash Flows from Operating Activities and Other Financial Information
The following table provides a detail of cash flows from operating activities (in thousands):
| Nine Months Ended March 31, | ||||||||
| 2010 | 2011 | |||||||
| Cash flows from operating activities |
||||||||
| Net income (loss) |
$ | (116 | ) | $ | 2,341 | |||
| Adjustments to reconcile net income (loss) to cash flows from operating activities: |
||||||||
| Gain on sales and disposals of property, plant and equipment |
7 | (13 | ) | |||||
| Gain on sales of lease fleet |
(5,562 | ) | (3,928 | ) | ||||
| Unrealized foreign exchange gain |
(2,637 | ) | (4,498 | ) | ||||
| Unrealized loss (gain) on forward exchange contracts |
(687 | ) | 373 | |||||
| Unrealized gain on interest rate swaps and options |
(313 | ) | (545 | ) | ||||
| Depreciation and amortization |
14,929 | 14,252 | ||||||
| Amortization of deferred financing costs |
293 | 854 | ||||||
| Accretion of interest |
180 | 180 | ||||||
| Share-based compensation expense |
615 | 581 | ||||||
| Deferred income taxes |
(249 | ) | 1,108 | |||||
| Changes in operating assets and liabilities: |
||||||||
| Trade, subscription and other receivables, net |
10,421 | 5,541 | ||||||
| Inventories |
4,936 | 1,786 | ||||||
| Prepaid expenses and other |
497 | (169 | ) | |||||
| Trade payables, accrued liabilities and other deferred credits |
(3,685 | ) | 3,817 | |||||
| Income taxes |
133 | 123 | ||||||
|
|
|
|
|
|||||
| Net cash provided by operating activities |
$ | 18,762 | $ | 21,803 | ||||
|
|
|
|
|
|||||
I-19
Table of Contents
GENERAL FINANCE CORPORATION AND SUBSIDIARIES
NOTES TO CONDENSED CONSOLIDATED FINANCIAL STATEMENTS
Note 10. Segment Reporting
The tables below represent the Company’s revenues from external customers, operating income, interest income and expense, share-based compensation expense, depreciation and amortization, expenditures for additions to long-lived assets (consisting of lease fleet and property, plant and equipment) and long-lived assets; as attributed to its two geographic (and operating) segments (in thousands):
| Quarter Ended March 31, | Nine Months Ended March 31, | |||||||||||||||
| 2010 | 2011 | 2010 | 2011 | |||||||||||||
| Revenues from external customers |
||||||||||||||||
| North America: |
||||||||||||||||
| Sales |
$ | 5,831 | $ | 2,315 | $ | 15,037 | $ | 13,413 | ||||||||
| Leasing |
8,653 | 9,009 | 27,704 | 27,700 | ||||||||||||
|
|
|
|
|
|
|
|
|
|||||||||
| 14,484 | 11,324 | 42,741 | 41,113 | |||||||||||||
|
|
|
|
|
|
|
|
|
|||||||||
| Asia-Pacific: |
||||||||||||||||
| Sales |
13,403 | 18,222 | 40,098 | 52,674 | ||||||||||||
| Leasing |
10,598 | 13,776 | 30,011 | 37,897 | ||||||||||||
|
|
|
|
|
|
|
|
|
|||||||||
| 24,001 | 31,998 | 70,109 | 90,571 | |||||||||||||
|
|
|
|
|
|
|
|
|
|||||||||
| Total |
$ | 38,485 | $ | 43,322 | $ | 112,850 | $ | 131,684 | ||||||||
|
|
|
|
|
|
|
|
|
|||||||||
| Operating income |
||||||||||||||||
| North America |
$ | 811 | $ | 15 | $ | 3,350 | $ | 1,614 | ||||||||
| Asia-Pacific |
2,168 | 4,263 | 4,345 | 10,679 | ||||||||||||
|
|
|
|
|
|
|
|
|
|||||||||
| Total |
$ | 2,979 | $ | 4,278 | $ | 7,695 | $ | 12,293 | ||||||||
|
|
|
|
|
|
|
|
|
|||||||||
| Interest income |
||||||||||||||||
| North America |
$ | — | $ | — | $ | — | $ | — | ||||||||
| Asia-Pacific |
56 | 124 | 178 | 354 | ||||||||||||
|
|
|
|
|
|
|
|
|
|||||||||
| Total |
$ | 56 | $ | 124 | $ | 178 | $ | 354 | ||||||||
|
|
|
|
|
|
|
|
|
|||||||||
| Interest expense |
||||||||||||||||
| North America |
$ | 1,306 | $ | 1,417 | $ | 3,977 | $ | 4,432 | ||||||||
| Asia-Pacific |
2,626 | 3,405 | 7,794 | 9,022 | ||||||||||||
|
|
|
|
|
|
|
|
|
|||||||||
| Total |
$ | 3,932 | $ | 4,822 | $ | 11,771 | $ | 13,454 | ||||||||
|
|
|
|
|
|
|
|
|
|||||||||
| Share-based compensation |
||||||||||||||||
| North America |
$ | 154 | $ | 176 | $ | 429 | $ | 476 | ||||||||
| Asia-Pacific |
45 | 36 | 186 | 105 | ||||||||||||
|
|
|
|
|
|
|
|
|
|||||||||
| Total |
$ | 199 | $ | 212 | $ | 615 | $ | 581 | ||||||||
|
|
|
|
|
|
|
|
|
|||||||||
| Depreciation and amortization |
||||||||||||||||
| North America |
$ | 1,499 | $ | 1,479 | $ | 4,485 | $ | 4,392 | ||||||||
| Asia-Pacific |
3,079 | 3,241 | 10,444 | 9,860 | ||||||||||||
|
|
|
|
|
|
|
|
|
|||||||||
| Total |
$ | 4,578 | $ | 4,720 | $ | 14,929 | $ | 14,252 | ||||||||
|
|
|
|
|
|
|
|
|
|||||||||
| Additions to long-lived assets |
||||||||||||||||
| North America |
$ | 2,583 | $ | 4,971 | ||||||||||||
| Asia-Pacific |
13,317 | 29,899 | ||||||||||||||
|
|
|
|
|
|||||||||||||
| Total |
$ | 15,900 | $ | 34,870 | ||||||||||||
|
|
|
|
|
|||||||||||||
| At | ||||||||
| June 30, 2010 | March 31, 2011 | |||||||
| Long-lived assets |
||||||||
| North America |
$ | 108,064 | $ | 107,588 | ||||
| Asia-Pacific |
90,528 | 118,080 | ||||||
|
|
|
|
|
|||||
| Total |
$ | 198,592 | $ | 225,668 | ||||
|
|
|
|
|
|||||
Intersegment net revenues totaled $2,280,000 and $690,000 during the quarter ended March 31, 2010 and 2011 and $2,584,000 and $1,988,000 during FY 2010 and FY 2011, respectively.
I-20
Table of Contents
GENERAL FINANCE CORPORATION AND SUBSIDIARIES
NOTES TO CONDENSED CONSOLIDATED FINANCIAL STATEMENTS
Note 11. Subsequent Events
On April 11, 2011, the Company announced that Royal Wolf is considering a proposal to undertake an initial public offering in Australia and apply for listing on the Australian Securities Exchange (“Australian IPO”). In May 2011, Royal Wolf completed the Australian IPO, which raised gross proceeds of A$91.5 million from the issuance of 50 million new ordinary shares. Royal Wolf used a portion of the net proceeds of the offering to prepay in full $22.3 million of Bison Capital subordinated notes and to reduce borrowings under its senior credit facility, and GFN used a portion of the net proceeds from the offering to satisfy the Bison Capital put option (see Note 8), to reduce borrowings under the senior credit facility of Pac-Van and the remaining amount of the net proceeds was used for general working capital purposes. At the completion of the offering, GFN still owned a majority of the ordinary shares of Royal Wolf.
I-21
Table of Contents
INDEX TO ANNUAL CONSOLIDATED FINANCIAL STATEMENTS
| F-2 | ||||
| F-3 | ||||
| Consolidated Statements of Operations for the years ended June 30, 2009 and 2010 |
F-4 | |||
| F-5 | ||||
| Consolidated Statements of Cash Flows for the years ended June 30, 2009 and 2010 |
F-6 | |||
| F-8 | ||||
F-1
Table of Contents
REPORT OF INDEPENDENT REGISTERED PUBLIC ACCOUNTING FIRM
To the Board of Directors and Stockholders
General Finance Corporation
We have audited the accompanying consolidated balance sheets of General Finance Corporation and Subsidiaries as of June 30, 2010 and 2009, and the related consolidated statements of operations, stockholders’ equity and comprehensive income (loss), and cash flows for the years then ended. In connection with our audits of the consolidated financial statements, we have also audited the financial statement schedule listed in Item 15(a) of this Form 10-K. These consolidated financial statements and financial statement schedule are the responsibility of the Company’s management. Our responsibility is to express an opinion on these consolidated financial statements and financial statement schedule based on our audits.
We conducted our audits in accordance with the standards of the Public Company Accounting Oversight Board (United States). Those standards require that we plan and perform the audit to obtain reasonable assurance about whether the financial statements are free of material misstatement. The Company is not required to have, nor were we engaged to perform, an audit of its internal control over financial reporting. Our audit included consideration of internal control over financial reporting as a basis for designing audit procedures that are appropriate in the circumstances, but not for the purpose of expressing an opinion on the effectiveness of the Company’s internal control over financial reporting. Accordingly, we express no such opinion. An audit includes examining, on a test basis, evidence supporting the amounts and disclosures in the financial statements. An audit also includes assessing the accounting principles used and significant estimates made by management, as well as evaluating the overall financial statement presentation. We believe that our audits provide a reasonable basis for our opinion.
In our opinion, the consolidated financial statements referred to above present fairly, in all material respects, the consolidated financial position of the Company as of June 30, 2010 and 2009, and the consolidated results of its operations and its cash flows for the years then ended, in conformity with U.S. generally accepted accounting principles.
/s/ Crowe Horwath LLP
Sherman Oaks, California
September 24, 2010
F-2
Table of Contents
GENERAL FINANCE CORPORATION AND SUBSIDIARIES
CONSOLIDATED BALANCE SHEETS
(In thousands, except share and per share data)
| June 30, | ||||||||
| 2009 | 2010 | |||||||
| Assets |
||||||||
| Cash and cash equivalents |
$ | 3,346 | $ | 4,786 | ||||
| Trade and other receivables, net of allowance for doubtful accounts of $2,642 and $2,328 at June 30, 2009 and 2010, respectively |
26,402 | 25,667 | ||||||
| Income taxes receivable |
30 | 1,071 | ||||||
| Subscription receivables |
— | 1,211 | ||||||
| Inventories |
22,511 | 19,063 | ||||||
| Prepaid and other expenses |
1,894 | 2,206 | ||||||
| Lease receivables |
1,163 | 1,782 | ||||||
| Property, plant and equipment, net |
10,460 | 10,182 | ||||||
| Lease fleet, net |
188,915 | 188,410 | ||||||
| Goodwill |
73,917 | 67,919 | ||||||
| Intangible assets, net |
30,058 | 24,583 | ||||||
|
|
|
|
|
|||||
| Total assets |
$ | 358,696 | $ | 346,880 | ||||
|
|
|
|
|
|||||
| Liabilities |
||||||||
| Trade payables and accrued liabilities |
$ | 24,657 | $ | 25,246 | ||||
| Unearned revenue and advance payments |
8,461 | 9,468 | ||||||
| Senior and other debt |
200,304 | 186,183 | ||||||
| Deferred tax liabilities |
13,822 | 13,409 | ||||||
|
|
|
|
|
|||||
| Total liabilities |
247,244 | 234,306 | ||||||
|
|
|
|
|
|||||
| Commitments and contingencies (Note 10) |
— | — | ||||||
| Redeemable noncontrolling interest (Note 10) |
8,278 | 10,840 | ||||||
| Stockholders’ equity |
||||||||
| Cumulative preferred stock, $.0001 par value: 1,000,000 shares authorized; 25,000 and 26,000 shares issued and outstanding (in series) and stated at liquidation value ($1,386 and $1,438 total liquidation preference at June 30, 2009 and 2010, respectively) at June 30, 2009 and 2010, respectively |
1,345 | 1,395 | ||||||
| Common stock, $.0001 par value: 100,000,000 shares authorized; 17,826,052 and 22,023,299 shares outstanding at June 30, 2009 and 2010, respectively |
2 | 2 | ||||||
| Additional paid-in capital |
105,314 | 111,783 | ||||||
| Subscription receivables |
— | (100 | ) | |||||
| Accumulated other comprehensive income (loss) |
(4,963 | ) | (1,571 | ) | ||||
| Retained earnings (accumulated deficit) |
1,476 | (9,775 | ) | |||||
|
|
|
|
|
|||||
| Total stockholders’ equity |
103,174 | 101,734 | ||||||
|
|
|
|
|
|||||
| Total liabilities and stockholders’ equity |
$ | 358,696 | $ | 346,880 | ||||
|
|
|
|
|
|||||
The accompanying notes are an integral part of these consolidated financial statements.
F-3
Table of Contents
GENERAL FINANCE CORPORATION AND SUBSIDIARIES
CONSOLIDATED STATEMENTS OF OPERATIONS
(In thousands, except share and per share data)
| Year Ended June 30, | ||||||||
| 2009 | 2010 | |||||||
| Revenues |
||||||||
| Sales |
$ | 75,528 | $ | 79,207 | ||||
| Leasing |
70,932 | 77,102 | ||||||
|
|
|
|
|
|||||
| 146,460 | 156,309 | |||||||
|
|
|
|
|
|||||
| Costs and expenses |
||||||||
| Cost of sales (exclusive of the items shown separately below) |
58,373 | 61,366 | ||||||
| Direct costs of leasing operations |
22,581 | 26,444 | ||||||
| Selling and general expenses |
34,403 | 37,672 | ||||||
| Impairment of goodwill |
— | 7,633 | ||||||
| Depreciation and amortization |
17,045 | 19,619 | ||||||
|
|
|
|
|
|||||
| Operating income |
14,058 | 3,575 | ||||||
| Interest income |
296 | 234 | ||||||
| Interest expense |
(16,161 | ) | (15,974 | ) | ||||
| Foreign currency exchange gain (loss) and other |
(9,312 | ) | 1,948 | |||||
|
|
|
|
|
|||||
| (25,177 | ) | (13,792 | ) | |||||
|
|
|
|
|
|||||
| Loss before provision for income taxes |
(11,119 | ) | (10,217 | ) | ||||
| Provision (benefit) for income taxes |
(4,374 | ) | (1,261 | ) | ||||
|
|
|
|
|
|||||
| Net loss |
(6,745 | ) | (8,956 | ) | ||||
| Noncontrolling interest |
3,028 | (2,295 | ) | |||||
| Preferred stock dividends |
(62 | ) | (168 | ) | ||||
|
|
|
|
|
|||||
| Net loss attributable to common stockholders |
$ | (3,779 | ) | $ | (11,419 | ) | ||
|
|
|
|
|
|||||
| Net income (loss) per common share: |
||||||||
| Basic |
$ | (0.22 | ) | $ | (0.64 | ) | ||
| Diluted |
(0.22 | ) | (0.64 | ) | ||||
|
|
|
|
|
|||||
| Weighted average shares outstanding: |
||||||||
| Basic |
16,817,833 | 17,826,052 | ||||||
| Diluted |
16,817,833 | 17,826,052 | ||||||
|
|
|
|
|
|||||
The accompanying notes are an integral part of these consolidated financial statements.
F-4
Table of Contents
GENERAL FINANCE CORPORATION AND SUBSIDIARIES
CONSOLIDATED STATEMENT OF STOCKHOLDERS’ EQUITY AND COMPREHENSIVE INCOME (LOSS)
(In thousands, except share data)
| Cumulative
Preferred Stock |
Common Stock | Additional Paid-In Capital |
Subscription | Other Comprehensive Income (Loss) |
Retained Earnings (Accumulated Deficit) |
Total Stockholders’ Equity |
||||||||||||||||||||||||||||||
| Shares | Amount | Shares | Amount | Receivables | ||||||||||||||||||||||||||||||||
| Balance at June 30, 2008 |
— | $ | — | 13,826,052 | $ | 1 | $ | 81,688 | $ | — | $ | 6,787 | $ | 5,255 | $ | 93,731 | ||||||||||||||||||||
| Issuance of common stock |
— | — | 4,000,000 | 1 | 25,599 | — | — | — | 25,600 | |||||||||||||||||||||||||||
| Issuance of preferred stock |
25,000 | 1,345 | — | — | (9 | ) | — | — | — | 1,336 | ||||||||||||||||||||||||||
| Share-based compensation |
— | — | — | — | 902 | — | — | — | 902 | |||||||||||||||||||||||||||
| Contributed services |
— | — | — | — | 130 | — | — | — | 130 | |||||||||||||||||||||||||||
| Adjustment of redemption value of noncontrolling interest put option |
— | — | — | — | (2,996 | ) | — | — | — | (2,996 | ) | |||||||||||||||||||||||||
| Preferred stock dividends |
— | — | — | — | — | — | — | (62 | ) | (62 | ) | |||||||||||||||||||||||||
| Net loss |
— | — | — | — | — | — | — | (6,745 | ) | (6,745 | ) | |||||||||||||||||||||||||
| Noncontrolling interest |
— | — | — | — | — | — | — | 3,028 | 3,028 | |||||||||||||||||||||||||||
| Cumulative translation adjustment |
— | — | — | — | — | — | (11,750 | ) | — | (11,750 | ) | |||||||||||||||||||||||||
|
|
|
|||||||||||||||||||||||||||||||||||
| Total comprehensive loss |
(15,467 | ) | ||||||||||||||||||||||||||||||||||
|
|
|
|
|
|
|
|
|
|
|
|
|
|
|
|
|
|
|
|||||||||||||||||||
| Balance at June 30, 2009 |
25,000 | 1,345 | 17,826,052 | 2 | 105,314 | — | (4,963 | ) | 1,476 | 103,174 | ||||||||||||||||||||||||||
|
|
|
|
|
|
|
|
|
|
|
|
|
|
|
|
|
|
|
|||||||||||||||||||
| Issuance of common stock included with units sold in a rights offering, net of offering expenses |
— | — | 4,197,247 | — | 6,008 | (100 | ) | — | — | 5,908 | ||||||||||||||||||||||||||
| Issuance of preferred stock |
1,000 | 50 | — | — | — | — | — | — | 50 | |||||||||||||||||||||||||||
| Share-based compensation |
— | — | — | — | 629 | — | — | — | 629 | |||||||||||||||||||||||||||
| Preferred stock dividends |
— | — | — | — | (168 | ) | — | — | — | (168 | ) | |||||||||||||||||||||||||
| Net loss |
— | — | — | — | — | — | — | (8,956 | ) | (8,956 | ) | |||||||||||||||||||||||||
| Noncontrolling interest |
— | — | — | — | — | — | — | (2,295 | ) | (2,295 | ) | |||||||||||||||||||||||||
| Cumulative translation adjustment |
— | — | — | — | — | — | 3,392 | — | 3,392 | |||||||||||||||||||||||||||
|
|
|
|||||||||||||||||||||||||||||||||||
| Total comprehensive loss |
— | — | — | — | — | — | — | (7,859 | ) | |||||||||||||||||||||||||||
|
|
|
|
|
|
|
|
|
|
|
|
|
|
|
|
|
|
|
|||||||||||||||||||
| Balance at June 30, 2010 |
26,000 | $ | 1,395 | 22,023,299 | $ | 2 | $ | 111,783 | $ | (100 | ) | $ | (1,571 | ) | $ | (9,775 | ) | $ | 101,734 | |||||||||||||||||
|
|
|
|
|
|
|
|
|
|
|
|
|
|
|
|
|
|
|
|||||||||||||||||||
The accompanying notes are an integral part of these consolidated financial statements.
F-5
Table of Contents
GENERAL FINANCE CORPORATION AND SUBSIDIARIES
CONSOLIDATED STATEMENTS OF CASH FLOWS
(In thousands)
| Year Ended June 30, | ||||||||
| 2009 | 2010 | |||||||
| Cash flows from operating activities |
||||||||
| Net loss |
$ | (6,745 | ) | $ | (8,956 | ) | ||
| Adjustments to reconcile net loss to cash flows from operating activities: |
||||||||
| Loss on sales and disposals of property, plant and equipment |
7 | 76 | ||||||
| Unrealized foreign exchange loss (gain) |
6,616 | (586 | ) | |||||
| Unrealized gain on forward exchange contracts |
(157 | ) | (958 | ) | ||||
| Unrealized loss (gain) on interest rate swaps and options |
2,057 | (231 | ) | |||||
| Impairment of goodwill |
— | 7,633 | ||||||
| Depreciation and amortization |
17,045 | 19,619 | ||||||
| Amortization of deferred financing costs |
256 | 381 | ||||||
| Accretion of interest |
240 | 240 | ||||||
| Share-based compensation expense |
902 | 629 | ||||||
| Contributed services |
130 | — | ||||||
| Deferred income taxes |
(4,198 | ) | (338 | ) | ||||
| Changes in operating assets and liabilities: |
||||||||
| Trade, subscription and other receivables, net |
5,659 | (234 | ) | |||||
| Inventories |
3,525 | 4,546 | ||||||
| Prepaid expenses and other |
442 | 149 | ||||||
| Trade payables, accrued liabilities and other deferred credits |
(2,125 | ) | 1,848 | |||||
| Income taxes |
(322 | ) | — | |||||
|
|
|
|
|
|||||
| Net cash provided by operating activities |
23,332 | 23,818 | ||||||
|
|
|
|
|
|||||
| Cash flows from investing activities: |
||||||||
| Proceeds from sales of property, plant and equipment |
134 | 105 | ||||||
| Business acquisitions, net of cash acquired |
(20,989 | ) | — | |||||
| Purchases of property, plant and equipment |
(3,531 | ) | (2,295 | ) | ||||
| Purchases of lease fleet |
(14,300 | ) | (4,297 | ) | ||||
| Purchases of intangible assets |
(107 | ) | — | |||||
|
|
|
|
|
|||||
| Net cash used by investing activities |
(38,793 | ) | (6,487 | ) | ||||
|
|
|
|
|
|||||
| Cash flows from financing activities: |
||||||||
| Proceeds from (repayments on) capital leasing activities |
241 | (337 | ) | |||||
| Proceeds from (repayments on) senior and other debt borrowings |
16,416 | (20,292 | ) | |||||
| Proceeds from issuances of units in rights offering |
— | 5,908 | ||||||
| Proceeds from issuances of preferred stock |
1,236 | 50 | ||||||
| Preferred stock dividends |
(62 | ) | (168 | ) | ||||
|
|
|
|
|
|||||
| Net cash provided (used) by financing activities |
17,831 | (14,839 | ) | |||||
|
|
|
|
|
|||||
| Net increase in cash |
2,370 | 2,492 | ||||||
| Cash and equivalents at beginning of period |
2,772 | 3,346 | ||||||
| The effect of foreign currency translation on cash |
(1,796 | ) | (1,052 | ) | ||||
|
|
|
|
|
|||||
| Cash and equivalents at end of period |
$ | 3,346 | $ | 4,786 | ||||
|
|
|
|
|
|||||
| Supplemental disclosure of cash flow information: |
||||||||
| Cash paid during the period: |
||||||||
| Interest |
$ | 13,417 | $ | 11,643 | ||||
| Income taxes |
536 | 52 | ||||||
|
|
|
|
|
|||||
F-6
Table of Contents
Non-cash investing and financing activities:
On October 1, 2008, the Company issued a subordinated promissory note of $1,500 and common stock of $25,600 as part of the consideration for the Pac-Van acquisition (see Note 1).
On December 8, 2008, the Company issued preferred stock of $100 as part of the consideration for a small acquisition (see Note 4).
The accompanying notes are an integral part of these consolidated financial statements.
F-7
Table of Contents
GENERAL FINANCE CORPORATION AND SUBSIDIARIES
NOTES TO CONSOLIDATED FINANCIAL STATEMENTS
Note 1. Organization and Business Operations
Organization
General Finance Corporation (“GFN”) was incorporated in Delaware in October 2005. References to the “Company” in these Notes are to GFN and its consolidated subsidiaries. These subsidiaries include GFN U.S. Australasia Holdings, Inc., a Delaware corporation (“GFN U.S.”); GFN North America Corp., a Delaware corporation (“GFNNA”); GFN Mobile Storage Inc., a Delaware corporation (“GFNMS”); GFN Australasia Holdings Pty Ltd., an Australian corporation (“GFN Holdings”); GFN Australasia Finance Pty Ltd, an Australian corporation (“GFN Finance”); RWA Holdings Pty Limited (“RWA”), an Australian corporation, and its subsidiaries (collectively, “Royal Wolf”); and Pac-Van, Inc., an Indiana corporation (combined with GFNMS, “Pac-Van”).
Acquisition of Royal Wolf
On September 13, 2007 (September 14 in Australia), the Company completed the acquisition of Royal Wolf through the acquisition of all of the outstanding shares of RWA. Based upon the actual exchange rate of one Australian dollar to $0.8407 U.S. dollar realized in connection with payments made upon completion of the acquisition, the purchase price paid to the sellers for the RWA shares was $64.3 million, including deposits of $1,005,000 previously paid in connection with the acquisition. The Company paid the purchase price, less the deposits, by a combination of cash in the amount of $44.7 million plus the issuance to Bison Capital Australia, L.P., (“Bison Capital”), one of the sellers, of shares of common stock of GFN U.S.; and the issuance of a note to Bison Capital. As a result of this structure, the Company owns 86.2% of the outstanding capital stock of GFN U.S. and Bison Capital owns 13.8% of the outstanding capital stock of GFN U.S.
Royal Wolf leases and sells storage containers, portable container buildings and freight containers in Australia and New Zealand, which is considered geographically by the Company to be the Asia-Pacific area.
Acquisition of Pac-Van
The Company’s long-term strategy is to acquire and operate businesses in North America, Europe and the Asia-Pacific area. The acquisition of Pac-Van gave the Company the opportunity to enter the United States market. On October 1, 2008, the Company completed its acquisition of Pac-Van through a merger with Mobile Office Acquisition Corp. (“MOAC”), the parent of Pac-Van, and the Company’s wholly-owned subsidiary formed in July 2008, GFNNA. Pac-Van leases and sells modular buildings, mobile offices and storage containers in the United States.
The Company, in addition to assuming Pac-Van’s senior and other debt, paid the purchase price to the stockholders of MOAC by a combination of $19.4 million in cash, 4,000,000 shares of GFN restricted common stock (valued at $25.6 million) and a 20-month subordinated promissory note in the aggregate principal amount of $1.5 million bearing interest at 8% per annum. The note and 1,133,333 shares of the restricted common stock secure the indemnification obligations for 20 months and 36 months, respectively. Among other things, in connection with the acquisition, the Company granted options to certain key employees of Pac-Van and to a former stockholder of MOAC at an exercise price equal to the closing market price of the Company’s common stock as of October 1, 2008 (see Note 9).
The total purchase consideration, including the Company’s transaction costs of approximately $0.9 million has been allocated to tangible and intangible assets acquired, including goodwill (which will not be deductible for tax purposes), and liabilities assumed based on their estimated fair market values as of October 1, 2008, as follows (in thousands):
| October 1, 2008 | ||||
| Fair value of the net tangible assets acquired and liabilities assumed: |
||||
| Cash and cash equivalents |
$ | 1,517 | ||
| Trade and other receivables |
15,035 | |||
| Inventories |
10,145 | |||
| Prepaid expenses |
398 | |||
| Property, plant and equipment |
3,473 | |||
| Lease fleet |
108,134 | |||
| Other assets |
— | |||
| Trade payables and accrued liabilities |
(12,880 | ) | ||
| Unearned revenue and advance payments |
(7,414 | ) | ||
| Senior and other debt |
(107,600 | ) | ||
| Deferred income taxes |
(17,405 | ) | ||
|
|
|
|||
| Total net tangible assets acquired and liabilities assumed |
(6,597 | ) | ||
|
|
|
|||
| Fair value of intangible assets acquired: |
||||
| Customer base |
4,850 | |||
| Trade name |
2,200 | |||
| Deferred financing costs |
191 | |||
| Goodwill |
46,794 | |||
|
|
|
|||
| Total intangible assets acquired |
54,035 | |||
|
|
|
|||
| Total purchase consideration |
$ | 47,438 | ||
|
|
|
|||
F-8
Table of Contents
GENERAL FINANCE CORPORATION AND SUBSIDIARIES
NOTES TO CONSOLIDATED FINANCIAL STATEMENTS
Reference is made to Note 2 for a discussion of impairment write-downs recognized subsequent to October 1, 2008 to the carrying value of goodwill and intangible assets acquired.
The accompanying consolidated statements of operations reflect the operating results of the Company following the date of acquisition of Pac-Van and do not reflect the operating results of Pac-Van prior to the acquisition date. The following unaudited pro forma information for the year ended June 30, 2009 assumes the acquisition of Pac-Van occurred at July 1, 2008 (in thousands, except per share data):
| Year Ended June 30, 2009 |
||||
| (Unaudited) | ||||
| Revenues |
$ | 169,102 | ||
| Net loss attributable to stockholders |
(2,937 | ) | ||
|
|
|
|||
| Pro forma net loss per common share: |
||||
| Basic |
$ | (0.17 | ) | |
| Diluted |
(0.17 | ) | ||
|
|
|
|||
The pro forma results are not necessarily indicative of the results that may have actually occurred had the acquisition taken place on the date noted, or the future financial position or operating results of the Company. The pro forma adjustments are based upon available information and assumptions that the Company believes are reasonable. The pro forma adjustments include adjustments for increased interest expense, as well as increased depreciation and amortization expense as a result of the application of the purchase method of accounting.
Note 2. Summary of Significant Accounting Policies
Basis of Presentation
The consolidated financial statements have been prepared on the accrual basis of accounting in accordance with accounting principles generally accepted in the United States.
Unless otherwise indicated, references to “FY 2009” and “FY 2010” are to the year ended June 30, 2009 and 2010, respectively.
Certain reclassifications have been made to the FY 2009 statements to conform to the current period presentation, including those resulting from the determination to present a nonclassified consolidated balance sheet at June 30, 2010 to be consistent and better compare the Company’s financial results with other past and present public reporting companies in the modular space and storage industries. The Company has no agreements or covenants that require an analysis or presentation of working capital.
Principles of Consolidation
The consolidated financial statements include the accounts of the Company and its wholly-owned and majority-owned subsidiaries. All significant intercompany accounts and transactions have been eliminated.
Foreign Currency Translation
The Company’s functional currency for its operations in the Asia-Pacific area is the local currency, which is primarily the Australian (“AUS”) dollar. All adjustments resulting from the translation of the accompanying consolidated financial statements from the functional currency into reporting currency are recorded as a component of stockholders’ equity in accordance with Financial Accounting Standards Board (“FASB”) Accounting Standards Codification (“ASC”) Topic 830, Foreign Currency Matters . All assets and liabilities are translated at the rates in effect at the balance sheet dates; and revenues, expenses, gains and losses are translated using the average exchange rates during the periods. Transactions in foreign currencies are translated at the foreign exchange rate prevailing at the date of the transaction. Monetary assets and liabilities denominated in foreign currencies at the balance sheet date are translated to the functional currency at the foreign exchange rate prevailing at that date. Foreign exchange differences arising on translation are recognized in the statement of operations. Non-monetary assets and liabilities that are measured in terms of historical cost in a foreign currency are translated using the exchange rate at the date of the transaction. Non-monetary assets and liabilities denominated in foreign currencies that are stated at fair value are translated to the functional currency at foreign exchange rates prevailing at the dates the fair value was determined.
F-9
Table of Contents
GENERAL FINANCE CORPORATION AND SUBSIDIARIES
NOTES TO CONSOLIDATED FINANCIAL STATEMENTS
Segment Information
FASB ASC Topic 280, Segment Reporting, establishes standards for the way companies report information about operating segments in annual financial statements. It also establishes standards for related disclosures about products and services, geographic areas and major customers. Based on the provisions of FASB ASC Topic 280 and the manner in which the chief operating decision maker analyzes the business, the Company has determined it has two separately reportable geographic and operating segments, North America (Pac-Van, including corporate headquarters) and the Asia-Pacific area (Royal Wolf).
Use of Estimates
The preparation of consolidated financial statements in conformity with accounting principles generally accepted in the United States requires management to make estimates and assumptions that affect the reported amounts of assets and liabilities and disclosure of contingent assets and liabilities at the date of the consolidated financial statements, and the reported amounts of revenues and expenses during the reporting period. Actual results could differ from those estimates.
Cash Equivalents
The Company considers highly liquid investments with maturities of three months or less, when purchased, to be cash equivalents. The Company maintains its cash in bank deposit accounts that, at times, may exceed federally insured limits. The Company has not experienced any losses in such accounts. The Company believes it is not exposed to any significant credit risk on its cash balances.
Allowance for Doubtful Accounts and Credit Risks
Reference is made to Note 6 for a discussion of the Company’s allowance for doubtful accounts and credit risks.
Inventories
Inventories are stated at the lower of cost or market (net realizable value). Net realizable value is the estimated selling price in the ordinary course of business. Expenses of marketing, selling and distribution to customers, as well as costs of completion are estimated and are deducted from the estimated selling price to establish net realizable value. Costs are assigned to individual items of inventory on the basis of specific identification and include expenditures incurred in acquiring the inventories and bringing them to their existing condition and location. Inventories consist primarily of containers, modular buildings and mobile offices held for sale or lease and are comprised of the following (in thousands):
| June 30, | ||||||||
| 2009 | 2010 | |||||||
| Finished goods |
$ | 21,170 | $ | 18,840 | ||||
| Work in progress |
1,341 | 223 | ||||||
|
|
|
|
|
|||||
| $ | 22,511 | $ | 19,063 | |||||
|
|
|
|
|
|||||
Derivative Financial Instruments
Derivative financial instruments include warrants issued as part of the Initial Public Offering (“IPO”) and rights offering (Note 3), a purchase option that was sold to the representative of the underwriters (Note 3) and warrants issued in connection with a senior subordinated promissory note with Bison Capital (Note 5). Based on Emerging Issues Task Force Issue No. 00-19, Accounting for Derivative Financial Instruments Indexed to, and Potentially Settled in, a Company’s Own Stock , the issuance of the warrants and the sale of the purchase option were reported in stockholders’ equity and, accordingly, there is no impact on the Company’s financial position or results of operations; except for the $100 in proceeds from the sale of the purchase option and the discounting of the senior subordinated promissory note for the fair market value of the warrants issued to Bison Capital. Subsequent changes in the fair value will not be recognized as long as the warrants and purchase option continue to be classified as equity instruments. At the date of issuance, the Company determined the purchase option and the warrants issued to Bison Capital had a fair market value of approximately $641,000 and $1,309,000, respectively, using the Black-Scholes pricing model.
F-10
Table of Contents
GENERAL FINANCE CORPORATION AND SUBSIDIARIES
NOTES TO CONSOLIDATED FINANCIAL STATEMENTS
The Company may use derivative financial instruments to hedge its exposure to foreign currency and interest rate risks arising from operating, financing and investing activities. The Company does not hold or issue derivative financial instruments for trading purposes. However, derivatives that do not qualify for hedge accounting are accounted for as trading instruments. Derivative financial instruments are recognized initially at fair value. Subsequent to initial recognition, derivative financial instruments are stated at fair value. The gain or loss on remeasurement to fair value is recognized immediately in the statement of operations.
Accounting for Stock Options
For the issuances of stock options, the Company follows the fair value provisions of FASB ASC Topic 718, Stock Compensation , which require recognition of employee share-based compensation expense in the statements of operations over the vesting period based on the fair value of the stock option at the grant date. For stock options granted to non-employees, the Company recognizes compensation expense measured at their fair value at each reporting date. Therefore, these stock options are subject to periodic fair value adjustments recorded in share-based compensation over the vesting period.
Property, Plant and Equipment
Owned assets
Property, plant and equipment are stated at cost, less accumulated depreciation and impairment losses. The cost of self-constructed assets includes the cost of materials, direct labor, the initial estimate (where relevant) of the costs of dismantling and removing the items and restoring the site on which they are located; and an appropriate allocation of production overhead, where applicable. Depreciation for property, plant and equipment is recorded on the straight-line basis over the estimated useful lives of the related asset. The residual value, the useful life and the depreciation method applied to an asset are reassessed at least annually.
Property, plant and equipment consist of the following (in thousands):
| Estimated Useful Life |
June 30, | |||||||||
| 2009 | 2010 | |||||||||
| Land |
— | $ | 1,486 | $ | 1,599 | |||||
| Building |
40 years | 230 | 247 | |||||||
| Transportation and plant equipment (including capital lease assets) |
3 — 10 years | 9,010 | 11,407 | |||||||
| Furniture, fixtures and office equipment |
3 — 10 years | 3,017 | 2,865 | |||||||
|
|
|
|
|
|||||||
| 13,743 | 16,118 | |||||||||
| Less accumulated depreciation and amortization |
(3,283 | ) | (5,936 | ) | ||||||
|
|
|
|
|
|||||||
| $ | 10,460 | $ | 10,182 | |||||||
|
|
|
|
|
|||||||
Capital leases
Leases under which substantially all the risks and benefits incidental to ownership of the leased assets are assumed by the Company are classified as capital leases. Other leases are classified as operating leases. A lease asset and a lease liability equal to the present value of the minimum lease payments, or the fair value of the leased item, whichever is the lower, are capitalized and recorded at the inception of the lease. Lease payments are apportioned between the finance charges and reduction of the lease liability so as to achieve a constant rate of interest on the remaining balance of the liability. Finance charges are charged directly to the statement of operations. Capitalized leased assets are depreciated over the shorter of the estimated useful life of the asset or the lease term.
Operating leases
Payments made under operating leases are expensed on the straight-line basis over the term of the lease, except where an alternative basis is more representative of the pattern of benefits to be derived from the leased property. Where leases have fixed rate increases, these increases are accrued and amortized over the entire lease period, yielding a constant periodic expense over the term of the lease.
F-11
Table of Contents
GENERAL FINANCE CORPORATION AND SUBSIDIARIES
NOTES TO CONSOLIDATED FINANCIAL STATEMENTS
Lease Fleet
The Company has a fleet of storage containers, mobile offices, modular buildings and steps that it primarily leases to customers under operating lease agreements with varying terms. The value of the lease fleet (or lease or rental equipment) is recorded at cost and depreciated on the straight-line basis over the estimated useful life (5 — 20 years), after the date the units are put in service, and are depreciated down to their estimated residual values (up to 70% of cost). In the opinion of management, estimated residual values are at or below net realizable values. The Company periodically reviews these depreciation policies against various factors, including the practices of the larger competitors in the industry, and its own historical experience.
Costs incurred on lease fleet units subsequent to initial acquisition are capitalized when it is probable that future economic benefits in excess of the originally assessed performance will result; otherwise, they are expensed as incurred.
Units in the lease fleet are also available for sale. The cost of sales of a unit in the lease fleet is recognized at the carrying amount at the date of sale.
Impairment of Long-Lived Assets
The Company periodically reviews for the impairment of long-lived assets and assesses when an event or change in circumstances indicates the carrying value of an asset may not be recoverable. An impairment loss would be recognized when estimated future cash flows expected to result from the use of the asset and the eventual disposition is less than its carrying amount. The Company has determined that no impairment provision related to long-lived assets was required to be recorded as of June 30, 2009 and 2010.
Goodwill
The Company accounts for goodwill in accordance with FASB ASC Topic 350, Intangibles — Goodwill and Other. FASB ASC Topic 350 prohibits the amortization of goodwill and intangible assets with indefinite lives and requires these assets be reviewed for impairment at least annually. The Company operates two reportable and operating segments (Pac-Van and Royal Wolf) and all of the goodwill was allocated between these two reporting units. The Company performs an annual impairment test on goodwill at year end using the two-step process required under FASB ASC Topic 350. The first step is a screen for potential impairment, while the second step measures the amount of the impairment, if any.
At June 30, 2010, the Company performed the first step of the two-step impairment test and compared the fair value of each reporting unit to its carrying value. In assessing the fair value of the reporting units, the Company considered both the market approach and the income approach. Under the market approach, the fair value of the reporting unit was determined on a weighted-average range of multiples to adjusted EBITDA. Under the income approach, the fair value of the reporting unit was based on the present value of estimated cash flows. The income approach was dependent on a number of significant management assumptions, including estimated future revenue growth rates, gross margins on sales, operating margins, capital expenditures and discount rates. Each approach was given equal weight in arriving at the fair value of the reporting unit and it was determined that the fair value of the Royal Wolf reporting unit exceeded the carrying values of the net assets. However, the fair value of the Pac-Van reporting unit was less than the carrying values of the net assets and, therefore, the Company performed a step-two impairment test for Pac-Van.
In the step-two test, the Company determined the implied fair value of the Pac-Van reporting unit’s goodwill and compared it to the carrying value of the goodwill. This involved allocating the fair value of the reporting unit to its respective assets and liabilities (as if it had been acquired in a separate and individual business combination and the fair value was the price paid to acquire it) with the excess of the fair value over the amounts assigned being the implied fair value of goodwill. For Pac-Van, the implied value of its goodwill was less than the carrying value of goodwill, resulting in an impairment charge of $7,633,000 in the fourth quarter of FY 2010. The Company had not recorded an impairment charge to goodwill prior to FY 2010.
F-12
Table of Contents
GENERAL FINANCE CORPORATION AND SUBSIDIARIES
NOTES TO CONSOLIDATED FINANCIAL STATEMENTS
The change in the balance of goodwill is as follows (in thousands)
| June 30, | ||||||||
| 2009 | 2010 | |||||||
| Beginning of year |
$ | 31,721 | $ | 73,917 | ||||
| Acquired goodwill (including foreign translation effect) |
42,196 | 1,635 | ||||||
| Impairment of goodwill |
— | (7,633 | ) | |||||
|
|
|
|
|
|||||
| End of year |
$ | 73,917 | $ | 67,919 | ||||
|
|
|
|
|
|||||
Intangible Assets
Intangible assets include those with indefinite (trademark and trade name) and finite (primarily customer base and lists, non-compete agreements and deferred financing costs) useful lives. Customer base and lists and non-compete agreements are amortized on the straight-line basis over the expected period of benefit which range from one to ten years. Costs to obtaining long-term financing are deferred and amortized over the term of the related debt using the straight-line method. Amortizing the deferred financing costs using the straight-line method does not produce significantly different results than that of the effective interest method.
Intangible assets with finite useful lives consist of the following (in thousands):
| June 30, | ||||||||
| 2009 | 2010 | |||||||
| Trademark and trade name |
$ | 2,940 | $ | 2,750 | ||||
| Customer base and lists |
29,485 | 31,118 | ||||||
| Non-compete agreements |
5,633 | 5,986 | ||||||
| Deferred financing costs |
2,019 | 2,319 | ||||||
| Other |
713 | 874 | ||||||
|
|
|
|
|
|||||
| 40,790 | 43,047 | |||||||
| Less accumulated amortization |
(10,732 | ) | (18,464 | ) | ||||
|
|
|
|
|
|||||
| $ | 30,058 | $ | 24,583 | |||||
|
|
|
|
|
|||||
The Company reviews intangible assets (those assets resulting from acquisitions) at least annually for impairment or when events or circumstances indicate these assets might be impaired. The Company tests impairment using historical cash flows and other relevant facts and circumstances as the primary basis for estimates of future cash flows. The Company determined that, as a result of changes in market conditions and other factors in the U.S., an impairment charge to the customer base acquired in the Pac-Van acquisition (see Note 1) was required to be recorded at both June 30, 2009 and June 30, 2010; and, as of June 30, 2010, to the trade name. The Company, to be more in line with the expected revenue stream of the customer base, recorded the FY 2009 impairment charge of $689,000 by revising its method of amortization from a straight-line to an accelerated basis. The FY 2010 impairment charge to the customer base and trade name of $329,000 and $190,000, respectively, was recorded pursuant to an evaluation, which determined that the respective fair values were less than the carrying values. These impairment charges are included as a part of depreciation and amortization.
The estimated future amortization of intangible assets with finite useful lives as of June 30, 2010 is as follows (in thousands):
| Year Ending June 30, |
||||
| 2011 |
$ | 5,070 | ||
| 2012 |
4,552 | |||
| 2013 |
4,093 | |||
| 2014 |
3,224 | |||
| 2015 |
3,208 | |||
| Thereafter |
1,686 | |||
|
|
|
|||
| $ | 21,833 | |||
|
|
|
|||
F-13
Table of Contents
GENERAL FINANCE CORPORATION AND SUBSIDIARIES
NOTES TO CONSOLIDATED FINANCIAL STATEMENTS
Subsequent expenditures
Subsequent expenditures on capitalized intangible assets are capitalized only when it increases the future economic benefits of the specific asset to which it relates. All other expenditures are expensed as incurred.
Defined Contribution Benefit Plan
Obligations for contributions to defined contribution benefit plans are recognized as an expense in the statement of operations as incurred. Contributions to defined contribution benefit plans in FY 2009 and FY 2010 were $848,000 and $950,000, respectively.
Revenue Recognition
The Company leases and sells new and used portable storage containers, modular buildings and mobile offices to its customers, as well as providing other ancillary products and services. Leases to customers generally qualify as operating leases unless there is a bargain purchase option at the end of the lease term. Revenue is recognized as earned in accordance with the lease terms established by the lease agreements and when collectability is reasonably assured.
Revenue from sales of the lease fleet is generally recognized upon delivery and when collectability is reasonably assured. Certain arrangements to sell units under long-term construction-type sales contracts are accounted for under the percentage of completion method. Under this method, income is recognized in proportion to the incurred costs to date under the contract to estimated total costs.
Unearned revenue includes end of lease services not yet performed by the Company (such as transport charges for the pick-up of a unit where the actual pick-up has not yet occurred as the unit is still leased), advance rentals and deposit payments.
Advertising
Advertising costs are generally expensed as incurred. Direct-response advertising costs, principally yellow page advertising, are monitored through call logs and advertising source codes, are capitalized when paid and amortized over the period in which the benefit is derived. However, the amortization period of the prepaid balance never exceeds 12 months. At June 30, 2009 and 2010, prepaid advertising costs were approximately $191,000 and $220,000, respectively. Advertising costs expensed were approximately $2,283,000 and $2,478,000 for FY 2009 and FY 2010, respectively.
Income Taxes
The Company uses the asset and liability method of accounting for income taxes. Under this method, deferred tax assets and liabilities are recorded for temporary differences between the financial reporting basis and income tax basis of assets and liabilities at the balance sheet date multiplied by the applicable tax rates. Valuation allowances are established when necessary to reduce deferred tax assets to the amount expected to be realized. Income tax expense is recorded for the amount of income tax payable or refundable for the period increased or decreased by the change in deferred tax assets and liabilities during the period.
The Company files U.S. Federal tax returns, multiple U.S. state (and state franchise) tax returns and Australian and New Zealand tax returns. For U.S. Federal tax purposes, all periods subsequent to June 30, 2008 are subject to examination by the U.S. Internal Revenue Service (“IRS”). The Company believes that its income tax filing positions and deductions would be sustained on audit and does not anticipate any adjustments that would result in a material change. Therefore, no reserves for uncertain income tax positions have been recorded. In addition, the Company does not anticipate that the total amount of unrecognized tax benefit related to any particular tax position will change significantly within the next 12 months.
The Company’s policy for recording interest and penalties, if any, will be to record such items as a component of income taxes.
F-14
Table of Contents
GENERAL FINANCE CORPORATION AND SUBSIDIARIES
NOTES TO CONSOLIDATED FINANCIAL STATEMENTS
Net Income per Common Share
Basic net income per common share is computed by dividing net income attributable to common stockholders by the weighted-average number of shares of common stock outstanding during the periods. Diluted net income per common share reflects the potential dilution that could occur if securities or other contracts to issue common stock were exercised or converted into common stock or resulted in the issuance of common stock that then shared in the earnings of the Company. The potential dilutive securities the Company has outstanding are warrants and stock options. The following is a reconciliation of weighted average shares outstanding used in calculating earnings per common share:
| Year Ended June 30, | ||||||||
| 2009 | 2010 | |||||||
| Basic |
16,817,833 | 17,826,052 | ||||||
| Assumed exercise of warrants |
— | — | ||||||
| Assumed exercise of stock options |
— | — | ||||||
|
|
|
|
|
|||||
| Diluted |
16,817,833 | 17,826,052 | ||||||
|
|
|
|
|
|||||
Potential common stock equivalents (consisting of units, warrants and stock options) totaling 8,430,380 and 5,353,533 for FY 2009 and FY 2010, respectively, have been excluded from the computation of diluted earnings per share because the effect is anti-dilutive.
Recently Issued Accounting Pronouncements
Effective July 1, 2009, the FASB ASC became the single official source of authoritative, nongovernmental U.S. GAAP. The historical U.S. GAAP hierarchy was eliminated and the ASC became the only level of authoritative U.S. GAAP, other than guidance issued by the SEC. The Company’s accounting policies were not affected by the conversion to ASC. However, references to specific accounting standards in the notes to our consolidated financial statements have been changed to refer to the appropriate section of the ASC.
Effective July 1, 2009, the Company adopted the provisions of a pronouncement issued in December 2007 on what is now codified as FASB ASC Topics 805, Business Combinations, and 810, Consolidation . Certain provisions of this pronouncement are required to be adopted retrospectively for all periods presented. In accordance with these provisions, minority interest is now referred to as noncontrolling interest and consolidated net income or loss has been recast to include net income or loss attributable to the noncontrolling interest.
Note 3. Equity Transactions
Warrants Issued in IPO
The Company, in connection with its IPO in April 2006, issued and sold a total of 8,625,000 units. Each unit consisted of one share of common stock and one warrant. In addition, the Company also issued and sold 583,333 privately-placed warrants to two executive officers for $1.20 per warrant. Each of the public and privately-placed warrants entitled the holder to purchase from the Company one share of common stock at an exercise price of $6.00, assuming there was an effective registration statement, and was redeemable at a price of $0.01 per warrant, under certain conditions. These warrants expired on June 30, 2010, at which time there were 5,072,380 still outstanding.
Also in connection with the IPO, the Company sold to the representative of the underwriters for $100 an option to purchase 750,000 units for $10.00 per unit. These units are identical to the units issued in the IPO, except that the warrants included in these units have an exercise price of $7.20. This option may be exercised on a cashless basis and expire on April 5, 2011.
Cumulative Preferred Stock
The Company is conducting private placements of Series A 12.5% Cumulative Preferred Stock, par value $0.0001 per share and liquidation preference of $50 per share (“Series A Preferred Stock”); and Series B 8% Cumulative Preferred Stock par value of $0.0001 per share and liquidation value of $1,000 per share (“Series B Preferred Stock”). The Series B Preferred Stock is offered primarily in connection with business combinations.
The Series A Preferred Stock and the Series B Preferred Stock are referred to collectively as the “Cumulative Preferred Stock.”
F-15
Table of Contents
GENERAL FINANCE CORPORATION AND SUBSIDIARIES
NOTES TO CONSOLIDATED FINANCIAL STATEMENTS
Upon issuance of the Cumulative Preferred Stock, the Company records the liquidation value as the preferred equity in the consolidated balance sheet, with any issuance or offering costs as a reduction in additional paid-in capital. As of June 30, 2010, the Company had issued 25,900 shares and 100 shares of Series A Preferred Stock and Series B Preferred Stock for total proceeds of $1,295,000 and $100,000, respectively.
The Cumulative Preferred Stock is not convertible into GFN common stock, has no voting rights, except as required by Delaware law, and is not redeemable prior to February 1, 2014; at which time it may be redeemed at any time, in whole or in part, at the Company’s option. Holders of the Cumulative Preferred Stock are entitled to receive, when declared by the Company’s Board of Directors, annual dividends payable quarterly in arrears on the 31 st day of January, July and October of each year and the 30 th day of April of each year. In the event of any liquidation or winding up of the Company, the holders of the Cumulative Preferred Stock will have preference to holders of common stock; with the holders of the Series A Preferred Stock having preference over holders of the Series B Preferred Stock. The Company has agreed to register for public trading the Cumulative Preferred Stock no later than one year from issuance.
As of June 30, 2010, since issuance, dividends paid or payable totaled $218,000 and $12,000 for the Series A Preferred Stock and Series B Preferred Stock, respectively. The characterization of dividends to the recipients for Federal income tax purposes is made based upon the earnings and profits of the Company, as defined by the Internal Revenue Code.
Rights Offering
On June 25, 2010, the Company completed a rights offering to stockholders of record as of May 14, 2010. The offering entitled holders of the rights to purchase units at $1.50 per unit, with each unit consisting of one share of GFN common stock and a three-year warrant to purchase 0.5 additional shares of GFN common stock at an exercise price of $4.00 per share. The rights were tradable during the offering period and, among other things, stockholders of record were generally able to purchase additional rights above their pro rata allocation and non-stockholders were able to purchase rights not exercised. A total of 8,920,000 rights to purchase 8,920,000 units were available.
The Company sold a total of 4,197,247 units that resulted, after deducting direct offering costs of $288,000, in net proceeds of $6,008,000 and the issuance of 4,197,247 shares of common stock and 4,197,247 warrants to acquire an additional 2,098,623 shares of common stock at an exercise price of $4.00 per share. As of June 30, 2010, subscriptions receivable from the rights offering totaled $1,311,000; of which $1,211,000 has been subsequently collected and, accordingly, has been reflected as an asset in the consolidated balance sheet.
The Company used $4,800,000 of the net proceeds from the rights offering in a refinancing at Pac-Van subsequent to June 30, 2010 (see Notes 5 and 13).
Note 4. Acquisitions
On July 11, 2008, the Company, through Royal Wolf, purchased the business of NT Container Services for $1,028,000. The total purchase price has been allocated to tangible and intangible assets acquired based on their estimated fair market values as of July 11, 2008.
On October 31, 2008, the Company, through Royal Wolf, purchased the business of Ace Container Services Pty Ltd for $741,000. The total purchase price has been allocated to tangible and intangible assets acquired based on their estimated fair market values as of October 31, 2008.
On December 8, 2008, the Company, through Pac-Van, purchased the business of Container Wholesalers for $499,000; including the issuance of 100 shares of Series B 8% Cumulative Preferred Stock (see Note 3). The total purchase price has been allocated to tangible and intangible assets acquired based on their estimated fair market values as of December 8, 2008.
F-16
Table of Contents
GENERAL FINANCE CORPORATION AND SUBSIDIARIES
NOTES TO CONSOLIDATED FINANCIAL STATEMENTS
Note 5. Senior and Other Debt
The following is a discussion of the Company’s significant senior and other debt.
Royal Wolf Senior Credit Facility and Subordinated Notes
Royal Wolf has a senior credit facility, as amended, with Australia and New Zealand Banking Group Limited (“ANZ”). The facility is subject to annual reviews by ANZ and is secured by substantially all of the assets of the Company’s Australian and New Zealand subsidiaries. The aggregate ANZ facility is comprised of various sub-facilities, not all of which provide additional borrowing availability. As of June 30, 2010, based upon the exchange rate of one Australian dollar to $0.8567 U.S. dollar and one New Zealand dollar to $0.8133 Australian dollar, borrowings and availability under the ANZ credit facility totaled $72,589,000 (AUS$84,731,000) and $4,908,000 (AUS$5,729,000), respectively. Principal payments during FY 2010 were required to be a minimum of AUS$1,250,000 per quarter, with an installment equal to 80% of Free Cash Flow, as defined, paid within 60 days from June 30, 2010. The minimum principal payments increase to AUS$1,500,000 ($1,285,000) per quarter during the year ending June 30, 2011 and vary throughout the scheduled maturity date of September 14, 2012. Approximately $48,020,000 (AUS$56,052,000) and $10,258,000 (AUS$11,974,000) of the borrowings under the ANZ credit facility at June 30, 2010 bear interest at ANZ’s prime rate, plus 3.15% per annum and 4.15% per annum, respectively; with the remaining borrowings bearing interest at varying rates. As of June 30, 2010, the weighted-average interest rate was 8.6%; which includes the effect of interest rate swap contracts and options (caps).
The ANZ senior credit facility is subject to certain covenants, including compliance with specified consolidated senior and total interest coverage and senior and total debt ratios, as defined, for each financial quarter based on earnings before interest, income taxes, depreciation and amortization and other non-operating costs (“EBITDA”), as defined, on a year-to-date or trailing twelve-month (“TTM”) basis; and restrictions on the payment of dividends, loans and payments to affiliates and granting of new security interests on the assets of any of the secured entities. A change of control in any of GFN Holdings or its direct and indirect subsidiaries without the prior written consent of ANZ constitutes an event of default under the facility. The ANZ senior credit facility further provides, among other things, that the $5,500,000 due Bison Capital (see below) must be paid by a capital infusion from GFN, that at least 50% of the amounts owed under the Bison Notes be hedged by Royal Wolf for foreign currency exchange risks and that capital expenditures of property, plant and equipment over $1,713,000 (AUS$2,000,000) in the year ending June 30, 2011 be approved by ANZ.
On September 13, 2007, in conjunction with the closing of the acquisition of Royal Wolf, the Company entered into a securities purchase agreement with Bison Capital, pursuant to which the Company issued and sold to Bison Capital, at par, a secured senior subordinated promissory note in the principal amount of $16,816,000 (the “Bison Note”). Pursuant to the securities purchase agreement, the Company issued to Bison Capital warrants to purchase 500,000 shares of common stock of GFN. The warrants issued to Bison Capital represent the right to purchase 500,000 shares of GFN’s common stock at an initial exercise price of $8.00 per share, subject to adjustment for stock splits and stock dividends. Unexercised warrants will expire September 13, 2014. The Bison Note bears interest at the annual rate of 13.5%, payable quarterly in arrears, and matures on March 13, 2013. The Company may extend the maturity date by one year, provided that it is not then in default. The Company may prepay the Bison Note at a declining price of 102% of par prior to September 13, 2010; 101% of par prior to September 13, 2011 and 100% of par thereafter. The maturity of the Bison Note may be accelerated upon an event of default or upon a change of control of GFN Finance or any of its subsidiaries. Payment under the Bison Note is secured by a lien on all or substantially all of the assets of GFN Finance and its subsidiaries, subordinated and subject to the intercreditor agreement with ANZ. If, during the 66-month period ending on the scheduled maturity date, GFN’s common stock has not traded above $10 per share for any 20 consecutive trading days on which the average daily trading volume was at least 30,000 shares (ignoring any daily trading volume above 100,000 shares), upon demand by Bison Capital, the Company will pay Bison Capital on the scheduled maturity date a premium of $1,000,000, less any gains realized by Bison Capital from any prior sale of the warrants and warrant shares. This premium is also payable upon any acceleration of the Bison Note due to an event of default or change of control of GFN Finance or any of its subsidiaries. As a condition to receiving this premium, Bison Capital must surrender for cancellation any remaining warrants and warrant shares.
On May 1, 2008, the Company issued and sold to Bison Capital a second secured senior subordinated promissory note in the principal amount of $5,500,000 on terms comparable to the original Bison Note, except that the maturity of this second note is July 1, 2011 and must be paid by a capital infusion from GFN (see above). Collectively, these two notes are referred to as the “Bison Notes.” At June 30, 2010, the principal balance of the Bison Notes was $21,676,000. The Bison Notes have covenants that require the maintenance of minimum EBITDA levels, as defined, and a total debt ratio based on a TTM EBITDA basis; as well as restrictions on capital expenditures.
Pac-Van Senior Credit Facility and Subordinated Note
Pac-Van had a senior credit facility, as amended, with a syndicate of four financial institutions led by Bank of America, N.A. (“BOA”), as administrative and collateral agent. On July 16, 2010, this facility was prepaid in full and replaced by a new senior credit facility formed by a syndicate of the other three financial institutions in the BOA credit facility (see Note 13).
F-17
Table of Contents
GENERAL FINANCE CORPORATION AND SUBSIDIARIES
NOTES TO CONSOLIDATED FINANCIAL STATEMENTS
The BOA credit facility was secured by substantially all the business assets of Pac-Van and GFNNA, including the assignment of its rights under leasing contracts with customers, and was available for purchases of rental equipment and general operating purposes. At June 30, 2010, borrowings under the BOA credit facility totaled $66,600,000, were due on August 23, 2012 and accrued interest at the lead lender’s prime lending rate or its prime lending rate plus 0.25%, or the LIBOR plus a stated margin ranging from 1.5% to 2.25%, based on Pac-Van’s leverage. In addition, the Company was required to pay an unused commitment fee equal to 0.25% of the average unused line calculated on a quarterly basis. As of June 30, 2010, the weighted-average interest rate was 3.3%. The BOA senior credit facility was subject to certain covenants, including compliance with minimum EBITDA levels, as defined, specified interest coverage, senior and total debt ratios based on a TTM EBITDA basis, a minimum lease fleet utilization rate, as defined; and, among other things, restrictions on the payment of dividends, loans and payments to affiliates.
Pac-Van also had a senior subordinated secured note payable to SPV Capital Funding, L.L.C. (“SPV”) with a principal balance of $25,000,000 at June 30, 2010. This subordinated note was scheduled to mature on February 2, 2013, but was repaid on July 16, 2010 in connection with the refinancing of the Pac-Van senior facility (see above). The subordinated note required quarterly interest only payments computed at 13.0% per annum and was also subject to the maintenance of certain financial covenants.
Other
The Company has a credit agreement at GFN, as amended, with Union Bank, N.A. (“UB”) for a $1,000,000 credit facility. Borrowings or advances under this facility bear interest at UB’s “Reference Rate” (which approximates the prime rate) and are due and payable at the earlier of 60 days from the advance date or the facility maturity date of March 31, 2011. The facility is guaranteed by GFN U.S. and requires the maintenance of certain quarterly and year-end financial reporting covenants. As of June 30, 2010, there were no borrowings outstanding under the UB credit facility.
Other debt totaled $318,000 at June 30, 2010.
Loan Covenant Compliance
The economic downturn in the U.S., particularly in the construction-related industries, and the global economy in general had an adverse impact on the Company’s operating results during FY 2010. To offset this adverse effect, the Company continued to undertake cost-reduction and other measures to be able to reduce its indebtedness and continue complying with the financial loan covenants of its senior lenders. The Company during the fourth quarter of FY 2010 amended its senior credit agreements at Royal Wolf to, among other things, extend required principal payments during the fiscal year ending June 30, 2011 and establish financial covenants at the ANZ credit facility at less restrictive levels. Subsequent to June 30, 2010, Pac-Van refinanced the BOA senior credit facility and subordinated note due SPV (see Note 13). This refinancing also resulted in the establishment of less restrictive covenants through a new senior credit facility. These actions should allow the Company to be able to satisfy its indebtedness and other liquidity requirements. However, if operating results do not improve, or worsen, the Company may eventually be unable to comply with the covenants governing its indebtedness; which may require waivers of covenant compliance, amendments to such agreements or alternative borrowing arrangements. In the event of noncompliance with covenants, there is no assurance that the senior lenders would consent to such an amendment or waiver in the event of noncompliance; or that such consent would not be conditioned upon the receipt of a cash payment, revised principal payout terms, increased interest rates, or restrictions in the expansion of the credit facilities, or that our senior lenders would not exercise rights that would be available to them, including, among other things, demanding payment of outstanding borrowings.
Scheduled Maturities on Senior and Other Debt
The scheduled maturities for the senior credit facilities senior subordinated notes and other debt at June 30, 2010 were as follows (in thousands):
| Year Ending June 30, |
||||
| 2011 |
$ | 9,188 | ||
| 2012 |
19,737 | |||
| 2013 |
156,152 | |||
| 2014 |
152 | |||
| 2015 |
31 | |||
| Thereafter |
923 | |||
|
|
|
|||
| $ | 186,183 | |||
|
|
|
|||
F-18
Table of Contents
GENERAL FINANCE CORPORATION AND SUBSIDIARIES
NOTES TO CONSOLIDATED FINANCIAL STATEMENTS
Note 6. Financial Instruments
Fair Value Measurements
The Company adopted what is now codified as FASB ASC Topic 820, Fair Value Measurements and Disclosures, effective July 1, 2008. FASB ASC Topic 820 defines fair value as the price that would be received from selling an asset or paid to transfer a liability in an orderly transaction between market participants. As such, fair value is a market-based measurement that should be determined based on assumptions that market participants would use in pricing an asset or liability. As a basis for considering such assumptions, FASB ASC Topic 820 establishes a three-tier fair value hierarchy, which prioritizes the inputs used in measuring fair value, as follows:
Level 1 — Observable inputs such as quoted prices in active markets for identical assets or liabilities;
Level 2 — Observable inputs, other than Level 1 inputs in active markets, that are observable either directly or indirectly; and
Level 3 — Unobservable inputs in which there is little or no market data, which require the reporting entity to develop its own assumptions.
Exposure to credit, interest rate and currency risks arises in the normal course of the Company’s business. The Company may use derivative financial instruments to hedge exposure to fluctuations in foreign exchange rates and interest rates. The Company believes it has no material market or credit risks to its operations, financial position or liquidity as a result of its commodities and other derivatives activities, including forward-exchange contracts. The Company’s swap contracts and options (caps) and forward-exchange contracts are not traded on a market exchange; therefore, the fair values are determined using valuation models that include assumptions about yield curve at the reporting dates as well as counter-party credit risk. The Company has consistently applied these calculation techniques to all periods presented.
Derivative instruments measured at fair value and their classification on the consolidated balances sheets and consolidated statements of operations are as follows (in thousands):
| Derivative — Fair Value (Level 2) June 30, |
||||||||||
| Type of Derivative Contract |
Balance Sheet Classification |
2009 | 2010 | |||||||
| Swap Contracts and Options (Caps) |
Trade payables and accrued liabilities | $ | (1,587 | ) | $ | (1,222 | ) | |||
| Forward-Exchange Contracts |
Trade and other receivables | — | 247 | |||||||
| Forward-Exchange Contracts |
Trade payables and accrued liabilities | (656 | ) | — | ||||||
|
|
|
|
|
|||||||
| Year Ended June 30, | ||||||||||
| Type of Derivative Contract |
Statement of Operations Classification |
2009 | 2010 | |||||||
| Swap Contracts and Options (Caps) |
Unrealized gain (loss) included in interest expense | $ | (2,057 | ) | $ | 231 | ||||
| Forward Contracts |
Foreign currency exchange gain and other | 157 | 958 | |||||||
|
|
|
|
|
|||||||
F-19
Table of Contents
GENERAL FINANCE CORPORATION AND SUBSIDIARIES
NOTES TO CONSOLIDATED FINANCIAL STATEMENTS
Fair Value of Financial Instruments
Under the provisions of FASB ASC Topic 825, Financial Instruments, the carrying value of the Company’s financial instruments, which include cash and cash equivalents, net receivables, trade payables and accrued liabilities, borrowings under the senior credit facilities, the subordinated notes, interest rate swap and forward exchange contracts and commercial bills; approximate fair value due to current market conditions, maturity dates and other factors.
Interest Rate Swap Contracts
The Company’s exposure to market risk for changes in interest rates relates primarily to its long-term debt obligations. The Company’s policy is to manage its interest expense by using a mix of fixed and variable rate debt.
To manage this mix in a cost-efficient manner, the Company enters into interest rate swaps and interest rate options, in which the Company agrees to exchange, at specified intervals, the difference between fixed and variable interest amounts calculated by reference to an agreed-upon notional principal amount. These swaps and options are designated to hedge changes in the interest rate of a portion of the ANZ outstanding borrowings. The Company believes that financial instruments designated as interest rate hedges are highly effective. However, documentation of such, as required by FASB ASC Topic 815 , Derivatives and Hedging, does not exist. Therefore, all movements in the fair values of these hedges are reported in the statement of operations in the period in which fair values change.
The Company’s interest rate swap and option (cap) contracts are not traded on a market exchange; therefore, the fair values are determined using valuation models which include assumptions about the interest rate yield curve at the reporting dates (Level 2 fair value measurement). As of June 30, 2009 and 2010, there were four open interest rate swap contracts and three open interest rate option (cap) contracts, as follows (dollars in thousands):
| June 30, 2009 | June 30, 2010 | |||||||||||||||
| Notional Amount | Fair Value | Notional Amount | Fair Value | |||||||||||||
| Swap |
$ | 13,279 | $ | (892 | ) | $ | 14,136 | $ | (669 | ) | ||||||
| Swap |
1,610 | (157 | ) | 1,713 | (118 | ) | ||||||||||
| Swap |
4,059 | (369 | ) | 4,320 | (277 | ) | ||||||||||
| Swap |
2,873 | (245 | ) | 3,091 | (171 | ) | ||||||||||
| Option (Cap) |
9,658 | 68 | 10,280 | 13 | ||||||||||||
| Option (Cap) |
1,231 | 1 | 1,852 | 1 | ||||||||||||
| Option (Cap) |
1,739 | 7 | 1,325 | (1 | ) | |||||||||||
|
|
|
|
|
|
|
|
|
|||||||||
| Total |
$ | 34,449 | $ | (1,587 | ) | $ | 36,717 | $ | (1,222 | ) | ||||||
|
|
|
|
|
|
|
|
|
|||||||||
Credit Risk
Financial instruments potentially exposing the Company to concentrations of credit risk consist primarily of receivables. Concentrations of credit risk with respect to receivables are limited due to the large number of customers spread over a large geographic area in many industry sectors. However, in the U.S. a significant portion of the Company’s business activity is with companies in the construction industry. Revenues and trade receivables from this industry totaled $25,376,000 and $5,757,000 during FY 2009 and at June 30, 2009, respectively; and $21,137,000 and $3,953,000 during FY 2010 and at June 30, 2010, respectively.
The Company’s receivables related to sales are generally secured by the equipment sold to the customer. The Company’s receivables related to its lease operations are primarily amounts generated from both off-site and on-site customers. The Company has the right to repossess lease equipment for nonpayment. It is the Company’s policy that all customers who wish to purchase or lease containers on credit terms are subject to credit verification procedures and the Company will agree to terms with customers believed to be creditworthy. In addition, receivable balances are monitored on an ongoing basis with the result that the Company’s exposure to bad debts is not significant. Net allowance for doubtful accounts provided and uncollectible accounts written off, net of recoveries, was $958,000 and $588,000 and $625,000 and $947,000 for FY 2009 and FY 2010, respectively. The translation gain (loss) to the allowance for doubtful accounts for FY 2009 and FY 2010 was ($80,000) and $45,000, respectively; and with the RWNZ and Pac-Van acquisitions, the Company recorded an allowance for doubtful accounts of $1,904,000 in FY 2009.
With respect to credit risk arising from the other significant financial assets of the Company, which comprise cash and cash equivalents, available-for-sale financial assets and certain derivative instruments, the Company’s exposure to credit risk arises from default of the counter party, with a maximum exposure equal to the carrying amount of these instruments. As the counter party for derivative instruments is nearly always a bank, the Company has assessed this as a low risk.
F-20
Table of Contents
GENERAL FINANCE CORPORATION AND SUBSIDIARIES
NOTES TO CONSOLIDATED FINANCIAL STATEMENTS
Foreign Currency Risk
The Company has transactional currency exposures. Such exposure arises from sales or purchases in currencies other than the functional currency. The currency giving rise to this risk is primarily U.S. dollars. Royal Wolf has a bank account denominated in U.S. dollars into which a small number of customers pay their debts. This is a natural hedge against fluctuations in the exchange rate. The funds are then used to pay suppliers, avoiding the need to convert to Australian dollars. Royal Wolf uses forward currency contracts and options to eliminate the currency exposures on the majority of its transactions denominated in foreign currencies, either by transaction if the amount is significant, or on a general cash flow hedge basis. The forward currency contracts and options are always in the same currency as the hedged item. The Company believes that financial instruments designated as foreign currency hedges are highly effective. However documentation of such as required by ASC Topic 815 does not exist. Therefore, all movements in the fair values of these hedges are reported in the statement of operations in the period in which fair values change.
The Company also has certain U.S. dollar-denominated debt at Royal Wolf, including intercompany borrowings, which are remeasured at each financial reporting date with the impact of the remeasurement being recorded in our consolidated statements of operations. Unrealized gains and losses resulting from such remeasurement due to changes in the Australian exchange rate to the U.S. dollar could have significant impact in the Company’s reported results of operations, as well as any realized gains and losses from the payments on such U.S. dollar-denominated debt and intercompany borrowings. In FY 2009, net unrealized and realized foreign exchange (losses) totaled ($6,616,000) and ($2,847,000), respectively. In FY 2010, net unrealized and realized foreign exchange gains totaled $586,000 and $453,000, respectively.
Note 7. Income Taxes
Income (loss) before provision for income taxes consisted of the following (in thousands):
| Year Ended June 30, | ||||||||
| 2009 | 2010 | |||||||
| U.S. |
$ | 3,593 | $ | (4,303 | ) | |||
| Asia-Pacific |
(14,712 | ) | (5,914 | ) | ||||
|
|
|
|
|
|||||
| $ | (11,119 | ) | $ | (10,217 | ) | |||
|
|
|
|
|
|||||
The provision (benefit) for income taxes consisted of the following (in thousands):
| Year Ended June 30, | ||||||||
| 2009 | 2010 | |||||||
| Current: |
||||||||
| U.S. Federal |
$ | — | $ | (1,041 | ) | |||
| State |
— | — | ||||||
| Asia -Pacific |
— | (30 | ) | |||||
|
|
|
|
|
|||||
| — | (1,071 | ) | ||||||
|
|
|
|
|
|||||
| Deferred: |
||||||||
| U.S. Federal |
(1,172 | ) | (152 | ) | ||||
| State |
(739 | ) | (87 | ) | ||||
| Asia-Pacific |
(2,463 | ) | 49 | |||||
|
|
|
|
|
|||||
| (4,374 | ) | (190 | ) | |||||
|
|
|
|
|
|||||
| $ | (4,374 | ) | $ | (1,261 | ) | |||
|
|
|
|
|
|||||
F-21
Table of Contents
GENERAL FINANCE CORPORATION AND SUBSIDIARIES
NOTES TO CONSOLIDATED FINANCIAL STATEMENTS
The components of the net deferred tax liability are as follows (in thousands):
| June 30, | ||||||||
| 2009 | 2010 | |||||||
| Deferred tax assets: |
||||||||
| Net operating loss and tax credit carryforwards |
$ | 14,308 | $ | 19,082 | ||||
| Deferred revenue and expenses |
137 | 209 | ||||||
| Accrued compensation and other benefits |
204 | 441 | ||||||
| Allowance for doubtful accounts |
670 | 605 | ||||||
| Unrealized exchange gains and losses |
946 | 597 | ||||||
|
|
|
|
|
|||||
| Total deferred tax assets |
16,265 | 20,934 | ||||||
| Valuation allowance |
— | — | ||||||
|
|
|
|
|
|||||
| Net deferred tax assets |
16,265 | 20,934 | ||||||
|
|
|
|
|
|||||
| Deferred tax liabilities: |
||||||||
| Accelerated tax depreciation and amortization |
(28,810 | ) | (33,216 | ) | ||||
| Other |
(1,277 | ) | (1,127 | ) | ||||
|
|
|
|
|
|||||
| Total deferred tax liabilities |
(30,087 | ) | (34,343 | ) | ||||
|
|
|
|
|
|||||
| Net deferred tax liabilities |
$ | (13,822 | ) | $ | (13,409 | ) | ||
|
|
|
|
|
|||||
At June 30, 2010, the Company had a U.S. federal net operating loss carryforward of $46,700,000, which expires if unused during fiscal years 2020 — 2030, and an Australian net operating loss carryforward of approximately $21,700,000 with no expiration date. As a result of the stock ownership change in the merger with MOAC (see Note 1), the available deduction of the net operating loss carryforward of $27,500,000 acquired in the Pac-Van acquisition is limited on a yearly basis.
Management evaluates the ability to realize its deferred tax assets on a quarterly basis and adjusts the amount of its valuation allowance if necessary. No valuation allowance has been determined to be required as of June 30, 2009 and 2010.
A reconciliation of the U.S. federal statutory rate of 34% to the Company’s effective tax rate is as follows:
| Year Ended June 30, | ||||||||
| 2009 | 2010 | |||||||
| Federal statutory rate |
(34.0 | )% | (34.0 | )% | ||||
| State and Asia-Pacific taxes, net of U.S. federal benefit and credit |
(4.4 | ) | (4.0 | ) | ||||
| Amortization and impairment of goodwill and intangible assets, net |
(4.8 | ) | 24.1 | |||||
| Nondeductible expenses |
3.9 | 1.6 | ||||||
|
|
|
|
|
|||||
| Effective tax rate |
(39.3 | )% | (12.3 | )% | ||||
|
|
|
|
|
|||||
Note 8. Related-Party Transactions
The Company has utilized certain accounting, administrative and secretarial services from affiliates of officers; as well as office space provided by an affiliate of Ronald F. Valenta, a director and the chief executive officer of the Company.
Effective January 31, 2008, the Company entered into a lease with an affiliate of Mr. Valenta for its new corporate headquarters in Pasadena, California. The rent is $7,393 per month, effective March 1, 2009, plus allocated charges for common area maintenance, real property taxes and insurance, for approximately 3,000 square feet of office space. The term of the lease is five years, with two five-year renewal options, and the rent is adjusted yearly based on the consumer price index. Rental payments were $113,000 and $110,000 in FY 2009 and FY 2010, respectively.
F-22
Table of Contents
GENERAL FINANCE CORPORATION AND SUBSIDIARIES
NOTES TO CONSOLIDATED FINANCIAL STATEMENTS
Effective October 1, 2008, the Company entered into a services agreement through June 30, 2009 (the “Termination Date”) with an affiliate of Mr. Valenta for certain accounting, administrative and secretarial services to be provided at the corporate offices and for certain operational, technical, sales and marketing services to be provided directly to the Company’s operating subsidiaries. Charges for services rendered at the corporate offices will be, until further notice, at $7,000 per month and charges for services rendered to the Company’s subsidiaries will vary depending on the scope of services provided. The services agreement provides for, among other things, mutual modifications to the scope of services and rates charged and automatically renews for successive one-year terms, unless terminated in writing by either party not less than 30 days prior to the Termination Date. Total charges to the Company for services rendered under this agreement totaled $234,000 ($63,000 at the corporate office and $155,000, plus out-of-pocket expenses of $16,000, at the operating subsidiaries) in FY 2009 and $114,000 ($84,000 at the corporate office and $30,000 at the operating subsidiaries) in FY 2010.
Note 9. Stock Option Plans
On August 29, 2006, the Board of Directors of the Company adopted the General Finance Corporation 2006 Stock Option Plan (“2006 Plan”), which was approved and amended by stockholders on June 14, 2007 and December 11, 2008, respectively. Options granted and outstanding under the 2006 Plan are either incentive stock options under Section 422 of the Internal Revenue Code of 1986, as amended, or so-called non-qualified options that are not intended to meet incentive stock option requirements. All options granted do not have a term in excess of ten years, and the exercise price of any option is not less than the fair market value of the Company’s common stock on the date of grant. After the adoption by the Board of Directors and upon the approval of the 2009 Stock Incentive Plan by the stockholders (see below), the Company suspended any further grants under the 2006 Plan.
On September 21, 2009, the Board of Directors of the Company adopted the 2009 Stock Incentive Plan (“2009 Plan”), which was approved by the stockholders at the Company’s annual meeting on December 10, 2009. The 2009 Plan is an “omnibus” incentive plan permitting a variety of equity programs designed to provide flexibility in implementing equity and cash awards, including incentive stock options, nonqualified stock options, restricted stock grants, restricted stock units, stock appreciation rights, performance stock, performance units and other stock-based awards. Participants in the 2009 Plan may be granted any one of the equity awards or any combination of them, as determined by the Board of Directors or the Compensation Committee. Upon the approval of the 2009 Plan by the stockholders, the Company suspended further grants under the 2006 Plan (see above). Any stock options which are forfeited under the 2006 Plan will become available for grant under the 2009 Plan, but the total number of shares available under the 2006 Plan and the 2009 Plan will not exceed the 2,500,000 shares reserved for grant under the 2006 Plan. Unless terminated earlier at the discretion of the Board of Directors, the 2009 Plan will terminate September 21, 2019.
On each of September 11, 2006 (“2006 Grant”) and December 14, 2007 (“2007 Grant”), the Company granted options to two officers of GFN to each purchase 225,000 shares of common stock at an exercise price equal to the closing market price of the Company’s common stock as of that date, or $7.30 per share and $9.05 per share, respectively, with a vesting period of five years.
On January 22, 2008 (“2008 Grant”), the Company granted options to certain key employees of Royal Wolf to purchase 489,000 shares of common stock at an exercise price equal to the closing market price of the Company’s common stock as of that date, or $8.80 per share. The 2008 Grant consisted of 243,000 options with a vesting period of five years and 246,000 options that vest subject to a performance condition based on Royal Wolf achieving a certain EBITDA target for FY 2008. The Company initially commenced recognizing compensation expense over the vesting period of 20 months.
In June 2008, the Compensation Committee of the Company’s Board of Directors determined that the full EBITDA target for the 2008 Grant would not be achieved. As a result, the 2008 Grant was modified whereby one-half of the outstanding options subject to the EBITDA performance criteria were deemed to have achieved the performance condition. The remaining one-half of these performance-based options (“PB 2008 Grant”) were modified on July 23, 2008 (see below) for EBITDA targets at Royal Wolf pertaining to FY 2009 and FY 2010. At that time, the Company reassessed and revalued these options and commenced recognizing the changes in share-based compensation on a prospective basis.
On July 23, 2008 (“July 2008 Grant”), the Company granted options to certain key employees of Royal Wolf to purchase 198,500 shares of common stock at an exercise price equal to the closing market price of the Company’s common stock as of that date, or $5.35 per share. The July 2008 Grant consisted of the PB 2008 Grant (see above) totaling 118,500 options, 40,000 options with a vesting period of five years and 40,000 options that vest subject to a performance condition based on Royal Wolf achieving certain EBITDA targets for FY 2009 and FY 2010. The Company initially commenced recognizing compensation expense over the vesting periods of 2.17 years and 3.17 years for EBITDA targets in FY 2009 and FY 2010, respectively, pertaining to 79,250 options in each of those vesting periods. However, it was subsequently determined that the EBITDA targets for both years were probable of not being achieved and, as result, previously recorded share-based compensation were reversed in the respective fiscal years; but the related performance-based options were not officially forfeited until the subsequent quarter ended September 30 th .
F-23
Table of Contents
GENERAL FINANCE CORPORATION AND SUBSIDIARIES
NOTES TO CONSOLIDATED FINANCIAL STATEMENTS
On September 18, 2008 (“September 2008 Grant”), the Company granted options to the non-employee members of its Board of Directors to purchase 36,000 shares of common stock at an exercise price equal to the closing market price of the Company’s common stock as of that date, or $6.50 per share, with a vesting period of three years.
On October 1, 2008 (“October 2008 Grant”), the Company granted options to certain key employees of Pac-Van and to a former stockholder of MOAC, who became a non-employee member of Company’s Board of Directors effective on that date, to purchase 356,000 shares of common stock at an exercise price equal to the closing market price of the Company’s common stock as of that date; or $6.40 per share. The October 2008 Grant consisted of 154,550 options with a vesting period of five years, 9,000 options with a vesting period of three years and 192,450 options that vest subject to performance conditions based on Pac-Van achieving EBITDA and return on asset targets for 2009 and to-be-determined targets for the subsequent four fiscal years. The Company commenced recognizing share-based compensation expense over the vesting periods ranging from 1.92 years to 5.92 years pertaining to 38,490 options in each of those vesting periods, but it was subsequently determined that the FY 2009 and FY 2010 fiscal year EBITDA targets were probable of not being achieved and, as result, previously recorded share-based compensation were reversed in those respective fiscal years. However, the related performance-based options were not officially forfeited until the subsequent quarter ended September 30th.
On December 11, 2008 (“December 2008 Grant”), the Company granted options to a non-employee member of its Board of Directors to purchase 9,000 shares of common stock at an exercise price equal to the closing market price of the Company’s common stock as of that date, or $1.78 per share, with a vesting period of three years.
On January 27, 2009 (“January 2009 Grant”), the Company granted options to certain key employees of Royal Wolf and Pac-Van to purchase 4,000 shares of common stock at an exercise price equal to the closing market price of the Company’s common stock as of that date, or $1.94 per share, with a vesting period of five years.
The fair value of the stock options granted under the 2006 Plan was determined by using the Black-Scholes option-pricing model. The range of the fair value of the stock options granted and the assumptions used are as follows:
| Fair value of stock option |
$ | 1.06 – $3.94 | ||
|
|
|
|||
| Assumptions used: |
||||
| Risk-free interest rate |
1.99% – 4.8 | % | ||
| Expected life (in years) |
7.5 | |||
| Expected volatility |
26.5% – 59.9 | % | ||
| Expected dividends |
— | |||
|
|
|
Under the 2009 Plan, on January 26, 2010 (“January 2010 Grant”) the Company granted options to two officers of GFN, certain key employees of Pac-Van and a non-employee to purchase 170,000 shares of common stock at an exercise price equal to the closing market value of the Company’s common stock as of that date; or $1.28 per share. The January 2010 Grant consisted of 4,750 options with a vesting period of five years, 20,000 options (granted to the non-employee) with a vesting period of three years and 145,250 options that vest subject to performance conditions based the achievement of certain EBITDA and other targets for FY 2010. The Company commenced recognizing share-based compensation expense on these performance-based options over an estimated vesting period of just over 20 months, but it was subsequently determined that the EBITDA target was not probable of being achieved and, as result, previously recorded share-based compensation was reversed in the fourth quarter of FY 2010. However, the related performance-based options will not be officially forfeited until the quarter ended September 30, 2010.
The weighted-average fair value of the stock options granted to the officers and key employees was $0.99, determined using the Black-Scholes option-pricing model under the following assumptions: A risk-free interest rate of 3.0% (average of five and ten-year Treasury bill); an expected life of 7.5 years; an expected volatility of 83.0%; and no expected dividend. At June 30, 2010, the weighted-average fair value of the stock options granted to the non-employee was $1.02, determined using the Black-Scholes option-pricing model using the following assumptions: A risk-free interest rate of 2.9% (average of five and ten-year Treasury bill); an expected life of 9.6 years; an expected volatility of 82.0%; and no expected dividend.
F-24
Table of Contents
GENERAL FINANCE CORPORATION AND SUBSIDIARIES
NOTES TO CONSOLIDATED FINANCIAL STATEMENTS
A summary of the Company’s stock option activity and related information as of and for FY 2009 and FY 2010 follows:
| Number of Options (Shares) |
Weighted- Average Exercise Price |
|||||||
| Outstanding at June 30, 2008 |
921,000 | $ | 8.49 | |||||
| Granted |
485,000 | 6.11 | ||||||
| Exercised |
— | — | ||||||
| Forfeited or expired |
(48,000 | ) | 7.63 | |||||
|
|
|
|
|
|||||
| Outstanding at June 30, 2009 |
1,358,000 | $ | 7.39 | |||||
|
|
|
|
|
|||||
| Exercisable at June 30, 2009 |
177,400 | $ | 8.10 | |||||
|
|
|
|
|
|||||
| Number of Options (Shares) |
Weighted- Average Exercise Price |
Weighted- Average Remaining Contractual Term (Years) |
||||||||||
| Outstanding at June 30, 2009 |
1,358,000 | $ | 7.39 | |||||||||
| Granted |
170,000 | 1.28 | ||||||||||
| Exercised |
— | — | ||||||||||
| Forfeited or expired |
(273,090 | ) | 6.97 | |||||||||
|
|
|
|
|
|||||||||
| Outstanding at June 30, 2010 |
1,254,910 | $ | 6.65 | 7.8 | ||||||||
|
|
|
|
|
|
|
|||||||
| Vested and expected to vest at June 30, 2010 |
1,045,127 | $ | 7.26 | 7.6 | ||||||||
|
|
|
|
|
|
|
|||||||
| Exercisable at June 30, 2010 |
403,960 | $ | 8.00 | 7.2 | ||||||||
|
|
|
|
|
|
|
|||||||
At June 30, 2010, the intrinsic value was zero as the Company’s market price for its common stock was at $1.25 per share, which is at or below the exercise prices of all of the outstanding stock options. Also at June 30, 2010, inception-to-date share-based compensation of $2,151,000 related to stock options has been recognized in the statement of operations, with a corresponding benefit to additional paid-in capital, and there remains $1,587,000 of unrecognized compensation expense to be recorded on a straight-line basis over the remaining weighted-average vesting period of 2.3 years.
A deduction is not allowed for U.S. income tax purposes with respect to non-qualified options granted in the United States until the stock options are exercised or, with respect to incentive stock options issued in the United States, unless the optionee makes a disqualifying disposition of the underlying shares. The amount of any deduction will be the difference between the fair value of the Company’s common stock and the exercise price at the date of exercise. Accordingly, there is a deferred tax asset recorded for the U.S. tax effect of the financial statement expense recorded related to stock option grants in the United States. The tax effect of the U.S. income tax deduction in excess of the financial statement expense, if any, will be recorded as an increase to additional paid-in capital.
F-25
Table of Contents
GENERAL FINANCE CORPORATION AND SUBSIDIARIES
NOTES TO CONSOLIDATED FINANCIAL STATEMENTS
Note 10. Commitments and Contingencies
Operating Lease Rentals
The Company leases office equipment and other facilities under operating leases. The leases have terms of between one and nine years, some with an option to renew the lease after that period. None of the leases includes contingent rentals. There are no restrictions placed upon the lessee by entering into these leases.
Non-cancellable operating lease rentals at June 30, 2010 are payable as follows (in thousands):
| Year Ending June 30, |
||||
| 2011 |
$ | 4,326 | ||
| 2012 |
2,815 | |||
| 2013 |
1,994 | |||
| 2014 |
1,376 | |||
| 2015 |
944 | |||
| Thereafter |
1,376 | |||
|
|
|
|||
| $ | 12,831 | |||
|
|
|
|||
Rental expense on non-cancellable operating leases was $4,204,000 and $5,373,000 in FY 2009 and FY 2010, respectively.
Sales-Type and Operating Fleet Leases
Future minimum payments to be received under sales-type and operating fleet leases at June 30, 2010 are as follows (in thousands):
| Year Ending June 30, |
||||
| 2011 |
$ | 7,806 | ||
| 2012 |
2,234 | |||
| 2013 |
1,166 | |||
| 2014 |
346 | |||
| 2015 |
111 | |||
| Thereafter |
333 | |||
|
|
|
|||
| $ | 11,996 | |||
|
|
|
|||
Put and Call Options
In conjunction with the closing of the acquisition of Royal Wolf, the Company entered into a shareholders agreement with Bison Capital. The shareholders agreement was amended on September 21, 2009 and provides that, at any time after July 1, 2011, Bison Capital may require the Company to purchase from Bison Capital all of its 13.8% outstanding capital stock of GFN U.S. The purchase price for the capital stock (which is payable in cash or, if mutually agreeable to both the Company and Bison Capital, paid in GFN common stock or some combination thereof) is the greater of the following:
(i) the amount equal to Bison Capital’s ownership percentage in GFN U.S. (13.8%) multiplied by the result of 8.25 multiplied by the sum of Royal Wolf’s EBITDA for a twelve-month determination period, as defined, plus all administrative expense payments or reimbursements made by Royal Wolf to the Company during such period; minus the net debt of Royal Wolf, as defined; or
(ii) the amount equal to the Bison Capital’s ownership percentage in GFN U.S. multiplied by the result of the GFN trading multiple, as defined, multiplied by Royal Wolf’s EBITDA for the determination period; minus the net debt of Royal Wolf; or
(iii) the greater of (1) $12,850,000 or (2) Bison Capital’s ownership percentage in GFN U.S. (or 13.8%) multiplied by the result of 8.25 multiplied by the sum of Royal Wolf’s TTM EBITDA measured at the end of each fiscal quarter through June 30, 2011, as defined.
Also under the shareholders agreement, the Company had the option, at anytime prior to September 13, 2010, to cause Bison Capital to sell and transfer its 13.8% outstanding capital stock of GFN U.S. to the Company for a purchase price equal to the product of 2.75 and Bison Capital’s cost in the GFN U.S. capital stock. Subsequent to July 1, 2012, the Company’s call option purchase price is similar to (i) and (ii) of the Bison Capital put option, except the EBITDA multiple is 8.75.
F-26
Table of Contents
GENERAL FINANCE CORPORATION AND SUBSIDIARIES
NOTES TO CONSOLIDATED FINANCIAL STATEMENTS
The Company accounts for Bison Capital’s put option as a non-freestanding financial instrument classified in temporary equity, pursuant to the requirements of SEC Accounting Series Release (“ASR”) No. 268, Presentation in Financial Statements of “Redeemable Preferred Stock.” In accordance with the guidelines of ASR No. 268, the redemption value of the put option has been reflected as redeemable noncontrolling interest with, prior to July 1, 2009, the corresponding adjustment to additional paid-in capital determined after the attribution of the net income or loss of Royal Wolf to noncontrolling interest. As discussed in Note 2, effective July 1, 2009, the Company adopted the provisions of a pronouncement issued in December 2007 on what is now codified as FASB ASC Topics 805, Business Combinations, and 810, Consolidation . In connection with the adoption of the provisions in these Topics, the Company now accretes the redemption value of the put option over the period from July 1, 2009 through June 30, 2011 with the corresponding adjustment to net income or loss attributable to noncontrolling interest.
Preferred Supply Agreement
In connection with a Business Sale Agreement dated November 14, 2007 with GE SeaCo Australia Pty Ltd. and GE SeaCo SRL (collectively “GE SeaCo”), Royal Wolf entered in a preferred supply agreement with GE SeaCo. Under the preferred supply agreement, GE SeaCo has agreed to sell to Royal Wolf, and Royal Wolf has agreed to purchase, all of GE SeaCo’s containers that GE SeaCo determines to sell, up to a maximum of 5,000 containers each year. The purchase price for the containers will be based on their condition and is specified in the agreement, subject to annual adjustment. In addition, Royal Wolf received a right of first refusal to purchase any additional containers that GE SeaCo desires to sell in Australia, New Zealand and Papua New Guinea. Either party may terminate the agreement upon no less than 90 days’ prior notice at any time after November 15, 2012.
Other Matters
The Company is not involved in any material lawsuits or claims arising out of the normal course of business. The nature of its business is such that disputes can occasionally arise with employees, vendors (including suppliers and subcontractors), and customers over warranties, contract specifications and contract interpretations among other things. The Company assesses these matters on a case-by-case basis as they arise. Reserves are established, as required, based on its assessment of its exposure. The Company has insurance policies to cover general liability and workers compensation related claims. In the opinion of management, the ultimate amount of liability not covered by insurance under pending litigation and claims, if any, will not have a material adverse effect on our financial position, operating results or cash flows.
Note 11. Detail of Certain Accounts
Trade payables and accrued liabilities consist of the following (in thousands):
| June 30, | ||||||||
| 2009 | 2010 | |||||||
| Trade payables |
$ | 14,328 | $ | 14,929 | ||||
| Payroll and related |
2,762 | 3,017 | ||||||
| Taxes, other than income |
1,488 | 937 | ||||||
| Fair value of interest swap and option and forward currency exchange contacts |
2,243 | 1,222 | ||||||
| Accrued interest |
1,599 | 1,718 | ||||||
| Other accruals |
2,237 | 3,423 | ||||||
|
|
|
|
|
|||||
| $ | 24,657 | $ | 25,246 | |||||
|
|
|
|
|
|||||
F-27
Table of Contents
GENERAL FINANCE CORPORATION AND SUBSIDIARIES
NOTES TO CONSOLIDATED FINANCIAL STATEMENTS
Note 12. Segment Reporting
The tables below represent the Company’s revenues from external customers, operating income, interest income and expense, share-based compensation expense, depreciation and amortization, expenditures for additions to long-lived assets (consisting of lease fleet and property, plant and equipment) and long-lived assets; as attributed to its two geographic (and operating) segments (in thousands):
| Year Ended June 30, | ||||||||
| 2009 | 2010 | |||||||
| Revenues from external customers |
||||||||
| North America: |
||||||||
| Sales |
$ | 19,657 | $ | 19,938 | ||||
| Leasing |
34,781 | 37,203 | ||||||
|
|
|
|
|
|||||
| 54,438 | 57,141 | |||||||
|
|
|
|
|
|||||
| Asia-Pacific: |
||||||||
| Sales |
55,871 | 59,269 | ||||||
| Leasing |
36,151 | 39,899 | ||||||
|
|
|
|
|
|||||
| 92,022 | 99,168 | |||||||
|
|
|
|
|
|||||
| Total |
$ | 146,460 | $ | 156,309 | ||||
|
|
|
|
|
|||||
| Operating income |
||||||||
| North America |
$ | 6,365 | $ | (4,613 | ) | |||
| Asia-Pacific |
7,693 | 8,188 | ||||||
|
|
|
|
|
|||||
| Total |
$ | 14,058 | $ | 3,575 | ||||
|
|
|
|
|
|||||
| Interest income |
||||||||
| North America |
$ | 7 | $ | — | ||||
| Asia-Pacific |
289 | 234 | ||||||
|
|
|
|
|
|||||
| Total |
$ | 296 | $ | 234 | ||||
|
|
|
|
|
|||||
| Interest expense |
||||||||
| North America |
$ | 4,451 | $ | 5,299 | ||||
| Asia-Pacific |
11,710 | 10,675 | ||||||
|
|
|
|
|
|||||
| Total |
$ | 16,161 | $ | 15,974 | ||||
|
|
|
|
|
|||||
| Share-based compensation |
||||||||
| North America |
$ | 347 | $ | 520 | ||||
| Asia-Pacific |
438 | 109 | ||||||
|
|
|
|
|
|||||
| Total |
$ | 902 | $ | 629 | ||||
|
|
|
|
|
|||||
| Impairment of goodwill |
||||||||
| North America |
$ | — | $ | 7,633 | ||||
| Asia-Pacific |
— | — | ||||||
|
|
|
|
|
|||||
| Total |
$ | — | $ | 7,633 | ||||
|
|
|
|
|
|||||
| Depreciation and amortization |
||||||||
| North America |
$ | 5,729 | $ | 6,512 | ||||
| Asia-Pacific |
11,316 | 13,107 | ||||||
|
|
|
|
|
|||||
| Total |
$ | 17,045 | $ | 19,619 | ||||
|
|
|
|
|
|||||
| Additions to long-lived assets |
||||||||
| North America |
$ | 4,539 | $ | 575 | ||||
| Asia-Pacific |
13,292 | 6,017 | ||||||
|
|
|
|
|
|||||
| Total |
$ | 17,831 | $ | 6,592 | ||||
|
|
|
|
|
|||||
| At June 30, | ||||||||
| 2009 | 2010 | |||||||
| Long-lived assets |
||||||||
| North America |
$ | 112,419 | $ | 108,064 | ||||
| Asia-Pacific |
86,956 | 90,528 | ||||||
|
|
|
|
|
|||||
| Total |
$ | 199,375 | $ | 198,592 | ||||
|
|
|
|
|
|||||
Intersegment net revenues totaled $432,000 during FY 2009 and $4,151,000 during FY 2010.
F-28
Table of Contents
GENERAL FINANCE CORPORATION AND SUBSIDIARIES
NOTES TO CONSOLIDATED FINANCIAL STATEMENTS
Note 13. Subsequent Event
On July 16, 2010, the Company entered into several agreements relating to: (a) a new $85,000,000 senior secured revolving credit facility at Pac-Van with a syndicate led by PNC Bank, National Association (“PNC”) and including Wells Fargo Bank, National Association and UB (the “PNC Credit Facility”); and (b) a new $15,000,000 senior subordinated note with Laminar Direct Capital, L.L.C. (“Laminar”) issued by GFN (the “Laminar Note”). Borrowings under the PNC Credit Facility and proceeds from both the issuance of the Laminar Note and the Company’s rights offering completed on June 25, 2010 (see Note 3) were used to prepay in full all borrowings under the BOA credit facility and the $25,000,000 senior subordinated secured note payable to SPV (see Note 5).
PNC Credit Facility
Under the terms of the PNC Credit Facility, Pac-Van may borrow up to $85,000,000, subject to the terms of a borrowing base, as defined, and will accrue interest, at Pac-Van’s option, either at the prime rate plus 2.75%, or the Eurodollar rate plus 3.75%. The PNC Credit Facility also provides for the issuance of irrevocable standby letters of credit in amounts totaling up to $5,000,000, contains certain financial covenants (which are less restrictive than those under the BOA credit facility), including fixed charge coverage ratios, senior leverage ratios and lease fleet utilization ratios; and also includes customary negative and other covenants, including events of default relating to a change of control, as defined, at GFN, GFNNA (which has guaranteed the repayment of all outstanding borrowings and obligations of the PNC Credit Facility) and Pac-Van or the cessation of involvement of Ronald F. Valenta as a director or officer in the operations and management of GFN, GFNNA or Pac-Van.
The PNC Credit Facility matures on January 16, 2013, at which time all amounts borrowed must be repaid, but Pac-Van has the right to prepay loans in whole or in part at any time, provided that Pac-Van will be required to pay PNC a prepayment fee of $700,000 if it prepays the loans in full prior to July 16, 2011 and to pay PNC a prepayment fee of $350,000 if it prepays the loans in full after July 16, 2011 but prior to July 16, 2012.
The repayment of borrowings under the PNC Credit Facility is secured by substantially all of the assets of Pac-Van and by a limited guaranty by Ronald F. Valenta and Lydia D. Valenta (the “Valenta Limited Guaranty”). Pursuant to the Valenta Limited Guaranty, the Valentas guaranteed $10,000,000 of borrowings from July 16, 2010 until June 30, 2011, $8,000,000 of borrowings from July 1, 2011 until June 30, 2012 and $6,000,000 of borrowings from July 1, 2012 until January 16, 2013. The amounts guaranteed by the Valentas will only be reduced if no event of default has occurred under the PNC Credit Facility and if Pac-Van has delivered to PNC the certificates necessary to demonstrate compliance by Pac-Van with the financial covenants at the date of each scheduled reduction. In consideration for entering into the Valenta Limited Guaranty, Pac-Van will pay the Valentas a fee equal to 1.2% of the lower of outstanding borrowings or the guaranty amount. A guarantee fee of $120,000 for the first year was paid at or near the closing of the PNC Credit Facility and, commencing with the first anniversary from the closing date, the guaranty fee will be paid in advance at a rate of 0.3% per quarter, so long as Pac-Van remains in compliance with the covenants of the PNC Credit Facility. In addition, the Valentas entered into a pledge and security agreement for the benefit of PNC whereby the Valentas pledged a deposit account maintained by PNC, and all interest accrued thereon, to secure the repayment of all loans and the performance of all obligations under the PNC Credit Facility.
Laminar Note
The Laminar Note accrues interest at the floating rate of LIBOR plus 10.0% per annum, provided that LIBOR shall be not less than 3.0%, and is payable monthly in arrears commencing on August 1, 2010. The Laminar Note matures on July 16, 2013, at which time all amounts borrowed must be repaid; but it may be prepaid by GFN in part or in full at any time before the maturity date without penalty and by Pac-Van, upon prior written notice, subject to the terms of the intercreditor agreement among Pac-Van, GFNNA, PNC and Laminar.
The Laminar Note contains certain financial covenants, including a consolidated funded indebtedness-to-consolidated EBITDA leverage ratio, a minimum consolidated EBITDA covenant for the four most recently completed calendar quarters of not less than $28,000,000; and customary negative and other covenants, including events of default relating to a change of control, as defined, at GFN, GFNNA and Pac-Van (both of which have guaranteed the repayment of all outstanding borrowings and obligations of the Laminar Note) and covenants which limit the ability of GFNNA and Pac-Van to sell assets, enter into acquisitions and incur additional indebtedness. In addition, the terms of the Laminar Note prohibit GFNNA and Pac-Van from extending the maturity of the PNC Credit Facility to a date later than April 16, 2013, increasing the maximum indebtedness above $93,500,000 without the prior written consent of Laminar, entering into interest rate increases for indebtedness and from undertaking certain other actions.
F-29
Table of Contents
GENERAL FINANCE
CORPORATION
100,000 Shares of Common Stock
PROSPECTUS
, 2011
Table of Contents
PART II
INFORMATION NOT REQUIRED IN PROSPECTUS
| Item 13. | Other Expenses of Issuance and Distribution. |
The estimated expenses payable by us in connection with the offering described in this registration statement (other than the underwriting discount and commissions) will be as follows:
| SEC registration fee |
$ | 35 | ||
| NASD filing fee |
10,000 | |||
| Accounting fees and expenses |
10,000 | |||
| Printing and engraving expenses |
10,000 | |||
| Legal fees and expenses |
25,000 | |||
| NASDAQ Global Market filing fee |
0 | |||
| Miscellaneous |
10,000 | |||
|
|
|
|||
| Total |
$ | 65,035 | ||
|
|
|
| Item 14. | Indemnification of Directors and Officers. |
Our certificate of incorporation provides that all directors, officers, employees and agents of the registrant shall be entitled to be indemnified by us to the fullest extent permitted by Section 145 of the Delaware General Corporation Law.
Section 145 of the Delaware General Corporation Law concerning indemnification of officers, directors, employees and agents is set forth below.
“Section 145. Indemnification of officers, directors, employees and agents; insurance.
(a) A corporation shall have power to indemnify any person who was or is a party or is threatened to be made a party to any threatened, pending or completed action, suit or proceeding, whether civil, criminal, administrative or investigative (other than an action by or in the right of the corporation) by reason of the fact that the person is or was a director, officer, employee or agent of the corporation, or is or was serving at the request of the corporation as a director, officer, employee or agent of another corporation, partnership, joint venture, trust or other enterprise, against expenses (including attorneys’ fees), judgments, fines and amounts paid in settlement actually and reasonably incurred by the person in connection with such action, suit or proceeding if the person acted in good faith and in a manner the person reasonably believed to be in or not opposed to the best interests of the corporation, and, with respect to any criminal action or proceeding, had no reasonable cause to believe the person’s conduct was unlawful. The termination of any action, suit or proceeding by judgment, order, settlement, conviction, or upon a plea of nolo contendere or its equivalent, shall not, of itself, create a presumption that the person did not act in good faith and in a manner which the person reasonably believed to be in or not opposed to the best interests of the corporation, and, with respect to any criminal action or proceeding, had reasonable cause to believe that the person’s conduct was unlawful.
(b) A corporation shall have power to indemnify any person who was or is a party or is threatened to be made a party to any threatened, pending or completed action or suit by or in the right of the corporation to procure a judgment in its favor by reason of the fact that the person is or was a director, officer, employee or agent of the corporation, or is or was serving at the request of the corporation as a director, officer, employee or agent of another corporation, partnership, joint venture, trust or other enterprise against expenses (including attorneys’ fees) actually and reasonably incurred by the person in connection with the defense or settlement of such action or suit if the person acted in good faith and in a manner the person reasonably believed to be in or not opposed to the best interests of the corporation and except that no indemnification shall be made in respect of any claim, issue or matter as to which such person shall have been adjudged to be liable to the corporation unless and only to the extent that the Court of Chancery or the court in which such action or suit was brought shall determine upon application that, despite the adjudication of liability but in view of all the circumstances of the case, such person is fairly and reasonably entitled to indemnity for such expenses which the Court of Chancery or such other court shall deem proper.
II-1
Table of Contents
(c) To the extent that a present or former director or officer of a corporation has been successful on the merits or otherwise in defense of any action, suit or proceeding referred to in subsections (a) and (b) of this section, or in defense of any claim, issue or matter therein, such person shall be indemnified against expenses (including attorneys’ fees) actually and reasonably incurred by such person in connection therewith.
(d) Any indemnification under subsections (a) and (b) of this section (unless ordered by a court) shall be made by the corporation only as authorized in the specific case upon a determination that indemnification of the present or former director, officer, employee or agent is proper in the circumstances because the person has met the applicable standard of conduct set forth in subsections (a) and (b) of this section. Such determination shall be made, with respect to a person who is a director or officer at the time of such determination, (1) by a majority vote of the directors who are not parties to such action, suit or proceeding, even though less than a quorum, or (2) by a committee of such directors designated by majority vote of such directors, even though less than a quorum, or (3) if there are no such directors, or if such directors so direct, by independent legal counsel in a written opinion, or (4) by the stockholders.
(e) Expenses (including attorneys’ fees) incurred by an officer or director in defending any civil, criminal, administrative or investigative action, suit or proceeding may be paid by the corporation in advance of the final disposition of such action, suit or proceeding upon receipt of an undertaking by or on behalf of such director or officer to repay such amount if it shall ultimately be determined that such person is not entitled to be indemnified by the corporation as authorized in this section. Such expenses (including attorneys’ fees) incurred by former directors and officers or other employees and agents may be so paid upon such terms and conditions, if any, as the corporation deems appropriate.
(f) The indemnification and advancement of expenses provided by, or granted pursuant to, the other subsections of this section shall not be deemed exclusive of any other rights to which those seeking indemnification or advancement of expenses may be entitled under any bylaw, agreement, vote of stockholders or disinterested directors or otherwise, both as to action in such person’s official capacity and as to action in another capacity while holding such office.
(g) A corporation shall have power to purchase and maintain insurance on behalf of any person who is or was director, officer, employee or agent of the corporation, or is or was serving at the request of the corporation as a director, officer, employee or agent of another corporation, partnership, joint venture, trust or other enterprise against any liability asserted against such person and incurred by such person in any such capacity, or arising out of such person’s status as such, whether or not the corporation would have the power to indemnify such person against such liability under this section.
(h) For purposes of this section, references to “the corporation” shall include, in addition to the resulting corporation, any constituent corporation (including any constituent of a constituent) absorbed in a consolidation or merger which, if its separate existence had continued, would have had power and authority to indemnify its directors, officers, and employees or agents, so that any person who is or was a director, officer, employee or agent of such constituent corporation, or is or was serving at the request of such constituent corporation as a director, officer, employee or agent of another corporation, partnership, joint venture, trust or other enterprise, shall stand in the same position under this section with respect to the resulting or surviving corporation as such person would have with respect to such constituent corporation if its separate existence had continued.
(i) For purposes of this section, references to “other enterprises” shall include employee benefit plans; references to “fines” shall include any excise taxes assessed on a person with respect to any employee benefit plan; and references to “serving at the request of the corporation” shall include any service as a director, officer, employee or agent of the corporation which imposes duties on, or involves services by, such director, officer, employee or agent with respect to an employee benefit plan, its participants or beneficiaries; and a person who acted in good faith and in a manner such person reasonably believed to be in the interest of the participants and beneficiaries of an employee benefit plan shall be deemed to have acted in a manner “not opposed to the best interests of the corporation” as referred to in this section.
(j) The indemnification and advancement of expenses provided by, or granted pursuant to, this section shall, unless otherwise provided when authorized or ratified, continue as to a person who has ceased to be a director, officer, employee or agent and shall inure to the benefit of the heirs, executors and administrators of such a person.
(k) The Court of Chancery is hereby vested with exclusive jurisdiction to hear and determine all actions for advancement of expenses or indemnification brought under this section or under any bylaw, agreement, vote of stockholders or disinterested directors, or otherwise. The Court of Chancery may summarily determine a corporation’s obligation to advance expenses (including attorneys’ fees).”
II-2
Table of Contents
Insofar as indemnification for liabilities arising under the Securities Act may be permitted to our directors, officers, and controlling persons pursuant to the foregoing provisions or otherwise, we have been advised that in the opinion of the SEC such indemnification is against public policy as expressed in the Securities Act and is, therefore, unenforceable. In the event that a claim for indemnification against such liabilities (other than the payment of expenses incurred or paid by a director, officer or controlling person in a successful defense of any action, suit or proceeding) is asserted by such director, officer or controlling person in connection with the securities being registered, we will, unless in the opinion of its counsel the matter has been settled by controlling precedent, submit to the court of appropriate jurisdiction the question whether such indemnification by it is against public policy as expressed in the Securities Act and will be governed by the final adjudication of such issue.
Paragraph B of Article Eighth of our certificate of incorporation provides:
“The Corporation, to the full extent permitted by Section 145 of the GCL, as amended from time to time, shall indemnify all persons whom it may indemnify pursuant thereto. Expenses (including attorneys’ fees) incurred by an officer or director in defending any civil, criminal, administrative, or investigative action, suit or proceeding for which such officer or director may be entitled to indemnification hereunder shall be paid by the Corporation in advance of the final disposition of such action, suit or proceeding upon receipt of an undertaking by or on behalf of such director or officer to repay such amount if it shall ultimately be determined that he is not entitled to be indemnified by the Corporation as authorized hereby.”
We have entered into indemnification agreements with each of our directors and officers that provide that we will indemnify the directors and officers to the fullest extent permitted by law.
| Item 15. | Recent Sales of Unregistered Securities. |
We are conducting a private placement of Series A 12.5% Cumulative Preferred Stock, par value $0.0001 per share and liquidation preference of $50 per share (“Series A Preferred Stock”), in reliance upon the exemption from registration provided by Section 4(2) of the Securities Act of 1933, as amended (the “Securities Act”), and Rule 506 promulgated thereunder pursuant to which it seeks to raise an aggregate amount of $15 million (the “Offering”). As of December 31, 2009, total proceeds from the Offering were approximately $1.3 million. Pursuant to the Certificate of Designation for the Series A Preferred Stock, each share of Series A Preferred Stock will pay cumulative cash distributions at a rate of 12.5% per annum, subject to declaration by the board of directors of the Company. The Series A Preferred Stock is not convertible into common stock.
On December 8, 2008 we sold 100 shares of Series 100 shares of Series B 8% cumulative Preferred Stock in connection with the acquisition by Pac-Van of Container Wholesalers in Salt Lake City, Utah. We issued and sold these shares without registration under the Securities Act pursuant to the exemption from registration contained in Section 4(2) of the Securities Act as transactions not involving any public offering. We paid no underwriting discounts or commissions with respect to this issuance and sale.
On October 1, 2008, we issued 4,000,000 shares of restricted common stock in connection with the acquisition of Mobile Office Acquisition Corp. We issued and sold these shares without registration under the Securities Act pursuant to the exemption from registration contained in Section 4(2) of the Securities Act as transactions not involving any public offering. We paid no underwriting discounts or commissions with respect to this issuance and sale.
On October 17, 2005, we issued and sold 1,875,000 shares of common stock to Ronald F. Valenta for $0.133 per share or a total of $250,000. We issued and sold these shares without registration under the Securities Act pursuant to the exemption from registration contained in Section 4(2) of the Securities Act as transactions not involving any public offering. We paid no underwriting discounts or commissions with respect to this issuance and sale.
On October 20, 2005, Mr. Valenta sold 356,250 shares of Common Stock to John O. Johnson, our former Executive Vice President, for $0.133 per share or an aggregate of $47,500. On November 15, 2005, Mr. Valenta transferred, without consideration, 22,500 shares to each of David M. Connell, Lawrence Glascott, Manuel Marrero and James B. Roszak, directors of the company, and 18,750 shares to Marc Perez, our controller. The transfer of these shares by Mr. Valenta was exempt from registration pursuant to Section 4(1) of the Securities Act as transaction by a person other than by an issuer, underwriter or dealer. In this respect, the shares were transferred without any general solicitation or general advertising and each purchaser is a director or officer of the registrant who agreed to appropriate limitations on resale.
The share amounts described above give effect to the 3-for-4 reverse split of Registrant’s common stock that occurred in March 2006.
II-3
Table of Contents
We issued and sold 583,333 warrants to Ronald F. Valenta and John O. Johnson immediately prior to the closing of the offering pursuant to this registration statement at a price of $1.20 per warrant for an aggregate purchase price of $700,000. These warrants are identical to the warrants being issued pursuant to the registration statement. The issuance and sale of these warrants will be made without registration under the Securities Act pursuant to the exemption from registration contained in Section 4(2) of the Securities Act as transactions not involving any public offering. We will use no general solicitation or general advertising in connection with the issuance and sale of these warrants, and the purchasers are affiliates of the company and have agreed to appropriate restrictions on resale of the warrants and the underlying shares. We will pay no underwriting discounts or commissions with respect to the issuance and sale of these warrants.
| Item 16. | Exhibits and Financial Statement Schedules. |
(a) The following exhibits are filed as part of this Registration Statement:
| Exhibit No. |
Description | |
| 5.1 | Legal Opinion of Christopher A. Wilson* | |
| 23.1 | Consent of Independent Registered Public Accounting Firm (Crowe Horwath LLP)* | |
| 23.2 | Consent of Christopher A. Wilson (contained in Exhibit 5.1)* | |
| 24 | Power of Attorney * | |
| * | Filed herewith. |
(b) Financial Statement Schedules
All supplemental schedules have been omitted since the required information is not present in amounts sufficient to require submission of the schedule, or because the required information is included in the consolidated financials statements or notes thereto.
| Item 17. | Undertakings. |
(a) The undersigned registrant hereby undertakes:
(1) To file, during any period in which offers or sales are being made, a post-effective amendment to this registration statement:
(i) To include any prospectus required by Section 10(a)(3) of the Securities Act of 1933;
(ii) To reflect in the prospectus any facts or events arising after the effective date of the registration statement (or the most recent post-effective amendment thereof) which, individually or in the aggregate, represent a fundamental change in the information set forth in the registration statement. Notwithstanding the foregoing, any increase or decrease in volume of securities offered (if the total dollar value of securities offered would not exceed that which was registered) and any deviation from the low or high end of the estimated maximum offering range may be reflected in the form of prospectus filed with the Commission pursuant to Rule 424(b) if, in the aggregate, the changes in volume and price represent no more than 20 percent change in the maximum aggregate offering price set forth in the “Calculation of Registration Fee” table in the effective registration statement.
(iii) To include any material information with respect to the plan of distribution not previously disclosed in the registration statement or any material change to such information in the registration statement.
(2) That, for the purpose of determining any liability under the Securities Act of 1933, each such post-effective amendment shall be deemed to be a new registration statement relating to the securities offered therein, and the offering of such securities at that time shall be deemed to be the initial bona fide offering thereof.
(3) To remove from registration by means of a post-effective amendment any of the securities being registered which remain unsold at the termination of the offering.
II-4
Table of Contents
(4) That, for the purpose of determining liability under the Securities Act of 1933 to any purchaser:
(i) If the registrant is relying on Rule 430B (§ 230.430B of this chapter):
(A) Each prospectus filed by the registrant pursuant to Rule 424(b)(3) shall be deemed to be part of the registration statement as of the date the filed prospectus was deemed part of and included in the registration statement; and
(B) Each prospectus required to be filed pursuant to Rule 424(b)(2), (b)(5), or (b)(7) as part of a registration statement in reliance on Rule 430B relating to an offering made pursuant to Rule 415(a)(1)(i), (vii), or(x) for the purpose of providing the information required by section 10(a) of the Securities Act of 1933 shall be deemed to be part of and included in the registration statement as of the earlier of the date such form of prospectus is first used after effectiveness or the date of the first contract of sale of securities in the offering described in the prospectus. As provided in Rule 430B, for liability purposes of the issuer and any person that is at that date an underwriter, such date shall be deemed to be a new effective date of the registration statement relating to the securities in the registration statement to which that prospectus relates, and the offering of such securities at that time shall be deemed to be the initial bona fide offering thereof. Provided, however, that no statement made in a registration statement or prospectus that is part of the registration statement or made in a document incorporated or deemed incorporated by reference into the registration statement or prospectus that is part of the registration statement will, as to a purchaser with a time of contract of sale prior to such effective date, supersede or modify any statement that was made in the registration statement or prospectus that was part of the registration statement or made in any such document immediately prior to such effective date; or
(ii) If the registrant is subject to Rule 430C, each prospectus filed pursuant to Rule 424(b) as part of a registration statement relating to an offering, other than registration statements relying on Rule 430B or other than prospectuses filed in reliance on Rule 430A, shall be deemed to be part of and included in the registration statement as of the date it is first used after effectiveness. Provided, however, that no statement made in a registration statement or prospectus that is part of the registration statement or made in a document incorporated or deemed incorporated by reference into the registration statement or prospectus that is part of the registration statement will, as to a purchaser with a time of contract of sale prior to such first use, supersede or modify any statement that was made in the registration statement or prospectus that was part of the registration statement or made in any such document immediately prior to such date of first use.
(5) That, for the purpose of determining liability of the registrant under the Securities Act of 1933 to any purchaser in the initial distribution of the securities:
The undersigned registrant undertakes that in a primary offering of securities of the undersigned registrant pursuant to this registration statement, regardless of the underwriting method used to sell the securities to the purchaser, if the securities are offered or sold to such purchaser by means of any of the following communications, the undersigned registrant will be a seller to the purchaser and will be considered to offer or sell such securities to such purchaser:
| (i) | Any preliminary prospectus or prospectus of the undersigned registrant relating to the offering required to be filed pursuant to Rule 424; | |
| (ii) | Any free writing prospectus relating to the offering prepared by or on behalf of the undersigned registrant or used or referred to by the undersigned registrant; | |
| (iii) | The portion of any other free writing prospectus relating to the offering containing material information about the undersigned registrant or its securities provided by or on behalf of the undersigned registrant; and | |
| (iv) | Any other communication that is an offer in the offering made by the undersigned registrant to the purchaser. | |
II-5
Table of Contents
(b) The undersigned hereby undertakes to provide to the underwriter at the closing specified in the underwriting agreements, certificates in such denominations and registered in such names as required by the underwriter to permit prompt delivery to each purchaser.
(c) Insofar as indemnification for liabilities arising under the Securities Act of 1933 may be permitted to directors, officers and controlling persons of the registrant pursuant to the foregoing provisions, or otherwise, the registrant has been advised that in the opinion of the Securities and Exchange Commission such indemnification is against public policy as expressed in the Act and is, therefore, unenforceable. In the event that a claim for indemnification against such liabilities (other than the payment by the registrant of expenses incurred or paid by a director, officer or controlling person of the registrant in the successful defense of any action, suit or proceeding) is asserted by such director, officer or controlling person in connection with the securities being registered, the registrant will, unless in the opinion of its counsel the matter has been settled by controlling precedent, submit to a court of appropriate jurisdiction the question whether such indemnification by it is against public policy as expressed in the Act and will be governed by the final adjudication of such issue.
(d) The undersigned registrant hereby undertakes that:
(1) For purposes of determining any liability under the Securities Act of 1933, the information omitted from the form of prospectus filed as part of this registration statement in reliance upon Rule 430A and contained in a form of prospectus filed by the registrant pursuant to Rule 424(b)(1) or (4) or 497(h) under the Securities Act shall be deemed to be part of this registration statement as of the time it was declared effective.
(2) For the purpose of determining any liability under the Securities Act of 1933, each post-effective amendment that contains a form of prospectus shall be deemed to be a new registration statement relating to the securities offered therein, and the offering of such securities at that time shall be deemed to be the initial bona fide offering thereof.
II-6
Table of Contents
SIGNATURES
Pursuant to the requirements of the Securities Act of 1933, the registrant has duly caused this Form S-1 registration statement to be signed on its behalf by the undersigned, thereunto duly authorized, in the City of Pasadena, State of California, on the 3rd day of August, 2011.
| GENERAL FINANCE CORPORATION | ||
| By: | /s/ RONALD F. VALENTA | |
| Ronald F. Valenta | ||
| Chief Executive Officer | ||
POWER OF ATTORNEY
KNOW ALL MEN BY THESE PRESENTS, that each person whose signature appears below constitutes and appoints Ronald F. Valenta, Charles E. Barrantes and Christopher A. Wilson his/her true and lawful attorney-in-fact and agent with full power of substitution and re-substitution, for him/her and in his/her name, place and stead, in any and all capacities to sign any or all amendments (including, without limitation, post-effective amendments) to this Registration Statement, any related Registration Statement filed pursuant to Rule 462(b) under the Securities Act of 1933 and any or all pre- or post-effective amendments thereto, and to file the same, with all exhibits thereto, and all other documents in connection therewith, with the Securities and Exchange Commission, granting unto said attorney-in-fact and agent, full power and authority to do and perform each and every act and thing requisite and necessary to be done in and about the premises, as fully for all intents and purposes as he or she might or could do in person, hereby ratifying and confirming that said attorney-in-fact and agent, or any substitute or substitutes for him, may lawfully do or cause to be done by virtue hereof.
Pursuant to the requirements of the Securities Act of 1933, this Registration Statement has been signed by the following persons in the capacities and on the dates indicated.
| Name |
Position |
Date | ||
| /s/ RONALD F. VALENTA Ronald F. Valenta |
Chief Executive Officer and Director (Principal Executive Officer) |
August 3, 2011 | ||
| /s/ CHARLES E. BARRANTES Charles E. Barrantes |
Executive Vice President and Chief Financial Officer (Principal Accounting Officer) |
August 3, 2011 | ||
| * James B. Roszak |
Director |
August 3, 2011 | ||
II-7
Table of Contents
| * Lawrence Glascott |
Chairman of the Board of Directors |
August 3, 2011 | ||
| * Manuel Marrero |
Director |
August 3, 2011 | ||
| * David M. Connell |
Director |
August 3, 2011 | ||
| * Susan Harris |
Director |
August 3, 2011 | ||
* By Christopher A. Wilson
Attorney-in-Fact
II-8