Attached files
| file | filename |
|---|---|
| 8-K - FORM 8-K - STANLEY BLACK & DECKER, INC. | d8k.htm |
| EX-99.2 - THE ENGLISH LANGUAGE VERSION OF THE PRESS RELEASE - STANLEY BLACK & DECKER, INC. | dex992.htm |
Exhibit 99.1

Supplement to the offer document regarding the offer to the shareholders and warrant holders in Niscayah Group AB (publ)
THIS SUPPLEMENT TO THE OFFER DOCUMENT IS IMPORTANT AND REQUIRES IMMEDIATE ATTENTION
Applicable law, disputes and translation
This supplement to the Offer Document (as defined below) has been prepared in accordance with the laws of Sweden, as well as relevant rules and regulations applicable to public offers in Sweden. Swedish law, NASDAQ OMX Stockholm’s (“NASDAQ OMX”) rules regarding public offers on the stock market (the “Takeover Rules”), the Swedish Securities Council’s (Sw. Aktiemarknadsnämnden) rulings regarding interpretation and application of the Takeover Rules, and, where applicable, the Swedish Securities Council’s former rulings regarding interpretation and application of the Swedish Industry and Commerce Stock Exchange Committee’s (Sw. Näringslivets Börskommitté) rules on public offers, are applicable to the Offer (as defined below). Any dispute relating to, or arising in connection with, the Offer shall be settled exclusively by Swedish courts, with the district court of Stockholm (Sw. Stockholms tingsrätt) as the court of first instance.
This supplement to the Offer Document is available in Swedish and English. The Swedish version has been approved by and registered with the Swedish Financial Supervisory Authority (Sw. Finansinspektionen) (the “SFSA”) on August 1, 2011, in accordance with Chapter 2, Section 3 of the Swedish Act on Public Takeovers on the Stock Market (Sw. lag (2006:451) om offentliga uppköpserbjudanden på aktiemarknaden) and Chapter 2 a, Section 11 of the Swedish Financial Instruments Trading Act (Sw. lag (1991:980) om handel med finansiella instrument) (the “Trading Act”), with reference to Chapter 2, Section 34 of the Trading Act and has been published on August 1, 2011. SFSA’s approval and registration does not imply that the SFSA guarantees that the factual information provided in this supplement to the Offer Document is correct or complete. In the event of any discrepancy between the English and the Swedish language versions, the English language version shall prevail.
Information for holders of shares and/or warrants in Niscayah outside Sweden
The Offer, pursuant to the terms and conditions presented in the Offer Document, is not being made to (and acceptances will not be accepted from) persons whose participation in the Offer requires that an additional offer document is prepared or registration effected or that any other measures are taken in addition to those required under Swedish law, except where there is an applicable exemption. This supplement to the Offer Document, the Offer Document, the acceptance form or any other documentation related to the Offer will not be distributed in and must not be mailed to or otherwise distributed or sent into any country in which such distribution would require any such additional measures or would be in conflict with any law or regulation in such country. SBD Holding will not permit or sanction any such distribution. Any acceptance of the Offer resulting directly or indirectly from a violation of these restrictions may be disregarded.
The Offer is not being made, directly or indirectly, by use of mail or any other means or instrumentality (including, without limitation, facsimile transmission, e-mail, telex, telephone and the Internet) in or into Australia, Japan, Canada, South Africa, Hong Kong or New Zealand and the Offer cannot be accepted in or from Australia, Japan, Canada, South Africa, Hong Kong or New Zealand. As a result, this supplement to the Offer Document, the Offer Document, the acceptance form or other documentation relating to the Offer will not, and may not, be sent by mail or in any other way be distributed, forwarded or transmitted to, from or within Australia, Japan, Canada, South Africa, Hong Kong or New Zealand. SBD Holding will not pay any consideration pursuant to the Offer to, or accept acceptance forms from, Australia, Japan, Canada, South Africa, Hong Kong or New Zealand.
Notwithstanding the foregoing, SBD Holding reserves the right to permit the Offer to be accepted by persons not resident in Sweden if, in its sole discretion, SBD Holding is satisfied that such transaction can be undertaken in compliance with applicable laws and regulations.
Forward-looking statements
Stanley Black & Decker makes forward-looking statements in the Offer Document (including this supplement to the Offer Document) which represent its expectations or beliefs about future events and financial performance. Forward-looking statements are identifiable by words such as “believe,” “anticipate,” “expect,” “intend,” “plan,” “will,” “may” and other similar expressions. In addition, any statements that refer to expectations, projections or other characterizations of future events or circumstances are forward-looking statements. Forward looking statements made in the Offer Document, include, but are not limited to, statements concerning: the consummation of the acquisition; Niscayah’s business complementing and expanding Stanley Black & Decker’s existing operations and international presence; cost savings; and earnings per share.
You are cautioned not to place undue reliance on these forward-looking statements. These forward-looking statements are not guarantees of future events and involve risks, uncertainties and other known and unknown factors that may cause actual results and performance to be materially different from any future results or performance expressed or implied by such forward-looking statements, including, but not limited to, the failure to consummate, or a delay in the consummation of, the transaction for various reasons.
Forward-looking statements made in the Offer Document are also subject to risks and uncertainties, described in: Stanley Black & Decker’s 2010 Annual Report on Form 10-K, its Quarterly Report on Form 10-Q for the quarter ended April 2, 2011; and other filings the company makes with the Securities and Exchange Commission. In addition, actual results could differ materially from those suggested by the forward-looking statements, and therefore you should not place undue reliance on the forward-looking statements. Stanley Black & Decker makes no commitment to revise or update any forward-looking statements to reflect events or circumstances occurring or existing after the date of any forward-looking statement.
Table of Contents
Supplement to the Offer Document 1
The interim report of Niscayah, January – June 2011. 2
Addresses 20
Supplement to the Offer Document
Through a press release on June 27, 2011, Stanley Black & Decker, Inc. (“Stanley Black & Decker”), through its indirect wholly-owned subsidiary SBD Holding AB (“SBD Holding”), announced a recommended all-cash offer to the shareholders and warrant holders in Niscayah Group AB (publ) (“Niscayah”) to tender all class A and class B shares and warrants in Niscayah to SBD Holding (the “Offer”). This document, dated August 1, 2011, constitutes a supplement (the SFSA’s reference number 11-7833-413) to the offer document prepared by Stanley Black & Decker which was approved by and registered with the SFSA on July 22, 2011 (the SFSA’s reference number 11-7337-413) in connection with the Offer (the “Offer Document”). The Offer Document was announced on July 22, 2011 on Stanley Black & Decker’s website for the Offer (www.publicoffer.se) and on Handelsbanken Capital Markets’ website (www.handelsbanken.se/investmentoffer).
This supplement has been prepared to include Niscayah’s interim report January–June 2011, announced on July 27, 2011.
This supplement has been approved by and registered with the SFSA on August 1, 2011, in accordance with Chapter 2, Section 3 of the Swedish Act on Public Take-overs on the Stock Market (Sw. lag (2006:451) om offentliga uppköpserbjudanden på aktiemarknaden) and Chapter 2 a, Section 11 of the Trading Act, with reference to Chapter 2, Section 34 of the Trading Act and has been published on August 1, 2011.
Shareholders who have accepted the Offer have, in accordance with Chapter 2 a, Section 11 of the Trading Act, with reference to Chapter 2, Section 34 of the Trading Act the right to withdraw submitted acceptance within five business days from the announcement of this supplement and, in addition, have a right to withdraw submitted acceptance of the Offer in accordance with what is stated in the Offer Document. Withdrawal of submitted acceptance shall be made in accordance with what is stated in the Offer Document. Holders of shares and/or warrants in Niscayah whose securities are registered in the name of a nominee and who wish to withdraw their acceptance of the Offer must do so in accordance with instructions from the nominee.
This supplement shall be read together with the Offer Document. For complete terms and conditions and further information regarding the Offer, reference is made to the Offer Document which, together with this supplement, is available on the web-sites stated above.
The interim report of Niscayah, January – June 2011
INTERIMQ2REPORT JAN?JUN 2011
INTERIM REPORT JANUARY—JUNE 2011
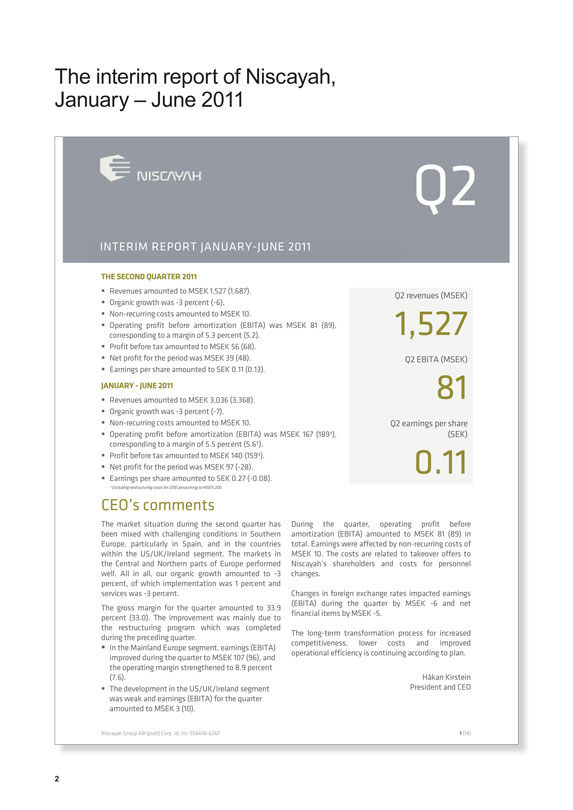
THE SECOND QUARTER 2011
Revenues amounted to MSEK 1,527 (1,687). Q2 revenues (MSEK)
Organic growth was -3 percent (-6).
Non-recurring costs amounted to MSEK 10.
Operating profit before amortization (EBITA) was MSEK 81 (89), 1,527
corresponding to a margin of 5.3 percent (5.2).
Profit before tax amounted to MSEK 56 (68).
Net profit for the period was MSEK 39 (48). Q2 EBITA (MSEK)
Earnings per share amounted to SEK 0.11 (0.13).
JANUARY—JUNE 2011 81
Revenues amounted to MSEK 3,036 (3,368).
Organic growth was -3 percent (-7).
Non-recurring costs amounted to MSEK 10. Q2 earnings per share
Operating profit before amortization (EBITA) was MSEK 167 (189¹),(SEK)
corresponding to a margin of 5.5 percent (5.6¹).
Profit before tax amounted to MSEK 140 (159¹).
Net profit for the period was MSEK 97 (-28). 0.11
Earnings per share amounted to SEK 0.27 (-0.08).
¹ Excluding restructuring costs for 2010 amounting to MSEK 200.
CEO’s comments
The market situation during the second quarter has During the quarter, operating profit before
been mixed with challenging conditions in Southern amortization (EBITA) amounted to MSEK 81 (89) in
Europe, particularly in Spain, and in the countries total. Earnings were affected by non-recurring costs of
within the US/UK/Ireland segment. The markets in MSEK 10. The costs are related to takeover offers to
the Central and Northern parts of Europe performed Niscayah’s shareholders and costs for personnel
well. All in all, our organic growth amounted to -3 changes.
percent, of which implementation was 1 percent and
services was -3 percent. Changes in foreign exchange rates impacted earnings
The gross margin for the quarter amounted to 33.9(EBITA) during the quarter by MSEK -6 and net
percent (33.0). The improvement was mainly due to financial items by MSEK -5.
the restructuring program which was completed
during the preceding quarter. The long-term transformation process for increased
In the Mainland Europe segment, earnings (EBITA) competitiveness, lower costs and improved
improved during the quarter to MSEK 107 (96), and operational efficiency is continuing according to plan.
the operating margin strengthened to 8.9 percent
| (7.6). |
|
Håkan Kirstein |
The development in the US/UK/Ireland segment President and CEO
was weak and earnings (EBITA) for the quarter
amounted to MSEK 3 (10).
Niscayah Group AB (publ) Corp. id. no. 556436-6267 1 (18 )
| 2 |
|
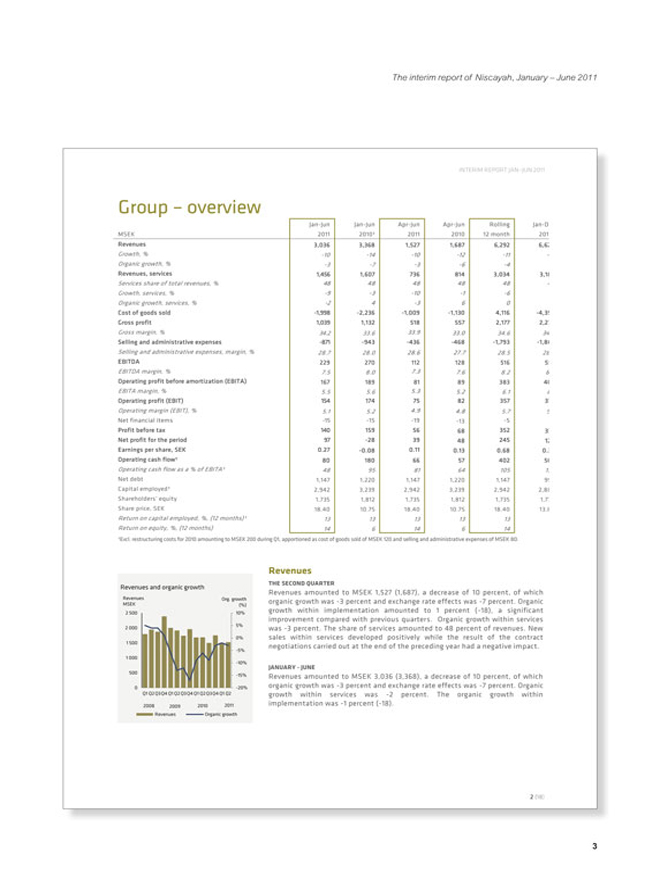
Group – overview
Jan-Jun Jan-Jun Apr-Jun Apr-Jun Rolling Jan-Dec
MSEK 2011 2010¹ 2011 2010 12 month 2010¹
Revenues 3,036 3,368 1,527 1,687 6,292 6,624
Growth, % -10 -14 -10 -12 -11 -13
Organic growth, % -3 -7 -3 -6 -4 -7
Revenues, services 1,456 1,607 736 814 3,034 3,186
Services share of total revenues, % 48 48 48 48 48 48
Growth, services, % -9 -3 -10 -1 -6 -3
Organic growth, services, % -2 4 -3 6 0 4
Cost of goods sold -1,998 -2,236 -1,009 -1,130 4,116 -4,354
Gross profit 1,039 1,132 518 557 2,177 2,270
Gross margin, % 34.2 33.6 33.9 33.0 34.6 34.3
Selling and administrative expenses -871 -943 -436 -468 -1,793 -1,865
Selling and administrative expenses, margin, % 28.7 28.0 28.6 27.7 28.5 28.2
EBITDA 229 270 112 128 516 557
EBITDA margin, % 7.5 8.0 7.3 7.6 8.2 8.4
Operating profit before amortization (EBITA) 167 189 81 89 383 405
EBITA margin, % 5.5 5.6 5.3 5.2 6.1 6.1
Operating profit (EBIT) 154 174 75 82 357 376
Operating margin (EBIT), % 5.1 5.2 4.9 4.8 5.7 5.7
Net financial items -15 -15 -19 -13 -5 -4
Profit before tax 140 159 56 68 352 372
Net profit for the period 97 -28 39 48 245 120
Earnings per share, SEK 0.27 -0.08 0.11 0.13 0.68 0.33
Operating cash flow¹ 80 180 66 57 402 502
Operating cash flow as a % of EBITA¹ 48 95 81 64 105 124
Net debt 1,147 1,220 1,147 1,220 1,147 995
Capital employed¹ 2,942 3,239 2,942 3,239 2,942 2,886
Shareholders’ equity 1,735 1,812 1,735 1,812 1,735 1,770
Share price, SEK 18.40 10.75 18.40 10.75 18.40 13.80
Return on capital employed, %, (12 months)¹ 13 13 13 13 13 14
Return on equity, %, (12 months) 14 6 14 6 14 6
¹Excl. restructuring costs for 2010 amounting to MSEK 200 during Q1, apportioned as cost of goods sold of MSEK 120 and selling and administrative expenses of MSEK 80.
Revenues
THE SECOND QUARTER
Revenues amounted to MSEK 1,527 (1,687), a decrease of 10 percent, of which organic growth was -3 percent and exchange rate effects was -7 percent. Organic growth within implementation amounted to 1 percent (-18), a significant improvement compared with previous quarters. Organic growth within services was -3 percent. The share of services amounted to 48 percent of revenues. New sales within services developed positively while the result of the contract negotiations carried out at the end of the preceding year had a negative impact.
JANUARY - JUNE
Revenues amounted to MSEK 3,036 (3,368), a decrease of 10 percent, of which organic growth was -3 percent and exchange rate effects was -7 percent. Organic growth within services was -2 percent. The organic growth within implementation was -1 percent (-18).
The interim report of Niscayah, January – June 2011
INTERIM REPORT JAN JUN 2011
Earnings
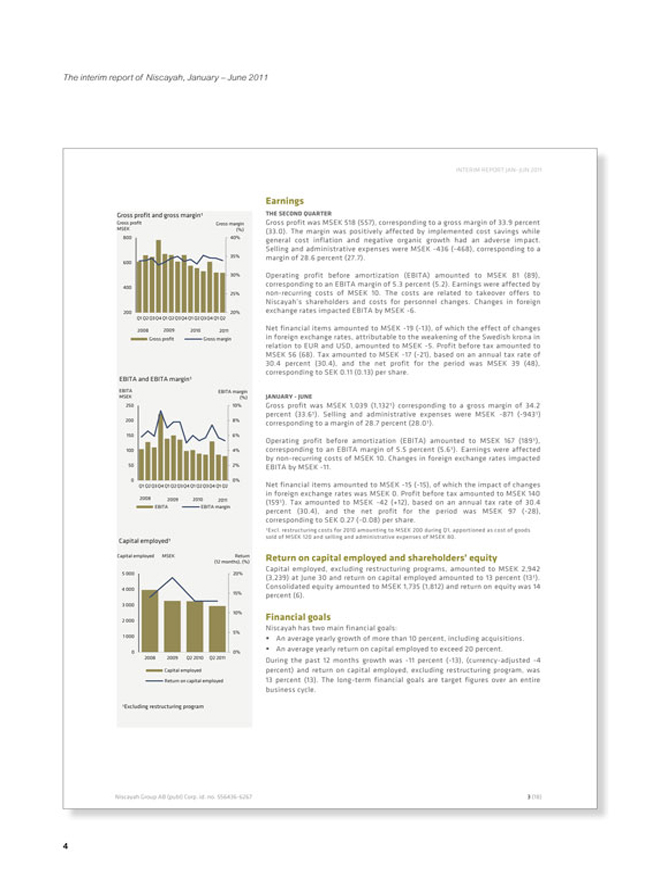
Gross profit and gross margin¹ THE SECOND QUARTER
Gross profit Gross margin Gross profit was MSEK 518 (557), corresponding to a gross margin of 33.9 percent
MSEK(%)(33.0). The margin was positively affected by implemented cost savings while
800 40% general cost inflation and negative organic growth had an adverse impact.
Selling and administrative expenses were MSEK -436 (-468), corresponding to a
35% margin of 28.6 percent (27.7).
600
30% Operating profit before amortization (EBITA) amounted to MSEK 81 (89),
400 corresponding to an EBITA margin of 5.3 percent (5.2). Earnings were affected by
25% non-recurring costs of MSEK 10. The costs are related to takeover offers to
Niscayah’s shareholders and costs for personnel changes. Changes in foreign
200 20% exchange rates impacted EBITA by MSEK -6.
Q1 Q2 Q3Q4 Q1 Q2Q3Q4 Q1 Q2 Q3Q4 Q1 Q2
2008 2009 2010 2011 Net financial items amounted to MSEK -19 (-13), of which the effect of changes
Gross profit Gross margin in foreign exchange rates, attributable to the weakening of the Swedish krona in
relation to EUR and USD, amounted to MSEK -5. Profit before tax amounted to
MSEK 56 (68). Tax amounted to MSEK -17 (-21), based on an annual tax rate of
| 30.4 |
percent (30.4), and the net profit for the period was MSEK 39 (48), |
corresponding to SEK 0.11 (0.13) per share.
EBITA and EBITA margin¹
EBITA EBITA margin
MSEK(%) JANUARY—JUNE
250 10% Gross profit was MSEK 1,039 (1,132¹) corresponding to a gross margin of 34.2
percent (33.6¹). Selling and administrative expenses were MSEK -871 (-943¹)
200 8% corresponding to a margin of 28.7 percent (28.0¹).
150 6%
Operating profit before amortization (EBITA) amounted to MSEK 167 (189¹),
100 4% corresponding to an EBITA margin of 5.5 percent (5.6¹). Earnings were affected
by non-recurring costs of MSEK 10. Changes in foreign exchange rates impacted
| 50 |
2% EBITA by MSEK -11. |
0 0%
Q1 Q2 Q3Q4 Q1 Q2 Q3Q4 Q1 Q2 Q3Q4 Q1 Q2 Net financial items amounted to MSEK -15 (-15), of which the impact of changes
in foreign exchange rates was MSEK 0. Profit before tax amounted to MSEK 140
2008 2009 2010 2011(159¹). Tax amounted to MSEK -42 (+12), based on an annual tax rate of 30.4
EBITA EBITA margin
percent (30.4), and the net profit for the period was MSEK 97 (-28),
corresponding to SEK 0.27 (-0.08) per share.
¹Excl. restructuring costs for 2010 amounting to MSEK 200 during Q1, apportioned as cost of goods
Capital employed¹ sold of MSEK 120 and selling and administrative expenses of MSEK 80.
Capital employed MSEK Return Return on capital employed and shareholders’ equity
(12 months), (%)
Capital employed, excluding restructuring programs, amounted to MSEK 2,942
| 5 |
000 20% |
(3,239) at June 30 and return on capital employed amounted to 13 percent (13¹).
| 4 |
000 Consolidated equity amounted to MSEK 1,735 (1,812) and return on equity was 14 |
15% percent (6).
| 3 |
000 |
10% Financial goals
| 2 |
000 |
Niscayah has two main financial goals:
5%
| 1 |
000 An average yearly growth of more than 10 percent, including acquisitions. |
0 0% An average yearly return on capital employed to exceed 20 percent.
2008 2009 Q2 2010 Q2 2011 During the past 12 months growth was -11 percent (-13), (currency-adjusted -4
Capital employed percent) and return on capital employed, excluding restructuring program, was
Return on capital employed 13 percent (13). The long-term financial goals are target figures over an entire
business cycle.
¹Excluding restructuring program
Niscayah Group AB (publ) Corp. id. no. 556436-6267 3 (18)
| 4 |
The interim report of Niscayah, January – June 2011
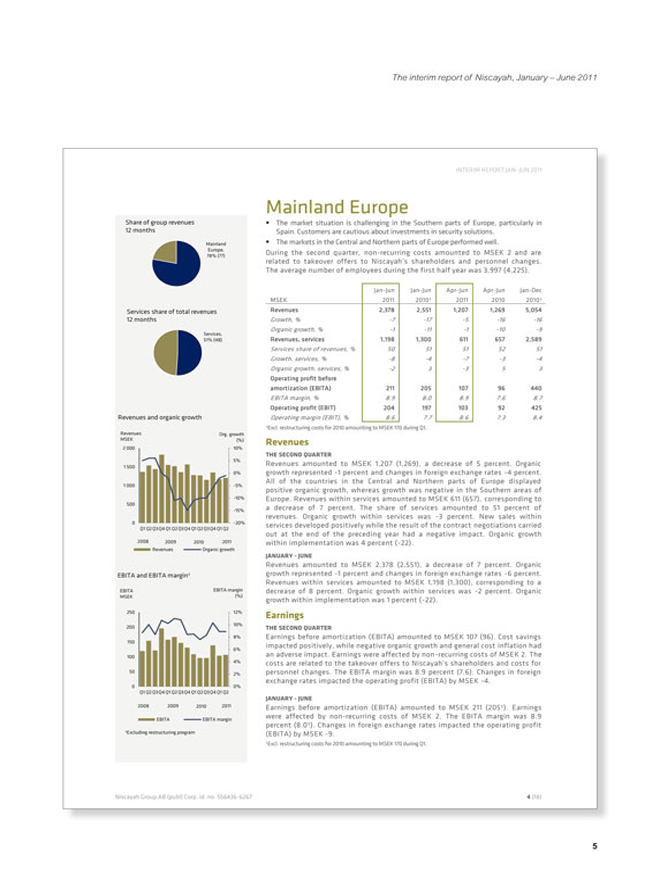
¹Excl. restructuring costs for 2010 amounting to MSEK 170 during Q1.
Revenues Org. growth
MSEK(%) Revenues
| 2 |
000 10% |
THE SECOND QUARTER
5% Revenues amounted to MSEK 1,207 (1,269), a decrease of 5 percent. Organic
| 1 |
500 |
0% growth represented -1 percent and changes in foreign exchange rates -4 percent.
All of the countries in the Central and Northern parts of Europe displayed
| 1 |
000 -5% |
positive organic growth, whereas growth was negative in the Southern areas of
-10% Europe. Revenues within services amounted to MSEK 611 (657), corresponding to
500
-15% a decrease of 7 percent. The share of services amounted to 51 percent of
revenues. Organic growth within services was -3 percent. New sales within
0 -20% services developed positively while the result of the contract negotiations carried
Q1 Q2 Q3Q4 Q1 Q2Q3Q4 Q1 Q2Q3Q4 Q1 Q2
out at the end of the preceding year had a negative impact. Organic growth
2008 2009 2010 2011 within implementation was 4 percent (-22).
Revenues Organic growth
JANUARY—JUNE
Revenues amounted to MSEK 2,378 (2,551), a decrease of 7 percent. Organic
EBITA and EBITA margin¹ growth represented -1 percent and changes in foreign exchange rates -6 percent.
Revenues within services amounted to MSEK 1,198 (1,300), corresponding to a
EBITA EBITA margin decrease of 8 percent. Organic growth within services was -2 percent. Organic
MSEK(%) growth within implementation was 1 percent (-22).
250 12% Earnings
10%
200 THE SECOND QUARTER
8% Earnings before amortization (EBITA) amounted to MSEK 107 (96). Cost savings
150 impacted positively, while negative organic growth and general cost inflation had
6%
100 an adverse impact. Earnings were affected by non-recurring costs of MSEK 2. The
4% costs are related to the takeover offers to Niscayah’s shareholders and costs for
| 50 |
2% personnel changes. The EBITA margin was 8.9 percent (7.6). Changes in foreign |
exchange rates impacted the operating profit (EBITA) by MSEK -4.
0 0%
Q1 Q2 Q3Q4 Q1 Q2 Q3Q4 Q1 Q2 Q3Q4 Q1 Q2
JANUARY—JUNE
2008 2009 2010 2011 Earnings before amortization (EBITA) amounted to MSEK 211 (205¹). Earnings
EBITA EBITA margin were affected by non-recurring costs of MSEK 2. The EBITA margin was 8.9
percent (8.0¹). Changes in foreign exchange rates impacted the operating profit
¹Excluding restructuring program(EBITA) by MSEK -9.
¹Excl. restructuring costs for 2010 amounting to MSEK 170 during Q1.
Niscayah Group AB (publ) Corp. id. no. 556436-6267 4 (18 )
| 5 |
The interim report of Niscayah, January – June 2011
INTERIM REPORT JAN?JUN 2011
US/UK/Ireland
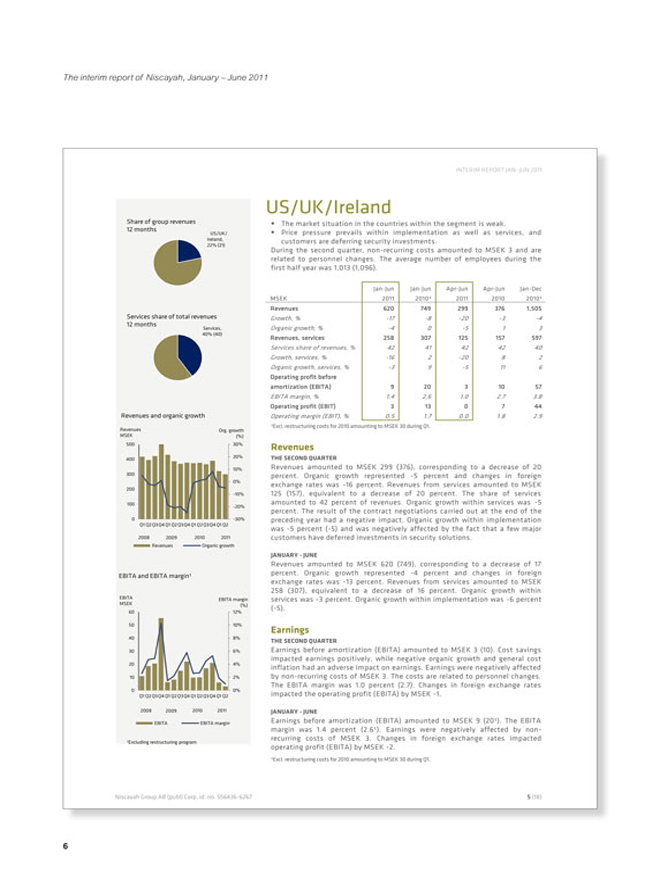
Share of group revenues The market situation in the countries within the segment is weak.
| 12 |
months US/UK/ Price pressure prevails within implementation as well as services, and |
Ireland, customers are deferring security investments.
22% (21)
During the second quarter, non-recurring costs amounted to MSEK 3 and are
related to personnel changes. The average number of employees during the
first half year was 1,013 (1,096).
Jan-Jun Jan-Jun Apr-Jun Apr-Jun Jan-Dec
MSEK 2011 2010¹ 2011 2010 2010¹
Revenues 620 749 299 376 1,505
Services share of total revenues Growth, % -17 -8 -20 -3 -4
| 12 |
months Services, Organic growth, % -4 0 -5 1 3 |
40% (40)
Revenues, services 258 307 125 157 597
Services share of revenues, % 42 41 42 42 40
Growth, services, % -16 2 -20 8 2
Organic growth, services, % -3 9 -5 11 6
Operating profit before
amortization (EBITA) 9 20 3 10 57
EBITA margin, % 1.4 2,6 1.0 2.7 3.8
Operating profit (EBIT) 3 13 0 7 44
Revenues and organic growth Operating margin (EBIT), % 0.5 1.7 0.0 1.8 2.9
¹Excl. restructuring costs for 2010 amounting to MSEK 30 during Q1.
Revenues Org. growth
MSEK(%)
500 30% Revenues
400 20% THE SECOND QUARTER
10% Revenues amounted to MSEK 299 (376), corresponding to a decrease of 20
300 percent. Organic growth represented -5 percent and changes in foreign
0% exchange rates was -16 percent. Revenues from services amounted to MSEK
200
-10% 125 (157), equivalent to a decrease of 20 percent. The share of services
100 amounted to 42 percent of revenues. Organic growth within services was -5
-20%
percent. The result of the contract negotiations carried out at the end of the
0 -30% preceding year had a negative impact. Organic growth within implementation
Q1 Q2Q3Q4 Q1 Q2Q3Q4 Q1 Q2Q3Q4 Q1 Q2
was -5 percent (-5) and was negatively affected by the fact that a few major
2008 2009 2010 2011 customers have deferred investments in security solutions.
Revenues Organic growth
JANUARY—JUNE
Revenues amounted to MSEK 620 (749), corresponding to a decrease of 17
EBITA and EBITA margin¹ percent. Organic growth represented -4 percent and changes in foreign
exchange rates was -13 percent. Revenues from services amounted to MSEK
258 (307), equivalent to a decrease of 16 percent. Organic growth within
EBITA EBITA margin services was -3 percent. Organic growth within implementation was -6 percent
MSEK
(%)(-5).
| 60 |
12% |
| 50 |
10% Earnings |
| 40 |
8% THE SECOND QUARTER |
| 30 |
6% Earnings before amortization (EBITA) amounted to MSEK 3 (10). Cost savings |
impacted earnings positively, while negative organic growth and general cost
| 20 |
4% inflation had an adverse impact on earnings. Earnings were negatively affected |
| 10 |
2% by non-recurring costs of MSEK 3. The costs are related to personnel changes. |
The EBITA margin was 1.0 percent (2.7). Changes in foreign exchange rates
0 0%
Q1 Q2 Q3Q4 Q1 Q2 Q3Q4 Q1 Q2 Q3Q4 Q1 Q2 impacted the operating profit (EBITA) by MSEK -1.
2008 2009 2010 2011 JANUARY—JUNE
EBITA EBITA margin Earnings before amortization (EBITA) amounted to MSEK 9 (20¹). The EBITA
margin was 1.4 percent (2.6¹). Earnings were negatively affected by non-
¹Excluding restructuring program recurring costs of MSEK 3. Changes in foreign exchange rates impacted
operating profit (EBITA) by MSEK -2.
¹Excl. restructuring costs for 2010 amounting to MSEK 30 during Q1.
Niscayah Group AB (publ) Corp. id. no. 556436-6267 5 (18 )
| 6 |
The interim report of Niscayah, January – June 2011
INTERIM REPORT JAN?JUN 2011
Other financial information
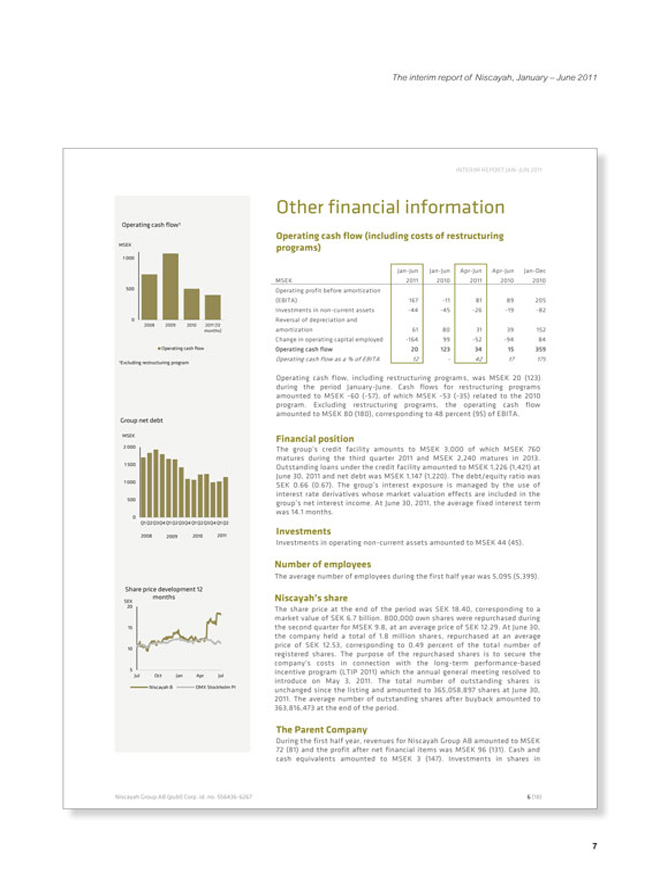
Operating cash flow¹
Operating cash flow (including costs of restructuring
MSEK programs)
| 1 |
000 |
Jan-Jun Jan-Jun Apr-Jun Apr-Jun Jan-Dec
MSEK 2011 2010 2011 2010 2010
500 Operating profit before amortization
(EBITA) 167 -11 81 89 205
Investments in non-current assets -44 -45 -26 -19 -82
0 Reversal of depreciation and
2008 2009 2010 2011 (12
months) amortization 61 80 31 39 152
Change in operating capital employed -164 99 -52 -94 84
Operating cash flow Operating cash flow 20 123 34 15 359
Operating cash flow as a % of EBITA 12—42 17 175
¹Excluding restructuring program
Operating cash flow, including restructuring programs, was MSEK 20 (123)
during the period January-June. Cash flows for restructuring programs
amounted to MSEK -60 (-57), of which MSEK -53 (-35) related to the 2010
program. Excluding restructuring programs, the operating cash flow
amounted to MSEK 80 (180), corresponding to 48 percent (95) of EBITA.
Group net debt
MSEK Financial position
| 2 |
000 The group’s credit facility amounts to MSEK 3,000 of which MSEK 760 |
matures during the third quarter 2011 and MSEK 2,240 matures in 2013.
| 1 |
500 Outstanding loans under the credit facility amounted to MSEK 1,226 (1,421) at |
June 30, 2011 and net debt was MSEK 1,147 (1,220). The debt/equity ratio was
| 1 |
000 SEK 0.66 (0.67). The group’s interest exposure is managed by the use of |
interest rate derivatives whose market valuation effects are included in the
500 group’s net interest income. At June 30, 2011, the average fixed interest term
was 14.1 months.
0
Q1 Q2Q3Q4 Q1 Q2Q3Q4 Q1 Q2Q3Q4 Q1 Q2
2008 2009 2010 2011 Investments
Investments in operating non-current assets amounted to MSEK 44 (45).
Number of employees
The average number of employees during the first half year was 5,095 (5,399).
Share price development 12
SEK months Niscayah’s share
| 20 |
The share price at the end of the period was SEK 18.40, corresponding to a |
market value of SEK 6.7 billion. 800,000 own shares were repurchased during
| 15 |
the second quarter for MSEK 9.8, at an average price of SEK 12.29. At June 30, |
the company held a total of 1.8 million shares, repurchased at an average
| 10 |
price of SEK 12.53, corresponding to 0.49 percent of the total number of |
registered shares. The purpose of the repurchased shares is to secure the
company’s costs in connection with the long-term performance-based
| 5 |
incentive program (LTIP 2011) which the annual general meeting resolved to |
Jul Oct Jan Apr Jul
introduce on May 3, 2011. The total number of outstanding shares is
Niscayah B OMX Stockholm PI unchanged since the listing and amounted to 365,058,897 shares at June 30,
| 2011. |
The average number of outstanding shares after buyback amounted to |
363,816,473 at the end of the period.
The Parent Company
During the first half year, revenues for Niscayah Group AB amounted to MSEK
| 72 |
(81) and the profit after net financial items was MSEK 96 (131). Cash and |
cash equivalents amounted to MSEK 3 (147). Investments in shares in
Niscayah Group AB (publ) Corp. id. no. 556436-6267 6 (18 )
| 7 |
The interim report of Niscayah, January – June 2011
INTERIM REPORT JAN?JUN 2011
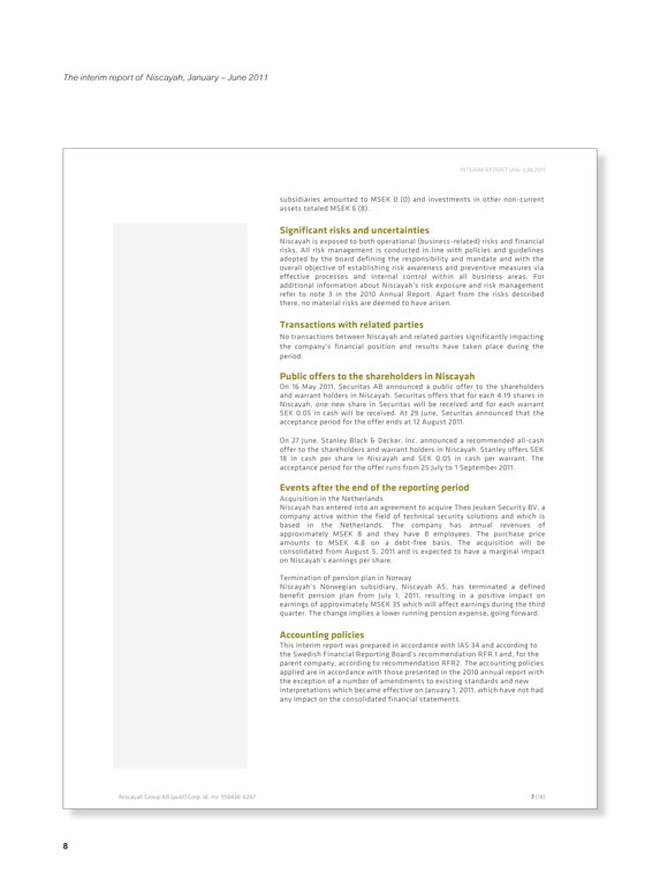
subsidiaries amounted to MSEK 0 (0) and investments in other non-current assets totaled MSEK 6 (8).
Significant risks and uncertainties
Niscayah is exposed to both operational (business-related) risks and financial risks. All risk management is conducted in line with policies and guidelines adopted by the board defining the responsibility and mandate and with the overall objective of establishing risk awareness and preventive measures via effective processes and internal control within all business areas. For additional information about Niscayah’s risk exposure and risk management refer to note 3 in the 2010 Annual Report. Apart from the risks described there, no material risks are deemed to have arisen.
Transactions with related parties
No transactions between Niscayah and related parties significantly impacting the company's financial position and results have taken place during the period.
Public offers to the shareholders in Niscayah
On 16 May 2011, Securitas AB announced a public offer to the shareholders and warrant holders in Niscayah. Securitas offers that for each 4.19 shares in Niscayah, one new share in Securitas will be received and for each warrant SEK 0.05 in cash will be received. At 29 June, Securitas announced that the acceptance period for the offer ends at 12 August 2011.
On 27 June, Stanley Black & Decker, Inc. announced a recommended all-cash offer to the shareholders and warrant holders in Niscayah. Stanley offers SEK 18 in cash per share in Niscayah and SEK 0.05 in cash per warrant. The acceptance period for the offer runs from 25 July to 1 September 2011.
Events after the end of the reporting period
Acquisition in the Netherlands
Niscayah has entered into an agreement to acquire Theo Jeuken Security BV, a company active within the field of technical security solutions and which is based in the Netherlands. The company has annual revenues of approximately MSEK 8 and they have 8 employees. The purchase price amounts to MSEK 4.8 on a debt-free basis. The acquisition will be consolidated from August 5, 2011 and is expected to have a marginal impact on Niscayah’s earnings per share.
Termination of pension plan in Norway
Niscayah’s Norwegian subsidiary, Niscayah AS, has terminated a defined benefit pension plan from July 1, 2011, resulting in a positive impact on earnings of approximately MSEK 35 which will affect earnings during the third quarter. The change implies a lower running pension expense, going forward.
Accounting policies
This interim report was prepared in accord ance with IAS 34 and according to the Swedish Financial Reporting Board's recommendation RFR 1 and, for the parent company, according to recommendation RFR2. The accounting policies applied are in accordance with those presented in the 2010 annual report with the exception of a number of amendments to existing standards and new interpretations which became effective on January 1, 2011, which have not had any impact on the consolidated financial statements.
Niscayah Group AB (publ) Corp. id. no. 556436-6267
| 7 |
(18 ) |
| 8 |
The interim report of Niscayah, January – June 2011
INTERIM REPORT JAN?JUN 2011
Future reporting dates in 2011
November 2, 2011 Interim report January-September 2011
This interim report has not been examined by the company’s auditors.
For further information please contact:
Håkan Kirstein, President and CEO +46 10 458 8000
Håkan Gustavson, Chief Financial Officer +46 10 458 8000
Johan Andersson Melbi, Investor Relations +46 10 458 8023
Niscayah’s annual reports, interim
reports and presentations are Niscayah Group AB discloses the information provided herein pursuant to the
available via Niscayah’s iPad Swedish Securities Markets Act and/or the Swedish Financial Instruments
application. Search for Niscayah in Trading Act. The information was submitted for publication on July 27, 2011 at
iTunes. 08.30 a.m. CET.
Niscayah Group AB (publ) Corp. id. no. 556436-6267 8 (18 )
9
The interim report of Niscayah, January – June 2011
INTERIM REPORT JAN?JUN 2011
CERTIFICATION
The Board of Directors and the CEO certify that the half-year report provides a true and fair overview of the Parent Company
Niscayah Group AB’s and the Group’s operations, their financial position and results of operations as well as describing material risks and uncertainties facing the Parent Company and other companies in the Group.
Stockholm, July 27, 2011
Niscayah Group AB (publ)
Jan Svensson Carl Douglas Tomas Franzén
Chairman of the Board Board member Board member
Eva Lindqvist Anders Böös Ulrik Svensson
Board member Board member Board member
Mikael Thylin Peter Alvhed Håkan Kirstein
Employee representative Employee representative Board member
President and CEO
Niscayah Group AB (publ) Corp. id. no. 556436-6267 9 (18 )
10
The interim report of Niscayah, January – June 2011
INTERIM REPORT JAN?JUN 2011
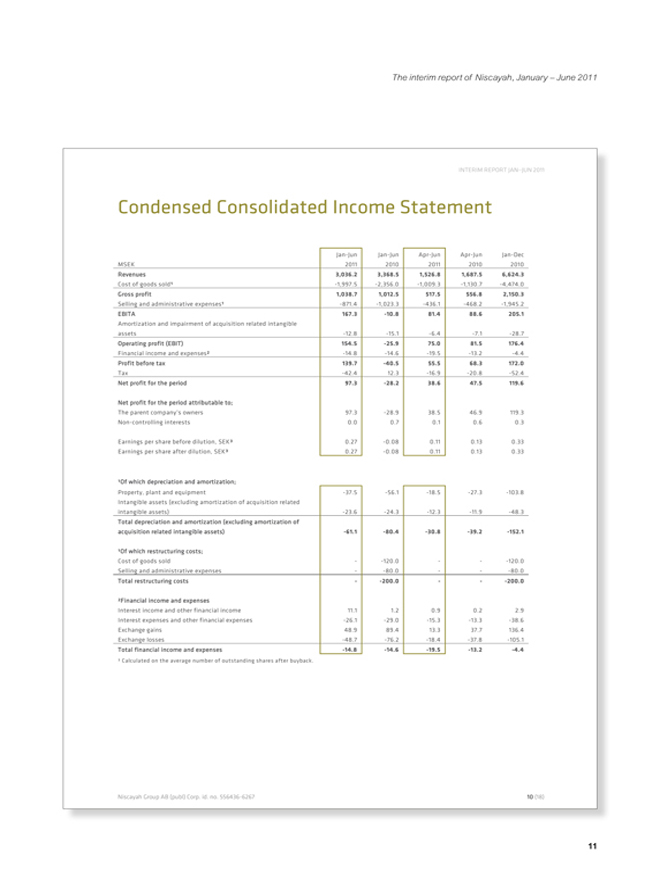
Condensed Consolidated Income Statement
Jan-Jun Jan-Jun Apr-Jun Apr-Jun Jan-Dec
MSEK 2011 2010 2011 2010 2010
Revenues 3,036.2 3,368.5 1,526.8 1,687.5 6,624.3
Cost of goods sold¹ -1,997.5 -2,356.0 -1,009.3 -1,130.7 -4,474.0
Gross profit 1,038.7 1,012.5 517.5 556.8 2,150.3
Selling and administrative expenses¹ -871.4 -1,023.3 -436.1 -468.2 -1,945.2
EBITA 167.3 -10.8 81.4 88.6 205.1
Amortization and impairment of acquisition related intangible
assets -12.8 -15.1 -6.4 -7.1 -28.7
Operating profit (EBIT) 154.5 -25.9 75.0 81.5 176.4
Financial income and expenses² -14.8 -14.6 -19.5 -13.2 -4.4
Profit before tax 139.7 -40.5 55.5 68.3 172.0
Tax -42.4 12.3 -16.9 -20.8 -52.4
Net profit for the period 97.3 -28.2 38.6 47.5 119.6
Net profit for the period attributable to;
The parent company’s owners 97.3 -28.9 38.5 46.9 119.3
Non-controlling interests 0.0 0.7 0.1 0.6 0.3
Earnings per share before dilution, SEK³ 0.27 -0.08 0.11 0.13 0.33
Earnings per share after dilution, SEK³ 0.27 -0.08 0.11 0.13 0.33
0,33
¹Of which depreciation and amortization;
Property, plant and equipment -37.5 -56.1 -18.5 -27.3 -103.8
Intangible assets (excluding amortization of acquisition related
intangible assets) -23.6 -24.3 -12.3 -11.9 -48.3
Total depreciation and amortization (excluding amortization of
acquisition related intangible assets) -61.1 -80.4 -30.8 -39.2 -152.1
¹Of which restructuring costs;
Cost of goods sold—-120.0——120.0
Selling and administrative expenses—-80.0——80.0
Total restructuring costs—-200.0——200.0
²Financial income and expenses
Interest income and other financial income 11.1 1.2 0.9 0.2 2.9
Interest expenses and other financial expenses -26.1 -29.0 -15.3 -13.3 -38.6
Exchange gains 48.9 89.4 13.3 37.7 136.4
Exchange losses -48.7 -76.2 -18.4 -37.8 -105.1
Total financial income and expenses -14.8 -14.6 -19.5 -13.2 -4.4
³ Calculated on the average number of outstanding shares after buyback.
Niscayah Group AB (publ) Corp. id. no. 556436-6267 10 (18 )
11
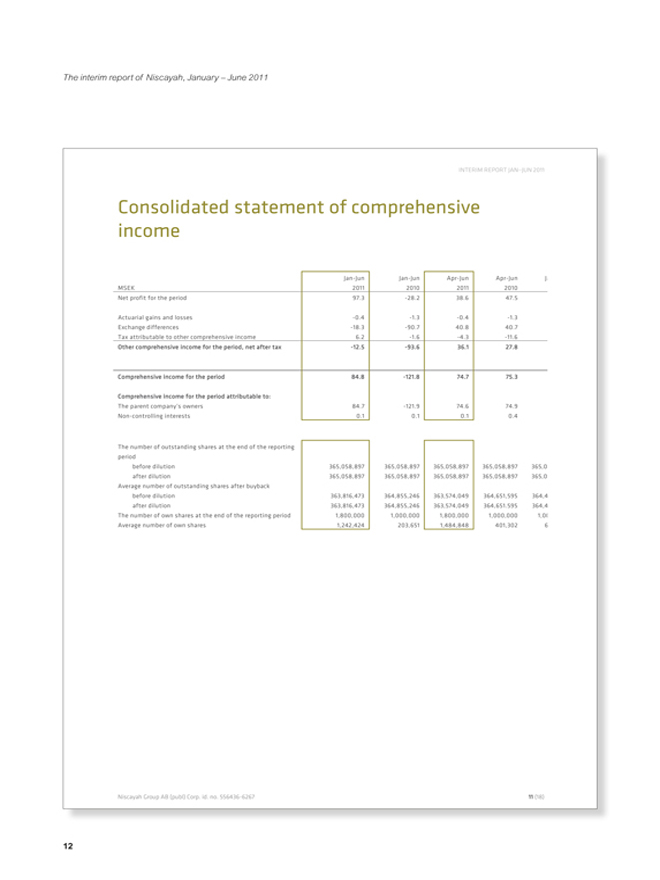
Consolidated statement of comprehensive income
Jan-Jun Jan-Jun Apr-Jun Apr-Jun Jan-Dec MSEK 2011 2010 2011 2010 Net profit for the period 97.3 -28.2 38.6 47.5 119.
Actuarial gains and losses -0.4 -1.3 -0.4 -1.3 -24. Exchange differences -18.3 -90.7 40.8 40.7 -291. Tax attributable to other comprehensive income 6.2 -1.6 -4.3 -11.6 31. Other comprehensive income for the period, net after tax -12.5 -93.6 36.1 27.8 -283.
Comprehensive income for the period 84.8 -121.8 74.7 75.3 -164.
Comprehensive income for the period attributable to:
The parent company’s owners 84.7 -121.9 74.6 74.9 -163. Non-controlling interests 0.1 0.1 0.1 0.4 -0.
The number of outstanding shares at the end of the reporting period before dilution 365,058,897 365,058,897 365,058,897 365,058,897 365,058,897 after dilution 365,058,897 365,058,897 365,058,897 365,058,897 365,058,897 Average number of outstanding shares after buyback before dilution 363,816,473 364,855,246 363,574,049 364,651,595 364,457,072 after dilution 363,816,473 364,855,246 363,574,049 364,651.595 364,457,072 The number of own shares at the end of the reporting period 1,800,000 1,000,000 1,800,000 1,000,000 1,000,000 Average number of own shares 1,242,424 203,651 1,484,848 401,302 601,825
The interim report of Niscayah, January – June 2011
12
The interim report of Niscayah, January – June 2011
INTERIM REPORT JAN?JUN 2011
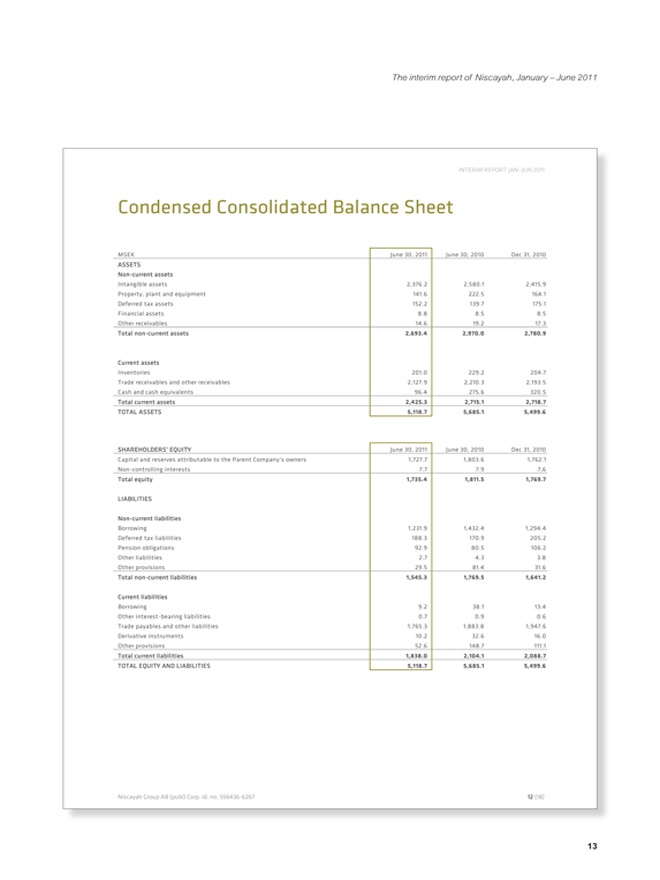
Condensed Consolidated Balance Sheet
MSEK June 30, 2011 June 30, 2010 Dec 31, 2010
ASSETS
Non-current assets
Intangible assets 2,376.2 2,580.1 2,415.9
Property, plant and equipment 141.6 222.5 164.1
Deferred tax assets 152.2 139.7 175.1
Financial assets 8.8 8.5 8.5
Other receivables 14.6 19.2 17.3
Total non-current assets 2,693.4 2,970.0 2,780.9
Current assets
Inventories 201.0 229.2 204.7
Trade receivables and other receivables 2,127.9 2,210.3 2,193.5
Cash and cash equivalents 96.4 275.6 320.5
Total current assets 2,425.3 2,715.1 2,718.7
TOTAL ASSETS 5,118.7 5,685.1 5,499.6
SHAREHOLDERS’ EQUITY June 30, 2011 June 30, 2010 Dec 31, 2010
Capital and reserves attributable to the Parent Company’s owners 1,727.7 1,803.6 1,762.1
Non-controlling interests 7.7 7.9 7,6
Total equity 1,735.4 1,811.5 1,769.7
LIABILITIES
Non-current liabilities
Borrowing 1,231.9 1,432.4 1,294.4
Deferred tax liabilities 188.3 170.9 205.2
Pension obligations 92.9 80.5 106.2
Other liabilities 2.7 4.3 3.8
Other provisions 29.5 81.4 31.6
Total non-current liabilities 1,545.3 1,769.5 1,641.2
Current liabilities
Borrowing 9.2 38.1 13.4
Other interest-bearing liabilities 0.7 0.9 0.6
Trade payables and other liabilities 1,765.3 1,883.8 1,947.6
Derivative instruments 10.2 32.6 16.0
Other provisions 52.6 148.7 111.1
Total current liabilities 1,838.0 2,104.1 2,088.7
TOTAL EQUITY AND LIABILITIES 5,118.7 5,685.1 5,499.6
Niscayah Group AB (publ) Corp. id. no. 556436-6267 12 (18 )
13
The interim report of Niscayah, January – June 2011
INTERIM REPORT JAN?JUN 2011
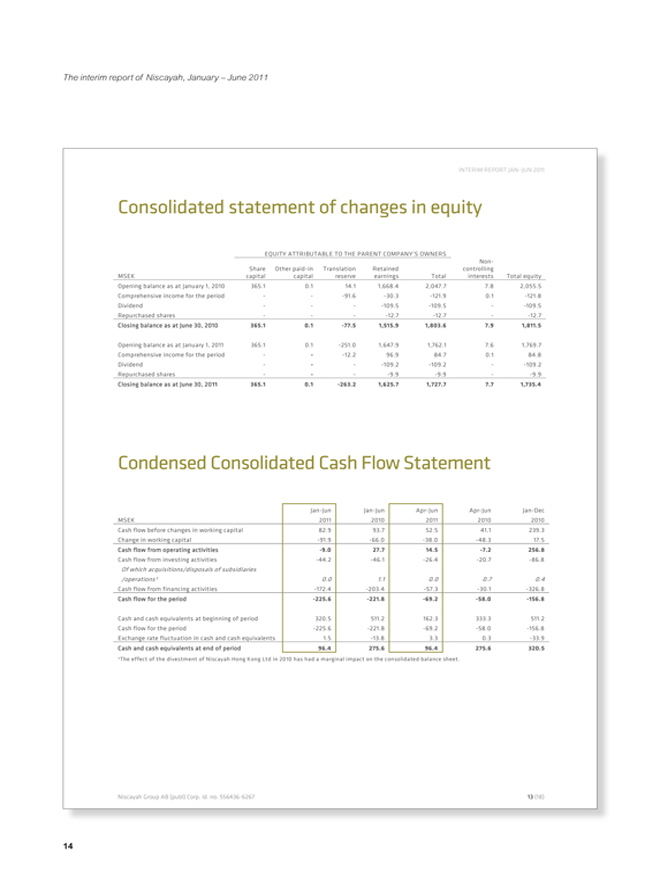
Consolidated statement of changes in equity
EQUITY ATTRIBUTABLE TO THE PARENT COMPANY’S OWNERS
Non-
Share Other paid-in Translation Retained controlling
MSEK capital capital reserve earnings Total interests Total equity
Opening balance as at January 1, 2010 365.1 0.1 14.1 1,668.4 2,047.7 7.8 2,055.5
Comprehensive income for the period——91.6 -30.3 -121.9 0.1 -121.8
Dividend—— -109.5 -109.5—-109.5
Repurchased shares—— -12.7 -12.7—-12.7
Closing balance as at June 30, 2010 365.1 0.1 -77.5 1,515.9 1,803.6 7.9 1,811.5
Opening balance as at January 1, 2011 365.1 0.1 -251.0 1,647.9 1,762.1 7.6 1,769.7
Comprehensive income for the period——12.2 96.9 84.7 0.1 84.8
Dividend—— -109.2 -109.2—-109.2
Repurchased shares—— -9.9 -9.9—-9.9
Closing balance as at June 30, 2011 365.1 0.1 -263.2 1,625.7 1,727.7 7.7 1,735.4
Condensed Consolidated Cash Flow Statement
Jan-Jun Jan-Jun Apr-Jun Apr-Jun Jan-Dec
MSEK 2011 2010 2011 2010 2010
Cash flow before changes in working capital 82.9 93.7 52.5 41.1 239.3
Change in working capital -91.9 -66.0 -38.0 -48.3 17.5
Cash flow from operating activities -9.0 27.7 14.5 -7.2 256.8
Cash flow from investing activities -44.2 -46.1 -26.4 -20.7 -86.8
Of which acquisitions/disposals of subsidiaries
/operations¹ 0.0 1.1 0.0 0.7 0.4
Cash flow from financing activities -172.4 -203.4 -57.3 -30.1 -326.8
Cash flow for the period -225.6 -221.8 -69.2 -58.0 -156.8
Cash and cash equivalents at beginning of period 320.5 511.2 162.3 333.3 511.2
Cash flow for the period -225.6 -221.8 -69.2 -58.0 -156.8
Exchange rate fluctuation in cash and cash equivalents 1.5 -13.8 3.3 0.3 -33.9
Cash and cash equivalents at end of period 96.4 275.6 96.4 275.6 320.5
¹The effect of the divestment of Niscayah Hong Kong Ltd in 2010 has had a marginal impact on the consolidated balance sheet.
Niscayah Group AB (publ) Corp. id. no. 556436-6267 13 (18 )
14
The interim report of Niscayah, January – June 2011
INTERIM REPORT JAN?JUN 2011
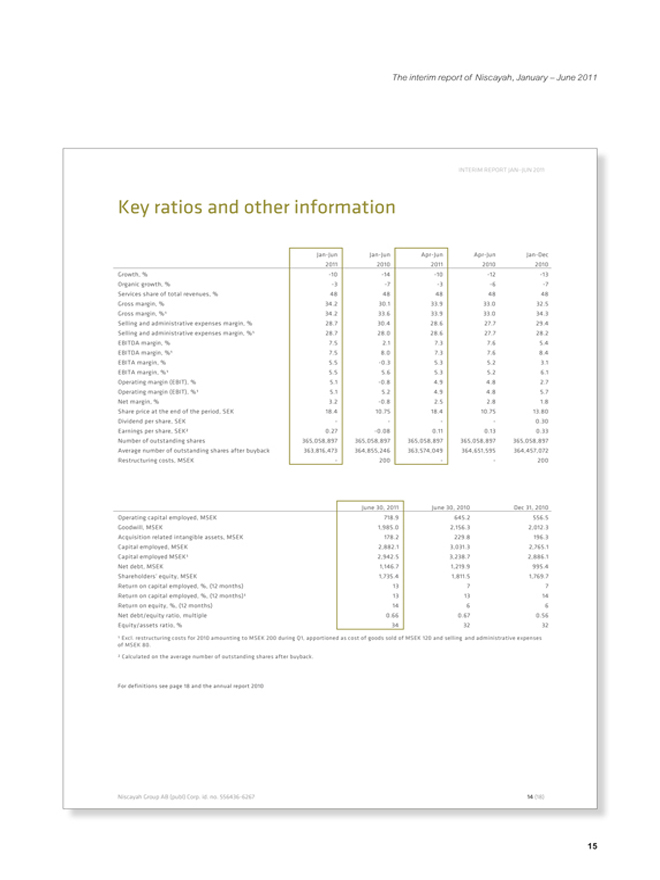
Key ratios and other information
Jan-Jun Jan-Jun Apr-Jun Apr-Jun Jan-Dec
2011 2010 2011 2010 2010
Growth, % -10 -14 -10 -12 -13
Organic growth, % -3 -7 -3 -6 -7
Services share of total revenues, % 48 48 48 48 48
Gross margin, % 34.2 30.1 33.9 33.0 32.5
Gross margin, %¹ 34.2 33.6 33.9 33.0 34.3
Selling and administrative expenses margin, % 28.7 30.4 28.6 27.7 29.4
Selling and administrative expenses margin, %¹ 28.7 28.0 28.6 27.7 28.2
EBITDA margin, % 7.5 2.1 7.3 7.6 5.4
EBITDA margin, %¹ 7.5 8.0 7.3 7.6 8.4
EBITA margin, % 5.5 -0.3 5.3 5.2 3.1
EBITA margin, %¹ 5.5 5.6 5.3 5.2 6.1
Operating margin (EBIT), % 5.1 -0.8 4.9 4.8 2.7
Operating margin (EBIT), %¹ 5.1 5.2 4.9 4.8 5.7
Net margin, % 3.2 -0.8 2.5 2.8 1.8
Share price at the end of the period, SEK 18.4 10.75 18.4 10.75 13.80
Dividend per share, SEK———0.30
Earnings per share, SEK² 0.27 -0.08 0.11 0.13 0.33
Number of outstanding shares 365,058,897 365,058,897 365,058,897 365,058,897 365,058,897
Average number of outstanding shares after buyback 363,816,473 364,855,246 363,574,049 364,651,595 364,457,072
Restructuring costs, MSEK—200—- 200
June 30, 2011 June 30, 2010 Dec 31, 2010
Operating capital employed, MSEK 718.9 645.2 556.5
Goodwill, MSEK 1,985.0 2,156.3 2,012.3
Acquisition related intangible assets, MSEK 178.2 229.8 196.3
Capital employed, MSEK 2,882.1 3,031.3 2,765.1
Capital employed MSEK¹ 2,942.5 3,238.7 2,886.1
Net debt, MSEK 1,146.7 1,219.9 995.4
Shareholders’ equity, MSEK 1,735.4 1,811.5 1,769.7
Return on capital employed, %, (12 months) 13 7 7
Return on capital employed, %, (12 months)¹ 13 13 14
Return on equity, %, (12 months) 14 6 6
Net debt/equity ratio, multiple 0.66 0.67 0.56
Equity/assets ratio, % 34 32 32
¹ Excl. restructuring costs for 2010 amounting to MSEK 200 during Q1, apportioned as cost of goods sold of MSEK 120 and selling and administrative expenses of MSEK 80.
² Calculated on the average number of outstanding shares after buyback.
For definitions see page 18 and the annual report 2010
Niscayah Group AB (publ) Corp. id. no. 556436-6267 14 (18 )
15
The interim report of Niscayah, January – June 2011
INTERIM REPORT JAN?JUN 2011
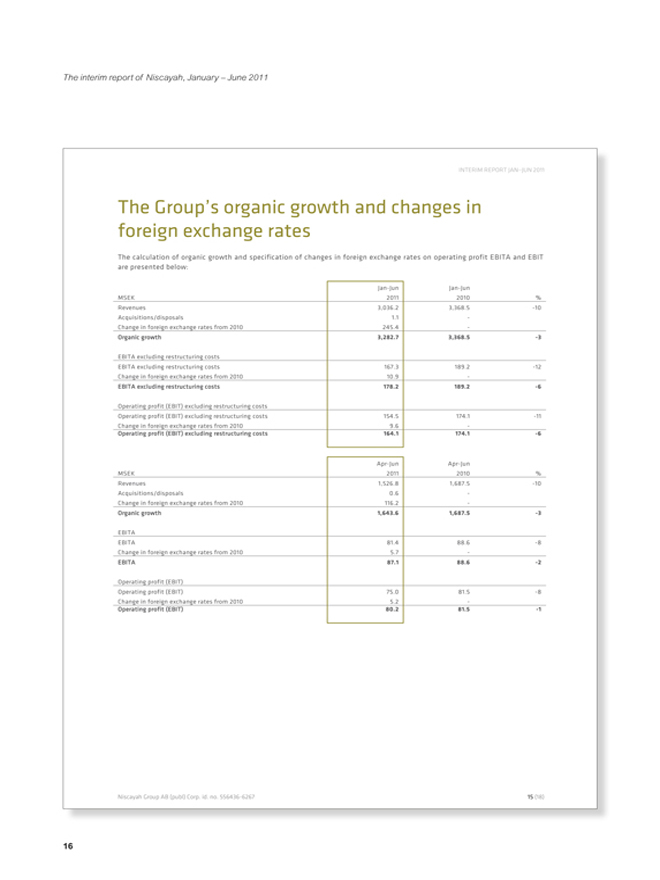
The Group’s organic growth and changes in foreign exchange rates
The calculation of organic growth and specification of changes in foreign exchange rates on operating profit EBITA and EBIT are presented below:
Jan-Jun Jan-Jun
MSEK 2011 2010%
Revenues 3,036.2 3,368.5 -10
Acquisitions/disposals 1.1 -
Change in foreign exchange rates from 2010 245.4 -
Organic growth 3,282.7 3,368.5 -3
EBITA excluding restructuring costs
EBITA excluding restructuring costs 167.3 189.2 -12
Change in foreign exchange rates from 2010 10.9 -
EBITA excluding restructuring costs 178.2 189.2 -6
Operating profit (EBIT) excluding restructuring costs
Operating profit (EBIT) excluding restructuring costs 154.5 174.1 -11
Change in foreign exchange rates from 2010 9.6 -
Operating profit (EBIT) excluding restructuring costs 164.1 174.1 -6
Apr-Jun Apr-Jun
MSEK 2011 2010%
Revenues 1,526.8 1,687.5 -10
Acquisitions/disposals 0.6 -
Change in foreign exchange rates from 2010 116.2 -
Organic growth 1,643.6 1,687.5 -3
EBITA
EBITA 81.4 88.6 -8
Change in foreign exchange rates from 2010 5.7 -
EBITA 87.1 88.6 -2
Operating profit (EBIT)
Operating profit (EBIT) 75.0 81.5 -8
Change in foreign exchange rates from 2010 5.2 -
Operating profit (EBIT) 80.2 81.5 -1
Niscayah Group AB (publ) Corp. id. no. 556436-6267 15 (18 )
16
The interim report of Niscayah, January – June 2011
INTERIM REPORT JAN?JUN 2011
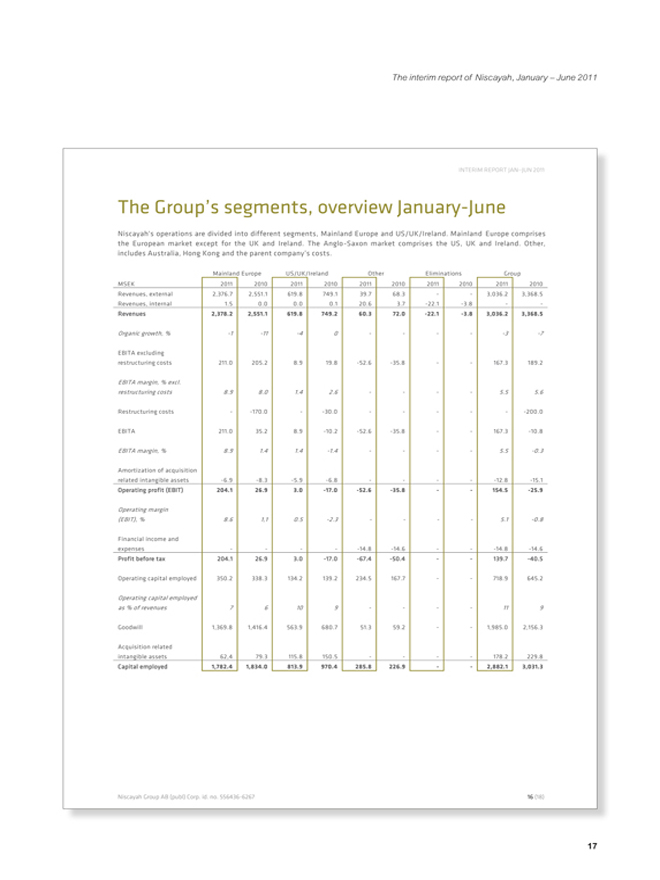
The Group’s segments, overview January-June
Niscayah's operations are divided into different segments, Mainland Europe and US/UK/Ireland. Mainland Europe comprises the European market except for the UK and Ireland. The Anglo-Saxon market comprises the US, UK and Ireland. Other, includes Australia, Hong Kong and the parent company’s costs.
Mainland Europe US/UK/Ireland Other Eliminations Group
MSEK 2011 2010 2011 2010 2011 2010 2011 2010 2011 2010
Revenues, external 2,376.7 2,551.1 619.8 749.1 39.7 68.3—- 3,036.2 3,368.5
Revenues, internal 1.5 0.0 0.0 0.1 20.6 3.7 -22.1 -3.8—-
Revenues 2,378.2 2,551.1 619.8 749.2 60.3 72.0 -22.1 -3.8 3,036.2 3,368.5
Organic growth, % -1 -11 -4 0———-3 -7
EBITA excluding
restructuring costs 211.0 205.2 8.9 19.8 -52.6 -35.8—- 167.3 189.2
EBITA margin, % excl.
restructuring costs 8.9 8.0 1.4 2.6———5.5 5.6
Restructuring costs—-170.0—-30.0————200.0
EBITA 211.0 35.2 8.9 -10.2 -52.6 -35.8—- 167.3 -10.8
EBITA margin, % 8.9 1.4 1.4 -1.4———5.5 -0.3
Amortization of acquisition
related intangible assets -6.9 -8.3 -5.9 -6.8———-12.8 -15.1
Operating profit (EBIT) 204.1 26.9 3.0 -17.0 -52.6 -35.8—- 154.5 -25.9
Operating margin
(EBIT), % 8.6 1,1 0.5 -2.3———5.1 -0.8
Financial income and
expenses———-14.8 -14.6——14.8 -14.6
Profit before tax 204.1 26.9 3.0 -17.0 -67.4 -50.4—- 139.7 -40.5
Operating capital employed 350.2 338.3 134.2 139.2 234.5 167.7—- 718.9 645.2
Operating capital employed
as % of revenues 7 6 10 9———11 9
Goodwill 1,369.8 1,416.4 563.9 680.7 51.3 59.2—- 1,985.0 2,156.3
Acquisition related
intangible assets 62,4 79.3 115.8 150.5———178.2 229.8
Capital employed 1,782.4 1,834.0 813.9 970.4 285.8 226.9—- 2,882.1 3,031.3
Niscayah Group AB (publ) Corp. id. no. 556436-6267 16 (18 )
17
The interim report of Niscayah, January – June 2011
INTERIM REPORT JAN?JUN 2011
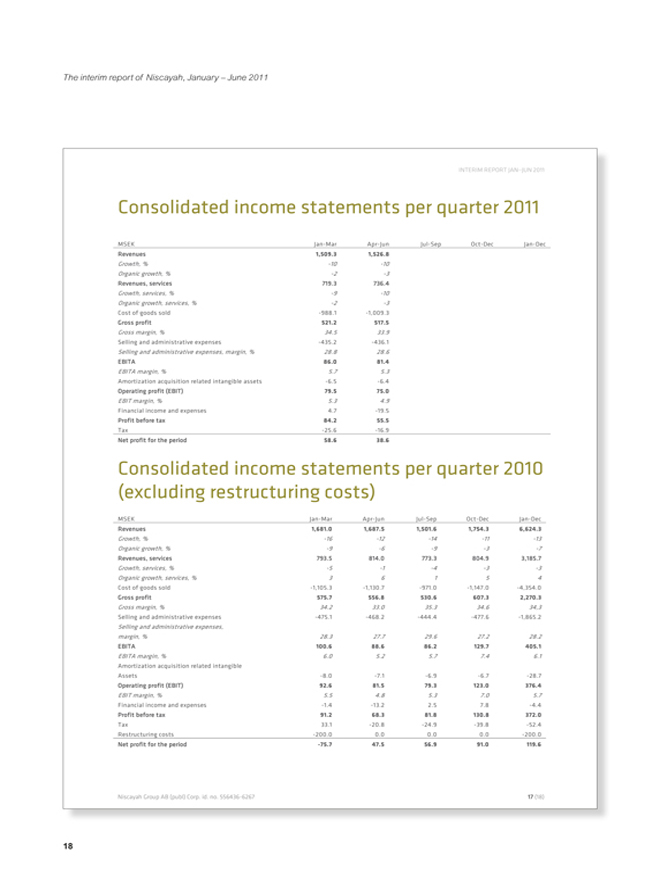
Consolidated income statements per quarter 2011
MSEK Jan-Mar Apr-Jun Jul-Sep Oct-Dec Jan-Dec
Revenues 1,509.3 1,526.8
Growth, % -10 -10
Organic growth, % -2 -3
Revenues, services 719.3 736.4
Growth, services, % -9 -10
Organic growth, services, % -2 -3
Cost of goods sold -988.1 -1,009.3
Gross profit 521.2 517.5
Gross margin, % 34.5 33.9
Selling and administrative expenses -435.2 -436.1
Selling and administrative expenses, margin, % 28.8 28.6
EBITA 86.0 81.4
EBITA margin, % 5.7 5.3
Amortization acquisition related intangible assets -6.5 -6.4
Operating profit (EBIT) 79.5 75.0
EBIT margin, % 5.3 4.9
Financial income and expenses 4.7 -19.5
Profit before tax 84.2 55.5
Tax -25.6 -16.9
Net profit for the period 58.6 38.6
Consolidated income statements per quarter 2010
(excluding restructuring costs)
MSEK Jan-Mar Apr-Jun Jul-Sep Oct-Dec Jan-Dec
Revenues 1,681.0 1,687.5 1,501.6 1,754.3 6,624.3
Growth, % -16 -12 -14 -11 -13
Organic growth, % -9 -6 -9 -3 -7
Revenues, services 793.5 814.0 773.3 804.9 3,185.7
Growth, services, % -5 -1 -4 -3 -3
Organic growth, services, % 3 6 1 5 4
Cost of goods sold -1,105.3 -1,130.7 -971.0 -1,147.0 -4,354.0
Gross profit 575.7 556.8 530.6 607.3 2,270.3
Gross margin, % 34.2 33.0 35.3 34.6 34,3
Selling and administrative expenses -475.1 -468.2 -444.4 -477.6 -1,865.2
Selling and administrative expenses,
margin, % 28.3 27.7 29.6 27.2 28.2
EBITA 100.6 88.6 86.2 129.7 405.1
EBITA margin, % 6.0 5.2 5.7 7.4 6.1
Amortization acquisition related intangible
Assets -8.0 -7.1 -6.9 -6.7 -28.7
Operating profit (EBIT) 92.6 81.5 79.3 123.0 376.4
EBIT margin, % 5.5 4.8 5.3 7.0 5.7
Financial income and expenses -1.4 -13.2 2.5 7.8 -4.4
Profit before tax 91.2 68.3 81.8 130.8 372.0
Tax 33.1 -20.8 -24.9 -39.8 -52.4
Restructuring costs -200.0 0.0 0.0 0.0 -200.0
Net profit for the period -75.7 47.5 56.9 91.0 119.6
Niscayah Group AB (publ) Corp. id. no. 556436-6267 17 (18 )
18
The interim report of Niscayah, January – June 2011
INTERIM REPORT JAN?JUN 2011
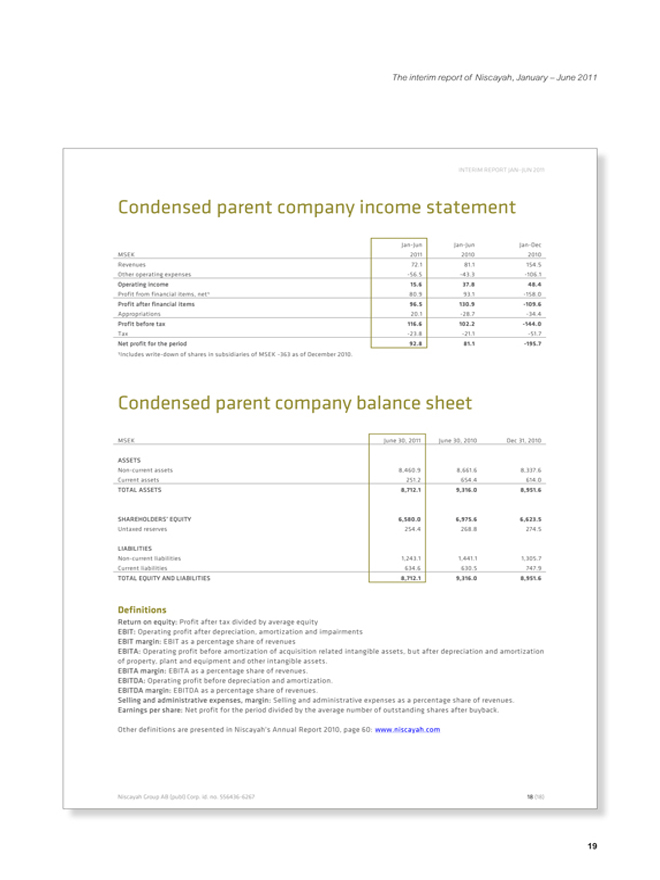
Condensed parent company income statement
Jan-Jun Jan-Jun Jan-Dec
MSEK 2011 2010 2010
Revenues 72.1 81.1 154.5
Other operating expenses -56.5 -43.3 -106.1
Operating income 15.6 37.8 48.4
Profit from financial items, net¹ 80.9 93.1 -158.0
Profit after financial items 96.5 130.9 -109.6
Appropriations 20.1 -28.7 -34.4
Profit before tax 116.6 102.2 -144.0
Tax -23.8 -21.1 -51.7
Net profit for the period 92.8 81.1 -195.7
¹Includes write-down of shares in subsidiaries of MSEK -363 as of December 2010.
Condensed parent company balance sheet
MSEK June 30, 2011 June 30, 2010 Dec 31, 2010
ASSETS
Non-current assets 8,460.9 8,661.6 8,337.6
Current assets 251.2 654.4 614.0
TOTAL ASSETS 8,712.1 9,316.0 8,951.6
SHAREHOLDERS’ EQUITY 6,580.0 6,975.6 6,623.5
Untaxed reserves 254.4 268.8 274.5
LIABILITIES
Non-current liabilities 1,243.1 1,441.1 1,305.7
Current liabilities 634.6 630.5 747.9
TOTAL EQUITY AND LIABILITIES 8,712.1 9,316.0 8,951.6
19
Addresses
Stanley Black & Decker, Inc Niscayah group AB (publ)
1000 Stanley Drive Box 12231
New Britain, CT 06053 SE-102 26 Stockholm
United States Visiting address:
Tel: +1 (860) 2255111 Lindhagensplan 70
Email: investorrelations@swkbdk.com Sweden
www.stanleyblackanddecker.com
AUDITORS TO NISCAYAH
SBD Holding AB PricewaterhouseCoopers AB
C/o Gernandt & Danielsson Advokatbyrå KB Torsgatan 21
Address below SE-113 97 Stockholm
Sweden
ADVISORS TO STANLEY BLACK & DECKER AND
SBD HOLDINg ADVISORS TO NISCAYAH
Financial advisors Financial advisor
Barclays Capital, Inc. Lazard AB
745 Seventh Avenue Sturegatan 24
New York, NY 10019 SE-114 36 Stockholm
USA Sweden
Handelsbanken Capital Markets Legal advisor
Blasieholmstorg 11–12 Hannes Snellman Attorneys Ltd
SE-106 70 Stockholm Kungsträdgårdsgatan 20
Sweden SE-111 47 Stockholm
Sweden
J.P. Morgan Securities LLP
383 Madison Avenue
New York, NY 10179
USA
Legal advisors
Cleary gottlieb Steen & Hamilton LLP
City Place House, 55 Basinghall Street
London EC2V 5EH
England
gernandt & Danielsson Advokatbyrå KB
Box 5747
SE-114 87 Stockholm
Sweden
20

Intellecta Finanstryck 2011 – 6061