Attached files
| file | filename |
|---|---|
| 8-K - FORM 8-K - POTLATCHDELTIC CORP | d8k.htm |
 POTLATCH CORPORATION
AUGUST 2011
POTLATCH CORPORATION
Eric J. Cremers
Vice President, Finance and Chief Financial Officer
Deutsche Bank Conference –
Boston
Exhibit 99.1 |
 POTLATCH CORPORATION
2
Forward-Looking Statements
This presentation contains certain forward-looking statements within the meaning of the Private
Litigation Reform Act of 1995 as amended, including without limitation statements about future
company performance, the company’s business model, strength of the company’s balance
sheet and credit metrics, dividend levels and yields, direction of markets and the economy, management of
timberlands to optimize values, projected inland private timber growth and harvest, future harvest
levels and their relation to market trends, impact of the pine beetle on North American lumber
supply, forecasts of North American exports of lumber to China, softwood stumpage price trends,
forecast of U.S. housing starts, the company’s capital structure, weighted average cost of debt, cash flow
generation, Canadian/U.S. dollar exchange rate, “organic” and “inorganic” funds
available for distribution, funds available for distribution, real estate business potential
and land development potential, real estate value opportunities, biomass opportunities,
forecasts of U.S. biomass consumed to produce electricity, management of the output of our Wood
Products facilities, asset coverage, debt repayment, and dividend policy. These
forward-looking statements are based on current expectations, estimates, assumptions and
projections that are subject to change, and actual results may differ materially from the forward-looking statements.
Factors that could cause actual results to differ materially include, but are not limited to, changes
in timberland values; changes in timber harvest levels on the company’s lands; changes in
timber prices; changes in policy regarding governmental timber sales; changes in the United
States and international economies; changes in the level of domestic construction activity; changes in
international tariffs, quotas and trade agreements involving wood products; changes in domestic and
international demand for wood products; changes in production and production capacity in the
forest products industry; competitive pricing pressures for the company’s products;
unanticipated manufacturing disruptions; changes in general and industry-specific environmental laws and
regulations; unforeseen environmental liabilities or expenditures; weather conditions; changes in fuel
and energy costs; changes in raw material and other costs; the ability to satisfy complex rules
in order to remain qualified as a REIT; changes in tax laws that could reduce the
benefits associated with REIT status; and other risks and uncertainties described from time to time in the
company’s public filings with the Securities and Exchange Commission. All
forward-looking statements are made as of the date of this presentation, and the company
does not undertake to update any forward-looking statements. |
 POTLATCH CORPORATION
3
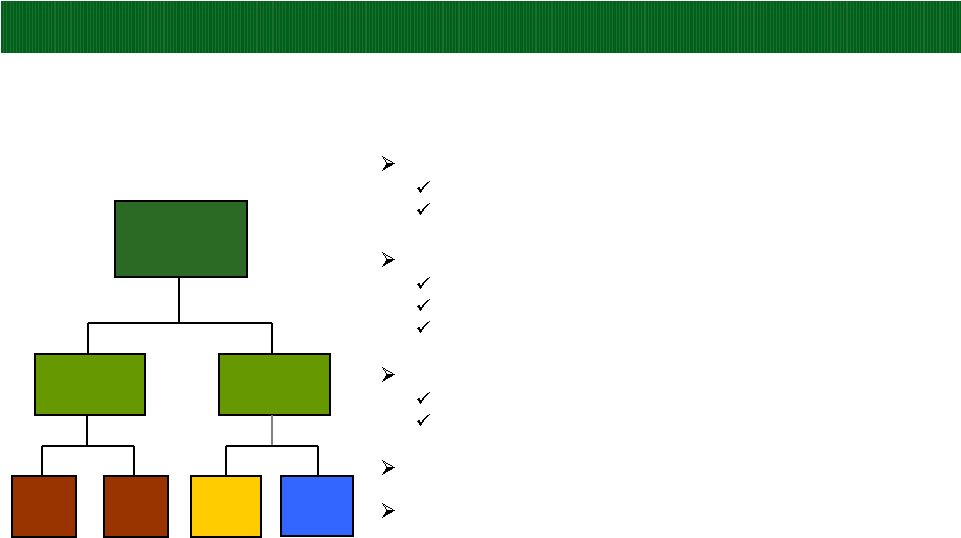
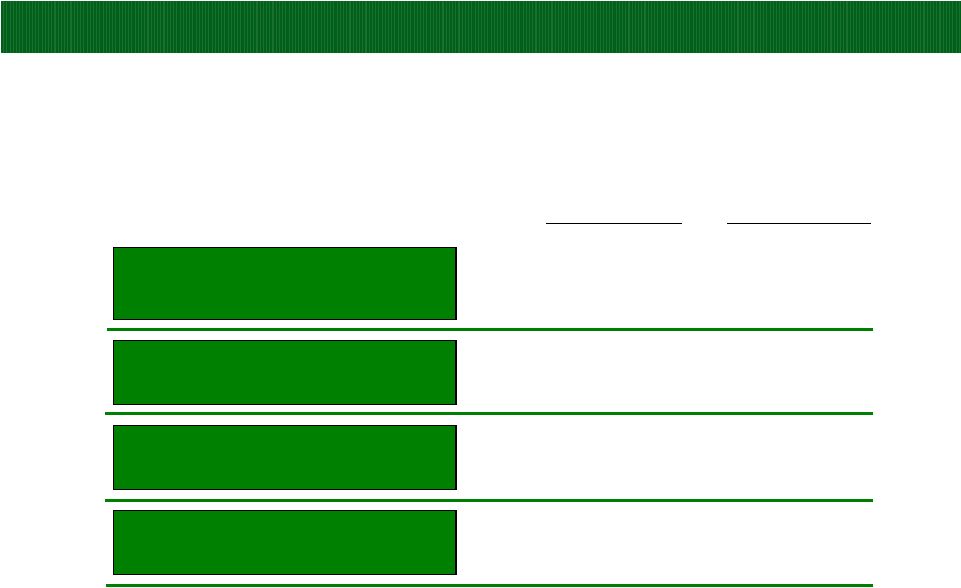
Converted to tax efficient REIT in 2006
Single level of taxation
Lower cost of capital
Fourth largest US Timber REIT
1.5 million acres of owned timberland
Growing real estate business
Five wood products manufacturing facilities
Enterprise value of $1.7 billion
(1)
Market cap of ~$1.4 billion
Net debt
(2)
of ~$300 million
Attractive
dividend
at
$2.04
per
share,
yielding
5.6%
(1)
Strong balance sheet with solid credit metrics
Company Overview
Potlatch
Corporation
(REIT)
Resource
(Timberlands)
Taxable REIT
Subsidiaries
North
South
Real
Estate
Wood
Products
(1)
Based on July 12, 2011, closing stock price of $36.32 a share.
(2)
We define net debt as the total of short-term and long-term debt less cash
and short-term investments, see reconciliation on page 31. |
 POTLATCH CORPORATION
4
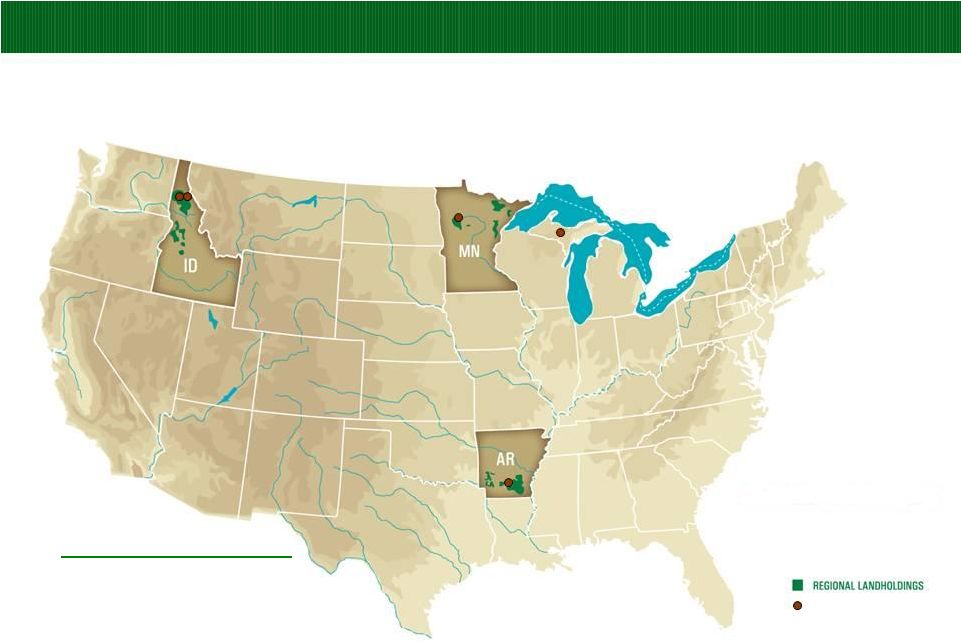
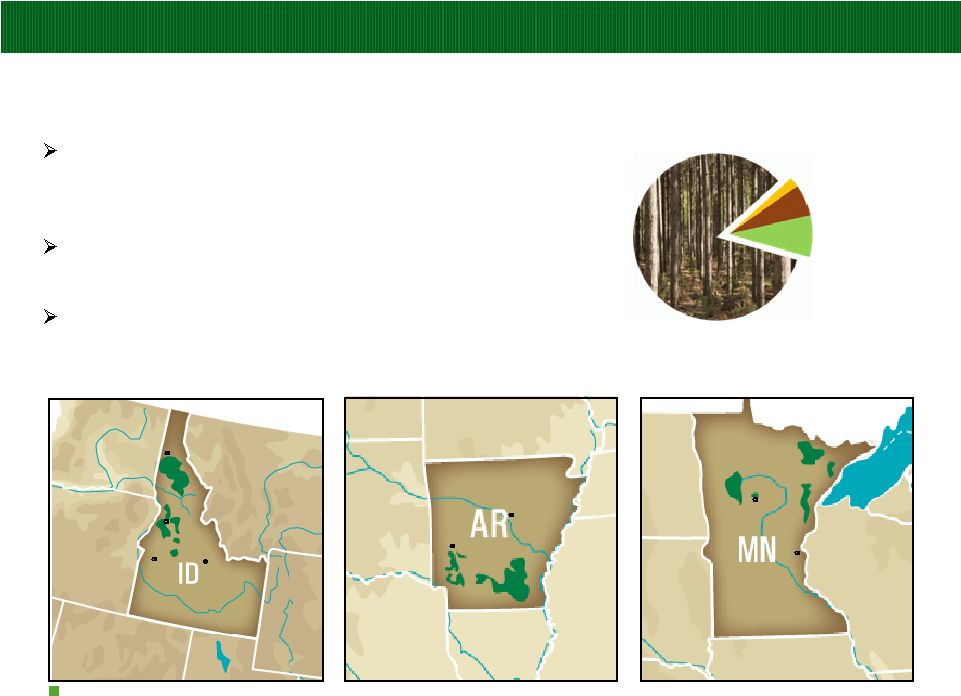
Wood Products
Manufacturing Facilities
Idaho:
818,000 acres
Arkansas:
408,000 acres
Minnesota:
228,000 acres
Total:
1,454,000 acres Timberlands
(1)
(1)
As of June 30, 2011.
Potlatch owns approximately 1.5 million acres of FSC-certified timberland in
Arkansas, Idaho and Minnesota and five wood products manufacturing
facilities Potlatch Business Overview
[818,000 acres]
[818,000 acres]
[228,000 acres]
[228,000 acres]
[408,000
acres] [408,000 acres]
408,000 acres] |
 POTLATCH CORPORATION
5
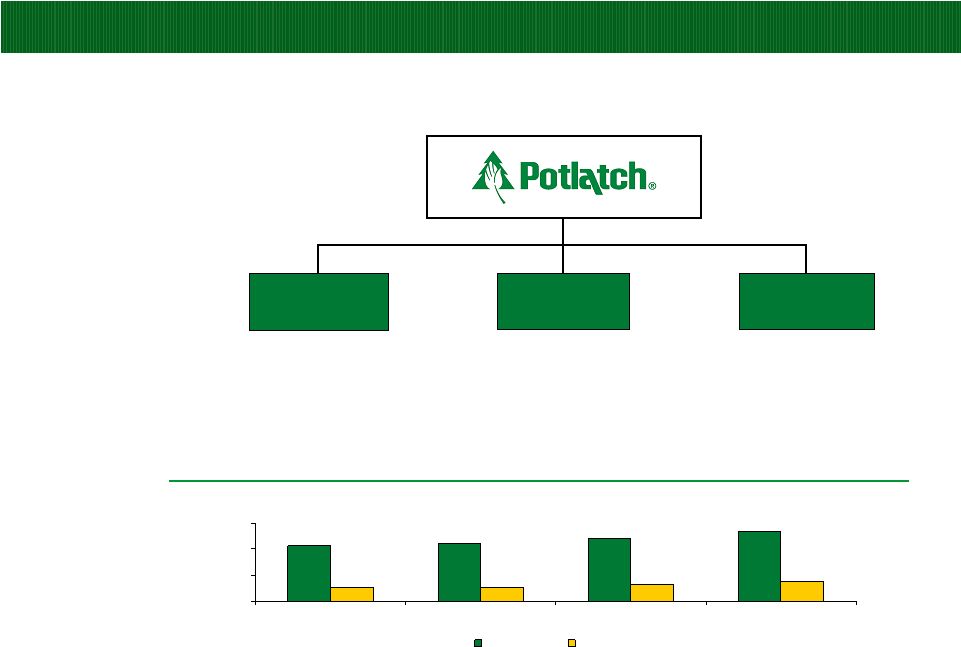
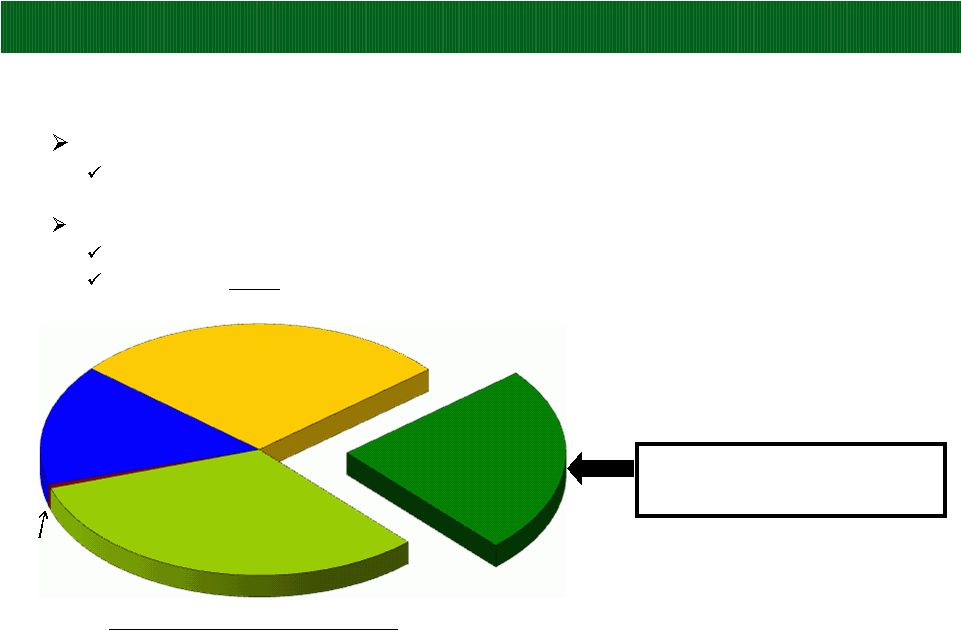
Potlatch Financial Overview
($ in millions)
2010 Segment Revenues
(1)
2010 Segment EBITDDA
(2)
Segment EBITDDA Margin
(3)
Resource
$226
$83
36.7%
Real Estate
$85
$79
92.9%
Wood
Products
$274
$15
5.5%
Historical Consolidated Revenue and EBITDDA
$423
$440
$476
$539
$102
$107
$131
$151
$0
$200
$400
$600
2007
2008
2009
2010
Revenue
EBITDDA
(2)
(1)
Segment revenues and EBITDDA presented prior to intersegment eliminations.
(2) See page 36 of this presentation for definitions of EBITDDA and segment EBITDDA, and
page 30 for reconciliations to most comparable GAAP measures.
(3) Segment EBITDDA Margin is defined as Segment EBITDDA divided by Segment
Revenues.
|
 POTLATCH CORPORATION
0.0
1.0
2.0
3.0
4.0
5.0
2004
2005
2006
2007
2008
2009
2010
2011F
~ 2 to 3
Years
Forward
Sawlogs
Pulpwood
$72
$80
$70
$53
$60
$59
$27
$34
$36
$33
$34
$32
$0
$25
$50
$75
$100
2006
2007
2008
2009
2010
Q2 2011
YTD
Sawlogs ($/ton)
Pulpwood ($/ton)
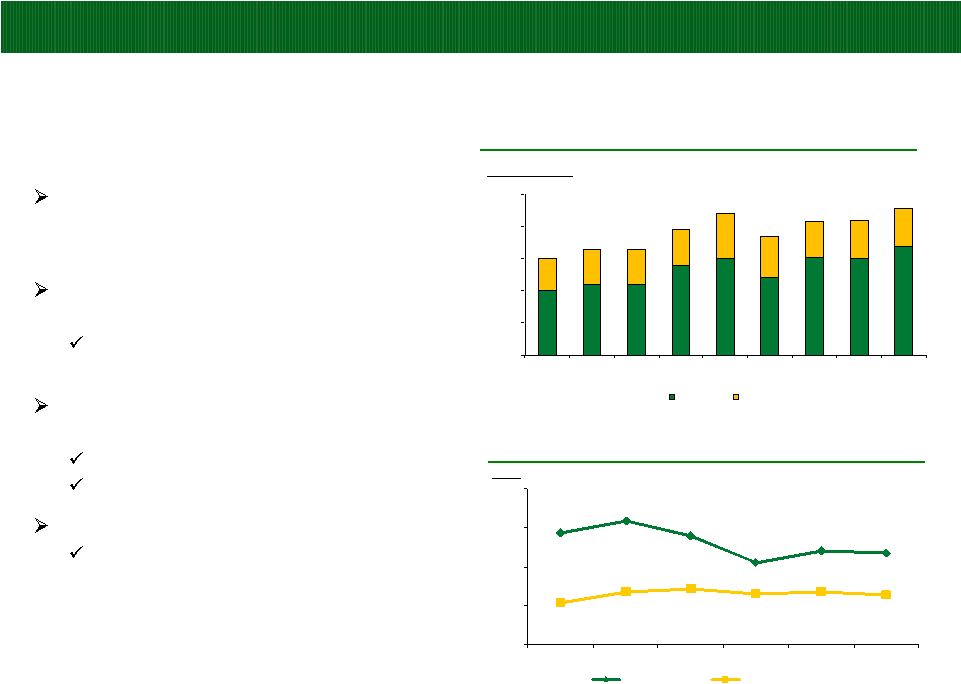
6
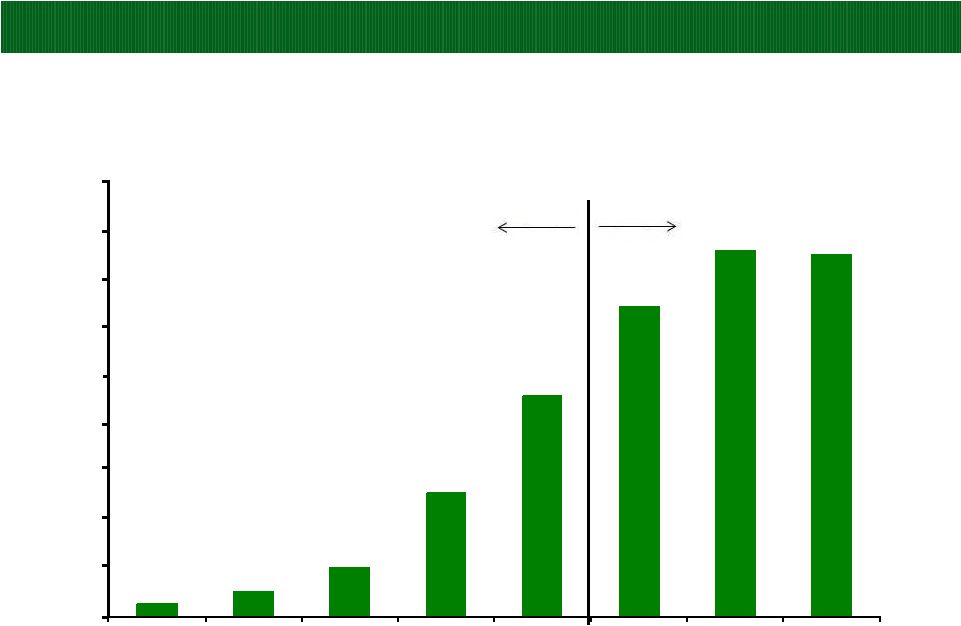
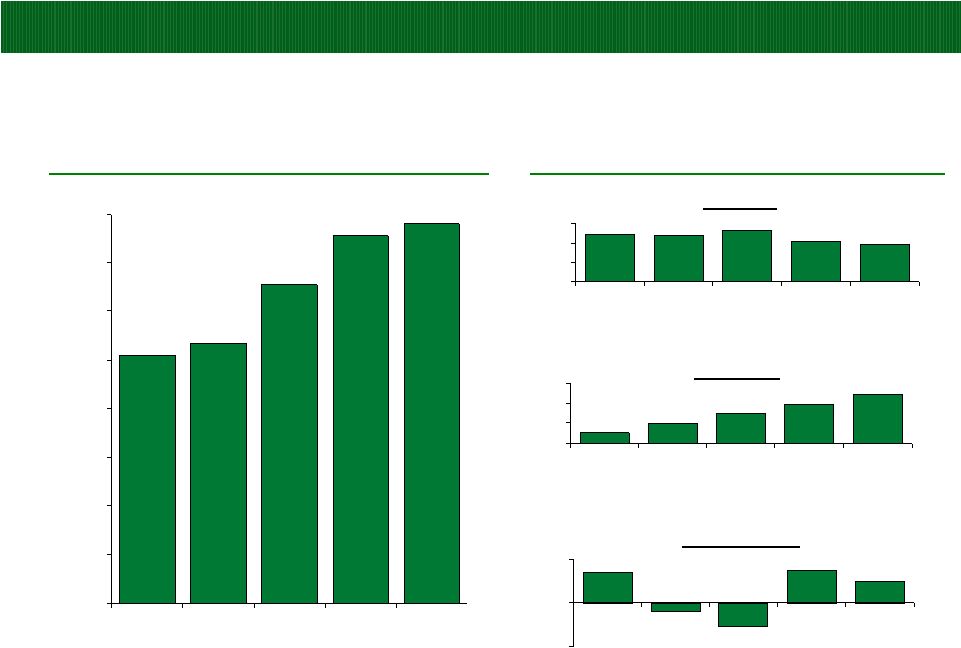
Attractive Timber Inventory & Harvest Profile
Allows active management of harvest
volumes to correspond with the
strength or weakness in timber prices
Attractive distribution of timber across
age-classes
Flexibility to monetize sawlog or pulpwood
harvests
Overall, harvest volume increasing
over time
4.2 million tons estimated in 2011
4.6
-
4.8
million
tons
expected
in
2
-
3
years
Highly leveraged to sawlog pricing
$7/ton price increase in 2010 produced
incremental EBITDDA of $21 million
Fee Harvest Log Volume
Timber Prices
3.0
3.3
3.3
3.9
4.4
3.8
~4.6
$/Ton
Tons in millions
4.2
4.2 |
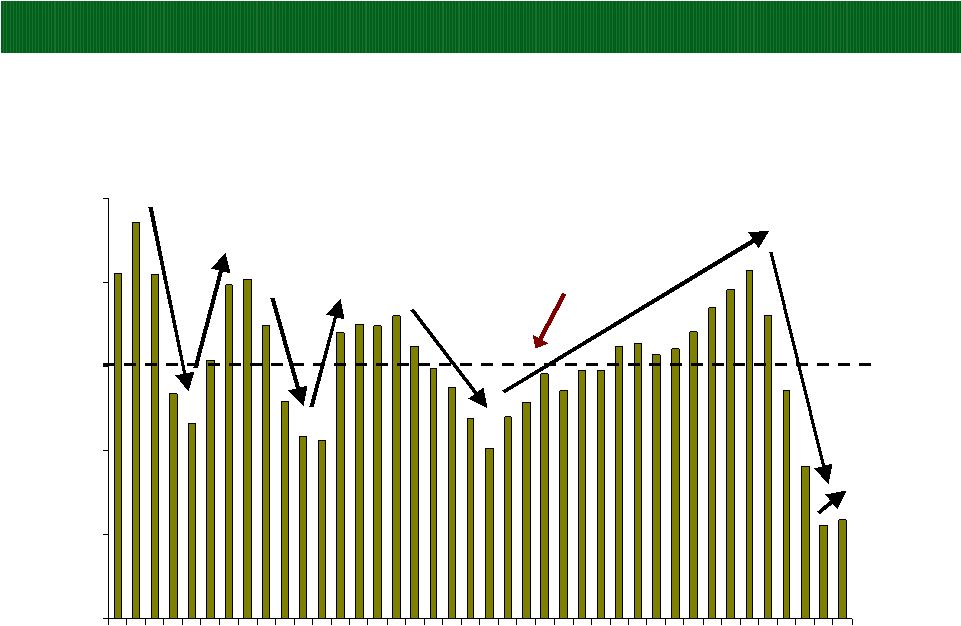 POTLATCH CORPORATION
7
Total Housing Starts
Housing starts are presently far below the long-term average
(in thousands)
Source: U.S. Census Bureau
0
500
1,000
1,500
2,000
2,500
71
73
75
77
79
81
83
85
87
89
91
93
95
97
99
01
03
05
07
09
Year
Average Starts Since 1971:
1.5 million |
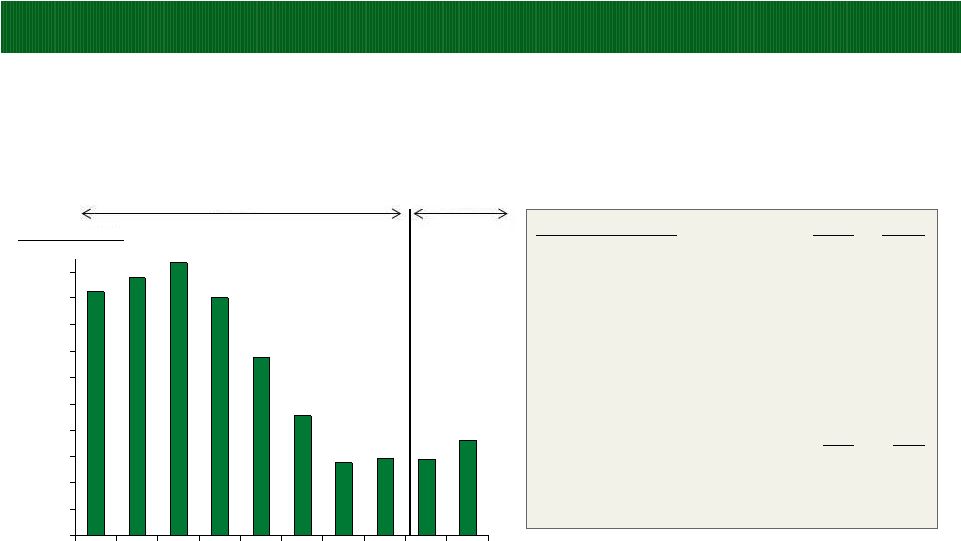 POTLATCH CORPORATION
Million U.S. Starts
0.0
0.2
0.4
0.6
0.8
1.0
1.2
1.4
1.6
1.8
2.0
'03
'04
'05
'06
'07
'08
'09
'10
'11
'12
U.S. Housing Starts Forecast
Single Family & Multifamily Only
Source: APA: Housing Starts: June 2011
(1)
RBC: Royal Bank of Canada
(2)
FEA: Forest Economic Advisors
(3)
NAR: National Association of Realtors
Actual
Forecast
8
Forecasts (000)
2011
2012
RBC
(1)
-July 15
600
799
Wells Fargo-June 29
590
760
NAHB-June 29
589
775
FEA
(2)
-June 30
587
726
NAR
(3)
-July
6
584
768
RISI-June 30
580
630
Mesirow Financial-July 11
570
710
APA-June 15
545
630
Average
581
725
*FEA:
Forest Economic Advisors. *NAR: National Assoc. of Realtors.
*RBC: Royal Bank of Canada |
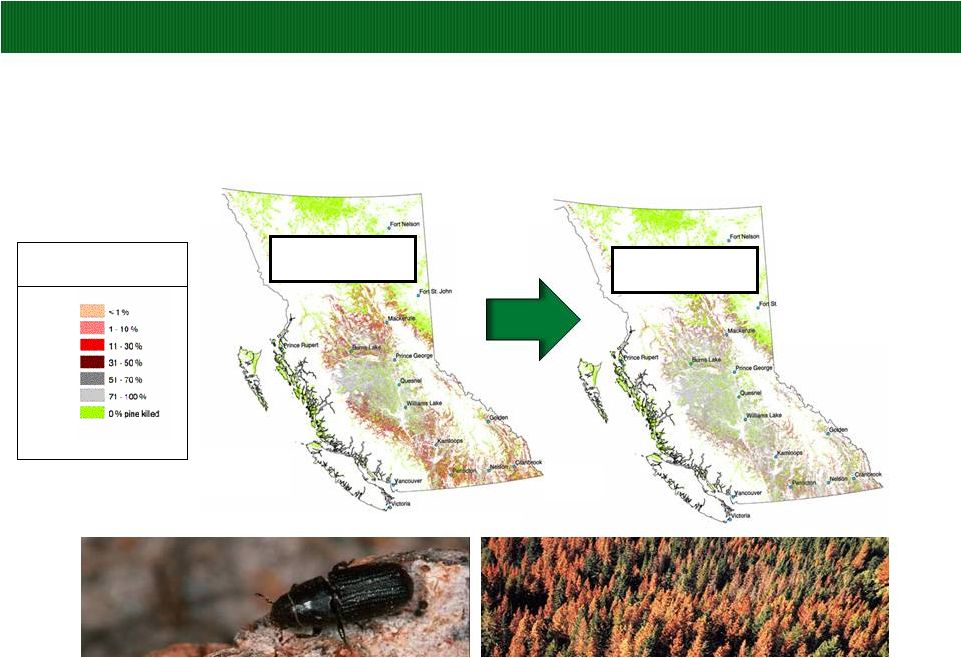 POTLATCH CORPORATION
Impact of the Pine Beetle on North American Lumber Supply
Source:
British Columbia Ministry of Forest and Range
9
Combined with Eastern Canadian harvest reductions of 20%, the pine beetle in British
Columbia is projected to lower North American lumber supply up to 15% over
the next few years, depending on lumber price levels.
Cumulative Percentage of
Pine Killed
British Columbia
2013
British Columbia
2009 |
 POTLATCH CORPORATION
10
North American Exports of Lumber to China as a % of North American Production
Actual
0.2%
0.5%
1.0%
2.6%
4.6%
6.4%
7.6%
7.5%
0%
1%
2%
3%
4%
5%
6%
7%
8%
9%
2006
2007
2008
2009
2010
2011
2012
2013
Forecast
Source: RISI North American Lumber Forecast, May 2011 & Potlatch Internal Forecast.
|
 POTLATCH CORPORATION
0
50
100
150
200
250
300
1990
1994
1998
2002
2006
2010
2014
2018
2022
2026
2030
2034
U.S. Biomass Consumed to Produce Electricity
(1)
(Millions Green Tons)
11
Actual
Forecast
(1) EIA Annual Energy Outlook 2011 & Potlatch Estimates.
|
 POTLATCH CORPORATION
Random Lengths Pricing for KD SYP (West) #2 2x6
($/MBF)
12
$150
$200
$250
$300
$350
$400
$450
2007
2008
2009
2010
2006
2005
2011
(1)
(1) Pricing through July 2011. |
 POTLATCH CORPORATION
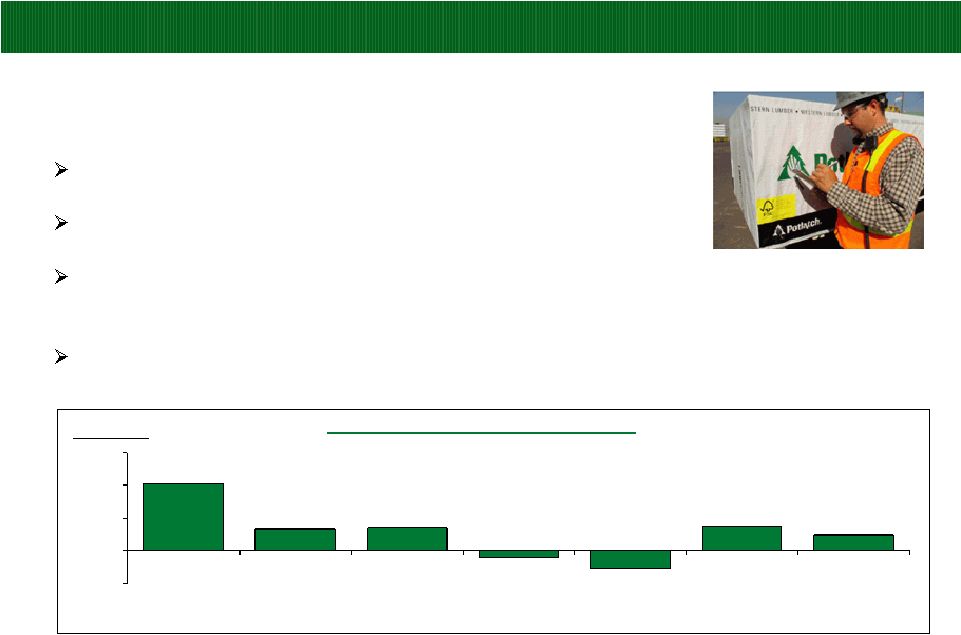
Wood Products Segment
$41
$13
$14
($4)
($11)
$15
$10
-$20
$0
$20
$40
$60
2005
2006
2007
2008
2009
2010
LTM
Q2 2011
13
Five manufacturing facilities, lumber and plywood
Sell to wholesalers for use in homebuilding and construction
Potlatch operates four sawmills in Idaho, Arkansas, Minnesota and Michigan as
well as one industrial-grade plywood mill in Idaho
Actively manage output of facilities to match supply and demand
$ in millions
(1)
(2)
Note: See page 36 of this presentation for the definition of segment EBITDDA, and page 30
for reconciliation to most comparable GAAP measure. (1)
Wood Products EBITDDA excludes $31 million for Canadian lumber settlement.
(2)
Wood Products EBITDDA includes asset impairment charge of $3 million.
Wood Products Segment EBITDDA |
 POTLATCH CORPORATION
14
Rural Real Estate
~95,000 acres
Frequently assess acreage to maximize
value through sale of non-core timberland
real estate
More than 3,000 miles of desirable water
frontage
More than 9 million people live within three
states of ownership
Potlatch Timberlands
(1)
Core Timberland
~1.2 million acres
Non-Strategic Timberland
~15,000 acres
HBU/Development
~125,000 acres
Land Portfolio
Idaho:
818,000 acres
Arkansas:
408,000 acres
Minnesota:
228,000 acres
(1)
As of June 30, 2011.
Real Estate Overview
Coeur d’Alene
Boise
Sun Valley
McCall
Little Rock
Hot Springs
Brainerd
Minneapolis
St. Paul |
 POTLATCH CORPORATION
15
Value Opportunities Are Unique to Each Category
CONSERVATION
EASEMENT
NON-STRATEGIC
TIMBERLAND
RURAL REAL
ESTATE
HIGHER-BETTER-USE
DEVELOPMENT
$400 to $1,000 per acre
$500 to $1,500 per acre
$1,000 to $1,500 per acre
$2,000 to $7,000 per acre
120,000
Opportunity dependent
10,000 to 20,000 acres
90,000 to 100,000 acres
120,000 to 130,000 acres
Characteristics:
-
Habitat related
-
Appropriate payment for
opportunity sold
-
Selective core lands
Characteristics:
-
Fringe of ownership
-
Location disadvantage
-
Higher operation cost
-
Capital allocation focus
Characteristics:
-
Fringe of ownership
-
Opportunity varies by
geographic market
-
Location disadvantage
-
Higher operation cost
-
Capital allocation focus
Characteristics:
-
Market position
properties
-
Investor interest
-
Explore proper land use
and entitlements
-
Emerging development
focus
LOWER VALUE
OPPORTUNITIES
HIGHER VALUE
OPPORTUNITIES |
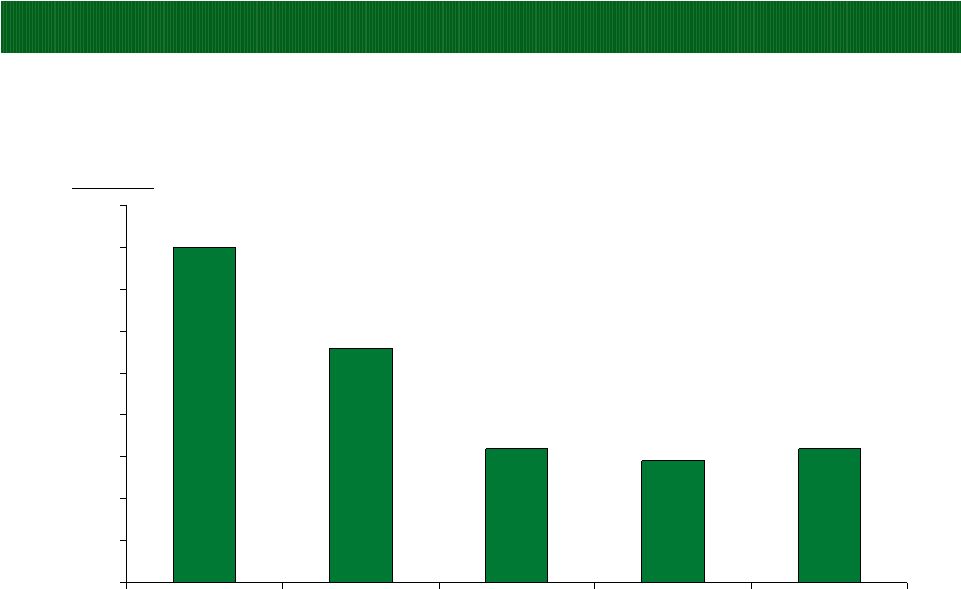
 POTLATCH CORPORATION
16
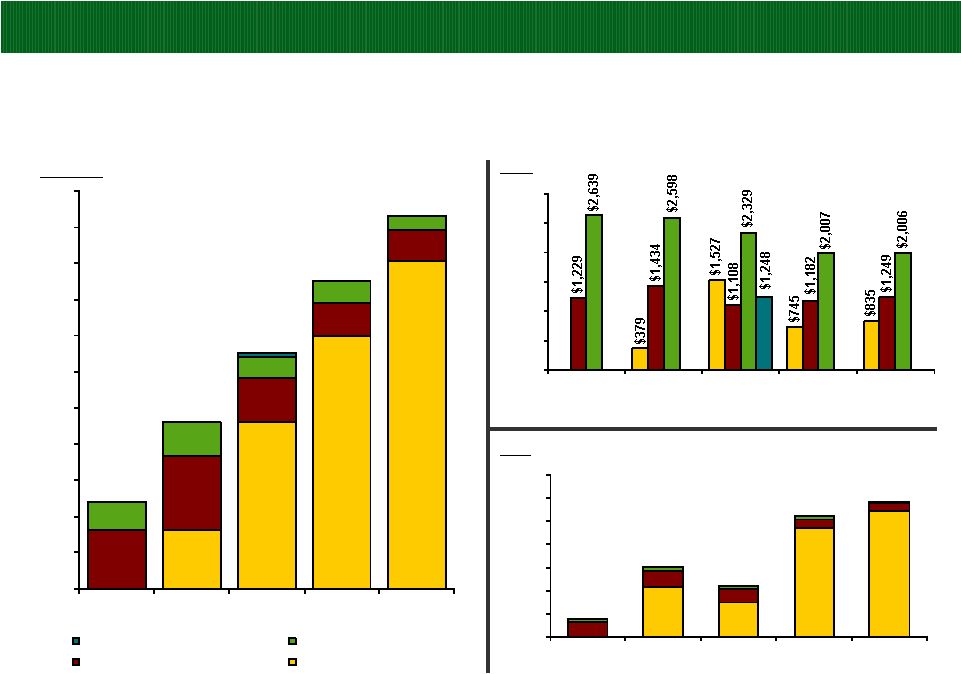
Significant Real Estate Portfolio
Realization of Non-Core Timberland Asset Value
$24.1
$46.1
$65.4
16,175
60,669
44,786
(1)
Segment Revenue in 2008 excludes sale of building.
(2)
Excludes the sale of the Boardman, Oregon tree farm of 17,000 acres.
$ in millions
$85.2
104,737
(2)
$103.3
117,482
16.3
46.1
70.1
90.8
16.2
20.5
12.5
9.2
8.4
7.9
9.3
5.6
5.9
4.1
1.2
$0
$10
$20
$30
$40
$50
$60
$70
$80
$90
$100
$110
2007
2008
2009
2010
LTM
Q2 2011
Segment Revenue
Conservation Easement
HBU/Development
Rural Real Estate
Non-Strategic Timberland
$0
$500
$1,000
$1,500
$2,000
$2,500
$3,000
2007
2008
2009
2010
LTM
Q2 2011
$/Acre
Price Per Acre
42,841
30,168
93,974
108,721
13,166
14,266
11,234
7,796
6,698
3,009
3,562
2,430
2,967
2,063
954
0
20,000
40,000
60,000
80,000
100,000
120,000
140,000
2007
2008
2009
2010
LTM
Q2 2011
Acres
Acres Sold
(1) |
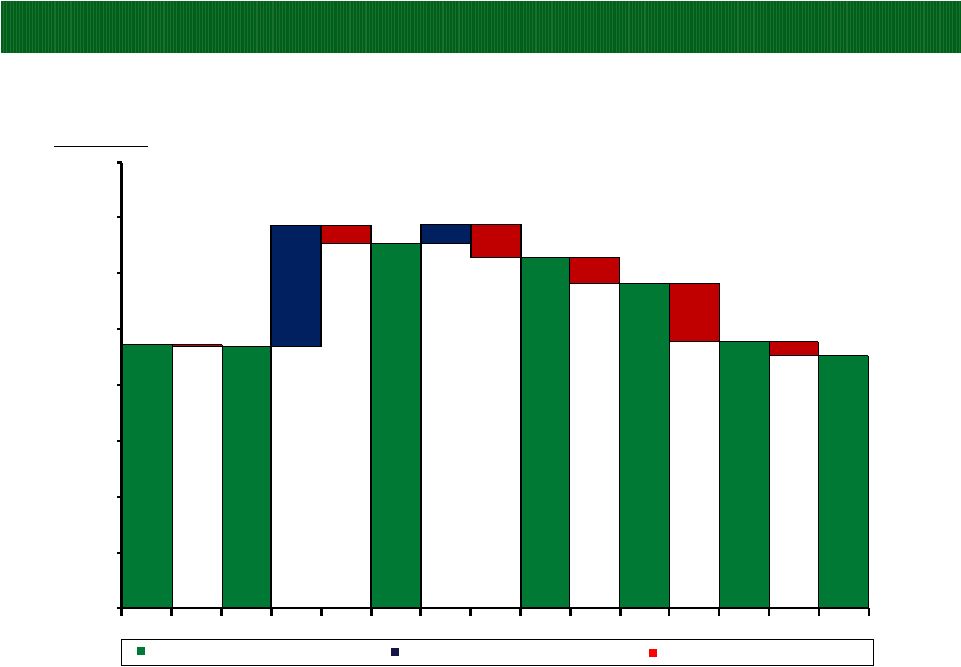 POTLATCH CORPORATION
Potlatch Timberland Holdings
17
1,000
1,100
1,200
1,300
1,400
1,500
1,600
1,700
1,800
2005
2006
2007
2008
2009
1,471
(3)
1,468
218
1,653
36
(61)
1,628
(45)
1,583
(105)
1,478
Acres (000’s)
PCH Owned Acreage at End of Period
PCH Acquired Acreage During the Year
PCH Sold Acreage During the Year
2010
(33)
(1)
(1)
Includes the sale of the Boardman, Oregon tree farm of 17,000 acres.
(2)
Acreage through June 30, 2011.
(24)
2011
1,454
(2) |
 POTLATCH CORPORATION
18
Balance Sheet Review
ASSETS
Cash and short-term investments
75
$
Other current assets
64
Long-term assets
602
Total assets
741
$
LIABILITIES & EQUITY
Current liabilities
81
$
Long-term debt
343
Other liabilities
134
Total liabilities
558
Equity
183
Total liabilities & equity
741
$
June 30, 2011
($ in millions)
Strong credit metrics
$150
million
revolver
expiring
December
2013
(1)
$68 million of fixed rate debt swapped to
floating as of June 30, 2010
$63 million of floating rate debt outstanding
Maturities
in
2012
-
2018
6.8% weighted average cost of debt (including
interest rate swaps)
8.9 weighted average years to maturity
7.1% weighted average cost of debt (all at fixed rate)
(1) Per an amendment to our credit agreement, the revolver decreased to
$150 million from $250 million, effective February 4, 2011. |
 POTLATCH CORPORATION
19
Conservative Leverage and Interest Coverage Ratios
(1)
as of June 30, 2011
Financial
Actual
Covenant
6/30/2011
Requirements
55.4%
70.0%
16.9%
N/A
5.58x
2.75x
(2)
3.27x
(3)
3.00x
Debt
to
Total
Capitalization
(1)
Net Debt to Enterprise Value
LTM EBITDDA to Interest Expense
Collateral Coverage
(1)
Calculated per our bank credit agreement, using an accumulated other comprehensive loss
“AOCL” exclusion. Per an amendment to the credit agreement, the Minimum
Collateral Coverage ratio increased to 3.00 and the Maximum Funded Indebtedness to Capitalization
ratio increased to 70.0% effective as of February 4, 2011.
(2)
This requirement will increase to 3.00 on October 1, 2011. (3)
Updated for new appraisal dated June 15, 2011.
Note: We define net debt as the total of short-term and long-term debt less cash and
short-term investments, see page 31 for reconciliation. See page 36 of this presentation
for the definition of EBITDDA and page 30 for reconciliation to most comparable GAAP measure.
|
 POTLATCH CORPORATION
20
Strong Asset Coverage
Arkansas Timberland
408,000 Acres
Secured Idaho Timberland
352,000 Acres
Unsecured Idaho Timberland
466,000 Acres
Wisconsin
Timberland
1,000 Acres
Minnesota Timberland
228,000 Acres
Total
=
Approx.
1.5
Million
Acres
Represents 24% of our acres, but the
appraisal represents approximately
41% of our enterprise value
(1)
Updated for new appraisal dated June 15, 2011. The appraisal uses comparable
transactions and discounted cash flow analyses for purposes of the valuation. There is no assurance
that sales could be effected at the appraised values or as to the timing of sales.
The calculation of discounted cash flows involves projection of future market conditions, harvest levels
and
other
factors,
all
of
which
could
vary
materially
from
those
projected.
There
is
no
implication
that
the
company’s
other
timberlands
would
have
a
similar
value
per
acre.
(2)
Enterprise value is defined as market capitalization value plus net debt as of June
30, 2011. $150 million revolver requires collateral
Another $66 million of debt is secured pari-passu along with the
revolver The
$216
million
of
debt
is
secured
with
352,000
acres
of
‘core’
Idaho
Timberland
Appraisal
on
this
352,000
acres
=
$707
million
(1)
Compares
to
entire
Potlatch
enterprise
value
of
$1.7
billion
(2) |
 POTLATCH CORPORATION
Conservative Capital Structure –
Long Term Debt Maturity Profile
($ in millions)
21
Mandatory principal repayments of only $79 million through 2016
(1) $5 million maturity paid in January, 2011 with cash on hand.
(1)
$0
$22
$8
$21
$23
$5
$5
$14
$150
$0
$0
$3
$0
$66
$7
$43
$0
$50
$100
$150
$200
2011
2012
2013
2014
2015
2016
2017
2018
2019
2020
2021
2022
2023
2024
2025
2026 |
 POTLATCH CORPORATION
Strong Cash Flow Generation
($ in millions)
$102
$107
$131
$151
$156
$0
$20
$40
$60
$80
$100
$120
$140
$160
2007
2008
2009
2010
LTM
Q2 2011
22
Total
EBITDDA
$97
$95
$105
$83
$78
$0
$40
$80
$120
2007
2008
2009
2010
LTM
Q2 2011
Resource
$21
$41
$60
$79
$97
$0
$40
$80
$120
2007
2008
2009
2010
LTM
Q2 2011
Real Estate
$14
($4)
($11)
$15
$10
-$20
$0
$20
2007
2008
2009
2010
LTM
Q2 2011
Wood Products
Segment
EBITDDA
(1)
See page 36 of this presentation for the definition of EBITDDA and Segment EBITDDA,
and page 30 for a reconciliation to most comparable GAAP measures. (2)
Consolidated and Wood Products EBITDDA includes a $3 million asset impairment
charge taken in 2009. (2)
(2)
(1)
(1) |
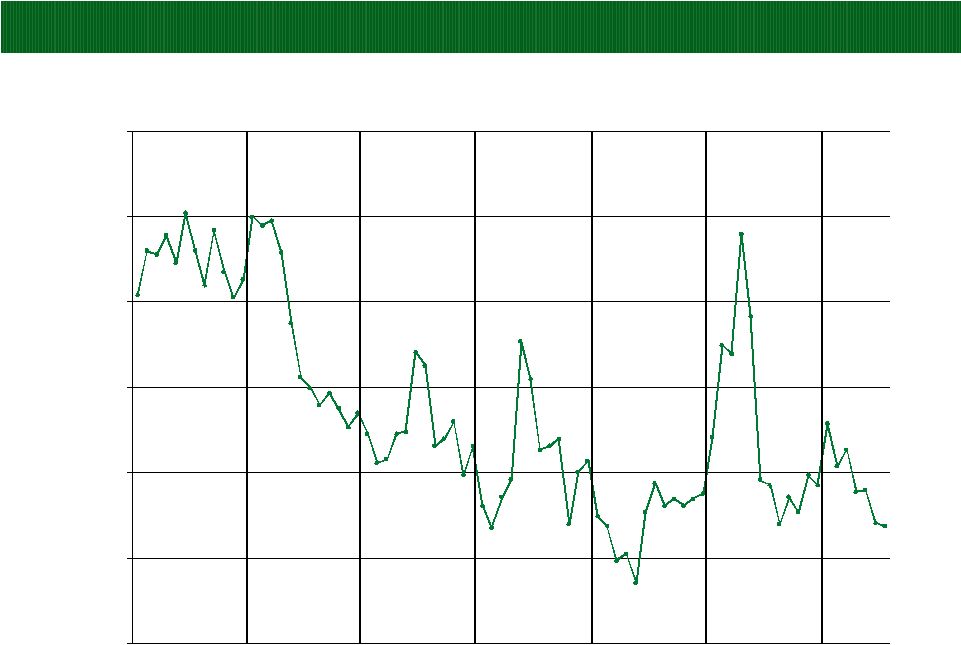
 POTLATCH CORPORATION
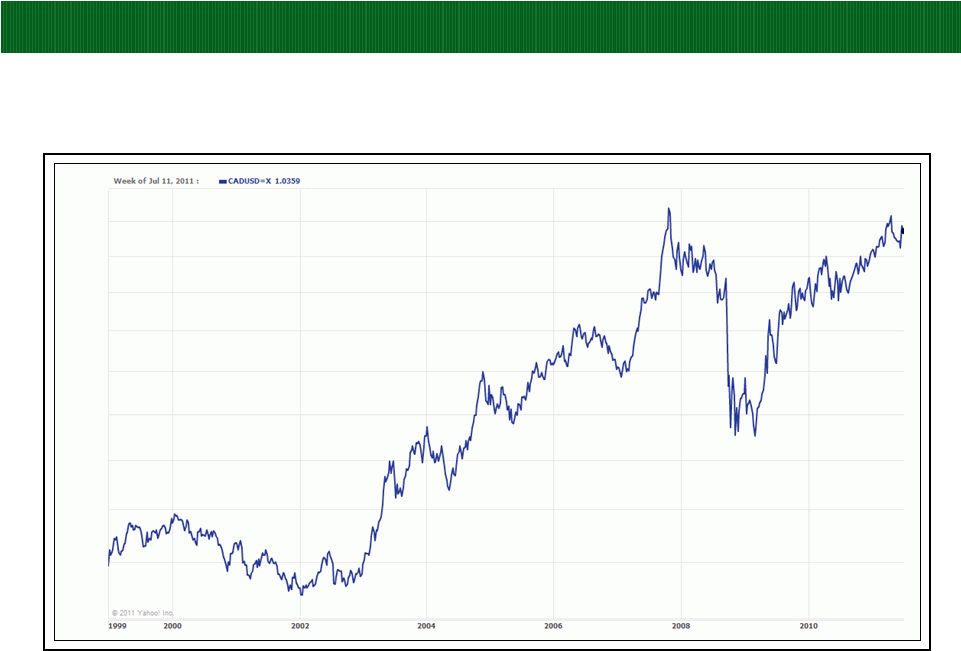
Exchange Rate
Canadian Dollar to U.S. Dollar
23
$1.05
$1.00
$0.95
$0.90
$0.85
$0.80
$0.75
$0.70
$0.65 |
 POTLATCH CORPORATION
Funds Available for Distribution (FAD)
($ in millions)
$85
$92
$111
$105
$112
$77
$81
$81
$82
$82
$0
$20
$40
$60
$80
$100
$120
2007
2008
2009
2010
LTM
Q2 2011
FAD
Dividend Distribution
24
Note:
See page 36 of this presentation for the definition of FAD, and see page 32 for a
reconciliation to most comparable GAAP measure. Excludes dividend distribution of
Clearwater Paper stock in 2008. |
 POTLATCH CORPORATION
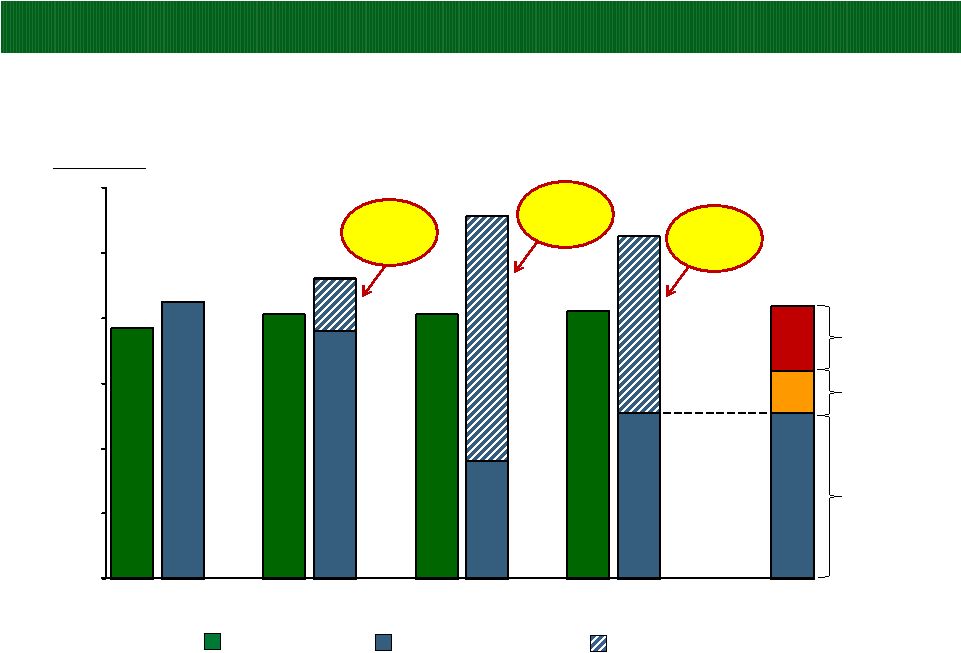
Organically Earning Our Dividend is Within Reach
25
$0
$20
$40
$60
$80
$100
$120
Dividend
"Organic" FAD
"Inorganic "FAD
2007
2008
2009
2010
~2-3 Years
Forward
Baseline:
2010 “Organic”
FAD
Impact of a 10%
increase in sawlog
prices from 2010
Impact of an increase
in the harvest level to
4.6 million tons
AR and WI
Non-Strategic
Timberland Sale
Timber Deed &
AR Non-Strategic
Timberland Sale
MN Non-Strategic
Timberland Sale
($ in millions)
Note:
See page 36 of this presentation for the definition of inorganic and organic FAD, and see page 32 for
a calculation organic/inorganic FAD. |
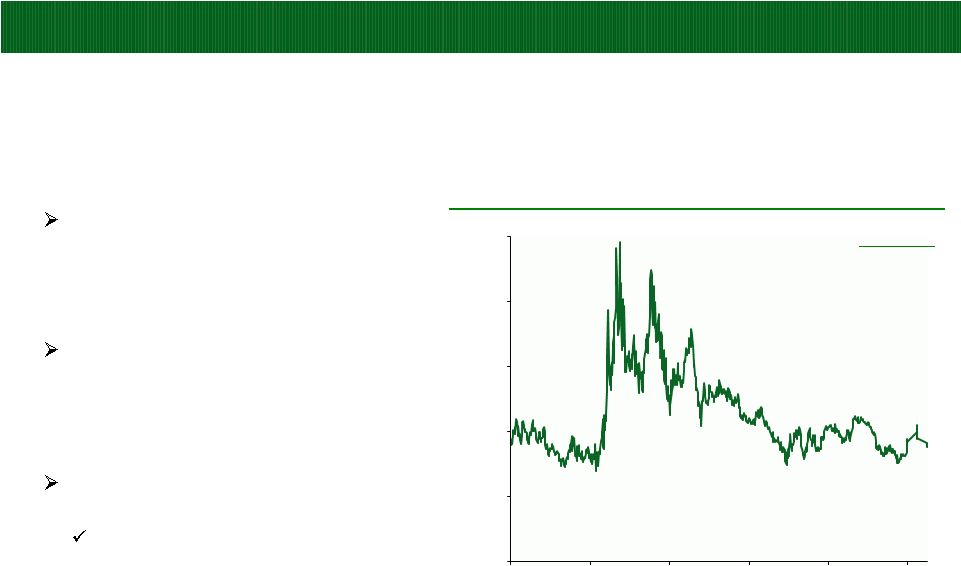 POTLATCH CORPORATION
26
Attractive Dividend
Potlatch's dividend policy has been
driven primarily by the performance
of its timber and real estate
businesses
We continue to pay our quarterly
dividend at $0.51/share since we
increased it from $0.49/share in Q3
2007
Our peers
(2)
have significantly
lower dividend yield (avg. = 3.7%)
At current dividend levels, a 3.7% yield
for Potlatch equates to $55 stock price
Source: Factset. Market data as of July 12, 2011.
(1)
Dividend yield calculated as annualized last quarter dividend divided by the
closing stock price. (2) Plum Creek and Rayonier.
Potlatch
Dividend
Yield
(1)
2.0%
4.0%
6.0%
8.0%
10.0%
12.0%
Jan-2008
Sep-2008
May-2009
Jan-2010
Sep-2010
May-2011
Avg. 6.4%
5.6% |
 POTLATCH CORPORATION
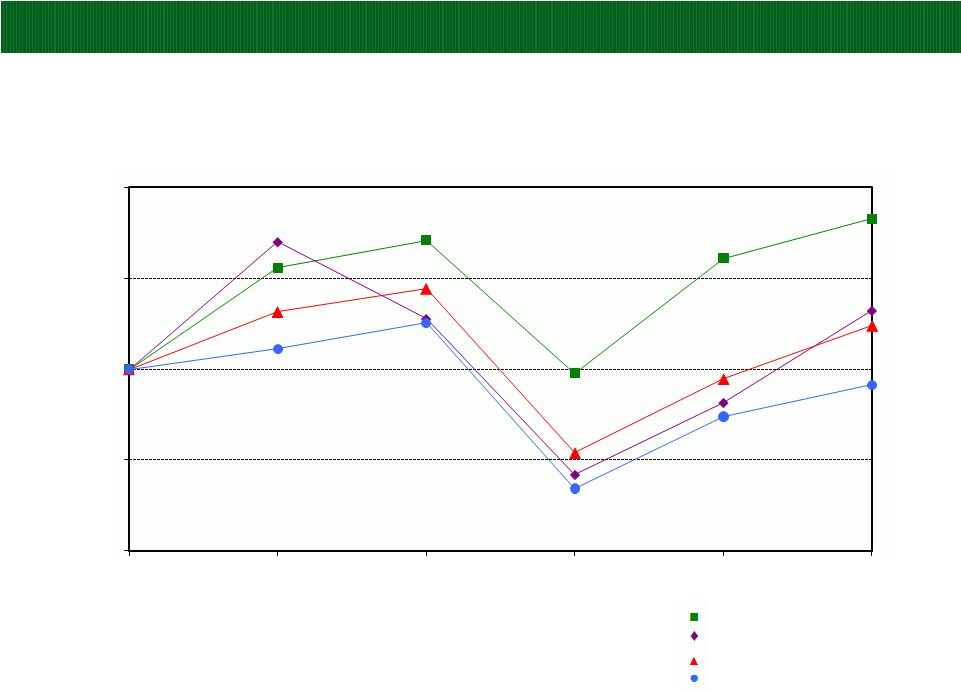
27
Stock Price Performance
Comparison
of
Five-Year
Total
Returns
(1)
Potlatch Corporation
NAREIT Equity Index
S&P 500 Composite
2010 Peer Group
(2)
(1) Assumes $100 was invested on December 31, 2005. Total return assumes
quarterly reinvestment of dividends. (2) Our
Peer
Group
companies
are
Deltic
Timber
Corp.;
Plum
Creek
Timber
Co.,
Inc.;
Rayonier
Inc.;
St.
Joe
Co.;
Universal
Forest
Products
Inc.;
and
Weyerhaeuser
Co.
$50
$75
$100
$125
$150
12/31/05
12/31/06
12/31/07
12/31/08
12/31/09
12/31/10 |
 POTLATCH CORPORATION
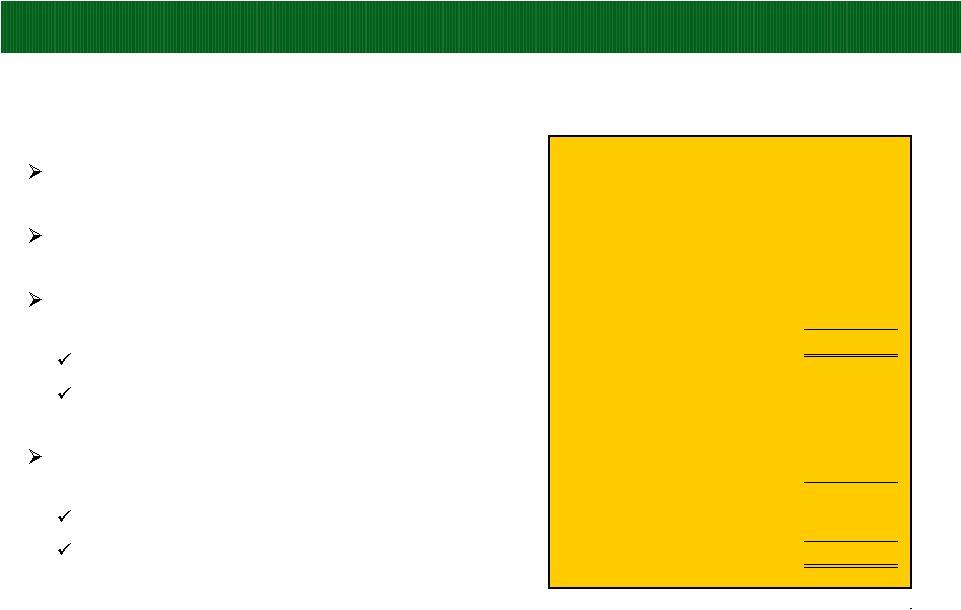
28
Conclusion
Potlatch maintains a very attractive asset base of 1.5 million acres of
timberland We have the ability to meaningfully expand high margin sawlog
harvest levels Wood Products business stabilized and generating solid cash
flow Real Estate segment low risk, high margin
Attractive dividend with improving coverage
Strong balance sheet with attractive debt cost and maturity profile
Industry trends beginning to turn positive
Housing starts beginning to grow, albeit slowly
Exports to China from North America continue to expand
Pine beetle to impact supply from Canada
Biomass continues to hold promise |
 Appendix
POTLATCH CORPORATION
AUGUST 2011 |
 POTLATCH
CORPORATION 30
EBITDDA and Segment EBITDDA Reconciliation
($ in millions)
(1)
Wood Products EBITDDA excludes $31 million for Canadian lumber settlement.
(2)
Consolidated and Wood Products EBITDDA includes a $3 million asset impairment charge taken in
2009. 2005
2006
(1)
2007
2008
2009
(2)
2010
LTM
Q2 2011
Consolidated
Earnings from continuing operations
74
$
73
$
81
$
40
$
43
$
Less:
Income tax benefit (provision)
17
25
16
(5)
(2)
Add:
Net cash interest expense
15
20
20
26
25
Depreciation, depletion, and amortization
26
30
35
31
31
Basis of real estate sold
4
9
11
49
55
Consolidated EBITDDA
102
$
107
$
131
$
151
$
156
$
Resource
Operating income
82
$
76
$
82
$
62
$
59
$
Depreciation, depletion, and amortization
15
19
23
21
19
Resource Segment EBITDDA
97
$
95
$
105
$
83
$
78
$
Real Estate
Operating income
17
$
32
$
49
$
30
$
43
$
Basis of real estate sold
4
9
11
49
54
Real Estate Segment EBITDDA
21
$
41
$
60
$
79
$
97
$
Wood Products
Operating income (loss)
29
$
2
$
4
$
(14)
$
(21)
$
7
$
2
$
Depreciation
12
11
10
10
10
8
8
Wood Products Segment EBITDDA
41
$
13
$
14
$
(4)
$
(11)
$
15
$
10
$
Fiscal Year |
 POTLATCH CORPORATION
31
Potlatch Net Debt Reconciliation
($ in millions)
June 30
2007
2008
2009
2010
2011
Long-term debt
321
$
221
$
368
$
363
$
343
$
Current installments on long-term debt
-
101
-
5
21
Current notes payable
110
129
-
-
-
Cash
(9)
(1)
(2)
(6)
(7)
Short-term investments
(22)
(3)
(53)
(85)
(68)
Net Debt
400
$
447
$
313
$
277
$
289
$
At December 31 |
 POTLATCH CORPORATION
32
Organic/Inorganic FAD Calculation
($ in millions)
(1) Excludes distribution of Clearwater Paper stock in 2008.
2007
2008
2009
2010
LTM
Q2 2011
Operating income (loss):
Resource
Baseline Income
82
$
76
$
82
$
62
$
59
$
62
$
Increase to 4.6 million tons
-
-
-
-
-
11
10% increase in sawlog prices from 2010
-
-
-
-
-
21
Resource
82
76
82
62
59
-
94
Real Estate
17
32
49
30
43
17
Wood Products
4
(14)
(21)
7
2
19
Eliminations and adjustments
1
(1)
8
2
2
-
104
93
118
101
106
130
Corporate administration
(32)
(25)
(33)
(30)
(34)
(32)
Net cash interest expense
(15)
(20)
(20)
(26)
(25)
(25)
Income tax benefit (provision)
17
25
16
(5)
(4)
(5)
Earnings from continuing operations
74
73
81
40
43
68
Depreciation, depletion and amortization
26
30
35
31
31
29
Basis of real estate sold
4
9
11
49
55
3
Capital expenditures
(19)
(20)
(16)
(15)
(17)
(18)
Funds Available for Distribution
85
$
92
$
111
$
105
$
112
$
82
$
Inorganic FAD:
Minnesota non-strategic sale (after tax income)
14
$
Basis of real estate sold
2
Arkansas non-strategic sale (after tax income)
24
$
Basis of real estate sold
2
Timber deed (after tax income)
42
Depletion
7
Arkansas/Wisconsin non-strategic sale (after tax income)
11
$
11
$
Basis of real estate sold
43
43
Total inorganic FAD
-
$
16
$
75
$
54
$
54
$
-
$
Organic FAD
85
$
76
$
36
$
51
$
58
$
82
$
Total FAD
85
$
92
$
111
$
105
$
112
$
82
$
Distributions
to
Common
Stockholders
(1)
77
$
81
$
81
$
82
$
82
$
82
$
~2-3 Years
Forward |
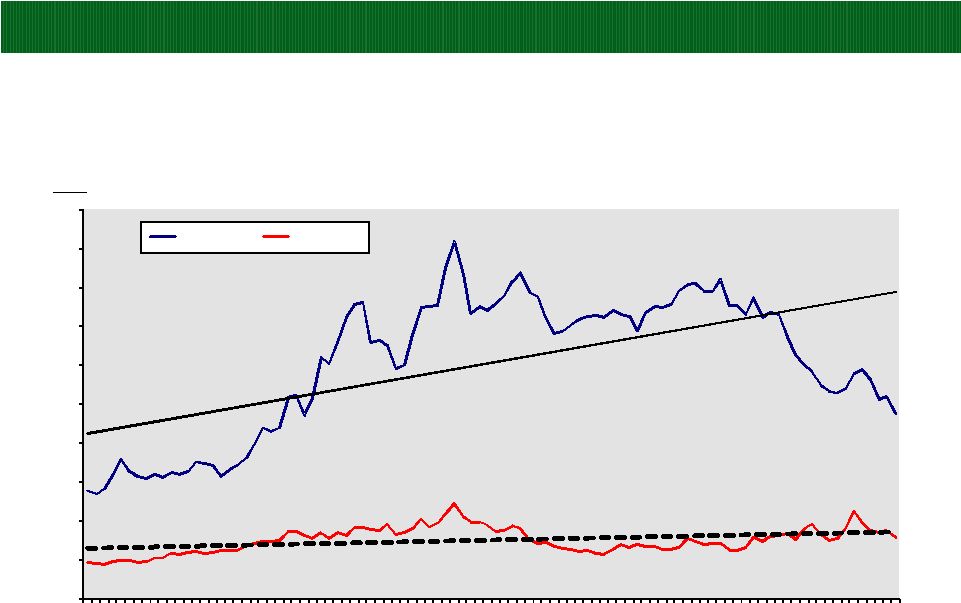 POTLATCH CORPORATION
33
Softwood Stumpage Price Trends
Southwide Average Nominal Prices
Source: Timber Mart-South, updated through June 30, 2011.
$0
$5
$10
$15
$20
$25
$30
$35
$40
$45
$50
1987
1989
1991
1993
1995
1997
1999
2001
2003
2005
2007
2009
$/Ton
Years
Pine Sawtimber
Pine Pulpwood
2010 |
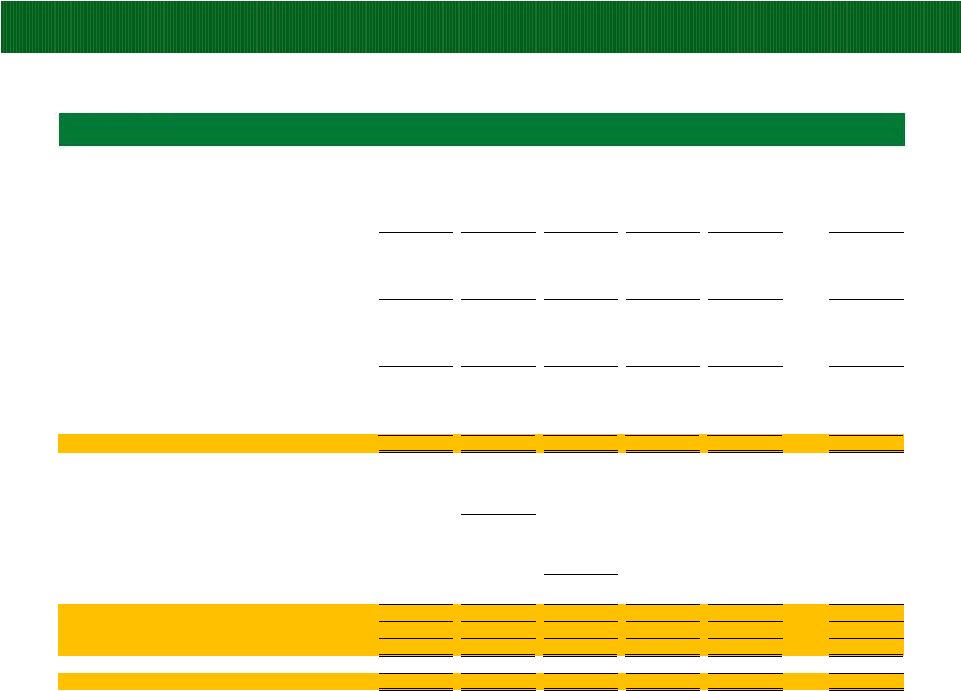
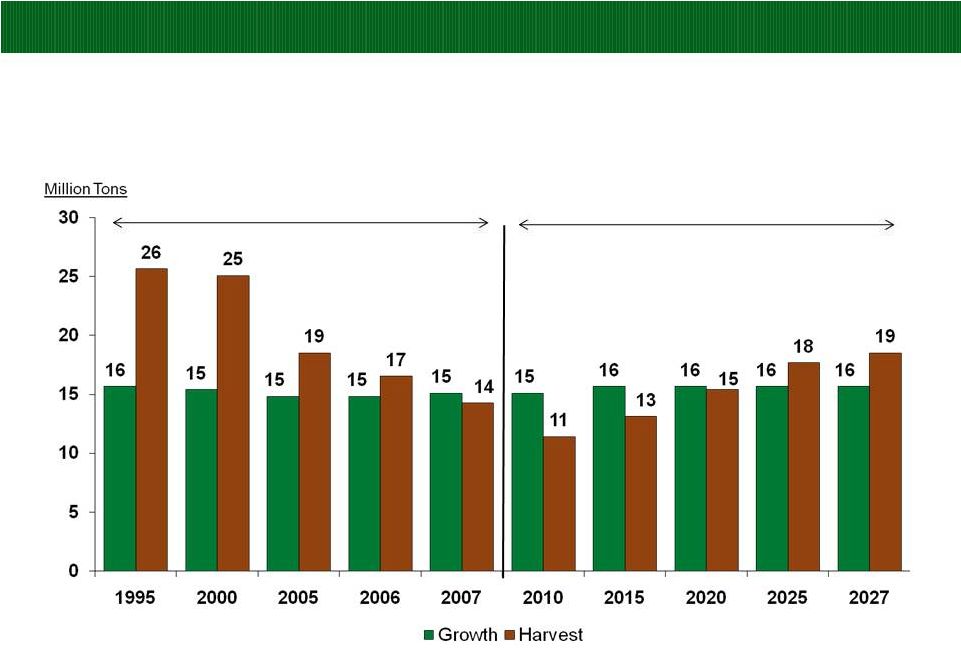 POTLATCH CORPORATION
Projected Inland Private Timber Growth and Harvest (1995-2027)
34
Source: F2M and Potlatch Corporation
Actual
Forecast |
 POTLATCH
CORPORATION Inland Private Sawtimber
Inventory –
Private Lands (1995-2007)
Inland West (Idaho, Eastern Washington, and Western Montana)
510
486
462
459
462
430
440
450
460
470
480
490
500
510
520
1995
2000
2005
2006
2007
Million Tons
35
Source: F2M and Potlatch Corporation |
 POTLATCH CORPORATION
,
,
,
36
Definitions of Non-GAAP Measures
EBITDDA
is
a
non-GAAP
measure
that
management
uses
to
evaluate
the
cash
generating
capacity
of
the
company.
The
most
directly
comparable
GAAP measure is net earnings. EBITDDA, as we define it, is net earnings from
continuing operations adjusted for net cash interest expense,
provision/benefit for income taxes, depreciation, depletion and amortization and
the basis of real estate sold from continuing operations. It should not
be considered as an alternative to net earnings computed under GAAP.
Funds
Available
for
Distribution
(FAD)
is
a
non-GAAP
measure.
FAD,
as
defined
in
the
indenture
governing
our
senior
notes,
is
earnings from
continuing operations, plus depreciation, depletion and amortization, plus basis of
real estate sold, and minus capital expenditures. For purposes of this
definition, capital expenditures exclude all expenditures relating to direct or indirect timberland purchases in excess of $5 million. We do not use
FAD
as,
nor
should
it
be
considered
to
be,
an
alternative
to
net
cash
provided
by
operating
activities
computed
under
GAAP
as
an
indicator
of
our
operating
performance,
or
as
an
indicator
of
our
ability
to
fund
our
cash
needs.
FAD,
as
defined
in
the
indenture
governing
our
senior
notes
may
not be
comparable with measures of similar titles reported by other companies.
Inorganic
FAD
as
used
in
this
presentation
is
FAD
from
certain
large
transactions.
Inorganic
FAD
equals
transaction
income
less
income
tax,
if
any,
plus depletion or basis of real estate sold.
Organic
FAD
as
used
in
this
presentation
is
calculated
by
subtracting
inorganic
FAD
from
Funds
Available
for
Distribution
(FAD),
as
defined
above.
Segment
EBITDDA
from
continuing
operations
as
we
define
it,
is
segment
operating
income
(loss)
adjusted
for
depreciation,
depletion,
amortization and the basis of real estate sold. |