Attached files
| file | filename |
|---|---|
| 8-K - 8-K - PARKER HANNIFIN CORP | d8k.htm |
| EX-99.1 - EX-99.1 - PARKER HANNIFIN CORP | dex991.htm |
 Parker Hannifin
Corporation Quarterly Earnings Release
4
th
Quarter and Total Year FY2011
August 2, 2011
Exhibit 99.2 |
| Forward-Looking Statements
Forward-Looking Statements:
Forward-looking statements contained in this and other written and oral reports
are made based on
known
events
and
circumstances
at
the
time
of
release,
and
as
such,
are
subject
in
the
future to unforeseen uncertainties and risks. All statements regarding future
performance, earnings projections, events or developments are
forward-looking statements. It is possible that the future performance
and earnings projections of the company, including its individual segments,
may differ materially from current expectations, depending on economic conditions
within its mobile, industrial and aerospace markets, and the company's ability to
maintain and achieve anticipated benefits associated with announced
realignment activities, strategic initiatives to improve operating margins,
actions taken to combat the effects of the current economic
environment,
and
growth,
innovation
and
global
diversification
initiatives.
A
change
in
economic conditions in individual markets may have a particularly volatile effect
on segment performance. Among other factors which may affect future
performance are: changes in business relationships with and purchases by or
from major customers, suppliers or distributors, including delays or
cancellations in shipments, disputes regarding contract terms or significant
changes in financial condition, changes in contract cost and revenue estimates for
new development programs and changes in product mix; uncertainties
surrounding timing, successful
completion
or
integration
of
acquisitions;
ability
to
realize
anticipated
cost
savings
from business realignment activities; threats associated with and efforts to combat
terrorism; uncertainties
surrounding
the
ultimate
resolution
of
outstanding
legal
proceedings,
including
the
outcome of any appeals; competitive market conditions and resulting effects on
sales and pricing; increases in raw material costs that cannot be recovered
in product pricing; the company’s ability to manage costs related to
insurance and employee retirement and health care benefits; and global
economic factors, including manufacturing activity, air travel trends,
currency exchange rates, difficulties entering new markets and general economic
conditions such as inflation, deflation, interest rates and credit
availability. The company makes these statements as of the date of this
disclosure, and undertakes no obligation to update them unless otherwise
required by law. Slide 2 |
| Non-GAAP Financial Measures
This presentation reconciles sales amounts reported in accordance
with U.S. GAAP to sales amounts adjusted to remove the effects of
acquisitions
made
within
the
prior
four
quarters
and
the
effects
of
currency exchange rates on sales. This presentation also reconciles
cash flow from operating activities as a percent of sales in accordance
with U.S. GAAP to cash flow from operating activities as a percent of
sales without the effect of a discretionary pension plan contribution.
The effects of acquisitions, currency exchange rates and the
discretionary pension plan contribution are removed to allow investors
and the company to meaningfully evaluate changes in sales and cash
flow from operating activities as a percent of sales on a comparable
basis from period to period.
Slide 3 |
| Slide 4
Discussion Agenda
CEO 4
th
Quarter and Total Year Highlights
Key Performance Measures & Outlook
Questions & Answers
CEO Closing Comments |
| 4th Quarter &
Total Year FY11 Highlights Total Year FY11:
Sales
Growth:
All-time
Record
Sales
of
$12.3B,
increased
23.5%
Year-
over-Year
Operating
Margins:
All-time
Record
Total
Segment
Operating
Margin
of
14.8%
Net
Income
&
EPS:
Achieved
All-time
Record
Net
Income,
EPS
increased 87%
4
Quarter
FY11:
Sales
Growth:
Q4
Record
Sales,
an
Increase
of
22%
Year-over-Year
Net
Income:
Achieved
All-time
Record
Net
Income,
EPS
and
Net
Income/Sales
Operating
Margins:
Total
Segment
Operating
Margin
of
14.8%
Continued Strong Cash Flow:
FY11 Operating Cash Flow/Sales of 9.5%; 12.7% Excluding $400M
Discretionary Pension Plan Contribution
Increased Dividend Payout by 42% and Share Repurchase Totaled
$693M in FY11
Slide 5
th |
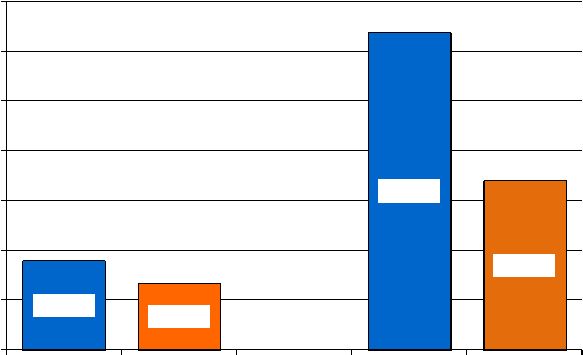 Slide 6
Financial Highlights
Diluted Earnings per Share
4
th
Quarter and Total Year
$1.79
$1.35
$6.37
$3.40
$.00
$1.00
$2.00
$3.00
$4.00
$5.00
$6.00
$7.00
Q4 FY11
Q4 FY10
FY11
FY10 |
 Influences
on
4
Quarter
Earnings
Diluted Earnings Per Share Increase of $.44 Year-over-Year
Driven By:
Increased Sales of 22%
Improved Segment Operating Income ($.54 EPS Impact)
Margins Improved to 14.8% from 13.9% Year-over-Year
Lower Corporate Tax Rate ($.02 EPS Impact)
Fewer Shares Outstanding ($.01 EPS Impact)
Offset by:
Net
Increase
in
Expenses
Below
Segment
Operating
Income
($.12 EPS Impact)
Higher Non-controlling Interests ($.01 EPS Impact)
Slide 7
th |
 Influences on Total
Year FY11 Earnings Diluted Earnings Per Share Increase of $2.97 Year-over-
Year Driven By:
Increased Sales of 24%
Improved Segment Operating Income ($3.08 EPS Impact)
Margins Improved to 14.8% from 11.4% Year-over-Year
Lower Corporate Tax Rate ($.09 EPS Impact)
Offset by:
Net
Increase
in
Expenses
Below
Segment
Operating
Income
($.10 EPS Impact)
Increased Diluted Shares Outstanding ($.07 EPS Impact)
Higher Non-controlling Interests ($.03 EPS Impact)
Slide 8 |
 Slide 9
Financial Highlights
Sales –
4
th
Quarter and Total Year
Dollars in millions
FY2011
%
Change
FY2010
FY2011
%
Change
FY2010
Sales
As reported
3,410
$
22.4 %
2,786
$
12,346
$
23.5 %
9,993
$
Acquisitions
21
0.7 %
54
0.5 %
Currency
185
6.7 %
205
2.0 %
Adjusted Sales
3,204
$
15.0 %
12,087
$
21.0 %
Operating Margin
As reported
503
$
388
$
1,823
$
1,143
$
% of Sales
14.8 %
13.9 %
14.8 %
11.4 %
4th Quarter
Total Year |
 Slide 10
Segment Reporting
Industrial North America
Dollars in millions
FY2011
%
Change
FY2010
FY2011
%
Change
FY2010
Sales
As reported
1,227
$
18.6 %
1,034
$
4,517
$
24.6 %
3,624
$
Acquisitions
11
1.0 %
24
0.7 %
Currency
9
0.9 %
24
0.6 %
Adjusted Sales
1,207
$
16.7 %
4,469
$
23.3 %
Operating Margin
As reported
207
$
163
$
746
$
487
$
% of Sales
16.9 %
15.7 %
16.5 %
13.4 %
4th Quarter
Total Year |
 Slide 11
Segment Reporting
Industrial International
Dollars in millions
FY2011
%
Change
FY2010
FY2011
%
Change
FY2010
Sales
As reported
1,384
$
33.8 %
1,034
$
4,917
$
29.0 %
3,811
$
Acquisitions
7
0.6 %
15
0.4 %
Currency
164
15.9 %
168
4.4 %
Adjusted Sales
1,213
$
17.3 %
4,734
$
24.2 %
Operating Margin
As reported
203
$
140
$
754
$
394
$
% of Sales
14.7 %
13.6 %
15.3 %
10.3 %
4th Quarter
Total Year |
 Slide 12
Segment Reporting
Aerospace
Dollars in millions
FY2011
%
Change
FY2010
FY2011
%
Change
FY2010
Sales
As reported
522
$
9.3 %
478
$
1,922
$
10.2 %
1,744
$
Acquisitions
0
0.0 %
3
0.2 %
Currency
2
0.4 %
0
0.0 %
Adjusted Sales
520
$
8.9 %
1,919
$
10.0 %
Operating Margin
As reported
71
$
64
$
247
$
208
$
% of Sales
13.6 %
13.4 %
12.9 %
11.9 %
4th Quarter
Total Year |
 Slide 13
Segment Reporting
Climate & Industrial Controls
Dollars in millions
FY2011
%
Change
FY2010
FY2011
%
Change
FY2010
Sales
As reported
277
$
15.2 %
240
$
990
$
21.7 %
814
$
Acquisitions
3
1.4 %
12
1.5 %
Currency
10
4.1 %
13
1.6 %
Adjusted Sales
264
$
9.7 %
965
$
18.6 %
Operating Margin
As reported
23
$
21
$
76
$
53
$
% of Sales
8.1 %
8.5 %
7.7 %
6.6 %
4th Quarter
Total Year |
 Slide 14
Parker Order Rates
Excludes Acquisitions & Currency
3-month year-over-year comparisons of total dollars, except Aerospace
Aerospace is calculated using a 12-month moving average
JUN '11
MAR '11
JUN '10
MAR '10
Total Parker
15 %
+
24 %
+
35 %
+
23 %
+
Industrial North America
11 %
+
20 %
+
46 %
+
30 %
+
Industrial International
18 %
+
22 %
+
46 %
+
42 %
+
Aerospace
27 %
+
44 %
+
3 %
-
22 %
-
Climate & Industrial Controls
1 %
+
14 %
+
35 %
+
38 %
+
Three Month Rolling at Period End |
| Slide 15
Balance Sheet Summary
Cash
Working capital
-
Accounts receivable
-
Inventory
-
Accounts payable |
 Strong Cash
Flow Cash from Operating Activities
4
Quarter
and
Total
Year
Slide 16
th
Q4 Cash From Operating Activities
Q4 '11
Q4 '10
As Reported
$367M
$377M
As Reported % Sales
10.8%
13.5%
Pension Plan Contribution
$200M
-0-
Adjusted Cash From Operating Activities
$567M
$377M
Adjusted % Sales
16.6%
13.5%
Full Year Cash from Operating Activities:
FY '11
FY '10
As Reported
$1,167M
$1,219M
As Reported % Sales
9.5%
12.2%
Pension Plan Contribution
$400M
$100M
Adjusted Cash From Operating Activities
$1,567M
$1,319M
Adjusted % Sales
12.7%
13.2% |
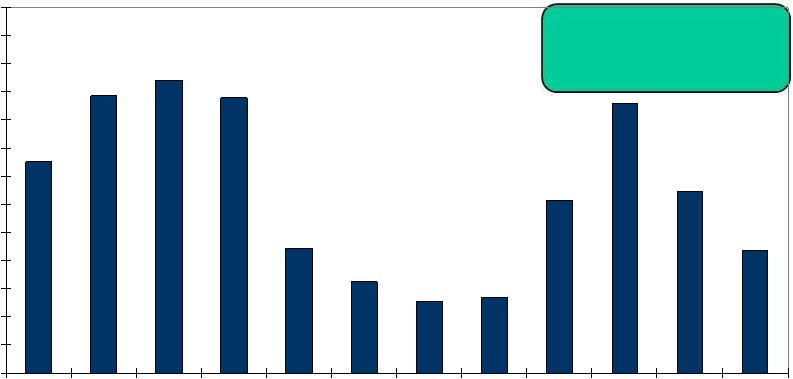 Slide 17
Financial Leverage
24.7%
Debt to Debt Equity
24.7%
16.0%
18.0%
20.0%
22.0%
24.0%
26.0%
28.0%
30.0%
32.0%
34.0%
36.0%
38.0%
40.0%
42.0%
FY00
FY01
FY02
FY03
FY04
FY05
FY06
FY07
FY08
FY09
FY10
FY11
Debt to Debt Equity |
 Slide 18
FY 2012 Earnings Outlook Assumptions
Segment Sales & Operating Margins
FY 2012 Sales change versus FY 2011
Industrial North America
4.2 %
--
8.2 %
Industrial International
8.6 %
--
12.6 %
Aerospace
3.0 %
--
6.0 %
Climate & Industrial Controls
3.6 %
--
7.6 %
FY 2012 Operating margin percentages
Industrial North America
16.5 %
--
17.1 %
Industrial International
15.2 %
--
15.8 %
Aerospace
13.0 %
--
13.3 %
Climate & Industrial Controls
8.8 %
--
9.3 % |
 Slide 19
FY 2012 Earnings Outlook Assumptions
below Operating Margin (+/-
4.0%)
Expenses Below Segment Operating Margin*
$425M at Midpoint
Tax Rate = 28%
*Corporate Admin, Interest and Other Expense (Income)
|
| Slide 20
Earnings Outlook –
FY12
Low
High
Diluted earnings per share
6.70
$
7.50
$ |
 Slide 21
Questions & Answers... |
 Appendix
Income Statement
4
th
Quarter FY2011
Total Year FY2011 |
 Slide 23
Income Statement –
4
Quarter
Dollars in millions
% of Sales
% of Sales
Net Sales
3,409.8
$
100.0 %
2,786.5
$
100.0 %
Cost of sales
2,590.8
76.0 %
2,114.2
75.9 %
Gross profit
819.0
24.0 %
672.3
24.1 %
S, G & A
413.4
12.1 %
349.3
12.5 %
Interest expense
24.8
.7 %
26.9
1.0 %
Other (income) expense, net
(.6)
(.0)%
3.9
.1 %
Income before taxes
381.4
11.2 %
292.2
10.5 %
Income taxes
86.7
2.5 %
69.1
2.5 %
Net income
294.7
$
8.7 %
223.1
$
8.0 %
Less: Noncontrolling interests
2.5
$
.1 %
.9
$
.0 %
Net income attributable to common
shareholders
292.2
$
8.6 %
222.2
$
8.0 %
FY 2011
FY 2010
th |
 Slide 24
Income Statement –
Total Year
Dollars in millions
% of Sales
% of Sales
Net Sales
12,345.9
$
100.0 %
9,993.2
$
100.0 %
Cost of sales
9,387.5
76.0 %
7,847.1
78.5 %
Gross profit
2,958.4
24.0 %
2,146.1
21.5 %
S, G & A
1,467.8
11.9 %
1,277.1
12.8 %
Interest expense
99.7
.8 %
103.6
1.0 %
Other (income) expense, net
(22.8)
(.2)%
10.6
.1 %
Income before taxes
1,413.7
11.5 %
754.8
7.6 %
Income taxes
356.6
2.9 %
198.4
2.0 %
Net income
1,057.1
$
8.6 %
556.4
$
5.6 %
Less: Noncontrolling interests
8.0
$
.1 %
2.3
$
.1 %
Net income attributable to common
shareholders
1,049.1
$
8.5 %
554.1
$
5.5 %
FY 2011
FY 2010 |