Attached files
| file | filename |
|---|---|
| 8-K - FORM 8-K - Simplicity Bancorp, Inc. | t71241_8k.htm |
Exhibit 99.1
 |
Dustin Luton - President & CEO Kaiser Federal Financial Group (KFFG) August 2011
|
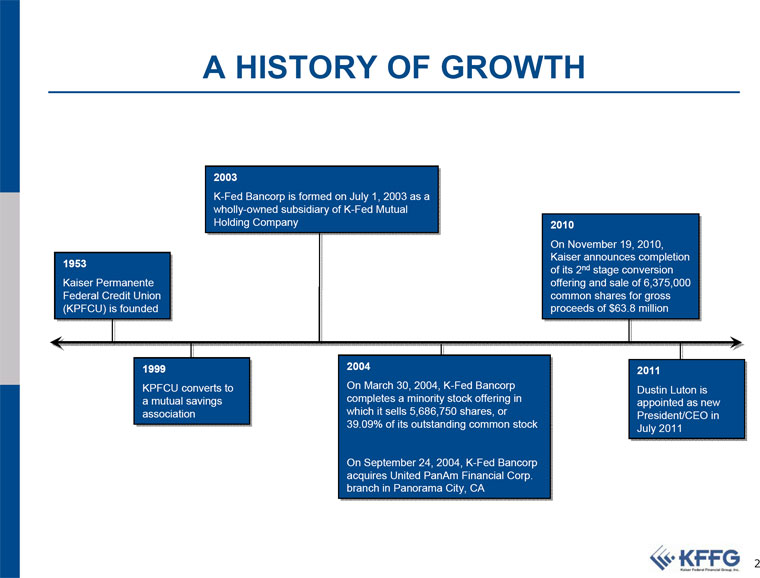 |
A HISTORY OF GROWTH
2003
K-Fed Bancorp is formed on July 1, 2003 as aK-
is
on 1,
as a wholly-owned subsidiary of K-Fed Mutual-
of K-
Holding Company
2010
On November 19, 2010,
Kaiser announces completion
1953 of its 2 of its 2nd ndstage conversion
Kaiser Permanente
offering and sale of 6,375,000 of
Federal Credit Union
common shares for gross
for
(KPFCU) is founded is
proceeds of $63.8 million of .8
1999
2004
2011
KPFCU converts to
On March 30, 2004, K-Fed Bancorp
K-
Dustin Luton is
to
is a mutual savings
completes a minority stock offering in a
in
appointed as new a
as association
which it sells 5,686,750 shares, or it
or
President/CEO in in 39.09% of its outstanding common stock 39. of its
July 2011
On September 24, 2004, K-Fed Bancorp
K-
acquires United PanAm Financial Corp.
. branch in Panorama City, CA in
2
|
 |
A STRONG BRANCH FRANCHISE
Main Office:
1359 North Grand Avenue
Covina, CA 91724
We currently have 58 ATMs:
Approximately 80% of our ATMs are located at Kaiser Permanente Medical Centers
2011 Deposits Branch Address
City
($000)
1
8501 Van Nuys Blvd
Panorama City
133,524
2
1359 N Grand Ave
Covina
90,653
3
1118 N Vermont Ave
Los Angeles
82,518
KFFG Branches (9)
4 3375 Scott Blvd #312
Santa Clara
68,895
KFFG ATMs (58)
5
252 S Lake Ave
Pasadena
65,709
6
251 Stonewood St
Downey
64,473
7
9714 Sierra Ave Ste 101
Fontana
48,870
8
11810 Pierce St Ste 150
Riverside
41,355
9
26640 Western Ave Ste N Harbor City
38,712
Data as of June 30, 2011
3
|
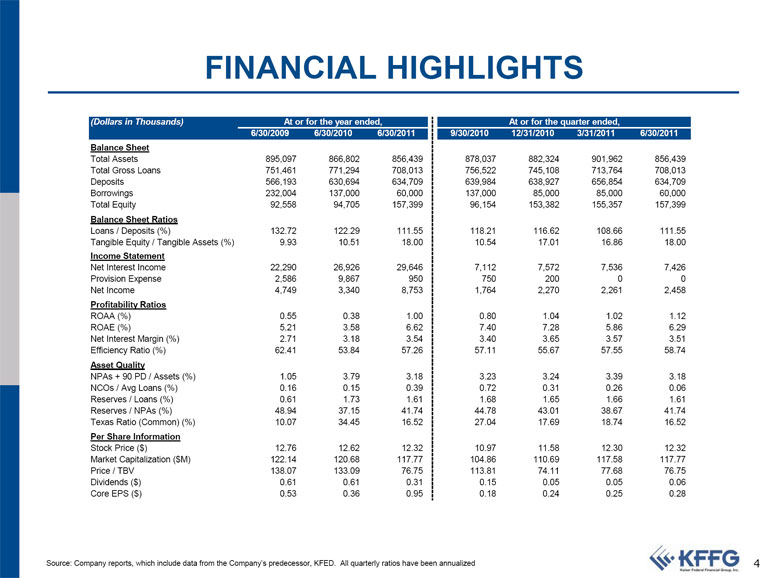 |
FINANCIAL HIGHLIGHTS
(Dollars in Thousands)
At or for the year ended,
At or for the quarter ended,
6/30/2009
6/30/2010
6/30/2011
9/30/2010
12/31/2010
3/31/2011
6/30/2011 Balance Sheet
Total Assets
895,097
866,802
856,439
878,037
882,324
901,962
856,439 Total Gross Loans
751,461
771,294
708,013
756,522
745,108
713,764
708,013 Deposits
566,193
630,694
634,709
639,984
638,927
656,854
634,709 Borrowings
232,004
137,000
60,000
137,000
85,000
85,000
60,000 Total Equity
92,558
94,705
157,399
96,154
153,382
155,357
157,399
Balance Sheet Ratios
Loans / Deposits (%)
132.72
122.29
111.55
118.21
116.62
108.66
111.55 Tangible Equity / Tangible Assets (%)
9.93
10.51
18.00
10.54
17.01
16.86
18.00
Income Statement
Net Interest Income
22,290
26,926
29,646
7,112
7,572
7,536
7,426 Provision Expense
2,586
9,867
950
750
200
0
0 Net Income
4,749
3,340
8,753
1,764
2,270
2,261
2,458
Profitability Ratios
ROAA (%)
0.55
0.38
1.00
0.80
1.04
1.02
1.12 ROAE (%)
5.21
3.58
6.62
7.40
7.28
5.86
6.29 Net Interest Margin (%)
2.71
3.18
3.54
3.40
3.65
3.57
3.51 Efficiency Ratio (%)
62.41
53.84
57.26
57.11
55.67
57.55
58.74
Asset Quality
NPAs + 90 PD / Assets (%)
1.05
3.79
3.18
3.23
3.24
3.39
3.18 NCOs / Avg Loans (%)
0.16
0.15
0.39
0.72
0.31
0.26
0.06 Reserves / Loans (%)
0.61
1.73
1.61
1.68
1.65
1.66
1.61 Reserves / NPAs (%)
48.94
37.15
41.74
44.78
43.01
38.67
41.74 Texas Ratio (Common) (%)
10.07
34.45
16.52
27.04
17.69
18.74
16.52
Per Share Information
Stock Price ($)
12.76
12.62
12.32
10.97
11.58
12.30
12.32 Market Capitalization ($M)
122.14
120.68
117.77
104.86
110.69
117.58
117.77 Price / TBV
138.07
133.09
76.75
113.81
74.11
77.68
76.75 Dividends ($)
0.61
0.61
0.31
0.15
0.05
0.05
0.06 Core EPS ($)
0.53
0.36
0.95
0.18
0.24
0.25
0.28
Source: Company reports, which include data from the Company’s predecessor, KFED. All quarterly ratios have been annualized
4
|
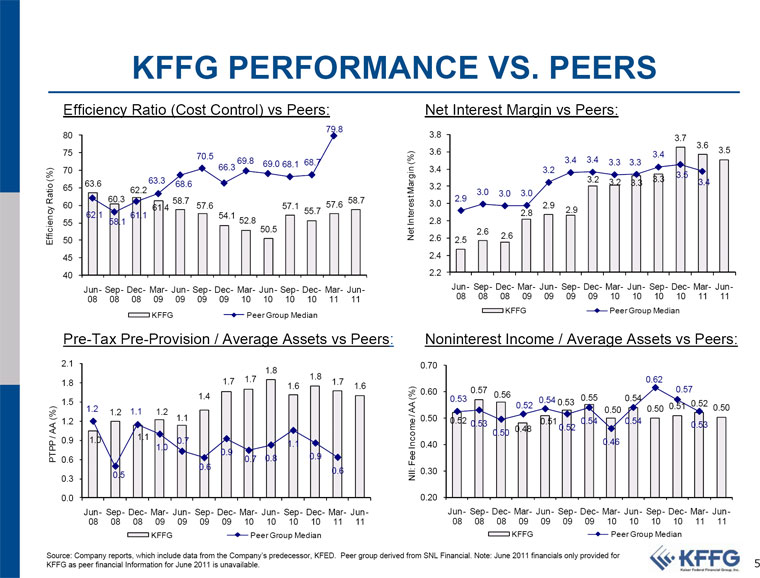 |
KFFG PERFORMANCE VS. PEERS
Efficiency Ratio (Cost Control) vs Peers:
Net Interest Margin vs Peers:
79.8
80
3.8
3.7 3.6
75
3.6
3.5
70.5
3.4 3.4 3.4 3.3 3.3
66.3 69.8 69.0 68.1 68.7
70
3.4
3.2
3.5 63.3
3.2 3.2 3.3 3.3
3.4
63.6
68.6
3.2
65
62.2
3.0 3.0 3.0
60.3
58.7
2.9
60
61.4 58.7 57.6
3.0
2.9 57.1 55.7 57.6
2.8
2.9
55
62.1 58.1 61.1
54.1 52.8
2.8
50.5
2.6 Net Interest Margin (%) 2.6
2.6
Efficiency Ratio (%) 50
2.5
45
2.4
40
2.2
Jun- Sep- Dec- Mar- Jun- Sep- Dec- Mar- Jun- Sep- Dec- Mar- Jun-
Jun- Sep- Dec- Mar- Jun- Sep- Dec- Mar- Jun- Sep- Dec- Mar- Jun-
08
08 08 09 09 09 09 10 10 10 10 11 11
08 08 08 09 09 09 09 10 10 10 10 11 11
KFFG
Peer Group Median KFFG
Peer Group Median
Pre-Tax Pre-Provision / Average Assets vs Peers:
Noninterest Income / Average Assets vs Peers:
2.1
0.70 1.8
1.7
1.8
0.62 1.8
1.7
1.7 1.6
1.6
0.57 0.60
0.57 0.56 1.4
0.53
0.54 1.5
0.52 0.54 0.53 0.55
1.2
1.1 1.2
0.50
0.50 0.51 0.52 0.50 1.2 1.2
1.1
0.50 0.52
0.51
0.54 0.53
0.53 0.48
0.52 0.54 0.50 0.9 1.0
1.1
0.7 1.1
0.40
0.46 1.0 0.9 PTPP / AA (%) 0.6
0.7 0.8
0.9 0.6
0.6 0.5
NII: Fee Income / AA (%) 0.30 0.3
0.0
0.20
Jun- Sep- Dec- Mar- Jun- Sep- Dec- Mar- Jun- Sep- Dec- Mar- Jun-
Jun- Sep- Dec- Mar- Jun- Sep- Dec- Mar- Jun- Sep- Dec- Mar- Jun-
08
08 08 09 09 09 09 10 10 10 10 11 11
08 08 08 09 09 09 09 10 10 10 10 11 11
KFFG
Peer Group Median
KFFG
Peer Group Median
Source: Company reports, which include data from the Company’s predecessor, KFED. Peer group derived from SNL Financial. Note: June 2011 financials only provided for
KFFG as peer financial Information for June 2011 is unavailable.
5
|
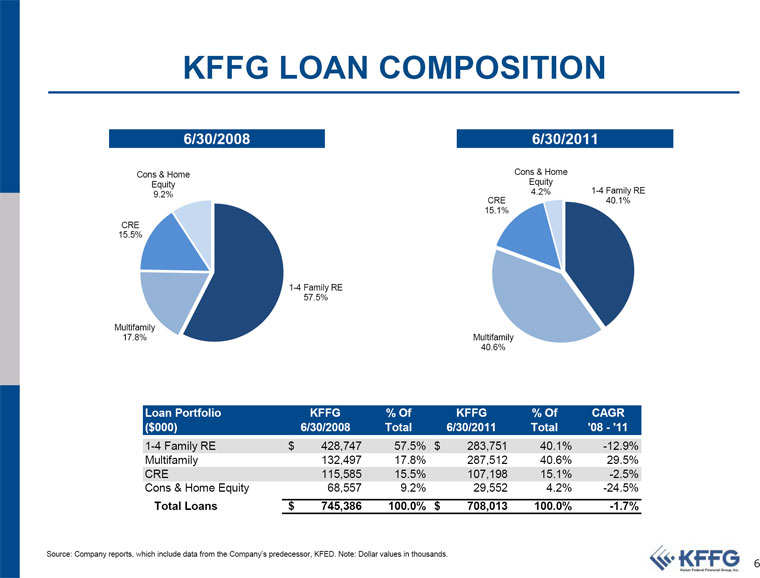 |
KFFG LOAN COMPOSITION
6/30/2008
6/30/2011
Cons & Home
Cons & Home Equity
Equity
9.2%
4.2%
1-4 Family RE
CRE
40.1% 15.1% CRE
15.5%
1-4 Family RE
57.5%
Multifamily
17.8%
Multifamily 40.6%
Loan Portfolio
KFFG
% Of
KFFG
% Of
CAGR ($000)
6/30/2008
Total
6/30/2011
Total
'08 - '11
1-4 Family RE
$ 428,747
57.5% $ 283,751
40.1%
-12.9% Multifamily
132,497
17.8% 287,512
40.6%
29.5% CRE
115,585
15.5% 107,198
15.1%
-2.5% Cons & Home Equity
68,557
9.2% 29,552
4.2%
-24.5%
Total Loans
$ 745,386
100.0% $ 708,013
100.0%
-1.7%
Source: Company reports, which include data from the Company’s predecessor, KFED. Note: Dollar values in thousands.
6
|
 |
ASSET QUALITY
Servicing of Loan Portfolio by Third Parties:
At June 30, 2011, 69.7% of our non-accrual real estate loans are one-to-four family residential loans
At June 30, 2011, 59.4% of our one-to-four family residential loans are serviced by third parties
•
7.8% of these serviced loans are non-performing
Due to a higher level of non-performing loans related to our third party servicers, we have hired additional experienced workout staff to monitor the collection activity of the servicers
•
We are also pursuing legal action against these loan servicers who we believe are not performing their servicing obligations
Composition of One-to-Four Family By Servicer:
Nonaccrual & 90+PD & OREO / Assets:
Dollars in thousands
4.0
3.8
3.3
3.4 3.5
3.2 3.2
3.2
Percent of Non-
2.8
Non-
performing to
3.0
2.6 2.6
Composition
Amount Percent performing
Loans
3.0 2.5
Purchased and serviced
2.6
2.5 2.0
1.7 by others
$167,605 59.42% $13,065
7.80%
1.3
1.5
2.1
Purchased and servicing
1.5
1.9 1.9 transferred to KFFG
24,343
8.63
3,232
13.28
1.1 0.7 0.9 1.0
0.8
Originated and serviced
0.7 by KFFG
90,120
31.95
2,088
2.32
0.5 0.5 0.4 Total
$282,068 100.00% $18,385
6.52%
Nonaccr. & 90+PD & OREO / Assets (%) 0.0
Jun- Sep- Dec- Mar- Jun- Sep- Dec- Mar- Jun- Sep- Dec- Mar- Jun-
08
08 08 09 09 09 09 10 10 10 10 11 11
KFFG
Peer Group Median Source: Company reports, which include data from the Company’s predecessor, KFED. Peer group derived from SNL Financial. Note: June 2011 financials only provided for
KFFG as peer financial Information for June 2011 is unavailable.
7
|
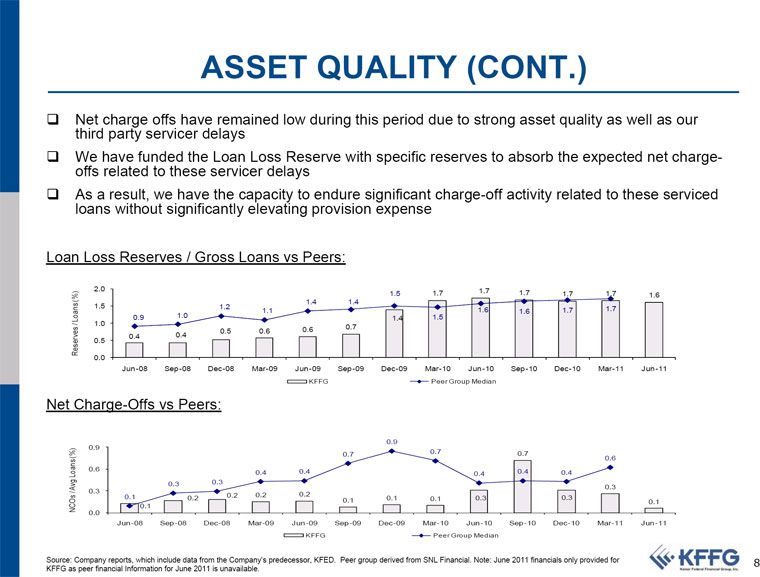 |
ASSET QUALITY (CONT.)
Net charge offs have remained low during this period due to strong asset quality as well as our third party servicer delays
We have funded the Loan Loss Reserve with specific reserves to absorb the expected net charge-offs related to these servicer delays
As a result, we have the capacity to endure significant charge-off activity related to these serviced loans without significantly elevating provision expense
Loan Loss Reserves / Gross Loans vs Peers:
2.0
1.7
1.5
1.7
1.7
1.7
1.7
1.6 1.4
1.4 1.5
1.2
1.7 1.1
1.6
1.6
1.7 0.9
1.0
1.4
1.5 1.0 0.6
0.7 0.5
0.6 0.4
0.4
Reserves / Loans (%) 0.5 0.0
Jun-08 Sep-08 Dec-08 Mar-09 Jun-09 Sep-09 Dec-09 Mar-10 Jun-10 Sep-10 Dec-10 Mar-11 Jun-11
KFFG
Peer Group Median
Net Charge-Offs vs Peers:
0.9 0.9
0.7
0.7
0.7
0.6 0.6
0.4
0.4 0.4
0.4
0.4 0.3
0.3 0.3 0.3 0.1
0.2 0.2
0.2 0.2
0.1
0.1
0.1
0.3
0.3
0.1
NCOs / Avg Loans (%)
0.1 0.0
Jun-08 Sep-08 Dec-08 Mar-09 Jun-09 Sep-09 Dec-09 Mar-10 Jun-10 Sep-10 Dec-10 Mar-11 Jun-11
KFFG
Peer Group Median
Source: Company reports, which include data from the Company’s predecessor, KFED. Peer group derived from SNL Financial. Note: June 2011 financials only provided for
8 KFFG as peer financial Information for June 2011 is unavailable.
|
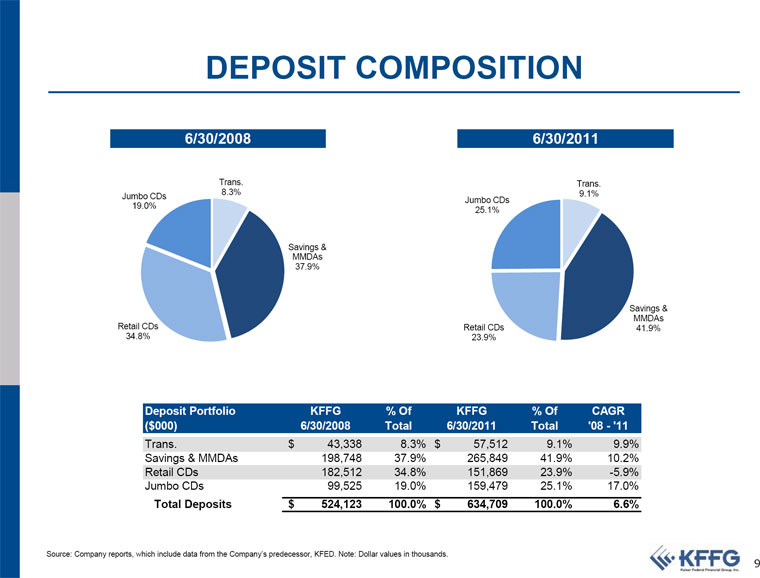 |
DEPOSIT COMPOSITION
6/30/2008
6/30/2011
Trans.
Trans. 8.3%
9.1% Jumbo CDs Jumbo CDs 19.0% 25.1%
Savings & MMDAs 37.9%
Savings & MMDAs Retail CDs
Retail CDs
41.9% 34.8%
23.9%
Deposit Portfolio
KFFG
% Of
KFFG
% Of
CAGR ($000)
6/30/2008
Total
6/30/2011
Total
'08 - '11
Trans.
$ 43,338
8.3% $ 57,512
9.1%
9.9% Savings & MMDAs
198,748
37.9% 265,849
41.9%
10.2% Retail CDs
182,512
34.8% 151,869
23.9%
-5.9% Jumbo CDs
99,525
19.0% 159,479
25.1%
17.0%
Total Deposits
$ 524,123
100.0% $ 634,709
100.0%
6.6%
Source: Company reports, which include data from the Company’s predecessor, KFED. Note: Dollar values in thousands.
9
|
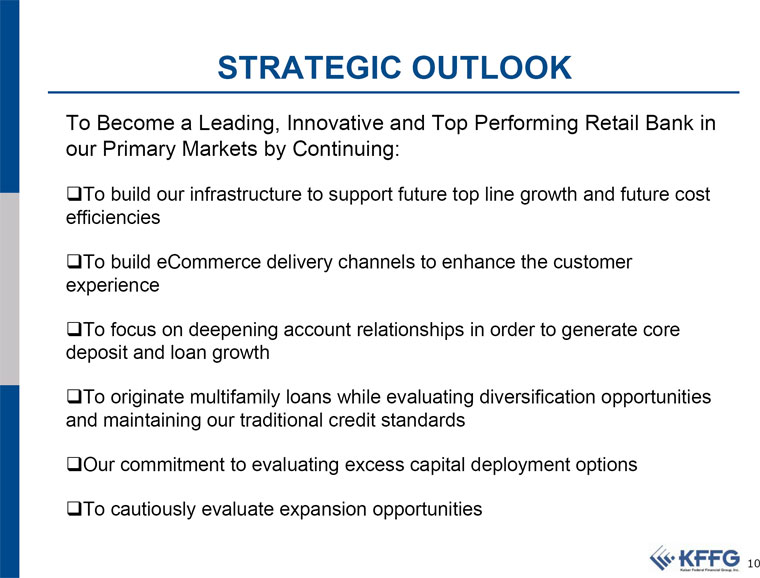 |
STRATEGIC OUTLOOK
To Become a Leading, Innovative and Top Performing Retail Bank in our Primary Markets by Continuing:
To build our infrastructure to support future top line growth and future cost efficiencies
To build eCommerce delivery channels to enhance the customer experience
To focus on deepening account relationships in order to generate core deposit and loan growth
To originate multifamily loans while evaluating diversification opportunities and maintaining our traditional credit standards
Our commitment to evaluating excess capital deployment options
To cautiously evaluate expansion opportunities
10
|
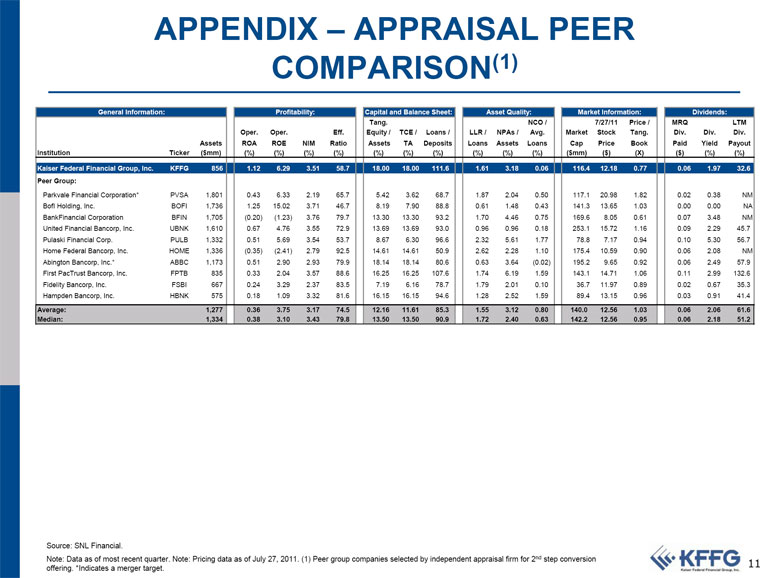 |
APPENDIX – APPRAISAL PEER COMPARISON(1)
General Information:
Profitability:
Capital and Balance Sheet:
Asset Quality:
Market Information:
Dividends: Tang.
NCO /
7/27/11 Price /
MRQ
LTM
Oper. Oper.
Eff.
Equity / TCE / Loans / LLR / NPAs / Avg. Market Stock Tang.
Div. Div. Div. Assets ROA ROE NIM Ratio Assets TA Deposits Loans Assets Loans
Cap Price Book
Paid Yield Payout Institution
Ticker ($mm)
(%) (%) (%) (%)
(%) (%) (%)
(%) (%) (%)
($mm) ($)
(X)
($) (%) (%)
Kaiser Federal Financial Group, Inc. KFFG
856
1.12 6.29 3.51 58.7
18.00 18.00 111.6
1.61 3.18 0.06
116.4 12.18 0.77
0.06 1.97 32.6 Peer Group:
Parkvale Financial Corporation*
PVSA 1,801
0.43 6.33 2.19 65.7
5.42 3.62 68.7
1.87 2.04 0.50
117.1 20.98 1.82
0.02 0.38
NM BofI Holding, Inc.
BOFI 1,736
1.25 15.02 3.71 46.7
8.19 7.90 88.8
0.61 1.48 0.43
141.3 13.65 1.03
0.00 0.00
NA BankFinancial Corporation
BFIN 1,705
(0.20) (1.23) 3.76 79.7
13.30 13.30 93.2
1.70 4.46 0.75
169.6 8.05 0.61
0.07 3.48
NM United Financial Bancorp, Inc.
UBNK 1,610
0.67 4.76 3.55 72.9
13.69 13.69 93.0
0.96 0.96 0.18
253.1 15.72 1.16
0.09 2.29 45.7 Pulaski Financial Corp.
PULB 1,332
0.51 5.69 3.54 53.7
8.67 6.30 96.6
2.32 5.61 1.77
78.8 7.17 0.94
0.10 5.30 56.7 Home Federal Bancorp, Inc.
HOME 1,336
(0.35) (2.41) 2.79 92.5
14.61 14.61 50.9
2.62 2.28 1.10
175.4 10.59 0.90
0.06 2.08
NM Abington Bancorp, Inc.*
ABBC 1,173
0.51 2.90 2.93 79.9
18.14 18.14 80.6
0.63 3.64 (0.02)
195.2 9.65 0.92
0.06 2.49 57.9 First PacTrust Bancorp, Inc.
FPTB
835
0.33 2.04 3.57 88.6
16.25 16.25 107.6
1.74 6.19 1.59
143.1 14.71 1.06
0.11 2.99 132.6 Fidelity Bancorp, Inc.
FSBI
667
0.24 3.29 2.37 83.5
7.19 6.16 78.7
1.79 2.01 0.10
36.7 11.97 0.89
0.02 0.67 35.3 Hampden Bancorp, Inc.
HBNK
575
0.18 1.09 3.32 81.6
16.15 16.15 94.6
1.28 2.52 1.59
89.4 13.15 0.96
0.03 0.91 41.4
Average:
1,277
0.36 3.75 3.17 74.5
12.16 11.61 85.3
1.55 3.12 0.80
140.0 12.56 1.03
0.06 2.06 61.6 Median:
1,334
0.38 3.10 3.43 79.8
13.50 13.50 90.9
1.72 2.40 0.63
142.2 12.56 0.95
0.06 2.18 51.2
Source: SNL Financial.
Note: Data as of most recent quarter. Note: Pricing data as of July 27, 2011. (1) Peer group companies selected by independent appraisal firm for 2nd step conversion
11 offering. *Indicates a merger target.
|