Attached files
| file | filename |
|---|---|
| 8-K - CURRENT REPORT OF MATERIAL EVENTS OR CORPORATE CHANGES - SUPERMEDIA INC. | a11-21341_18k.htm |
| EX-99.1 - EX-99.1 - SUPERMEDIA INC. | a11-21341_1ex99d1.htm |
Exhibit 99.2
|
|
Q2 2011 Earnings Presentation August 2, 2011 Peter McDonald, CEO Dee Jones, CFO 1 |
|
|
2 Safe Harbor Statement This presentation contains forward-looking statements within the meaning of Section 27A of the Securities Act of 1933 and Section 21E of the Securities Exchange Act of 1934. You should not place undue reliance on these statements. These forward-looking statements include statements that reflect the current views of our senior management with respect to our financial performance and future events with respect to our business and industry in general. Statements that include the words “may,” “could,” “should,” “would,” “believe,” “anticipate,” “forecast,” “estimate,” “expect,” “preliminary,” “intend,” “plan,” “project,” “outlook” and similar statements of a future or forward-looking nature identify forward-looking statements. Forward-looking statements address matters that involve risks and uncertainties. Accordingly, there are or will be important factors that could cause our actual results to differ materially from those indicated in these statements. We believe that these factors include, but are not limited to, the following: our inability to provide assurance for the long-term continued viability of our business; reduced advertising spending and contract cancellations by our clients, which causes reduced revenue; declining use of print yellow pages directories by consumers; competition from other yellow pages directory publishers and other traditional and new media, and our ability to anticipate or respond to changes in technology and user preferences; changes in our operating performance; our post-restructuring financial condition, financing requirements and cash flow; limitations on our operating and strategic flexibility and the ability to operate our business, finance our capital needs or expand business strategies under the terms of our debt agreements; failure to comply with the financial covenants and other restrictive covenants in our debt agreements; limited access to capital markets and increased borrowing costs resulting from our leveraged capital structure and debt ratings; our ability to resolve any remaining bankruptcy claims; changes in the availability and cost of paper and other raw materials used to print our directories and our reliance on third-party providers for printing, publishing and distribution services; credit risk associated with our reliance on small- and medium-sized businesses as clients; our ability to attract and retain qualified key personnel; our ability to maintain good relations with our unionized employees; changes in labor, business, political and economic conditions; changes in governmental regulations and policies and actions of federal, state and local municipalities; and the outcome of pending or future litigation and other claims. The foregoing factors should not be construed as exhaustive and should be read together with the other cautionary statements included in this and other reports we file with the Securities and Exchange Commission (“SEC”), including the information in “Item 1A. Risk Factors” in Part I of our Annual Report on Form 10-K for the year ended December 31, 2010 and in all subsequent filings with the SEC. If one or more events related to these or other risks or uncertainties materialize, or if our underlying assumptions prove to be incorrect, actual results may differ materially from what we anticipate. All forward-looking statements included in this report are expressly qualified in their entirety by these cautionary statements. The forward-looking statements speak only as of the date made and, other than as required by law, we undertake no obligation to publicly update or revise any forward-looking statements, whether as a result of new information, future events or otherwise. |
|
|
3 Peter McDonald, CEO |
|
|
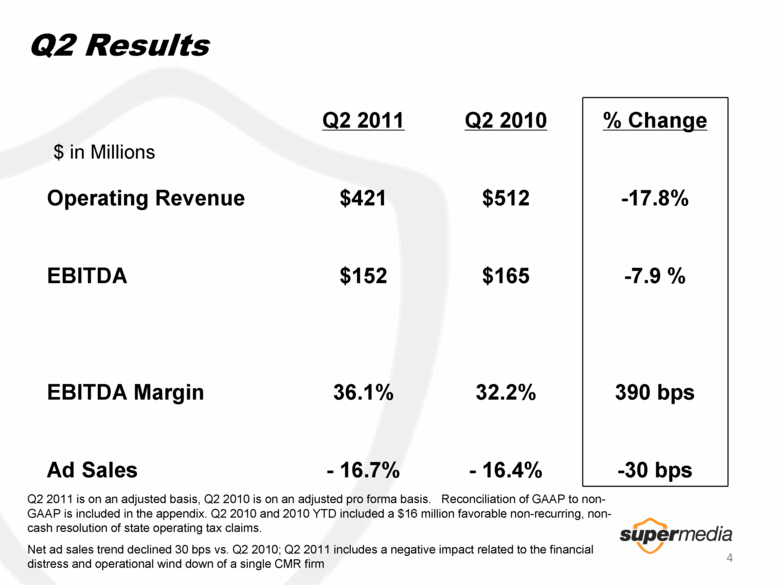
4 Q2 Results $ in Millions Q2 2011 is on an adjusted basis, Q2 2010 is on an adjusted pro forma basis. Reconciliation of GAAP to non-GAAP is included in the appendix. Q2 2010 and 2010 YTD included a $16 million favorable non-recurring, non-cash resolution of state operating tax claims. Net ad sales trend declined 30 bps vs. Q2 2010; Q2 2011 includes a negative impact related to the financial distress and operational wind down of a single CMR firm Q2 2011 Q2 2010 % Change Operating Revenue $421 $512 -17.8% EBITDA $152 $165 -7.9 % EBITDA Margin 36.1% 32.2% 390 bps Ad Sales - 16.7% - 16.4% -30 bps |
|
|
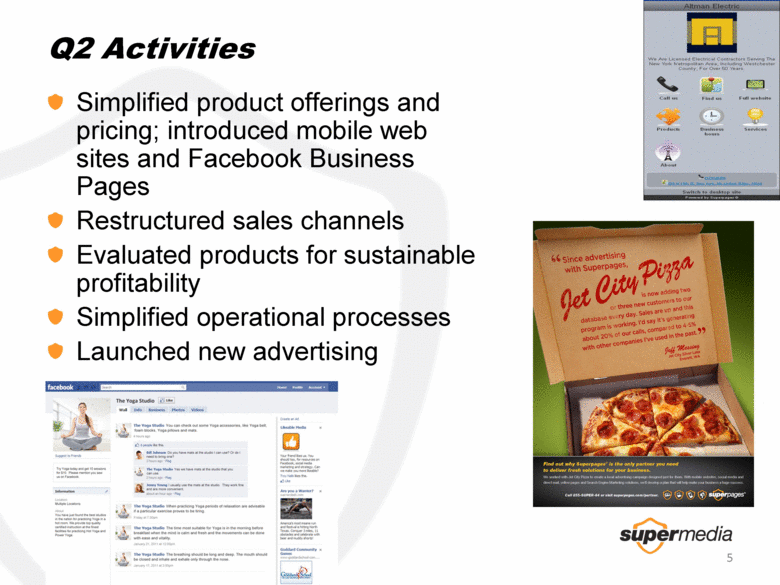
5 Q2 Activities Simplified product offerings and pricing; introduced mobile web sites and Facebook Business Pages Restructured sales channels Evaluated products for sustainable profitability Simplified operational processes Launched new advertising |
|
|
Small Business Challenges 6 |
|
|
7 Small Business Challenges |
|
|
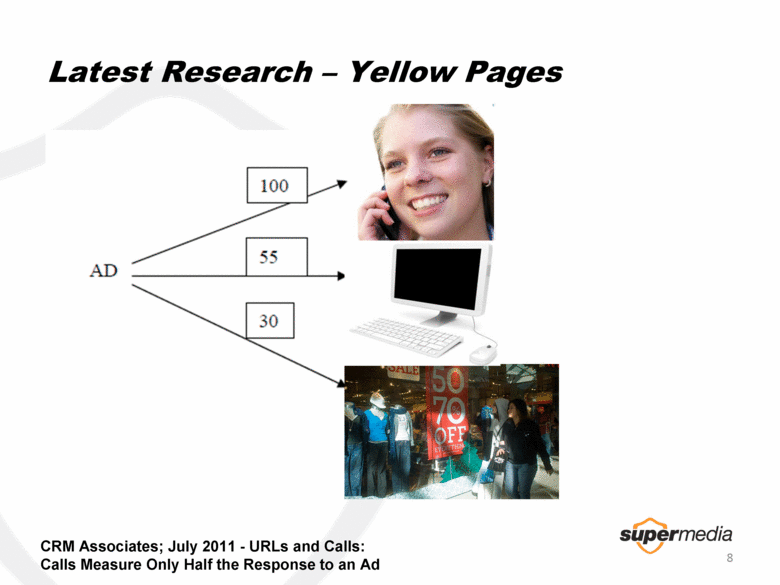
Latest Research – Yellow Pages 8 CRM Associates; July 2011 - URLs and Calls: Calls Measure Only Half the Response to an Ad |
|
|
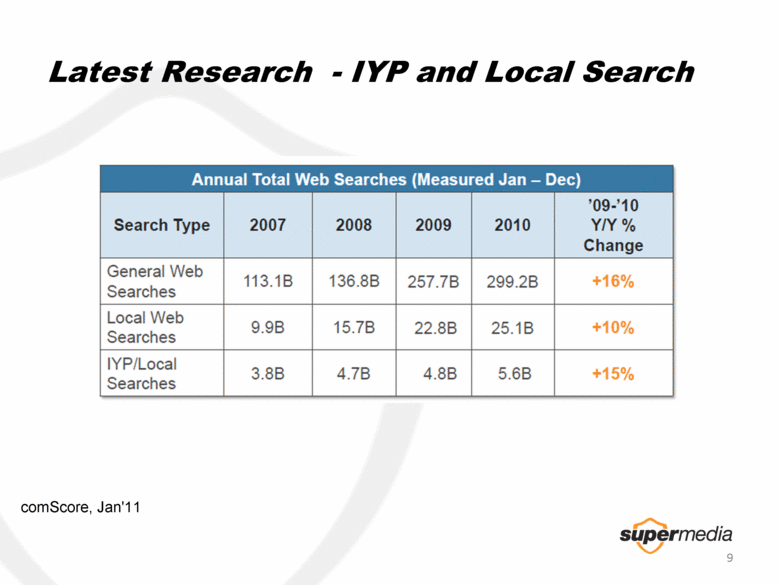
Latest Research - IYP and Local Search 9 comScore, Jan'11 Annual Total Web Searches (Measured Jan - Dec) Search Type 2007 2008 2009 2010 '09-'10 Y/Y % Change General Web Searches 113.1B 136.8B 257.7B 299.2B +16% Local Web Searches 9.9B 15.7B 22.8B 25.1B +10% lYP/Local Searches 3.8B 4.7B 4.8B 5.6B +15% |
|
|
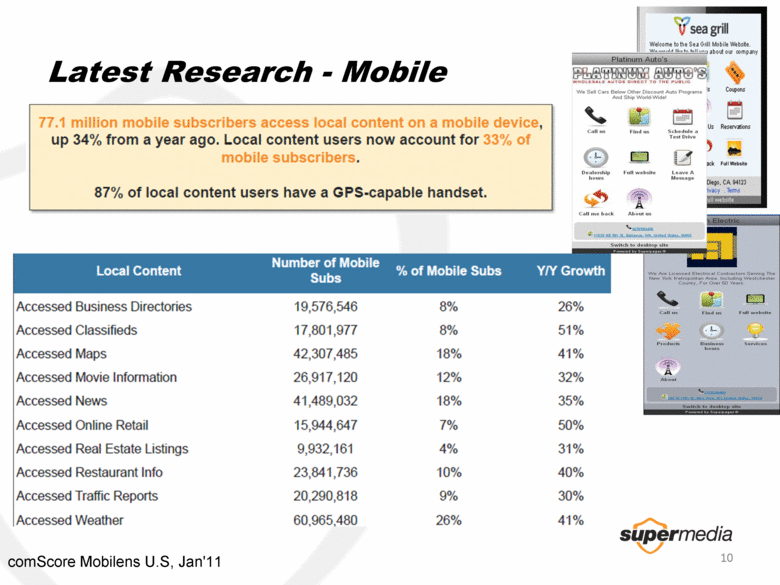
10 Latest Research - Mobile 10 comScore Mobilens U.S, Jan'11 Local Content Number of Mobile Subs % of Mobile Subs Y/Y Growth Accessed Business Directories 19,576,546 8% 26% Accessed Classifieds 17,801,977 8% 51% Accessed Maps 42,307,485 18% 41% Accessed Movie Information 26,917,120 12% 32% Accessed News 41,489,032 18% 35% Accessed Online Retail 15,944,647 7% 50% Accessed Real Estate Listings 9,932,161 4% 31% Accessed Restaurant Info 23,841,736 10% 40% Accessed Traffic Reports 20,290,818 9% 30% Accessed Weather 60,965,480 26% 41% 77.1 million mobile subscribers access local content on a mobile device, up 34% from a year ago. Local content users now account for mobile subscribers. 87% of local content users have a GPS-capable handset. |
|
|
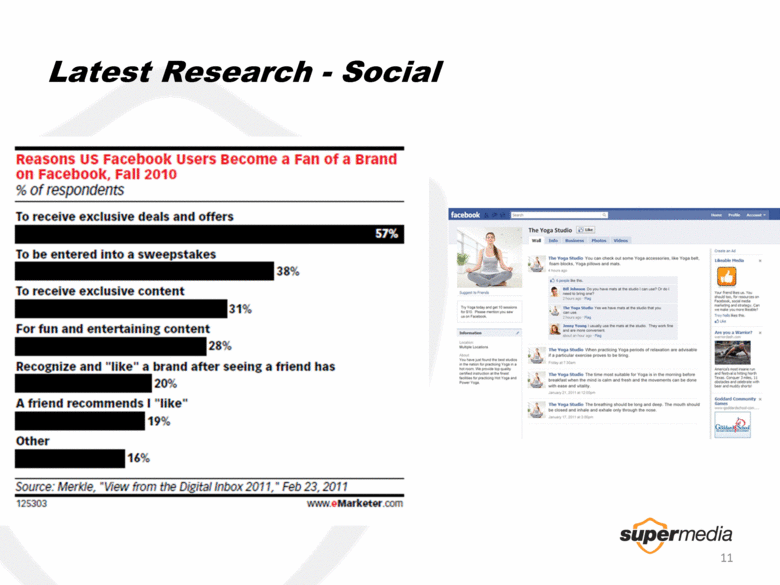
11 Latest Research - Social 11 Reasons us Facebook users Become a Fan of a Brand on Facebook, Fall 2010 % of respondents To receive exclusive deals and offers To be entered into a sweepstakes To receive exclusive content 57% 31% 38% For fun and entertaining content 28% Recognize and "like" a brand after seeing a friend has 20% A friend recommends I "like" 19% Other 16% Source: Merkle, "View from the Digital Inbox 2011," Feb 23.2011 www.eMarketer.com 125303 |
|
|
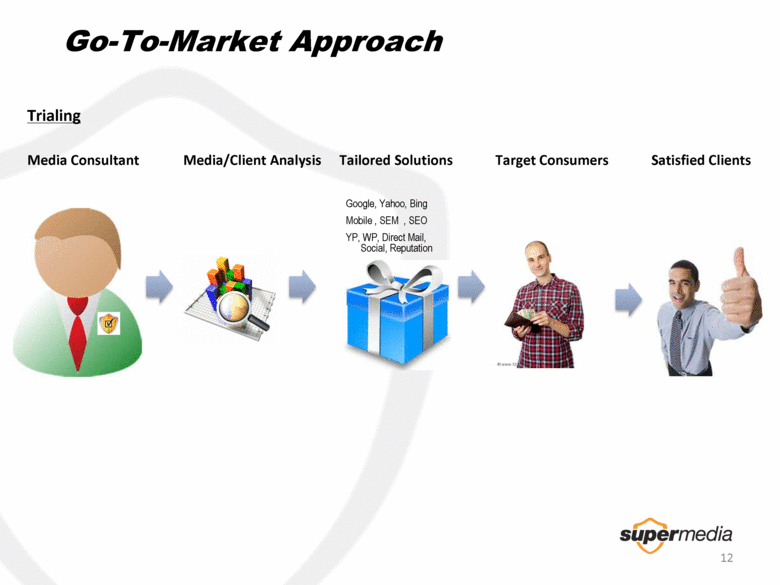
12 Go-To-Market Approach Trialing Media Consultant Media/Client Analysis Tailored Solutions Target Consumers Satisfied Clients Google, Yahoo, Bing Mobile , SEM , SEO YP, WP, Direct Mail, Social, Reputation |
|
|
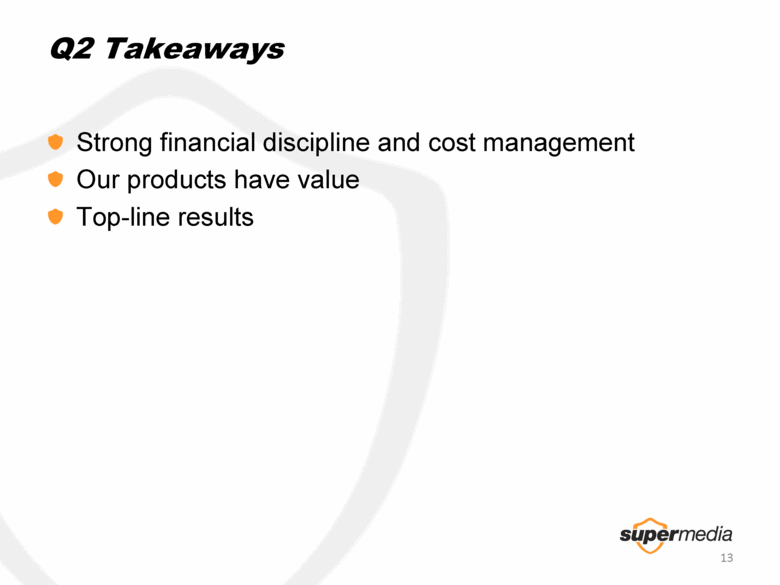
Q2 Takeaways Strong financial discipline and cost management Our products have value Top-line results 13 |
|
|
14 Financials – Dee Jones, EVP and CFO |
|
|
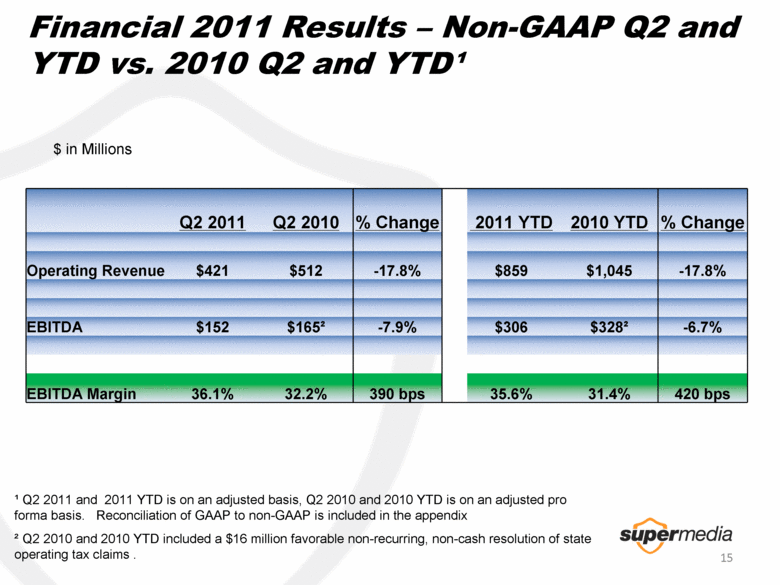
15 Financial 2011 Results – Non-GAAP Q2 and YTD vs. 2010 Q2 and YTD¹ $ in Millions ¹ Q2 2011 and 2011 YTD is on an adjusted basis, Q2 2010 and 2010 YTD is on an adjusted pro forma basis. Reconciliation of GAAP to non-GAAP is included in the appendix ² Q2 2010 and 2010 YTD included a $16 million favorable non-recurring, non-cash resolution of state operating tax claims . Q2 2011 Q2 2010 % Change 2011 YTD 2010 YTD % Change Operating Revenue $421 $512 -17.8% $859 $1,045 -17.8% EBITDA $152 $165² -7.9% $306 $328² -6.7% EBITDA Margin 36.1% 32.2% 390 bps 35.6% 31.4% 420 bps |
|
|
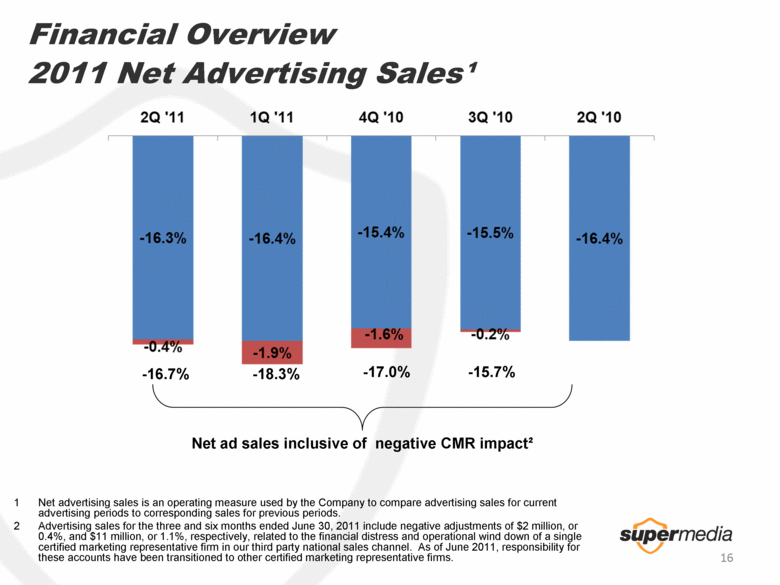
16 Financial Overview 1 Net advertising sales is an operating measure used by the Company to compare advertising sales for current advertising periods to corresponding sales for previous periods. 2 Advertising sales for the three and six months ended June 30, 2011 include negative adjustments of $2 million, or 0.4%, and $11 million, or 1.1%, respectively, related to the financial distress and operational wind down of a single certified marketing representative firm in our third party national sales channel. As of June 2011, responsibility for these accounts has been transitioned to other certified marketing representative firms. 2011 Net Advertising Sales¹ Net ad sales inclusive of negative CMR impact² -16.7% -18.3% -17.0% -15.7% |
|
|
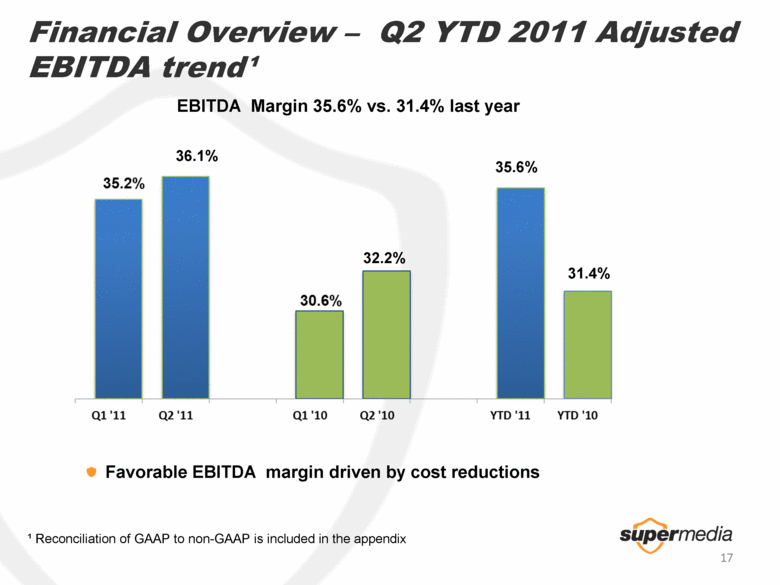
17 35.6% EBITDA Margin 35.6% vs. 31.4% last year Financial Overview – Q2 YTD 2011 Adjusted EBITDA trend¹ ¹ Reconciliation of GAAP to non-GAAP is included in the appendix Favorable EBITDA margin driven by cost reductions 31.4% 36.1% 32.2% |
|
|
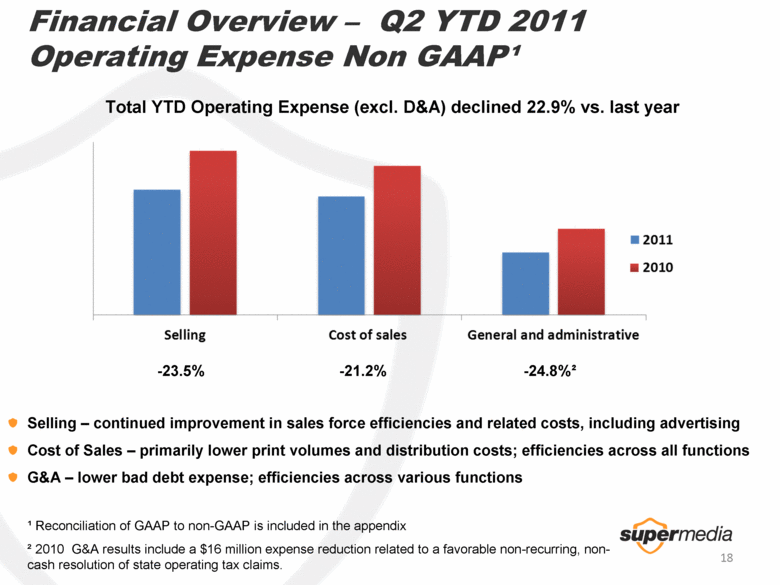
18 -23.5% -21.2% Financial Overview – Q2 YTD 2011 Operating Expense Non GAAP¹ ¹ Reconciliation of GAAP to non-GAAP is included in the appendix ² 2010 G&A results include a $16 million expense reduction related to a favorable non-recurring, non-cash resolution of state operating tax claims. Selling – continued improvement in sales force efficiencies and related costs, including advertising Cost of Sales – primarily lower print volumes and distribution costs; efficiencies across all functions G&A – lower bad debt expense; efficiencies across various functions Total YTD Operating Expense (excl. D&A) declined 22.9% vs. last year -24.8%² |
|
|
19 Questions and Answers |
|
|
20 |
|
|
21 Appendix |
|
|
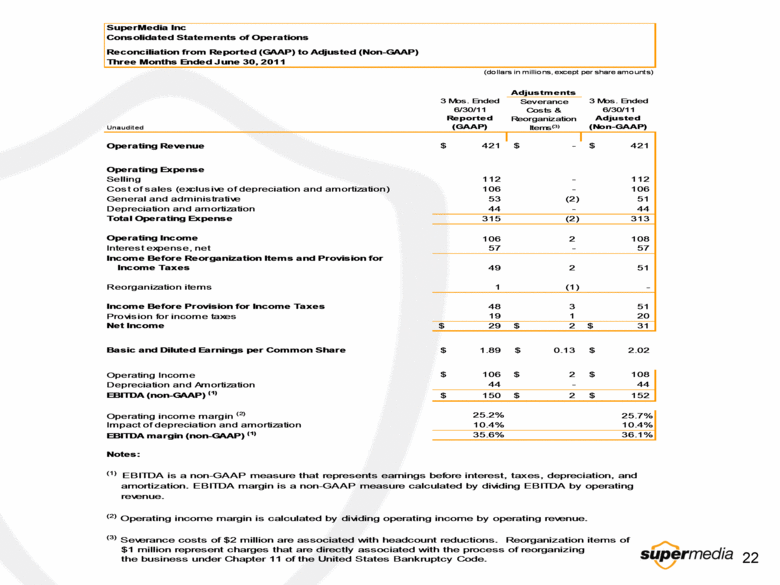
22 the business under Chapter 11 of the United States Bankruptcy Code. $1 million represent charges that are directly associated with the process of reorganizing (3) Severance costs of $2 million are associated with headcount reductions. Reorganization items of (2) Operating income margin is calculated by dividing operating income by operating revenue. revenue. amortization. EBITDA margin is a non-GAAP measure calculated by dividing EBITDA by operating (1) EBITDA is a non-GAAP measure that represents earnings before interest, taxes, depreciation, and Notes: 36.1% 35.6% EBITDA margin (non-GAAP) (1) 10.4% 10.4% Impact of depreciation and amortization 25.7% 25.2% Operating income margin (2) $ 152 $ 2 $ 150 EBITDA (non-GAAP) (1) 44 - 44 Depreciation and Amortization $ 108 $ 2 $ 106 Operating Income $ 2.02 $ 0.13 $ 1.89 Basic and Diluted Earnings per Common Share $ 31 $ 2 $ 29 Net Income 20 1 19 Provision for income taxes 51 3 48 Income Before Provision for Income Taxes - (1) 1 Reorganization items 51 2 49 Income Taxes Income Before Reorganization Items and Provision for 57 - 57 Interest expense, net 108 2 106 Operating Income 313 (2) 315 Total Operating Expense 44 - 44 Depreciation and amortization 51 (2) 53 General and administrative 106 - 106 Cost of sales (exclusive of depreciation and amortization) 112 - 112 Selling Operating Expense $ 421 $ - $ 421 Operating Revenue Adjusted (Non-GAAP) Reported (GAAP) Unaudited 3 Mos. Ended 6/30/11 Severance Costs & Reorganization Items(3) 3 Mos. Ended 6/30/11 Adjustments (dollars in millions, except per share amounts) Three Months Ended June 30, 2011 Reconciliation from Reported (GAAP) to Adjusted (Non-GAAP) Consolidated Statements of Operations SuperMedia Inc Unaudited 3 Mos. Ended 6/30/11 Reported (GAAP) Adjustments Severance Costs & Reorganization Items(3) 3 Mos. Ended 3/30/11 |
|
|
|
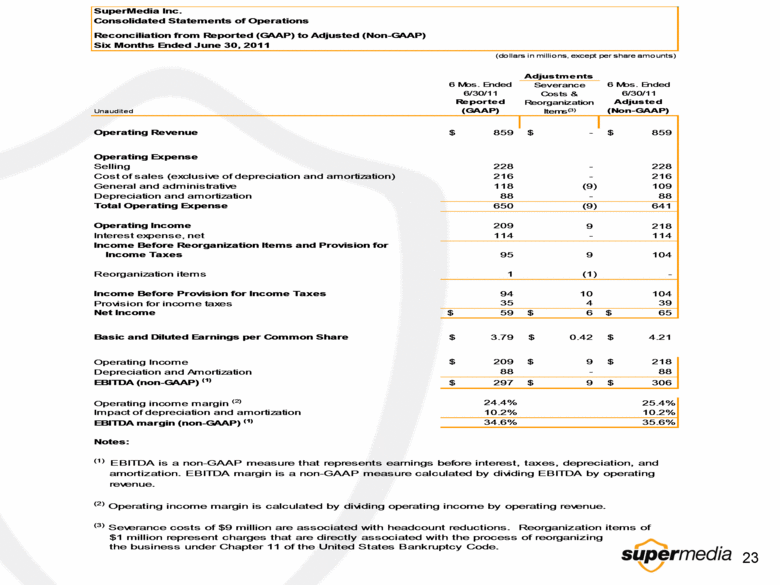
23 SuperMedia Inc. Consolidated Statements of Operations Reconciliation from Reported (GAAP) to Adjusted (Non-GAAP) Six Months Ended June 30, 2011 (dollars in millions, except per share amounts) Adjustments 6 Mos. Ended 6/30/11 6 Mos. Ended 6/30/11 Unaudited Reported (GAAP) Adjusted (Non-GAAP) Operating Revenue 859 $ - $ 859 $ Operating Expense Selling 228 - 228 Cost of sales (exclusive of depreciation and amortization) 216 - 216 General and administrative 118 (9) 109 Depreciation and amortization 88 - 88 Total Operating Expense 650 (9) 641 Operating Income 209 9 218 Interest expense, net 114 - 114 95 9 104 Reorganization items 1 (1) - 94 10 104 Provision for income taxes 35 4 39 Net Income 59 $ 6 $ 65 $ Basic and Diluted Earnings per Common Share 3.79 $ 0.42 $ 4.21 $ Operating Income 209 $ 9 $ 218 $ Depreciation and Amortization 88 - 88 EBITDA (non-GAAP) (1) 297 $ 9 $ 306 $ Operating income margin (2) 24.4% 25.4% Impact of depreciation and amortization 10.2% 10.2% EBITDA margin (non-GAAP) (1) 34.6% 35.6% Notes: (1) EBITDA is a non-GAAP measure that represents earnings before interest, taxes, depreciation, and amortization. EBITDA margin is a non-GAAP measure calculated by dividing EBITDA by operating revenue. (2) Operating income margin is calculated by dividing operating income by operating revenue. (3) Severance costs of $9 million are associated with headcount reductions. Reorganization items of $1 million represent charges that are directly associated with the process of reorganizing the business under Chapter 11 of the United States Bankruptcy Code. Severance Costs & Reorganization Items (3) Income Before Reorganization Items and Provision for Income Taxes Income Before Provision for Income Taxes |
|

