Attached files
| file | filename |
|---|---|
| 8-K - First California Financial Group, Inc. | firstcal-8k_080211.htm |

This presentation contains certain forward - looking information about First California Financial Group, Inc. (“First California” or “FCAL” that is intended to be covered by the safe harbor for "forward - looking statements" provided by the Private Securities Litigation Reform Act of 1995. All statements other than statements of historical fact are forward - looking statements. Such statements involve inherent risks and uncertainties, many of which are difficult to predict and are generally beyond the control of First California. First California cautions that a number of important factors could cause actual results to differ materially from those expressed in, or implied or projected by, such forward - looking statements. Risks and uncertainties include, but are not limited to, revenues are lower than expected, credit quality deterioration which could cause an increase in the provision for credit losses, First California’s ability to complete future acquisitions, successfully integrate such acquired entities, or achieve expected beneficial synergies and/or operating efficiencies within expected time - frames or at all, changes in consumer spending, borrowing and savings habits, technological changes, the cost of additional capital is more than expected, a change in the interest rate environment reduces interest margins, asset/liability repricing risks and liquidity risks, general economic conditions, particularly those affecting real estate values, either nationally or in the market areas in which First California does or anticipates doing business are less favorable than expected, a slowdown in construction activity, recent volatility in the credit or equity markets and its effect on the general economy, legislative or regulatory requirements or changes adversely affecting First California’s business, the effects of and changes in monetary and fiscal policies and laws including the interest rate policies of the Board of Governors of the Federal Reserve , demand for the products or services of First California as well as their ability to attract and retain qualified people, competition with other banks and financial institutions, the costs and effects of legal, accounting and regulatory developments, the inability to obtain regulatory approvals for acquisitions on the terms expected or on the anticipated schedule, and other factors. If any of these risks or uncertainties materialize or if any of the assumptions underlying such forward - looking statements prove to be incorrect, First California's results could differ materially from those expressed in, or implied or projected by, such forward - looking statements. First California assumes no obligation to update such forward - looking statements. For a more complete discussion of risks and uncertainties, investors and security holders are urged to read the section titled "Risk Factors" in First California's Annual Report on Form 10 - K, Quarterly Reports on Form 10 - Q and any other reports filed by it with the Securities and Exchange Commission ("SEC"). Safe Harbor 2

First California Snapshot ▪ NASDAQ: FCAL ▪ Total assets of $1.8 billion ▪ Legacy First California Bank 32 years old ▪ 19 offices in 7 counties ▪ FCAL created in 2007 as a result of merger of equals between FCB Bancorp and National Mercantile Bancorp ▪ Current management in place since 1999 3

2Q 2010 2Q 2011 Net income $147,000 $2.4 million Diluted EPS $(0.01) $0.07 Net interest income $10.8 million $15.5 million Service charges, fees and other income $1.1 million $2.2 million Allowance to non - covered loans 1.85% 1.99% Tangible book value per common share $3.64 $4.11 2011 Second Quarter 4

▪ Proactively and diligently addressed asset quality • Only three non - covered nonaccrual loans greater than $1 million • Non performing assets continue to decrease ▪ Expanded geographic footprint through strategic acquisitions • Western Commercial Bank increased market share in existing service area • San Luis Trust Bank expanded into new, contiguous market ▪ New product offerings through EPS acquisition • Stored value cards • Merchant card acquiring Strong Quarter … On Solid Footing 5
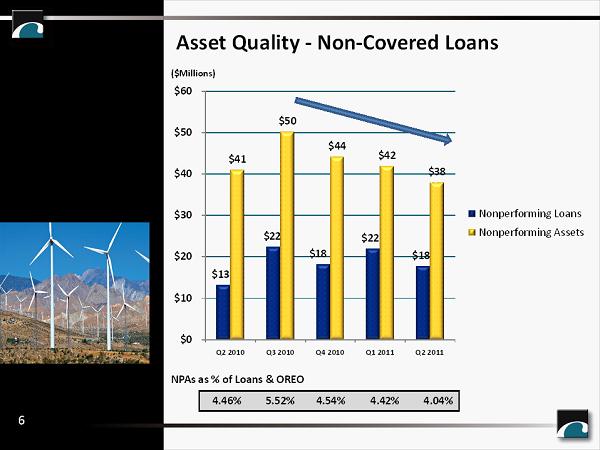
Asset Quality - Non - Covered Loans 4.46% 5.52% 4.54% 4.39% 4.04% $13 $22 $18 $24 $18 $41 $50 $44 $45 $38 $0 $10 $20 $30 $40 $50 $60 Q2 2010 Q3 2010 Q4 2010 Q1 2011 Q2 2011 Nonperforming Loans Nonperforming Assets 6 NPAs as % of Loans & OREO ($Millions)
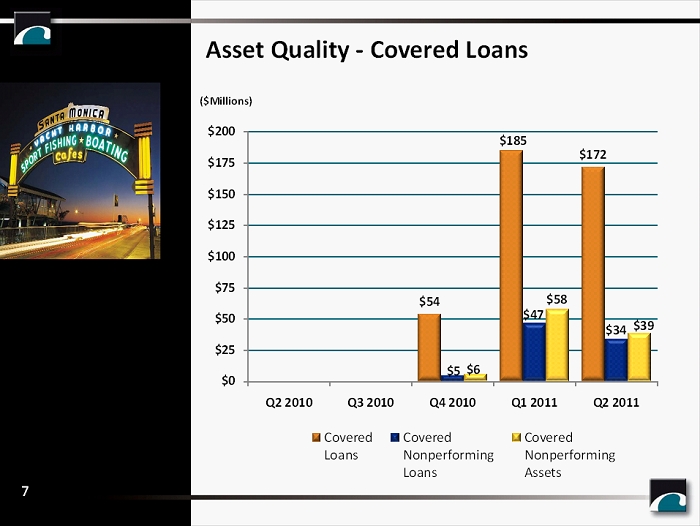
$54 $185 $172 $5 $47 $34 $6 $58 $39 $0 $25 $50 $75 $100 $125 $150 $175 $200 Q2 2010 Q3 2010 Q4 2010 Q1 2011 Q2 2011 Covered Loans Covered Nonperforming Loans Covered Nonperforming Assets Asset Quality - Covered Loans ($Millions) 7

Low Historical Loss Levels Annualized Net Charge - Offs to Average Non - Covered Loans Source: First California Bank Uniform Bank Performance Report as of 3/31/2011. Peer group represents all insured commercial banks with assets between $1 billion and $3 billion. 0.81% 1.53% 1.27% 0.82% 0.12% 0.89% 0.85% 0.37% 0.00% 0.20% 0.40% 0.60% 0.80% 1.00% 1.20% 1.40% 1.60% 1.80% 2008 2009 2010 2011 Peers FCAL 8

Net Charge - Offs by Type ($ Thousands) 2Q10 3Q10 4Q10 1Q11 2Q11 CRE $ 337 $ 82 $ (41) $379 — Commercial loans & lines 496 3,530 520 98 800 Construction (17) (117) 150 3 (4) Home mortgage 93 49 41 352 15 Installment 3 26 (4) 35 49 Total net charge - offs $ 912 $ 3,570 $ 666 $867 $860 Annualized net loan charge - offs 0.40% 1.60% 0.28% 0.37% 0.37% 9

Loan Portfolio Characteristics Construction and Land Commercial Mortgage Multi - Family C&I Owner - Occupied Investor Portfolio Size $80.0 million $129.6 million $306.6 million $153.2 million $216.7 million % of Total Portfolio 7.3% 11.9% 28.1% 14.0% 19.9% Weighted Avg LTV 56.2% 58.9% 59.3% Weighted Avg DSCR 1.65 1.38 Average Balance/ Commitment $1,116,000 $1,117,000 $948,000 $429,000 0 non - covered nonaccrual loans > $1.0 million 1 non - covered nonaccrual loan > $1.0 million 0 non - covered nonaccrual loans > $1.0 million 2 non - covered nonaccrual loans > $1.0 million 10

Loans up 22% from one year ago Yield on Loans = 6.12% Total Loans: $1.1 b illion Diversified Loan Portfolio 12% 28% 14% 7% 14% 5% Multifamily 14% Commercial Mortgages 28% Owner - Occupied Commercial Mortgages 12% Commerial Loans & Lines of Credit 20% 1 - 4 Family 14% Construction & Land Dev 7% Other 5% Loan yield for the six months ended 6/30/2011 11 20%

$0 $2,000 $4,000 $6,000 $8,000 $10,000 $12,000 $14,000 $16,000 $18,000 Q2 2010 Q3 2010 Q4 2010 Q1 2011 Q2 2011 $0 $500 $1,000 $1,500 $2,000 $2,500 Q2 2010 Q3 2010 Q4 2010 Q1 2011 Q2 2011 Net Interest Income Service Charges/Fees ($Thousands) Top - Line Revenue Growth ($Thousands) 12
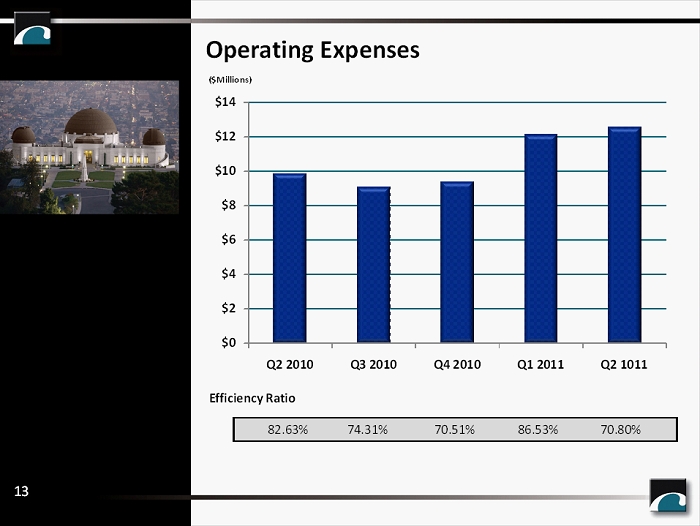
$0 $2 $4 $6 $8 $10 $12 $14 Q2 2010 Q3 2010 Q4 2010 Q1 2011 Q2 1011 Operating Expenses 82.63% 74.31% 70.51% 86.53% 70.80% ($Millions) Efficiency Ratio 13
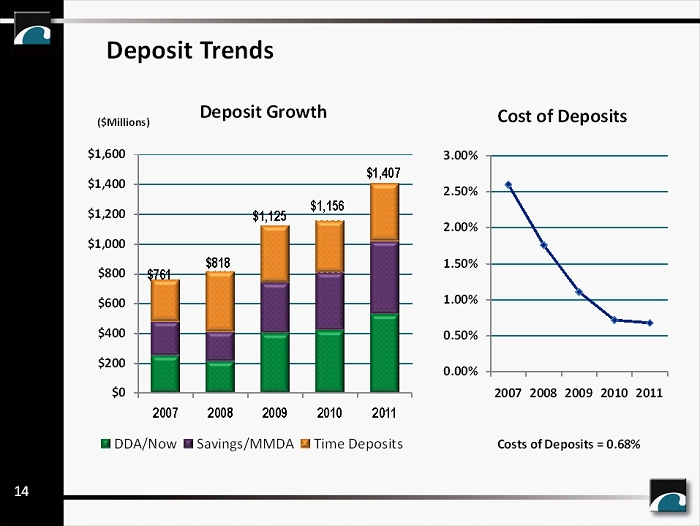
$0 $200 $400 $600 $800 $1,000 $1,200 $1,400 $1,600 2007 2008 2009 2010 2011 DDA/Now Savings/MMDA Time Deposits 0.00% 0.50% 1.00% 1.50% 2.00% 2.50% 3.00% 2007 2008 2009 2010 2011 $761 $818 $1,125 $1,156 $1,407 ($Millions) Deposit Trends Costs of Deposits = 0.68% Deposit Growth Cost of Deposits 14
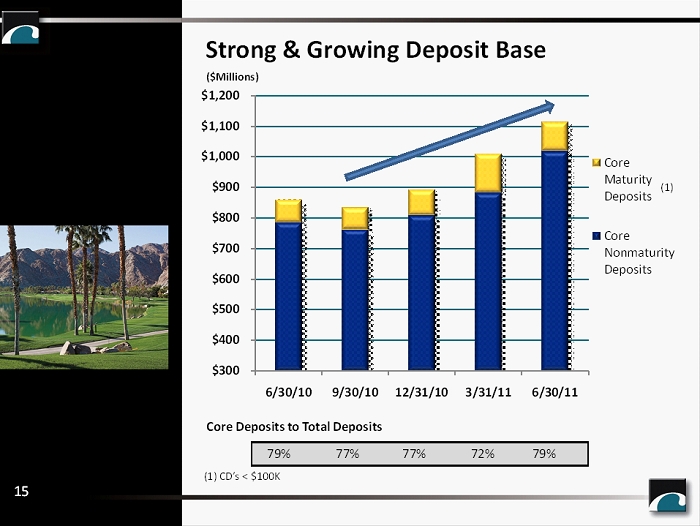
Strong & Growing Deposit Base $300 $400 $500 $600 $700 $800 $900 $1,000 $1,100 $1,200 6/30/10 9/30/10 12/31/10 3/31/11 6/30/11 Core Maturity Deposits Core Nonmaturity Deposits (1 ) (1 ) CD’s < $100K ($Millions) 15 79% 77% 77% 72% 79% Core Deposits to Total Deposits
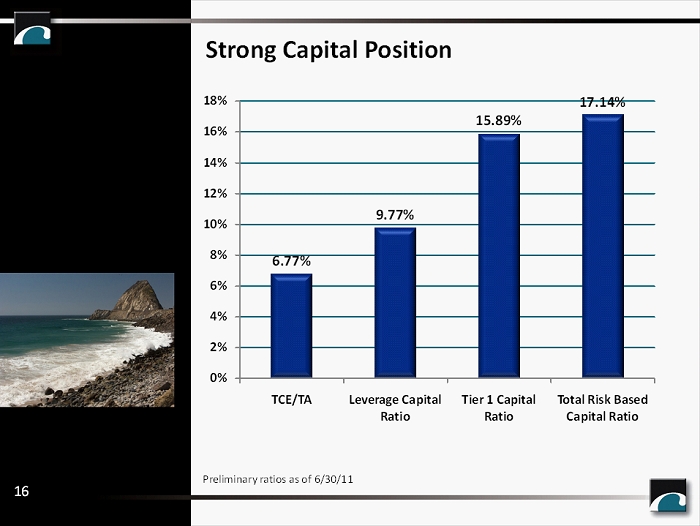
Strong Capital Position 6.77% 9.77% 15.89% 17.14% 0% 2% 4% 6% 8% 10% 12% 14% 16% 18% TCE/TA Leverage Capital Ratio Tier 1 Capital Ratio Total Risk Based Capital Ratio Preliminary ratios as of 6/30/11 16

▪ Redeemed TARP • Completed July 14, 2011 • Used $25 million of proceeds to redeem all 25,000 outstanding TARP series B shares • Will recognize a $1.1 million deemed dividend in connection with redemption in Q3 11 ▪ Received SBLF funds • Issued perpetual preferred stock series C shares to Treasury under its SBLF program • Initial dividend rate on the SBLF series C shares will be 5 % • D ividend rate will vary between 1 percent and 5 percent each quarter for the following nine quarters based on the growth of our eligible loans to small businesses Small Business Lending Fund (SBLF) Program 17

Positive Earnings Momentum ▪ Growing and sustainable top - line revenues ▪ Improved net interest margin ▪ Ability to deploy excess liquidity into quality loans ▪ Positive impact to NIM from continued resolution of NAL ▪ Ongoing benefit from attracting low - cost core deposits 18

Foundation for Our Future ▪ Recruitment of new Chief Banking Officer and Chief Marketing Officer • Plans to stimulate loan and deposit growth • Spearheading initiatives to enhance Brand Awareness ▪ EPS division brings significant new revenue stream • Adds new products and services – prepaid debit cards and merchant card acquiring • Adds low - cost core deposits ▪ Demonstrated capability in: • FDIC - assisted transactions • Whole bank acquisitions • De novo branches and business lines 19
Why First California ▪ Highly attractive deposit base in attractive markets ▪ Superior credit quality ▪ Strong balance sheet ▪ Talent and infrastructure for long - term growth ▪ Continuity of leadership ▪ The capital and liquidity to capitalize on market opportunities 20
