Attached files
| file | filename |
|---|---|
| 8-K - FORM 8-K - NEVADA POWER CO | b87529e8vk.htm |
| EX-99.1 - EX-99.1 - NEVADA POWER CO | b87529exv99w1.htm |
Exhibit 99.2

| Second Quarter 2011 Earnings Call Supplemental Slides August 1, 2011 |

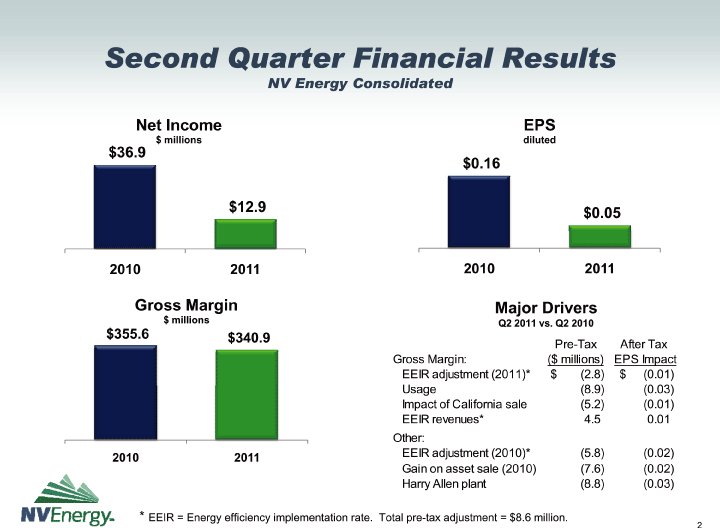
| Second Quarter Financial Results NV Energy Consolidated Major Drivers Q2 2011 vs. Q2 2010 * EEIR = Energy efficiency implementation rate. Total pre-tax adjustment = $8.6 million. |

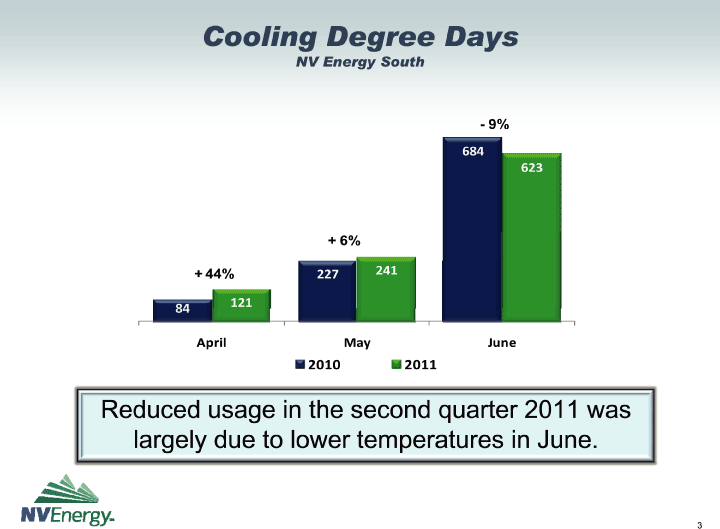
| Cooling Degree Days NV Energy South Reduced usage in the second quarter 2011 was largely due to lower temperatures in June. |

| Quarterly Earnings Are Highly Seasonal NV Energy Consolidated * Revised from $0.78 to $0.75. See Note 18 in 2010 Form 10-K. |

| Customer and Usage Trends NV Energy South * 12 Month Rolling Average |

| Customer and Usage Trends NV Energy North * 12 Month Rolling Average |

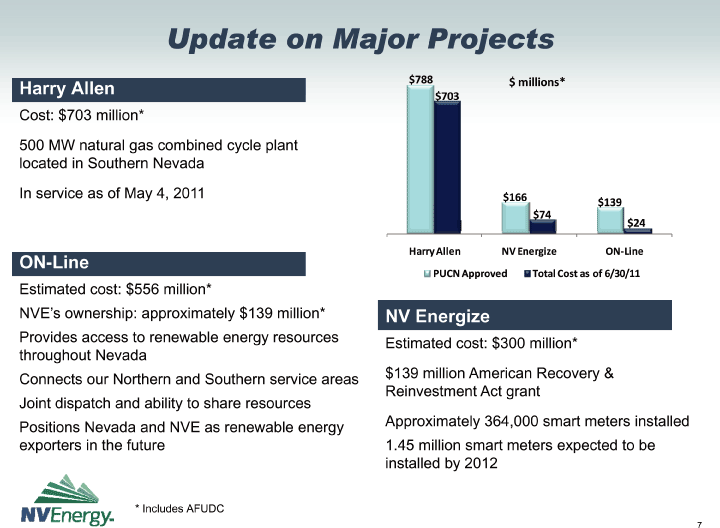
| Update on Major Projects Harry Allen NV Energize ON-Line Cost: $703 million* 500 MW natural gas combined cycle plant located in Southern Nevada In service as of May 4, 2011 Estimated cost: $556 million* NVE's ownership: approximately $139 million* Provides access to renewable energy resources throughout Nevada Connects our Northern and Southern service areas Joint dispatch and ability to share resources Positions Nevada and NVE as renewable energy exporters in the future Estimated cost: $300 million* $139 million American Recovery & Reinvestment Act grant Approximately 364,000 smart meters installed 1.45 million smart meters expected to be installed by 2012 * Includes AFUDC |

| Nevada Economy Shows Signs of Stabilization Southern Nevada Northern Nevada Nevada Unemployment Rate Source: Center for Business and Economic Research, LVCVA, DETR April 2011 taxable sales increased 10.2% compared to last year Construction employment increased by 1.0% as of May 2011, compared to May 2010 Visitor volume decreased 2.8% compared to last year May 2011 gaming revenues decreased 6.6% compared to the previous year Reno total employment fell by 400 jobs in June Nevada accounts for 87% of the total US gold production and is the third largest producer in the world behind South Africa and Australia Hotel/motel occupancy increased 3.6% for YTD May compared to the same period 2010 Visitor volume increased 2.9% compared to last year Gaming revenue increased for the month of May by 19.4% compared to last year Convention attendance increased 8.1% for YTD May compared to same period 2010 Construction employment decreased 15.8% as of May 2011, compared to May 2010 Taxable sales decreased 0.9% compared to last year Las Vegas total employment fell by 4,000 jobs in June |
