Attached files
| file | filename |
|---|---|
| 8-K - 8-K - FIRST NIAGARA FINANCIAL GROUP INC | d8k.htm |
| EX-2.1 - EX-2.1 - FIRST NIAGARA FINANCIAL GROUP INC | dex21.htm |
| EX-99.1 - EX-99.1 - FIRST NIAGARA FINANCIAL GROUP INC | dex991.htm |
 August 1,
2011 Building to be Even Better …
Acquisition of HSBC Upstate NY Branches
Exhibit 99.2 |
 2
Safe Harbor Statement
The information presented may contain forward-looking
statements within the meaning of the Private Securities
Litigation Reform Act of 1995.
These statements are based upon
current beliefs and expectations and are subject to significant
risks and uncertainties (some of which are beyond First Niagara’s
control).
Factors that could cause First Niagara’s results to differ
materially can be found in the risk factors set forth in First
Niagara’s Annual Report on Form 10-K for the year ended
December 31, 2010 and First Niagara’s other filings with the SEC.
|
 3
Unique Opportunity that Creates A Market Leader
Strategically Compelling
–
Upstate NY market share increases from 8% to 22%
–
Adds $11.0 billion in deposits and 100 branches
–
Long standing presence; talented team
Financially Attractive
–
2013 Operating EPS accretion of 11-12%
–
Deposit funding has grown from 70% to 90% of total liabilities
–
ROTCE up more than 400 bps
–
IRR > 20%
Low Risk
–
In market transaction
–
Proven integrator –
prepared and ready
–
Very limited credit risk
Building to be Even Better |
 4
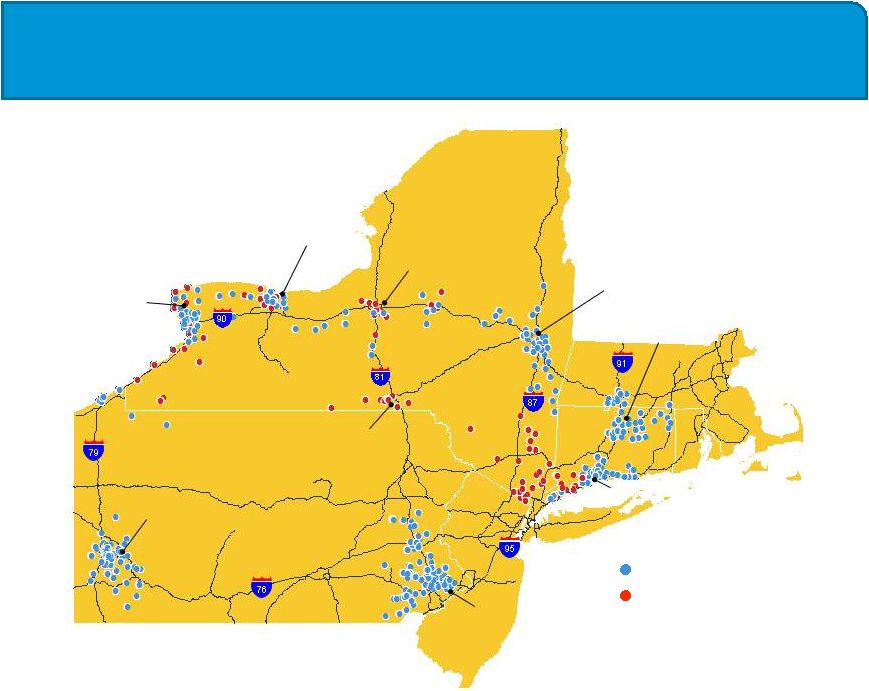
Northeast Regional Banking Profile
First Niagara
HSBC
Pro Forma First Niagara:
•
$38B in assets
•
$30B in deposits
•
$18B in loans
•
450 branches
Acquired Branches:
•
$15B in deposits
•
$3B in loans
•
195 locations
Rochester
Syracuse
Albany
Buffalo
Binghamton
Hartford
New Haven
Philadelphia
Pittsburgh |
 5
Strategically Compelling
•
Accelerates Upstate NY retail growth strategy
•
Solidifies market leadership in Buffalo, Albany, Rochester and Syracuse
•
Adds strong, experienced retail bankers that know our market well
•
Brings scale to business banking, consumer finance and wealth management
•
Connects Lower Hudson to Southern CT markets
Upstate NY
(¹)
BAC, 5%
FNFG,
8%
Citizens,
9%
KEY,
15%
HSBC,
16%
MTB,
22%
BAC,5%
Citizens
%
KEY,
15%
MTB,
22%
FNFG,
22%
9
(1) Combination of Buffalo, Rochester, Syracuse and Albany MSAs; Excludes ~$7B in
HSBC corporate deposits in Buffalo which are not included in this
transaction. Includes impact of estimated divestitures. SNL Data as of June 30, 2010.
|
 6
Key Strengths of Acquired Franchise
•
Well positioned, with a similar strategy
-
Mature, profitable business platform
-
Relationship focused
-
Knows our marketplace
-
Experienced talent
•
Consumer Banking
-
Adds more than 1 million accounts; over 650 thousand retail customers
-
~250 thousand consumer credit card accounts
•
Wealth Management
-
Source of strong fee revenue generation
-
Over 60 financial advisors providing a broad range of financial products
-
Nearly doubles AUM adding $4.3 billion
•
Business Banking
-
Strong relationship between business banking and branch network
-
Focus on deposit gathering and fee income generation
-
Target customer has annual sales of $30 million or less and credit exposure <$3
million |
 7
Financially Attractive
•
EPS accretion of 10-11% in 2012; 11-12% in 2013
•
TBV dilution of 17-18%, earn back period of 4-5 years
•
Drives return on tangible equity up more than 400bps
•
IRR 20-22%; ROIC of approximately 10%
•
Low cost core deposit funding base
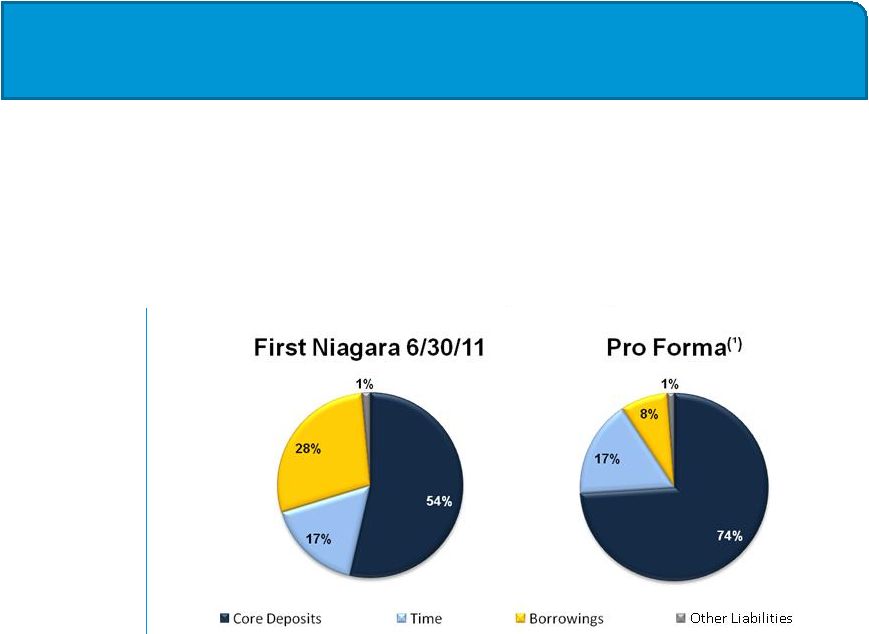
Core Deposits
improve to
74% of total
liabilities
Borrowings
decrease to
8% of total
liabilities
(1): Pro forma based on net increase of $11B deposits.
Liability Funding |
 8
Low Risk
Transaction Risk
•
In market transaction with
deep experience
•
Predictability and stability of
net interest margin
•
Limited credit exposure
•
Readily achievable efficiencies
driven by branch optimizations
•
Strong risk adjusted capital
position
Conversion Risk
•
Branch/deposit deal simpler
than whole bank deal
•
Significant capacity to facilitate
conversion
•
Proven conversion track record
driven by seasoned, deep team
•
Ready and prepared with New
Alliance successfully completed
Highly confident in financial outcomes |
 9
Northeast Regional Profile
•
Leading position to drive profitable growth
•
Significant market share opportunity within major Northeast markets
•
Access to nearly 15 million customers in very attractive markets
$ Billions
Upstate New
York
(1)
Central
Connecticut
(2)
Philadelphia
MSA
Pittsburgh MSA
Market Share
22%
(³)
7%
1%
4%
Ranking
1
4
13
5
Market
Deposits
(4)
$69.5
$67.8
$190.3
$75.2
Population (2010)
3.7M
2.7M
5.9M
2.4M
Median Household
Income (2010)
$54.6K
$61.4K
$64.6K
$49.5K
Source: SNL, Deposit Data as of June 30, 2010
(1) Average of Buffalo, Rochester, Syracuse, and Albany MSAs
(2) Average of New Haven, Hartford, and Springfield MSAs
(3) Does not include ~$7B in HSBC corporate deposits in Buffalo that are not
included in this transaction. Includes impact of estimated divestitures. (4) Includes
Home Office Deposits National
Average
$54.4K |
 10
Transaction Summary
•
Attractive, low cost deposit franchise with 195 branch locations
and $15.0B in deposits; $2.8B in loans
•
6.67% or $1.0B (based on May 31, 2011 deposit balances)
Transaction Scope
•
Common equity raise of $750-800MM prior to closing
•
Debt issuance of $350-400MM prior to closing
•
Timing to be determined based on market conditions
Capital Issuance
•
OCC approval; Other customary conditions
•
First Niagara shareholder approval not required
Closing Conditions
•
First Half of 2012
Expected Closing
Branch Optimization
•
Expected divestitures and consolidations include approximately
100 locations
•
Deposits per branch in Upstate NY increases by 40-45% to
~$80MM per branch
•
Net retention of approximately $11.0B in deposits; $2.0B in loans
Deposit premium |
 11
Financially
Attractive Transaction
•
10-11% accretive to 2012 operating EPS
•
11-12% accretive to 2013 operating EPS
Accretion
•
20-22% IRR
IRR
•
6.67% total deposit premium
•
Deposit premium comparable to recent industry deals, with lower cost of
deposits and business risk
Attractive
Comparative Pricing
•
2013 ROATCE: ~19%
•
ROA: ~1.20%
ROE & ROA
•
Tangible book value per share dilution of 17-18% at close
•
4-5 year earn back period
Tangible Book Value
per Share
Pro Forma Metrics |
 First Niagara
/ HSBC Median of Selected
Transactions
(1)
Transaction Metrics
Deposit Premium
6.67%
8.40%
1-Mile Branch Overlap
(2)
~30%
5%
Target’s Financial Metrics
(3)
Cost of Deposits
0.3%
0.8%
NPAs / Assets
0.0%
1.8%
Transaction Pricing
(1)
Source: SNL Financial. Based on
selected bank transactions with at least $1B of deposits in the last 12
months (2)
Overlap as a percentage of acquired branches
(3)
Metrics for selected transactions based on most recent quarter prior to transaction
announcement 12 |
 13
Key Financial Assumptions
On Acquired Operations
Incremental Loan Growth
$100-200MM per year
Loan Credit Mark
3% of loans outstanding at close (~$80MM)
Deposit Attrition
~5% of total deposits over 9 months post close
Core Deposit Intangibles
2.0% of deposits, amortized using SYD over 8 years
Balance Sheet Restructuring
~$5B wholesale liability pay down at close
Net Interest Margin
(1)
4.50%-5.00%
Noninterest Income
0.80%-0.90% of average deposits
Synergy-Adjusted Operating Costs
~1.4% of average deposits
Provisions
Target reserves of 1.20% of new loan originations
Restructuring Expenses
$150-$175MM (pre-tax) expensed 100% in 2012
Income Tax Treatment
CDI and goodwill are tax deductible
(1)
Represents net interest margin on the incremental increase in First Niagara’s earning
assets of approximately $6B following wholesale liability pay down |
 14
Pro Forma Capital & Liquidity Impact
•
Strong Pro Forma capital ratios reflect risk profile
•
Low risk, highly liquid balance sheet
Ratios
First Niagara
(6/30/2011)
Pro Forma with
HSBC (At Close)
TCE/TA
7.4%
6.0%-6.3%
Tier 1 Common Capital
11.4%
9.6-10.0%
Tier 1 Risk Based Capital
12.0%
10.1-10.5%
Total Risk Based Capital
12.7%
12.3-12.7%
Tier 1 Leverage
7.8%
6.3-6.5%
RWA / Assets
57%
~55%
Loans / Deposits
85%
~65%
Deposits / Total Liabilities
70%
~90%
Note: All capital ratios are at the consolidated level and assumes divestitures occur in the
same quarter as the acquisition |
 15
•
Liquidity will be used to pay down ~$5B in wholesale funding; 100-110 basis points
improvement
•
Significant benefit to funding profile and cost; acquired deposit cost 32 basis points
6249 LRA
Improved Funding Profile
Cost of Funds
(1)
0.75%
Total Deposits
$19B
Total Borrowings
$8B
Cost of Funds
(1)
0.52%
Total Deposits
$30B
Total Borrowings
$3B
First Niagara (6/30/11)
Pro Forma
(1)
Calculated using weighted average cost of funding for deposits and borrowings as of most
recent quarter |
 •
Transaction affords an opportunity to diversify securities portfolio, reducing MBS
concentration, while minimizing interest rate risk
•
Cash flow profile of pro forma investment portfolio supports strong liquidity position and
allows for redeployment into loans
High Grade Securities Portfolio
First Niagara (6/30/11)
Pro Forma
Securities Portfolio Composition
16
Market
Value
$11B
Market Value
$14B |
 17
•
Primarily branch related portfolio
•
Excludes
loans
60
days
or
more delinquent
•
Conducted extensive due diligence
–
Reviewed by in-market First Niagara credit
team
–
Focused on underwriting quality and
regulatory compliance
•
Estimated credit mark at closing ~3.0%
Loan Portfolio Composition
(1)
Total Acquired Loans
$2.8B
Net Retained Loans
$2.0B
(1)
Balance excludes 60+ delinquent loans, as of May 30, 2011.
Acquired Loan Portfolio |
 18
Proven Integrator
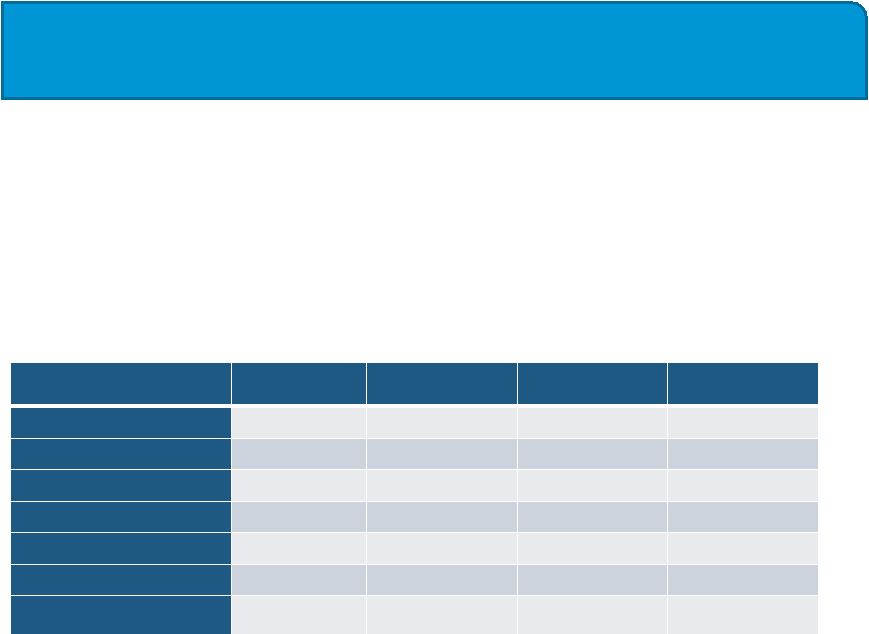
Source: SNL Financial for acquired balances
Percentage calculations based on First Niagara’s prior reported quarter
(1) Represents Pro Forma net retained operations
$ in Billions
National City
Harleysville
NewAlliance
HSBC
(1)
Date of Close
Sept, 2009
April, 2010
April, 2011
Assets
3.9
5.6
8.7
11.0
% of First Niagara assets
34%
38%
41%
35%
Loans
0.8
3.5
4.9
2.0
% of First Niagara loans
12%
48%
46%
12%
Deposits
3.9
4.1
5.1
11.0
% of First Niagara deposits
62%
42%
38%
58%
•
Experienced leadership and integration team
–
Deep talent pool dedicated to conversions / integrations
•
Comprehensive and tested project plans
–
Simultaneous close / convert process
•
Existing market presence further deepens experience
•
Consistent track record of core deposit retention
•
Solid post-acquisition loan growth in new markets |
 19
Unique Opportunity that Creates A Market Leader
Strategically Compelling
–
Upstate NY market share increases from 8% to 22%
–
Adds $11.0 billion in deposits and 100 branches
–
Long standing presence; talented team
Financially Attractive
–
2013 Operating EPS accretion of 11-12%
–
Deposit funding has grown from 70% to 90% of total liabilities
–
ROTCE up more than 400 bps
–
IRR > 20%
Low Risk
–
In market transaction
–
Proven integrator –
prepared and ready
–
Very limited credit risk
Building to be Even Better |
 Q&A
|
