Attached files
| file | filename |
|---|---|
| 8-K - 8-K - NEWELL BRANDS INC. | d8k.htm |
Exhibit 99.1

|
||
| > News Release |
Newell Rubbermaid Reports Second Quarter 2011 Results
» Sales growth of 5.1%;
» Normalized EPS of $0.46
ATLANTA, July 29, 2011 – Newell Rubbermaid (NYSE: NWL) today announced second quarter 2011 sales growth of 5.1%, gross margin of 37.5 percent and normalized diluted earnings per share of $0.46.
“Overall our second quarter performance was in line with the guidance we communicated in early June,” said Michael Polk, President and Chief Executive Officer. “We are experiencing good progress in many areas of the business. Our new product innovations are gaining traction in the marketplace, and our Latin America and Asia Pacific businesses continue to deliver strong growth. This underlying momentum is tempered by difficult U.S. and European economies and the ongoing challenges in the baby and parenting category. In this context we now expect to deliver core sales growth in the back half between three and five percent. This lower sales growth expectation will translate to full year normalized EPS in the range of $1.55 – $1.62 and operating cash flow between $520 and $560 million.”
Polk, who recently joined the company as President and CEO, added “I am very excited to be leading Newell Rubbermaid. I believe we have the people, brands and resources required to deliver our upside potential. There are significant opportunities to accelerate growth and improve the profitability of our business by more effective commercialization of our products and innovation, more complete deployment of our portfolio across our existing channel and geographic footprint and by expanding more aggressively into faster growing emerging markets. To get this done, we will continue to improve our cost structure and reduce working capital to free up the fuel for growth.”
Net sales in the second quarter were $1.57 billion, an increase of 5.1 percent over the prior year. Core sales grew 1.9 percent and foreign currency had a positive 3.2 percent impact on sales. The company estimates that core sales in the prior year’s second quarter were negatively impacted by approximately $35 million due to pre-buying by certain customers in anticipation of an April 2010 SAP go live. Adjusting for this timing difference, second quarter 2011 core sales would have declined by 0.4 percent.
Gross margin for the quarter was 37.5 percent, down 175 basis points from last year due to higher than usual overhead absorption that benefitted the second quarter 2010. In addition, pricing actions lagged input cost inflation in the current year quarter.
Second quarter operating income, on a normalized basis, was $207.9 million, or 13.2 percent of sales, excluding $10.0 million of restructuring and restructuring-related costs incurred in connection with the European Transformation Plan. In 2010, normalized operating income was $226.3 million, or 15.1 percent of sales, excluding $22.8 million in Project Acceleration restructuring costs and restructuring-related costs incurred in connection with the European Transformation Plan.
3 Glenlake Parkway | Atlanta, GA 30328 | Phone +1 (770) 418-7000 | www.newellrubbermaid.com | NYSE: NWL

|
|
||
| > News Release |
The normalized tax rate for the quarter was 26.0 percent compared to 24.8 percent in the prior year. The year-over-year change in tax rate was primarily driven by the geographical mix in earnings.
Normalized earnings were $0.46 per diluted share compared to prior year normalized results of $0.51 per diluted share, as higher sales volume, pricing actions and interest expense savings were offset by the impact of input cost inflation and higher strategic SG&A spending. For the second quarter 2011, normalized diluted earnings per share exclude $0.03 per diluted share for restructuring and restructuring-related costs associated with the European Transformation Plan, net of tax, and $0.07 per diluted share resulting from the reversal of certain tax contingencies due to the expiration of various worldwide statutes of limitation. For the second quarter 2010, normalized diluted earnings per share exclude $0.06 per diluted share for restructuring and restructuring-related costs, net of tax, $0.05 per diluted share of dilution related to the conversion feature of the convertible notes issued in March 2009 and the impact of associated hedge transactions, and a benefit of $0.01 per diluted share related to the impact of hyperinflationary accounting for the company’s Venezuelan operations. (A reconciliation of the “as reported” results to “normalized” results is included below.)
Net income, as reported, was $146.7 million, or $0.49 per diluted share, for the second quarter. This compares to net income of $130.4 million, or $0.41 per diluted share, in the prior year.
The company generated operating cash of $92.8 million during the second quarter, compared to $154.0 million in the comparable period last year. Higher accounts receivable balances due to a shift in the timing of back-to-school orders and the settlement of customer program payments are the primary drivers of the year-over-year change in operating cash flow. Capital expenditures were $51.2 million in the second quarter compared to $37.8 million in the prior year.
A reconciliation of the second quarter 2011 and last year’s results is as follows:
| Q2 2011 | Q2 2010 | |||||||
| Diluted earnings per share (as reported) |
$ | 0.49 | $ | 0.41 | ||||
| Restructuring and restructuring-related costs, net of tax |
$ | 0.03 | $ | 0.06 | ||||
| Convertible notes dilution |
$ | 0.00 | $ | 0.05 | ||||
| Income tax benefit – expiration of statutes of limitation |
($ | 0.07 | ) | $ | 0.00 | |||
| Other items, net of tax |
$ | 0.00 | ($ | 0.01 | ) | |||
| “Normalized” EPS* |
$ | 0.46 | $ | 0.51 | ||||
| * | May not foot due to rounding |
3 Glenlake Parkway | Atlanta, GA 30328 | Phone +1 (770) 418-7000 | www.newellrubbermaid.com | NYSE: NWL
|
|
||
| > News Release |
Six Months Results
Net sales for the six months ended June 30, 2011 increased 2.6 percent to $2.88 billion, compared to $2.80 billion in the prior year. Core sales increased 0.2 percent for the six months and foreign currency translation increased net sales by 2.4 percent.
Gross margin was 37.6 percent, a 20 basis point decline versus the prior year, as productivity gains and pricing largely offset the effect of input cost inflation.
Normalized earnings were $0.75 per diluted share compared to $0.77 per diluted share in the prior year. For the six months ended June 30, 2011, normalized earnings exclude the same items as those in the second quarter 2011, as well as $0.01 per diluted share for a loss related to the retirement of convertible notes. For the six months ended June 30, 2010, normalized earnings excluded the same items as those in the second quarter 2010. (A reconciliation of the “as reported” results to “normalized” results is included below.)
Net income, as reported, was $222.4 million, or $0.75 per diluted share. This compares to $188.8 million, or $0.61 per diluted share, in the prior year.
The company used operating cash flow of $15.5 million during the first six months of 2011 compared to a generation of $183.4 million in the prior year. The year-over-year change in operating cash flow is primarily driven by the settlement of customer programs and higher inventory levels in anticipation of international expansion and new product introductions. Capital expenditures were $96.1 million, compared to $69.3 million in the prior year.
A reconciliation of the first six months 2011 and last year’s results is as follows:
| YTD Q2 2011 | YTD Q2 2010 | |||||||
| Diluted earnings per share (as reported) |
$ | 0.75 | $ | 0.61 | ||||
| Restructuring and restructuring-related costs, net of tax |
$ | 0.06 | $ | 0.10 | ||||
| Income tax benefit – expiration of statutes of limitation |
($ | 0.07 | ) | $ | 0.00 | |||
| Convertible notes dilution |
$ | 0.00 | $ | 0.07 | ||||
| Other items, net of tax |
$ | 0.01 | ($ | 0.01 | ) | |||
|
|
|
|
|
|||||
| “Normalized” EPS |
$ | 0.75 | $ | 0.77 | ||||
3 Glenlake Parkway | Atlanta, GA 30328 | Phone +1 (770) 418-7000 | www.newellrubbermaid.com | NYSE: NWL
|
|
||
| > News Release |
On July 1, 2011, the company divested its BernzOmatic torch and solder business, which generated 2010 sales of $101 million with gross margin below company fleet average. Beginning in the third quarter of 2011, financial results of the BernzOmatic business will be accounted for as discontinued operations in both 2010 and 2011. The impact of the discontinued operations accounting treatment on 2010 and 2011 financial results will be made available simultaneously with the company’s third quarter earnings results. The transaction is anticipated to be marginally dilutive to normalized earnings in both years. “This transaction is squarely in line with our strategy of strengthening the portfolio to drive faster growth and improve our return on invested capital,” said Polk. “Disposing of less strategic businesses and eliminating the related structural cost overhead allows us to focus resources on those businesses and opportunities that can create the most value for our shareholders.”
2011 Full Year Outlook
The company’s second half expectation for core sales growth of three to five percent results in revised guidance for full year 2011 core sales growth of one to three percent. In addition, foreign currency is expected to have an approximate two point positive impact on full year sales.
Gross margin is still expected to improve 40 to 60 basis points with the combination of productivity, mix and pricing more than offsetting input cost inflation.
The company now expects normalized earnings per diluted share in the range of $1.55 to $1.62.
The company’s 2011 normalized EPS expectation excludes approximately $8 million related to the incremental costs associated with its CEO transition and between $80 and $85 million of restructuring and other plan-related costs associated with the company’s European Transformation Plan. The company continues to expect to realize annualized net income improvement of $55 to $65 million upon completion of the European Transformation Plan in 2012, and estimates the initiative will result in aggregate restructuring and other Plan-related costs of $110 to $115 million. (A reconciliation of the “as reported” results to “normalized” results is included below.)
Operating cash flow is now projected at between $520 and $560 million for the full year, including approximately $90 to $100 million in restructuring and restructuring-related cash payments. The company plans to fund capital expenditures of approximately $200 million during the year.
The earlier guidance provided by the company in its June 3, 2011 press release included core sales growth of three to four percent, normalized earnings per diluted share growth of between five and ten percent (or $1.60 to $1.67) and operating cash flow of more than $550 million.
3 Glenlake Parkway | Atlanta, GA 30328 | Phone +1 (770) 418-7000 | www.newellrubbermaid.com | NYSE: NWL
|
|
||
| > News Release |
A reconciliation of the 2011 earnings outlook is as follows:
| FY 2011 | ||||
| Diluted earnings per share* |
$ | 1.35 to $1.42 | ||
| Restructuring and restructuring-related costs, net of tax |
$ | 0.22 to $0.26 | ||
| Incremental costs related to the company’s CEO transition |
$ | 0.02 | ||
| Income tax benefit – expirations of statutes of limitation |
($ | 0.07 | ) | |
| Other items, net of tax |
$ | 0.01 | ||
| “Normalized” EPS* |
$ | 1.55 to $1.62 | ||
| * | Does not include the impact of the company’s BernzOmatic divestiture. |
Conference Call
The company’s second quarter 2011 earnings conference call is scheduled for today, July 29, 2011, at 9:00 am ET. To listen to the webcast, use the link provided under Events & Presentations in the Investor Relations section of Newell Rubbermaid’s Web site at www.newellrubbermaid.com. The webcast will be available for replay for two weeks. A brief supporting slide presentation will be available prior to the call under Quarterly Earnings in the Investor Relations section on the company’s Web site.
Non-GAAP Financial Measures
This release contains non-GAAP financial measures within the meaning of Regulation G promulgated by the Securities and Exchange Commission. Included in this release is a reconciliation of these non-GAAP financial measures to the most directly comparable financial measures calculated in accordance with GAAP.
About Newell Rubbermaid
Newell Rubbermaid Inc., an S&P 500 company, is a global marketer of consumer and commercial products with 2010 sales of approximately $5.8 billion and a strong portfolio of brands, including Rubbermaid®, Sharpie®, Graco®, Calphalon®, Irwin®, Lenox®, Levolor®, Paper Mate®, Dymo®, Waterman®, Parker®, Goody®, and Aprica®.
This press release and additional information about Newell Rubbermaid are available on the company’s Web site, www.newellrubbermaid.com.
Contacts:
| Nancy O’Donnell | David Doolittle | |
| Vice President, Investor Relations | Vice President, Corporate Communications | |
| +1 (770) 418-7723 | +1 (770) 418-7519 |
3 Glenlake Parkway | Atlanta, GA 30328 | Phone +1 (770) 418-7000 | www.newellrubbermaid.com | NYSE: NWL
|
|
||
| > News Release |
Caution Concerning Forward-Looking Statements
Statements in this press release that are not historical in nature constitute forward-looking statements. These forward-looking statements relate to information or assumptions about the effects of sales, income/(loss), earnings per share, operating income or gross margin improvements or declines, Project Acceleration, the European Transformation Plan, the Capital Structure Optimization Plan, capital and other expenditures, cash flow, dividends, restructuring and restructuring related costs, costs and cost savings, inflation or deflation, particularly with respect to commodities such as oil and resin, debt ratings, and management’s plans, projections and objectives for future operations and performance. These statements are accompanied by words such as “anticipate,” “expect,” “project,” “will,” “believe,” “estimate” and similar expressions. Actual results could differ materially from those expressed or implied in the forward-looking statements. Important factors that could cause actual results to differ materially from those suggested by the forward-looking statements include, but are not limited to, our dependence on the strength of retail, commercial and industrial sectors of the economy in light of the global economic slowdown; currency fluctuations; competition with other manufacturers and distributors of consumer products; major retailers’ strong bargaining power; changes in the prices of raw materials and sourced products and our ability to obtain raw materials and sourced products in a timely manner from suppliers; our ability to develop innovative new products and to develop, maintain and strengthen our end-user brands; our ability to expeditiously close facilities and move operations while managing foreign regulations and other impediments; our ability to implement successfully information technology solutions throughout our organization; our ability to improve productivity and streamline operations; changes to our credit ratings; significant increases in the funding obligations related to our pension plans due to declining asset values or otherwise; the imposition of tax liabilities greater than our provisions for such matters; the risks inherent in our foreign operations and those factors listed in the company’s latest quarterly report on Form 10-Q, and exhibit 99.1 thereto, filed with the Securities and Exchange Commission. Changes in such assumptions or factors could produce significantly different results. The information contained in this news release is as of the date indicated. The company assumes no obligation to update any forward-looking statements contained in this news release as a result of new information or future events or developments.
NWL-EA
3 Glenlake Parkway | Atlanta, GA 30328 | Phone +1 (770) 418-7000 | www.newellrubbermaid.com | NYSE: NWL
Newell Rubbermaid Inc.
CONSOLIDATED STATEMENTS OF OPERATIONS (UNAUDITED)
(in millions, except per share data)
Reconciliation of “As Reported” Results to “Normalized” Results
| Three Months Ended June 30, | ||||||||||||||||||||||||||||
| 2011 | 2010 | YOY % Change |
||||||||||||||||||||||||||
| As Reported | Excluded Items (1) | Normalized | As Reported | Excluded Items (2) | Normalized | |||||||||||||||||||||||
| Net sales |
$ | 1,572.8 | $ | — | $ | 1,572.8 | $ | 1,496.2 | $ | — | $ | 1,496.2 | 5.1 | % | ||||||||||||||
| Cost of products sold |
982.9 | — | 982.9 | 908.9 | — | 908.9 | ||||||||||||||||||||||
| GROSS MARGIN |
589.9 | — | 589.9 | 587.3 | — | 587.3 | 0.4 | % | ||||||||||||||||||||
| % of sales |
37.5 | % | 37.5 | % | 39.3 | % | 39.3 | % | ||||||||||||||||||||
| Selling, general & administrative expenses |
391.0 | (9.0 | ) | 382.0 | 362.6 | (1.6 | ) | 361.0 | 5.8 | % | ||||||||||||||||||
| % of sales |
24.9 | % | 24.3 | % | 24.2 | % | 24.1 | % | ||||||||||||||||||||
| Restructuring costs |
1.0 | (1.0 | ) | — | 21.2 | (21.2 | ) | — | ||||||||||||||||||||
| OPERATING INCOME |
197.9 | 10.0 | 207.9 | 203.5 | 22.8 | 226.3 | (8.1 | )% | ||||||||||||||||||||
| % of sales |
12.6 | % | 13.2 | % | 13.6 | % | 15.1 | % | ||||||||||||||||||||
| Nonoperating expenses: |
||||||||||||||||||||||||||||
| Interest expense, net |
21.3 | — | 21.3 | 33.2 | — | 33.2 | ||||||||||||||||||||||
| Other expense (income), net |
3.6 | — | 3.6 | (5.9 | ) | 5.6 | (0.3 | ) | ||||||||||||||||||||
| 24.9 | — | 24.9 | 27.3 | 5.6 | 32.9 | (24.3 | )% | |||||||||||||||||||||
| INCOME BEFORE INCOME TAXES |
173.0 | 10.0 | 183.0 | 176.2 | 17.2 | 193.4 | (5.4 | )% | ||||||||||||||||||||
| % of sales |
11.0 | % | 11.6 | % | 11.8 | % | 12.9 | % | ||||||||||||||||||||
| Income taxes |
26.3 | 21.3 | 47.6 | 45.8 | 2.2 | 48.0 | (0.8 | )% | ||||||||||||||||||||
| Effective rate |
15.2 | % | 26.0 | % | 26.0 | % | 24.8 | % | ||||||||||||||||||||
| NET INCOME (3) |
$ | 146.7 | $ | (11.3 | ) | $ | 135.4 | $ | 130.4 | $ | 15.0 | $ | 145.4 | (6.9 | )% | |||||||||||||
| % of sales |
9.3 | % | 8.6 | % | 8.7 | % | 9.7 | % | ||||||||||||||||||||
| EARNINGS PER SHARE: |
||||||||||||||||||||||||||||
| Basic |
$ | 0.50 | $ | (0.04 | ) | $ | 0.46 | $ | 0.46 | $ | 0.06 | $ | 0.52 | |||||||||||||||
| Diluted |
$ | 0.49 | $ | (0.03 | ) | $ | 0.46 | $ | 0.41 | $ | 0.10 | $ | 0.51 | |||||||||||||||
| AVERAGE SHARES OUTSTANDING: |
||||||||||||||||||||||||||||
| Basic |
294.3 | 294.3 | 281.5 | 281.5 | ||||||||||||||||||||||||
| Diluted |
304.9 | 304.9 | 315.4 | 292.6 | ||||||||||||||||||||||||
| (1) | Items excluded from “normalized” results for 2011 consist of $9.0 million of restructuring related costs and $1.0 million of restructuring costs incurred in connection with the European Transformation Plan, net of tax effects, as well as $20.8 million of income tax benefits primarily resulting from the reduction of unrecognized tax benefits for items for which the statute of limitations expired. |
| (2) | Items excluded from “normalized” results for 2010 consist of the net of tax impact of $1.6 million of restructuring related costs incurred in connection with the European Transformation Plan, $21.2 million of Project Acceleration restructuring costs, including asset impairment charges and employee termination and other costs, net of tax effects, the net of tax impact of a $5.6 million gain resulting from hyperinflationary accounting for the Company’s Venezuelan operations, as well as the dilutive impact of the conversion feature of the convertible notes issued in March 2009 and the associated hedge transactions. |
| (3) | Net income attributable to noncontrolling interests was not material in either of the periods presented. |
Newell Rubbermaid Inc.
CONSOLIDATED STATEMENTS OF OPERATIONS (UNAUDITED)
(in millions, except per share data)
Reconciliation of “As Reported” Results to “Normalized” Results
| Six Months Ended June 30, | ||||||||||||||||||||||||||||
| 2011 | 2010 | YOY % Change |
||||||||||||||||||||||||||
| As Reported | Excluded Items (1) | Normalized | As Reported | Excluded Items (2) | Normalized | |||||||||||||||||||||||
| Net sales |
$ | 2,875.5 | $ | — | $ | 2,875.5 | $ | 2,802.6 | $ | — | $ | 2,802.6 | 2.6 | % | ||||||||||||||
| Cost of products sold |
1,794.7 | — | 1,794.7 | 1,743.6 | — | 1,743.6 | ||||||||||||||||||||||
| GROSS MARGIN |
1,080.8 | — | 1,080.8 | 1,059.0 | — | 1,059.0 | 2.1 | % | ||||||||||||||||||||
| % of sales |
37.6 | % | 37.6 | % | 37.8 | % | 37.8 | % | ||||||||||||||||||||
| Selling, general & administrative expenses |
745.5 | (14.3 | ) | 731.2 | 688.2 | (1.6 | ) | 686.6 | 6.5 | % | ||||||||||||||||||
| % of sales |
25.9 | % | 25.4 | % | 24.6 | % | 24.5 | % | ||||||||||||||||||||
| Restructuring costs |
6.8 | (6.8 | ) | — | 37.2 | (37.2 | ) | — | ||||||||||||||||||||
| OPERATING INCOME |
328.5 | 21.1 | 349.6 | 333.6 | 38.8 | 372.4 | (6.1 | )% | ||||||||||||||||||||
| % of sales |
11.4 | % | 12.2 | % | 11.9 | % | 13.3 | % | ||||||||||||||||||||
| Nonoperating expenses: |
||||||||||||||||||||||||||||
| Interest expense, net |
43.2 | — | 43.2 | 65.2 | — | 65.2 | ||||||||||||||||||||||
| Loss related to extinguishment of debt |
4.8 | (4.8 | ) | — | — | — | — | |||||||||||||||||||||
| Other expense (income), net |
5.1 | — | 5.1 | (6.2 | ) | 5.6 | (0.6 | ) | ||||||||||||||||||||
| 53.1 | (4.8 | ) | 48.3 | 59.0 | 5.6 | 64.6 | (25.2 | )% | ||||||||||||||||||||
| INCOME BEFORE INCOME TAXES |
275.4 | 25.9 | 301.3 | 274.6 | 33.2 | 307.8 | (2.1 | )% | ||||||||||||||||||||
| % of sales |
9.6 | % | 10.5 | % | 9.8 | % | 11.0 | % | ||||||||||||||||||||
| Income taxes |
53.0 | 24.2 | 77.2 | 85.8 | 4.7 | 90.5 | (14.7 | )% | ||||||||||||||||||||
| Effective rate |
19.2 | % | 25.6 | % | 31.2 | % | 29.4 | % | ||||||||||||||||||||
| NET INCOME (3) |
$ | 222.4 | $ | 1.7 | $ | 224.1 | $ | 188.8 | $ | 28.5 | $ | 217.3 | 3.1 | % | ||||||||||||||
| % of sales |
7.7 | % | 7.8 | % | 6.7 | % | 7.8 | % | ||||||||||||||||||||
| EARNINGS PER SHARE: |
||||||||||||||||||||||||||||
| Basic |
$ | 0.76 | $ | — | $ | 0.76 | $ | 0.67 | $ | 0.10 | $ | 0.77 | ||||||||||||||||
| Diluted |
$ | 0.75 | $ | — | $ | 0.75 | $ | 0.61 | $ | 0.16 | $ | 0.77 | ||||||||||||||||
| AVERAGE SHARES OUTSTANDING: |
||||||||||||||||||||||||||||
| Basic |
294.2 | 294.2 | 281.3 | 281.3 | ||||||||||||||||||||||||
| Diluted |
297.4 | 297.4 | 311.6 | 283.6 | ||||||||||||||||||||||||
| (1) | Items excluded from “normalized” results for 2011 consist of $14.3 million of restructuring related costs and $6.8 million of restructuring costs incurred in connection with the European Transformation Plan, net of tax effects, the net of tax impact of $4.8 million of debt extinguishment costs incurred to exchange substantially all of the remaining convertible notes issued during March 2009 and $20.8 million of income tax benefits primarily resulting from the reduction of unrecognized tax benefits for items for which the statute of limitations expired. |
| (2) | Items excluded from “normalized” results for 2010 consist of the net of tax impact of $1.6 million of restructuring related costs incurred in connection with the European Transformation Plan, $37.2 million of Project Acceleration restructuring costs, including asset impairment charges and employee termination and other costs, net of tax effects, the net of tax impact of a $5.6 million gain resulting from hyperinflationary accounting for the Company’s Venezuelan operations, as well as the dilutive impact of the conversion feature of the convertible notes issued in March 2009 and the associated hedge transactions. |
| (3) | Net income attributable to noncontrolling interests was not material in either of the periods presented. |
Newell Rubbermaid Inc.
CONSOLIDATED BALANCE SHEETS (UNAUDITED)
(in millions)
| June 30, | June 30, | |||||||
| 2011 | 2010 | |||||||
| Assets: |
||||||||
| Cash and cash equivalents |
$ | 143.6 | $ | 259.8 | ||||
| Accounts receivable, net |
1,139.9 | 1,037.6 | ||||||
| Inventories, net |
933.2 | 802.4 | ||||||
| Deferred income taxes |
167.8 | 195.7 | ||||||
| Prepaid expenses and other |
147.7 | 105.3 | ||||||
|
|
|
|
|
|||||
| Total Current Assets |
2,532.2 | 2,400.8 | ||||||
| Property, plant and equipment, net |
544.6 | 536.3 | ||||||
| Goodwill |
2,800.4 | 2,701.7 | ||||||
| Other intangible assets, net |
668.4 | 636.6 | ||||||
| Other assets |
346.9 | 289.1 | ||||||
|
|
|
|
|
|||||
| Total Assets |
$ | 6,892.5 | $ | 6,564.5 | ||||
|
|
|
|
|
|||||
| Liabilities and Stockholders’ Equity: |
||||||||
| Accounts payable |
$ | 659.1 | $ | 597.2 | ||||
| Accrued compensation |
115.7 | 122.0 | ||||||
| Other accrued liabilities |
625.5 | 651.0 | ||||||
| Short-term debt |
313.9 | 1.0 | ||||||
| Current portion of long-term debt |
408.8 | 393.0 | ||||||
|
|
|
|
|
|||||
| Total Current Liabilities |
2,123.0 | 1,764.2 | ||||||
| Long-term debt |
1,805.5 | 2,049.3 | ||||||
| Other noncurrent liabilities |
779.3 | 852.1 | ||||||
| Stockholders’ Equity - Parent |
2,181.2 | 1,895.4 | ||||||
| Stockholders’ Equity - Noncontrolling Interests |
3.5 | 3.5 | ||||||
|
|
|
|
|
|||||
| Total Stockholders’ Equity |
2,184.7 | 1,898.9 | ||||||
|
|
|
|
|
|||||
| Total Liabilities and Stockholders' Equity |
$ | 6,892.5 | $ | 6,564.5 | ||||
|
|
|
|
|
|||||
Newell Rubbermaid Inc.
CONSOLIDATED STATEMENTS OF CASH FLOW (UNAUDITED)
(in millions)
| Six Months Ended June 30, | ||||||||
| 2011 | 2010 | |||||||
| Operating Activities: |
||||||||
| Net income |
$ | 222.4 | $ | 188.8 | ||||
| Adjustments to reconcile net income to net cash (used in) provided by operating activities: |
||||||||
| Depreciation and amortization |
81.5 | 86.9 | ||||||
| Loss related to extinguishment of debt |
4.8 | — | ||||||
| Deferred income taxes |
56.2 | 16.7 | ||||||
| Non-cash restructuring (benefits) costs |
(1.2 | ) | 1.9 | |||||
| Stock-based compensation expense |
16.7 | 18.8 | ||||||
| Other |
10.4 | 12.7 | ||||||
| Changes in operating assets and liabilities, excluding the effects of acquisitions: |
||||||||
| Accounts receivable |
(122.8 | ) | (165.1 | ) | ||||
| Inventories |
(215.2 | ) | (131.8 | ) | ||||
| Accounts payable |
178.2 | 172.4 | ||||||
| Accrued liabilities and other |
(246.5 | ) | (17.9 | ) | ||||
| Net cash (used in) provided by operating activities |
$ | (15.5 | ) | $ | 183.4 | |||
| Investing Activities: |
||||||||
| Acquisitions and acquisition related activity |
$ | (18.9 | ) | $ | (1.5 | ) | ||
| Capital expenditures |
(96.1 | ) | (69.3 | ) | ||||
| Proceeds from sales of noncurrent assets |
4.1 | 8.7 | ||||||
| Other |
(5.1 | ) | (2.0 | ) | ||||
| Net cash used in investing activities |
$ | (116.0 | ) | $ | (64.1 | ) | ||
| Financing Activities: |
||||||||
| Net short-term borrowings |
$ | 177.8 | $ | — | ||||
| Proceeds from issuance of debt, net of debt issuance costs |
1.1 | 2.4 | ||||||
| Payments on notes payable and debt |
(0.8 | ) | (108.4 | ) | ||||
| Cash consideration paid in convertible note exchange |
(3.1 | ) | — | |||||
| Cash dividends |
(38.1 | ) | (28.0 | ) | ||||
| Other, net |
(4.5 | ) | (3.1 | ) | ||||
| Net cash provided by (used in) financing activities |
$ | 132.4 | $ | (137.1 | ) | |||
| Currency rate effect on cash and cash equivalents |
$ | 3.1 | $ | (0.7 | ) | |||
| Increase (decrease) in cash and cash equivalents |
$ | 4.0 | $ | (18.5 | ) | |||
| Cash and cash equivalents at beginning of period |
139.6 | 278.3 | ||||||
| Cash and cash equivalents at end of period |
$ | 143.6 | $ | 259.8 | ||||
Newell Rubbermaid Inc.
Financial Worksheet
(In Millions)
| 2011 | 2010 | |||||||||||||||||||||||||||||||||||||||||||||||||||||||
| Reconciliation (1) | Reconciliation (2) | Year-over-year changes | ||||||||||||||||||||||||||||||||||||||||||||||||||||||
| Net Sales | Reported OI |
Excluded Items |
Normalized OI |
Operating Margin |
Net Sales | Reported OI |
Excluded Items |
Normalized OI |
Operating Margin |
Net Sales | Normalized OI | |||||||||||||||||||||||||||||||||||||||||||||
| $ | % | $ | % | |||||||||||||||||||||||||||||||||||||||||||||||||||||
| Q1: |
||||||||||||||||||||||||||||||||||||||||||||||||||||||||
| Home & Family |
$ | 534.1 | $ | 56.6 | $ | — | $ | 56.6 | 10.6 | % | $ | 556.9 | $ | 68.8 | $ | — | $ | 68.8 | 12.4 | % | $ | (22.8 | ) | (4.1 | )% | $ | (12.2 | ) | (17.7 | )% | ||||||||||||||||||||||||||
| Office Products |
364.9 | 54.9 | — | 54.9 | 15.0 | % | 351.6 | 47.3 | — | 47.3 | 13.5 | % | 13.3 | 3.8 | % | 7.6 | 16.1 | % | ||||||||||||||||||||||||||||||||||||||
| Tools, Hardware & Commercial Products |
403.7 | 49.4 | — | 49.4 | 12.2 | % | 397.9 | 51.6 | — | 51.6 | 13.0 | % | 5.8 | 1.5 | % | (2.2 | ) | (4.3 | )% | |||||||||||||||||||||||||||||||||||||
| Restructuring Costs |
— | (5.8 | ) | 5.8 | — | — | (16.0 | ) | 16.0 | — | ||||||||||||||||||||||||||||||||||||||||||||||
| Corporate |
— | (24.5 | ) | 5.3 | (19.2 | ) | — | (21.6 | ) | — | (21.6 | ) | 2.4 | 11.1 | % | |||||||||||||||||||||||||||||||||||||||||
| Total |
$ | 1,302.7 | $ | 130.6 | $ | 11.1 | $ | 141.7 | 10.9 | % | $ | 1,306.4 | $ | 130.1 | $ | 16.0 | $ | 146.1 | 11.2 | % | $ | (3.7 | ) | (0.3 | )% | $ | (4.4 | ) | (3.0 | )% | ||||||||||||||||||||||||||
| 2011 | 2010 | |||||||||||||||||||||||||||||||||||||||||||||||||||||||
| Reconciliation (1) | Reconciliation (1, 2) | Year-over-year changes | ||||||||||||||||||||||||||||||||||||||||||||||||||||||
| Reported OI |
Excluded Items |
Normalized OI |
Operating Margin |
Net Sales | Reported OI |
Excluded Items |
Normalized OI |
Operating Margin |
Net Sales | Normalized OI | ||||||||||||||||||||||||||||||||||||||||||||||
| Net Sales | $ | % | $ | % | ||||||||||||||||||||||||||||||||||||||||||||||||||||
| Q2: |
||||||||||||||||||||||||||||||||||||||||||||||||||||||||
| Home & Family |
$ | 601.4 | $ | 64.6 | $ | — | $ | 64.6 | 10.7 | % | $ | 592.0 | $ | 75.6 | $ | — | $ | 75.6 | 12.8 | % | $ | 9.4 | 1.6 | % | $ | (11.0 | ) | (14.6 | )% | |||||||||||||||||||||||||||
| Office Products |
499.9 | 96.3 | — | 96.3 | 19.3 | % | 483.5 | 99.4 | — | 99.4 | 20.6 | % | 16.4 | 3.4 | % | (3.1 | ) | (3.1 | )% | |||||||||||||||||||||||||||||||||||||
| Tools, Hardware & Commercial Products |
471.5 | 67.2 | — | 67.2 | 14.3 | % | 420.7 | 70.1 | — | 70.1 | 16.7 | % | 50.8 | 12.1 | % | (2.9 | ) | (4.1 | )% | |||||||||||||||||||||||||||||||||||||
| Restructuring Costs |
— | (1.0 | ) | 1.0 | — | — | (21.2 | ) | 21.2 | — | ||||||||||||||||||||||||||||||||||||||||||||||
| Corporate |
— | (29.2 | ) | 9.0 | (20.2 | ) | — | (20.4 | ) | 1.6 | (18.8 | ) | (1.4 | ) | (7.4 | )% | ||||||||||||||||||||||||||||||||||||||||
| Total |
$ | 1,572.8 | $ | 197.9 | $ | 10.0 | $ | 207.9 | 13.2 | % | $ | 1,496.2 | $ | 203.5 | $ | 22.8 | $ | 226.3 | 15.1 | % | $ | 76.6 | 5.1 | % | $ | (18.4 | ) | (8.1 | )% | |||||||||||||||||||||||||||
| 2011 | 2010 | |||||||||||||||||||||||||||||||||||||||||||||||||||||||
| Reconciliation (1) | Reconciliation (1, 2) | Year-over-year changes | ||||||||||||||||||||||||||||||||||||||||||||||||||||||
| Reported OI |
Excluded Items |
Normalized OI |
Operating Margin |
Net Sales | Reported OI |
Excluded Items |
Normalized OI |
Operating Margin |
Net Sales | Normalized OI | ||||||||||||||||||||||||||||||||||||||||||||||
| Net Sales | $ | % | $ | % | ||||||||||||||||||||||||||||||||||||||||||||||||||||
| YTD: |
||||||||||||||||||||||||||||||||||||||||||||||||||||||||
| Home & Family |
$ | 1,135.5 | $ | 121.2 | $ | — | $ | 121.2 | 10.7 | % | $ | 1,148.9 | $ | 144.4 | $ | — | $ | 144.4 | 12.6 | % | $ | (13.4 | ) | (1.2 | )% | $ | (23.2 | ) | (16.1 | )% | ||||||||||||||||||||||||||
| Office Products |
864.8 | 151.2 | — | 151.2 | 17.5 | % | 835.1 | 146.7 | — | 146.7 | 17.6 | % | 29.7 | 3.6 | % | 4.5 | 3.1 | % | ||||||||||||||||||||||||||||||||||||||
| Tools, Hardware & Commercial Products |
875.2 | 116.6 | — | 116.6 | 13.3 | % | 818.6 | 121.7 | — | 121.7 | 14.9 | % | 56.6 | 6.9 | % | (5.1 | ) | (4.2 | )% | |||||||||||||||||||||||||||||||||||||
| Restructuring Costs |
— | (6.8 | ) | 6.8 | — | — | (37.2 | ) | 37.2 | — | ||||||||||||||||||||||||||||||||||||||||||||||
| Corporate |
— | (53.7 | ) | 14.3 | (39.4 | ) | — | (42.0 | ) | 1.6 | (40.4 | ) | 1.0 | 2.5 | % | |||||||||||||||||||||||||||||||||||||||||
| Total |
$ | 2,875.5 | $ | 328.5 | $ | 21.1 | $ | 349.6 | 12.2 | % | $ | 2,802.6 | $ | 333.6 | $ | 38.8 | $ | 372.4 | 13.3 | % | $ | 72.9 | 2.6 | % | $ | (22.8 | ) | (6.1 | )% | |||||||||||||||||||||||||||
| (1) | Excluded items consist of restructuring and restructuring related costs incurred in connection with the European Transformation Plan. |
| (2) | Excluded items are related to Project Acceleration restructuring costs. |
Newell Rubbermaid Inc.
Calculation of Free Cash Flow (1)
| Three Months Ended June 30, | ||||||||
| 2011 | 2010 | |||||||
| Free Cash Flow (in millions): |
||||||||
| Net cash provided by operating activities |
$ | 92.8 | $ | 154.0 | ||||
| Capital expenditures |
(51.2 | ) | (37.8 | ) | ||||
| Free Cash Flow |
$ | 41.6 | $ | 116.2 | ||||
| Six Months Ended June 30, | ||||||||
| 2011 | 2010 | |||||||
| Free Cash Flow (in millions): |
||||||||
| Net cash (used in) provided by operating activities |
$ | (15.5 | ) | $ | 183.4 | |||
| Capital expenditures |
(96.1 | ) | (69.3 | ) | ||||
| Free Cash Flow |
$ | (111.6 | ) | $ | 114.1 | |||
| (1) | Free Cash Flow is defined as cash flow (used in) provided by operating activities less capital expenditures. |
Newell Rubbermaid Inc.
Three Months Ended June 30, 2011
In Millions
Currency Analysis
| 2011 | 2010 | Year-Over-Year (Decrease) Increase | ||||||||||||||||||||||||||
| Sales as Reported |
Currency Impact |
Adjusted Sales |
Sales as Reported |
Excluding Currency |
Including Currency |
Currency Impact |
||||||||||||||||||||||
| By Segment | ||||||||||||||||||||||||||||
| Home & Family |
$ | 601.4 | $ | (11.9 | ) | $ | 589.5 | $ | 592.0 | (0.4 | )% | 1.6 | % | 2.0 | % | |||||||||||||
| Office Products |
499.9 | (22.6 | ) | 477.3 | 483.5 | (1.3 | )% | 3.4 | % | 4.7 | % | |||||||||||||||||
| Tools, Hardware & Commercial Products |
471.5 | (14.1 | ) | 457.4 | 420.7 | 8.8 | % | 12.1 | % | 3.3 | % | |||||||||||||||||
| Total Company |
$ | 1,572.8 | $ | (48.6 | ) | $ | 1,524.2 | $ | 1,496.2 | 1.9 | % | 5.1 | % | 3.2 | % | |||||||||||||
| By Geography | ||||||||||||||||||||||||||||
| United States |
$ | 1,051.1 | $ | — | $ | 1,051.1 | $ | 1,042.0 | 0.9 | % | 0.9 | % | 0.0 | % | ||||||||||||||
| Canada |
105.7 | (6.6 | ) | 99.1 | 88.0 | 12.6 | % | 20.1 | % | 7.5 | % | |||||||||||||||||
| Total North America |
1,156.8 | (6.6 | ) | 1,150.2 | 1,130.0 | 1.8 | % | 2.4 | % | 0.6 | % | |||||||||||||||||
| Europe, Middle East and Africa |
226.5 | (24.9 | ) | 201.6 | 215.2 | (6.3 | )% | 5.3 | % | 11.6 | % | |||||||||||||||||
| Latin America |
80.5 | (6.3 | ) | 74.2 | 67.2 | 10.4 | % | 19.8 | % | 9.4 | % | |||||||||||||||||
| Asia Pacific |
109.0 | (10.8 | ) | 98.2 | 83.8 | 17.2 | % | 30.1 | % | 12.9 | % | |||||||||||||||||
| Total International |
416.0 | (42.0 | ) | 374.0 | 366.2 | 2.1 | % | 13.6 | % | 11.5 | % | |||||||||||||||||
| Total Company |
$ | 1,572.8 | $ | (48.6 | ) | $ | 1,524.2 | $ | 1,496.2 | 1.9 | % | 5.1 | % | 3.2 | % | |||||||||||||
Newell Rubbermaid Inc.
Six Months Ended June 30, 2011
In Millions
Currency Analysis
| 2011 | 2010 | Year-Over-Year (Decrease) Increase | ||||||||||||||||||||||||||
| Sales as Reported |
Currency Impact |
Adjusted Sales |
Sales as Reported |
Excluding Currency |
Including Currency |
Currency Impact |
||||||||||||||||||||||
| By Segment | ||||||||||||||||||||||||||||
| Home & Family |
$ | 1,135.5 | $ | (17.5 | ) | $ | 1,118.0 | $ | 1,148.9 | (2.7 | )% | (1.2 | )% | 1.5 | % | |||||||||||||
| Office Products |
864.8 | (30.0 | ) | 834.8 | 835.1 | (0.0 | )% | 3.6 | % | 3.6 | % | |||||||||||||||||
| Tools, Hardware & Commercial Products |
875.2 | (20.0 | ) | 855.2 | 818.6 | 4.5 | % | 6.9 | % | 2.4 | % | |||||||||||||||||
| Total Company |
$ | 2,875.5 | $ | (67.5 | ) | $ | 2,808.0 | $ | 2,802.6 | 0.2 | % | 2.6 | % | 2.4 | % | |||||||||||||
| By Geography | ||||||||||||||||||||||||||||
| United States |
$ | 1,919.1 | $ | — | $ | 1,919.1 | $ | 1,946.6 | (1.4 | )% | (1.4 | )% | 0.0 | % | ||||||||||||||
| Canada |
187.2 | (11.7 | ) | 175.5 | 166.0 | 5.7 | % | 12.8 | % | 7.0 | % | |||||||||||||||||
| Total North America |
2,106.3 | (11.7 | ) | 2,094.6 | 2,112.6 | (0.9 | )% | (0.3 | )% | 0.6 | % | |||||||||||||||||
| Europe, Middle East and Africa |
415.0 | (26.7 | ) | 388.3 | 404.0 | (3.9 | )% | 2.7 | % | 6.6 | % | |||||||||||||||||
| Latin America |
153.6 | (11.7 | ) | 141.9 | 122.9 | 15.5 | % | 25.0 | % | 9.5 | % | |||||||||||||||||
| Asia Pacific |
200.6 | (17.4 | ) | 183.2 | 163.1 | 12.3 | % | 23.0 | % | 10.7 | % | |||||||||||||||||
| Total International |
769.2 | (55.8 | ) | 713.4 | 690.0 | 3.4 | % | 11.5 | % | 8.1 | % | |||||||||||||||||
| Total Company |
$ | 2,875.5 | $ | (67.5 | ) | $ | 2,808.0 | $ | 2,802.6 | 0.2 | % | 2.6 | % | 2.4 | % | |||||||||||||
 Q2
2011 Earnings Call Presentation July 29, 2011 |
 2
Forward-Looking Statements
Statements in this presentation that are not historical in nature constitute forward-looking
statements. These forward-looking statements relate to information or assumptions about the
effects of sales, income/(loss), earnings per share, operating income or gross margin
improvements or declines, Project Acceleration, the European Transformation Plan, the Capital
Structure Optimization Plan, capital and other expenditures, cash flow, dividends,
restructuring and restructuring-related costs, costs and cost savings, inflation or deflation,
particularly with respect to commodities such as oil and resin, debt ratings, and management's plans,
projections and objectives for future operations and performance. These statements are
accompanied by words such as "anticipate," "expect," "project,"
"will," "believe," "estimate" and similar expressions. Actual results could differ
materially from those expressed or implied in the forward-looking statements. Important factors
that could cause actual results to differ materially from those suggested by the
forward-looking statements include, but are not limited to, our dependence on the strength
of retail, commercial and industrial sectors of the economy in light of the global economic
slowdown; currency fluctuations; competition with other manufacturers and distributors of
consumer products; major retailers' strong bargaining power; changes in the prices of raw materials
and sourced products and our ability to obtain raw materials and sourced products in a timely
manner from suppliers; our ability to develop innovative new products and to develop, maintain
and strengthen our end-user brands; our ability to expeditiously close facilities and move
operations while managing foreign regulations and other impediments; our ability to implement
successfully information technology solutions throughout our organization; our ability to
improve productivity and streamline operations; changes to our credit ratings; significant increases
in the funding obligations related to our pension plans due to declining asset values or otherwise;
the imposition of tax liabilities greater than our provisions for such matters; the risks
inherent in our foreign operations and those factors listed in the company’s latest
quarterly report on Form 10-Q, and exhibit 99.1 thereto, filed with the Securities and
Exchange Commission. Changes in such assumptions or factors could produce significantly
different results. The information contained in this presentation is as of the date indicated. The
company assumes no obligation to update any forward-looking statements contained in this
news release as a result of new information or future events or developments. |
 3
Net Sales of $1.57 billion, a 5.1% increase versus the prior year,
reflecting a 1.9% improvement in core sales and favorable foreign
currency of 3.2%
Gross
Margin
of
37.5%,
down
175
basis
points
from
the
prior
year
due
to
higher than usual overhead absorption that benefitted the second
quarter 2010
•
In addition, pricing actions lagged input cost inflation in the current
year quarter
Normalized
EPS
of
$0.46,
compared
to
$0.51
in
the
prior
year,
as
higher
sales volume, pricing actions and interest expense savings were offset
by the impact of input cost inflation and higher strategic SG&A spending
Operating
Cash
Flow
of
$92.8
million,
compared
to
$154.0
million
last
year, reflecting higher accounts receivable balances due to shifts in the
timing of back-to-school orders and higher customer program payments
Q2 2011 Summary |
 4
Net Sales of $2.88 billion, a 2.6% increase versus the prior year,
reflecting a 0.2% improvement in core sales and favorable foreign
currency of 2.4%
Gross Margin of 37.6%, down 20 basis points from the prior year as
productivity gains and pricing largely offset the effect of input cost
inflation
Normalized EPS of $0.75, compared to $0.77 in the prior year
Operating Cash used during the period was $15.5 million, compared to
cash generation of $183.4 million in the prior year
Year-over-year change primarily driven by the settlement of
customer programs and higher inventory levels in anticipation of
international expansion and new product introductions.
Q2 YTD 2011 Summary |
   5
Q2 2011 Sales:
Percent Change by Segment
Q2 2011
Home &
Family
Office
Products
Tools,
Hardware &
Commercial
Products
Total
Core Sales
(0.4)
(1.3)
8.8
1.9
Currency Translation
2.0
4.7
3.3
3.2
Total
1.6
3.4
12.1
5.1 |
   6
Q2 YTD 2011 Sales:
Percent Change by Segment
Q2 YTD 2011
Home &
Family
Office
Products
Tools,
Hardware &
Commercial
Products
Total
Core Sales
(2.7)
0.0
4.5
0.2
Currency Translation
1.5
3.6
2.4
2.4
Total
(1.2)
3.6
6.9
2.6 |
  7
Full Year 2011 Outlook
Net Sales Growth
Core Sales Growth
Currency Translation
Gross Margin Expansion
"Normalized" EPS**
Cash Flow from Operations
Capital Expenditures
FY 2011 Outlook*
Approximately $200 million
1% to 3%
3% to 5%
$520 to $560 million
40 to 60 basis points
$1.55 to $1.62
Approximately +2%
*
Reflects outlook communicated in the Q2 2011 Earnings Release and Earnings
Call **
See reconciliation included in the Appendix. Does not include the impact of
the company’s BernzOmatic divestiture. |
 8
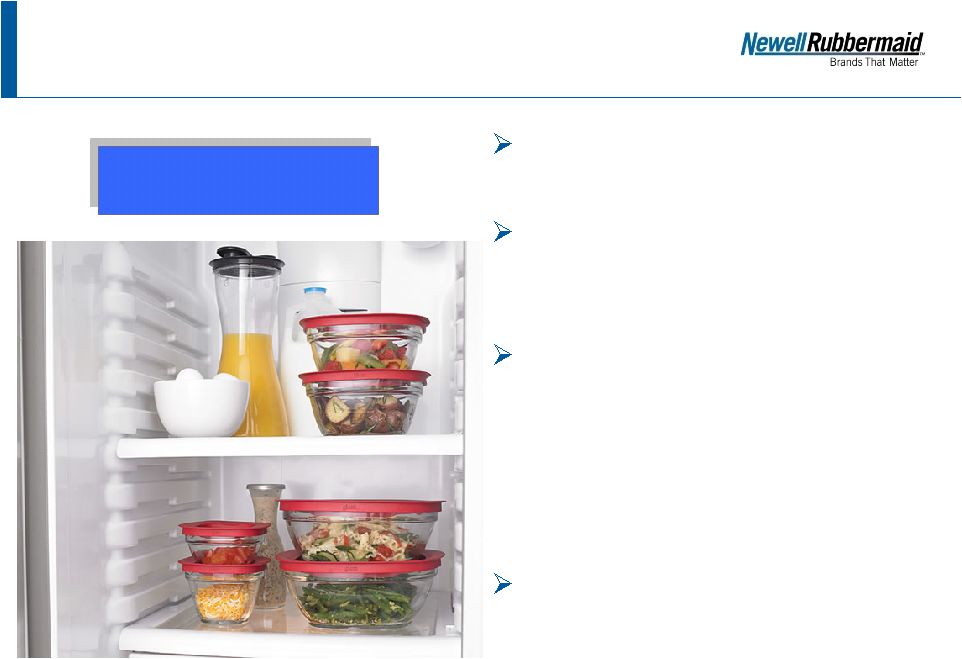
Sales Growth Initiatives
Discussed on the Q2 2011 Call
Rubbermaid®
Glass
with Easy Find Lids™
Growing the category and
taking market share
Sleek, crystal clear, tempered
glass is oven, microwave,
dishwasher and freezer safe
Features Easy Find Lids
organization system -
lids snap
to the bottom of the container
and to each other, and bases
neatly nest inside each other
for compact storage
Built-in gasket creates a leak-
proof seal |
  9
Sales Growth Initiatives
Discussed on the Q2 2011 Call
Expanding distribution in
the mass retail channel
and driving category
growth
Microfiber pad is reusable
saving the extra cost of
buying disposable pads
Picks up 50% more dirt
and dust per swipe than
traditional mops
Refillable spray bottle
allows you to use your
favorite cleaning solution
Rubbermaid Reveal™
Spray Mop |
  10
Sales Growth Initiatives
Discussed on the Q2 2011 Call
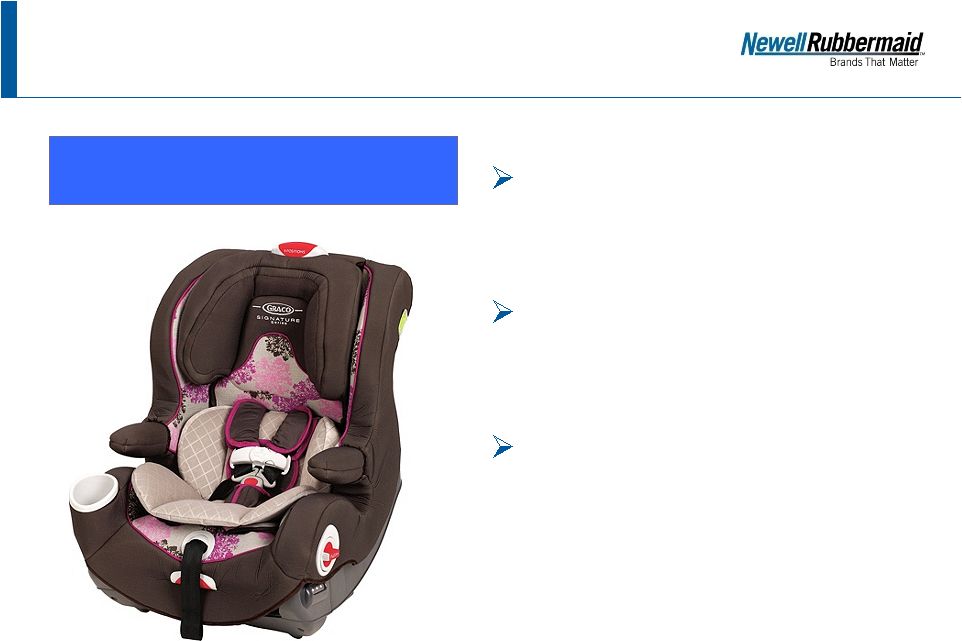
Convertible “grow-with-me”
car seat fits children from 5
to 100 lbs.
Features a convenient stay-
in-car base so parents only
have to install it one time
Side impact tested &
SafeSeat Engineered –
Steel-reinforced frame & car
seat base provides strength
and durability
Graco®
Signature Series™
Smart Seat™
All-in-One Car Seat |
 11
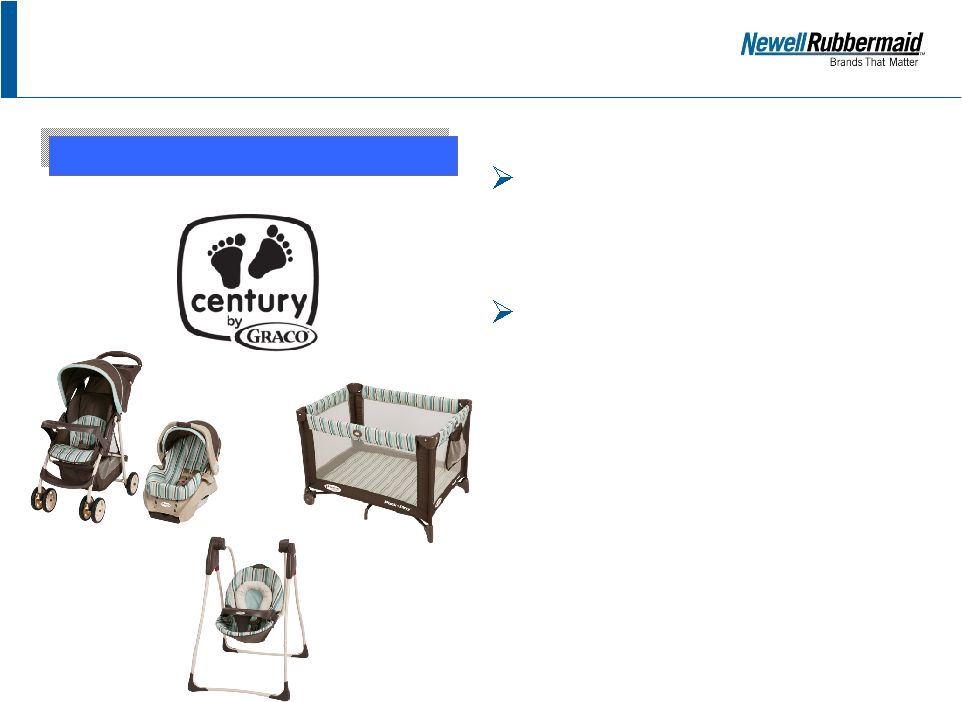
Sales Growth Initiatives
Discussed on the Q2 2011 Call
Line of products targeted to
the value-conscious
consumer
Includes a travel system
which leverages our Graco®
SnugRide®
car seat system
Century by Graco® |
  12
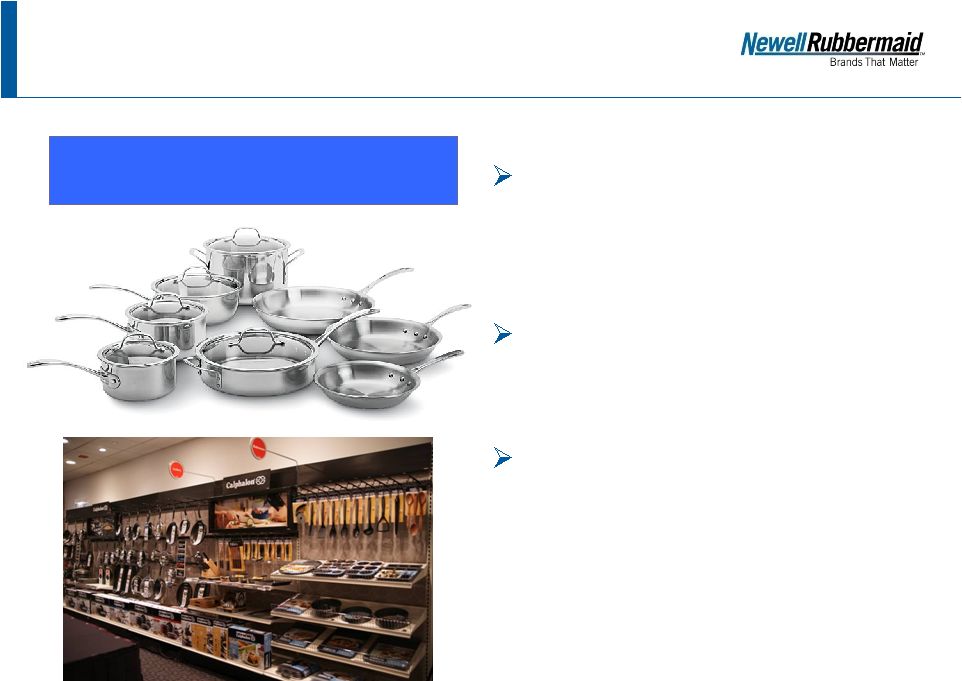
Sales Growth Initiatives
Discussed on the Q2 2011 Call
Calphalon®
Tri-Ply Stainless
Steel cookware line is driving
growth and gaining market
share
Tri-Ply combines the beauty of
stainless steel with the superior
performance of aluminum
Calphalon named 2010 Vendor
of the Year at Target for
superior in-store presence and
impact and for the collaborative
development of the category
Calphalon®
Tri-Ply Stainless
Steel Cookware |
  13
Sales Growth Initiatives
Discussed on the Q2 2011 Call
New advertising & marketing
campaign focuses on our
passionate fans and the
amazing things they have
started with Sharpie®
products
Campaign includes TV &
cinema, print, digital and social
media, new packaging and in-
store merchandising
Highlights new products: Gel
Highlighter™, Stained by
Sharpie™
fabric markers and
Sharpie®
80’s Glam markers
“Start with Sharpie®”
Marketing Campaign |
  14
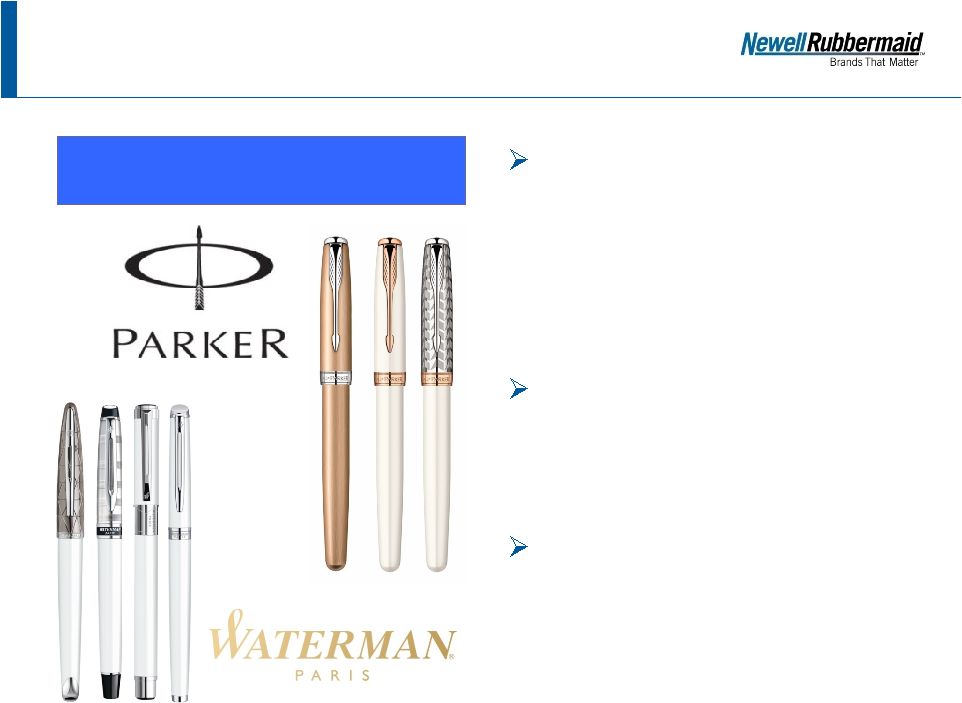
Sales Growth Initiatives
Discussed on the Q2 2011 Call
Opening our 400
th
dedicated Parker fine
writing shop-in-shop in
China, with first shops
opening in Moscow and
New York City
New Parker Sonnet pen is
subtle and feminine, with a
luxurious on-trend palette of
metallic “pink gold”
tones
New Waterman Pure White
Collection is simultaneously
fresh, sophisticated and
versatile
Fine Writing “Shop-in-Shop”
Expansion and New Products |
 Sales Growth Initiatives
Discussed on the Q2 2011 Call
15
Rubbermaid®
HYGEN™
Clean Water System
Expanding distribution and
expanding globally
Revolutionary floor cleaning
system features an innovative
integrated water filter for
generating clean water from
dirty mopping water
Offers a wide assortment of
microfiber flat mops
engineered to remove over 99
percent of microbes |
 16
Sales Growth Initiatives
Discussed on the Q2 2011 Call
Helping to drive significant
growth and market share gains
in Asia Pacific
Designed specifically for the
rigorous cutting demands of the
Asian metal-working market
Won two prestigious global
innovation awards for superior
design and performance
Lenox®
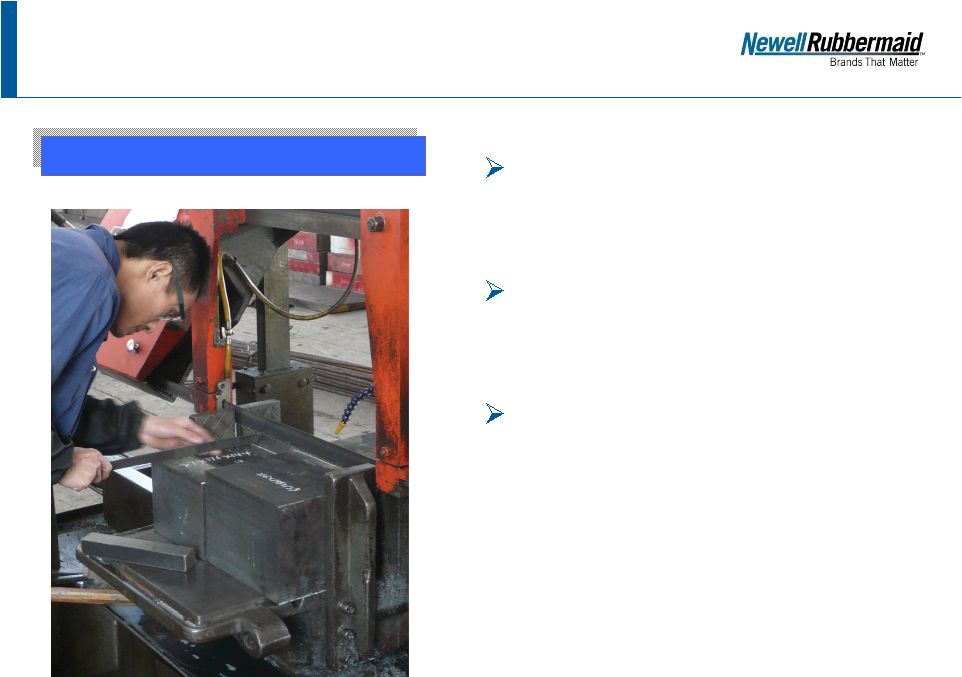
Q88™
Bandsaw Blade |
 Appendix |
 18
Reconciliation: Q2 2011 and
Q2 2010 “Normalized”
EPS
Q2 2011
Q2 2010
Diluted earnings per share (as reported):
$0.49
$0.41
Restructuring and restructuring-related costs,
net of tax [ 1 ]
$0.03
$0.06
Convertible notes dilution
$0.00
$0.05
Income tax benefit -- expiration of statutes of
limitation
($0.07)
$0.00
Other items, net of tax
$0.00
($0.01)
"Normalized" EPS*:
$0.46
$0.51
* May not foot due to rounding
[ 1 ] Items excluded from "normalized" results for 2011 consist of restructuring
and restructuring- related costs incurred in connection with the European Transformation
Plan, net of tax effects. Items excluded from "normalized" results for 2010
consist of Project Acceleration restructuring costs and restructuring-related costs
incurred in connection with the European Transformation Plan, net of tax effects.
|
 19
Reconciliation: Q2 YTD 2011 and
Q2 YTD 2010 “Normalized”
EPS
Q2 YTD 2011
Q2 YTD 2010
Diluted earnings per share (as reported):
$0.75
$0.61
Restructuring and restructuring-related costs,
net of tax [ 1 ]
$0.06
$0.10
Income tax benefit -- expiration of statutes of
limitation
($0.07)
$0.00
Convertible notes dilution
$0.00
$0.07
Other items, net of tax
$0.01
($0.01)
"Normalized" EPS:
$0.75
$0.77
[ 1 ] Items excluded from "normalized" results for 2011 consist of restructuring
and restructuring- related costs incurred in connection with the European Transformation
Plan, net of tax effects. Items excluded from "normalized" results for 2010
consist of Project Acceleration restructuring costs and restructuring-related costs
incurred in connection with the European Transformation Plan, net of tax effects.
|
 20
Reconciliation: Full Year 2011 Outlook
and “Normalized”
EPS
FY 2011
Diluted earnings per share*
$1.35 to $1.42
Restructuring and restructuring-related costs, net of tax [ 1 ]
$0.22 to $0.26
Incremental costs related to the company's CEO transition
$0.02
Income tax benefit -- expirations of statutes of limitation
($0.07)
Other items, net of tax
$0.01
"Normalized" EPS*:
$1.55 to $1.62
* Does not include the impact of the company's BernzOmatic divestiture
[ 1 ] Items excluded from "normalized" results consist of restructuring and
restructuring-related costs incurred in connection with the European Transformation Plan,
net of tax effects. |
 21
Reconciliation: Q2 2011 and Q2 2010 Operating
Income to Operating Income Excluding Charges
$ millions
Q2 2011
Q2 2010
Net sales
$1,572.8
$1,496.2
Operating income (as reported)
$197.9
$203.5
Restructuring and restructuring-related costs [ 1 ]
$10.0
$22.8
Operating income (excluding charges)
$207.9
$226.3
Operating income (excluding charges), as a
percent of net sales
13.2%
15.1%
[ 1 ] Items excluded from "normalized" results for 2011 consist of restructuring and
restructuring- related costs incurred in connection with the European Transformation
Plan. Items excluded from "normalized" results for 2010 consist of Project
Acceleration restructuring costs and restructuring- related costs incurred in connection
with the European Transformation Plan. |
 22
Reconciliation:
Q2
YTD
2011
and
Q2
YTD
2010
Operating
Income to Operating Income Excluding Charges
Q2 YTD 2011
Q2 YTD 2010
Net sales
$2,875.5
$2,802.6
Operating income (as reported)
$328.5
$333.6
Restructuring and restructuring-related costs [ 1 ]
$21.1
$38.8
Operating income (excluding charges)
$349.6
$372.4
Operating income (excluding charges), as a
percent of net sales
12.2%
13.3%
[ 1 ] Items excluded from "normalized" results for 2011 consist of restructuring and
restructuring- related costs incurred in connection with the European Transformation
Plan. Items excluded from "normalized" results for 2010 consist of Project
Acceleration restructuring costs and restructuring- related costs incurred in connection
with the European Transformation Plan. $ millions
|
 23
Reconciliation: Q2 2011 and
Q2 2010 Free Cash Flow
Q2 2011
Q2 2010
Operating Cash Flow
$92.8
$154.0
Capital Expenditures
(51.2)
(37.8)
Free Cash Flow
$41.6
$116.2
Free Cash Flow is defined as cash flow (used)/provided by operating activities less
capital expenditures.
$ millions |
 24
Reconciliation: Q2 YTD 2011 and
Q2 YTD 2010 Free Cash Flow
Q2 YTD 2011
Q2 YTD 2010
Operating Cash Flow
($15.5)
$183.4
Capital Expenditures
(96.1)
(69.3)
Free Cash Flow
($111.6)
$114.1
Free Cash Flow is defined as cash flow (used)/provided by operating activities less
capital expenditures.
$ millions |