Attached files
| file | filename |
|---|---|
| EX-23 - EX-23 - FRISCHS RESTAURANTS INC | dex23.htm |
| EX-21 - EX-21 - FRISCHS RESTAURANTS INC | dex21.htm |
| EX-14 - EX-14 - FRISCHS RESTAURANTS INC | dex14.htm |
| EX-32.2 - EX-32.2 - FRISCHS RESTAURANTS INC | dex322.htm |
| EX-32.1 - EX-32.1 - FRISCHS RESTAURANTS INC | dex321.htm |
| EX-31.1 - EX-31.1 - FRISCHS RESTAURANTS INC | dex311.htm |
| EX-31.2 - EX-31.2 - FRISCHS RESTAURANTS INC | dex312.htm |
| EX-10.60 - EX-10.60 - FRISCHS RESTAURANTS INC | dex1060.htm |
| EX-10.61 - EX-10.61 - FRISCHS RESTAURANTS INC | dex1061.htm |
Table of Contents
UNITED STATES
SECURITIES AND EXCHANGE COMMISSION
Washington, D.C. 20549
FORM 10-K
[ x ] ANNUAL REPORT PURSUANT TO SECTION 13 OR 15(d) OF THE SECURITIES EXCHANGE ACT OF 1934
For the fiscal year ended May 31, 2011
or
[ ] TRANSITION REPORT PURSUANT TO SECTION 13 OR 15(d) OF THE SECURITIES EXCHANGE ACT OF 1934
Commission file number 001-07323
FRISCH’S RESTAURANTS, INC.
(Exact name of registrant as specified in its charter)
| State of Ohio | 31-0523213 | |
| (State or other jurisdiction of incorporation or organization) | (IRS Employer Identification Number) |
2800 Gilbert Avenue
Cincinnati, Ohio 45206
(Address of principal executive offices)
(513)-961-2660
(Registrant’s telephone number, including area code)
Securities registered pursuant to Section 12(b) of the Act:
| Title of each class |
Name of each Exchange on which registered | |
| Common Stock of No Par Value | NYSE Amex | |
Securities registered pursuant to Section 12(g) of the Act: None
Indicate by check mark if the registrant is a well-known seasoned issuer, as defined in Rule 405 of the Securities Act.
Yes [ ] No [ x ]
Indicate by check mark if the registrant is not required to file reports pursuant to Section 13 or Section 15(d) of the Act.
Yes [ ] No [ x ]
Indicate by check mark whether the registrant (1) has filed all reports required to be filed by Section 13 or 15(d) of the Securities Exchange Act of 1934 during the preceding 12 months (or for such shorter period that the registrant was required to file such reports), and (2) has been subject to such filing requirements for the past 90 days.
Yes [ x ] No [ ]
Indicate by check mark whether the registrant has submitted electronically and posted on its corporate Web site, if any, every Interactive Data File required to be submitted and posted pursuant to Rule 405 of Regulation S-T (Section 232.405 of this chapter) during the preceding 12 months (or for such shorter period that the registrant was required to submit and post such files).
Yes [ ] No [ ]
Indicate by check mark if disclosure of delinquent filers pursuant to Item 405 of Regulation S-K (Section 229.405 of this chapter) is not contained herein, and will not be contained, to the best of registrant’s knowledge, in definitive proxy or information statements incorporated by reference in Part III of this Form 10-K or any amendment to this Form 10-K or any amendment of this Form 10-K.
[ x ]
Table of Contents
Indicate by check mark whether the registrant is a large accelerated filer, an accelerated filer, a non-accelerated filer, or a smaller reporting company. See the definitions of “large accelerated filer,” “accelerated filer” and “smaller reporting company” in Rule 12b-2 of the Exchange Act.
| Large accelerated filer [ ] |
Accelerated filer [ x ] | |
| Non-accelerated filer [ ] (Do not check if a smaller reporting company) |
Smaller reporting company [ ] | |
Indicate by check mark whether the registrant is a shell company (as defined in Rule 12b-2 of the Exchange Act).
Yes [ ] No [ x ]
The aggregate market value of voting common stock held by non-affiliates of the registrant on December 14, 2010 (the last business day of the registrant’s most recently completed second fiscal quarter) was approximately $75,401,000, based upon the closing sales price of the registrant’s common stock as reported on NYSE Amex on that date. The registrant does not have any non-voting common equity.
As of July 26, 2011, there were 4,926,703 shares of registrant’s common stock outstanding.
DOCUMENTS INCORPORATED BY REFERENCE
Portions of the registrant’s definitive proxy statement for its Annual Meeting of Shareholders to be held October 5, 2011 are incorporated by reference into Part III of this Form 10-K.
Table of Contents
Table of Contents
Cautionary Statement Regarding Forward-Looking Information
Forward-looking statements are contained throughout this Annual Report on Form 10-K. Such statements may generally express management’s expectations with respect to its plans, or its assumptions and beliefs concerning future developments and their potential effect on the Company. There can be no assurances that such expectations will be met or that future developments will not conflict with management’s current beliefs and assumptions, which are inherently subject to risks and other uncertainties. Factors that could cause actual results and performance to differ materially from anticipated results that may be expressed or implied in forward-looking statements are included in, but not limited to, the discussion in this Form 10-K under Part I, Item 1A. “Risk Factors.” Risk factors and other uncertainties may also be discussed from time to time in the Company’s press releases, public statements or other filings with the Securities and Exchange Commission.
Sentences that contain words such as “should,” “would,” “could,” “may,” “plan(s),” “anticipate(s),” “project(s),” “believe(s),” “will,” “expect(s),” “estimate(s),” “intend(s),” “continue(s),” “assumption(s),” “goal(s),” “target” and similar words (or derivatives thereof) are generally used to distinguish forward-looking statements from historical or present facts.
All forward looking information in this Form 10-K is provided by the Company pursuant to the safe harbor established under the Private Securities Litigation Reform Act of 1995 and should be evaluated in the context of all risk factors. Except as may be required by law, the Company disclaims any obligation to update any of the forward-looking statements that may be contained in this Form 10-K.
References to fiscal years used in this Form 10-K
In this Annual Report on Form 10-K, the Company’s fiscal year that ended May 31, 2011 may be referred to as fiscal year 2011. The Company’s fiscal year is the 52 week (364 days) or 53 week (371 days) period ending on the Tuesday nearest to the last day of the month of May. Fiscal year 2011 consisted of 52 weeks.
Also in this Annual Report on Form 10-K, the Company’s fiscal years that ended June 1, 2010, June 2, 2009, June 3, 2008 and May 29, 2007 may be referred to as fiscal years 2010, 2009, 2008 and 2007, respectively. All of these years consisted of 52 weeks, except for fiscal year 2008, which was a 53 week year. References to fiscal year 2012 refer to the 52 week year that began on June 1, 2011, which will end on Tuesday, May 29, 2012.
The first quarter of each fiscal year presented herein contained 16 weeks while the last three quarters contained 12 weeks, except for the fourth quarter of fiscal year 2008, which contained 13 weeks.
1
Table of Contents
(Items 1 through 4)
Background
The registrant, Frisch’s Restaurants, Inc. (together with its wholly owned subsidiaries, referred to as the “Company” or the “Registrant”), is a regional company that operates full service family-style restaurants under the name “Frisch’s Big Boy.” The Company also operates grill buffet style restaurants under the name “Golden Corral” pursuant to certain licensing agreements. Frisch’s Big Boy (Big Boy) restaurants operated by the Company during the last five years have been located entirely in various regions of Ohio, Kentucky and Indiana. In addition to Ohio, Kentucky and Indiana, Golden Corral restaurants have been operated in small portions of Pennsylvania and West Virginia during the last five years.
Incorporated in the state of Ohio in 1947, the Company’s stock has been publicly traded since 1960. Today it trades on the NYSE Amex market.
The Company’s executive offices are located at 2800 Gilbert Avenue, Cincinnati, Ohio 45206. The telephone number is (513) 961-2660. The Company’s web site is www.frischs.com.
As of May 31, 2011, the Company’s operations consisted of 95 Big Boy restaurant and 35 Golden Corral restaurants. Additionally, 25 Big Boy restaurants were in operation under licensing rights granted by the Company to other operators. All of the restaurants licensed to other operators are located in various markets within the states of Ohio, Kentucky and Indiana.
The Company owns the trademark “Frisch’s.” The rights to the “Big Boy” trademark, trade name and service mark are exclusively and irrevocably owned by the Company for use in the states of Kentucky and Indiana, and in most of Ohio and Tennessee. “Golden Corral” is a registered trademark of the Golden Corral Corporation, Raleigh, North Carolina.
Financial information for both the Big Boy and Golden Corral operating segments as of and for the three fiscal years in the period ended May 31, 2011 appears in Note G - Segment Information – to the Consolidated Financial Statements included in Part II, Item 8 of this Form 10-K.
Big Boy Restaurant Operations
Big Boy restaurants are full service family-style restaurants offering quick, friendly service, which the Company operates under the name “Frisch’s.” All of the restaurants offer “drive-thru” service. The restaurants are generally open seven days a week, typically from 7:00 a.m. to 11:00 p.m. with extended weekend evening hours. Standardized menus offer a wide variety of items at moderate prices, featuring well-known signature items such as the original “Big Boy” double-deck hamburger sandwich, freshly made onion rings and hot fudge cake for dessert. Several promising new items were introduced to the menu in fiscal year 2011, including awesome burgers (non-beef), smoothies and hand dipped shakes. Menu selections also include many other sandwiches, pasta, roast beef, chicken and seafood dinners, desserts, non-alcoholic beverages and many other items. In addition, a full breakfast menu is offered, and all of the restaurants utilize breakfast bars that are easily converted to soup and salad bars for lunch and dinner hours. Drive-thru and carryout menus emphasize combo meals that consist of a popular sandwich packaged with french fries and a beverage and sold at a lower price than if purchased separately.
Although customers have not shown any significant preference for highly nutritional, low fat foods, such items are available on the menu and salad bars. Customers are not discouraged from ordering customized servings to meet their dietary concerns. For example, a sandwich can be ordered without the usual dressing of cheese and tartar sauce. In addition, beginning in fiscal year 2011, fried foods are now fried only in trans fat-free shortening.
Operations in the Big Boy segment are vertically integrated. The Company operates a commissary and food manufacturing plant near its Cincinnati headquarters, which manufactures and prepares foods, and stocks food and
2
Table of Contents
beverages, paper products and other supplies for distribution to Big Boy restaurants. Some companies in the restaurant industry operate commissaries, while others purchase directly from outside sources. Raw materials, principally consisting of food items, are generally plentiful and may be obtained from any number of reliable suppliers. Quality and price are the principal determinants of source. The Company believes that its Big Boy operations benefit from centralized purchasing and food preparation through its commissary operation, which ensures uniform product quality, timeliness of distribution (two to three deliveries per week) to restaurants and ultimately results in lower food and supply costs. The commissary does not supply the Company’s Golden Corral restaurants.
Substantially all licensed Big Boy restaurants regularly purchase products from the commissary. Sales of commissary products to Big Boy restaurants licensed to other operators were $9.0 million in fiscal year 2011 (3.0 percent of consolidated sales), $8.6 million fiscal year 2010 (2.9 percent of consolidated sales) and $9.0 million in fiscal year 2009 (3.0 percent of consolidated sales).
System-wide Frisch’s Big Boy restaurant gross sales, which include sales generated by restaurants that the Company licenses to others, were approximately $225 million in fiscal year 2011, $215 million in fiscal year 2010, and $216 million in fiscal year 2009.
The Big Boy marketing strategy - “What’s Your Favorite Thing?” – has been in place for more than ten years. Results from ongoing market research indicate its effectiveness has not diminished. Television commercials are broadcast on local network affiliates and local cable programming that emphasize Big Boy’s distinct and signature menu items and unique dining experience.
Television and radio are the primary media to carry and promote Big Boy’s key messages. Television reinforces the positioning of “Favorite Things” while radio provides a cost effective means to promote shorter-term menu items. Five new television commercials debuted in fiscal year 2011. Outdoor billboards and targeted online advertising are used to complement the media plan, primarily to introduce and promote new menu items. The Company also utilizes social media as a means to develop two-way communication directly with the customer. Targeted social media communities are a cost effective way to reach a wide range of customers, but are a particularly important means to reach younger audiences.
The Company currently expends for advertising an amount equal to 2.5 percent of Big Boy gross sales, plus fees paid into an advertising fund by restaurants licensed to other operators.
Designed with longevity in mind while also appealing to younger customers, newly constructed Big Boy restaurants are marked with bold colors and bright environments, featuring sleek lines, cherry colored paneling and wood trim, accented with abundant natural light and company memorabilia covering much of the wall space. On average, the approximate cost to build and equip a typical Big Boy restaurant currently ranges from $2,500,000 to $3,400,000, depending on land cost and land improvements, which can vary greatly from location to location, and whether the land is purchased or leased. Costs also depend on whether the new restaurant is constructed using basic plans for the original newer building prototype (5,700 square feet, used since 2001) or its smaller adaptation that was developed in fiscal year 2010 (5,000 square feet) for use in smaller trade areas.
As part of the Company’s commitment to serve customers in clean, pleasant surroundings, the Company renovates approximately one-fifth of its Big Boy restaurants each year. The renovations are designed to not only refresh and upgrade the interior finishes, but also to synchronize the interiors and exteriors of older restaurants with that of newly constructed restaurants. The current cost to renovate a Big Boy restaurant ranges from $100,000 to $200,000.
In addition, certain high-volume Big Boy restaurants are regularly evaluated to determine a) whether their kitchens should be redesigned for increased efficiencies and b) if an expansion of the dining room is warranted. At least one older Big Boy restaurant is typically razed each year and replaced with a new building.
The following tabulation recaps Big Boy restaurant openings and closings for restaurants operated by the Company for the five most recent fiscal years:
3
Table of Contents
| Fiscal Year | ||||||||||||||||||||
| 2007 |
2008 |
2009 |
2010 |
2011 |
||||||||||||||||
| Big Boy Restaurants Operated by the Company |
||||||||||||||||||||
| In operation beginning of year |
90 | 87 | 87 | 88 | 91 | |||||||||||||||
| Opened |
2 | 2 | 2 | 3 | 4 | |||||||||||||||
| Opened replacement building |
- | 1 | 1 | 1 | - | |||||||||||||||
| Closed to make way for new buildings |
(1) | - | (1) | (1) | - | |||||||||||||||
| Closed |
(4) | (3) | (1) | - | - | |||||||||||||||
|
|
|
|
|
|
|
|
|
|
|
|||||||||||
| End of year - total operated Big Boy restaurants |
87 | 87 | 88 | 91 | 95 | |||||||||||||||
The four new Big Boy restaurants opened in fiscal year 2011 were: 1) July 2010 in Louisville, Kentucky, 2) August 2010 near Dayton, Ohio, 3) October 2010 in Elizabethtown, Kentucky (Louisville market) and 4) December 2010 in Heath, Ohio (Columbus market).
Two other sites were under construction as of May 31, 2011: one to open near Cincinnati, Ohio in July 2011, and the other is scheduled to open in Highland, Heights, Kentucky (Cincinnati market) in September 2011. Three other sites are in the pipeline for future construction, including two that were acquired in fiscal year 2011. Several other sites are currently being evaluated for future acquisition and development.
With respect to Big Boy restaurants licensed to other operators, the following tabulation recaps openings and closings for the five most recent fiscal years:
| Fiscal Year |
||||||||||||||||||||
| 2007 |
2008 |
2009 |
2010 |
2011 |
||||||||||||||||
| Big Boy Restaurants Licensed to Others |
||||||||||||||||||||
| Licensed to others beginning of year |
28 | 28 | 28 | 26 | 25 | |||||||||||||||
| Opened |
- | - | - | - | - | |||||||||||||||
| Closed |
- | - | (2) | (1) | - | |||||||||||||||
|
|
|
|
|
|
|
|
|
|
|
|||||||||||
| End of year - total Big Boy restaurants licensed to others |
28 | 28 | 26 | 25 | 25 | |||||||||||||||
Franchise fees are charged to licensees for use of trademarks and trade names and licensees are required to make contributions to the Company’s general advertising account. These fees and contributions are calculated principally on percentages of sales. Total franchise and other service fee revenue earned by the Company from licensees was $1.2 million in fiscal year 2011, $1.1 million in fiscal year 2010 and $1.1 million in fiscal year 2009. Other service fees from licensees include revenue from accounting and payroll services that four of the licensed restaurants currently purchase from the Company.
The license agreements with licensees are not uniform, but most of the licenses for individually licensed restaurants that were in effect as of May 31, 2011 are covered by agreements containing the following provisions:
| 1. | The Company grants to the Licensee the right to use the name “Frisch” and/or “Frisch’s,” “Big Boy” and related trademarks and trade names in connection with the operation of a food and restaurant business, in return for which the Licensee pays a monthly license fee equal to 3.75 percent of its gross sales. In addition, an initial license fee of $30,000 is generally required. |
| 2. | The Company provides local and regional advertising through publications, radio, television, etc., in return for which the Licensee pays a monthly fee equal to 2.5 percent of its gross sales. |
4
Table of Contents
In addition, Licensees are required to conduct business on a high scale, in an efficient manner, with cleanliness and good service, all to the complete satisfaction of the Company. Licensees are required to serve only quality foods and must comply with all food, sanitary and other regulations.
Long standing area license agreements granted to other operators in northern Indiana and northwestern Ohio differ in various ways from license agreements covering individual restaurants. The most notable differences are significantly lower license and advertising fee percentages and lower initial fees paid by the area operators. Provisions for these lower fees have been perpetually in place since the 1950’s.
Golden Corral Restaurant Operations
In 1998, the Company entered into an area development agreement with Golden Corral Franchising Systems, Inc. of Raleigh, North Carolina (Franchisor), under which development rights were granted to the Company to establish and operate 26 Golden Corral restaurants in certain markets in Ohio, Kentucky and Indiana, principally the greater metropolitan areas of Cincinnati and Dayton, Ohio and Louisville, Kentucky. In 2000, the Company entered into a second area development agreement with the Franchisor, which granted development rights to the Company to establish and operate 15 additional Golden Corral restaurants in certain defined markets in the Cleveland and Toledo, Ohio Designated Market Areas. In July 2004, the Company entered its third area development agreement under which rights were received to develop an additional 22 Golden Corral restaurants by December 31, 2011, including markets in western Pennsylvania, southern Michigan, northern Indiana, the northwest portion of West Virginia and certain areas of Ohio, including Columbus.
The July 2004 development agreement was amended in April 2008 to delete 16 restaurants from development plans, which were to be located in western Pennsylvania, southern Michigan, and northern Indiana. The Company’s rights to develop 12 additional Golden Corral restaurants will expire December 31, 2011. The Company does not have the right to sub-license others to use the Golden Corral system or proprietary marks.
The Company opened its first Golden Corral restaurant in January 1999. Thirty-three more opened over the course of the seven year period ending May 30, 2006. The Company opened its 35th and final Golden Corral restaurant in July 2007. The Company has no plans to build any additional Golden Corral restaurants.
On June 4, 2008, the Company announced that management had concluded that certain assets in the Golden Corral segment were impaired under applicable accounting rules. As a result, a non-cash pretax charge to earnings approximating $4.7 million dollars was taken to record the impairment in the fourth quarter of fiscal year 2008. The impairment charge lowered the carrying values of three Golden Corral restaurant locations to their estimated fair values, as required when the expected future cash flows from the operation of individual restaurants is less than the carrying values of the operating assets. The three restaurants with impaired values remained in operation as of May 31, 2011.
Golden Corral is a grill-buffet style family restaurant concept offering a wide variety of buffet items. The buffet line features a large charbroil grill that is placed directly on the buffet line. This format allows customers to be served grilled-to-order steaks directly from the buffet line as part of the regular buffet price. The buffet also features many other varieties of meat including fried and rotisserie chicken, meat loaf, pot roast, fish, shrimp and a carving station that serves a rotation of hot roast beef, ham and turkey. The buffet also includes fresh fruits and vegetables, other hot and cold buffet foods, a salad bar, desserts, an in-store display bakery that offers made-from-scratch bakery goods, and many beverage items, none of which contains alcohol. Most of the food is prepared in full view of customers in order to emphasize its freshness and quality. The restaurants have distinctive exterior and interior designs, and are open seven days a week for lunch and dinner, providing prompt, courteous service in a clean and wholesome family atmosphere. Typical operating hours are 11:00 a.m. to 9:00 p.m. The restaurants open at 7:30 a.m. on weekends to provide the “Golden Sunrise Breakfast” buffet. The Company has sole discretion as to the prices charged to its customers.
The nature of buffet style dining easily affords every customer vast control in tailoring a meal to meet individual dietary needs, in terms of portion sizes and in selection from the wide variety of items that may be consumed from the buffet, including several foods that are low in fat. In addition, fried foods are fried only in trans fat-free shortening.
5
Table of Contents
The Company may only sell such products, food, beverages and other menu items that meet the Franchisor’s standards of quality and quantity, as expressly approved and have been prepared in accordance with the Franchisor’s specifications. Except for items such as bread, produce and dairy products that are purchased from any number of local suppliers, the Company currently purchases substantially all other raw material for menu items and other supplies from the same vendor that the Franchisor uses for its operations. Deliveries are made two times per week. Other vendors are available to provide products that meet the Franchisor’s specifications at comparable prices should the Company wish or need to make a change.
Under the terms of the area development agreements, each Golden Corral restaurant operated by the Company is governed by an individual franchise agreement. The term of each franchise granted is for 15 years from the date the restaurant opens for business. Renewal privileges include two additional consecutive five year terms provided that the terms are the same as the then-current form of renewal required by the Franchisor.
The granting of each individual franchise agreement required the Company to pay an initial franchise fee of $40,000. The franchise agreements also require a continuing royalty fee equal to 4 percent of the restaurant’s gross sales, and require the Company to expend or contribute for advertising an amount not less than 2 percent of the restaurant’s gross sales up to a maximum of 6 percent of the restaurant’s gross sales.
Royalty fees have always been paid to the Franchisor weekly. Prior to January 1, 2009, the Company was permitted to retain and expend advertising fees at its direction, at the rate of 2 percent of gross sales. On January 1, 2009, the Franchisor initiated a national advertising program under which all Golden Corral restaurants in its system were required to begin contributing their advertising fees each week to the Franchisor, continuing at the rate of 2 percent of gross sales. On January 1, 2010, advertising fees were increased to 2.4 percent of gross sales, allowing additional national media buying by the Franchisor. The changes have effectively expanded cable television spots, which focus on Golden Corral’s value in comparison to competition and a wide range of available dining options, in all the Company’s market areas.
A renovation program for Golden Corral restaurants has been tailored to replicate the highly successful Big Boy renovation program. Each Golden Corral restaurant is renovated every seven years, but carpeting is replaced every 42 months. The fiscal year 2012 remodeling budget is approximately $2,545,000. This includes the carryover cost to complete four restaurants for which work was not completed in the prior year, and three other restaurants to be remodeled over the winter months.
Human Resources
The Company provides equal opportunity employment without regard to age, race, religion, color, sex, national origin, disability, veteran status or any other legally protected class. The Company’s Equal Opportunity Employment Policy provides and maintains a work environment that is free from all forms of illegal discrimination including sexual harassment. The philosophy of the policy stresses the need to train and to promote the person who becomes the most qualified individual to do a particular job. The Company is committed to promoting “Diversity” in the workplace in order to enhance its Equal Opportunity Employment Policy.
The Company remains committed to providing employees with the best training possible, as management believes that investing in people is a strategic advantage. Comprehensive recruiting and training programs are designed to maintain the food and service quality necessary to achieve the Company’s goals for operating results. A management recruiting staff is maintained at the Company’s headquarters. Corporate training centers for new Big Boy managers are operated in Cincinnati, Ohio and Covington, Kentucky, and certified (by the Franchisor) training centers for new Golden Corral managers are located throughout the markets in which the Company operates Golden Corral restaurants. The training includes both classroom instruction and on-the-job training. A full time recruiter is on staff to attract high quality hourly-paid restaurant workers.
The Company’s incentive-based compensation program for restaurant managers, area supervisors and regional directors (collectively, operations management) ties compensation of operations management directly to the cash flows of their restaurant(s), which allows incentive compensation to be more consistently earned. The incentive compensation that operations management can earn under the program is at a level the Company believes is above the average for competing restaurant concepts. The Company believes the program has reduced turnover in operations management, and has resulted in a strong management team that focuses on building same store sales and margins.
6
Table of Contents
Employee selection software helps lower hourly employee turnover rates; an employee validation website is in place that measures employee job satisfaction; and an interactive employee training program uses training videos and quizzes. These digital videos are loaded directly onto the hard drive of a PC located at each restaurant that is networked to the point-of-sale system, allowing headquarters to access the interactive results.
Information Technology
Each of the Company’s restaurants is managed through standardized operating and control systems anchored by a point-of-sale (POS) system that allows management to instantly accumulate and utilize data for more effective decision making, while allowing restaurant managers to spend more time in the dining room focusing on the needs of customers. The system generates the guest check and provides functionality for settling the customer’s check using cash, credit or debit card, or gift card. The system provides a record of all items sold, the service time, and the server responsible for the customer. Employee time keeping is also kept on the POS system. Back office functionality provides employee master file data, employee scheduling, inventory control, sales forecasting, product ordering and many other management reports.
The execution of the $2,000,000 plan that was launched in May 2009 to merge the POS systems of Big Boy and Golden Corral into one integrated solution through the implementation of new software that provides both ‘front of the house’ and ‘back of the house’ functionality was completed in September 2010 when the final batches of systems were installed in the final groupings of Big Boy restaurants. Installations in Golden Corral restaurants were fully completed in fiscal year 2010. As part of the plan, each Golden Corral was also fitted with new POS register equipment and back office hardware, and each Big Boy received new back office hardware. A five year plan to replace POS register equipment in Big Boy restaurants was completed during fiscal year 2008.
The implementation of the integrated solution includes improved security measures derived through the installation of biometric sign-on devices to access the POS systems, replacing card swipe technology. The system meets the security requirements of the Payment Card Industry (PCI). The Company received its attestation of compliance in June 2011. A finding of non-compliance could have restricted the Company’s ability to take credit cards.
Standardized operating and control systems also include an automated drive-thru timer system in all Big Boy restaurants that measures the time from when a customer’s car first enters the drive-thru station until the order is received and the customer exits the drive-thru. This information is provided to the restaurant manager in a real time environment, which reduces the amount of time required to serve customers. To replenish restaurant inventories, a “suggested order” automated system analyzes current inventory balances and sales patterns and then “suggests” a replenishment order from the commissary operation. This process optimizes in-store inventory levels, which results in better control over food costs, identifies waste and improves food quality.
Digital Subscriber Lines (DSL) were installed in all Big Boy restaurants in fiscal year 2008, replacing satellite broad band connectivity between headquarters and the restaurants. DSL installation in Golden Corral restaurants was completed during fiscal year 2010. The changeover has eliminated periodic disruptions of service associated with satellite technology.
Big Boy gift cards have been sold in certain grocery store outlets since 2009. During fiscal year 2010, Big Boy gift cards became available online through the Company’s corporate web site (www.frischs.com). Golden Corral gift cards became the standard within the Golden Corral franchise system in fiscal year 2007.
Electronic signature capture devices that process debit and credit card transactions, which have been in place in all Big Boy restaurants for several years, will be added in all Golden Corral restaurants during fiscal year 2012. Other paperless systems in restaurants include a) employee payroll advices that can be either emailed directly to the employee or provided electronically to each restaurant where the employees may print them on demand if desired, b) signatures have been captured on key employment documents such as Form W-4 and acknowledgements regarding employee handbooks, and c) an online employment application has been added to the Company’s corporate web site (www.frischs.com) that provides direct feeds into the POS system and the enterprise reporting system at headquarters.
Originally installed in 2004, the enterprise reporting system that supports the Company’s information needs has twice been successfully upgraded to new environments, most recently in September 2009. A further upgrade is
7
Table of Contents
currently being planned for August 2011. A complete headquarters network upgrade (wiring and equipment) was completed in the spring of 2007, which coincided with the replacement of the headquarters telephone system with a Voice Over Internet Protocol (VOIP) system.
A secondary data storage appliance with supporting hardware and a VMware server were purchased in fiscal year 2011 to build an off-site storage area network (SAN). The SAN is being designed to perform near real time replication of all data in the production environment, which will allow for quick start-up of the disaster recovery environment should it be necessary to call it into service. The new environment will also be available for testing at all times. The SAN is expected to be operational by August 2011, when the current use of an off-site tape library system will be discontinued.
Raw Materials
The sources and availability of food and supplies are discussed above under Big Boy Restaurant Operations and Golden Corral Restaurant Operations. Other raw materials used in food processing include equipment for cooking and preparing food, refrigeration and storage equipment and various other fixtures. The Company currently purchases its restaurant equipment principally from two vendors, one of which supplies Big Boy restaurants, the other supplies Golden Corral restaurants. Other reliable restaurant equipment suppliers are available should the Company choose to change vendors. In addition, no significant disruptions in the supply of electricity and natural gas used in restaurant operations have been experienced to date.
Trademarks and Service Marks
The Company has registered certain trademarks and service marks on the Principal Register of the United States Patent and Trademark Office, including “Frisch’s” and the tagline “What’s Your Favorite Thing?” Other registrations include “Brawny Lad,” “Buddie Boy,” “Just Right Favorites,” “Pie Baby,” “Fire & Ice,” “Frisch-ly Made,” “Bundle of Joy,” and “Tiers of Joy.” All of these registrations are considered important to the Company’s Big Boy operations, especially the primary mark “Frisch’s” and the tag line “What’s Your Favorite Thing?” The duration of each registration varies depending upon when registration was first obtained. The Company currently intends to renew all of its trademarks and service marks when each comes up for renewal.
Pursuant to a 2001 agreement with Big Boy Restaurants International, LLC, the Company acquired limited ownership rights and a right to use the “Big Boy” trademarks and service marks within the states of Indiana and Kentucky and in most of Ohio and Tennessee. A concurrent use registration was issued October 6, 2009 on the Principal Register of the United States Patent and Trademark Office, confirming these exclusive “Big Boy” rights.
The “Golden Corral” trademarks and service marks are registered trademarks of Golden Corral Corporation.
The Company is not aware of any infringements on its registered trademarks and service marks, nor is the Company aware of any infringement on any of its territorial rights to use the proprietary marks that are owned by or licensed to the Company.
Seasonality
The Company’s business is moderately seasonal for both the Big Boy and Golden Corral operating segments, with the third quarter of the fiscal year (mid-December through early March) normally accounting for a smaller share of annual revenues. Additionally, severe winter weather can have a marked negative impact upon revenue during the third quarter. Occupancy and other fixed operating costs have a greater negative impact on operating results during any quarter that may experience lower sales. Results for any quarter should not be regarded as indicative of the year as a whole, especially the first quarter, which contains 16 weeks. Each of the last three quarters normally contains 12 weeks.
Working Capital
Restaurant sales provide the Company’s principal source of cash. Funds from both the Big Boy and Golden Corral operating segments are immediately available to meet the Company’s working capital needs, as substantially all restaurant sales are settled in cash or cash equivalents such as debit and credit cards. Other sources of cash may include borrowing against credit lines, proceeds from stock options exercised and occasional sales of real estate.
8
Table of Contents
The Company uses its positive cash flows for debt service, capital spending (principally restaurant expansion), capital stock repurchases and cash dividends.
As there is no need to maintain significant levels of inventories and accounts receivable are minimal in nature, the Company maintains a strategic negative working capital position, which is not uncommon in the restaurant industry. The working capital deficit was $14,240,000 as of May 31, 2011. As significant, predictable cash flows are provided by operations, the deployment of a negative working capital strategy has not and is not expected to hinder the Company’s ability to satisfactorily retire any of its obligations when due. Additionally, a working capital revolving line of credit is readily available if needed.
Customers, Backlog and Government Contracts
Because all of the Company’s retail sales are derived from food sales to the general public, neither the Big Boy nor the Golden Corral operating segments have any material dependence upon a single customer or any group of a few customers. No backlog of orders exists and no material portion of the business of either segment is subject to re-negotiation of profits or termination of contracts or subcontracts at the election of government authorities.
Competition
The restaurant industry is highly competitive and many of the Company’s competitors are substantially larger and possess greater financial resources than does the Company. Both the Big Boy and Golden Corral operating segments have numerous competitors, including national chains, regional and local chains, as well as independent operators. None of these competitors, in the opinion of the Company, is dominant in the family-style sector of the restaurant industry. In addition, competition continues to increase from non-traditional competitors such as supermarkets that not only offer home meal replacement but also have now added in-store dining space, a trend that continues to grow in popularity.
The principal methods of competition in the restaurant industry are brand name recognition and advertising; menu selection and prices; food quality and customer perceptions of value, speed and quality of service; cleanliness and fresh, attractive facilities in convenient locations. In addition to competition for customers, sharp competition exists for qualified restaurant managers, hourly restaurant workers and quality sites on which to build new restaurants.
Research and Development
The Company’s corporate staff includes a research and development chef for its Big Boy restaurants whose responsibilities entail development of new menu items and enhancing existing products. From time to time, the Company also conducts consumer research to identify where future restaurants should be built, along with emerging industry trends and changing consumer preferences. While these activities are important to the Company, these expenditures have not been material during the three fiscal years in the period that ended May 31, 2011 and are not expected to be material to the Company’s future results.
Government Regulation
The Company is subject to licensing and regulation by various Federal, state and local agencies. These licenses and regulations pertain to food safety, health, sanitation, safety, vendors’ licenses and hiring and employment practices including compliance with the Fair Labor Standards Act and minimum wage statutes. All Company operations, including the commissary and food manufacturing plant, are believed to be in material compliance with all applicable laws and regulations. All of the Company’s restaurants substantially meet local and state building and fire codes, and the material requirements of the Americans with Disabilities Act. Although the Company has not experienced any significant obstacles to obtaining building permits, licenses or approvals from governmental bodies, increasingly rigorous requirements on the part of state, and in particular, local governments, could delay or possibly prevent expansion in desired markets.
The Federal Patient Protection and Affordable Health Care Act was enacted in March 2010. As the U.S. Health and Human Services Department and other Federal agencies release their regulations, the Company is closely monitoring the potential for higher costs to maintain the existing health care plans that are sponsored by the Company. The same legislation will require calorie counts and other nutritional information to be posted on the Company’s menus. Proposed regulations regarding menu labeling were issued by the U.S. Food and Drug
9
Table of Contents
Administration in April 2011. Final regulations are expected by the end of calendar year 2011 with implementation required by mid 2012. Sales and profitability could be adversely affected if customers significantly alter their menu ordering habits as this information becomes readily available to them.
The Company is subject to the franchising regulations of the Federal Trade Commission and the franchising laws of Ohio, Kentucky and Indiana where it has licensed Big Boy restaurants to other operators.
Environmental Matters
The Company does not believe that various Federal, state or local environmental regulations will have any material effect upon the capital expenditures, earnings or competitive position of either the Big Boy or Golden Corral operating segments. However, the Company cannot predict the effect of any future environmental legislation or regulations.
Employees
As of May 31, 2011, the Company and its subsidiaries employed approximately 8,400 active employees, approximately 2,250 of whom work in Golden Corral restaurants. Approximately 4,600 of the Company’s employees are considered part-time (those who work less than 30 hours per week). Although there is no significant seasonal fluctuation in employment levels, hours worked may vary according to sales patterns in individual restaurants. None of the Company’s employees is represented by a collective bargaining agreement. Management believes that employee relations are excellent and employee compensation is comparable with or better than competing restaurants.
Geographic Areas
The Company has no operations outside of the United States of America. The Company’s revenues, consisting principally of retail sales of food and beverages to the general public and certain wholesale sales to and license fees from restaurants licensed to other operators, were substantially generated in various markets in the states of Ohio, Kentucky and Indiana during each of the three fiscal years in the period ended May 31, 2011. In addition, two Golden Corral restaurants are operated in western Pennsylvania and a third restaurant operates in the northwest part of West Virginia. Substantially all of the Company’s long-lived assets were deployed in service in the same states during the same periods stated above.
Available Information
The Securities Exchange Act of 1934, as amended, requires the Company to file periodic reports with the Securities and Exchange Commission (SEC) including its Annual Report on Form 10-K, quarterly reports on Form 10-Q, current reports on Form 8-K, Definitive 14A Proxy Statements, and certain other information. The Company’s periodic reports (and any amendments thereto) can be viewed by visiting the SEC’s internet site (http://www.sec.gov). In addition, the SEC makes the Company’s periodic reports available for reading and copying in its Public Reference Room located at 100 F. Street, NE, Washington, DC 20549. Information on the operation of the Public Reference Room may be obtained by calling the SEC at 1-800-SEC-0330.
The Company makes available the periodic reports that it files with the SEC through its corporate web site (www.frischs.com) via a hyperlink directly to the Company’s filings on the SEC’s web site. New information available through the hyperlink is generally provided within a few minutes from the time a report is filed. Information contained on or available through the Company’s website is not a part of, nor is it being incorporated into, this Annual Report on Form 10-K. In addition, printed copies of the reports the Company files with the SEC may be obtained without charge by writing to Mark R. Lanning, Vice President – Finance, Frisch’s Restaurants, Inc., 2800 Gilbert Avenue, Cincinnati, Ohio 45206-1206. Email requests may be sent to cfo@frischs.com.
Copies of the Company’s corporate governance documents are also available on the Company’s corporate web site (www.frischs.com). The documents include the Company’s Code of Regulations, Corporate Governance Guidelines, Code of Conduct, Code of Ethics, Insider Trading Policy, Related Person Transaction Policy, the Charter of the Disclosure Controls and Risk Management Committee, and various charters of committees of the Board of Directors, including those of the Audit Committee, the Compensation Committee, the Nominating and Corporate Governance Committee and the Finance Committee.
10
Table of Contents
The Audit Committee has established a procedure for the confidential, anonymous submission by employees and other concerned parties regarding the Company’s accounting, internal accounting controls or auditing matters. The toll free Corporate Governance Hotline number is 800-506-6424. The Hotline is managed by an independent third party and is available 24 hours a day, seven days a week. Messages are transcribed and referred electronically to the Audit Committee.
Executive Officers of the Registrant
The following table sets forth the names and certain information concerning the executive officers of the Company:
| Name | Age | Current Principal Occupation or Employment and Five Year Employment History | ||
| Craig F. Maier (a) |
61 | President and Chief Executive Officer of the Company (since 1989); Director of the Company since 1984 | ||
| Rinzy J. Nocero |
57 | Vice President and Chief Operating Officer of the Company (since February 2007); Private Investor (from November 2004 to February 2007); Senior Vice President - Operations, Bob Evans Farms, Inc. (from 1993 to November 2004) | ||
| Donald H. Walker |
65 | Vice President and Chief Financial Officer (since 1996) and Treasurer of the Company (since 1982); Director of the Company since November 2009. | ||
| Michael E. Conner, Sr. |
59 | Vice President - Human Resources of the Company (since 2000) | ||
| Michael R. Everett |
57 | Vice President - Information Services of the Company (since May 2006); Director of Information Services of the Company (from May 2005 to May 2006) | ||
| Stephen J. Hansen |
46 | Vice President - Commissary of the Company (since June 2010); Plant Manager, Klosterman Baking Company (from March 2009 to May 2010); Operations Manager, General Mills (from October 2008 to February 2009); Plant Manager, Campos Foods LLC (from 1996 to June 2008) | ||
| James I. Horwitz |
54 | Vice President – Real Estate of the Company (since March 2008); Director of Leasing and Development, Cincinnati United Contractors (from February 2007 to March 2008); Director of Real Estate, Alderwoods Group (from December 2005 to January 2007) | ||
| Mark R. Lanning |
56 | Vice President – Finance of the Company (since May 2011); Vice President – Investor Relations and Treasurer, Hillenbrand, Inc. (from March 2008 to May 2011); Vice President and Treasurer of Hillenbrand Industries, Inc. (from 1988 to March 2008) | ||
| Karen F. Maier (a) |
59 | Vice President - Marketing of the Company (since 1983); Director of the company since 2005 | ||
| William L. Harvey |
57 | Regional Director of the Company (since 1995) and formerly held positions within the Company of Area Supervisor and Executive Store Manager | ||
11
Table of Contents
| Lindon C. Kelley |
56 | Regional Director of the Company (since 2000) and formerly held positions within the Company of Area Supervisor and Executive Store Manager | ||
| Louie Sharalaya |
61 | Regional Director of the Company (since 2001) and formerly held positions within the Company of Area Supervisor and Executive Store Manager | ||
| (a) | Craig F. Maier is the brother of Karen F. Maier. |
The realization of any of the operational and other risks and uncertainties identified herein, together with those risks not specifically listed or those that are presently unforeseen, could result in significant adverse effects on the Company’s financial position, results of operations and cash flows, which could include the permanent closure of any affected restaurant(s) with an impairment of assets charge taken against earnings, and could adversely affect the price at which shares of the Company’s common stock trade.
In addition to operating results, other factors can influence the volatility and price at which the Company’s common stock trades. The Company’s stock is thinly traded on the NYSE Amex market. Thinly traded stocks can be susceptible to sudden, rapid declines in price, especially when holders of large blocks of shares seek exit positions. Rebalancing of stock indices in which the Company’s shares are placed can also influence the price of the Company’s stock.
Food Safety
Food safety is the most significant risk to any company that operates in the restaurant industry. It is the focus of increased government regulatory initiatives at the local, state and Federal levels. Failure to protect the Company’s food supplies could result in food borne illnesses and/or injuries to customers. If any of the Company’s customers become ill from consuming the Company’s products, the affected restaurants may be forced to close. An instance of food contamination originating at the commissary operation could have far reaching effects, as the contamination would affect substantially all Big Boy restaurants.
Economic Factors
Economic recessions can negatively influence discretionary consumer spending in restaurants and result in lower customer counts, as consumers become more price conscious, tending to conserve their cash amid unemployment and economic uncertainty. The effects of higher gasoline prices can also negatively affect discretionary consumer spending in restaurants. Increasing costs for energy can affect profit margins in many other ways. Petroleum based material is often used to package certain products for distribution. In addition, suppliers may add surcharges for fuel to their invoices. The cost to transport products from the commissary to restaurant operations will rise with each increase in fuel prices. Higher costs for electricity and natural gas result in higher costs to a) heat and cool restaurant facilities, b) refrigerate and cook food and c) manufacture and store food at the Company’s food manufacturing plant.
Inflationary pressure, particularly on food costs, labor costs (especially associated with increases in the minimum wage) and health care benefits, can negatively affect the operation of the business. Shortages of qualified labor are sometimes experienced in certain local economies. In addition, the loss of a key executive could pose a significant adverse effect on the Company.
Future funding requirements of the two qualified defined benefit pension plans that are sponsored by the Company largely depend upon the performance of investments that are held in trusts that have been established for the plans. Equity securities comprise 70 percent of the target allocation of the plans’ assets. Poor performance in equity securities markets can significantly lower the market values of the plans’ investment portfolios, which, in turn, can result in a) material increases in future funding requirements, b) much higher net periodic pension costs to be recognized in future years, and c) the plans reaching underfunded status, requiring reductions in the Company’s equity to be recognized.
12
Table of Contents
Competition
The restaurant industry is highly competitive and many of the Company’s competitors are substantially larger and possess greater financial resources than does the Company. Both the Big Boy and Golden Corral operating segments have numerous competitors, including national chains, regional and local chains, as well as independent operators. None of these competitors, in the opinion of the Company’s management, presently dominates the family-style sector of the restaurant industry in any of the Company’s operating markets. That could change at any time due to:
| • | changes in economic conditions |
| • | changes in demographics in neighborhoods where the Company operates restaurants |
| • | changes in consumer perceptions of value, food and service quality |
| • | changes in consumer preferences, particularly based on concerns with nutritional content of food on the Company’s menus |
| • | new competitors that enter the Company’s markets from time to time |
| • | increased competition from supermarkets and other non-traditional competitors |
| • | increased competition for quality sites on which to build restaurants |
Development Plans and Financing Arrangements
The Company’s business strategy and development plans also face risks and uncertainties. These include the inherent risk of poor quality decisions in the selection of sites on which to build restaurants, the ever rising cost and availability of desirable sites and increasingly rigorous requirements on the part of local governments to obtain various permits and licenses. Other factors that could impede plans to increase the number of restaurants operated by the Company include saturation in existing markets, limitations on borrowing capacity and the effects of higher interest rates.
In addition, the Company’s loan agreements include financial and other covenants with which compliance must be met or exceeded each quarter. Failure to meet these or other restrictions could result in an event of default under which the lender may accelerate the outstanding loan balances and declare them immediately due and payable.
The Supply and Cost of Food
Food purchases can be subject to significant price fluctuations that can considerably affect results of operations from quarter to quarter and year to year. Price fluctuations can be due to seasonality or any number of factors. The market for beef, in particular, continues to be highly volatile due in part to import and export restrictions. Beef costs can also be affected by bio-fuel initiatives and other factors that influence the cost to feed cattle. The Company depends on timely deliveries of perishable food and supplies. Any interruption in the continuing supply would harm the Company’s operations.
Litigation and Negative Publicity
Employees, customers and other parties bring various claims against the Company from time to time. Defending such claims can distract the attention of senior level management away from the operation of the business. Legal proceedings can result in significant adverse effects to the Company’s financial condition, especially if other potentially responsible parties lack the financial wherewithal to satisfy a judgment against them or the Company’s insurance coverage proves to be inadequate. Also, see “Legal Proceedings” elsewhere in Part I, Item 3 of this Form 10-K.
In addition, negative publicity associated with legal claims against the Company, whether or not such complaints are valid, could harm the Company’s reputation, which, in turn, could adversely affect operating results. The Company’s reputation and brand can also be harmed by operational problems experienced by other operators of Big Boy and Golden Corral restaurants, especially from issues relating to food safety. Other negative publicity such as that arising from rumor and innuendo spread through social internet media and other sources can create adverse effects on the Company’s results of operations.
13
Table of Contents
Governmental and Other Rules and Regulations
Governmental and other rules and regulations can pose significant risks to the Company. Examples include:
| • | general exposure to penalties or other costs associated with the potential for violations of numerous governmental regulations, including: |
| ¡ | immigration (I-9) and labor regulations regarding the employment of minors |
| ¡ | minimum wage and overtime requirements |
| ¡ | employment discrimination and sexual harassment |
| ¡ | health, sanitation and safety regulations |
| ¡ | facility issues, such as meeting the requirements of the Americans with Disabilities Act of 1990 or liabilities to remediate unknown environmental conditions |
| • | changes in existing environmental regulations that would significantly add to the Company’s costs |
| • | any future imposition by OSHA of costly ergonomics regulations on workplace safety |
| • | climate change legislation that adversely affects the cost of energy |
| • | legislative changes affecting labor law, especially increases in the Federal or state minimum wage requirements |
| • | compliance with legislation enacted to reform the U.S. health care system could adversely affect the Company’s health care costs |
| • | nutritional labeling on menus - compliance with legislation enacted to reform the U.S. health care system that requires nutritional labeling on menus and the Company’s reliance on the accuracy of certain information obtained from third party suppliers |
| • | nutritional labeling on menus – potential adverse effect on sales and profitability if customers’ menu ordering habits change |
| • | legislation or court rulings that result in changes to tax codes that are adverse to the Company |
| • | changes in accounting standards imposed by governmental regulators or private governing bodies could adversely affect the Company’s financial position |
| • | estimates used in preparing financial statements and the inherent risk that future events affecting them may cause actual results to differ markedly |
Catastrophic Events
Unforeseen catastrophic events could disrupt the Company’s operations, the operations of the Company’s suppliers and the lives of the Company’s customers. The Big Boy segment’s dependency on the commissary operation in particular could present an extensive disruption of products to restaurants should a catastrophe impair its ability to operate. Examples of catastrophic events include but are not limited to:
| • | adverse winter weather conditions |
| • | natural disasters such as earthquakes or tornadoes |
| • | fires or explosions |
| • | widespread power outages |
| • | criminal acts, including bomb threats, robberies, hostage taking, kidnapping and other violent crimes |
| • | acts of terrorists or acts of war |
| • | civil disturbances and boycotts |
| • | disease transmitted across borders that may enter the food supply chain |
Technology and Information Systems
The strategic nature of technology and information systems is of vital importance to the operations of the Company. Events that could pose threats to the operation of the business include:
| • | catastrophic failure of certain information systems |
| • | difficulties that may arise in maintaining existing systems |
| • | difficulties that may occur in the implementation of and transition to new systems |
| • | financial stability of vendors to support software over the long term |
14
Table of Contents
In addition, security violations or any unauthorized access to information systems, including breaches on third party servers, could result in the loss of proprietary data. Should consumer privacy be compromised, consumer confidence may be lost, which could adversely affect sales and profitability.
Item 1B. Unresolved Staff Comments
None
All of the Company’s restaurants are freestanding, well-maintained facilities. Older Big Boy restaurants are generally located in urban or heavily populated suburban neighborhoods that cater to local trade rather than highway travel. A few of these restaurant facilities are now more than 40 years old. Big Boy restaurants opened since the early 1990’s have generally been located near interstate highways. A typical Big Boy restaurant built before 2001 contains on average approximately 5,600 square feet with seating capacity for 156 guests. The prototype introduced in 2001 has generally contained 5,700 square feet with seating for 172 guests. An adaptation of the 2001 prototype was introduced in 2010 for use in smaller trade areas. Its footprint approximates 5,000 square feet and has 148 dining room seats.
Golden Corral restaurants constructed through 2002 contained 9,952 square feet with seating for 348 guests. Golden Corral restaurants opened since 2003 have 10,300 square feet with 372 seats.
Most new restaurant construction requires approximately 18 weeks to complete, depending on the time of year and weather conditions. A competitive bidding process is used to award contracts to general contractors for all new restaurant construction. The general contractor selects and schedules sub-contractors, and is responsible for procuring most building materials. A Company project coordinator is assigned to coordinate all construction projects.
The following table provides certain operating segment information with respect to the number and location of all restaurants in the Company’s system as of May 31, 2011:
| Big Boy |
||||||
| Company Operated |
Operated by Licensees |
Golden Corral | ||||
| Cincinnati, Ohio market |
50 | 4 | 11 | |||
| Dayton, Ohio market |
19 | - | 5 | |||
| Columbus, Ohio market |
11 | 1 | 1 | |||
| Louisville, Kentucky market |
10 | 2 | 4 | |||
| Lexington, Kentucky market |
5 | 3 | - | |||
| Cleveland, Ohio market |
- | - | 8 | |||
| Toledo/Lima/Findlay, Ohio market |
- | 13 | 3 | |||
| Pittsburgh, Pennsylvania market |
- | - | 3 | |||
| Other |
- | 2 | - | |||
| Total |
95 | 25 | 35 | |||
Sites acquired for development of new Company operated restaurants are identified and evaluated for potential long-term sales and profits. A variety of factors is analyzed including demographics, traffic patterns, competition and other relevant information. Because control of property rights is important to the Company, it is the Company’s policy to own its restaurant locations whenever possible.
In recent years, it has sometimes become necessary to enter ground leases to obtain desirable land on which to build. In addition, many of the restaurants operated by the Company that opened prior to 1990 were financed with sale/leaseback transactions. Most of the leases are for 15 or 20 years and contain multiple five-year renewal options. All of the leases generally require the Company to pay property taxes, insurance and maintenance. As of May 31,
15
Table of Contents
2011, 22 restaurants were in operation on non-owned premises, 21 of which are classified as operating leases with one being treated as a capital lease. Two of the operating leases contain options to purchase the underlying properties, which only become available over time. Under the terms of the lone capital lease, the Company is required to acquire the underlying land in fee simple estate at any time between the 10th and 15th years of the lease. The following table sets forth certain operating segment information regarding the type of occupancy of Company-operated restaurants:
| Big Boy | Golden Corral | |||
| Land and building owned |
80 | 28 | ||
| Land or land & building leased |
15 | 7 | ||
| Total |
95 | 35 | ||
Seven (all of which are Big Boy restaurants) of the 22 leases in the above table will expire during the next five years, as detailed in the list below. Three of the seven leases have remaining options to renew for five or more years. Current plans call for the three leases expiring in fiscal year 2012 to be vacated upon expiration.
| Fiscal year ending in |
Number of leases expiring | |
| 2012 |
3 | |
| 2013 |
- | |
| 2014 |
1 | |
| 2015 |
2 | |
| 2016 |
1 | |
Construction of two new Big Boy restaurants, both in the Cincinnati market, was in progress at May 31, 2011 – one on land owned by the Company and the other was being built on leased land (not included in the above tables). Three other sites owned by the Company - one each in the Cincinnati, Columbus and Indianapolis market areas - were in the pipeline and ready for development as of May 31, 2011.
None of the real property owned by the Company is currently encumbered by mortgages or otherwise pledged as collateral. With the exception of certain delivery and other equipment utilized under capital leases expiring during periods through fiscal year 2019, the Company owns substantially all of the furnishings, fixtures and equipment used in the operation of the business.
The Company owns a 79,000 square foot building that houses its commissary in Cincinnati, Ohio. It is suitable and adequate to supply Company operated Big Boy restaurants and the needs of Big Boy restaurants licensed to others in all the Company’s Big Boy market areas. As the facility normally operates one shift daily, additional productive capacity is readily available if needed.
The Company maintains its headquarters in Cincinnati on a well-traveled street in a mid-town business district. This administrative office space approximates 49,000 square feet and is occupied under an operating lease expiring December 31, 2012, with a renewal option available through December 31, 2022. During the term of the lease and the period covered by its renewal option, the Company has been granted the right of first refusal should the lessor receive a bona fide offer to purchase from a third party. The Company has an option to purchase the property at the end of the renewal option period.
Seven surplus land locations owned by the Company were listed for sale with brokers as of May 31, 2011, four of which are located in the Columbus, Ohio market, the fifth is located in the Louisville, Kentucky market area, the sixth is in the Dayton, Ohio market and the seventh is in Toledo, Ohio. Two former Big Boy restaurants owned by the Company are also listed for sale with brokers, one in the Cincinnati market, and the other in the Dayton, Ohio market. No specific plans have yet been made for three other sites owned by the Company, two of which are located in the Cincinnati market with the third one being located in the Dayton, Ohio market area. Finally, the Company owns one former restaurant building in the Cincinnati market that it leases to a third party.
The Company is contingently liable for the performance of a ground lease (of property located in Covington, Kentucky on which a hotel once operated by the Company is built) that has been assigned to a third party. The
16
Table of Contents
annual obligation of the lease approximates $48,000 through 2020. Should the third party default, the Company has the right to re-assign the lease.
Employees, customers and other parties bring various claims and suits against the Company from time to time in the ordinary course of business. Whether or not covered by insurance, management presently believes that the resolution of claims currently outstanding will not result in a material effect on the Company’s earnings, cash flows or financial position.
Item 4. (Removed and Reserved)
(Items 5 through 9)
Item 5. Market for Registrant’s Common Equity, Related Stockholder Matters and Issuer Purchases of Equity Securities
The Company’s common stock is traded on NYSE Amex under the symbol “FRS.” The closing price of the Company’s common stock as reported by NYSE Amex on July 26, 2011 was $22.00. There were approximately 1,675 shareholders of record as of July 26, 2011. The following table sets forth the high and low sales prices for the common stock and the cash dividend declared for each quarter within the Company’s two most recent fiscal years:
| Fiscal Year Ended May 31, 2011 | Fiscal Year Ended June 1, 2010 | |||||||||||||
|
|
| |||||||||||||
| Stock Prices | Dividend | Stock Prices | Dividend | |||||||||||
| High | Low | per share | High | Low | per share | |||||||||
| 1st Quarter |
$21.49 | $18.54 | 13¢ | $32.21 | $23.12 | 12¢ | ||||||||
| 2nd Quarter |
23.70 | 18.84 | 15¢ | 26.79 | 22.07 | 13¢ | ||||||||
| 3rd Quarter |
22.34 | 19.89 | 15¢ | 25.61 | 22.17 | 13¢ | ||||||||
| 4th Quarter |
23.61 | 20.53 | 15¢ | 24.10 | 19.91 | 13¢ | ||||||||
Dividend Policy
Through July 8, 2011, the Company has paid 202 consecutive quarterly cash dividends during its 51 year history as a public company. The Company currently expects that quarterly cash dividends will continue to be paid for the foreseeable future at rates comparable with or slightly higher than those shown in the above table.
Equity Compensation Plan Information
Information regarding equity compensation plans under which common stock of the Company is authorized for issuance is incorporated by reference to Item 12 of this Form 10-K.
Issuer Purchases of Equity Securities
In January 2010, the Board of Directors authorized a program to repurchase up to 500,000 shares of the Company’s common stock in the open market or through block trades over a two-year period that expires January 6, 2012. The following table shows information pertaining to the Company’s repurchases of its common stock during its fourth quarter that ended May 31, 2011:
17
Table of Contents
| Period |
Total Number Of Shares Purchased |
Average Price |
Total Number of Shares Purchased as Part of Publicly Announced Plans or Programs |
Maximum Number Plans or Programs |
||||||||
| March 9, 2011 to April 5, 2011 |
80,923 | $21.31 | 80,923 | 247,777 | ||||||||
| April 6, 2011 to May 3, 2011 |
11,758 | $22.34 | 11,758 | 236,019 | ||||||||
| May 4, 2011 to May 31, 2011 |
5,951 | $22.41 | 5,951 | 230,068 | ||||||||
| Total |
98,632 | $21.50 | 98,632 | 230,068 | ||||||||
Performance Graph
The following graph compares the yearly percentage change in the Company’s cumulative total stockholder return on its common stock over the five year period ending May 31, 2011 with the Russell 2000 Index and a group of the Company’s peer issuers, selected by the Company in good faith. The graph assumes an investment of $100 in the Company’s common stock, in the Index and in the common stock of each member of the peer group on May 31, 2006 and reinvestment of all dividends.
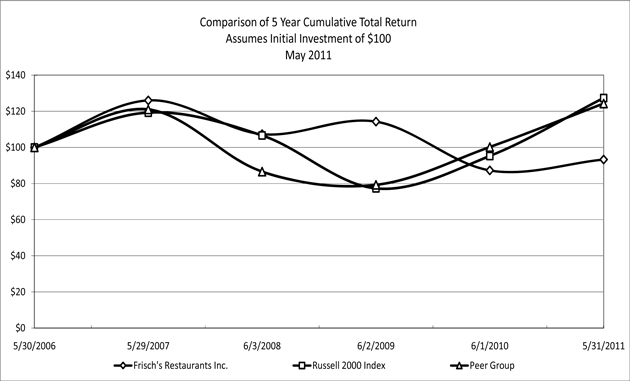
The Peer Group consists of the following issuers: Bob Evans Farms, Inc., Biglari Holdings, Inc. (Steak n Shake), CBRL Group, Inc. (Cracker Barrel Old Country Store), Denny’s, Inc. and DineEquity, Inc. (IHOP and Applebees).
18
Table of Contents
Item 6. Selected Financial Data
FRISCH’S RESTAURANTS, INC. AND SUBSIDIARIES
SUMMARY OF OPERATIONS
| (in thousands, except per share data) | ||||||||||||||||||||
| 2011 | 2010 | 2009 | 2008 | 2007 | ||||||||||||||||
| Sales |
$ | 303,541 | $ | 292,872 | $ | 297,861 | $ | 299,562 | $ | 289,934 | ||||||||||
| Cost of sales |
||||||||||||||||||||
| Food and paper |
105,484 | 99,651 | 105,860 | 106,895 | 101,401 | |||||||||||||||
| Payroll and related |
101,067 | 97,919 | 97,678 | 98,347 | 95,501 | |||||||||||||||
| Other operating costs |
67,631 | 64,988 | 66,082 | 66,383 | 64,043 | |||||||||||||||
|
|
|
|
|
|
|
|
|
|
|
|||||||||||
| 274,182 | 262,558 | 269,620 | 271,625 | 260,945 | ||||||||||||||||
| Gross profit |
29,359 | 30,314 | 28,241 | 27,937 | 28,989 | |||||||||||||||
| Administrative and advertising |
15,872 | 15,127 | 14,638 | 14,131 | 14,301 | |||||||||||||||
| Franchise fees and other revenue |
(1,324) | (1,266) | (1,281) | (1,278) | (1,254) | |||||||||||||||
| Loss (gain) on sale of assets |
40 | - | (1,163) | (524) | (250) | |||||||||||||||
| Litigation settlement |
- | - | (890) | - | - | |||||||||||||||
| Impairment of long-lived assets |
- | - | - | 4,660 | - | |||||||||||||||
|
|
|
|
|
|
|
|
|
|
|
|||||||||||
| Operating profit |
14,771 | 16,453 | 16,937 | 10,948 | 16,192 | |||||||||||||||
| Interest expense |
1,582 | 1,748 | 2,000 | 2,360 | 2,672 | |||||||||||||||
|
|
|
|
|
|
|
|
|
|
|
|||||||||||
| Earnings before income taxes |
13,189 | 14,705 | 14,937 | 8,588 | 13,520 | |||||||||||||||
| Income taxes |
||||||||||||||||||||
| Current |
890 | 5,664 | 4,022 | 5,147 | 5,357 | |||||||||||||||
| Deferred |
2,826 | (958) | 194 | (2,505) | (1,105) | |||||||||||||||
|
|
|
|
|
|
|
|
|
|
|
|||||||||||
| 3,716 | 4,706 | 4,216 | 2,642 | 4,252 | ||||||||||||||||
|
|
|
|
|
|
|
|
|
|
|
|||||||||||
| NET EARNINGS |
$ | 9,473 | $ | 9,999 | $ | 10,721 | $ | 5,946 | $ | 9,268 | ||||||||||
|
|
|
|
|
|
|
|
|
|
|
|||||||||||
| Diluted net earnings per share of common stock |
$ 1.87 | $ 1.93 | $ 2.08 | $ 1.14 | $ 1.78 | |||||||||||||||
| Cash dividends per share |
$ .58 | $ .51 | $ .48 | $ .46 | $ .44 | |||||||||||||||
| Other financial statistics |
||||||||||||||||||||
| Working capital (deficit) |
$ | (14,240) | $ | (18,661) | $ | (16,552) | $ | (20,142) | $ | (25,832) | ||||||||||
| Capital expenditures |
19,703 | 24,484 | 18,035 | 14,646 | 18,588 | |||||||||||||||
| Total assets |
195,294 | 189,253 | 176,976 | 172,060 | 179,259 | |||||||||||||||
| Long-term obligations |
40,646 | 40,109 | 34,588 | 30,509 | 34,538 | |||||||||||||||
| Shareholders’ equity |
125,528 | 120,094 | 114,377 | 110,715 | 107,870 | |||||||||||||||
| Book value per share at year end |
$25.51 | $23.73 | $22.43 | $21.67 | $21.06 | |||||||||||||||
| Return on average shareholders’ equity |
7.7% | 8.5% | 9.5% | 5.4% | 8.9% | |||||||||||||||
| Weighted average number of diluted shares outstanding |
5,068 | 5,192 | 5,164 | 5,228 | 5,215 | |||||||||||||||
| Number of shares outstanding at year end |
4,920 | 5,061 | 5,100 | 5,110 | 5,123 | |||||||||||||||
| Sales change percentage |
3.6% | (1.7%) | (.6%) | 3.3% | (.4%) | |||||||||||||||
| Earnings as a percentage of sales |
||||||||||||||||||||
| Gross profit |
9.7% | 10.4% | 9.5% | 9.3% | 10.0% | |||||||||||||||
| Operating profit |
4.9% | 5.6% | 5.7% | 3.7% | 5.6% | |||||||||||||||
| Earnings before income taxes |
4.3% | 5.0% | 5.0% | 2.9% | 4.7% | |||||||||||||||
| Net earnings |
3.1% | 3.4% | 3.6% | 2.0% | 3.2% | |||||||||||||||
All fiscal years presented contained 52 weeks consisting of 364 days, except for fiscal year 2008, which contained 53 weeks consisting of 371 days.
19
Table of Contents
Item 7. Management’s Discussion and Analysis of Financial Condition and Results of Operations
SAFE HARBOR STATEMENT under the PRIVATE SECURITIES LITIGATION REFORM ACT of 1995
Forward-looking statements are included in this Management’s Discussion and Analysis of Financial Condition and Results of Operations (MD&A). Such statements may generally express management’s expectations with respect to its plans, or its assumptions and beliefs concerning future developments and their potential effect on the Company. There can be no assurances that such expectations will be met or that future developments will not conflict with management’s current beliefs and assumptions, which are inherently subject to risks and other uncertainties. Factors that could cause actual results and performance to differ materially from anticipated results that may be expressed or implied in forward-looking statements are included in, but not limited to, the discussion in this Form 10-K under Part I, Item 1A. “Risk Factors.”
Sentences that contain words such as “should,” “would,” “could,” “may,” “plan(s),” “anticipate(s),” “project(s),” “believe(s),” “will,” “expect(s),” “estimate(s),” “intend(s),” “continue(s),” “assumption(s),” “goal(s),” “target” and similar words (or derivatives thereof) are generally used to distinguish forward-looking statements from historical or present facts.
All forward-looking information in this MD&A is provided by the Company pursuant to the safe harbor established under the Private Securities Litigation Reform Act of 1995 and should be evaluated in the context of all risk factors. Except as may be required by law, the Company disclaims any obligation to update any of the forward-looking statements that may be contained in this MD&A.
This MD&A should be read in conjunction with the consolidated financial statements. The Company has no off-balance sheet arrangements other than operating leases that are entered from time to time in the ordinary course of business. The Company does not use special purpose entities.
CORPORATE OVERVIEW
The operations of Frisch’s Restaurants, Inc. and Subsidiaries (Company) consist of two reportable segments within the restaurant industry: full service family-style “Big Boy” restaurants and grill buffet-style “Golden Corral” restaurants. As of May 31, 2011, 95 Big Boy restaurants and 35 Golden Corral restaurants were owned and operated by the Company, located in various regions of Ohio, Kentucky and Indiana, plus smaller areas in Pennsylvania and West Virginia, and 25 Big Boy restaurants were licensed to other operators who pay franchise and other fees to the Company.
Fiscal Year 2011 ended on Tuesday, May 31, 2011 (a period of 52 weeks comprised of 364 days). It compares with Fiscal Year 2010 that ended on Tuesday, June 1, 2010 and Fiscal Year 2009 that ended on Tuesday, June 2, 2009 (both of which were 52 week periods comprised of 364 days). Fiscal Year 2012 will end on Tuesday, May 29, 2012 (also a period of 52 weeks comprised of 364 days).
Net earnings in Fiscal Year 2011 were $9,473,000, or diluted earnings per share (EPS) of $1.87. Net earnings were $9,999,000 ($1.93 diluted EPS) in Fiscal Year 2010 and $10,721,000 ($2.08 diluted EPS) in Fiscal Year 2009. Diluted EPS was calculated using the following diluted weighted average shares outstanding: 5,068,466 in Fiscal Year 2011, 5,192,419 in Fiscal Year 2010 and 5,164,164 in Fiscal Year 2009. The effective tax rates were 28.2 percent, 32.0 percent and 28.2 percent, respectively, in Fiscal Years 2011, 2010 and 2009.
Factors having a notable effect on pretax earnings when comparing Fiscal Year 2011 ($13,189,000) with Fiscal Year 2010 ($14,705,000) and Fiscal Year 2009 ($14,937,000):
| • | Consolidated restaurant sales in Fiscal Years 2011, 2010 and 2009 were $303,541,000, $292,872,000 and $297,861,000, respectively. The increase in Fiscal Year 2011 is primarily attributable to more Big Boy restaurants in operation. |
| • | Big Boy same store sales decreased 0.4 percent in Fiscal Year 2011, which followed a 1.6 percent decrease in Fiscal Year 2010. |
20
Table of Contents
| • | Golden Corral same store sales increased 0.6 percent in Fiscal Year 2011, which followed a 2.9 percent decrease in Fiscal Year 2010. |
| • | Golden Corral pretax earnings were $2,316,000 in Fiscal Year 2011, $3,874,000 in Fiscal year 2010 and $2,170,000 in Fiscal Year 2009. |
| • | As a percentage of sales, consolidated food costs were 34.8 percent in Fiscal Year 2011, 34.0 percent in Fiscal Year 2010 and 35.5 percent in Fiscal Year 2009. |
| • | As a percentage of sales, consolidated payroll and related costs were 33.3 percent in Fiscal Year 2011, 33.4 percent in Fiscal Year 2010 and 32.8 percent in Fiscal Year 2009. |
| • | Net periodic pension cost was $3,025,000 in Fiscal Year 2011, $2,818,000 in Fiscal Year 2010 and $1,814,000 in Fiscal Year 2009. |
| • | Self-insurance reserve adjustments – charges to earnings of $174,000 and $536,000 were recorded respectively in Fiscal Years 2011 and 2010 versus a credit in Fiscal Year 2009 of $68,000. |
| • | New store opening costs (all for Big Boy) were $1,073,000 in Fiscal Year 2011, $768,000 in Fiscal Year 2010 and $585,000 in Fiscal Year 2009. |
| • | Gains & losses on the sale of real estate – a loss of $40,000 was recorded in Fiscal Year 2011, no activity occurred during Fiscal Year 2010 and a gain of $1,163,000 was reported in Fiscal Year 2009. |
| • | Results for Fiscal Year 2009 included an $890,000 credit to earnings, the result of a favorable conclusion to long-standing litigation. |
Underfunded status in the two defined benefit pension plans that are sponsored by the Company was $8,946,000 as of May 31, 2011, which improved from $10,748,000 at June 1, 2010. The improvement resulted in an increase in equity of $1,538,000, net of tax, effected through a credit to accumulated other comprehensive loss.
RESULTS OF OPERATIONS
Sales
The Company’s sales are primarily generated through the operation of Big Boy restaurants and Golden Corral restaurants. Big Boy sales also include wholesale sales from the Company’s commissary to restaurants licensed to other Big Boy operators and the sale of Big Boy’s signature brand tartar sauce to grocery stores. Same store sales comparisons are a key metric that management uses in the operation of the business. Same store sales are affected by changes in customer counts and menu price increases. Changes in sales also occur as new restaurants are opened and older restaurants are closed. Below is the detail of consolidated restaurant sales:
| Fiscal Year 2011 |
Fiscal Year 2010 |
Fiscal Year 2009 |
||||||||||
| (in thousands) | ||||||||||||
| Big Boy restaurants |
$ | 191,493 | $ | 181,903 | $ | 183,443 | ||||||
| Wholesale sales to licensees |
8,990 | 8,554 | 9,038 | |||||||||
| Wholesale sales to groceries |
1,234 | 1,152 | 1,142 | |||||||||
|
|
|
|
|
|
|
|||||||
| Total Big Boy sales |
201,717 | 191,609 | 193,623 | |||||||||
| Golden Corral sales |
101,824 | 101,263 | 104,238 | |||||||||
|
|
|
|
|
|
|
|||||||
| Consolidated restaurant sales |
$ | 303,541 | $ | 292,872 | $ | 297,861 | ||||||
|
|
|
|
|
|
|
|||||||
A breakdown of changes in Big Boy same store sales by quarter follows:
| Big Boy |
1st Qtr. | 2nd Qtr. | 3rd Qtr. | 4th Qtr. | Year | |||||
| Fiscal Year 2011 |
(0.8)% | (1.1)% | 0.2% | 0.5% | (0.4)% | |||||
| Fiscal Year 2010 |
(0.1)% | (0.4)% | (3.4)% | (2.7)% | (1.6)% | |||||
The 1.6 percent decrease in Big Boy same store sales during Fiscal Year 2010 brought to an end 12 consecutive years of Big Boy same store sales increases. Fiscal Year 2010 (began June 2009) was the first full fiscal year of the economic downturn, which continues to impede sales growth opportunities.
21
Table of Contents
All Big Boy same store sales comparisons include average menu price increases of 1.0 percent, 1.0 percent, and 1.4 percent, implemented respectively near the ends of the third quarters of Fiscal Years 2011, 2010 and 2009. The first quarters of Fiscal Years 2011, 2010 and 2009 included average menu price increases of 1.0 percent, 1.0 percent, and 2.4 percent, respectively. Another increase is currently being planned for implementation in the first quarter of Fiscal Year 2012 (September 2011). Customer counts in same stores were 2.0 percent lower in Fiscal Year 2011 compared with Fiscal Year 2010, which was 3.4 percent lower than Fiscal Year 2009.
The Company operated 95 Big Boy restaurants as of May 31, 2011. The count of 95 includes the following openings and closings since the beginning of Fiscal Year 2009 (June 2008):
Fiscal Year 2011
| • | New unit opened in July 2010 in Louisville, Kentucky |
| • | New unit opened in August 2010 near Dayton, Ohio |
| • | New unit opened in October 2010 in Elizabethtown, Kentucky (Louisville market) |
| • | New unit opened in December 2010 in Heath, Ohio (Columbus market) |
Fiscal Year 2010
| • | New unit opened in May 2010 in Shepherdsville, Kentucky (Louisville market) |
| • | New unit opened in April 2010 in Independence, Kentucky (Cincinnati market) |
| • | New unit opened in November 2009 near Hamilton, Ohio (Cincinnati market) |
| • | Replacement unit opened in September 2009 in Lawrenceburg, Indiana (Cincinnati market) – no sales interruption |
Fiscal Year 2009
| • | Closed unit in May 2009 in Dayton, Ohio |
| • | New unit opened in October 2008 in Dayton, Ohio |
| • | Replacement unit opened in September 2008 in Blue Ash, Ohio (Cincinnati market) – three month sales interruption |
| • | New unit opened in August 2008 in Winchester, Kentucky (Lexington market) |
Planned Big Boy Openings in Fiscal Year 2012
| • | Near Cincinnati, Ohio - July 2011 |
| • | Highland Heights, Kentucky (Cincinnati market) – September 2011 |
When the Big Boy restaurant being built in Highland Heights, Kentucky opens, a nearby aging restaurant will be permanently closed. In addition, three other older Big Boy restaurants currently operating at leased locations will be closed and the properties vacated as their leases expire over the course of Fiscal Year 2012.
A breakdown of Golden Corral same store sales by quarter follows:
| Golden Corral |
1st Qtr. | 2nd Qtr. | 3rd Qtr. | 4th Qtr. | Year | |||||
| Fiscal 2011 |
4.4% | 1.4% | (0.9)% | (3.6)% | 0.6% | |||||
| Fiscal 2010 |
(2.4)% | (3.6)% | (6.4)% | 0.7% | (2.9)% | |||||
The same store sales increases that began in the fourth quarter of Fiscal Year 2010 and continued through the second quarter of Fiscal Year 2011 was the result of a seasonal promotion that featured baby back ribs on the all-you-can-eat buffet line. The renewal of the promotion in the fourth quarter of Fiscal Year 2011 was not as successful as the prior year. The Golden Corral segment of the business has now experienced a same store sales decline in 23 of the last 31 quarters.
All Golden Corral same store sales comparisons include average menu price increases of 1.0 percent in March 2011, 0.9 percent in January 2011, 1.3 percent in September 2010, 0.5 percent in February 2010, 0.3 percent in May 2009, 2.5 percent in September 2008 and 0.5 percent in June 2008. Same store customer counts were 2.3 percent lower in Fiscal Year 2011 compared with Fiscal Year 2010, which was 4.2 percent lower than Fiscal Year 2009.
22
Table of Contents
The Company operated 35 Golden Corral restaurants as of May 31, 2011. No Golden Corral restaurants have been opened or closed since the beginning of Fiscal Year 2009 (June 2008). Management has no plans for further development of Golden Corral restaurants. Three Golden Corral restaurant operations that were determined to have an impairment of long-lived assets at the end of Fiscal year 2008 remained in operation as of May 31, 2011.
While higher menu prices may contribute to the trend in lower customer traffic, a larger concern is the persistently high unemployment rate in the Midwest that continues to restrict the disposable income of the customer bases for both Big Boy and Golden Corral, which in turn limits sales growth opportunities. Management has no plans to offer competitive discounting or other promotional deals as many other chain restaurant concepts have done during the continued economic downturn to boost their sagging customer traffic because management believes the avoidance of deep discounting has kept the Company’s sales declines to a minimum, placing it in a solid position of not having to ask customers to give up deals when the economy eventually recovers.
Proposed regulations of the menu labeling provisions of the Federal Patient Protection and Affordable Care Act (enacted March 2010) were issued by the U.S. Food and Drug Administration on April 1, 2011. Final regulations are expected by the end of calendar year 2011 with implementation required by mid 2012. Sales volumes in both Big Boy and Golden Corral restaurants may be adversely affected if customers significantly alter their dining choices as a result of the requirement to add nutritional information to menus.
The Payment Card Industry Security Standards Council (PCI) has a data security standard with which all entities that process credit and debit card payments must comply. The standard is designed to prevent credit card fraud by focusing on the internal controls of processing and storing such data. While the Company has long adhered to this standard, an amendment was put in place to require an independent audit to certify the Company’s compliance with the standards of PCI no later than July 2011. The Company received its Attestation of Compliance as a result of an independent audit in June 2011. A finding of non-compliance could have restricted the Company’s ability to continue accepting credit and debit cards as a form of payment.
Gross Profit
Gross profit for the Big Boy segment includes wholesale sales and cost of wholesale sales. Gross profit differs from restaurant level profit discussed in Note G (Segment Information) to the consolidated financial statements because advertising expense is charged against restaurant level profit. Gross profit for both operating segments is shown below.
| Fiscal Year 2011 |
Fiscal Year 2010 |
Fiscal Year 2009 |
||||||||||
| (in thousands) | ||||||||||||
| Big Boy gross profit |
$ | 24,428 | $ | 24,066 | $ | 23,725 | ||||||
| Golden Corral gross profit |
4,931 | 6,248 | 4,515 | |||||||||
|
|
|
|
|
|
|
|||||||
| Total gross profit |
$ | 29,359 | $ | 30,314 | $ | 28,240 | ||||||
|
|
|
|
|
|
|
|||||||
The operating percentages shown in the following table are percentages of total sales, including Big Boy wholesale sales. The table supplements the discussion that follows, which addresses cost of sales for both the Big Boy and Golden Corral reporting segments, including food cost, payroll and other operating costs.
| Fiscal Year 2011 |
Fiscal Year 2010 |
Fiscal Year 2009 |
||||||||||||||||||||||||||||||||||
| Total |
BB |
GC |
Total |
BB |
GC |
Total |
BB |
GC |
||||||||||||||||||||||||||||
| Sales |
100.0 | 100.0 | 100.0 | 100.0 | 100.0 | 100.0 | 100.0 | 100.0 | 100.0 | |||||||||||||||||||||||||||
| Food and paper |
34.8 | 32.9 | 38.4 | 34.0 | 32.2 | 37.4 | 35.5 | 33.8 | 38.8 | |||||||||||||||||||||||||||
| Payroll and related |
33.3 | 35.4 | 29.0 | 33.4 | 35.8 | 28.9 | 32.8 | 34.7 | 29.2 | |||||||||||||||||||||||||||
| Other operating costs (including opening costs) |
22.3 | 19.6 | 27.7 | 22.2 | 19.3 | 27.6 | 22.2 | 19.2 | 27.7 | |||||||||||||||||||||||||||
| Gross profit |
9.6 | 12.1 | 4.9 | 10.4 | 12.7 | 6.1 | 9.5 | 12.3 | 4.3 | |||||||||||||||||||||||||||
23
Table of Contents
Food prices continued to escalate in Fiscal Year 2011. Food costs began rising during the last half of Fiscal Year 2010, after a period of food cost deflation that first emerged during the last half of Fiscal Year 2009. The cost of hamburger and bacon, the two items in the Big Boy menu mix with the greatest consumption, experienced the largest percentages of increase of all commodities purchased in Fiscal Year 2011, as compared with the prior year. Elevated prices for most of the commodities that the Company uses are expected to continue throughout calendar year 2011, including beef, pork, poultry, dairy and grains. Purchase contracts for some commodities may contain contractual provisions that limit the price the Company will pay.
The Company does not use financial instruments as a hedge against changes in commodity prices. The effect of commodity price increases is actively managed with changes to the Big Boy menu mix and effective selection and rotation of items served on the Golden Corral buffet, together with periodic increases in menu prices. However, rapid escalations in the cost of food can be problematic to effective menu management, as evidenced by the rising percentages in the above table despite higher prices being charged to customers. Food and paper cost percentages in the Golden Corral segment are much higher than Big Boy because of the all-you-can-eat nature of the Golden Corral concept, and because steak is featured daily on the buffet line.
Food safety poses a major risk to the Company. Management rigorously emphasizes and enforces established food safety policies in all of the Company’s restaurants and in its commissary and food manufacturing plant. These policies are designed to work cooperatively with programs established by health agencies at all levels of government authority, including the Federal Hazard Analysis of Critical Control Points (HACCP) program. In addition, the Company makes use of ServSafe Training, a nationally recognized program developed by the National Restaurant Association. The ServSafe program provides accurate, up-to-date science-based information to all levels of restaurant workers on all aspects of food handling, from receiving and storing to preparing and serving. All restaurant managers are required to be certified in ServSafe Training and are required to be re-certified every five years.
Management initiated an assessment of its food handling, processing and storage practices that are used at the commissary and food manufacturing plant. Completed in October 2010, the assessment concluded that key safety practices that are in place are very well established and functioning properly. The assessment also noted certain opportunities for improvement, most of which have already been completed, thus providing a solid foundation for ultimate compliance with the Federal Food Safety Modernization act that was signed into law in January 2011.
Payroll and related costs have benefitted from the Federal Hiring Incentives to Restore Employment Act of 2010 (HIRE Act enacted March 2010) under which the Company did not have to pay the employer’s share of social security (FICA) taxes through December 31, 2010 on certain employees hired in calendar year 2010. FICA credits under the HIRE Act amounted to $472,000 during Fiscal Year 2011.
Notwithstanding the improvements shown in some of the payroll and related cost percentages in the above table, operating margins continue to be adversely affected by mandated increases in the minimum wage:
| • | In Ohio, where more than two-thirds of the Company’s payroll costs are incurred, the minimum wage for non-tipped employees was increased 33 percent from $5.15 per hour to $6.85 per hour beginning January 1, 2007. It was increased to $7.00 per hour on January 1, 2008 and to $7.30 per hour on January 1, 2009. While there was no increase on January 1, 2010, the minimum increased to $7.40 per hour on January 1, 2011. |
| • | The Ohio minimum wage for tipped employees increased 61 percent from $2.13 per hour to $3.43 per hour beginning January 1, 2007. It was increased to $3.50 per hour on January 1, 2008 and to $3.65 per hour on January 1, 2009. While there was no increase on January 1, 2010, the minimum increased to $3.70 per hour on January 1, 2011. |
| • | Federal minimum wage statutes currently apply to substantially all other (non-Ohio) employees. The Federal minimum wage for non-tipped employees increased from $5.15 per hour to $5.85 per hour in July 2007. It was increased to $6.55 per hour in July 2008 and to $7.25 per hour in July 2009. The rate for tipped employees (non-Ohio) was not affected by the Federal legislation, remaining at $2.13 per hour. |
Although there is no seasonal fluctuation in employment levels, the number of hours worked by hourly paid employees has always been managed closely according to sales patterns in individual restaurants. However, the
24
Table of Contents
effects of paying the mandated higher hourly rates of pay have been and are continuing to be countered through the combination of reductions in the number of scheduled labor hours and higher menu prices charged to customers. Without benefit of reductions in labor hours, the Ohio minimum wage increases on January 1, 2011 and January 1, 2009 would have added an estimated $140,000 and $500,000 respectively, to annual payroll costs in Ohio restaurant operations, and the July 2009 increase in the Federal minimum wage would have added an estimated $400,000 to annual payroll costs in non-Ohio restaurant operations.
Despite the savings that come from reductions in hours worked and higher menu prices charged to customers, other factors add to payroll and related costs. These factors include higher costs associated with benefit programs offered by the Company, including significant increases in medical insurance premiums and pension related costs.
Medical insurance premiums totaled approximately $9,900,000 for the plan year that ended December 31, 2010, an increase of 5.2 percent over the plan year ended December 31, 2009, and 21.2 percent higher than the plan year ended December 31, 2008. The Company typically absorbs 78 to 80 percent of the cost, with employees contributing the remainder. Premium cost is currently projected to be 5.7 percent higher in the 2011 calendar year, exceeding a level of $10,450,000. Management continues to evaluate health care reform legislation (the Federal Patient Protection and Affordable Care Act, enacted March 2010) and its potential effects upon the Company, as the U.S. Health and Human Services Department and other Federal agencies release their regulations.
Net periodic pension cost was $3,025,000, $2,818,000 and $1,814,000 respectively, in Fiscal Years 2011, 2010 and 2009. The higher costs in Fiscal Years 2011 and 2010 are primarily the result of market losses experienced in Fiscal Year 2009, which lowered the fair value of plan assets at the end of Fiscal Year 2009 to $19,744,000 from $26,213,000 at the end of the previous year. Settlement losses of $256,000 and $238,000 respectively, were included in the net periodic pension costs for Fiscal Years 2010 and 2009. No settlement losses were incurred in Fiscal Year 2011. Settlement losses are triggered when the sum of all settlements (lump sum cash outs) exceed interest and service cost, which occurred in Fiscal Years 2010 and 2009 in the pension plan that covers hourly restaurant employees.
The expected long-term rate of return on plan assets used to compute pension cost was 7.50 percent in Fiscal Year 2011, which was lowered from 8.00 percent in Fiscal Years 2010 and 2009. The assumption will remain at 7.50 percent for the determination of pension costs for Fiscal Year 2012. Net periodic pension cost increases by approximately $50,000 for each decrease of 25 basis points in the expected return assumption. The discount rate used in the actuarial assumptions to compute pension costs was 5.50 percent in Fiscal Year 2011, which was lowered from 6.50 percent in Fiscal Years 2010 and 2009. The rate for Fiscal Year 2012 will be lowered to 5.25 percent. Net periodic pension cost will increase by approximately $125,000 for each decrease of 25 basis points in the discount rate. The rate of compensation increase used to calculate pension costs was 4.0 percent in Fiscal Years 2011 and 2010, which was lowered from 4.5 percent in Fiscal Year 2009. It will remain at 4.0 percent for Fiscal Year 2012. Net periodic pension cost for Fiscal Year 2012 is currently estimated at approximately $2,754,000, which includes a benefit in excess of $550,000 from changes in assumptions relating to retirement, termination and marriage.
Contributions made to Company sponsored plans were $1,600,000, $1,625,000 and $1,000,000 respectively, in Fiscal Years 2011, 2010 and 2009. Contributions for Fiscal Year 2012 are currently anticipated to be at least $1,600,000. Future funding of the pension plans largely depends upon the performance of investments that are held in trusts that have been established for the plans. Equity securities comprise 70 percent of the target allocation of the plans’ assets. The fair value of all plan assets was $27,906,000, $23,030,000 and $19,744,000 respectively at the end of Fiscal Years 2011, 2010 and 2009. Notwithstanding market rebounds in both Fiscal Years 2011 and 2010, the market declines experienced in Fiscal Year 2009 are likely to take several years from which to fully recover. As a result, future funding and net periodic pension costs will remain much higher than historical levels for years to come.
Pension accounting standards require the overfunded or underfunded status of defined benefit pension plans to be recognized as an asset or liability in the Company’s consolidated balance sheet. Funded status is measured as the difference between plan assets at fair value and projected benefit obligations (PBO), which includes a projection of future salary increases. Underfunded status at May 31, 2011 was $8,946,000, an improvement from $10,748,000 at June 1, 2010. The improvement was primarily the result of the increase in the fair value of the plans’ assets. However, it should be noted that the PBO received the benefit from changes in assumptions (retirement, termination
25
Table of Contents
and marriage) approximating $2,750,000, which was offset by approximately $950,000 from lowering the discount rate from 5.50 percent to 5.25 percent.
A $1,538,000 increase in the Company’s equity, net of tax, was required at May 31, 2011 to establish underfunded status at $8,946,000. The increase in equity was effected through a credit to accumulated other comprehensive loss. Equity was reduced $1,917,000, net of tax, to establish underfunded status of $10,748,000 at June 1, 2010, effected through a charge against accumulated other comprehensive loss.
The Hourly Pension Plan (Plan) was amended on July 1, 2009 to freeze all future accruals for credited service under the Plan after August 31, 2009. The Plan had previously been closed to all hourly paid restaurant employees hired after December 31, 1998. The Salaried Pension Plan was amended on July 1, 2009 to close admission to salaried employees hired after June 30, 2009. Salaried employees hired before June 30, 2009 continue to participate in the Salaried Pension Plan and receive credit with normal benefits for years of service.
The Company self-insures a significant portion of expected losses from its Ohio workers’ compensation program. Initial self-insurance reserves are accrued based on prior claims history, including an amount developed for incurred but unreported claims. Active management of claims, which includes a requirement for post accident drug testing, keeps the number of claims and the average cost per claim to a minimum.
Payroll and related costs are also affected when management performs a comprehensive review each quarter of the Ohio workers’ compensation program and adjusts its reserves as deemed necessary based on claims experience. The reserves were increased (charged against earnings) by $174,000 and $536,000 respectively, during Fiscal Year 2011 and Fiscal Year 2010. The reserves were decreased (credited to earnings) by $68,000 in Fiscal Year 2009.
Other operating costs include occupancy costs such as maintenance, rent, depreciation, property tax, insurance and utilities, plus costs relating to field supervision, accounting and payroll preparation costs, franchise fees for Golden Corral restaurants, new restaurant opening costs, and many other restaurant operating costs. Opening costs can have a significant effect on the operating costs for the applicable period. Opening costs (all for Big Boy – no Golden Corral restaurants have been opened during the last three fiscal years) in Fiscal Years 2011, 2010 and 2009 were $1,073,000, $768,000, and $585,000 respectively. As most of the other typical expenses charged to other operating costs tend to be more fixed in nature, the percentages shown in the above table can be greatly affected by changes in same store sales levels. In other words, percentages rise when sales decrease and percentages will decrease when sales increase. Other operating costs in Fiscal Year 2009 included a charge of $334,000 to write down the carrying value of a Big Boy restaurant that permanently ceased operations on May 31, 2009. Other operating costs for the Golden Corral segment are a much higher percentage of sales than Big Boy because the physical facility of a Golden Corral restaurant is roughly twice as large as a Big Boy restaurant and Golden Corral sales volumes have generally remained well below management’s original long-term expectations.
Operating Profit
To arrive at the measure of operating profit, administrative and advertising expense is subtracted from gross profit, while the line item for franchise fees and other revenue is added to it. Gains and losses from the sale of real property (if any) are then respectively added or subtracted. Charges for impairment of assets (if any) are also subtracted from gross profit to arrive at the measure of operating profit. Operating profit in Fiscal Year 2009 included certain amounts (discussed below) credited to earnings in connection with the settlement of a long-standing legal matter.
Administrative and advertising expense was $15,872,000, $15,128,000 and $14,638,000 respectively in Fiscal Years 2011, 2010 and 2009. Advertising expense represents the largest component of these costs. Advertising expense was $7,541,000, $7,049,000, and $6,984,000 respectively in Fiscal Years 2011, 2010 and 2009. Spending for advertising and marketing programs is proportionate to sales levels, reflecting the Company’s long-standing policy to spend a constant percentage of Big Boy and Golden Corral sales on advertising and marketing. On January 1, 2010, Golden Corral advertising fees were increased from 2.0 percent to 2.4 percent of sales, allowing additional national media buying by Golden Corral Franchising Systems, Inc., which effectively expanded cable television spots in all the Company’s market areas. All other administrative costs were $8,330,000, $8,079,000 and $7,654,000 respectively in Fiscal Years 2011, 2010 and 2009. The Chief Executive Officer’s incentive compensation was included in other administrative costs as follows: $265,000, $511,000 and $497,000 respectively was accrued in Fiscal Years 2011, 2010 and 2009. Stock based compensation costs included in other administrative costs were $421,000, $356,000 and $249,000 respectively in Fiscal Years 2011, 2010 and 2009. Fiscal Year 2011
26
Table of Contents
included a charge in other administrative costs of $135,000 to write-off deposits for Golden Corral development rights.
Revenue from franchise fees is based upon sales volumes generated by Big Boy restaurants that are licensed to other operators. The fees are based principally on percentages of sales and are recorded on the accrual method as earned. As of May 31, 2011, 25 Big Boy restaurants were licensed to other operators and paying franchise fees to the Company. No new licensed Big Boy restaurants opened during any of the periods presented in this MD&A; one closed during Fiscal Year 2010 and two closed during Fiscal Year 2009. Other revenue also includes certain other fees earned from restaurants licensed to others along with minimal amounts of rent and investment income.
Gains and losses from the sale of assets consist of transactions involving real property and sometimes may include restaurant equipment that is sold together with real property as a package when closed restaurants are sold. Gains and losses reported on this line do not include abandonment losses that routinely arise when certain equipment is replaced before it reaches the end of its expected life; abandonment losses are instead reported in other operating costs.
Losses from sales involving real property in Fiscal Year 2011 amounted to $40,000, primarily the result of the March 2011 sale of certain surplus property. Total sale proceeds in Fiscal Year 2011 were $386,000. No sales of real property occurred during Fiscal Year 2010. Gains from sales involving real property in Fiscal Year 2009 amounted to $1,163,000 on aggregate proceeds of $1,750,000. The gains in Fiscal Year 2009 are primarily attributable to the disposition of a Big Boy restaurant that had ceased operations in June 2008, the gain from which was $1,072,000 on proceeds of $1,487,000.
During Fiscal Year 2009, the Company received $640,000 in full and final settlement of the arbitration award in the long-standing case by the Company against the general contractor that had constructed a Golden Corral restaurant in Canton, Ohio in 2001, which the Company had to subsequently demolish due to defective construction. In addition to the cash received, an additional credit to earnings of $250,000 was recorded to reverse a liability representing the general contractor’s claim against the Company for the outstanding contract balance, which was eliminated when the arbitration award was made final.
No significant charges for impairment of assets were recorded during Fiscal Years 2011, 2010 or 2009.
Interest Expense
Interest expense was $1,582,000, $1,749,000 and $2,000,000 respectively, in Fiscal Years 2011, 2010 and 2009. The decreasing trend is primarily the result of lower debt levels. In addition, the weighted average interest rate on fixed rate financing has moved lower reflecting the retirement of older fixed rate loans that had higher interest rates.
Income Taxes
Income tax expense as a percentage of pre-tax earnings was 28.2 percent in Fiscal Year 2011, 32.0 percent in Fiscal Year 2010 and 28.2 percent in Fiscal Year 2009. The effective rates have been kept consistently low through the Company’s use of available tax credits, principally the Federal credit allowed for Employer Social Security and Medicare Taxes Paid on Certain Employee Tips and the Federal Work Opportunity Tax Credit (WOTC). These credits are generally more favorable to the effective tax rate when pretax earnings decrease.
The Company believes it has no uncertain tax positions that have been filed or that are expected to be taken on a future tax return. The Internal Revenue Service completed its examination of the Company’s tax return for Fiscal Year 2009 in November 2010. The examination resulted in no changes.
LIQUIDITY AND CAPITAL RESOURCES
Sources of Funds
Food sales to restaurant customers provide the Company’s principal source of cash. The funds from sales are immediately available for the Company’s use, as substantially all sales to restaurant customers are received in currency or are settled by debit or credit cards. The primary source of cash provided by operating activities is net earnings plus depreciation and impairment of assets, if any. Other sources of cash may include borrowing against credit lines, proceeds received when stock options are exercised and occasional sales of real estate. In addition to
27
Table of Contents
servicing debt, these cash flows are utilized for discretionary objectives, including capital projects (principally restaurant expansion), capital stock repurchases and dividends.
Working Capital Practices
The Company has historically maintained a strategic negative working capital position, which is a common practice in the restaurant industry. As significant cash flows are consistently provided by operations and credit lines remain readily available, this practice should not hinder the Company’s ability to satisfactorily retire any of its obligations when due, including the aggregated contractual obligations and commercial commitments shown in the following table.
Aggregated Information about Contractual Obligations and Commercial Commitments
As of May 31, 2011
| Payments due by period (in thousands) |
more | |||||||||||||||||||||||||||||
| than 5 | ||||||||||||||||||||||||||||||
| Total |
year 1 |
year 2 |
year 3 |
year 4 |
year 5 |
years |
||||||||||||||||||||||||
| Long-Term Debt |
$ | 30,326 | $ | 7,754 | $ | 6,848 | $ | 5,118 | $ | 3,943 | $ | 3,031 | $3,632 | |||||||||||||||||
| Interest on Long-Term Debt (estimated) |
3,711 | 1,333 | 958 | 643 | 399 | 222 | 156 | |||||||||||||||||||||||
| Rent due under Capital Lease Obligations |
2,789 | 374 | 259 | 245 | 245 | 245 | 1,421 | |||||||||||||||||||||||
| 1. |
Rent due under Operating Leases |
20,691 | 1,721 | 1,582 | 1,601 | 1,495 | 1,406 | 12,886 | ||||||||||||||||||||||
| 2. |
Purchase Obligations |
19,040 | 13,639 | 4,883 | 351 | 155 | 12 | - | ||||||||||||||||||||||
| 3. |
Other Long-Term Obligations |
859 | 231 | 233 | 236 | 159 | - | - | ||||||||||||||||||||||
| Total Contractual Cash Obligations |
$ | 77,416 | $ | 25,052 | $ | 14,763 | $ | 8,194 | $ | 6,396 | $ | 4,916 | $ | 18,095 | ||||||||||||||||
| 1. |
Operating leases may include option periods yet to be exercised, when exercise is determined to be reasonably assured. |
|||||||||||||||||||||||||||||
| 2. |
Primarily consists of commitments for certain food and beverage items, plus capital projects including commitments to purchase real property (if any). Does not include agreements that are cancellable without penalty. |
|||||||||||||||||||||||||||||
| 3. |
Deferred compensation liability (undiscounted). |
|||||||||||||||||||||||||||||
The working capital deficit was $14,240,000 as of May 31, 2011. The deficit was $18,661,000 as of June 1, 2010. Most of the improvement is attributable to a higher level of cash on hand as of May 31, 2011, and higher prepaid and refundable income taxes.
The Company has had a financing package of unsecured credit facilities in place for many years with the same lending institution. The financing package was amended and restated in October 2010 (2010 Loan Agreement). The 2010 Loan Agreement increased the amount available to be borrowed on the Construction Loan to $15,000,000, up $14,000,000 from the $1,000,000 that had remained available from the previous renewal cycle. As of May 31, 2011, $10,500,000 remained available to be borrowed.
The 2010 Loan Agreement also renewed the $5,000,000 Revolving Loan, which provides financing to fund temporary working capital if needed (unused as of May 31, 2011). In addition, the 2010 Loan Agreement provides a new $10,000,000 Stock Repurchase Loan, under which $9,000,000 remained available to be borrowed as of May 31, 2011.
All remaining funds available under the 2010 Loan Agreement are readily accessible for borrowing through April 2012. The Company expects to encounter no difficulties in extending the 2010 Loan Agreement prior to its scheduled expiration in April 2012.
The Company is in compliance with the covenants contained in the 2010 Loan Agreement.
28
Table of Contents
Operating Activities
Operating cash flows were $29,347,000 in Fiscal Year 2011, which compares with $26,627,000 in Fiscal Year 2009 and $22,408,000 Fiscal Year 2009. These changes are usually attributable to normal changes in assets and liabilities such as prepaid expenses, inventories and accounts payable and accrued, prepaid and deferred income taxes, all of which can and often do fluctuate widely from year to year.
The Small Business Jobs Act of 2010, Federal legislation that was signed into law in September 2010, extended bonus depreciation through December 31, 2010, which had previously expired December 31, 2009. The Tax Relief, Unemployment Insurance Reauthorization and Job Creation Act of 2010, Federal legislation that was signed into law in December 2010, extended bonus depreciation through December 31, 2011. The combined effect of the two pieces of legislation allows the Company to immediately write-off 50 percent of the cost of certain capital expenditures made between January 1, 2010 and September 7, 2010, and 100 percent of certain capital spending costs from September 8, 2010 through December 31, 2011. Two automatic Change in Accounting Method applications were filed by the Company with the Internal Revenue Service that affect Fiscal Year 2011. The Change in Accounting Method for depreciation and amortization was filed to segregate certain restaurant building costs to their proper categories (shorter recovery periods) for depreciation purposes. The Change in Accounting Method for incidental repairs and maintenance was filed to allow the immediate deduction of certain repairs and maintenance costs, replacing previous accounting that capitalized these costs.
The bonus depreciation legislation, together with the two automatic Change in Accounting Method applications, allowed the Company to reduce its Fiscal Year 2011 tax deposits by over $4,200,000 compared with Fiscal Year 2010.
Management measures cash flows from the operation of the business by simply adding to net earnings certain non-cash expenses such as depreciation, losses (net of any gains) on dispositions of assets, charges for impairment of long-lived assets (if any), stock based compensation costs and pension costs in excess of plan contributions. The result of this approach is shown as a sub-total in the consolidated statement of cash flows: $27,141,000 in Fiscal Year 2011, $25,819,000 in Fiscal Year 2010 and $24,568,000 in Fiscal Year 2009.
Investing Activities
Capital spending is the principal component of the Company’s investing activities. Capital spending was $19,703,000 during Fiscal Year 2011, which included $17,149,000 for Big Boy restaurants and $2,554,000 for Golden Corral restaurants. These capital expenditures consisted of site acquisitions for expansion, new restaurant construction, ongoing reinvestments in existing restaurants including remodelings, routine equipment replacements and other maintenance capital expenditures.
Proceeds from sales involving real property during Fiscal Year 2011 amounted to $386,000, primarily the result of the March 2011 sale of certain surplus property. No sales of real property occurred in Fiscal Year 2010. Sales involving real property in Fiscal Year 2009 yielded proceeds of $1,750,000, primarily the result of selling a Big Boy restaurant that had ceased operations in June 2008 to make room for redevelopment. Total proceeds from disposition of property as shown on the consolidated statement of cash flows include amounts received from completely separate transactions to sell used equipment and/or other operating assets. Two former Big Boy restaurants and seven surplus land locations are currently held for sale at an aggregate asking price of approximately $3,700,000.
Financing Activities
Borrowing against credit lines amounted to $6,500,000 during Fiscal Year 2011, consisting of $5,500,000 borrowed to finance construction and $1,000,000 borrowed specifically to fund repurchases of the Company’s common stock. Scheduled and other payments of long-term debt and capital lease obligations amounted to $7,734,000 during Fiscal Year 2011.
Regular quarterly cash dividends to shareholders amounted to $2,925,000 in Fiscal Year 2011, or $0.58 per share. The dividend per share was $0.51 in Fiscal Year 2010 and $0.48 in Fiscal Year 2009. A $0.15 per share quarterly dividend was declared on June 3, 2011. Its payment on July 8, 2011 was the 202nd consecutive quarterly dividend paid by the Company. The Company currently expects to continue its 51 year practice of paying regular quarterly cash dividends.
29
Table of Contents
During Fiscal Year 2011, options to purchase 68,145 shares of the Company’s common stock were exercised, 61,478 of which were exercised by the President and Chief Executive Officer (CEO). The issuance (or re-issuance from the Company’s treasury) of 68,145 shares of the Company’s common stock yielded proceeds of $737,000.
During Fiscal Year 2011, options to purchase 40,000 shares of the Company’s common stock were granted (June 2010) to executive officers (excluding the CEO) and 3,000 option shares were granted to the CEO (October 2010) pursuant to the terms of his employment agreement. As of May 31, 2011, 461,840 shares granted under the Company’s two stock option plans remained outstanding, including 381,340 fully vested shares at a weighted average price per share of $22.95. The closing price of the Company’s common stock on May 31, 2011 was $21.73.
In lieu of granting an automatic annual option to purchase stock, 12,036 shares of restricted stock were awarded in October 2010 to the six non-employee members (2,006 shares each) of the Board of Directors. The shares were re-issued from the Company’s treasury and will vest in full on the first anniversary date of the grant. Full voting and dividend rights are provided prior to vesting. Vested shares must be held until Board service ends, except that enough shares may be sold to satisfy tax obligations attributable to the grant.
As of May 31, 2011, 511,881 shares of the Company’s common stock remained available for awards under the 2003 Stock Option and Incentive Plan. On June 15, 2011, the CEO was granted an unrestricted stock award of 17,364 shares and a group of executive officers and other key employees was granted an award of 7,078 restricted shares. The total value of the unrestricted shares of stock issued to the CEO is $371,000, for which the Company will record a charge against its pretax earnings in the first quarter (ending September 20, 2011) of Fiscal Year 2012. The restricted shares issued to officers and employees will vest in full on the first anniversary date of the grant. Full voting and dividend rights are provided prior to vesting. Vested shares must be held until employment ends, except that enough shares may be sold to satisfy tax obligations attributable to the grant.
The current stock repurchase program was authorized by the Board of Directors on January 6, 2010, which authorizes the Company to repurchase up to 500,000 shares of its common stock in the open market or through block trades over a two year period that will expire January 6, 2012. Since the inception of the current program, the Company had acquired 269,932 shares at a cost of $5,689,000 through May 31, 2011, of which 223,464 shares were acquired during Fiscal Year 2011 at a cost of $4,680,000. So long as it is warranted by the price per share, the Company intends to continue making periodic repurchases of its common stock over the remaining life of the current authorization.
Other Information
Four new Big Boy restaurants were opened for business in Fiscal Year 2011. Three of the four restaurants were constructed on land that was acquired in fee simple estate during Fiscal Year 2010. The fourth one was built on land that is occupied pursuant to the terms of a capital lease. As of May 31, 2011, two new Big Boy restaurants were under construction, one on land owned in fee simple estate, the other on land leased to the Company. Openings are currently scheduled for July and September 2011. Three other sites owned by the Company are in the pipeline for future construction, including two that were acquired in Fiscal Year 2011. Any other contracts to acquire promising sites for future development are cancellable at the Company’s sole discretion while due diligence is pursued under the inspection period provisions of the respective contracts.
Including land and land improvements, the cost required to build and equip each new Big Boy restaurant currently ranges from $2,500,000 to $3,400,000. The actual cost depends greatly on the price paid for the land and the cost of land improvements, which can vary widely from location to location, and whether the land is purchased or leased. Costs also depend on whether the new restaurant is constructed using plans for the original 2001 building prototype (5,700 square feet with seating for 172 guests) or its smaller adaptation, the 2010 building prototype (5,000 square feet with seating for 148 guests), which is used in smaller trade areas. The 2010 building prototype was used to construct all four Big Boy restaurants that opened during Fiscal Year 2011. The 2001 building prototype is being used to build the two restaurants that were under construction as of May 31, 2011.
Approximately one-fifth of the Big Boy restaurants are routinely renovated or decoratively updated each year. The renovations not only refresh and upgrade interior finishes, but are also designed to synchronize the interiors and exteriors of older restaurants with that of newly constructed restaurants. The current cost to renovate a Big Boy restaurant ranges from $100,000 to $200,000. The Fiscal Year 2012 remodeling budget is $3,320,000. In addition, certain high-volume Big Boy restaurants are regularly evaluated to determine whether their kitchens should be
30
Table of Contents
redesigned for increased efficiencies and whether an expansion of the dining room is warranted. A typical kitchen redesign costs approximately $125,000 and a dining room expansion can cost up to $750,000.
The Fiscal Year 2012 remodeling budget for Golden Corral restaurants is approximately $2,545,000. This includes the carryover cost to complete four restaurants for which work was not completed in the prior year, and three other restaurants that will be remodeled over the winter months. Golden Corral restaurants are remodeled every seven years, but replacement of carpeting occurs every 42 months.
The Company possesses development rights to open up to 12 more Golden Corrals by December 31, 2011. These rights were acquired several years ago when the Company paid $135,000 in initial franchise fees. Because management determined that no further Golden Corral restaurants will be developed, the $135,000 fee balance was written-off during Fiscal Year 2011.
Although part of the Company’s strategic plan entails owning the land on which it builds new restaurants, it is sometimes necessary to enter ground leases to obtain desirable land on which to build. Seven of the 35 Golden Corral restaurants and four Big Boy restaurants that have opened since 2003 were built on leased land. As of May 31, 2011, 22 restaurants were operating on non-owned premises, 21 of which are being accounted for as operating leases with one treated as a capital lease. In addition, an operating lease is in place for land on which construction of a Big Boy restaurant is currently in progress.
APPLICATION OF CRITICAL ACCOUNTING POLICIES
The preparation of financial statements in conformity with accounting principles generally accepted in the United States of America requires management to use estimates and assumptions to measure certain items that affect the amounts reported in the financial statements and accompanying footnotes. These judgments are based on knowledge and experience about past and current events, and assumptions about future events. Accounting estimates can and do change as new events occur and additional information becomes available. Actual results may differ markedly from current judgment.
Two factors are required for an accounting policy to be deemed critical. The policy must be significant to the fair presentation of a company’s financial condition and its results of operations, and the policy must require management’s most difficult, subjective or complex judgments. Management believes the following to be the Company’s critical accounting policies.
Self Insurance
The Company self-insures a significant portion of expected losses from its workers’ compensation program in the state of Ohio. The Company purchases coverage from an insurance company for individual claims in excess of $300,000. Reserves for claims expense include a provision for incurred but not reported claims. Each quarter, management reviews claims valued by the third party administrator (TPA) of the program and then applies experience and judgment to determine the most probable future value of incurred claims. As the TPA submits additional new information, management reviews it in light of historical claims for similar injuries, probability of settlement, and any other facts that might provide guidance in determining ultimate value of individual claims. Unexpected changes in any of these or other factors could result in actual costs differing materially from initial projections or values presently carried in the self-insurance reserves.
Pension Plans
Pension plan accounting requires rate assumptions for future compensation increases and the long-term investment return on plan assets. A discount rate is also applied to the calculations of net periodic pension cost and projected benefit obligations. A committee comprised of executives from the Finance Department and the Human Resources Department, with guidance provided by the Company’s actuarial consulting firm, develops these assumptions each year. The consulting firm also provides services in calculating estimated future obligations and net periodic pension cost.
To determine the long-term rate of return on plan assets, the committee reviews the target asset allocation of plan assets and determines the expected return on each asset class. The expected returns for each asset class are combined and rounded to the nearest 25 basis points to determine the overall expected return on assets. The committee determines the discount rate by looking at the projected future benefit payments by year and matches
31
Table of Contents
them to spot rates based on yields of high-grade corporate bonds over the term of projected benefit payments. A single discount rate is selected, and then rounded to the nearest 25 basis points, which produces the same present value as the various spot rates.
Assets of the pension plans are targeted to be invested 70 percent in equity securities, as these investments have historically provided the greatest long-term returns. Poor performance in equity securities markets can significantly lower the market values of the plans’ investment portfolios, which, in turn, can result in a) material increases in future funding requirements, b) much higher net periodic pension costs to be recognized in future years, and c) the plans reaching underfunded status, requiring the Company’s equity to be reduced.
Long-Lived Assets
Long-lived assets include property and equipment, goodwill and other intangible assets. Property and equipment typically approximates 85 to 90 percent of the Company’s total assets. Judgments and estimates are used to determine the carrying value of long-lived assets. This includes the assignment of appropriate useful lives, which affect depreciation and amortization expense. Capitalization policies are continually monitored to assure they remain appropriate.
Management considers a history of cash flow losses on a restaurant-by-restaurant basis to be the primary indicator of potential impairment. Carrying values of property and equipment are tested for impairment at least annually, and whenever events or circumstances indicate that the carrying value may be impaired. When undiscounted expected future cash flows are less than carrying values, an impairment loss is recognized for the amount by which carrying values exceed the greater of the net present value of the future cash flow stream or a floor value. Future cash flows can be difficult to predict. Changing neighborhood demographics and economic conditions, and many other factors may influence operating performance, which affect cash flows. Floor values are generally determined by opinions of value provided by real estate brokers and/or management’s judgment as developed through its experience in disposing of property.
Sometimes it becomes necessary to cease operating a certain restaurant due to poor operating performance. The ultimate loss can be significantly different from the original impairment charge, particularly if the eventual market price received from the disposition of the property differs materially from initial estimates of floor values.
Acquired goodwill and other intangible assets are tested for impairment annually or whenever an impairment indicator arises.
Item 7A. Quantitative and Qualitative Disclosures about Market Risk
The Company has no significant market risk exposure to interest rate changes as substantially all of its debt is currently financed with fixed interest rates, or will be converted to fixed rate term loans in the next six months. The Company does not currently use derivative financial instruments to manage its exposure to changes in interest rates. Any cash equivalents maintained by the Company have original maturities of three months or less. The Company does not use any foreign currency in its operations.
Operations in the Big Boy segment are vertically integrated, using centralized purchasing and food preparation, provided through the Company’s commissary and food manufacturing plant. Management believes the commissary operation ensures uniform product quality and safety, timeliness of distribution to restaurants and creates efficiencies that ultimately result in lower food and supply costs. The commissary operation does not supply Golden Corral restaurants.
Commodity pricing affects the cost of many of the Company’s food products. Commodity pricing can be extremely volatile, affected by many factors outside of the Company’s control, including import and export restrictions, the influence of currency markets relative to the U.S. dollar, supply versus demand, production levels and the impact that adverse weather conditions may have on crop yields. Certain commodities purchased by the commissary, principally beef, chicken, pork, dairy products, fish, french fries and coffee, are generally purchased based upon market prices established with vendors. Purchase contracts for some of these items may contain contractual provisions that limit the price to be paid. These contracts are normally for periods of one year or less but may have longer terms if favorable long-term pricing becomes available. Food supplies are generally plentiful and may be obtained from any number of suppliers, which mitigates the Company’s overall commodity cost risk. Quality,
32
Table of Contents
timeliness of deliveries and price are the principal determinants of source. The Company does not use financial instruments as a hedge against changes in commodity pricing.
Except for items such as bread, fresh produce and dairy products that are purchased from any number of reliable local suppliers, the Golden Corral segment of the business currently purchases substantially all food, beverage and other menu items from the same approved vendor that Golden Corral Franchising Systems, Inc. (the Franchisor) uses in its operations. Deliveries are received twice per week. Other vendors are available to provide products that meet the Franchisor’s specifications at comparable prices should the Company wish or need to make a change.
| Item 8. Financial Statements and Supplementary Data | Page | |
| The following financial statements and reports are included in Item 8 of this report: |
||
| Index to Consolidated Financial Statements |
||
| Report of Management on Internal Control over Financial Reporting |
34 | |
| Report of Independent Registered Public Accounting Firm (on Financial Statements) |
35 | |
| 36 | ||
| 37 | ||
| Consolidated Statement of Earnings – Three fiscal years ended May 31, 2011 |
39 | |
| Consolidated Statement of Cash Flows – Three fiscal years ended May 31, 2011 |
40 | |
| Consolidated Statement of Shareholders’ Equity – Three fiscal years ended May 31, 2011 |
41 | |
| Notes to Consolidated Financial Statements – Three fiscal years ended May 31, 2011 |
42 | |
| 70 | ||
33
Table of Contents
REPORT OF MANAGEMENT ON INTERNAL CONTROL OVER FINANCIAL REPORTING
Management of the Company is responsible for establishing and maintaining adequate internal control over the Company’s financial reporting, and for performing an assessment of the effectiveness of internal control over financial reporting as of May 31, 2011. Internal control over financial reporting is a process designed to provide reasonable assurance regarding the reliability of financial reporting and the preparation of financial statements for external purposes in accordance with generally accepted accounting principles. The Company’s system of internal control over financial reporting includes those policies and procedures that (i) pertain to the maintenance of records that, in reasonable detail, accurately and fairly reflect the transactions and dispositions of the assets of the Company; (ii) provide reasonable assurance that transactions are recorded as necessary to permit preparation of financial statements in accordance with generally accepted accounting principles, and that receipts and expenditures of the Company are being made only in accordance with authorizations of management and directors of the Company; and (iii) provide reasonable assurance regarding prevention or timely detection of unauthorized acquisition, use, or disposition of the Company’s assets that could have a material effect on the financial statements.
Management performed an assessment of the effectiveness of the Company’s internal control over financial reporting as of May 31, 2011 based upon criteria in Internal Control – Integrated Framework issued by the Committee of Sponsoring Organizations of the Treadway Commission (COSO). Based on our assessment, management determined that the Company’s internal control over financial reporting was effective as of May 31, 2011 based on the criteria in Internal Control - Integrated Framework issued by the COSO.
The Board of Directors meets its responsibility for oversight of the integrity of the Company’s financial statements through its Audit Committee, which is composed entirely of independent directors, none of whom are employees of the Company and all of whom are financial experts. The Audit Committee meets periodically with management and Internal Audit to review their work and confirm that their respective responsibilities are being properly discharged. In addition, Grant Thornton LLP, the Company’s independent registered public accounting firm, has full access to the Audit Committee to discuss the results of their audit work, the effectiveness of internal accounting controls and the quality of financial reporting.
The Company’s internal control over financial reporting as of May 31, 2011 has been audited by Grant Thornton LLP, as is stated in their report that is presented in these financial statements which appears herein.
| July 26, 2011 |
| Date |
| /s/ Craig F. Maier |
| Craig F. Maier |
| President and Chief Executive Officer |
| /s/ Donald H. Walker |
| Donald H. Walker |
| Vice President and Chief Financial Officer |
34
Table of Contents
REPORT OF INDEPENDENT REGISTERED PUBLIC ACCOUNTING FIRM
Board of Directors and Shareholders
Frisch’s Restaurants, Inc.
We have audited the accompanying consolidated balance sheets of Frisch’s Restaurants, Inc. (an Ohio corporation) and Subsidiaries (the “Company”) as of May 31, 2011 and June 1, 2010, and the related consolidated statements of earnings, shareholders’ equity, and cash flows for each of the three years in the period ended May 31, 2011. These financial statements are the responsibility of the Company’s management. Our responsibility is to express an opinion on these financial statements based on our audits.
We conducted our audits in accordance with the standards of the Public Company Accounting Oversight Board (United States). Those standards require that we plan and perform the audit to obtain reasonable assurance about whether the financial statements are free of material misstatement. An audit includes examining, on a test basis, evidence supporting the amounts and disclosures in the financial statements. An audit also includes assessing the accounting principles used and significant estimates made by management, as well as evaluating the overall financial statement presentation. We believe that our audits provide a reasonable basis for our opinion.
In our opinion, the consolidated financial statements referred to above present fairly, in all material respects, the financial position of Frisch’s Restaurants, Inc. and Subsidiaries as of May 31, 2011 and June 1, 2010, and the results of their operations and their cash flows for each of the three years in the period ended May 31, 2011 in conformity with accounting principles generally accepted in the United States of America.
We have also audited, in accordance with the standards of the Public Company Accounting Oversight Board (United States), the Company’s internal control over financial reporting as of May 31, 2011, based on criteria established in Internal Control-Integrated Framework issued by the Committee of Sponsoring Organizations of the Treadway Commission (COSO) and our report dated July 29, 2011 expressed an unqualified opinion therein.
| GRANT THORNTON LLP |
| /s/ Grant Thornton LLP |
| Cincinnati, Ohio |
| July 29, 2011 |
35
Table of Contents
REPORT OF INDEPENDENT REGISTERED PUBLIC ACCOUNTING FIRM
Board of Directors and Shareholders
Frisch’s Restaurants, Inc.
We have audited Frisch’s Restaurants, Inc.’s (an Ohio Corporation) internal control over financial reporting as of May 31, 2011, based on criteria established in Internal Control – Integrated Framework issued by the Committee of Sponsoring Organizations of the Treadway Commission (COSO). Frisch’s Restaurants, Inc.’s management is responsible for maintaining effective internal control over financial reporting and for its assessment of the effectiveness of internal control over financial reporting, included in the accompanying Report of Management on Internal Control over Financial Reporting. Our responsibility is to express an opinion on Frisch’s Restaurants, Inc.’s internal control over financial reporting based on our audit.
We conducted our audit in accordance with the standards of the Public Company Accounting Oversight Board (United States). Those standards require that we plan and perform the audit to obtain reasonable assurance about whether effective internal control over financial reporting was maintained in all material respects. Our audit included obtaining an understanding of internal control over financial reporting, assessing the risk that a material weakness exists, testing and evaluating the design and operating effectiveness of internal control based on the assessed risk, and performing such other procedures as we considered necessary in the circumstances. We believe that our audit provides a reasonable basis for our opinion.
A company’s internal control over financial reporting is a process designed to provide reasonable assurance regarding the reliability of financial reporting and the preparation of financial statements for external purposes in accordance with generally accepted accounting principles. A company’s internal control over financial reporting includes those policies and procedures that (1) pertain to the maintenance of records that, in reasonable detail, accurately and fairly reflect the transactions and dispositions of the assets of the company; (2) provide reasonable assurance that transactions are recorded as necessary to permit preparation of financial statements in accordance with generally accepted accounting principles, and that receipts and expenditures of the company are being made only in accordance with authorizations of management and directors of the company; and (3) provide reasonable assurance regarding prevention or timely detection of unauthorized acquisition, use, or disposition of the company’s assets that could have a material effect on the financial statements.
Because of its inherent limitations, internal control over financial reporting may not prevent or detect misstatements. Also, projections of any evaluation of effectiveness to future periods are subject to the risk that controls may become inadequate because of changes in conditions, or that the degree of compliance with the policies or procedures may deteriorate.
In our opinion, Frisch’s Restaurants, Inc. maintained, in all material respects, effective internal control over financial reporting as of May 31, 2011, based on criteria established in Internal Control – Integrated Framework issued by COSO.
We also have audited, in accordance with the standards of the Public Company Accounting Oversight Board (United States), the consolidated balance sheets of Frisch’s Restaurants, Inc. and Subsidiaries as of May 31, 2011 and June 1, 2010, and the related consolidated statements of earnings, shareholders’ equity, and cash flows for each of the three years in the period ended May 31, 2011 and our report dated July 29, 2011 expressed an unqualified opinion on those consolidated statements.
| GRANT THORNTON LLP |
| /s/ Grant Thornton LLP |
| Cincinnati, Ohio |
| July 29, 2011 |
36
Table of Contents
FRISCH’S RESTAURANTS, INC. AND SUBSIDIARIES
CONSOLIDATED BALANCE SHEET
May 31, 2011 and June 1, 2010
ASSETS
| 2011 | 2010 | |||||||
| Current Assets |
||||||||
| Cash and equivalents |
$ | 2,449,448 | $ | 647,342 | ||||
| Trade and other receivables |
1,997,428 | 1,533,799 | ||||||
| Inventories |
5,717,264 | 5,958,540 | ||||||
| Prepaid expenses, sundry deposits and other |
1,482,344 | 760,032 | ||||||
| Prepaid and deferred income taxes |
3,213,527 | 1,489,119 | ||||||
| Total current assets |
14,860,011 | 10,388,832 | ||||||
| Property and Equipment |
||||||||
| Land and improvements |
81,402,037 | 77,458,187 | ||||||
| Buildings |
104,968,167 | 101,478,173 | ||||||
| Equipment and fixtures |
101,385,187 | 96,531,395 | ||||||
| Leasehold improvements and buildings on leased land |
24,731,195 | 23,267,910 | ||||||
| Capitalized leases |
2,554,870 | 2,158,899 | ||||||
| Construction in progress |
6,532,591 | 5,855,478 | ||||||
| 321,574,047 | 306,750,042 | |||||||
| Less accumulated depreciation and amortization |
148,651,557 | 138,051,284 | ||||||
| Net property and equipment |
172,922,490 | 168,698,758 | ||||||
| Other Assets |
||||||||
| Goodwill |
740,644 | 740,644 | ||||||
| Other intangible assets |
495,725 | 718,357 | ||||||
| Investments in land |
923,435 | 923,435 | ||||||
| Property held for sale |
2,921,818 | 2,758,998 | ||||||
| Deferred income taxes |
- | 3,162,703 | ||||||
| Other |
2,409,612 | 1,860,919 | ||||||
| Total other assets |
7,491,234 | 10,165,056 | ||||||
| Total assets |
$ | 195,273,735 | $ | 189,252,646 | ||||
The accompanying notes are an integral part of the consolidated financial statements.
37
Table of Contents
FRISCH’S RESTAURANTS, INC. AND SUBSIDIARIES
CONSOLIDATED BALANCE SHEET
May 31, 2011 and June 1, 2010
LIABILITIES AND SHAREHOLDERS’ EQUITY
| 2011 | 2010 | |||||||
| Current Liabilities |
||||||||
| Long-term obligations due within one year |
||||||||
| Long-term debt |
$ | 7,753,562 | $ | 8,026,816 | ||||
| Obligations under capitalized leases |
266,358 | 240,893 | ||||||
| Self insurance |
778,181 | 528,220 | ||||||
| Accounts payable |
10,216,467 | 10,557,636 | ||||||
| Accrued expenses |
10,083,229 | 9,641,305 | ||||||
| Income taxes |
1,862 | 54,972 | ||||||
| Total current liabilities |
29,099,659 | 29,049,842 | ||||||
| Long-Term Obligations |
||||||||
| Long-term debt |
22,572,677 | 23,285,995 | ||||||
| Obligations under capitalized leases |
1,677,230 | 994,151 | ||||||
| Self insurance |
1,127,615 | 1,040,778 | ||||||
| Deferred income taxes |
1,966,819 | - | ||||||
| Underfunded pension obligation |
8,912,781 | 10,747,629 | ||||||
| Deferred compensation and other |
4,389,062 | 4,040,235 | ||||||
| Total long-term obligations |
40,646,184 | 40,108,788 | ||||||
| Commitments |
||||||||
| Shareholders’ Equity |
||||||||
| Capital stock |
||||||||
| Preferred stock - authorized, 3,000,000 shares without par value; none issued |
- | - | ||||||
| Common stock - authorized, 12,000,000 shareswithout par value; issued 7,586,764 and 7,585,764 shares - stated value - $1 |
7,586,764 | 7,585,764 | ||||||
| Additional contributed capital |
65,535,634 | 65,222,878 | ||||||
| 73,122,398 | 72,808,642 | |||||||
| Accumulated other comprehensive loss |
(5,726,555) | (7,856,427) | ||||||
| Retained earnings |
96,249,483 | 89,701,652 | ||||||
| 90,522,928 | 81,845,225 | |||||||
| Less cost of treasury stock (2,666,956 and 2,525,174 shares) |
(38,117,434) | (34,559,851) | ||||||
| Total shareholders’ equity |
125,527,892 | 120,094,016 | ||||||
| Total liabilities and shareholders’ equity |
$ | 195,273,735 | $ | 189,252,646 | ||||
38
Table of Contents
FRISCH’S RESTAURANTS, INC. AND SUBSIDIARIES
CONSOLIDATED STATEMENT OF EARNINGS
Three years ended May 31, 2011
| 2011 | 2010 | 2009 | ||||||||||
| Sales |
$ | 303,540,552 | $ | 292,872,174 | $ | 297,860,951 | ||||||
| Cost of sales |
||||||||||||
| Food and paper |
105,483,656 | 99,651,072 | 105,859,982 | |||||||||
| Payroll and related |
101,067,336 | 97,918,797 | 97,678,114 | |||||||||
| Other operating costs |
67,630,437 | 64,987,881 | 66,082,244 | |||||||||
| 274,181,429 | 262,557,750 | 269,620,340 | ||||||||||
| Gross profit |
29,359,123 | 30,314,424 | 28,240,611 | |||||||||
| Administrative and advertising |
15,871,599 | 15,127,522 | 14,637,943 | |||||||||
| Franchise fees and other revenue |
(1,324,362) | (1,266,368) | (1,281,940) | |||||||||
| Loss (gain) on sale of assets |
40,354 | - | (1,163,173) | |||||||||
| Litigation settlement |
- | - | (889,579) | |||||||||
| Operating profit |
14,771,532 | 16,453,270 | 16,937,360 | |||||||||
| Interest expense |
1,582,205 | 1,748,542 | 2,000,442 | |||||||||
| Earnings before income taxes |
13,189,327 | 14,704,728 | 14,936,918 | |||||||||
| Income taxes |
||||||||||||
| Current |
||||||||||||
| Federal |
1,591,589 | 6,035,179 | 4,626,721 | |||||||||
| Less tax credits |
(1,051,185) | (951,592) | (1,010,762) | |||||||||
| State and municipal |
350,078 | 579,963 | 406,403 | |||||||||
| Deferred |
2,826,256 | (957,753) | 193,701 | |||||||||
| Total income taxes |
3,716,738 | 4,705,797 | 4,216,063 | |||||||||
| NET EARNINGS |
$ | 9,472,589 | $ | 9,998,931 | $ | 10,720,855 | ||||||
| Earnings per share (EPS) of common stock: |
||||||||||||
| Basic net earnings per share |
$ 1.88 | $ 1.96 | $ 2.10 | |||||||||
| Diluted net earnings per share |
$ 1.87 | $ 1.93 | $ 2.08 | |||||||||
All three fiscal years contained 52 weeks consisting of 364 days.
The accompanying notes are an integral part of the consolidated financial statements.
39
Table of Contents
FRISCH’S RESTAURANTS, INC. AND SUBSIDIARIES
CONSOLIDATED STATEMENT OF CASH FLOWS
Three years ended May 31, 2011
| 2011 | 2010 | 2009 | ||||||||||
| Cash flows provided by (used in) operating activities: |
||||||||||||
| Net earnings |
$ | 9,472,589 | $ | 9,998,931 | $ | 10,720,855 | ||||||
| Adjustments to reconcile net earnings to net cash from operating activities: |
||||||||||||
| Depreciation and amortization |
15,563,320 | 14,085,261 | 13,690,689 | |||||||||
| Loss (gain) on disposition of assets, including abandonment losses |
258,651 | 186,255 | (906,803) | |||||||||
| Stock-based compensation expense |
420,922 | 355,561 | 248,869 | |||||||||
| Net periodic pension cost |
3,025,143 | 2,818,009 | 1,814,440 | |||||||||
| Contributions to pension plans |
(1,600,000) | (1,625,000) | (1,000,000) | |||||||||
| 27,140,625 | 25,819,017 | 24,568,050 | ||||||||||
| Changes in assets and liabilities: |
||||||||||||
| Trade and other receivables |
(463,629) | 15,427 | (100,841) | |||||||||
| Inventories |
241,276 | 54,466 | (883,498) | |||||||||
| Prepaid expenses and sundry deposits |
(722,312) | 131,144 | 229,184 | |||||||||
| Other assets |
143,004 | 70,374 | 169,729 | |||||||||
| Prepaid and deferred income taxes |
2,307,907 | (770,696) | 223,735 | |||||||||
| Accrued income taxes |
170,186 | 19,549 | (171,358) | |||||||||
| Excess tax benefit from stock-based compensation |
(223,296) | (6,144) | (11,760) | |||||||||
| Accounts payable |
(341,168) | 2,519,218 | (2,242,598) | |||||||||
| Accrued expenses |
441,924 | (1,913,723) | 884,295 | |||||||||
| Self insured obligations |
336,798 | 445,000 | (252,753) | |||||||||
| Deferred compensation and other liabilities |
315,915 | 242,920 | (3,853) | |||||||||
| 2,206,605 | 807,535 | (2,159,718) | ||||||||||
| Net cash provided by operating activities |
29,347,230 | 26,626,552 | 22,408,332 | |||||||||
| Cash flows (used in) provided by investing activities: |
||||||||||||
| Additions to property and equipment |
(19,703,394) | (24,484,342) | (18,034,851) | |||||||||
| Proceeds from disposition of property |
422,576 | 30,701 | 1,769,837 | |||||||||
| Change in other assets |
(440,588) | (392,208) | 182,202 | |||||||||
| Net cash (used in) investing activities |
(19,721,406) | (24,845,849) | (16,082,812) | |||||||||
| Cash flows (used in) provided by financing activities: |
||||||||||||
| Proceeds from borrowings |
6,500,000 | 10,000,000 | 6,000,000 | |||||||||
| Payment of long-term debt and capital lease obligations |
(7,734,211) | (8,616,525) | (9,562,519) | |||||||||
| Cash dividends paid |
(2,924,758) | (2,603,767) | (2,449,347) | |||||||||
| Proceeds from stock options exercised - new shares issued |
10,375 | 83,866 | 31,461 | |||||||||
| Proceeds from stock options exercised - treasury shares re-issued |
726,257 | 10,060 | 8,310 | |||||||||
| Other treasury shares re-issued |
50,546 | 74,773 | 8,184 | |||||||||
| Treasury shares acquired |
(4,680,224) | (1,009,010) | (256,472) | |||||||||
| Excess tax benefit from stock based compensation |
223,296 | 6,144 | 11,760 | |||||||||
| Employee stock purchase plan |
5,001 | 22,319 | (19,415) | |||||||||
| Net cash (used in) financing activities |
(7,823,718) | (2,032,140) | (6,228,038) | |||||||||
| Net increase (decrease) in cash and equivalents |
1,802,106 | (251,437) | 97,482 | |||||||||
| Cash and equivalents at beginning of year |
647,342 | 898,779 | 801,297 | |||||||||
|
Cash and equivalents at end of year |
$ |
2,449,448 |
|
$ |
647,342 |
|
$ |
898,779 |
| |||
| Supplemental disclosures: |
||||||||||||
| Interest paid |
$ | 1,560,703 | $ | 1,839,073 | $ | 2,058,560 | ||||||
| Income taxes paid |
1,241,221 | 5,514,145 | 4,163,785 | |||||||||
| Income taxes refunded |
2,576 | 57,201 | 100 | |||||||||
| Litigation settlement received |
- | - | 639,856 | |||||||||
| Lease transactions capitalized (non-cash) |
996,844 | 825,000 | - | |||||||||
The accompanying notes are an integral part of the consolidated financial statements.
40
Table of Contents
FRISCH’S RESTAURANTS, INC. AND SUBSIDIARIES
CONSOLIDATED STATEMENT OF SHAREHOLDERS’ EQUITY
Three years ended May 31, 2011
| Common stock at $1 per share - Shares and amount |
Additional contributed capital |
Accumulated other comprehensive loss |
Retained earnings |
Treasury shares |
Total | |||||||||||||||||||
|
|
|
|||||||||||||||||||||||
| Balance at June 3, 2008 |
$ | 7,580,263 | $ | 64,451,899 | $ | (1,992,515 | ) | $ | 74,034,980 | $ | (33,359,781 | ) | $ | 110,714,846 | ||||||||||
| Net earnings for the year |
- | - | - | 10,720,855 | - | 10,720,855 | ||||||||||||||||||
| Other comprehensive loss, net of tax |
- | - | (4,641,907 | ) | - | - | (4,641,907) | |||||||||||||||||
| Stock options exercised - new shares issued |
2,084 | 29,377 | - | - | - | 31,461 | ||||||||||||||||||
| Stock options exercised - treasury shares re-issued |
- | (5,210 | ) | - | - | 13,520 | 8,310 | |||||||||||||||||
| Excess tax benefit from stock-based compensation |
- | 11,760 | - | - | - | 11,760 | ||||||||||||||||||
| Compensation cost - stock options |
- | 248,869 | - | - | - | 248,869 | ||||||||||||||||||
| Other treasury shares re-issued |
- | 4,048 | - | - | 4,136 | 8,184 | ||||||||||||||||||
| Treasury shares acquired |
- | - | - | - | (256,472 | ) | (256,472) | |||||||||||||||||
| Employee stock purchase plan |
- | (19,415 | ) | - | - | - | (19,415) | |||||||||||||||||
| Cash dividends paid - $.48 per share |
- | - | - | (2,449,347 | ) | - | (2,449,347) | |||||||||||||||||
|
|
|
|||||||||||||||||||||||
| Balance at June 2, 2009 |
7,582,347 | 64,721,328 | (6,634,422 | ) | 82,306,488 | (33,598,597 | ) | 114,377,144 | ||||||||||||||||
| Net earnings for the year |
- | - | - | 9,998,931 | - | 9,998,931 | ||||||||||||||||||
| Other comprehensive loss, net of tax |
- | - | (1,222,005 | ) | - | - | (1,222,005) | |||||||||||||||||
| Stock options exercised - new shares issued |
3,417 | 80,449 | - | - | - | 83,866 | ||||||||||||||||||
| Stock options exercised - treasury shares re-issued |
- | (3,480 | ) | - | - | 13,540 | 10,060 | |||||||||||||||||
| Excess tax benefit from stock-based compensation |
- | 6,144 | - | - | - | 6,144 | ||||||||||||||||||
| Compensation cost - stock options |
- | 355,561 | - | - | - | 355,561 | ||||||||||||||||||
| Other treasury shares re-issued |
- | 40,557 | - | - | 34,216 | 74,773 | ||||||||||||||||||
| Treasury shares acquired |
- | - | - | - | (1,009,010 | ) | (1,009,010) | |||||||||||||||||
| Employee stock purchase plan |
- | 22,319 | - | - | - | 22,319 | ||||||||||||||||||
| Cash dividends paid - $.51 per share |
- | - | - | (2,603,767 | ) | - | (2,603,767) | |||||||||||||||||
|
|
|
|||||||||||||||||||||||
| Balance at June 1, 2010 |
7,585,764 | 65,222,878 | (7,856,427 | ) | 89,701,652 | (34,559,851 | ) | 120,094,016 | ||||||||||||||||
| Net earnings for the year |
- | - | - | 9,472,589 | - | 9,472,589 | ||||||||||||||||||
| Other comprehensive income, net of tax |
- | - | 2,129,872 | - | - | 2,129,872 | ||||||||||||||||||
| Stock options exercised - new shares issued |
1,000 | 9,375 | - | - | - | 10,375 | ||||||||||||||||||
| Stock options exercised - treasury shares re-issued |
- | (195,809 | ) | - | - | 922,066 | 726,257 | |||||||||||||||||
| Issuance of restricted stock - treasury shares re-issued |
- | (166,338 | ) | - | - | 166,338 | - | |||||||||||||||||
| Excess tax benefit from stock-based compensation |
- | 223,296 | - | - | - | 223,296 | ||||||||||||||||||
| Compensation cost - stock options |
- | 273,231 | - | - | - | 273,231 | ||||||||||||||||||
| Compensation cost - restricted stock |
- | 147,691 | - | - | - | 147,691 | ||||||||||||||||||
| Other treasury shares re-issued |
- | 16,309 | - | - | 34,237 | 50,546 | ||||||||||||||||||
| Treasury shares acquired |
- | - | - | - | (4,680,224 | ) | (4,680,224) | |||||||||||||||||
| Employee stock purchase plan |
- | 5,001 | - | - | - | 5,001 | ||||||||||||||||||
| Cash dividends paid - $.58 per share |
- | - | - | (2,924,758 | ) | - | (2,924,758) | |||||||||||||||||
|
|
|
|||||||||||||||||||||||
| Balance at May 31, 2011 |
$ | 7,586,764 | $ | 65,535,634 | $ (5,726,555 | ) | $ | 96,249,483 | $ | (38,117,434 | ) | $ | 125,527,892 | |||||||||||
|
|
|
|||||||||||||||||||||||
| Comprehensive income: |
May 31, 2011 | June 1, 2010 | June 2, 2009 | |||||||||||||||||||||
|
|
|
|||||||||||||||||||||||
| Net earnings for the year |
$ | 9,472,589 | $ | 9,998,931 | $ | 10,720,855 | ||||||||||||||||||
| Change in defined benefit pension plans, net of tax of $1,097,207 |
|
2,129,872 | - | - | ||||||||||||||||||||
| Change in defined benefit pension plans, net of tax of $629,517 |
|
- | (1,222,005 | ) | - | |||||||||||||||||||
| Change in defined benefit pension plans, net of tax of $2,391,286 |
|
- | - | (4,641,907) | ||||||||||||||||||||
|
|
|
|||||||||||||||||||||||
| Comprehensive income |
$ | 11,602,461 | $ | 8,776,926 | $ | 6,078,948 | ||||||||||||||||||
|
|
|
|||||||||||||||||||||||
| The accompanying notes are an integral part of the consolidated financial statements. | ||||||||||||||||||||||||
41
Table of Contents
Frisch’s Restaurants, Inc. and Subsidiaries
NOTES TO CONSOLIDATED FINANCIAL STATEMENTS
Three years ended May 31, 2011
NOTE A – ACCOUNTING POLICIES
A summary of the Company’s significant accounting policies consistently applied in the preparation of the accompanying consolidated financial statements follows:
Description of the Business
Frisch’s Restaurants, Inc. and Subsidiaries (Company) is a regional company that operates full service family-style restaurants under the name “Frisch’s Big Boy.” The Company also operates grill buffet style restaurants under the name “Golden Corral” pursuant to certain licensing agreements. All 95 Big Boy restaurants operated by the Company as of May 31, 2011 are located in various regions of Ohio, Kentucky and Indiana. All 35 Golden Corral restaurants operated by the Company as of May 31, 2011 are located primarily in the greater metropolitan areas of Cincinnati, Columbus, Dayton, Toledo and Cleveland, Ohio, Louisville, Kentucky and Pittsburgh, Pennsylvania.
The Company owns the trademark “Frisch’s” and has exclusive, irrevocable ownership of the rights to the “Big Boy” trademark, trade name and service marks in the states of Kentucky and Indiana, and in most of Ohio and Tennessee. All of the Frisch’s Big Boy restaurants also offer “drive-thru” service. The Company also licenses 25 Big Boy restaurants to other operators, which are located in certain parts of Ohio, Kentucky and Indiana. In addition, the Company operates a commissary and food manufacturing plant near its headquarters in Cincinnati, Ohio that services all Big Boy restaurants operated by the Company, and is available to supply restaurants licensed to others.
Consolidation Practices
The accompanying consolidated financial statements include the accounts of Frisch’s Restaurants, Inc. and all of its subsidiaries, prepared in conformity with generally accepted accounting principles in the United States of America (US GAAP). Significant inter-company accounts and transactions have been eliminated in consolidation.
Reclassification
Certain amounts reported in prior years have been reclassified to conform to the current year presentation.
Fiscal Year
The Company’s fiscal year is the 52 week (364 days) or 53 week (371 days) period ending on the Tuesday nearest to the last day of May. Each of the three years in the period ended May 31, 2011 consisted of 52 weeks. The years ended respectively on May 31, 2011 (fiscal year 2011), June 1, 2010 (fiscal year 2010) and June 2, 2009 (fiscal year 2009). The fiscal year that will end on Tuesday, May 29, 2012 (fiscal year 2012) will also be a 52 week (364 days) period.
The first quarter of each fiscal year presented herein contained 16 weeks, while the last three quarters of each year contained 12 weeks.
Use of Estimates and Critical Accounting Policies
The preparation of financial statements in conformity with US GAAP requires management to use estimates and assumptions to measure certain items that affect the amounts reported. These judgments are based on knowledge and experience about past and current events, and assumptions about future events. Although management believes its estimates are reasonable and adequate, future events affecting them may differ markedly from current judgment. Significant estimates and assumptions are used to measure self-insurance liabilities, deferred executive compensation obligations, net periodic pension cost and future pension obligations, the carrying values of property held for sale and for long-lived assets including property and equipment, goodwill and other intangible assets.
42
Table of Contents
Frisch’s Restaurants, Inc. and Subsidiaries
NOTES TO CONSOLIDATED FINANCIAL STATEMENTS
Three years ended May 31, 2011
NOTE A – ACCOUNTING POLICIES (continued)
Management considers the following accounting policies to be critical accounting policies because the application of estimates to these policies requires management’s most difficult, subjective or complex judgments: self-insurance liabilities, net periodic pension cost and future pension obligations, and the carrying values of long-lived assets.
Cash and Cash Equivalents
Funds in transit from credit card processors are classified as cash. Highly liquid investments with original maturities of three months or less are considered as cash equivalents.
Receivables
Trade and other accounts receivable are valued on the reserve method. The reserve balance was $30,000 as of May 31, 2011 and June 1, 2010. The reserve is monitored for adequacy based on historical collection patterns and write-offs, and current credit risks.
Inventories
Inventories, comprised principally of food items, are valued at the lower of cost, determined by the first-in, first-out method, or market.
Accounting for Rebates
Cash consideration received from certain food vendors is treated as a reduction of cost of sales and is recognized in the same periods in which the rebates are earned.
Leases
Minimum scheduled payments on operating leases, including escalating rental payments, are recognized as rent expense on a straight-line basis over the term of the lease. Under certain circumstances, the lease term used to calculate straight-line rent expense includes option periods that have yet to be legally exercised. Contingent rentals, typically based on a percentage of restaurant sales in excess of a fixed amount, are expensed as incurred. Rent expense is also recognized during that part of the lease term when no rent is paid to the landlord, often referred to as a “rent holiday,” that generally occurs while a restaurant is being constructed on leased land. The Company does not typically receive leasehold incentives from landlords.
Property and Equipment
Property and equipment are stated at cost. Depreciation is provided principally on the straight-line method over the estimated service lives, which range from 10 to 25 years for new buildings or components thereof and five to 10 years for equipment. Leasehold improvements are depreciated over the shorter of the useful life of the asset or the lease term. Property betterments are capitalized while the cost of maintenance and repairs is expensed as incurred.
The cost of land not yet in service is included in “Construction in progress” if construction has begun or if construction is likely within the next 12 months. Two new Big Boy restaurant buildings were under construction as of May 31, 2011 – one on land owned by the Company and the other was being built on leased land. Estimated remaining costs (not already included in Construction in progress) to complete construction of the two restaurants approximated $2,480,000 as of May 31, 2011. The cost of three other land tracts owned by the Company is included in Construction in progress at May 31, 2011, as near term construction is more likely than not. Any contracts to acquire additional sites for future development that had been entered before May 31, 2011 were cancellable at the Company’s sole discretion while due diligence is pursued under the inspection period provisions of the contracts.
43
Table of Contents
Frisch’s Restaurants, Inc. and Subsidiaries
NOTES TO CONSOLIDATED FINANCIAL STATEMENTS
Three years ended May 31, 2011
NOTE A – ACCOUNTING POLICIES (continued)
Interest on borrowings is capitalized during active construction periods of new restaurants. Capitalized interest for fiscal years 2011, 2010 and 2009 was $87,000, $89,000 and $40,000, respectively.
The fair value of land on which construction is not likely within the next 12 months is classified as “Investments in land” in the consolidated balance sheet. Surplus property that is no longer needed by the Company, including two former Big Boy restaurants (one ceased operations in fiscal year 2008 and the other was closed in fiscal year 2009), is classified as “Property held for sale” in the consolidated balance sheet. All of the surplus property is stated at estimated fair value expected to be received upon sale. Fair values are generally determined by opinions of value provided by real estate brokers and/or management’s judgment. The fair value of any property held for sale for which a viable sales contract is pending at the balance sheet date is reclassified to current assets.
Costs incurred during the application development stage of computer software that is developed or obtained for internal use is capitalized, while the costs of the preliminary project stage are expensed as incurred, along with certain other costs such as training. Capitalized computer software is amortized on the straight-line method over the estimated service lives, which range from three to 10 years. Software assets are reviewed for impairment when events or circumstances indicate that the carrying value may not be recoverable over the remaining service life.
Impairment of Long-Lived Assets
Management considers a history of cash flow losses on a restaurant-by-restaurant basis to be its primary indicator of potential impairment of long-lived assets. Carrying values are tested for impairment at least annually, and whenever events or changes in circumstances indicate that the carrying values of the assets may not be recoverable from the estimated future cash flows expected to result from the use and eventual disposition of the property. When undiscounted expected future cash flows are less than carrying values, an impairment loss is recognized equal to the amount by which the carrying values exceed the greater of the net present value of the future cash flow stream or a floor value. Floor values are generally determined by opinions of value provided by real estate brokers and/or management’s judgment as developed through its experience in disposing of unprofitable restaurant properties.
The impairment test completed at the end of the fourth quarters of fiscal years 2011, 2010 and 2009 resulted in no charges to record impairment of assets.
Restaurant Closing Costs
Any liabilities associated with exit or disposal activities are recognized only when the liabilities are incurred, rather than upon the commitment to an exit or disposal plan. Conditional obligations that meet the definition of an asset retirement obligation are currently recognized if fair value is reasonably estimable.
The carrying values of closed restaurant properties that are held for sale are reduced to fair value in accordance with the accounting policy for impairment of long-lived assets (see above). When leased restaurant properties are closed, a provision is made equal to the present value of remaining non-cancellable lease payments after the closing date, net of estimated subtenant income. The carrying values of leasehold improvements are also reduced in accordance with the accounting policy for impairment of long-lived assets.
Goodwill and Other Intangible Assets, Including Licensing Agreements
As of May 31, 2011 and June 1, 2010, the carrying amount of goodwill that was acquired in prior years amounted to $741,000. Acquired goodwill is tested for impairment on the first day of fourth quarter of each fiscal year and whenever an impairment indicator arises. Impairment losses are recorded when impairment is determined to have occurred.
44
Table of Contents
Frisch’s Restaurants, Inc. and Subsidiaries
NOTES TO CONSOLIDATED FINANCIAL STATEMENTS
Three years ended May 31, 2011
NOTE A – ACCOUNTING POLICIES (continued)
An analysis of other intangible assets follows:
| 2011 | 2010 | |||||||
| (in thousands) | ||||||||
| Golden Corral initial franchise fees subject to amortization |
$ | 1,280 | $ | 1,280 | ||||
| Less accumulated amortization |
|
(750)
|
|
|
(665
|
)
| ||
|
|
|
|
|
|||||
| Carrying amount of Golden Corral initial franchise fees subject to amortization |
530 | 615 | ||||||
| Current portion of Golden Corral initial franchise fees subject to amortization |
(85) | (85 | ) | |||||
| Golden Corral initial franchise fees not yet subject to amortization |
|
-
|
|
|
135
|
| ||
|
|
|
|
|
|||||
| Golden Corral – total intangible fees |
445 | 665 | ||||||
| Other intangible assets subject to amortization – net |
17 | 19 | ||||||
| Other intangible assets not yet subject to amortization |
34 | 34 | ||||||
|
|
|
|
|
|||||
| Total other intangible assets |
$ | 496 | $ | 718 | ||||
|
|
|
|
|
|||||
An initial franchise fee of $40,000 was paid for each Golden Corral restaurant that the Company opened. As finite useful lives are subject to amortization, the initial fee began amortizing when each restaurant opened, computed using the straight-line method over the 15 year term of each individual restaurant’s franchise agreement, which equated to $2,667 per year per restaurant. Amortization was $85,000 in each of the three years in the period ending May 31, 2011. The fees will continue to amortize as scheduled below:
| (in thousands) |
| Fiscal year 2012 |
$ | 85 | ||||||
| Fiscal year 2013 |
85 | |||||||
| Fiscal year 2014 |
84 | |||||||
| Fiscal year 2015 |
77 | |||||||
| Fiscal year 2016 |
67 | |||||||
| Subsequent to fiscal year 2016 |
132 | |||||||
|
|
|
|||||||
| $ | 530 | |||||||
|
|
|
An aggregate deposit of $135,000 in initial franchise fees had been paid to Golden Corral Franchising Systems, Inc. through the years in anticipation of additional development of Golden Corral restaurants. In exchange for payment of these fees, the Company was granted development rights to open up to 12 more Golden Corral restaurants through December 31, 2011. Since the Company now has no further plans to develop any new Golden Corral restaurants, the deposit was written off during the second quarter of fiscal year 2011 (the 12 week period ended December 14, 2010).
The franchise agreements with Golden Corral Franchising Systems, Inc. also require the Company to pay fees based on defined gross sales. These costs are charged to “Other operating costs” as incurred.
Other intangible assets are tested for impairment on the first day of the fourth quarter of each fiscal year and whenever an impairment indicator arises.
45
Table of Contents
Frisch’s Restaurants, Inc. and Subsidiaries
NOTES TO CONSOLIDATED FINANCIAL STATEMENTS
Three years ended May 31, 2011
NOTE A – ACCOUNTING POLICIES (continued)
Revenue Recognition
Revenue from restaurant operations is recognized upon the sale of products as they are sold to customers. All sales revenue is recorded on a net basis, which excludes sales tax collected from being reported as sales revenue and sales tax remitted from being reported as a cost. Revenue from the sale of commissary products to Big Boy restaurants licensed to other operators is recognized upon shipment of product. Revenue from franchise fees, based on certain percentages of sales volumes generated in Big Boy restaurants licensed to other operators, is recorded on the accrual method as earned. Initial franchise fees are recognized as revenue when the fees are deemed fully earned and non-refundable, which ordinarily occurs upon the execution of the license agreement, in consideration for the Company’s services to that time.
Revenue from the sale of gift cards is deferred for recognition until the gift card is redeemed by the cardholder, or when the probability becomes remote that the cardholder will demand full performance by the Company and there is no legal obligation to remit the value of the unredeemed card under applicable state escheatment statutes.
Advertising
Advertising costs are charged to “Administrative and advertising” expense as incurred. Advertising expense for fiscal years 2011, 2010 and 2009 was $7,541,000, $7,049,000 and $6,984,000, respectively.
New Store Opening Costs
New store opening costs consist of new employee training costs, the cost of a team to coordinate the opening and the cost of certain replaceable items such as uniforms and china. New store opening costs are charged to “Other operating costs” as incurred. New store opening costs for fiscal years 2011, 2010 and 2009 (all for Big Boy – no Golden Corral restaurants opened during the last three years) was $1,073,000, $768,000 and $585,000.
Benefit Plans
The Company sponsors two qualified defined benefit pension plans: the Pension Plan for Operating Unit Hourly Employees (the Hourly Pension Plan) and the Pension Plan for Managers, Office and Commissary Employees (the Salaried Pension Plan). (See Note F – Pension Plans.) Both plans have been amended to comply with the Pension Protection Act of 2006 (PPA) and the Heroes Earnings Assistance and Relief Tax Act of 2008 (HEART Act), and have been further amended for technical corrections promulgated by the Worker, Retiree, and Employer Recovery Act of 2008 (WRERA) and guidance on the HEART Act provided by the Internal Revenue Service.
Benefits under both plans are based on years-of-service and other factors. The Company’s funding policy is to contribute at least the minimum annual amount sufficient to satisfy legal funding requirements plus additional discretionary tax deductible amounts that may be deemed advisable, even when no minimum funding is required. Contributions are intended to provide not only for benefits attributed to service-to-date, but also for those expected to be earned in the future.
The Hourly Pension Plan covers hourly restaurant employees. The Hourly Pension Plan was amended on July 1, 2009 to freeze all future accruals for credited service after August 31, 2009. The Hourly Pension Plan had previously been closed to all hourly paid restaurant employees who were hired after December 31, 1998. Hourly restaurant employees hired January 1, 1999 or after have been eligible to participate in the Frisch’s Restaurants, Inc. Hourly Employees 401(k) Savings Plan (the Hourly Savings Plan), a defined contribution plan that provided a 40 percent match by the Company on the first 10 percent of earnings deferred by the participants. The Company’s match had vested on a scale based on length of service that reached 100 percent after four years of service. The Hourly Savings Plan was amended effective September 1, 2009 to provide for immediate vesting along with a 100 percent match from the Company on the first 3 percent of earnings deferred by participants. All hourly restaurant employees are now eligible to participate in the Hourly Savings Plan, regardless of when hired.
46
Table of Contents
Frisch’s Restaurants, Inc. and Subsidiaries
NOTES TO CONSOLIDATED FINANCIAL STATEMENTS
Three years ended May 31, 2011
NOTE A – ACCOUNTING POLICIES (continued)
The Salaried Pension Plan covers restaurant management, office and commissary employees (salaried employees). The Salaried Pension Plan was amended on July 1, 2009 to close entry into the Plan to employees hired after June 30, 2009. Salaried employees hired before June 30, 2009 continue to participate in the Salaried Pension Plan and are credited with normal benefits for years of service. Salaried employees are automatically enrolled, unless otherwise elected, in the Frisch’s Employee 401(k) Savings Plan (the Salaried Savings Plan), a defined contribution plan. The Salaried Savings Plan provides immediate vesting under two different Company matching schedules. Employees who are participants in the Salaried Pension Plan (hired before June 30, 2009) may continue to defer up to 25 percent of their compensation under the Salaried Savings Plan, with the Company contributing a 10 percent match on the first 18 percent deferred. Beginning September 1, 2009, salaried employees hired after June 30, 2009 receive a 100 percent match from the Company on the first 3 percent of compensation deferred.
The executive officers of the Company and certain other “highly compensated employees” (HCE’s) are disqualified from participation in the Salaried Savings Plan. A non-qualified savings plan - Frisch’s Executive Savings Plan (FESP) - provides a means by which the HCE’s may continue to defer a portion of their compensation. FESP allows deferrals of up to 25 percent of a participant’s compensation into a choice of mutual funds or common stock of the Company. Matching contributions are added to the first 10 percent of salary deferred at a rate of 10 percent for deferrals into mutual funds, while a 15 percent match is added to deferrals into the Company’s common stock. HCE’s hired after June 30, 2009 receive a 100 percent matching contribution from the Company on the first 3 percent of compensation deferred into either mutual funds or common stock.
Although the Company owns the mutual funds of the FESP until the retirement of the participants, the funds are invested at the direction of the participants. FESP assets are the principal component of “Other long-term assets” in the consolidated balance sheet. The common stock is a “phantom investment” that may be paid in actual shares or in cash upon retirement of the participant. The FESP liability to the participants is included in “Deferred compensation and other” long term obligations in the consolidated balance sheet. As a result of market gains, the mutual funds and the corresponding liability to FESP participants were increased $561,000 and $203,000 respectively during fiscal years 2011 and 2010. A market loss of $447,000 was experienced in fiscal year 2009. All of the changes were effected through offsetting investment income or loss and charges (market gains) or credits (market losses) to deferred compensation expense within administrative and advertising expense in the consolidated statement of earnings.
The Company also sponsors an unfunded non-qualified Supplemental Executive Retirement Plan (SERP) that was originally intended to provide a supplemental retirement benefit to the HCE’s whose benefits under the Salaried Pension Plan were reduced when their compensation exceeded Internal Revenue Code imposed limitations or when elective salary deferrals were made to FESP. The SERP was amended effective January 1, 2000 to exclude any benefit accruals after December 31, 1999 (interest continues to accrue) and to close entry into the Plan by any HCE hired after December 31, 1999.
Effective January 1, 2000 a Non Deferred Cash Balance Plan was adopted to provide comparable retirement type benefits to the HCE’s in lieu of future accruals under the Salaried Pension Plan and the SERP. The comparable benefit amount is determined each year and converted to a lump sum (reported as W-2 compensation) from which taxes are withheld and the net amount is deposited into the HCE’s individual trust account. (See Note F – Pension Plans.)
47
Table of Contents
Frisch’s Restaurants, Inc. and Subsidiaries
NOTES TO CONSOLIDATED FINANCIAL STATEMENTS
Three years ended May 31, 2011
NOTE A – ACCOUNTING POLICIES (continued)
Self Insurance
The Company self-insures its Ohio workers’ compensation claims up to $300,000 per claim. Initial self-insurance liabilities are accrued based on prior claims history, including an amount developed for incurred but unreported claims. Management performs a comprehensive review each fiscal quarter and adjusts the self-insurance liabilities as deemed appropriate based on claims experience, which continues to benefit from active claims management and post accident drug testing. Below is a summary of reductions or (increases) to the self-insurance liabilities that were credited to or (charged against) earnings:
| 2011 | 2010 | 2009 | ||||||
| (in thousands) | ||||||||
| $ (174) |
$ | (536) | $ | 68 | ||||
Income Taxes
Income taxes are provided on all items included in the consolidated statement of earnings regardless of when such items are reported for tax purposes, which gives rise to deferred income tax assets and liabilities. (See Note D – Income Taxes.)
Fair Value of Financial Instruments
The Company’s financial instruments consist primarily of cash and cash equivalents, accounts payable and accounts receivable, investments and long-term debt. The carrying values of cash and cash equivalents together with accounts payable and accounts receivable approximate their fair value based on their short-term character. The fair value of long-term debt is disclosed in Note B – Long-Term Debt.
The Company does not use the fair value option for reporting financial assets and financial liabilities and therefore does not report unrealized gains and losses in the consolidated statement of earnings. Fair value measurements for non-financial assets and non-financial liabilities are used primarily in the impairment analyses of long-lived assets, goodwill and other intangible assets. The Company does not use derivative financial instruments.
New Accounting Standards
In June 2011, the Financial Accounting Standards Board issued Accounting Standards Update (ASU) 2011-05, “Presentation of Comprehensive Income”. ASU 2011-05 was issued to amend Accounting Standards Codification Topic 220, “Comprehensive Income”. Under ASU 2011-05, an entity has the option to present the total of comprehensive income, the components of net income, and the components of other comprehensive income either in a single continuous statement of comprehensive income or in two separate but consecutive statements. In both choices, the presentation must show each component of net income along with total net income, each component of other comprehensive income along with a total for other comprehensive income, and a total amount for comprehensive income. ASU 2011-05 eliminates the option to present the components of other comprehensive income as part of the statement of changes in shareholders’ equity, which is the Company’s current presentation. The amendment does not change the items that must be reported in other comprehensive income or when an item of other comprehensive income must be reclassified to net income.
ASU 2011-05 is effective for fiscal years, and interim periods within those years, beginning after December 15, 2011. Although early adoption is permitted, the Company will adopt the provisions of ASU 2011-05 on May 30, 2012 (the first day of the fiscal year that will end May 28, 2013).
The Company reviewed all other significant newly issued accounting standards and concluded that they are either not applicable to the Company’s business or that no material impact is anticipated on the financial statements as a result of future adoption.
48
Table of Contents
Frisch’s Restaurants, Inc. and Subsidiaries
NOTES TO CONSOLIDATED FINANCIAL STATEMENTS
Three years ended May 31, 2011
NOTE B - LONG-TERM DEBT
| 2011 | 2010 | |||||||||||||||
| Payable within one year |
Payable after one year |
Payable within one year |
Payable after one year |
|||||||||||||
| (in thousands) | ||||||||||||||||
| Construction Loan |
||||||||||||||||
| Construction Phase |
$ | 220 | $ | 2,780 | $ | 509 | $ | 5,491 | ||||||||
| Term Loans |
6,428 | 17,415 | 6,550 | 15,312 | ||||||||||||
| Revolving Loan |
- | - | - | - | ||||||||||||
| Stock Repurchase Loan |
||||||||||||||||
| Draw Phase |
104 | 896 | ||||||||||||||
| Term Loans |
- | - | ||||||||||||||
| 2009 Term Loan |
|
1,002
|
|
|
1,481
|
|
|
968
|
|
|
2,483
|
| ||||
| $ | 7,754 | $ | 22,572 | $ | 8,027 | $ | 23,286 | |||||||||
The portion payable after one year matures as follows:
| 2011 | 2010 | |||||||
| (in thousands) | ||||||||
| Period ending in 2012 | $ | - | $ | 7,039 | ||||
| 2013 | 6,848 | 5,841 | ||||||
| 2014 | 5,118 | 4,244 | ||||||
| 2015 | 3,943 | 2,927 | ||||||
| 2016 | 3,031 | 1,942 | ||||||
| 2017 | 1,984 | 1,293 | ||||||
| Subsequent to 2017 | 1,648 | - | ||||||
| $ | 22,572 | $ | 23,286 | |||||
The Company has four unsecured loans in place, all with the same lending institution. A single Amended and Restated Loan Agreement (2010 Loan Agreement), under which the Company may not assume or permit to exist any other indebtedness, governs the four loans. The 2010 Loan Agreement amended and restated two prior loan agreements that consisted of a construction draw facility (Construction Loan) and a revolving credit agreement (Revolving Loan), and added a Stock Repurchase Loan. Borrowing under these three credit lines is permitted through April 2012. The 2009 Term Loan, previously controlled by the revolving credit agreement, is also governed under the 2010 Loan Agreement. Management expects to encounter no difficulties in extending the 2010 Loan Agreement before its scheduled expiration in April 2012.
Construction Loan
The Construction Loan is an unsecured draw credit line intended to finance construction and opening and/or the refurbishing of restaurant operations. The 2010 Loan Agreement increased the amount available to be borrowed from $1,000,000 to $15,000,000. As of May 31, 2011, the amount available to be borrowed had been reduced to $10,500,000, which reflects the sum of $4,500,000 borrowed since the 2010 Loan Agreement went into effect.
49
Table of Contents
Frisch’s Restaurants, Inc. and Subsidiaries
NOTES TO CONSOLIDATED FINANCIAL STATEMENTS
Three years ended May 31, 2011
NOTE B - LONG-TERM DEBT (continued)
The Construction Loan is subject to an unused commitment fee equal to 0.25 percent of the amount available to be borrowed. Funds borrowed are initially governed as a Construction Phase loan on an interest only basis. Interest is calculated with a pricing matrix that uses changeable basis points, determined by certain of the Company’s financial ratios. Interest is payable at the end of each specific rate period selected by the Company, which may be monthly, bi-monthly or quarterly. Payment of principal without penalty is permitted at the end of any rate period.
Within six months, the balance outstanding under each loan in the Construction Phase must be converted to a Term Loan, with an amortization period of not less than seven nor more than 12 years as chosen by the Company. For funds borrowed between September 2007 and September 2010, any Term Loan converted with an initial amortization period of less than 12 years, a one-time option, without penalty or premium, is available during the chosen term to extend the amortization period up to a total of 12 years. Outstanding balances of loans initiated prior to September 2007 had to be converted with an amortization period not to exceed seven years. Upon conversion to an amortizing Term Loan, the Company may select a fixed interest rate over the chosen term or may choose among various adjustable rate options.
Prepayments of Term Loans that were initiated prior to September 2009 are permissible upon payment of sizable prepayment fees and other amounts. For Term Loans initiated after September 2009, the Company has the option at the time of conversion to include a small breakfunding premium over the otherwise applicable fixed rate in exchange for the right to prepay in whole or in part at any time without incurring a prepayment fee. After September 2010, the breakfunding premium included at conversion is also necessary in order to extend the amortization period up to 12 years without incurring additional costs.
As of May 31, 2011, the aggregate outstanding balance under the Construction Loan was $26,843,000, which consisted of $23,843,000 in Term Loans plus $3,000,000 in the Construction Phase awaiting conversion. Since the inception of the Construction Loan (including prior agreements), 20 of the Term Loans ($45,000,000 out of $93,000,000 in original notes) had been retired as of May 31, 2011. All of the outstanding Term Loans are subject to fixed interest rates, the weighted average of which is 5.36 percent, all of which are being repaid in 84 equal monthly installments of principal and interest aggregating $696,000, expiring in various periods ranging from September 2011 through May 2018.
The $3,000,000 balance in the Construction Phase as of May 31, 2011 was borrowed under three separate draws $500,000 in December 2010, $1,000,000 in February 2011 and $1,500,000 in May 2011 ), all of which were subject to a variable interest rate of 1.9 percent or lower as of May 31, 2011. The amount in the Construction Phase that is included in the table above as being payable within one year is an estimate that assumes conversion to a Term Loan within six months from the date of borrowing. If the 2010 Loan Agreement is not renewed by April 2012, any outstanding amount in the Construction Phase that has not been converted into a Term Loan shall mature and be payable in full at that time.
Revolving Loan
The Revolving Loan provides an unsecured credit line that allows for borrowing of up to $5,000,000 to fund temporary working capital needs. Amounts repaid may be re-borrowed so long as the amount outstanding does not exceed $5,000,000 at any time. The Revolving Loan, none of which was outstanding as of May 31, 2011, will mature and be payable in full in April 2012, unless it is renewed sooner. It is subject to a 30 consecutive day out-of-debt period each fiscal year. Interest is determined by the same pricing matrix used for loans in the Construction Phase as described above under the Construction Loan. Interest is payable at the end of each specific rate period selected by the Company, which may be monthly, bi-monthly or quarterly. The loan is also subject to a 0.25 percent unused commitment fee.
50
Table of Contents
Frisch’s Restaurants, Inc. and Subsidiaries
NOTES TO CONSOLIDATED FINANCIAL STATEMENTS
Three years ended May 31, 2011
NOTE B - LONG-TERM DEBT (continued)
Stock Repurchase Loan
The Stock Repurchase Loan is an unsecured draw credit line intended to finance repurchases of the Company’s common stock, under which up to $10,000,000 may be borrowed. As of May 31, 2011, the amount available to be borrowed had been reduced to $9,000,000, which reflects the sum of $1,000,000 borrowed in December 2010. Amounts drawn are on an interest-only basis for six months (Draw Phase). Interest is determined by the same pricing matrix used for loans in the Construction Phase as described above under the Construction Loan. Interest is payable at the end of each specific rate period selected by the Company, which may be monthly, bi-monthly or quarterly. Prepayment of principal, without penalty, is permitted at the end of any rate period during the Draw Phase. The balance outstanding must be converted semi-annually to a Term Loan amortized over seven years. The Stock Repurchase Loan is not subject to an unused commitment fee.
The $1,000,000 balance in the Draw Phase as of May 31, 2011 was subject to a variable interest rate of 1.86 percent. The amount in the Draw Phase that is included in the table above as being payable within one year is an estimate that assumes conversion to a Term Loan within six months from the date of borrowing. If the 2010 Loan Agreement is not renewed by April 2012, any outstanding amount in the Draw Phase that has not been converted into a Term Loan shall mature and be payable in full at that time.
2009 Term Loan
The 2009 Term Loan originated in September 2009 when $4,000,000 was borrowed to fund the acquisition of five Big Boy restaurants from the landlord of the facilities. The 2009 Term Loan requires 48 monthly installments of $89,000 including principal and interest at a fixed 3.47 percent rate. The final payment of the unsecured loan is due October 21, 2013.
Loan Covenants
The 2010 Loan Agreement contains covenants relating to cash flows, debt levels, lease expense, asset dispositions, investments and restrictions on pledging certain restaurant operating assets. The Company was in compliance with all loan covenants as of May 31, 2011. Compensating balances are not required under the terms of the 2010 Loan Agreement.
Fair Values
The fair values of the fixed rate Term Loans within the Construction Loan as shown in the following table are based on fixed rates that would have been available at May 31, 2011 if the loans could have been refinanced with terms similar to the remaining terms under the present Term Loans. The carrying value of substantially all other long-term debt approximates its fair value.
| Carrying Value | Fair Value | |||
| Term Loans under the Construction Loan |
$23,843,000 | $24,769,000 | ||
Other
The final payment on a separate term loan (2007 Term Loan - a bullet loan prior to March 15, 2007) was made on March 15, 2010. It had required 36 equal monthly installments of $92,000 including principal and interest at a fixed 6.13 percent rate and was secured by mortgages that encumbered the real property of two Golden Corral restaurants. None of the Company’s real property is currently encumbered by mortgages.
51
Table of Contents
Frisch’s Restaurants, Inc. and Subsidiaries
NOTES TO CONSOLIDATED FINANCIAL STATEMENTS
Three years ended May 31, 2011
NOTE C - LEASED PROPERTY
Although the Company’s policy is to own the property on which it operates restaurants, the Company occupies certain of its restaurants pursuant to lease agreements. As of May 31, 2011, 22 restaurants were in operation on non-owned premises, of which 21 were classified as operating leases and one was a capital lease. Most of the operating leases are for 15 or 20 years and contain multiple five year renewal options. However, three operating leases (all for Big Boy) will expire over the course of fiscal year 2012, with the underlying properties expected to be vacated.
Seven of the operating leases are for Golden Corral operations. Big Boy restaurants are operated under the terms of 14 operating leases and one capital lease. In addition, an operating lease is in place for land on which construction of a Big Boy restaurant is currently in progress.
Office space is occupied under an operating lease that expires during fiscal year 2013, with renewal options available through fiscal year 2023. A purchase option is available in 2023 to acquire the office property in fee simple estate.
Rent expense under operating leases (including certain month-to-month arrangements for five Big Boy restaurant facilities until they were acquired from the landlord in September 2009):
| 2011 | 2010 | 2009 | ||||||||||
| (in thousands) | ||||||||||||
| Minimum rentals |
$ | 1,735 | $ | 1,872 | $ | 2,262 | ||||||
| Contingent payments |
- | 10 | 47 | |||||||||
|
|
|
|
|
|
|
|||||||
| $ | 1,735 | $ | 1,882 | $ | 2,309 | |||||||
|
|
|
|
|
|
|
|||||||
The capital lease used in Big Boy operations is for land on which a Big Boy restaurant opened for business in July 2010. Under the terms of the lease, the Company is required to acquire the land in fee simple estate after the 10th year. Delivery and other equipment is held under capitalized leases expiring during various periods through fiscal year 2019.
An analysis of the capitalized lease property is shown in the following table. Amortization of capitalized delivery and other equipment is based on the straight-line method over the primary terms of the leases.
| Asset balances at | ||||||||
| 2011 | 2010 | |||||||
| (in thousands) | ||||||||
| Restaurant property (land) |
$ | 825 | $ | 825 | ||||
| Delivery and other equipment leases |
1,730 | 1,334 | ||||||
| Less accumulated amortization |
(662) | (995) | ||||||
|
|
|
|
|
|||||
| $ | 1,893 | $ | 1,164 | |||||
|
|
|
|
|
|||||
52
Table of Contents
Frisch’s Restaurants, Inc. and Subsidiaries
NOTES TO CONSOLIDATED FINANCIAL STATEMENTS
Three years ended May 31, 2011
NOTE C - LEASED PROPERTY (continued)
Future minimum lease payments under capitalized leases and operating leases are summarized in the table below. The column for capitalized leases includes the requirement to acquire land, currently leased by the Company, in fee simple estate after the 10th year of the lease.
| Fiscal year ending in: |
Capitalized leases |
Operating leases | ||||||||
| (in thousands) | ||||||||||
| 2012 |
$ | 374 | $ | 1,721 | ||||||
| 2013 |
259 | 1,582 | ||||||||
| 2014 |
245 | 1,601 | ||||||||
| 2015 |
245 | 1,495 | ||||||||
| 2016 |
245 | 1,406 | ||||||||
| 2017 to 2033 |
1,421 | 12,886 | ||||||||
| Total |
2,789 | $ | 20,691 | |||||||
| Amount representing interest |
(846) | |||||||||
| Present value of obligations |
1,943 | |||||||||
| Portion due within one-year |
(266) | |||||||||
| Long-term obligations |
$ | 1,677 | ||||||||
NOTE D – INCOME TAXES
The variations between the statutory Federal rate and the effective rate are summarized as follows:
| Percent of pretax earnings | ||||||||||||
| 2011 | 2010 | 2009 | ||||||||||
| Statutory U.S. Federal income tax |
34.0 | 34.0 | 34.0 | |||||||||
| Tax credits |
(8.0) | (6.4) | (6.8) | |||||||||
| State and municipal income taxes - Current and deferred (net of Federal tax benefit) |
1.8 | 2.6 | 1.8 | |||||||||
| Other |
0.4 | 1.8 | (0.8) | |||||||||
| Effective rate |
28.2 | 32.0 | 28.2 | |||||||||
Deferred tax assets and liabilities result from timing differences in the recognition of revenue and expense between financial reporting and tax statutes. The components of the deferred tax (liability) are shown in the table that follows:
53
Table of Contents
Frisch’s Restaurants, Inc. and Subsidiaries
NOTES TO CONSOLIDATED FINANCIAL STATEMENTS
Three years ended May 31, 2011
NOTE D – INCOME TAXES (continued)
| 2011 | 2010 | |||||||
| (in thousands) | ||||||||
| Deferred compensation |
$ | 991 | $ | 901 | ||||
| Compensated absences |
1,018 | 972 | ||||||
| Stock-based compensation |
467 | 373 | ||||||
| Impairment of assets |
1,577 | 1,579 | ||||||
| Self insurance |
625 | 515 | ||||||
| Pension |
3,073 | 3,654 | ||||||
| Lease transactions |
447 | 418 | ||||||
| Other |
635 | 463 | ||||||
| Total deferred income tax assets |
8,833 | 8,875 | ||||||
| Depreciation |
(9,228) | (4,179) | ||||||
| Other |
(411) | (495) | ||||||
| Total deferred income tax liabilities |
(9,639) | (4,674) | ||||||
| Net deferred income tax (liabilities) assets |
$ | (806) | $ | 4,201 | ||||
| Net current deferred income tax assets |
$ | 1,161 | $ | 1,038 | ||||
| Net long term deferred income tax (liabilities) assets |
(1,967) | 3,163 | ||||||
| $ | (806) | $ | 4,201 | |||||
Prepaid and deferred income taxes reported as current assets in the consolidated balance sheet include prepaid income taxes of $1,418,000 and $451,000 respectively as of May 31, 2011 and June 1, 2010. In addition, prepaid and deferred income taxes reported as current assets at May 31, 2011 include $635,000 in tax benefits arising from general business credits in fiscal year 2011 that will be carried back to the previous year’s tax return.
Income taxes paid (net of refunds, if any) during fiscal years 2011, 2010 and 2009 were $1,239,000, $5,457,000 and $4,164,000, respectively. Income taxes paid in fiscal year 2011 reflect the savings derived from extensions of bonus depreciation through December 31, 2011 and two automatic Change in Accounting Method applications filed with the Internal Revenue Service. The Changes in Accounting Methods yielded a combined tax deduction in fiscal year 2011 of approximately $10,165,000. The Change in Accounting Method for depreciation and amortization was filed to segregate certain restaurant building costs to their proper category for depreciation purposes. The Change in Accounting Method for incidental repairs and maintenance was filed to allow the immediate deduction of certain repairs and maintenance costs, replacing the previous accounting that capitalized these costs with recovery periods of 31.5 or 39 or 15 years.
Net operating losses (NOL’s) have been generated from operations in certain states from prior periods that total approximately $2,864,000. These NOL’s are set to expire in periods ranging from 2021 through 2030. The statutory tax rate has been applied to each state NOL resulting in a total tax benefit of approximately $271,000. A valuation allowance has been applied at 100 percent to these NOL’s since management believes that it is more likely than not that the total tax benefit will not be realized.
The Company believes it has no material uncertain tax positions taken in any tax returns that have been filed or that are expected to be taken on a future tax return. The impact of an uncertain tax position taken or expected to be taken on an income tax return must be recognized in the financial statements at the largest amount that is more likely than not to be sustained upon audit by the relevant taxing authority. An uncertain income tax position will not be recognized in the financial statements unless it is more likely than not of being sustained. An examination by the Internal Revenue Service (IRS) of the Company’s tax return for the year ended June 2, 2009 (fiscal year 2009) was completed in November 2010. The examination resulted in no changes.
54
Table of Contents
Frisch’s Restaurants, Inc. and Subsidiaries
NOTES TO CONSOLIDATED FINANCIAL STATEMENTS
Three years ended May 31, 2011
NOTE E - CAPITAL STOCK
The Company has two equity compensation plans adopted respectively in 1993 and 2003.
2003 Stock Option and Incentive Plan
Shareholders approved the 2003 Stock Option and Incentive Plan ((the 2003 Incentive Plan) or (Plan)) in October 2003. The 2003 Incentive Plan provides for several forms of awards including stock options, stock appreciation rights, stock awards including restricted and unrestricted awards of stock, and performance awards. The Plan is in full compliance with the American Jobs Creation Act of 2004 and Section 409A of the Internal Revenue Code.
No award shall be granted under the Plan on or after October 6, 2013 or after such earlier date on which the Board of Directors may terminate the Plan. The maximum number of shares of common stock that the Plan may issue is 800,000, subject, however, to proportionate and equitable adjustments determined by the Compensation Committee of the Board of Directors (the Committee) as deemed necessary following the event of any equity restructuring that may occur.
Employees of the Company and non-employee members of the Board of Directors are eligible to be selected to participate in the Plan. Participation is based on selection by the Committee. Although there is no limitation on the number of participants in the Plan, approximately 40 persons have historically participated.
The Plan provides that the total number of shares of common stock covered by options plus the number of stock appreciation rights granted to any one individual may not exceed 80,000 during any fiscal year. Additionally, no more than 80,000 shares of common stock may be issued in payment of performance awards denominated in shares, and no more than $1,000,000 in cash (or fair market value, if paid in shares) may be paid pursuant to performance awards denominated in dollars, granted to any one individual during any fiscal year if the awards are intended to qualify as performance based compensation.
Options to purchase shares of the Company’s common stock permit the holder to purchase a fixed number of shares at a fixed price. When options are granted, the Committee determines the number of shares subject to the option, the term of the option, which may not exceed 10 years, the time or times when the option will become exercisable and the price per share that a participant must pay to exercise the option. No option will be granted with an exercise price that is less than 100 percent of fair market value on the date of the grant. The option price and obligatory withholding taxes may be paid pursuant to a “cashless” exercise/sale procedure involving the simultaneous sale by a broker of shares that are covered by the option.
Stock appreciation rights (SAR’s) are rights to receive payment, in cash, shares of common stock or a combination of the two, equal to the excess of (1) the fair market value of a share of common stock on the date of exercise over (2) the price per share of common stock established in connection with the grant of the SAR (the reference price). The reference price must be at least 100 percent of the common stock’s fair market value on the date the SAR is granted. SAR’s may be granted by the Committee in its discretion to any participant, and may have terms no longer than 10 years.
Stock awards are grants of shares of common stock that may be restricted (subject to a holding period or other conditions) or unrestricted. The Committee determines the amounts, vesting, if any, terms and conditions of the awards, including the price to be paid, if any, for restricted awards and any contingencies related to the attainment of specified performance goals or continued employment or service.
The Committee may also grant performance awards to participants. Performance awards are the right to receive cash, common stock or both, at the end of a specified performance period, subject to satisfaction of the performance criteria and any vesting conditions established for the award.
55
Table of Contents
Frisch’s Restaurants, Inc. and Subsidiaries
NOTES TO CONSOLIDATED FINANCIAL STATEMENTS
Three years ended May 31, 2011
NOTE E - CAPITAL STOCK (continued)
Stock Options Awarded under the 2003 Incentive Plan
As of May 31, 2011, options to purchase 333,250 shares had been cumulatively granted under the Plan, including 43,000 granted in fiscal year 2011: 40,000 to 10 executive officers and 3,000 to the President and Chief Executive Officer (CEO). Of the 333,250 shares cumulatively granted under the Plan, 26,000 belong to the CEO. The outstanding options belonging to the CEO that were granted before October 2009 (20,000) vested six months from the date of the grant. Options granted to the CEO pursuant to the terms of his employment agreement (3,000 respectively in October 2009 and October 2010) vest one year from the date of the grant. Outstanding options granted to executive officers and other key employees vest in three equal annual installments. Outstanding options granted to non-employee members of the Board of Directors vested one year from the date of grant. The Committee may, in its sole discretion, accelerate the vesting of all or any part of any awards held by a terminated participant, excluding, however, any participant who is terminated for cause.
There were 261,671 options outstanding as of May 31, 2011.
Restricted Stock Awarded under the 2003 Incentive Plan
Beginning in October 2010, the Committee determined that restricted stock awards be granted to non-employee members of the Board of Directors in lieu of granting automatic annual stock options. On October 6, 2010, each non-employee director was granted a restricted stock award equivalent to $40,000 in shares of the Company’s common stock. Based upon the closing price of the Company’s common stock on October 6, 2010, the total number of shares granted amounted to 12,036, an award of 2,006 shares issued to each non-employee director. The shares were re-issued from the Company’s treasury and will vest in full on the first anniversary of the grant date. Full voting and dividend rights are provided prior to vesting. Vested shares must be held until board service ends, except that enough shares may be sold to satisfy tax obligations attributable to the grant.
Shares available for awards under the 2003 Incentive Plan
The table below reconciles shares available for awards under the 2003 Incentive Plan as of May 31, 2011:
| Original authorization |
800,000 | |||
| Stock options granted to date |
(333,250) | |||
| Stock options forfeited to date (re-available) |
57,167 | |||
| Restricted stock issued to date |
(12,036) | |||
| Available for awards |
511,881 |
No other awards - stock appreciation rights, unrestricted stock awards or performance awards - had been granted under the 2003 Stock Option and Incentive Plan as of May 31, 2011.
Awards under the 2003 Incentive Plan (after May 31, 2011)
On June 15, 2011, the Committee granted an unrestricted stock award to the CEO. Pursuant to the award, 17,364 shares of the Company’s common stock were re-issued to the CEO from the Company’s treasury. The total value of the award amounted to $371,000, for which the Company will record a charge against its pretax earnings in the first quarter (ending September 20, 2011) of fiscal year 2012. In connection with the award, the CEO surrendered 7,998 shares back to the Company’s treasury to cover the withholding tax obligation on the compensation.
Also on June 15, 2011, the Committee granted restricted stock awards (in lieu of the previous practice of granting stock options each year) to executive officers and other key employees. Pursuant to the award, 7,078 shares were re-issued from the Company’s treasury, which will vest in full on the first anniversary of the grant date. Full voting and dividend rights are provided prior to vesting. Vested shares must be held until employment ends, except that enough shares may be sold to satisfy withholding tax obligations attributable to the grant.
56
Table of Contents
Frisch’s Restaurants, Inc. and Subsidiaries
NOTES TO CONSOLIDATED FINANCIAL STATEMENTS
Three years ended May 31, 2011
NOTE E - CAPITAL STOCK (continued)
1993 Stock Option Plan
The 1993 Stock Option Plan was not affected by the adoption of the 2003 Stock Option and Incentive Plan. Approved by the shareholders in October 1993, the 1993 Stock Option Plan authorized the grant of stock options for up to 562,432 shares (as adjusted for subsequent changes in capitalization from the original authorization of 500,000 shares) of the common stock of the Company for a 10 year period beginning in May 1994. Shareholders approved the Amended and Restated 1993 Stock Option Plan (Amended Plan) in October 1998, which extended the availability of options to be granted to October 4, 2008. The Amended Plan is in compliance with the American Jobs Creation Act of 2004 and Section 409A of the Internal Revenue Code.
Options to purchase 556,228 shares were cumulatively granted under the 1993 Stock Option Plan and the Amended Plan before granting authority expired on October 4, 2008. As of May 31, 2011, 200,169 shares granted remained outstanding, including 150,000 that belong to the CEO. An outstanding option for 40,000 shares that was granted to the CEO in 2001 terminated on June 15, 2011.
All outstanding options under the 1993 Stock Option Plan and the Amended Plan were granted at fair market value and expire 10 years from the date of grant. Final expirations will occur in June 2014. Outstanding options to the CEO vested in six months, while options granted to non-employee members of the Board of Directors vested after one year. Outstanding options granted to executive officers and other key employees vested in three equal annual installments.
Outstanding and Exercisable Options
The changes in outstanding and exercisable options involving both the 1993 Stock Option Plan and the 2003 Stock Option and Incentive Plan are shown below as of May 31, 2011:
| No. of |
Weighted avg. |
Weighted avg. |
Aggregate | |||||||||
| Outstanding at beginning of year |
503,069 | $21.64 | ||||||||||
| Granted |
43,000 | $20.51 | ||||||||||
| Exercised |
(68,145) | $10.81 | ||||||||||
| Forfeited or expired |
(16,084) | $25.30 | ||||||||||
| Outstanding at end of year |
461,840 | $23.01 | 4.49 years | $ 697 | ||||||||
| Exercisable at end of year |
381,340 | $22.95 | 3.65 years | $ 645 | ||||||||
The intrinsic value of stock options exercised during fiscal years 2011, 2010 and 2009 was $657,000, $36,000 and $35,000, respectively. Options exercised during fiscal year 2011 include 61,478 by the CEO, the intrinsic value of which amounted to $595,000.
57
Table of Contents
Frisch’s Restaurants, Inc. and Subsidiaries
NOTES TO CONSOLIDATED FINANCIAL STATEMENTS
Three years ended May 31, 2011
NOTE E - CAPITAL STOCK (continued)
Stock Options outstanding and exercisable as of May 31, 2011 for the 1993 Stock Option Plan and the 2003 Stock Option and Incentive Plan are shown below:
| Range of Exercise Prices per Share |
No. of |
Weighted average price per share |
Weighted average | |||||
| Outstanding: |
||||||||
| $13.43 to $18.00 |
44,500 | $13.84 | 0.07 years | |||||
| $18.01 to $24.20 |
212,085 | $20.59 | 4.43 years | |||||
| $24.21 to $31.40 |
205,255 | $27.49 | 5.51 years | |||||
| $13.43 to $31.40 |
461,840 | $23.01 | 4.49 years | |||||
| Exercisable: |
||||||||
| $13.43 to $18.00 |
44,500 | $13.84 | 0.07 years | |||||
| $18.01 to $24.20 |
162,585 | $20.49 | 3.11 years | |||||
| $24.21 to $31.40 |
174,255 | $27.58 | 5.07 years | |||||
| $13.43 to $31.40 |
381,340 | $22.95 | 3.65 years | |||||
Restricted Stock
The changes in restricted stock issued under the 2003 Stock Option and Incentive Plan are shown below as of May 31, 2011:
| No. of |
Weighted average price per share | |||||
| Non-vested at beginning of year |
- | $ - | ||||
| Granted |
12,036 | 19.94 | ||||
| Released |
- | - | ||||
| Forfeited |
- | - | ||||
| Non-vested at end of year |
12,036 | $19.94 | ||||
Employee Stock Purchase Plan
Shareholders approved the Employee Stock Option Plan (elsewhere referred to as Employee Stock Purchase Plan) in October 1998. The Plan provides employees who have completed 90 days of continuous service with an opportunity to purchase shares of the Company’s common stock through payroll deduction. Immediately following the end of each semi-annual offering period, participant account balances are used to purchase shares of stock measured at 85 percent of the fair market value of shares at the beginning of the offering period or at the end of the offering period, whichever is lower. The Plan authorizes a maximum of 1,000,000 shares that may be purchased on the open market or from the Company’s treasury. As of April 30, 2011, (latest available data), 159,283 shares had been cumulatively purchased through the Plan. Shares purchased through the Plan are held by the Plan’s custodian until withdrawn or distributed. As of April 30, 2011, the custodian held 44,507 shares on behalf of employees.
Frisch’s Executive Savings Plan
Common shares totaling 58,492 (as adjusted for subsequent changes in capitalization from the original authorization of 50,000 shares) were reserved for issuance under the non-qualified Frisch’s Executive Savings Plan (FESP) (see Benefit Plans in Note A – Accounting Policies) when it was established in 1993. As of May 31, 2011, 39,249 shares remained in the FESP reserve, including 11,805 shares allocated but not issued to participants.
There are no other outstanding options, warrants or rights.
58
Table of Contents
Frisch’s Restaurants, Inc. and Subsidiaries
NOTES TO CONSOLIDATED FINANCIAL STATEMENTS
Three years ended May 31, 2011
NOTE E - CAPITAL STOCK (continued)
Treasury Stock
As of May 31, 2011, the Company’s treasury held 2,666,956 shares of the Company’s common stock. Most of the shares were acquired through a modified “Dutch Auction” self-tender offer in 1997, and in a series of intermittent open market repurchase programs that began in 1998.
The current repurchase program was authorized by the Board of Directors on January 6, 2010. The authorization allows the Company to repurchase up to 500,000 shares of its common stock in the open market or through block trades over a two year period that will expire January 6, 2012. Since its inception, the Company has acquired 269,932 shares at a cost of $5,689,000, of which 223,464 shares were acquired in fiscal year 2011 at a cost of $4,680,000.
Earnings Per Share
Basic earnings per share is based on the weighted average number of outstanding common shares during the period presented. Diluted earnings per share includes the effect of common stock equivalents, which assumes the exercise and conversion of dilutive stock options.
| Basic earnings per share | Stock equivalents |
Diluted earnings per share | ||||||||||||||||
| Weighted average |
EPS |
Weighted average |
EPS |
|||||||||||||||
| 2011 |
5,037,667 | $ | 1.88 | 30,799 | 5,068,466 | $ | 1.87 | |||||||||||
| 2010 |
5,103,834 | 1.96 | 88,585 | 5,192,419 | 1.93 | |||||||||||||
| 2009 |
5,101,994 | 2.10 | 62,170 | 5,164,164 | 2.08 | |||||||||||||
Stock options to purchase 253,000, 193,000 and 205,000 shares were respectively excluded from the calculation of diluted EPS in fiscal years 2011, 2010 and 2009 because the effect was anti-dilutive.
Share-Based Payment (Compensation Cost)
The fair value of stock options granted and restricted stock issued is recognized as compensation cost in the consolidated statement of earnings (charged to administrative and advertising expense) on a straight-line basis over the vesting periods of the awards.
| 2011 |
2010 | 2009 | ||||||||||
| (in thousands) | ||||||||||||
| Stock Options Granted |
||||||||||||
| Charged to compensation cost |
$ | 273 | $ | 356 | $ | 249 | ||||||
| Tax benefit |
(93) | (121) | (85) | |||||||||
|
|
|
|
|
|
|
|||||||
| Compensation cost, net of tax |
$ | 180 | $ | 235 | $ | 164 | ||||||
| Restricted Stock Issued |
||||||||||||
| Charged to compensation cost |
$ | 148 | ||||||||||
| Tax benefit |
(50) | |||||||||||
|
|
|
|||||||||||
| Compensation cost, net of tax |
$ | 98 | ||||||||||
|
|
|
|
|
|
|
|||||||
| Total share-based compensation cost, net of tax |
$ | 278 | $ | 235 | $ | 164 | ||||||
|
|
|
|
|
|
|
|||||||
| Effect on basic earnings per share |
$ | .06 | $ | .05 | $ | .03 | ||||||
|
|
|
|
|
|
|
|||||||
| Effect on diluted earnings per share |
$ | .05 | $ | .05 | $ | .03 | ||||||
|
|
|
|
|
|
|
|||||||
59
Table of Contents
Frisch’s Restaurants, Inc. and Subsidiaries
NOTES TO CONSOLIDATED FINANCIAL STATEMENTS
Three years ended May 31, 2011
NOTE E - CAPITAL STOCK (continued)
As of May 31, 2011, there was $251,000 of total unrecognized pretax compensation cost related to non-vested stock options, which is expected to be recognized over a weighted average period of 1.0 years. Unrecognized pretax compensation cost related to restricted stock awards amounted to $92,000 as of May 31, 2011, which is expected to be recognized over a weighted average period of 0.38 years.
The fair value of each stock option award was estimated on the date of the grant:
| 2011 |
2010 |
2009 |
||||||||||
| Weighted average fair value of options |
$ | 5.40 | $ | 7.88 | $ | 5.47 | ||||||
|
|
|
|
|
|
|
|||||||
The fair value of a stock option is influenced most by the stock price on the date of the grant. The larger or smaller the stock price, the higher or lower value of the underlying stock option. Other factors used to determine the fair value of stock option awards are inputs into the modified Black-Scholes option pricing model, which used the assumptions shown in the following table.
| Assumptions |
2011 |
2010 |
2009 | |||
| Dividend yield |
2.5% - 3.0% | 1.9% - 2.0% | 2.0% - 2.5% | |||
| Expected volatility |
30% - 32% | 32% | 29% - 32% | |||
| Risk free interest rate |
1.8% - 2.7% | 2.8% - 3.3% | 2.4% - 3.5% | |||
| Expected lives |
6 years | 6 years | 5 years | |||
Dividend yield is based on the Company’s current dividend yield, which is considered the best estimate of projected dividend yields within the contractual life of the options. Expected volatility is based on the historical volatility of the Company’s stock using the month end closing price of the previous six years. Risk free interest rate is based on the U. S. Treasury yield curve in effect at the time of grant for periods within the expected life of the option. Expected life represents the period of time the options are expected to be outstanding based on historical exercise patterns.
Compensation cost is also recognized in connection with the Company’s Employee Stock Purchase Plan (see Employee Stock Purchase Plan described elsewhere in Note E – Capital Stock). Compensation costs related to the Employee Stock Purchase Plan, determined at the end of each semi-annual offering period – October 31 and April 30 - amounted to $44,000, $53,000 and $59,000 respectively during fiscal years 2011, 2010 and 2009.
60
Table of Contents
Frisch’s Restaurants, Inc. and Subsidiaries
NOTES TO CONSOLIDATED FINANCIAL STATEMENTS
Three years ended May 31, 2011
NOTE F - PENSION PLANS
As discussed more fully under Benefit Plans in Note A – Accounting Policies, the Company sponsors two qualified defined benefit pension plans plus an unfunded non-qualified Supplemental Executive Retirement Plan (SERP) for “highly compensated employees” (HCE’s). The accounting for all three retirement plans is summarized in the tables that follow.
Recognition of the overfunded or underfunded status of defined benefit pension plans is recorded as an asset or liability in the consolidated balance sheet. Funded status is measured as the difference between plan assets at fair value and projected benefit obligations, which includes a projection of future salary increases. Actuarial gains and losses, prior service costs or credits and transition obligations, if any, which have not yet been recognized, are recorded in equity as Accumulated Other Comprehensive Income or Loss (AOCI).
The measurement dates in the following tables are May 31, 2011 and June 1, 2010.
| (in thousands) | ||||||||
| Change in benefit obligation |
2011 |
2010 |
||||||
| Projected benefit obligation at beginning of year |
$ | 33,778 | $ | 27,447 | ||||
| Service cost |
1,926 | 1,515 | ||||||
| Interest cost |
1,892 | 1,823 | ||||||
| Plan settlements |
- | (486) | ||||||
| Benefits paid from the plans (inc. expenses) |
(1,684) | (1,533) | ||||||
| Actuarial loss |
940 | 5,012 | ||||||
| Projected benefit obligation at end of year |
$ | 36,852 | $ | 33,778 | ||||
| Accumulated benefit obligation at end of year |
$ | 31,256 | $ | 28,294 | ||||
| (in thousands) | ||||||||
| Change in the plans’ assets |
2011 |
2010 |
||||||
| Fair value of plan assets at beginning of year (a) |
$ | 23,030 | $ | 19,744 | ||||
| Actual return on plan assets |
4,960 | 3,680 | ||||||
| Employer contributions |
1,600 | 1,625 | ||||||
| Plan settlements |
- | (486) | ||||||
| Benefits paid from the plans (inc. expenses) |
(1,684) | (1,533) | ||||||
| Fair value of plan assets at end of year (a) |
$ | 27,906 | $ | 23,030 | ||||
| (a) | No portion of plan assets has been invested in shares of the Company’s common stock. |
| (in thousands) | ||||||||
| Reconciliation of Funded status at end of year |
2011 |
2010 |
||||||
| Fair value of plan assets |
$ | 27,906 | $ | 23,030 | ||||
| Projected benefit obligations |
36,852 | 33,778 | ||||||
| Funded status at end of year |
$ | (8,946) | $ | (10,748) | ||||
| Amount of asset or (liability) recognized at end of year |
$ | (8,946) | $ | (10,748) | ||||
61
Table of Contents
Frisch’s Restaurants, Inc. and Subsidiaries
NOTES TO CONSOLIDATED FINANCIAL STATEMENTS
Three years ended May 31, 2011
NOTE F - PENSION PLANS (continued)
| (in thousands) | ||||||||
| Funded status recognized in the consolidated balance sheet |
2011 |
2010 |
||||||
| Non-current asset |
$ | - | $ | - | ||||
| Current liability (b) |
(33) | - | ||||||
| Non-current liability (c) |
(8,913) | (10,748) | ||||||
|
|
|
|
|
|||||
| $ | (8,946) | $ | (10,748) | |||||
|
|
|
|
|
|||||
(b) Current liability for fiscal year 2011 consists of direct benefit payments expected to be paid from the unfunded SERP in fiscal year 2012.
(c) Non-current liability for fiscal year 2011 consists of $8,677,000 in underfunding of the two qualified defined benefit pension plans plus $236,000 for the unfunded SERP. Non-current liability for fiscal year 2010 consisted of $10,511,000 in underfunding of the two qualified defined benefit pension plans plus $237,000 for the unfunded SERP.
| (in thousands) | ||||||||
| Pretax amounts recognized in accumulated other comprehensive income or loss (AOCI) |
2011 |
2010 |
||||||
| Unrecognized net actuarial loss |
$ | 8,787 | $ | 12,006 | ||||
| Unrecognized prior service cost / (credit) |
(110 | ) | (102 | ) | ||||
|
|
|
|
|
|||||
| $ | 8,677 | $ | 11,904 | |||||
|
|
|
|
|
|||||
The estimated amounts that will be amortized from AOCI into net periodic pension cost in fiscal year 2012 are as follows:
| (in thousands) | ||||
| Net actuarial loss |
$ 875 | |||
| Prior service cost |
1 | |||
| $ 876 | ||||
The projected benefit obligation and fair value of plan assets for pension plans with a projected benefit obligation in excess of plan assets at the measurement date were as follows:
| (in thousands) | ||||||||
| 2011 |
2010 |
|||||||
| Projected benefit obligation at end of year |
$ | 36,852 | $ | 33,778 | ||||
| Fair value of plan assets at end of year |
27,906 | 23,030 | ||||||
62
Table of Contents
Frisch’s Restaurants, Inc. and Subsidiaries
NOTES TO CONSOLIDATED FINANCIAL STATEMENTS
Three years ended May 31, 2011
NOTE F - PENSION PLANS (continued)
The projected benefit obligation, accumulated benefit obligation and fair value of plan assets for pension plans with an accumulated benefit obligation in excess of plan assets at the measurement date were as follows:
| (in thousands) | ||||||||||||
| 2011 |
2010 |
|||||||||||
| Projected benefit obligation at end of year |
$ | 36,852 | $ | 33,778 | ||||||||
| Accumulated benefit obligation at end of year |
31,256 | 28,294 | ||||||||||
| Fair value of plan assets at end of year |
27,906 | 23,030 | ||||||||||
| (in thousands) | ||||||||||||
| Net periodic pension cost components |
2011 |
2010 |
2009 |
|||||||||
| Service cost |
$ | 1,926 | $1,515 | $1,614 | ||||||||
| Interest cost |
1,892 | 1,823 | 1,738 | |||||||||
| Expected return on plan assets |
(1,690 | ) | (1,573 | ) | (2,049 | ) | ||||||
| Amortization of prior service cost |
8 | 8 | 17 | |||||||||
| Amortization of net actuarial loss |
889 | 740 | 256 | |||||||||
| Curtailment loss recognized |
- | 49 | - | |||||||||
| Settlement loss recognized |
- | 256 | 238 | |||||||||
|
|
|
|
|
|
|
|||||||
| Net periodic pension cost |
$ | 3,025 | $ | 2,818 | $ | 1,814 | ||||||
|
|
|
|
|
|
|
|||||||
Net periodic pension cost for fiscal year 2012 is currently expected to approximate $2,754,000.
| (in thousands) | ||||||||||||
| Changes in other comprehensive income (pretax): |
2011 |
2010 |
2009 |
|||||||||
| Changes in plan assets and benefit obligations recognized in other comprehensive income: | ||||||||||||
| Current year actuarial (gain) loss |
$ | (2,330 | ) | $ | 2,905 | $ | 7,633 | |||||
| Current year prior service (credit) cost (d) |
- | - | (89 | ) | ||||||||
| Amounts recognized as a component of net periodic benefit cost: |
||||||||||||
| Settlements |
- | (256 | ) | (238 | ) | |||||||
| Amortization of actuarial loss |
(889 | ) | (740 | ) | (256 | ) | ||||||
| Curtailment effects |
- | (49 | ) | - | ||||||||
| Amortization of prior service cost |
(8 | ) | (8 | ) | (17 | ) | ||||||
|
|
|
|
|
|
|
|||||||
| Total recognized in other comprehensive income |
$ | (3,227 | ) | $ | 1,852 | $ | 7,033 | |||||
|
|
|
|
|
|
|
|||||||
| Total recognized in net periodic pension cost and other Comprehensive (income) loss | $ | (202 | ) | $ | 4,670 | $ | 8,847 | |||||
|
|
|
|
|
|
|
|||||||
(d) The Pension Protection Act required the basis (mortality table and interest rate) for determining lump sum payments to be changed. The new basis lowered the projected benefit obligation by $89,000 in fiscal year 2009.
63
Table of Contents
Frisch’s Restaurants, Inc. and Subsidiaries
NOTES TO CONSOLIDATED FINANCIAL STATEMENTS
Three years ended May 31, 2011
NOTE F - PENSION PLANS (continued)
| Weighted average assumptions |
May 31, 2011 |
June 1, 2010 |
June 2, |
|||||||||
| Discount rate - net periodic pension cost |
5.50% | 6.50% | 6.50% | |||||||||
| Discount rate - projected benefit obligation |
5.25% | 5.50% | 6.50% | |||||||||
| Rate of compensation increase - net periodic pension cost |
4.00% | 4.00% | 4.50% | |||||||||
| Rate of compensation increase - projected benefit obligation |
4.00% | 4.00% | 4.00% | |||||||||
| Expected long-term rate of return on plan assets |
7.50% | 8.00% | 8.00% | |||||||||
The Company determines its discount rate by looking at the plans’ projected future benefit payments by year and matching those to spot rates based on yields of high-grade corporate bonds over the term of projected benefit payments. A single discount rate is chosen, rounded to the nearest 25 basis points, that produces the same present value as the various spot rates.
To determine the expected return on plan assets, the Company looks at the target asset allocation of the plans’ trust and determines the expected return on each asset class. The expected returns for each asset class are combined and rounded to the nearest 25 basis points to determine the overall expected return on assets. The expected rate of return will remain at 7.50 percent for fiscal year 2012.
The following table shows the estimated future benefit payments for all three plans:
| (in thousands) | ||||||||
| 2012 | $ 2,367 | |||||||
| 2013 | 1,458 | |||||||
| 2014 | 1,303 | |||||||
| 2015 | 2,788 | |||||||
| 2016 | 1,454 | |||||||
| 2017-2021 | 15,066 | |||||||
Investment Policies and Asset Allocation
The objectives of the committee that sets investment policy for pension assets include holding, protecting and investing the assets prudently. The committee has determined that plan assets should be invested using long-term objectives, since the plan is intended to fund current and future benefits for participants and beneficiaries. Equity securities have provided the highest historical return to investors over extended time horizons. Thus, the bulk of the plan assets are targeted to be held in equity securities. Prudent investment strategies also call for a certain portion of the plan assets to be held in fixed return instruments. The Committee does not use derivative instruments to rebalance exposures to certain asset classes. Although not prohibited from doing so, the committee has chosen not to invest the plan assets in the common stock of the Company.
Target and actual pension plan assets are summarized as follows:
| Actual Allocations | ||||||||||||
| Asset Category |
Target | 2011 | 2010 |
|||||||||
| Equity securities |
70% | 75% | 65% | |||||||||
| Fixed income |
25% | 24% | 33% | |||||||||
| Cash equivalents |
5% | 1% | 2% | |||||||||
|
|
|
|
|
|
|
|||||||
| Total |
100% | 100% | 100% | |||||||||
|
|
|
|
|
|
|
|||||||
64
Table of Contents
Frisch’s Restaurants, Inc. and Subsidiaries
NOTES TO CONSOLIDATED FINANCIAL STATEMENTS
Three years ended May 31, 2011
NOTE F - PENSION PLANS (continued)
Funding
The Company contributes amounts to the two qualified defined benefit pension plans that are sufficient to satisfy legal funding requirements, plus discretionary tax-deductible amounts that may be deemed advisable. Contributions for fiscal year 2012 are currently anticipated at a level of $1,600,000, which includes amounts to meet minimum legal funding requirements, if any, to which discretionary contributions have been added. Obligations to participants in the SERP are satisfied in the form of a lump sum distribution upon the retirement of the participants. Aggregate payments from the SERP for fiscal year 2012 are currently estimated at $33,000.
Future funding of the qualified defined benefit pension plans largely depends upon the performance of investments that are held in trusts that have been established for the plans. Equity securities comprise 70 percent of the target allocation of the plans’ assets. Although equity markets made significant rebounds in fiscal years 2011 and 2010, the market losses experienced in fiscal year 2009 continue to adversely affect funding requirements and will likely require net periodic pension costs recognized in future years to remain much higher than historical levels.
Plan Assets at Fair Value
The Company uses fair value measurements for recording the assets of its defined benefit pension plans. Fair value is defined as the exchange price that would be received for an asset in its principal market in an orderly transaction between market participants on the measurement date. Assets of the plans are grouped into a three-level hierarchy for valuation techniques used to measure the fair values of the assets. These levels are:
| • | Level I – Quoted prices in active markets for identical assets. |
| • | Level II – Observable inputs other than Level I prices, such as quoted prices for similar assets; quoted prices in markets that are not active; or other inputs that are observable or can be corroborated by observable market data by correlation or other means. |
| • | Level III – Unobservable inputs that are supported by little or no market activity and that are significant to the fair value of the assets. |
The assets of the defined benefit pension plans include investments in mutual funds whose fair values are determined based on quoted market prices and are classified within Level I of the fair value hierarchy. Plan assets also include investments in money market funds, corporate and U.S. government bonds, guaranteed insurance contracts and foreign obligations that are based on other observable inputs and are classified within Level II of the fair value hierarchy. The following table summarizes the plan assets measured at fair value as of May 31, 2011 and June 1, 2010:
| (in thousands) | ||||||||||||||||||||||||
| 2011 |
2010 |
|||||||||||||||||||||||
| Level I | Level II | Level I | Level II | |||||||||||||||||||||
| Money market funds |
$ | - | $ | 215 | $ | - | $ | 507 | ||||||||||||||||
| U.S. treasury and agency obligations |
- | 557 | - | 891 | ||||||||||||||||||||
| Corporate obligations |
- | 4,098 | - | 4,604 | ||||||||||||||||||||
| Mutual funds |
21,572 | - | 15,383 | - | ||||||||||||||||||||
| Foreign obligations |
- | 911 | - | 1,035 | ||||||||||||||||||||
| Guaranteed insurance contracts |
- | 553 | - | 547 | ||||||||||||||||||||
|
|
|
|
|
|
|
|
|
|||||||||||||||||
| $ | 21,572 | $ | 6,334 | $ | 15,383 | $ | 7,584 | |||||||||||||||||
|
|
|
|
|
|
|
|
|
|||||||||||||||||
65
Table of Contents
Frisch’s Restaurants, Inc. and Subsidiaries
NOTES TO CONSOLIDATED FINANCIAL STATEMENTS
Three years ended May 31, 2011
NOTE F - PENSION PLANS (continued)
Other Post Retirement Plans
Compensation expense (not included in the above tables) relating to the Non Deferred Cash Balance Plan (see Benefit Plans in Note A – Accounting Policies) is equal to the amounts contributed, or expected to be contributed to the Plan – $477,000 in fiscal year 2011, $342,000 in fiscal year 2010 and $216,000 in fiscal year 2009. In addition, the President and Chief Executive Officer (CEO) has an employment agreement that calls for additional annual contributions to be made to the trust established for the benefit of the CEO under the Non Deferred Cash Balance Plan when certain levels of annual pretax earnings are achieved. Based on the Company’s pretax earnings, $55,000, $111,000 and 105,000, respectively, was included in the CEO’s incentive compensation for fiscal years 2011, 2010 and 2009.
The Company also sponsors two 401(k) defined contribution plans and a non-qualified Executive Savings Plan (FESP) for certain highly compensated employees who have been disqualified from participation in the 401(k) plans (see Benefit Plans in Note A – Accounting Policies). In fiscal years 2011, 2010 and 2009, matching contributions to the 401(k) plans amounted to $241,000, $179,000 and $164,000, respectively. Matching contributions to the FESP were $28,000, $27,000 and $25,000, respectively in fiscal years 2011, 2010 and 2009.
The Company does not sponsor post retirement health care benefits.
66
Table of Contents
Frisch’s Restaurants, Inc. and Subsidiaries
NOTES TO CONSOLIDATED FINANCIAL STATEMENTS
Three years ended May 31, 2011
NOTE G – SEGMENT INFORMATION
The Company has two reportable segments within the food service industry: Big Boy restaurants and Golden Corral restaurants. Financial information by operating segment is as follows:
| 2011 | 2010 | 2009 | ||||||||||
| (in thousands) | ||||||||||||
| Sales |
||||||||||||
| Big Boy |
$ | 201,717 | $ | 191,609 | $ | 193,623 | ||||||
| Golden Corral |
101,824 | 101,263 | 104,238 | |||||||||
|
|
|
|
|
|
|
|||||||
| $ | 303,541 | $ | 292,872 | $ | 297,861 | |||||||
|
|
|
|
|
|
|
|||||||
| Earnings (loss) before income taxes |
||||||||||||
| Big Boy |
$ | 20,575 | $ | 20,160 | $ | 19,672 | ||||||
| Opening expense |
(1,073 | ) | (768 | ) | (585 | ) | ||||||
|
|
|
|
|
|
|
|||||||
| Total Big Boy |
19,502 | 19,392 | 19,087 | |||||||||
| Total Golden Corral |
2,316 | 3,873 | 2,170 | |||||||||
|
|
|
|
|
|
|
|||||||
| Total restaurant level profit |
21,818 | 23,265 | 21,257 | |||||||||
| Administrative expense |
(8,330 | ) | (8,078 | ) | (7,654 | ) | ||||||
| Franchise fees and other revenue |
1,324 | 1,266 | 1,281 | |||||||||
| (Loss) gain on sale of assets |
(40 | ) | - | 1,163 | ||||||||
| Litigation settlement |
- | - | 890 | |||||||||
|
|
|
|
|
|
|
|||||||
| Operating Profit |
14,772 | 16,453 | 16,937 | |||||||||
| Interest expense |
(1,583 | ) | (1,748 | ) | (2,000 | ) | ||||||
|
|
|
|
|
|
|
|||||||
| $ | 13,189 | $ | 14,705 | $ | 14,937 | |||||||
|
|
|
|
|
|
|
|||||||
| Depreciation and amortization |
||||||||||||
| Big Boy |
$ | 9,933 | $ | 8,477 | $ | 8,097 | ||||||
| Golden Corral |
5,630 | 5,608 | 5,594 | |||||||||
|
|
|
|
|
|
|
|||||||
| $ | 15,563 | $ | 14,085 | $ | 13,691 | |||||||
|
|
|
|
|
|
|
|||||||
| Capital expenditures |
||||||||||||
| Big Boy |
$ | 17,149 | $ | 21,373 | $ | 14,759 | ||||||
| Golden Corral |
2,554 | 3,111 | 3,276 | |||||||||
|
|
|
|
|
|
|
|||||||
| $ | 19,703 | $ | 24,484 | $ | 18,035 | |||||||
|
|
|
|
|
|
|
|||||||
| Identifiable assets |
||||||||||||
| Big Boy |
$ | 125,784 | $ | 116,486 | $ | 102,886 | ||||||
| Golden Corral |
69,490 | 72,767 | 74,090 | |||||||||
|
|
|
|
|
|
|
|||||||
| $ | 195,274 | $ | 189,253 | $ | 176,976 | |||||||
|
|
|
|
|
|
|
|||||||
67
Table of Contents
Frisch’s Restaurants, Inc. and Subsidiaries
NOTES TO CONSOLIDATED FINANCIAL STATEMENTS
Three years ended May 31, 2011
NOTE H – COMMITMENTS AND CONTINGENCIES
Commitments
In the ordinary course of business, purchase commitments are entered into with certain of the Company’s suppliers. Most of these agreements are typically for periods of one year or less in duration; however, longer term agreements are also in place. Future minimum payments under these arrangements are $11,970,000, $4,883,000, $351,000, and $167,000 respectively, for fiscal years 2012, 2013, 2014 and 2015. These agreements are intended to secure favorable pricing while ensuring availability of desirable products. Management does not believe such agreements expose the Company to any significant risk.
Litigation - Open
The Company is subject to various claims and suits that arise from time to time in the ordinary course of business. Management does not presently believe that the resolution of any claims currently outstanding will materially affect the Company’s earnings, cash flows or financial position. Exposure to loss contingencies from pending or threatened litigation is continually evaluated by management, which believes adequate provisions for losses not covered by insurance are already included in the consolidated financial statements.
Litigation - Closed
In fiscal year 2010, the Company reached a settlement of all claims and counterclaims that had been asserted in six separate lawsuits involving the lessor of five properties on which five Big Boy restaurants are operated. In consideration of the settlement agreement, the lessor agreed to sell, and the Company agreed to purchase, the five properties for the total sum of $4,000,000. The real estate transactions were completed in September 2009.
In fiscal year 2009, the Company received a check for $640,000 representing full and final payment of the arbitration award in its long-standing case against the general contractor that had constructed a Golden Corral restaurant in Canton, Ohio in 2001, which the Company had to demolish in 2002 due to defective construction work by the contractor. In addition to the cash received, $250,000 was credited to earnings to reverse a liability that had represented the contractor’s claim against the Company for the outstanding contract balance, which was eliminated when the award was made final.
Other Contingencies
The Company self-insures a significant portion of expected losses under its workers’ compensation program in the state of Ohio. Insurance coverage is purchased from an insurance company for individual claims that may exceed $300,000. (See Self Insurance in Note A – Accounting Policies.) Insurance coverage is maintained for various levels of casualty and general and product liability.
Outstanding letters of credit maintained by the Company totaled $100,000 as of May 31, 2011.
As of May 31, 2011, the Company operated 22 restaurants on non-owned properties. (See Note C – Leased Properties.) Two of the leases provide for contingent rental payments based on a percentage of the leased restaurant’s sales in excess of a fixed amount.
The Company is secondarily liable for the performance of a ground lease that has been assigned to a third party. The annual obligation of the lease approximates $48,000 through 2020. Since there is no reason to believe that the third party will default, no provision has been made in the consolidated financial statements for amounts that would be payable by the Company. In addition, the Company has the right to re-assign the lease in the event of the third party’s default.
68
Table of Contents
Frisch’s Restaurants, Inc. and Subsidiaries
NOTES TO CONSOLIDATED FINANCIAL STATEMENTS
Three years ended May 31, 2011
NOTE I - RELATED PARTY TRANSACTIONS
The Chief Executive Officer of the Company (Craig F. Maier), who also serves as a director of the Company, owns a Big Boy restaurant licensed to him by the Company. Another officer and director of the Company (Karen F. Maier) is a part owner of a Big Boy restaurant that is licensed to her and her siblings (excluding Craig F. Maier). Until her death in September 2009, Blanche F. Maier (the mother of Craig F. Maier and Karen F. Maier) served as a director of the Company. Certain other family members of Mrs. Maier’s also own a licensed Big Boy restaurant.
These three restaurants are operated by the Company (not consolidated herein) and they pay to the Company franchise and advertising fees, employee leasing and other fees, and make purchases from the Company’s commissary. The total paid to the Company by these three restaurants amounted to $5,002,000, $4,915,000 and $4,982,000 respectively, in fiscal years 2011, 2010 and 2009. The amount owed to the Company from these restaurants was $57,000 and $86,000 respectively, as of May 31, 2011 and June 1, 2010. Amounts due are generally settled within 28 days of billing.
All related party transactions described above were effected on substantially similar terms as transactions with persons or entities having no relationship with the Company.
The Chairman of the Board of Directors from 1970 to 2005 (Jack C. Maier, deceased February 2005) had an employment agreement that contained a provision for deferred compensation. The agreement provided that upon its expiration or upon the Chairman’s retirement, disability, death or other termination of employment, the Company would become obligated to pay the Chairman or his survivors for each of the next 10 years the amount of $214,050, adjusted annually to reflect 50 percent of the annual percentage change in the Consumer Price Index (CPI). Monthly payments of $17,838 to the Chairman’s widow (Blanche F. Maier), a director of the Company until her death in September 2009, commenced in March 2005. On March 1, 2011, the monthly payment was increased to $19,149 from $19,006 in accordance with the CPI provision of the agreement. The present value of the long-term portion of the obligation to Mrs. Maier’s Estate, approximating $579,000 is included in the consolidated balance sheet under the caption “Deferred compensation and other.” The present value of the current portion of the obligation approximating $190,000 is included in current liabilities in the consolidated balance sheet.
69
Table of Contents
QUARTERLY EARNINGS
| Year Ended May 31, 2011 (Fiscal 2011) | Year Ended June 1, 2010 (Fiscal 2010) | |||||||||||||||||||||||||||||||
| (in thousands, except per share data) | (in thousands, except per share data) | |||||||||||||||||||||||||||||||
| Sales | Operating profit |
Net earnings |
Diluted net earnings per share |
Sales | Operating profit |
Net earnings |
Diluted net earnings per share |
|||||||||||||||||||||||||
| 1st Quarter |
$ | 92,926 | $ | 4,505 | $ | 2,741 | $ | 0.54 | $ | 88,982 | $ | 4,924 | $ | 2,988 | $ | 0.57 | ||||||||||||||||
| 2nd Quarter |
70,652 | 3,704 | 2,485 | 0.49 | 67,898 | 3,919 | 2,369 | 0.46 | ||||||||||||||||||||||||
| 3rd Quarter |
67,490 | 2,992 | 1,855 | 0.37 | 64,873 | 3,366 | 2,024 | 0.39 | ||||||||||||||||||||||||
| 4th Quarter |
72,473 | 3,571 | 2,392 | 0.48 | 71,119 | 4,244 | 2,618 | 0.51 | ||||||||||||||||||||||||
|
|
|
|
|
|
|
|
|
|
|
|
|
|
|
|
|
|||||||||||||||||
| Total |
$ | 303,541 | $ | 14,772 | $ | 9,473 | $ | 1.87 | $ | 292,872 | $ | 16,453 | $ | 9,999 | $ | 1.93 | ||||||||||||||||
|
|
|
|
|
|
|
|
|
|
|
|
|
|
|
|
|
|||||||||||||||||
The first quarter of each year contained 16 weeks, while the last three quarters each contained 12 weeks.
Quarterly diluted net earnings per share for Fiscal 2011 do not sum to the diluted net earnings per share
for the year due to changes throughout the year in the diluted weighted average shares outstanding.
Net earnings for the fourth quarter of Fiscal 2011 include a favorable adjustment of $205,000 resulting from lower
than anticipated settlement charges in one of the pension plans sponsored by the Company.
Net earnings for the fourth quarter of Fiscal 2011 include a favorable adjustment of $131,000 resulting from lower
than anticipated levels of accrued incentive compensation.
The fourth quarter of Fical 2011 included a favorable adjustment to income tax expense of $80,000 to reflect the
actual effective tax rate for the year.
70
Table of Contents
Item 9. Changes in and Disagreements with Accountants on Accounting and Financial Disclosure
None.
Item 9A. Controls and Procedures
(a) Effectiveness of Disclosure Controls and Procedures. The Company’s Chief Executive Officer (CEO) and Chief Financial Officer (CFO) reviewed and evaluated the effectiveness of the Company’s disclosure controls and procedures (as defined in Rules 13a-15(e) or 15d-15(e) under the Securities Exchange Act of 1934 (the “Exchange Act”)) as of May 31, 2011, the end of the period covered by this Annual Report on Form 10-K. Based on that evaluation, the CEO and CFO concluded that the Company’s disclosure controls and procedures were effective as of such date to ensure that information that would be required to be disclosed in the Company’s Exchange Act reports is (i) recorded, processed, summarized and reported within the time periods specified in Securities and Exchange Commission rules and forms, and (ii) would be accumulated and communicated to the Company’s management, including the CEO and CFO, as appropriate to allow timely decisions regarding required disclosures.
(b) Management’s Annual Report on Internal Control Over Financial Reporting. The Report of Management on Internal Control over Financial Reporting and the Report of the Independent Registered Public Accounting Firm thereon are set forth in Part II, Item 8 of this Annual Report on Form 10-K.
(c) Changes in Internal Control Over Financial Reporting. There were no changes in the Company’s internal control over financial reporting (as defined in Exchange Act Rules 13a-15(f) or 15d-15(f)) during the fourth quarter ended May 31, 2011 that materially affected, or are reasonably likely to materially affect, the Company’s internal control over financial reporting.
None.
(Items 10 through 13)
Item 10. Directors, Executive Officers and Corporate Governance
The Company has adopted a Code of Ethics that applies to its principal executive officer, principal financial officer, principal accounting officer, controller, members of the Disclosure Controls and Risk Management Committee and persons performing similar financial, accounting and public reporting functions. The Code of Ethics is available on the Company’s web site at www.frischs.com in the “Investor Relations” section under “Corporate Governance.” To receive a printed copy of the Code of Ethics at no cost, please contact Mark R. Lanning, Vice President-Finance, Frisch’s Restaurants, Inc. 2800 Gilbert Avenue, Cincinnati, Ohio 45206 – 1206. Email requests may be made to cfo@frischs.com. Also, any amendments to or waivers from the Code of Ethics will be disclosed on the Company’s web site within five business days following the date of amendment or waiver. There were no waivers of the Code of Ethics during the fiscal year ended May 31, 2011.
The information required by this item regarding executive officers appears in Item 1 of Part I of this Form 10-K under the caption “Executive Officers of the Registrant.”
All other information required by this item is incorporated by reference to the Registrant’s definitive proxy statement for the 2011 Annual Meeting of Shareholders.
Item 11. Executive Compensation
Information required by this item is incorporated by reference to the Registrant’s definitive proxy statement for the 2011 Annual Meeting of Shareholders.
71
Table of Contents
Item 12. Security Ownership of Certain Beneficial Owners and Management and Related Stockholder Matters
Information required by this item not otherwise disclosed below is incorporated by reference to the Registrant’s definitive proxy statement for the 2011 Annual Meeting of Shareholders.
Equity Compensation Plan Information
as of May 31, 2011
| (a) |
(b) |
(c) | ||||
| Plan Category |
Number of Securities to be issued upon exercise of outstanding options, warrants and rights | Weighted-average exercise price of outstanding options, warrants and rights | Number of securities remaining available for future issuance under equity compensation plans (excluding securities reflected in column (a))
| |||
| Equity compensation plans approved by security holders:
|
||||||
| 1993 Stock Option Plan | 200,169 | $20.65 | - | |||
| 2003 Stock Option and Incentive Plan | 261,671 | $24.81 | 511,881 | |||
| Total | 461,840 | $23.01 | 511,881
| |||
| Equity compensation plans not approved by security holders: | ||||||
|
Executive Savings Plan (1) |
39,249 | |||||
|
Senior Executive Bonus Plan (2) |
||||||
|
CEO Employment Agreement (3)
|
||||||
| Total |
461,840 | $23.01 | 551,130 | |||
(1) Frisch’s Executive Savings Plan
The Frisch’s Executive Savings Plan (FESP) provides a means for certain management employees who are disqualified from participating in the Frisch’s Employee 401(k) Savings Plan, to participate in a similarly designed non-qualified plan. Under the FESP, an eligible employee may choose to defer up to 25 percent of his or her salary, which may be invested in mutual funds or in common stock of the Company. For participants who choose to invest in the Company’s common stock, the Company makes a 15 percent matching contribution of common stock to the employee’s account, but only on the first 10 percent of salary deferred. All eligible FESP participants hired July 1, 2009 or after receive an enhanced match of 100 percent on the first 3 percent of compensation deferred into either mutual funds or common stock.
Upon an employee’s retirement, the Company has the option to issue to the employee the shares of common stock allocated to that employee or to pay to the employee the fair market value of the common stock allocated to him or her in cash. A reserve of 58,492 shares of common stock (as adjusted for subsequent changes in capitalization from the original authorization of 50,000 shares) was established for issuance under the FESP when it was established in November 1993. Since its inception, participants have cumulatively redeemed 19,243 shares through May 31, 2011.
72
Table of Contents
The current reserve balance of 39,249 shares contains 11,805 shares (including 2,266 shares allocated during the year ended May 31, 2011) that have been allocated but not issued to active plan participants.
(2) Senior Executive Bonus Plan
Under the Company’s Senior Executive Bonus Plan that was effective June 2, 2003, the Chief Operating Officer, the Chief Financial Officer and other non-operations executives are eligible to earn annual incentive bonuses of up to 40 percent of their annual base salary. Each executive’s incentive bonus is determined by a formula that takes into account: (1) the extent to which individual performance goals established prior to the beginning of the fiscal year are met, and (2) the Company’s pre-tax consolidated earnings for the fiscal year, as a percentage of total revenue (adjusted to exclude certain revenue, if any, not related to the Company’s food service operations). No incentive bonuses are paid unless pre-tax consolidated earnings of the Company are at least 4 percent of total revenue.
In order to receive the maximum incentive bonus permissible under the Plan, an executive must fully meet his or her individual performance goals and pre-tax consolidated earnings of the Company must equal or exceed 7 percent of revenue. Of the total incentive bonuses earned by each executive, 10 percent is paid in shares of the Company’s common stock (rounded down to the nearest whole share) and the remainder is paid in cash. For the fiscal year ended May 31, 2011, 489 shares of common stock were issued to employees pursuant to the Plan. All common stock issued must be held one year from the date of issue. If all eligible employees under the Senior Executive Bonus Plan had earned their maximum bonus during the year ended May 31, 2011, a total of 2,555 shares of common stock would have been issued.
(3) CEO Employment Agreement
During the fiscal year ended May 31, 2011, Craig F. Maier, President and Chief Executive Officer (CEO), was employed by the Company pursuant to a three-year employment agreement that commenced June 3, 2009. Under the terms of the agreement, the CEO is eligible for incentive compensation for each fiscal year that the Company’s pre-tax earnings equal or exceed 4 percent of the Company’s total revenue as reported in the Company’s annual report to shareholders. Pursuant to an amendment to that agreement effective April 6, 2011, the incentive compensation for the third and final year (June 1, 2011 through May 29, 2012) of the agreement is at risk and will not be paid unless approved by shareholders at the October 5, 2011 Annual Meeting of Shareholders.
Pre-tax earnings is defined as the amount reported in the annual report, but computed without reduction for: the CEO’s incentive compensation; the value of stock options and awards granted that are recognized as stock based compensation and deducted as an expense in calculating pre-tax earnings, and performance based bonuses paid under the Senior Executive Bonus Plan. The incentive compensation is equal to (a) 1.5 percent of the Company’s pre-tax earnings if in such year pre-tax earnings equal or exceed 4 percent (but are less than 5 percent) of the Company’s total revenue, and (b) an additional 1 percent of the Company’s pre-tax earnings if in such year the Company’s pre-tax earnings equal or exceed 5 percent of the Company’s total revenue. However, the incentive compensation will be reduced to the extent that the payment of the incentive compensation would reduce the Company’s pre-tax earnings to below 4 percent of the Company’s total revenue. Incentive compensation is paid 90 percent in cash and 10 percent in common stock (rounded down to the nearest whole share). Any common stock issued must be held for one year after the date of issue.
For the fiscal year ended May 31, 2011, an estimated 992 shares of common stock will be issued to Mr. Maier in August 2011, which represents 10 percent of the incentive compensation that he earned divided by the average value at which common shares of the Company were traded during the year.
Item 13. Certain Relationships and Related Transactions, and Director Independence
Information required by this item is incorporated by reference to the Registrant’s definitive proxy statement for the 2011 Annual Meeting of Shareholders.
Item 14. Principal Accounting Fees and Services
Information required by this item is incorporated by reference to the Registrant’s definitive proxy statement for the 2011 Annual Meeting of Shareholders.
73
Table of Contents
Item 15. Exhibits and Financial Statement Schedules
a). List of documents filed as part of this report.
| 1. | Financial Statements |
The following consolidated financial statements of the Registrant are contained in Part II, Item 8 of this Form 10-K.
Report of Independent Registered Public Accounting Firm (on Financial Statements)
Report of Independent Registered Public Accounting Firm (on Management’s Assessment of Internal Control over Financial Reporting)
Consolidated Balance Sheet – May 31, 2011 and June 1, 2010
Consolidated Statement of Earnings – Three fiscal years ended May 31, 2011
Consolidated Statement of Cash Flows – Three fiscal years ended May 31, 2011
Consolidated Statement of Shareholders’ Equity – Three fiscal years ended May 31, 2011
Notes to Consolidated Financial Statements – Three fiscal years ended May 31, 2011
| 2. | Financial Statement Schedules |
Financial statement schedules are not applicable or are not required under the related instructions or the information is included in the financial statements or the notes to the financial statements.
| 3. | Exhibits |
Articles of Incorporation and Bylaws
3.1 Third Amended Articles of Incorporation, which was filed as Exhibit (3) (a) to the Registrant’s Form 10-K Annual Report for 1993, is incorporated herein by reference.
3.2 Amended and Restated Code of Regulations effective October 2, 2006, which was filed as Exhibit A to the Registrant’s Definitive Proxy Statement dated September 1, 2006, is incorporated herein by reference.
Material Contracts
10.1 Amended and Restated Loan Agreement between the Registrant and US Bank NA dated October 21, 2010, which was filed as Exhibit 10.1 to the Registrant’s Form 10-Q Quarterly Report for September 21, 2010, is incorporated herein by reference.
10.2 Agreement to Purchase Stock between the Registrant and Frisch West Chester, Inc. dated June 1, 1988, which was filed as Exhibit 10 (f) to the Registrant’s Form 10-Q Quarterly Report for September 19, 2006, is incorporated herein by reference.
10.3 Agreement to Purchase Stock between the Registrant and Frisch Hamilton West, Inc. dated February 19, 1988, which was filed as Exhibit 10 (g) to the Registrant’s Form 10-Q Quarterly Report for September 19, 2006, is incorporated herein by reference.
74
Table of Contents
Material Contracts - Compensatory Plans or Agreements
10.50 Employment Agreement between the Registrant and Craig F. Maier effective June 3, 2009, dated April 10, 2009, which was filed as Exhibit 10.16 to the Registrant’s Form 10-Q Quarterly Report for March 10, 2009, is incorporated herein by reference.
10.51 Amendment to Employment Agreement between the Registrant and Craig F. Maier effective April 6, 2011, which was filed as Exhibit 99.1 to the Registrant’s Form 8-K Current Report dated April 6, 2011, is incorporated herein by reference.
10.52 Frisch’s Executive Retirement Plan (SERP) effective June 1, 1994, which was filed as Exhibit (10) (b) to the Registrant’s Form 10-Q Quarterly Report for September 17, 1995, is incorporated herein by reference.
10.53 Amendment No. 1 to Frisch’s Executive Retirement Plan (SERP) (see Exhibit 10.52 above) effective January 1, 2000, which was filed as Exhibit 10 (k) to the Registrant’s form 10-K Annual Report for 2003, is incorporated herein by reference.
10.54 2003 Stock Option and Incentive Plan, which was filed as Appendix A to the Registrant’s Proxy Statement dated August 28, 2003, is incorporated herein by reference.
10.55 Amendment # 1 to the 2003 Stock Option and Incentive Plan (see Exhibit 10.54 above) effective September 26, 2006, which was filed as Exhibit 10 (q) to the Registrant’s Form 10-Q Quarterly Report for September 19, 2006, is incorporated herein by reference.
10.56 Amendments to the 2003 Stock Option and Incentive Plan (see Exhibits 10.54 and 10.55 above) effective December 19, 2006, which was filed as Exhibit 99.2 to the Registrant’s Form 8-K Current Report dated December 19, 2006, is incorporated herein by reference.
10.57 Amendments to the 2003 Stock Option and Incentive Plan (see Exhibits 10.54, 10.55 and 10.56 above) adopted October 7, 2008, which was filed as Exhibit 10.21 to the Registrant’s Form 10-Q Quarterly Report for September 23, 2008, is incorporated herein by reference.
10.58 Forms of Agreement to be used for stock options granted to employees and to non-employee directors under the Registrant’s 2003 Stock Option and Incentive Plan (see Exhibits 10.54, 10.55, 10.56 and 10.57 above), which was filed as Exhibits 99.1 and 99.2 to the Registrant’s Form 8-K dated October 1, 2004, are incorporated herein by reference.
10.59 Restricted Stock Agreement to be used for restricted stock granted to non-employee members of the Board of Directors under the Registrant’s 2003 Stock Option and Incentive Plan (see Exhibits 10.54, 10.55, 10.56 and 10.57 above), which was filed as Exhibit 10.58 to the Registrant’s Form 10-Q Quarterly Report for September 21, 2010, is incorporated herein by reference.
10.60 Restricted Stock Agreement to be used for restricted stock granted to key employees under the Registrant’s 2003 Stock Option and Incentive Plan (see Exhibits 10.54, 10.55, 10.56 and 10.57 above), is filed herewith.
10.61 Unrestricted Stock Agreement to be used for unrestricted stock granted to employees (between the Registrant and Craig F. Maier dated June 15, 2011) under the Registrant’s 2003 Stock Option and Incentive Plan (see Exhibits 10.54, 10.55, 10.56 and 10.57 above), is filed herewith.
10.62 Amended and Restated 1993 Stock Option Plan, which was filed as Exhibit A to the Registrant’s Proxy Statement dated September 9, 1998, is incorporated herein by reference.
10.63 Amendments to the Amended and Restated 1993 Stock Option Plan (see Exhibit 10.62 above) effective December 19, 2006, which was filed as Exhibit 99.1 to the registrant’s Form 8-K Current Report dated December 19, 2006, is incorporated herein by reference.
75
Table of Contents
10.64 Employee Stock Option Plan, which was filed as Exhibit B to the Registrant’s Proxy Statement dated September 9, 1998, is incorporated herein by reference.
10.65 Change of Control Agreement between the Registrant and Craig F. Maier dated November 21, 1989, which was filed as Exhibit (10) (g) to the Registrant’s Form 10-K Annual Report for 1990, is incorporated herein by reference. It was also filed as Exhibit 99.2 to the Registrant’s Form 8-K Current Report dated March 17, 2006, which is also incorporated herein by reference.
10.66 First Amendment to Change of Control Agreement (see Exhibit 10.65 above) between the Registrant and Craig F. Maier dated March 17, 2006, which was filed as Exhibit 99.1 to the Registrant’s Form 8-K Current Report dated March 17, 2006, is incorporated herein by reference.
10.67 Second Amendment to Change of Control Agreement (see Exhibits 10.65 and 10.66 above) between the Registrant and Craig F. Maier dated October 7, 2008, which was filed as Exhibit 99.1 to the Registrant’s Form 8-K Current Report dated October 7, 2008, is incorporated herein by reference.
10.68 Frisch’s Nondeferred Cash Balance Plan effective January 1, 2000, which was filed as Exhibit (10) (r) to the Registrant’s Form 10-Q Quarterly Report for December 10, 2000, is incorporated herein by reference, together with the Trust Agreement established by the Registrant between the Plan’s Trustee and Donald H. Walker (Grantor). There are identical Trust Agreements between the Plan’s Trustee and Craig F. Maier, Rinzy J. Nocero, Karen F. Maier, Michael E. Conner, Louie Sharalaya, Lindon C. Kelley, Michael R. Everett, James I. Horwitz, William L. Harvey and certain other “highly compensated employees” (Grantors).
10.69 First Amendment (to be effective June 6, 2006) to the Frisch’s Nondeferred Cash Balance Plan that went into effect January 1, 2000 (see Exhibit 10.68 above), which was filed as Exhibit 99.2 to the Registrant’s Form 8-K Current Report dated June 7, 2006, is incorporated herein by reference.
10.70 Senior Executive Bonus Plan effective June 2, 2003, which was filed as Exhibit (10) (s) to the Registrant’s Form 10-K Annual Report for 2003, is incorporated herein by reference.
10.71 Non-Qualified Deferred Compensation Plan, Basic Plan Document to Restate Frisch’s Executive Savings Plan (FESP) effective December 31, 2008, (also see Exhibits 10.72, 10.73 and 10.74), which was filed as Exhibit 10.32 to the Registrant’s Form 10-Q Quarterly Report for September 23, 2008, is incorporated herein by reference.
10.72 Non-Qualified Deferred Compensation Plan, Adoption Agreement (Stock) to Restate Frisch’s Executive Savings Plan (FESP) effective December 31, 2008, (also see Exhibits 10.71, 10.73 and 10.74), which was filed as Exhibit 10.33 to the Registrant’s Form 10-Q Quarterly Report for September 23, 2008, is incorporated herein by reference.
10.73 Non-Qualified Deferred Compensation Plan, Adoption Agreement (Mutual Funds) to Restate Frisch’s Executive Savings Plan (FESP) effective December 31, 2008, (also see Exhibits 10.71, 10.72 and 10.74), which was filed as Exhibit 10.34 to the Registrant’s Form 10-Q Quarterly Report for September 23, 2008, is incorporated herein by reference.
10.74 Non-Qualified Deferred Compensation Plan, Adoption Agreement to Restate Frisch’s Executive Savings Plan (FESP) effective July 1, 2009 (also see Exhibits 10.71, 10.72 and 10.73), which was filed as Exhibit 10.36 to the Registrant’s Form 10-K Annual Report for 2009, is incorporated herein by reference.
76
Table of Contents
Other Exhibits
14 Code of Ethics is filed herewith.
21 Subsidiaries of the Registrant is filed herewith.
23 Consent of Grant Thornton LLP is filed herewith.
31.1 Certification of Chief Executive Officer pursuant to Securities Exchange Act of 1934 Rule 13a-14(a) or 15d-14(a) is filed herewith.
31.2 Certification of Chief Financial Officer pursuant to Securities Exchange Act Rule of 1934 Rule 13a-14(a) or 15d-14(a) is filed herewith.
32.1 Section 1350 Certification of Chief Executive Officer is filed herewith.
32.2 Section 1350 Certification of Chief Financial Officer is filed herewith.
77
Table of Contents
Pursuant to the requirements of Section 13 or 15(d) of the Securities Exchange Act of 1934, the Registrant has duly caused this Report to be signed on its behalf by the undersigned, thereunto duly authorized.
FRISCH’S RESTAURANTS, INC. (Registrant)
| By | /s/ Donald H. Walker |
July 19, 2011 | ||||||
| Donald H. Walker, Vice President, |
Date | |||||||
| Chief Financial Officer, Principal Financial Officer, and |
||||||||
| Principal Accounting Officer |
||||||||
Pursuant to the requirements of the Securities Exchange Act of 1934, this report has been signed below by the following persons on behalf of the Registrant and in the capacities and on the dates indicated:
| Signature | Title |
Date | ||||
| Chairman of the Board |
||||||
| /s/ Daniel W. Geeding |
Director |
July 27, 2011 | ||||
| Daniel W. Geeding |
||||||
| President and Chief Executive Officer |
||||||
| /s/ Craig F. Maier |
Director |
July 27, 2011 | ||||
| Craig F. Maier |
||||||
| /s/ Dale P. Brown |
Director |
July 27, 2011 | ||||
| Dale P. Brown |
||||||
| /s/ RJ Dourney |
Director |
July 27, 2011 | ||||
| RJ Dourney |
||||||
| /s/ Lorrence T. Kellar |
Director |
July 27, 2011 | ||||
| Lorrence T. Kellar |
||||||
| /s/ Karen F. Maier |
Director |
July 27, 2011 | ||||
| Karen F. Maier |
||||||
| /s/ Jerome P. Montopoli |
Director |
July 27, 2011 | ||||
| Jerome P. Montopoli |
||||||
| /s/ William J. Reik, Jr. |
Director |
July 27, 2011 | ||||
| William J. Reik, Jr. |
||||||
| /s/ Donald H. Walker |
Director |
July 19, 2011 | ||||
| Donald H. Walker |
||||||
78