Attached files
| file | filename |
|---|---|
| 8-K - FIRST MERCHANTS CORPORATION - 2ND QTR 2011 - EARNINGS - FIRST MERCHANTS CORP | f8kearningslides06302011.htm |

1
2nd Quarter 2011 Earnings Call
July 28, 2011

2
Michael C. Rechin
President
and Chief Executive Officer

3
Forward-Looking Statement
The Corporation may make forward-looking statements about its
relative business outlook. These forward-looking statements and all
other statements made during this meeting that do not concern
historical facts are subject to risks and uncertainties that may
materially affect actual results.
Specific forward-looking statements include, but are not limited to,
any indications regarding the financial services industry, the economy
and future growth of the balance sheet or income statement.
Please refer to our press releases, Form 10-Qs and 10-Ks concerning
factors that could cause actual results to differ materially from any
forward-looking statements.

4
2nd Quarter 2011 Highlights
§ Second quarter earnings of $4.5M, or $.18 per common
share
share
§ Core business profitability solidifying through:
§ Margin and net interest income expansion
§ Increasing commercial loan demand
§ Additional revenue-generating staff
§ Improvement in asset quality continues
§ Loan loss reserve ample for projected future losses at
2.83% of total loans
2.83% of total loans

5
Mark K. Hardwick
Executive Vice President
and Chief Financial Officer

6
2009 2010 Q1-’11 Q2-’11
1. Investments $ 563 $ 827 $ 886 $ 938
2. Loans 3,278 2,857 2,766 2,729
3. Allowance (92) (83) (81) (77)
4. CD&I & Goodwill 159 154 153 152
5. BOLI 95 97 102 103
6. Other 478 319 291 249
7. Total Assets $4,481 $4,171 $4,117 $4,094
($ in Millions)
TOTAL ASSETS
7
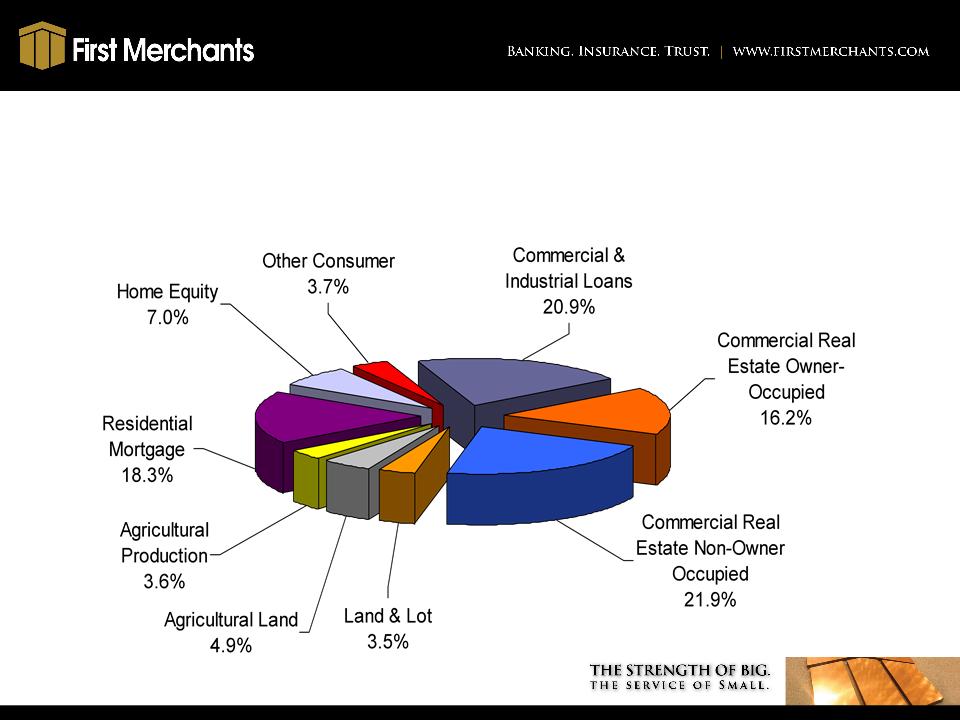
(as of 6/30/2011)
YTD Yield = 5.51%
Total = $2.7B
LOAN PORTFOLIO
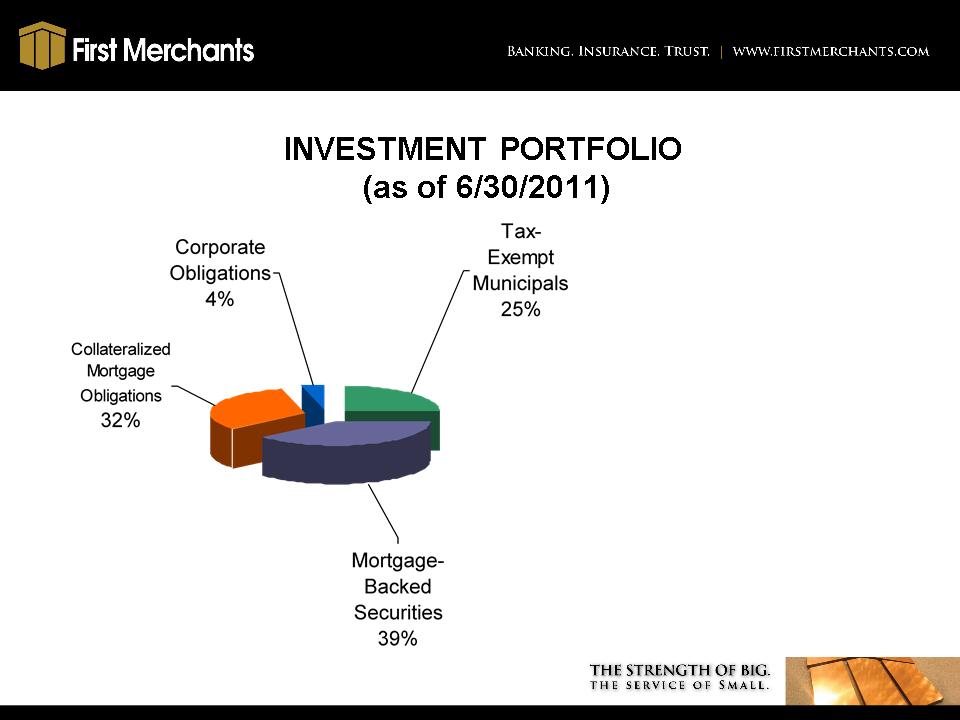
8
§ $938 Million Balance
§ Average duration - 4.5 years
§ Tax equivalent yield of 4.08%
§ Net unrealized gain of $14.6
million
million

9
2009 2010 Q1-’11 Q2-’11
1. Customer Non-Maturity
Deposits $2,042 $2,127 $2,083 $2,114
2. Customer Time Deposits 1,220 996 943 890
3. Brokered Deposits 275 146 126 139
4. Borrowings 339 277 305 306
5. Other Liabilities 30 28 56 35
6. Hybrid Capital 111 142 142 142
7. Preferred Stock (CPP) 112 68 68 68
8. Common Equity 352 387 394 400
9. Total Liabilities and Capital $4,481 $4,171 $4,117 $4,094
($ in Millions)
TOTAL LIABILITIES AND CAPITAL
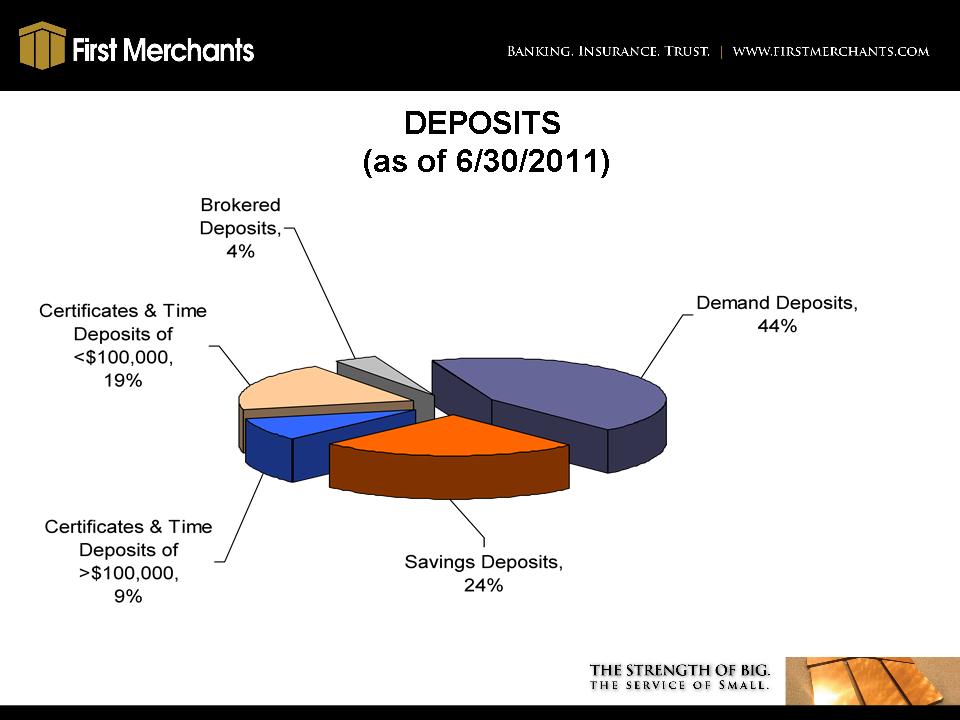
10
YTD Cost = .98%
Total = $3.1B

11
2009 2010 Q1-’11 Q2-’11
1. Total Risk-Based
Capital Ratio 13.04% 15.74% 15.66% 16.05%
2. Tier 1 Risk-Based
Capital Ratio 10.32% 12.82% 13.05% 13.42%
3. Leverage Ratio 8.20% 9.50% 9.80% 9.94%
4. Tier 1 Common Risk-
Based Capital Ratio 5.40% 7.64% 7.75% 8.07%
5. TCE/TCA 4.54% 5.86% 6.16% 6.36%
CAPITAL RATIOS
12
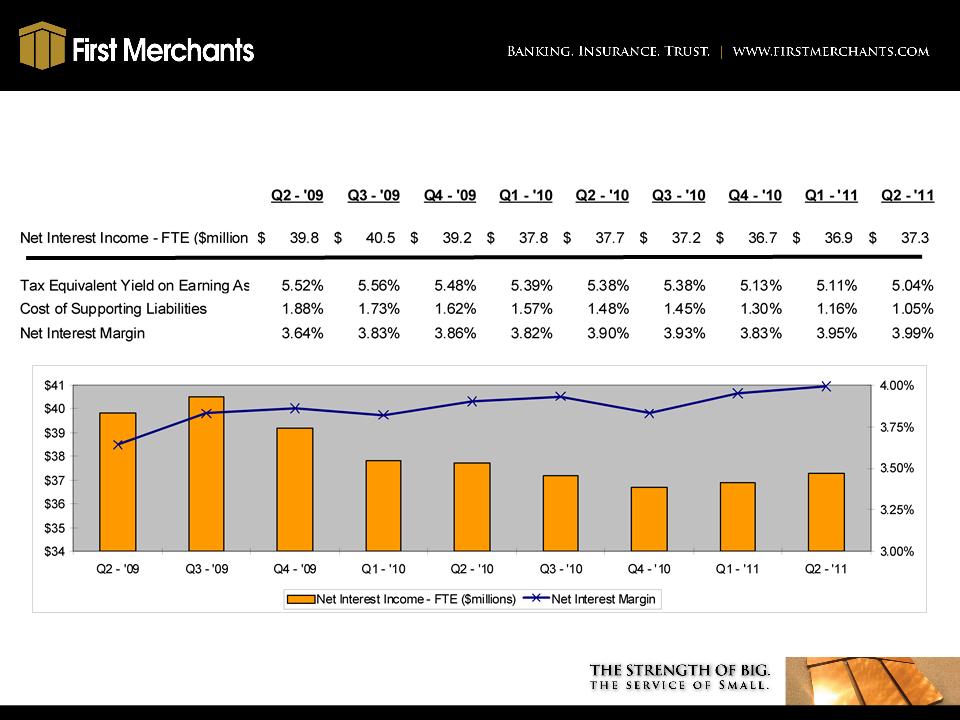
NET INTEREST MARGIN
13
2009 2010 Q1-’11 Q2-’11
1. Service Charges on Deposit Accounts $15.1 $13.3 $ 2.8 $ 3.0
2. Trust Fees 7.4 7.7 2.0 1.9
3. Insurance Commission Income 6.4 6.2 1.9 1.0
4. Electronic Card Fees 4.9 6.1 1.5 1.7
5. Cash Surrender Value of Life Ins 1.6 2.1 0.6 0.6
6. Gains on Sales Mortgage Loans 6.8 6.8 1.9 1.0
7. Securities Gains/Losses 4.4 1.9 0.1 0.8
8. Other 4.6 4.4 1.1 1.1
9. Total $51.2 $48.5 $11.9 $11.1
10. Adjusted Non-Interest Income1 $46.5 $46.6 $11.8 $10.3
1Adjusted for gains and losses in bond portfolio and one-time mortgage sale
($ in Millions)
NON-INTEREST INCOME

14
NON-INTEREST EXPENSE
2009 2010 Q1-’11 Q2-’11
1. Salary & Benefits $76.3 $73.3 $17.2 $18.6
2. Premises & Equipment 17.9 17.2 4.5 4.1
3. Core Deposit Intangible 5.1 4.7 1.1 1.1
4. Professional Services 1.3 1.4 0.6 0.5
5. OREO/Credit-Related Expense 12.9 14.6 3.2 2.8
6. FDIC Expense 10.4 8.1 2.1 1.5
7. FHLB Prepayment Penalties 1.9 ― ― ―
8. Outside Data Processing 6.2 5.1 1.4 1.5
9. Marketing 2.1 2.0 0.4 0.4
10. Other 17.5 15.9 3.4 3.9
11. Total $151.6 $142.3 $33.9 $34.4
12. Adjusted Non-Interest Expense 2 $134.7 $127.7 $30.7 $31.6
1Credit-related professional services are reclassed to OREO/credit-related expenses
2Adjusted for the FDIC special assessment, FHLB prepayment penalties & OREO
expense & credit-related professional services
($ in Millions)
1
1
15
2009 2010 Q1-’11 Q2-’11
1. Net Interest Income-FTE $159.1 $149.4 $ 36.9 $ 37.3
2. Non Interest Income1 46.5 46.6 11.8 10.3
3. Non Interest Expense2 (134.7) (127.7) (30.7) (31.6)
4. Pre-Tax Pre-Provision Earnings $ 70.9 $ 68.3 $ 18.0 $ 16.0
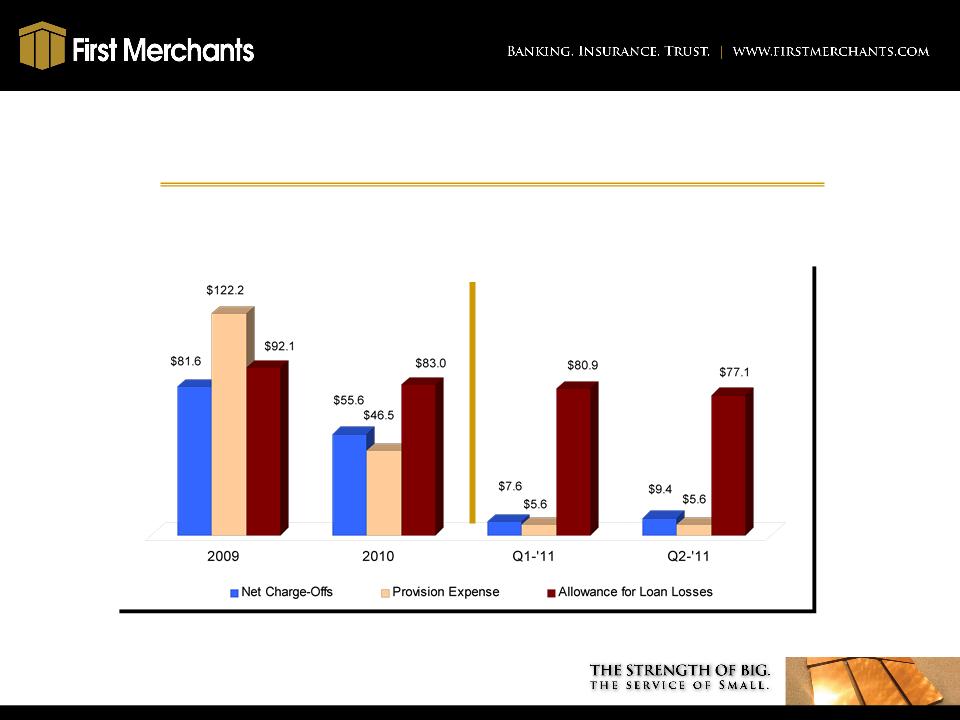
5. Provision (122.2) (46.5) (5.6) (5.6)
6. Adjustments (12.1) (12.7) (3.1) (2.0)
7. Taxes - FTE 22.7 (2.3) (3.8) (2.9)
8. Gain on Exchange of Preferred
Stock for Trust Preferred Debt — 10.1 — —
9. CPP Dividend (5.0) (5.2) (1.0) (1.0)
10. Net Income Avail. for Distribution ($45.7) $11.7 $ 4.5 $ 4.5
11. EPS ($2.17) $0.48 $ .17 $ .18
1Adjusted for gains and losses in bond portfolio and one-time mortgage sale
2Adjusted for the FDIC special assessment, FHLB prepayment penalties & OREO
expense & credit-related professional services
($ in Millions)
EARNINGS

16
John J. Martin
Senior Vice President
and Chief Credit Officer

17
PORTFOLIO OVERVIEW
2nd Quarter Highlights
§ Continued reduction in Criticized and Classified Assets coupled with
reduction in impaired loans
reduction in impaired loans
§ Stabilized Non-Accrual and Non-Performing Assets
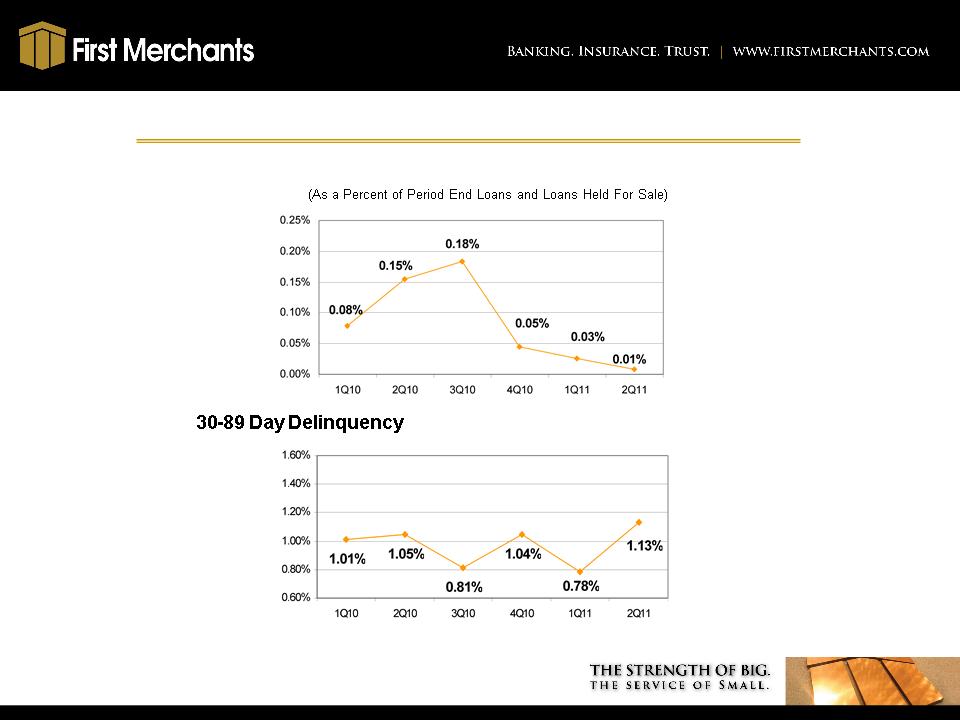
§ Improving 90+ day delinquency. Increase in 30-89 day delinquent
loans related to two matured relationships totaling $9.4 million. One
resolved and the other in the process of resolution
loans related to two matured relationships totaling $9.4 million. One
resolved and the other in the process of resolution
§ Allowance declined from $80.9 million to $77.1 million in line with
improvement in portfolio and $2.1 million reduction in specific
reserves.
improvement in portfolio and $2.1 million reduction in specific
reserves.
18
NON-ACCRUAL TREND
Q2-’10
Q3-’10
Q4-’10
Q1-’11
NON-ACCRUAL LOANS BY CATEGORY
Commercial & Industrial
3.55%
3.19%
1.75%
1.55%
3.69%
$21.1
Construction & Land Development
8.91%
6.25%
16.10%
14.76%
14.66%
14.1
Commercial Mortgage
4.74%
4.22%
3.69%
3.66%
2.88%
33.8
Agricultural Production and Other Commercial
1.27%
0.64%
0.57%
1.06%
0.91%
0.9
Total Commercial
4.43%
3.84%
3.66%
3.52%
3.61%
$69.9
Residential Mortgage
3.86%
3.26%
2.78%
3.21%
2.99%
$14.9
Home Equity
1.74%
1.39%
1.31%
1.31%
1.42%
2.8
Other Consumer
0.00%
0.01%
0.00%
0.03%
0.00%
0.0
Total Consumer and
Residential Mortgage
2.83%
2.36%
2.05%
2.32%
2.24%
$17.7
Total Consumer and Commercial
3.93%
3.37%
3.17%
3.17%
3.21%
$87.6
(% of period end total loans by category and loans held for sale)
Q2-’11
(in millions)
Q2-’11
19
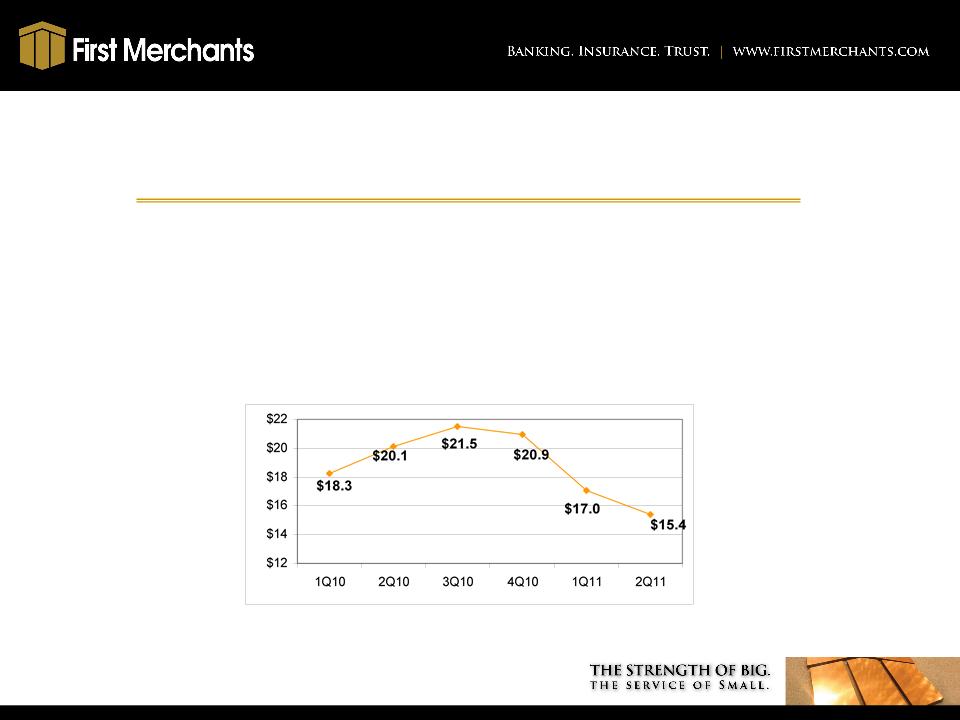
OTHER REAL ESTATE OWNED
|
|
Commercial
Real Estate
|
Land &
Construction |
1-4 Family
|
Total
|
|
Book Balance
|
$ 4.8
|
$ 7.4
|
$ 3.2
|
$15.4
|
|
% ORE
|
31.0%
|
48.1%
|
20.9%
|
100.0%
|
($ in millions)
20
LOAN DELINQUENCY TRENDS
90+ Day Delinquency

21
LOAN CHARGE-OFF TREND
Q2-’10
Q3-’10
Q4-’10
Q1-’11
Q2-’11
NET CHARGE-OFFS BY CATEGORY
Commercial & Industrial
4.65%
3.22%
2.69%
0.30%
( 1.72%)
Construction/Land Development
5.10%
4.14%
4.27%
9.96%
10.78%
Commercial Mortgage
1.98%
2.44%
2.18%
1.15%
2.33%
Agricultural Production and Other
Commercial
Commercial
1.18%
1.36%
1.04%
0.00%
(0.33%)
Total Commercial
2.88%
2.69%
2.39%
1.32%
1.42%
Residential Mortgage
0.79%
1.09%
1.12%
0.27%
0.72%
Home Equity
0.71%
1.04%
0.25%
1.11%
1.24%
Other Consumer
0.96%
1.15%
1.28%
1.13%
0.60%
Total Consumer and
Residential Mortgage
Residential Mortgage
0.79%
1.09%
0.94%
0.59%
0.83%
(Annualized year-to-date net charge-offs by category as a % of period end total loans plus loans held for sale)

22
NON-PERFORMING ASSET RECONCILIATION
|
|
Q3-’10
|
Q4-’10
|
Q1-’11
|
Q2-’11
|
|
Beginning Balance NPAs & 90+ Days Delinquent ($ in millions)
|
$ 146.5
|
$ 130.8
|
$ 120.0
|
$107.6
|
|
Non-Accrual
|
|
|
|
|
|
Add: New Non-Accruals
|
$ 15.5
|
$ 27.4
|
$ 11.7
|
$ 26.7
|
|
Less: To Accrual/Payoff/Restructured
|
( 18.6)
|
( 14.5)
|
( 3.2)
|
( 8.3)
|
|
Less: To OREO
|
( 6.7)
|
( 7.0)
|
( 2.0)
|
( 1.6)
|
|
Less: Charge-offs (includes write-downs for transfer to OREO)
|
( 11.8)
|
(13.9)
|
( 9.4)
|
(16.9)
|
|
Increase /(Decrease): Non-Accrual Loans
|
($ 21.6)
|
($ 8.0)
|
($ 2.9)
|
($ .1)
|
|
Other Real Estate Owned (ORE)
|
|
|
|
|
|
Add: New ORE Properties
|
$ 6.6
|
$7.2
|
$ 2.2
|
$ 1.6
|
|
Less: ORE Sold
|
(3.8)
|
( 4.2)
|
( 3.6)
|
( 1.6)
|
|
Less: ORE Losses (write-downs)
|
( 1.4)
|
( 3.6)
|
( 2.5)
|
( 1.6)
|
|
Increase /(Decrease): ORE
|
$ 1.4
|
($ .60)
|
($ 3.9)
|
($ 1.6)
|
|
Increase /(Decrease): 90 Days Delinquent
|
$ 0.8
|
($ 4.0)
|
($ 0.6)
|
($ 0.5)
|
|
Increase /(Decrease): Restructured/Renegotiated Loans
|
$ 3.7
|
$ 1.8
|
($ 5.0)
|
$ 4.1
|
|
Total NPA Change
|
$(15.7)
|
($ 10.8)
|
($ 12.4)
|
$ 1.9
|
|
Ending Balance NPAs & 90+ Days Delinquent
|
$ 130.8
|
$ 120.0
|
$ 107.6
|
$ 109.5
|
23
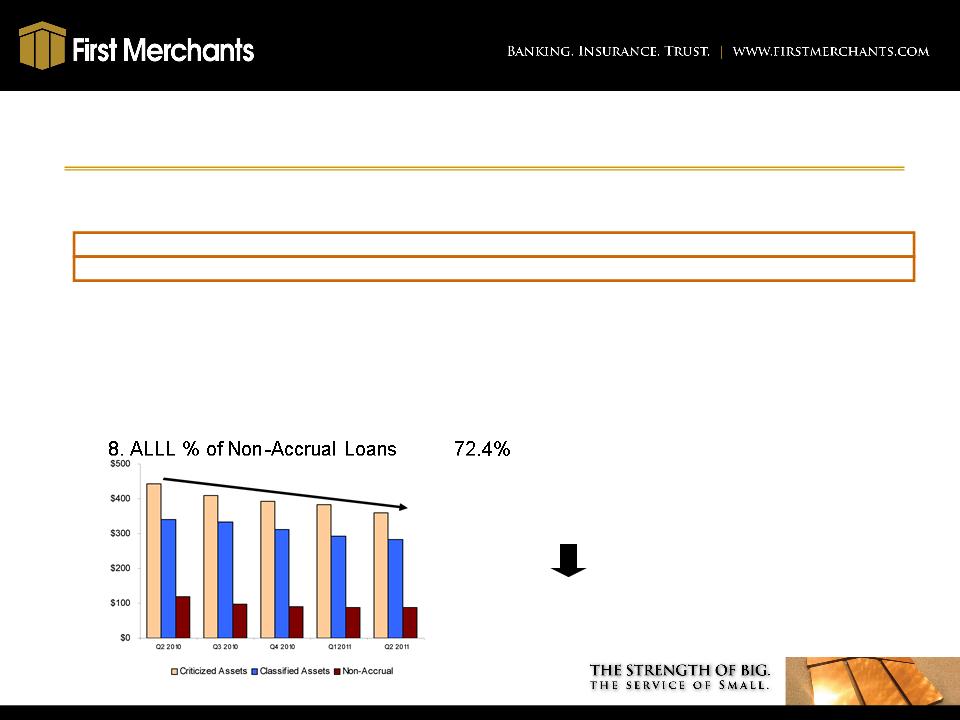
IMPROVEMENT AND STABILIZATION IN CREDIT METRICS
|
|
Q2-’10
|
Q3-’10
|
Q4-’10
|
Q1-’11
|
Q2-’11
|
|
1. Classified Assets
|
$341.6
|
$334.2
|
$313.0
|
$293.8
|
$282.2
|
|
2. Criticized Assets (includes Classified)
|
442.9
|
408.6
|
393.0
|
383.7
|
360.5
|
|
3. 90 day Delinquent Loans
|
4.5
|
5.3
|
1.3
|
.8
|
.2
|
|
4. Non-Accrual Loans
|
120.2
|
98.6
|
90.6
|
87.7
|
87.6
|
|
5. Impaired Loans
|
150.6
|
125.7
|
116.2
|
116.8
|
108.3
|
|
6. Specific Reserves
|
18.4
|
14.9
|
13.9
|
15.8
|
13.7
|
|
7. Allowance for Loan and Lease
Losses |
87.0
|
83.7
|
83.0
|
80.9
|
77.1
|
|
84.9%
|
91.6%
|
92.3%
|
88.1%
|
||
|
|
|
|
|
($ in millions)
Allowance for Loan and
Lease Losses down 11.3%
Lease Losses down 11.3%
Criticized Assets Down 18.6%
Classified Assets Down 17.4%
Non-Accrual Loans Down 27.1%
Classified Assets Down 17.4%
Non-Accrual Loans Down 27.1%
24
NET CHARGE-OFFS, PROVISION AND ALLOWANCE
($ in millions)

25
Michael C. Rechin
President
and Chief Executive Officer

26
Overview of 2011 Strategy and Tactics
“Strengthen and Grow”
“Strengthen and Grow”
§ Implement systems to standardize and accelerate
small business opportunities.
small business opportunities.
§ Preserve margin while intensifying revenue activity
using market coverage tactics and the addition of
revenue-generating staff in key markets.
using market coverage tactics and the addition of
revenue-generating staff in key markets.
§ Realize investment in online and mobile banking.
§ Continue to improve asset quality, reduce credit costs,
and maximize resolutions.
and maximize resolutions.

27
Contact Information
First Merchants Corporation common stock is
traded on the NASDAQ Global Select Market
under the symbol FRME.
traded on the NASDAQ Global Select Market
under the symbol FRME.
Additional information can be found at
www.firstmerchants.com
Investor inquiries:
David L. Ortega
Investor Relations
Telephone: 765.378.8937
dortega@firstmerchants.com