Attached files
| file | filename |
|---|---|
| 8-K - SUNOCO LOGISTICS PARTNERS L.P. -- FORM 8-K - Energy Transfer Operating, L.P. | d8k.htm |
| EX-99.1 - PRESS RELEASE - Energy Transfer Operating, L.P. | dex991.htm |
 Second Quarter 2011
Earnings Conference Call
July 26, 2011
Sunoco Logistics Partners L.P.
Exhibit 99.2 |
 Forward-Looking Statements
You should review this slide presentation in conjunction with the second
quarter 2011 earnings conference call for Sunoco Logistics Partners
L.P., held on July 26 at 5:00 p.m. ET. You may listen to the
audio
portion
of
the
conference
call
on
our
website
at
www.sunocologistics.com
or
by
dialing
(USA
toll-
free) 888-889-4955. International callers should dial
312-470-0130. Please enter Conference ID “Sunoco
Logistics.”
Audio replays of the conference call will be available for two weeks
after the conference call beginning approximately two hours
following the completion of the call. To access the replay, dial 800-239-
4499. International callers should dial 402-220-9696.
During the call, those statements we make that are not historical facts
are forward-looking statements. These forward-looking
statements are not guarantees of future performance. Although we
believe the assumptions underlying these statements are reasonable,
investors are cautioned that such forward-looking statements
involve risks and uncertainties that may affect our business and cause actual
results to differ materially from those discussed during the conference
call. Such risks and uncertainties include economic, business,
competitive and/or regulatory factors affecting our business, as well as
uncertainties related to the outcomes of pending or future
litigation. Sunoco Logistics Partners L.P. has
included in its Annual Report on Form 10-K for the year ended
December 31, 2010, and in its subsequent Form 8-K filings,
cautionary language identifying important factors (though not necessarily all such
factors) that could cause future outcomes to differ materially from those
set forth in the forward-looking statements. For more
information about these factors, see our SEC filings, available on our website at
www.sunocologistics.com.
We
expressly
disclaim
any
obligation
to
update
or
alter
these
forward-looking
statements, whether as a result of new information, future events or
otherwise. This presentation includes certain non-GAAP
financial measures intended to supplement, not substitute for,
comparable GAAP measures. Reconciliations of non-GAAP financial measures to GAAP
financial measures are provided in the slides at the end of the
presentation. You should consider carefully the comparable
GAAP measures and the reconciliations to those measures provided in this presentation.
2 |
 Highlights
Record quarterly performance:
•
$138 million EBITDA
•
$106 million Distributable Cash Flow
•
$94 million Net Income
Increased
distribution
for
25
th
consecutive quarter
Announced over $450MM in acquisitions
3 |
 2011 Acquisition Announcements
Acquired 83.8% Interest in Inland Pipeline –
May
•
Net purchase price: $99MM
Acquired
Eagle
Point
Tank
Farm
–
July
•
Purchase price: $100MM
Announced
East
Boston,
MA
Terminal
–
Expected
3
rd
Quarter
Close
•
Purchase price: $56MM plus inventory
Announced
Purchase
of
Texon
Crude
Business
–
Expected
3
rd
Quarter
Close
•
Purchase price: $205MM plus inventory
4 |
 Inland Pipeline System
A 350-mile refined products
pipeline located in Ohio
Supply Points
•
BP and TRC Toledo
refineries
•
Husky Lima refinery
•
Lima Junction
Complementary Asset Base
•
Toledo area lines south
•
Will become operator
•
Potential synergy with
Mariner West project
5 |
 Eagle Point Tank Farm
5 MMB storage in service
Increases the revenues of
existing SXL docks, terminal,
and pipeline
Import / export capability
Connects to Harbor, Colonial,
and Laurel pipelines
6 |
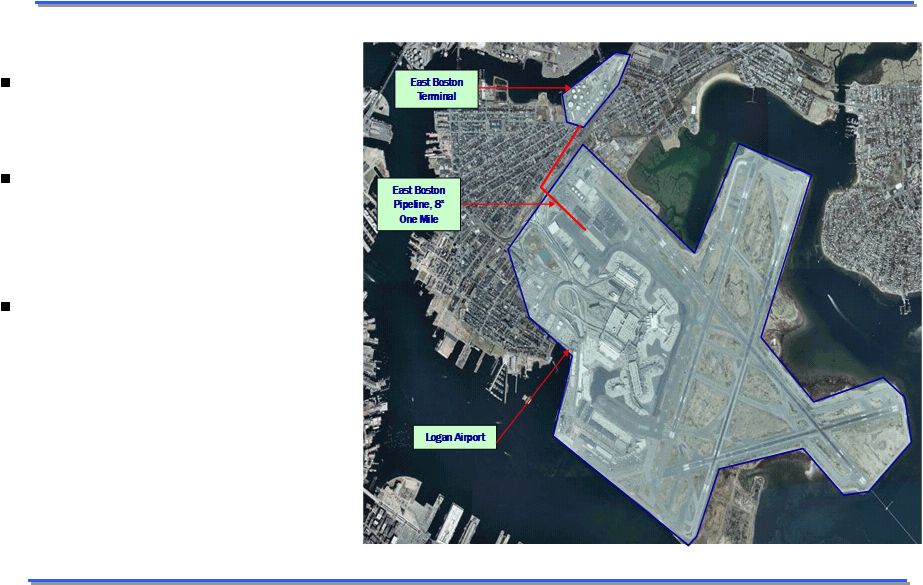 Entry into New England
terminal market
Terminal
•
10 bay truck rack
•
1.2 MMB
Jet pipeline to Airport
•
8”
line from terminal to
airport (0.8 mile)
•
Sole jet fuel provider to
Logan Airport
•
10 year contract –
renewed Feb 2010
East Boston Terminal
7 |
 Crude Lease & Marketing
•
75,000 barrels per day
Expands our lease business
by more than 30%
Potential synergies with
existing crude business
Expands geographic footprint
•
Bakken Shale
•
Granite Wash Shale
•
Eagle Ford Shale
Texon Crude Business
8
Shaded states indicate area of operation |
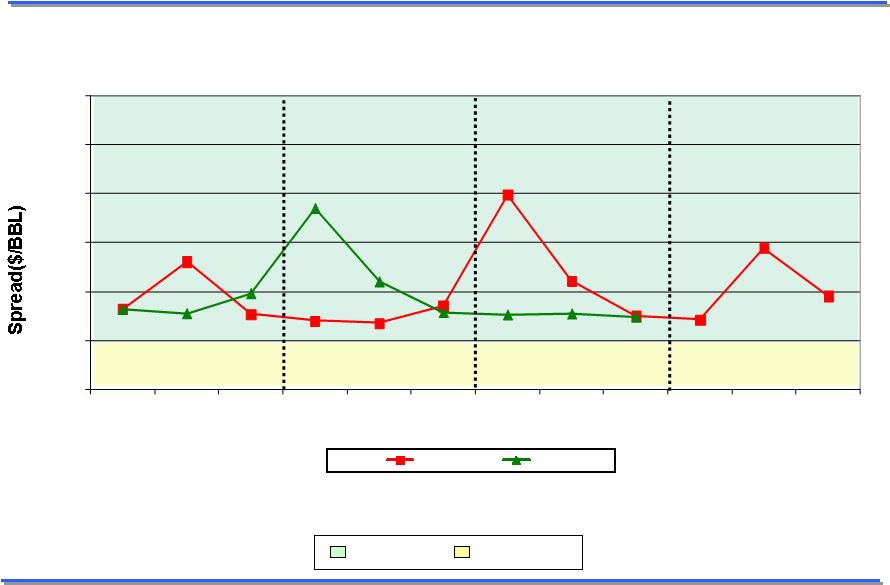 Crude Oil Contango
Backwardation
Contango
Source: NYMEX
9
-1
0
1
2
3
4
5
Jan
Feb
Mar
Apr
May
Jun
Jul
Aug
Sep
Oct
Nov
Dec
WTI NYMEX Month 2 vs. Month 1
2010
2011 |
 Q2 2011 Financial Highlights
($ in millions, unaudited)
10
Three Months Ended
Six Months Ended
June 30,
June 30,
2011
2010
2011
2010
Sales and other operating revenue
2,424
$
2,029
$
4,682
$
3,709
$
Other income
4
10
6
18
Total revenues
2,428
2,039
4,688
3,727
Cost of products sold and operating expenses
2,266
1,939
4,411
3,533
Depreciation and amortization expense
19
14
37
29
Selling, general and administrative expenses
22
16
44
37
Total costs and expenses
2,307
1,969
4,492
3,599
Operating income
121
70
196
128
Interest cost and debt expense
21
20
42
36
Capitalized interest
(2)
(1)
(3)
(2)
Income before provision for income taxes
102
51
157
94
Provision for income taxes
6
-
11
-
Net Income
96
$
51
$
146
$
94
$
Net income attributable to noncontrolling
interests
2
-
4
-
Net Income attributable to Sunoco Logistics
Partners L.P.
94
$
51
$
142
$
94
$
|
 Q2 2011 Financial Highlights
(amounts in millions, except unit and per unit amounts, unaudited)
11
Three Months Ended
Six Months Ended
June 30,
June 30,
2011
2010
2011
2010
Calculation of Limited Partners' interest:
Net Income attributable to Sunoco Logistics
Partners L.P.
94
$
51
$
142
$
94
$
Less: General Partner's interest
(14)
(11)
(26)
(21)
Limited Partners' interest in Net Income
80
$
40
$
116
$
73
$
Net Income per Limited Partner unit:
Basic
2.42
$
1.30
$
3.50
$
2.36
$
Diluted
2.40
$
1.29
$
3.48
$
2.35
$
Weighted Average Limited Partners' units
outstanding (in millions):
Basic
33.1
31.0
33.1
31.0
Diluted
33.3
31.2
33.3
31.2 |
 Refined Products Pipeline System
($ in millions, unaudited)
12
Three Months Ended
Six Months Ended
June 30,
June 30,
2011
2010
2011
2010
Financial Highlights
Sales and other operating revenue
29
$
31
$
56
$
61
$
Other income
4
4
6
6
Total revenues
33
35
62
67
Operating expenses
15
13
28
26
Depreciation and amortization expense
4
4
8
8
Selling, general and administrative expenses
6
5
13
12
Operating income
8
$
13
$
13
$
21
$
|
 Terminal Facilities
($ in millions, unaudited)
13
Three Months Ended
Six Months Ended
June 30,
June 30,
2011
2010
2011
2010
Financial Highlights
Sales and other operating revenue
87
$
59
$
174
$
114
$
Other income
-
1
-
1
Total revenues
87
60
174
115
Cost of products sold and operating expenses
36
22
79
42
Depreciation and amortization expense
8
5
16
11
Selling, general and administrative expenses
9
5
16
12
Operating income
34
$
28
$
63
$
50
$
|
 Crude Oil Pipeline System
($ in millions, unaudited)
14
Three Months Ended
Six Months Ended
June 30,
June 30,
2011
2010
2011
2010
Financial Highlights
Sales and other operating revenue
2,308
$
1,939
$
4,452
$
3,534
$
Other income
-
5
-
11
Total revenues
2,308
1,944
4,452
3,545
Cost of products sold and operating expenses
2,215
1,904
4,304
3,465
Depreciation and amortization expense
7
5
13
10
Selling, general and administrative expenses
7
6
15
13
Operating income
79
$
29
$
120
$
57
$
|
 Q2 2011 Operating Highlights
15
Three Months Ended
Six Months Ended
June 30,
June 30,
2011
2010
2011
2010
Operating highlights(unaudited)
Refined Products Pipeline System:
Refined products pipeline throughput (thousands of bpd)
(1)(2)
471
519
441
488
Revenue per barrel of pipeline throughput (cents)
69.1
66.5
70.4
68.6
Terminal Facilities:
Refined products terminals throughput (thousands of bpd)
479
487
479
473
Nederland terminal throughput (thousands of bpd)
771
684
734
705
Refinery terminals throughput (thousands of bpd)
393
471
391
484
Crude Oil Pipeline System:
Crude oil pipeline throughput (thousands of bpd)
(3)
1,641
906
1,568
872
Crude oil purchases at wellhead (thousands of bpd)
196
191
193
188
Gross margin per barrel of pipeline throughput (cents)
(3)(4)
57.8
35.7
47.4
37.8
Average crude oil price (per barrel)
102.55
$
77.99
$
98.42
$
78.39
$
Excludes amounts attributable to equity ownership interests which are
not consolidated. In May 2011, the Partnership acquired a controlling financial interest
in the Inland refined products pipeline. As a result of this acquisition, the Partnership accounted for this entity as a
consolidated subsidiary from the acquisition date. Volumes for the
three and six months ended June 30, 2011 of 72 and 36 thousand bpd, respectively, and the related revenue per barrel, have
been included in the refined products pipeline throughput and revenue
per barrel. From the date of acquisition, this pipeline had actual throughput of approximately 143 thousand bpd for the
three and six months ended June 30, 2011. The amounts presented for the
three and six month periods ended June 30, 2010 exclude amounts attributable to this system.
In July 2010, the Partnership acquired additional interests in the
Mid-Valley and West Texas Gulf crude oil pipelines, which previously had been recorded as equity investments. The
Partnership obtained a controlling financial interest as a result of
these acquisitions and began accounting for these entities as consolidated subsidiaries from their respective acquisition dates.
Volumes for the three and six months ended June 30, 2011 of 717 and 687
thousand bpd, respectively, and the related gross margin, have been included in the crude oil pipeline throughput
and gross margin per barrel of throughput. The amounts presented for
the three and six month periods ended June 30, 2010 exclude amounts attributable to these systems.
Represents total segment sales and other operating revenue minus cost
of products sold and operating expenses and depreciation and amortization divided by pipeline throughput.
(1)
(2)
(3)
(4) |
 Q2 2011 Financial Highlights
($ in millions, unaudited)
16
Three Months Ended
Six Months Ended
June 30,
June 30,
2011
2010
2011
2010
Capital Expenditure Data:
Maintenance capital expenditures
7
$
10
$
10
$
14
$
Expansion capital expenditures
133
39
158
62
Total
140
$
49
$
168
$
76
$
June 30,
December 31,
2011
2010
Balance Sheet Data (at period end):
Cash and cash equivalents
6
$
2
$
Total debt
(1)
1,463
$
1,229
$
Equity
Sunoco Logistics Partners L.P. Equity
1,006
$
965
$
Noncontrolling interests
98
77
Total Equity
1,104
$
1,042
$
(1)
Total debt at June 30, 2011 and December 31, 2010 includes the $100
million promissory note to Sunoco, Inc.
|
 Non-GAAP Financial Measures
($ in millions, unaudited)
Three Months Ended
Six Months Ended
June 30,
June 30,
2011
2010
2011
2010
Add: Interest expense, net
19
19
39
34
Add: Depreciation and amortization expense
19
14
37
29
Add: Provision for income taxes
6
-
11
-
EBITDA
(1)
138
84
229
157
Less: Interest expense, net
(19)
(19)
(39)
(34)
Less: Maintenance capital expenditures
(7)
(10)
(10)
(14)
Less: Provision for income taxes
(6)
-
(11)
-
Distributable cash flow
(1)
106
$
55
$
169
$
109
$
142
$
94
$
51
$
94
$
Net Income attributable to Sunoco Logistics
Partners L.P.
17
(1) Management of the Partnership believes EBITDA and distributable
cash flow information enhances an investor's understanding of a business’ ability to
generate cash for payment of distributions and other purposes.
EBITDA and distributable cash flow do not represent and should not be considered an alternative
to net income or cash flows from operating activities as determined
under United States generally accepted accounting principles (GAAP) and may not be
comparable to other similarly titled measures of other
businesses. Reconciliations of these measures to the comparable GAAP measure are provided in the tables
accompanying this release.
Non-GAAP Financial Measures
|
 Historical Operating Highlights
18
2007
2008
Total
Total
1st
2nd
3rd
4th
1st
2nd
3rd
4th
1st
2nd
Operating highlights(unaudited)
Refined Products Pipeline System:
Refined
product
pipeline
throughput
(thousands
of bpd)
(1)(2)
491
510
583
568
578
576
456
519
452
442
410
471
Revenue per barrel of pipeline throughput (cents)
54.8
55.4
59.9
60.4
60.2
62.4
70.9
66.5
71.4
71.7
71.8
69.1
Terminal Facilities:
Refined products terminals throughput (thousands of bpd)
434
436
460
464
465
466
459
487
505
502
478
479
Nederland terminal throughput (thousands of bpd)
507
526
653
646
560
531
726
684
780
724
696
771
Refinery terminals throughput (thousands of bpd)
696
653
583
600
609
573
498
471
459
434
389
393
Crude Oil Pipeline System:
Crude
oil
pipeline
throughput
(thousands
of
bpd)
(3)
674
683
664
670
611
687
837
906
1,387
1,592
1,493
1,641
Crude oil purchases at wellhead (thousands of bpd)
178
178
191
181
177
177
184
191
188
192
189
196
Gross
margin
per
barrel
of
pipeline
throughput
(cents)
(3)(4)
31.9
63.0
103.9
80.4
46.4
60.4
40.1
35.7
43.8
39.9
35.9
57.8
Average crude oil price (per barrel)
72.40
$
99.65
$
43.21
$
59.61
$
68.29
$
76.17
$
78.79
$
77.99
$
76.21
$
85.18
$
94.25
$
102.55
$
(1)
(2)
(3)
(4)
In May 2011, the Partnership acquired a controlling financial interest
in the Inland refined products pipeline. As a result of this acquisition, the Partnership accounted for this entity as a consolidated subsidiary
from the acquisition date. Volumes for the three months ended June 30,
2011 of 72 thousand bpd, and the related revenue per barrel, have been included in the refined products pipeline throughput and revenue
per barrel. From the date of acquisition, this pipeline had actual
throughput of approximately 143 thousand bpd for the three months ended June 30, 2011. The amounts presented for the three month period
ended June 30, 2010 exclude amounts attributable to this system.
2009
2010
2011
Excludes amounts attributable to equity ownership interests which are
not consolidated. In July 2010, the Partnership acquired
additional interests in the Mid-Valley and West Texas Gulf crude oil pipelines, which previously had been recorded as equity investments. The Partnership obtained a
controlling financial interest as a result of these acquisitions and
began accounting for these entities as consolidated subsidiaries from their respective acquisition dates. Volumes for the three months ended
June 30, 2011 of 717 thousand bpd, and the related gross margin, have
been included in the crude oil pipeline throughput and gross margin per barrel of throughput. The amounts presented for the three
month period ended June 30, 2010 exclude amounts attributable to these
systems. Represents
total segment sales and other operating revenue minus cost of products sold and operating expenses and depreciation and amortization divided by crude oil pipeline throughput.
|