Attached files
| file | filename |
|---|---|
| 8-K - 8-K - O-I Glass, Inc. /DE/ | a11-22451_18k.htm |
| EX-99.1 - EX-99.1 - O-I Glass, Inc. /DE/ | a11-22451_1ex99d1.htm |
Exhibit 99.2
|
|
O-I Earnings Presentation Second Quarter 2011 Owens-Illinois, Inc. |

|
|
1 Introduction Agenda Business discussion Financial review Business outlook Concluding remarks and Q&A Presenters Regulation G The information included in this presentation regarding adjusted net earnings relates to net earnings attributable to the Company exclusive of items management considers not representative of ongoing operations does not conform to U.S. generally accepted accounting principles (GAAP). It should not be construed as an alternative to the reported results determined in accordance with GAAP. Management has included this non-GAAP information to assist in understanding the comparability of results of ongoing operations. Management uses this non-GAAP information principally for internal reporting, forecasting, budgeting and calculating bonus payments. Further, the information in this presentation regarding free cash flow does not conform to GAAP. Management defines free cash flow as cash provided by operating activities less capital spending (both as determined in accordance with GAAP) and has included this non-GAAP information to assist in understanding the comparability of cash flows. Management uses this non-GAAP information principally for internal reporting, forecasting, and budgeting. Management believes that the non-GAAP presentation allows the board of directors, management, investors and analysts to better understand the Company’s financial performance in relationship to core operating results and the business outlook. Forward Looking Statements This presentation contains "forward looking" statements within the meaning of Section 21E of the Securities Exchange Act of 1934 and Section 27A of the Securities Act of 1933. Forward looking statements reflect the Company's current expectations and projections about future events at the time, and thus involve uncertainty and risk. The words “believe,” “expect,” “anticipate,” “will,” “could,” “would,” “should,” “may,” “plan,” “estimate,” “intend,” “predict,” “potential,” “continue,” and the negatives of these words and other similar expressions generally identify forward looking statements. It is possible the Company's future financial performance may differ from expectations due to a variety of factors including, but not limited to the following: (1) foreign currency fluctuations relative to the U.S. dollar, (2) changes in capital availability or cost, including interest rate fluctuations, (3) the general political, economic and competitive conditions in markets and countries where the Company has operations, including uncertainties related to the economic conditions in Australia and New Zealand, the expropriation of the Company’s operations in Venezuela, disruptions in capital markets, disruptions in the supply chain, competitive pricing pressures, inflation or deflation, and changes in tax rates and laws, (4) consumer preferences for alternative forms of packaging, (5) fluctuations in raw material and labor costs, (6) availability of raw materials, (7) costs and availability of energy, including natural gas prices, (8) transportation costs, (9) the ability of the Company to raise selling prices commensurate with energy and other cost increases, (10) consolidation among competitors and customers, (11) the ability of the Company to acquire businesses and expand plants, integrate operations of acquired businesses and achieve expected synergies, (12) unanticipated expenditures with respect to environmental, safety and health laws, (13) the performance by customers of their obligations under purchase agreements, (14) the Company’s ability to further develop its sales, marketing and product development capabilities, (15) the Company’s ability to resolve its production and supply chain issues in North America, (16) the Company’s success in implementing necessary restructuring plans, and (17) the timing and occurrence of events which are beyond the control of the Company, including any expropriation of the Company’s operations, floods and other natural disasters, and events related to asbestos-related claims. It is not possible to foresee or identify all such factors. Any forward looking statements in this document are based on certain assumptions and analyses made by the Company in light of its experience and perception of historical trends, current conditions, expected future developments, and other factors it believes are appropriate in the circumstances. Forward looking statements are not a guarantee of future performance and actual results or developments may differ materially from expectations. While the Company continually reviews trends and uncertainties affecting the Company's results of operations and financial condition, the Company does not assume any obligation to update or supplement any particular forward looking statements contained in this presentation. Presentation Note Unless otherwise noted, the information presented in this presentation reflects continuing operations only. Al Stroucken Chairman and CEO Ed White SVP and CFO |
|
|
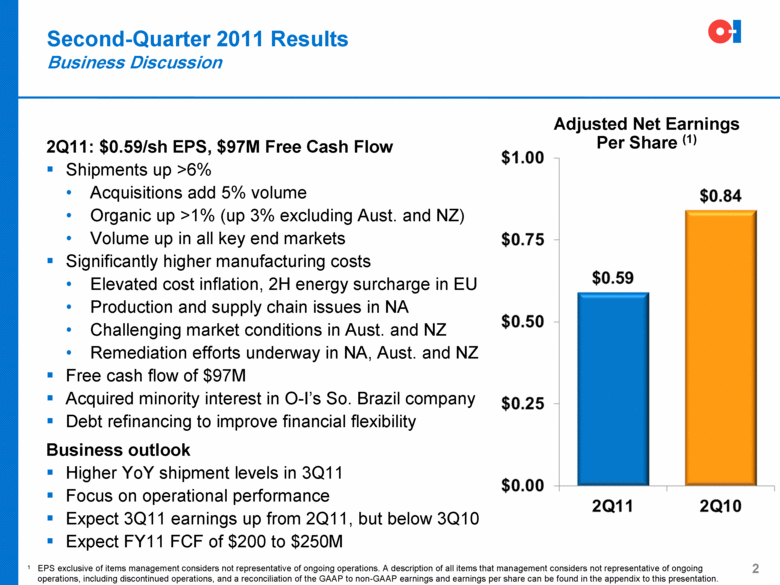
2 Second-Quarter 2011 Results Business Discussion 2Q11: $0.59/sh EPS, $97M Free Cash Flow Shipments up >6% Acquisitions add 5% volume Organic up >1% (up 3% excluding Aust. and NZ) Volume up in all key end markets Significantly higher manufacturing costs Elevated cost inflation, 2H energy surcharge in EU Production and supply chain issues in NA Challenging market conditions in Aust. and NZ Remediation efforts underway in NA, Aust. and NZ Free cash flow of $97M Acquired minority interest in O-I’s So. Brazil company Debt refinancing to improve financial flexibility Business outlook Higher YoY shipment levels in 3Q11 Focus on operational performance Expect 3Q11 earnings up from 2Q11, but below 3Q10 Expect FY11 FCF of $200 to $250M Adjusted Net Earnings Per Share (1) 1 EPS exclusive of items management considers not representative of ongoing operations. A description of all items that management considers not representative of ongoing operations, including discontinued operations, and a reconciliation of the GAAP to non-GAAP earnings and earnings per share can be found in the appendix to this presentation. |
|
|
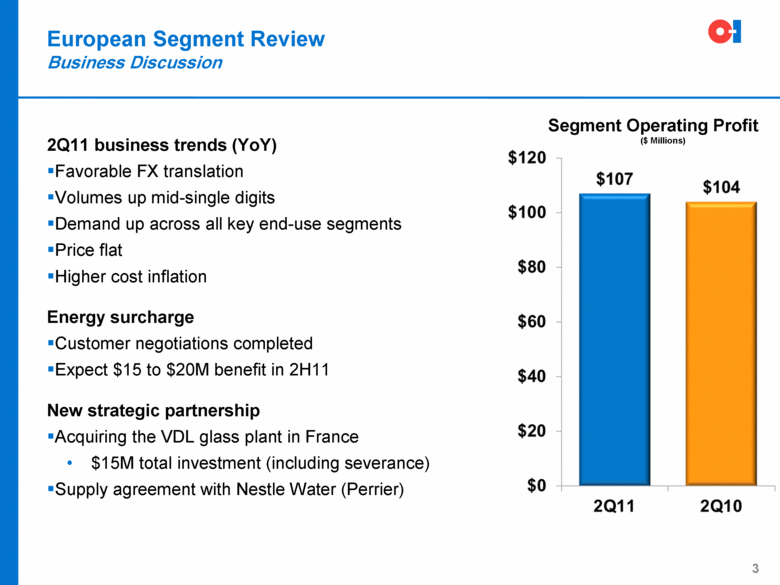
European Segment Review Business Discussion 2Q11 business trends (YoY) Favorable FX translation Volumes up mid-single digits Demand up across all key end-use segments Price flat Higher cost inflation Energy surcharge Customer negotiations completed Expect $15 to $20M benefit in 2H11 New strategic partnership Acquiring the VDL glass plant in France $15M total investment (including severance) Supply agreement with Nestle Water (Perrier) 3 Segment Operating Profit ($ Millions) |
|
|
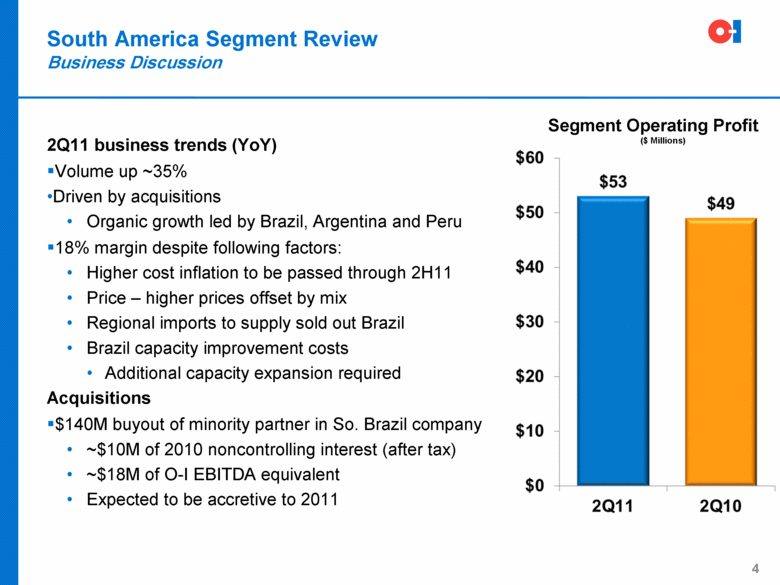
South America Segment Review Business Discussion 4 2Q11 business trends (YoY) Volume up ~35% Driven by acquisitions Organic growth led by Brazil, Argentina and Peru 18% margin despite following factors: Higher cost inflation to be passed through 2H11 Price – higher prices offset by mix Regional imports to supply sold out Brazil Brazil capacity improvement costs Additional capacity expansion required Acquisitions $140M buyout of minority partner in So. Brazil company ~$10M of 2010 noncontrolling interest (after tax) ~$18M of O-I EBITDA equivalent Expected to be accretive to 2011 Segment Operating Profit ($ Millions) |
|
|
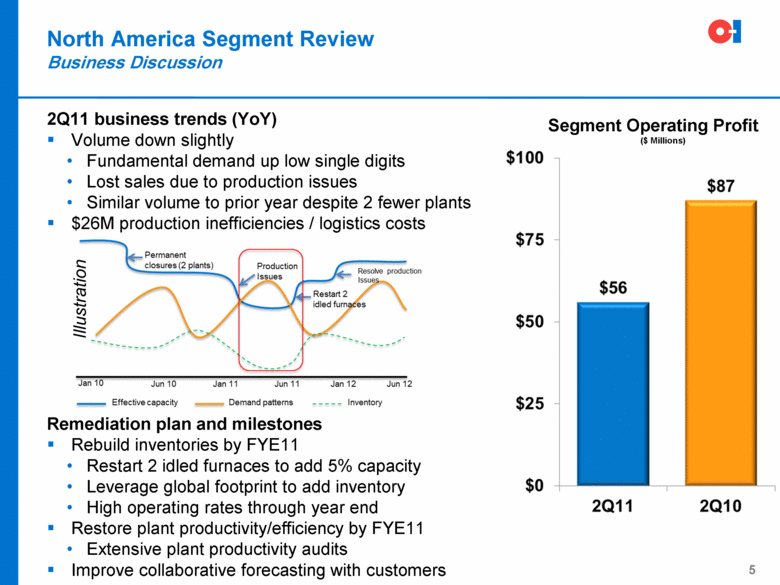
5 North America Segment Review Business Discussion 2Q11 business trends (YoY) Volume down slightly Fundamental demand up low single digits Lost sales due to production issues Similar volume to prior year despite 2 fewer plants $26M production inefficiencies / logistics costs Remediation plan and milestones Rebuild inventories by FYE11 Restart 2 idled furnaces to add 5% capacity Leverage global footprint to add inventory High operating rates through year end Restore plant productivity/efficiency by FYE11 Extensive plant productivity audits Improve collaborative forecasting with customers Segment Operating Profit ($ Millions) Illustration |
|
|
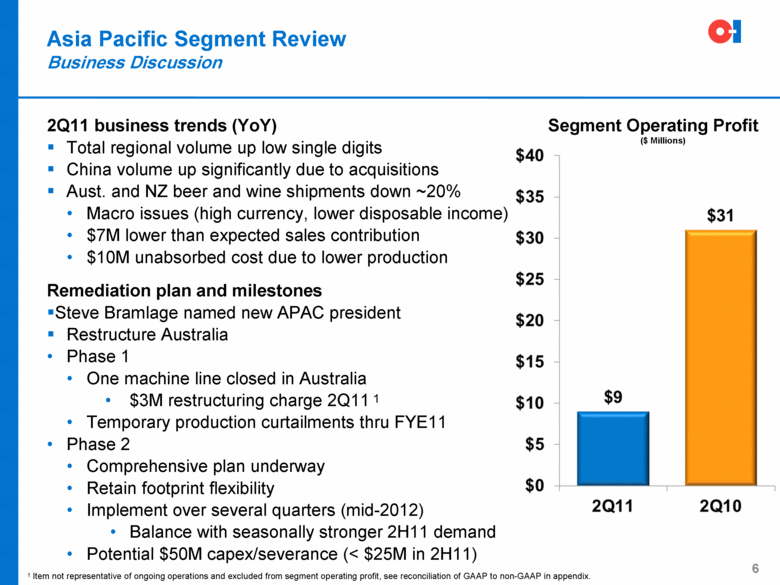
6 Asia Pacific Segment Review Business Discussion 2Q11 business trends (YoY) Total regional volume up low single digits China volume up significantly due to acquisitions Aust. and NZ beer and wine shipments down ~20% Macro issues (high currency, lower disposable income) $7M lower than expected sales contribution $10M unabsorbed cost due to lower production Remediation plan and milestones Steve Bramlage named new APAC president Restructure Australia Phase 1 One machine line closed in Australia $3M restructuring charge 2Q11 1 Temporary production curtailments thru FYE11 Phase 2 Comprehensive plan underway Retain footprint flexibility Implement over several quarters (mid-2012) Balance with seasonally stronger 2H11 demand Potential $50M capex/severance (< $25M in 2H11) 1 Item not representative of ongoing operations and excluded from segment operating profit, see reconciliation of GAAP to non-GAAP in appendix. Segment Operating Profit ($ Millions) |
|
|
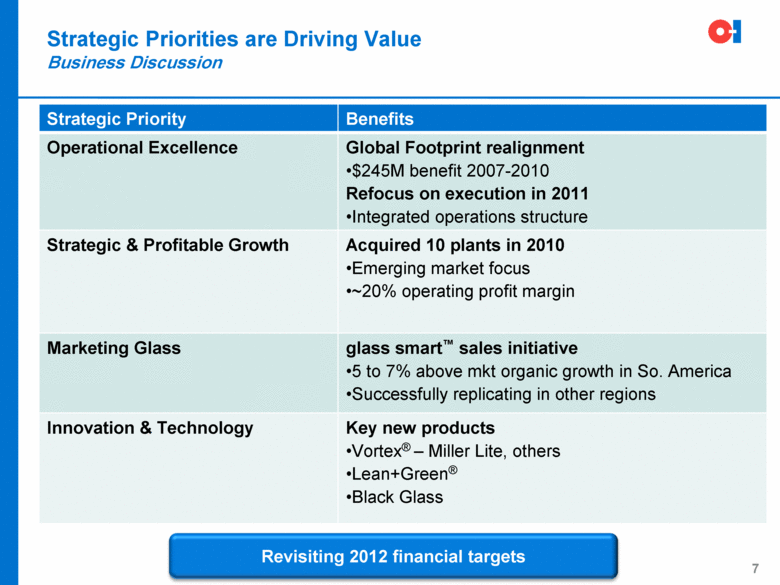
Strategic Priority Benefits Operational Excellence Global Footprint realignment $245M benefit 2007-2010 Refocus on execution in 2011 Integrated operations structure Strategic & Profitable Growth Acquired 10 plants in 2010 Emerging market focus ~20% operating profit margin Marketing Glass glass smart™ sales initiative 5 to 7% above mkt organic growth in So. America Successfully replicating in other regions Innovation & Technology Key new products Vortex® – Miller Lite, others Lean+Green® Black Glass Strategic Priorities are Driving Value Business Discussion 7 Revisiting 2012 financial targets |
|
|
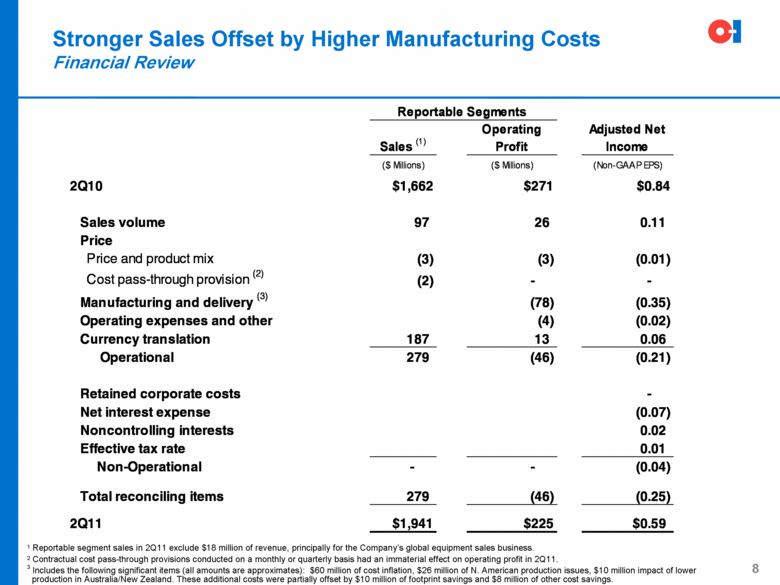
8 Stronger Sales Offset by Higher Manufacturing Costs Financial Review 1 Reportable segment sales in 2Q11 exclude $18 million of revenue, principally for the Company’s global equipment sales business. 2 Contractual cost pass-through provisions conducted on a monthly or quarterly basis had an immaterial effect on operating profit in 2Q11. 3 Includes the following significant items (all amounts are approximates): $60 million of cost inflation, $26 million of N. American production issues, $10 million impact of lower production in Australia/New Zealand. These additional costs were partially offset by $10 million of footprint savings and $8 million of other cost savings. Reportable Segments Sales (1) Operating Profi Adjusted Net Income ($ Millions) ($ Millions) (Non-GAAP EPS) 2Q10 $1,662 $271 $0.84 Sales volume 97 26 0.11 Price Price and product mix (3) (3) (0.01) Cost pass-through provision (2) (2) - - Manufacturing and delivery (3) (78) (0.35) Operating expenses and other (4) (0.02) Currency translation 187 13 0.06 Operational 279 (46) (0.21) Retained corporate cost - Net interest expens (0.07) Noncontrolling interest 0.02 Effective tax rat 0.01 Non-Operationa - - (0.04) Total reconciling items 279 (46) (0.25) 2Q11 $1,941 $225 $0.59 |
|
|
9 Balance Sheet, Cash Flow and Capital Structure Financial Review Highlight of Select Balance Sheet and Cash Flow Items (1) ($ Millions) 1 All information presented is from continuing operations only. 2 Total debt less cash divided by bank credit agreement EBITDA. The 2Q11 and 2Q10 ratios were calculated excluding the impact of the discontinued Venezuelan operations. Current bank covenants allow for a maximum ratio of 4.0x. Capital allocation priorities – 2H11 Reduce leverage ratio below 3.0x EBITDA Australian restructuring Rebuild No. American inventory levels Brazil capacity expansion 2011 capital expenditures: up to $375M Australian restructuring Brazil capacity expansion Refinanced debt and lowered interest exp. New $2B bank credit agreement $1.1B term loans, $900M revolver LIBOR + 175 bps, May 2016 maturity Redeemed $700M 6.75% sr. notes Highlight of Select Balance Sheet and Cash Flow Items (1) ($ Millions) 2Q11 2Q10 YoY Cash $260 $648 ($388) Debt $4,340 $3,500 $840 Net Debt $4,080 $2,852 $1,228 Net Debt to EBITDA (2) 3.2 2.4 0.8x Free Cash Flow $97 ($6) $103 Capital Expenditures ($80) ($139) $59 Working Capital $30 ($64) $94 Restructuring Pymts ($9) ($12) $3 Asbestos Pymts ($35) ($43) $8 |

|
|
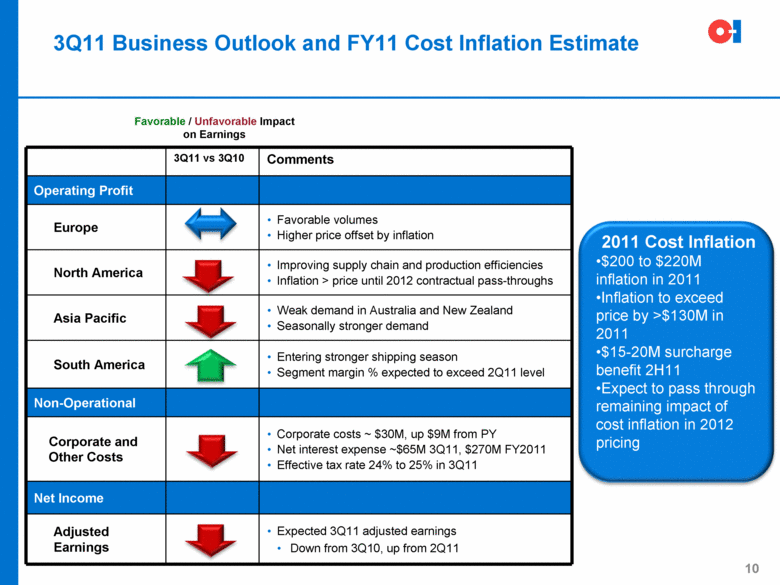
3Q11 Business Outlook and FY11 Cost Inflation Estimate Favorable / Unfavorable Impact on Earnings 3Q11 vs 3Q10 Comments Operating Profit Europe Favorable volumes Higher price offset by inflation North America Improving supply chain and production efficiencies Inflation > price until 2012 contractual pass-throughs Asia Pacific Weak demand in Australia and New Zealand Seasonally stronger demand South America Entering stronger shipping season Segment margin % expected to exceed 2Q11 level Non-Operational Corporate and Other Costs Corporate costs ~ $30M, up $9M from PY Net interest expense ~$65M 3Q11, $270M FY2011 Effective tax rate 24% to 25% in 3Q11 Net Income Adjusted Earnings Expected 3Q11 adjusted earnings Down from 3Q10, up from 2Q11 2011 Cost Inflation $200 to $220M inflation in 2011 Inflation to exceed price by >$130M in 2011 $15-20M surcharge benefit 2H11 Expect to pass through remaining impact of cost inflation in 2012 pricing 10 |
|
|
Concluding Remarks and Q&A Remediation plans to address North America and Australia/NZ challenges Maximize O-I’s long-term earnings power Expect $200 to $250M free cash flow in 2011 Primary uses of cash include implementing remediation plans, expansion in South America and debt reduction Strategy unchanged; prioritize operational excellence Core business top priority until operating performance recovers Third Quarter 2011 Earnings Dates Press release to be issued after market close Wednesday, October 26, 2011 Earnings conference call Thursday, October 27, 2011 @ 8:30am ET 11 |
|
|
Appendix |

|
|
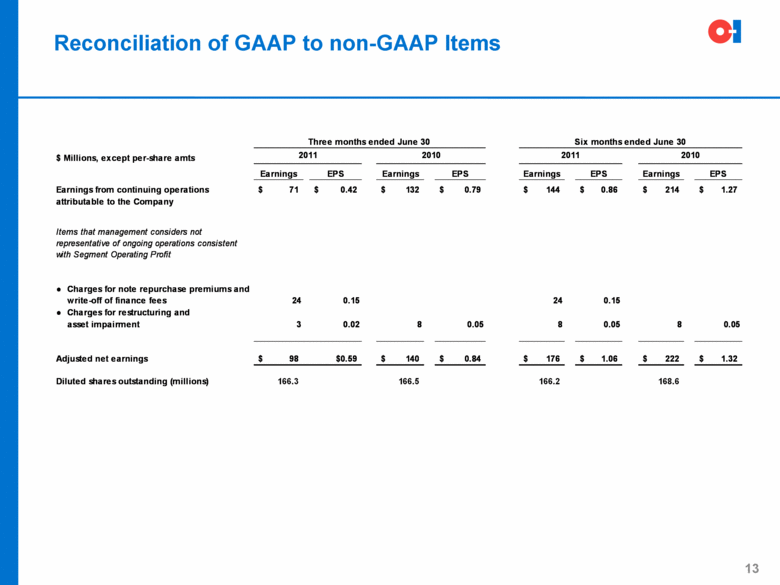
13 Reconciliation of GAAP to non-GAAP Items 168.6 166.2 166.5 166.3 Diluted shares outstanding (millions) $ 1.32 $ 222 $ 1.06 $ 176 $ 0.84 $ 140 $0.59 $ 98 Adjusted net earnings 0.05 8 0.05 8 0.05 8 0.02 3 asset impairment Charges for restructuring and • 0.15 24 0.15 24 Charges for note repurchase premiums and write-off of finance fees • Items that management considers not representative of ongoing operations consistent with Segment Operating Profit attributable to the Company $ 1.27 $ 214 $ 0.86 $ 144 $ 0.79 $ 132 $ 0.42 $ 71 Earnings from continuing operations EPS Earnings EPS Earnings EPS Earnings EPS Earnings 2010 2011 2010 2011 $ Millions, except per-share amts Six months ended June 30 Three months ended June 30 |
|
|
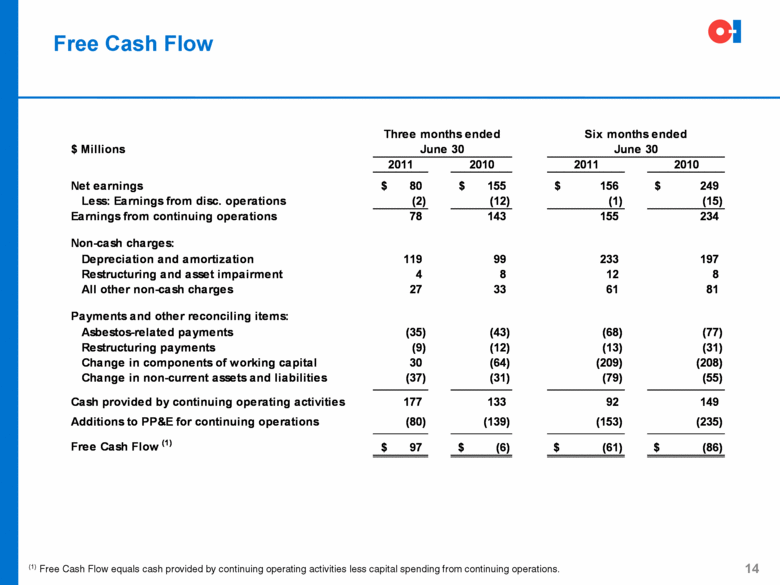
14 Free Cash Flow (1) Free Cash Flow equals cash provided by continuing operating activities less capital spending from continuing operations. $ Million Three months ended June 30 Six months end June 30 2011 2010 2011 2010 Net earnings $80 $155 $156 $249 Less: Earnings from disc. operations (2) (12) (1) (15) Earnings from continuing operations 78 143 155 234 Non-cash charges: Depreciation and amortization 119 99 233 197 Restructuring and asset impairment 4 8 12 8 All other non-cash charges 27 33 61 81 Payments and other reconciling items: Asbestos-related payments (35) (43) (68) (77) Restructuring payments (9) (12) (13) (31) Change in components of working capital 30 (64) (209) (208) Change in non-current assets and liabilities (37) (31) (79) (55) Cash provided by continuing operating activities 177 133 92 149 Additions to PP&E for continuing operations (80) (139) (153) (235) Free Cash Flow (1) $97 $(6) $(61) $(86) |
|
|
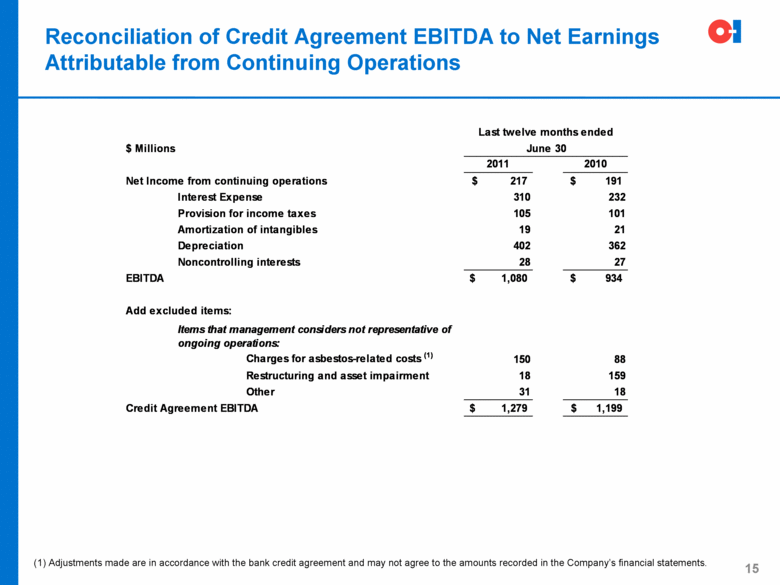
Reconciliation of Credit Agreement EBITDA to Net Earnings Attributable from Continuing Operations 15 (1) Adjustments made are in accordance with the bank credit agreement and may not agree to the amounts recorded in the Company’s financial statements. $ Millions 2011 2010 Net Income from continuing operations 217 $ 191 $ Interest Expense 310 232 Provision for income taxes 105 101 Amortization of intangibles 19 21 Depreciation 402 362 Noncontrolling interests 28 27 EBITDA 1,080 $ 934 $ Add excluded items: Charges for asbestos-related costs (1) 150 88 Restructuring and asset impairment 18 159 Other 31 18 Credit Agreement EBITDA 1,279 $ 1,199 $ Last twelve months ended Items that management considers not representative of ongoing operations: June 30 |