Attached files
 Q2 2011
EARNINGS CONFERENCE CALL
Aspen Insurance Holdings Limited
July 28, 2011
AHL: NYSE
Exhibit 99.3 |
 AHL: NYSE
2
SAFE HARBOR DISCLOSURE
This slide presentation is for information purposes only. It should be read in conjunction with
our financial supplement posted on our website on the Investor Relations page and with other
documents filed or to be filed shortly by Aspen Insurance Holdings Limited (the “Company” or “Aspen”) with the U.S. Securities and Exchange Commission.
Non-GAAP Financial Measures
In presenting Aspen's results, management has included and discussed certain "non-GAAP
financial measures", as such term is defined in Regulation G. Management believes that these
non-GAAP measures, which may be defined differently by other companies, better explain Aspen's results of operations in a manner that allows for a more complete
understanding of the underlying trends in Aspen's business. However, these measures should not be
viewed as a substitute for those determined in accordance with GAAP. The reconciliation of such
non-GAAP financial measures to their respective most directly comparable GAAP financial measures in accordance with Regulation G is included
Application of the Safe Harbor of the Private Securities Litigation Reform Act of 1995:
This presentation contains, and Aspen's earnings conference call will contain, written or oral
"forward-looking statements" within the meaning of the U.S. federal securities laws.
These statements are made pursuant to the safe harbor provisions of the Private Securities Litigation
Reform Act of 1995. Forward-looking statements include all statements that do not relate
solely to historical or current facts, and can be identified by the use of words such as "expect," "intend," "plan," "believe," “do not believe,” “aim,” "project,"
"anticipate," "seek," "will," "estimate," "may,"
"continue," “guidance,” and similar expressions of a future or forward-looking nature.
All forward-looking statements address matters that involve risks and uncertainties.
Accordingly, there are or will be important factors that could cause actual results to differ
materially from those indicated in these statements. Aspen believes these factors include, but are not
limited to: the possibility of greater frequency or severity of claims and loss activity,
including as a result of natural or man-made (including economic and political risks) catastrophic or material loss events, than our underwriting, reserving, reinsurance
purchasing or investment practices have anticipated; the reliability of, and changes in assumptions
to, natural and man-made catastrophe pricing, accumulation and estimated loss models;
evolving issues with respect to interpretation of coverage after major loss events and any intervening legislative or governmental action; the effectiveness of our
loss limitation methods; changes in the total industry losses, or our share of total industry losses,
resulting from past events and, with respect to such events, our reliance on loss reports
received from cedants and loss adjustors, our reliance on industry loss estimates and those generated by modeling techniques, changes in rulings on flood damage
or other exclusions as a result of prevailing lawsuits and case law; the impact of acts of terrorism
and related legislation and acts of war; decreased demand for our insurance or reinsurance
products and cyclical changes in the insurance and reinsurance sectors; any changes in our reinsurers’ credit quality and the amount and timing of reinsurance
recoverables; changes in the availability, cost or quality of reinsurance or retrocessional coverage;
the continuing and uncertain impact of the current depressed economic environment in many of
the countries in which we operate; the level of inflation in repair costs due to limited availability of labor and materials after catastrophes; changes in
insurance and reinsurance market conditions; increased competition on the basis of pricing, capacity,
coverage terms or other factors and the related demand and supply dynamics as contracts come up
for renewal; a decline in our operating subsidiaries’ ratings with Standard & Poor’s (“S&P”), A.M. Best Company, Inc. (“A.M. Best”) or Moody’s
Investor Service (“Moody’s”); our ability to execute our business plan to enter new
markets, introduce new products and develop new distribution channels, including their
integration into our existing operations; changes in general economic conditions, including inflation,
foreign currency exchange rates, interest rates and other factors that could affect our
investment portfolio; the risk of a material decline in the value or liquidity of all or parts of our investment portfolio; changes in our ability to exercise capital
management initiatives or to arrange banking facilities as a result of prevailing market changes or
changes in our financial position; changes in government regulations or tax laws in
jurisdictions where we conduct business; Aspen Holdings or Aspen Bermuda becoming subject to income taxes in the United States or the United Kingdom; loss of key
personnel; and increased counterparty risk due to the credit impairment of financial institutions. For a more detailed description of these uncertainties and other factors, please
see the "Risk Factors" section in Aspen's Annual Report on Form 10-K as filed with the
U.S. Securities and Exchange Commission on February 25, 2011. Aspen undertakes no
obligation to publicly update or revise any forward-looking statements, whether as a result of new
information, future events or otherwise. Readers are cautioned not to place undue reliance on
these forward-looking statements, which speak only as of the dates on which they are made. In addition, any estimates relating to loss events involve the exercise of considerable
judgment in the setting of reserves and reflect a combination of ground-up evaluations,
information available to date from brokers and cedants, market intelligence, initial tentative loss
reports and other sources. The actuarial range of reserves and management's best estimate
represents a distribution from our internal capital model for reserving risk based on our then current state of knowledge and explicit and implicit assumptions
relating to the incurred pattern of claims, the expected ultimate settlement amount, inflation and
dependencies between lines of business. Due to the complexity of factors contributing to
the losses and the preliminary nature of the information used to prepare these estimates and reserves, there can be no assurance that Aspen’s ultimate losses
will remain within the stated amounts.
herein
or
in
the
financial
supplement,
as
applicable,
which
can
be
obtained
from
the
Investor
Relations
section
of
Aspen's
website
at
www.aspen.bm. |
 AHL: NYSE
FINANCIAL HIGHLIGHTS: Q2 2011
AHL: NYSE
3
(US$ in millions, except per share data)
(*) Note:
See
Aspen's
quarterly
financial
supplement
for
a
reconciliation
of
operating
income
to
net
income,
average
equity
to
closing
shareholders’
equity
and
diluted
book
value
per
share
to
basic
book
value
per
share
in
the
Investor
Relations
section
of
Aspen's
website
at
www.aspen.bm
Quarter Ended June 30
2011
2010
Change
Gross Written Premiums
582.2
545.4
6.7%
Net Written Premiums
525.7
538.8
(2.4%)
Net Earned Premiums
459.8
479.9
(4.2%)
Underwriting Income / (Loss)
(22.9)
62.8
(136.5%)
Net Investment Income
58.6
57.5
1.9%
Net Income / (Loss) after Tax
10.2
108.9
(90.6%)
Financial Ratios
Loss Ratio
71.0%
57.7%
-
Expense Ratio
34.0%
29.2%
-
Combined Ratio
105.0%
86.9%
-
Annualized Operating ROE*
4.4%
15.6%
-
Operating EPS*
0.36
1.23
(70.7%)
Diluted Book Value per Share*
37.43
36.96
1.3% |
 AHL: NYSE
FINANCIAL HIGHLIGHTS: H1 2011
AHL: NYSE
4
(US$ in millions, except per share data)
(*) Note:
See
Aspen's
quarterly
financial
supplement
for
a
reconciliation
of
operating
income
to
net
income,
average
equity
to
closing
shareholders’
equity
and
diluted
book
value
per
share
to
basic
book
value
per
share
in
the
Investor
Relations
section
of
Aspen's
website
at
www.aspen.bm
Six Months Ended June 30
2011
2010
Change
Gross Written Premiums
1,253.5
1,248.2
0.4%
Net Written Premiums
1,035.3
1,118.9
(7.5%)
Net Earned Premiums
912.2
947.5
(3.7%)
Underwriting Income
(242.2)
14.6
NM
Net Investment Income
114.1
116.9
(2.4%)
Net Income after Tax
(141.5)
127.2
(211.2%)
Financial Ratios
Loss Ratio
93.8%
69.2%
-
Expense Ratio
32.8%
29.2%
-
Combined Ratio
126.6%
98.4%
-
Annualized Operating ROE*
(11.4%)
7.8%
-
Operating EPS*
(1.98)
1.24
(259.7%)
Diluted Book Value per Share*
37.43
36.96
1.3% |
 AHL: NYSE
GROWTH IN BOOK VALUE PER SHARE AND NET INCOME ROE
AHL: NYSE
5
(*) Note:
See
Aspen's
quarterly
financial
supplement
for
a
reconciliation
of
average
equity
to
closing
shareholders’
equity
and
diluted
book
value
per
share
to
basic
book
value
per
share
in
the
Investor
Relations
section
of
Aspen's
website
at
www.aspen.bm
0
5
10
15
20
25
30
35
40
45
Q1
Q2
Q3
Q4
Q1
Q2
Q3
Q4
Q1
Q2
Q3
Q4
Q1
Q2
Q3
Q4
Q1
Q2
Q3
Q4
Q1
Q2
-30%
-20%
-10%
0%
10%
20%
30%
40%
BVPS(LH Scale)
Annualized Net Income ROE (RH Scale)*
2006
2007
2009
2008
2010
2011 |
 AHL: NYSE
BUSINESS
PERFOMANCE
AND
MARKET
OUTLOOK
:
Q2
2011
Information reflecting Aspen’s portfolios as at June 30, 2011
Key located on page 21
6
Reinsurance
Q3'10
Q4'10
Q1'11
Q2'11
Q3'10
Q4'10
Q1'11
Q2'11
Q3'10
Q4'10
Q1'11
Q2'11
Q3'10
Q4'10
Q1'11
Q2'11
Q3'10
Q4'10
Q1'11
Q2'11
Q3'10
Q4'10
Q1'11
Q2'11
Property Catastrophe Reinsurance
Other Property Reinsurance
Casualty Reinsurance
Specialty Reinsurance
Insurance
Property Insurance
Casualty Insurance
Marine, Energy & Transportation Insurance
Financial & Professional Lines Insurance
Marine Hull
Aviation
Information Reflecting Aspen's Current InforcePortfolios as 30th June 2011
Specie
Financial Institutions
Professional Lines Insurance (UK)
Financial & Political Risks Insurance
Professional Indemnity Insurance (US)
Excess Casualty Insurance
US Casualty E&S Insurance
MEC Liability
Energy Property
UK Commercial Property & Construction
Agriculture
US Property (E&S)
UK Liability Insurance
US Casualty Treaty
Global Casualty Facultative
Credit and Surety Reinsurance
Specialty Reinsurance
Treaty Catastrophe
Treaty Risk Excess
Treaty Pro Rata
Global Property Facultative
International Casualty Treaty
Terms & Conditions
4
Volume change
5
Outlook
6
Performance
1
Absolute Pricing
2
Relative Price Movement
3
*MEC - Marine, Energy & Construction
1 - 12 months rolling RORAC
2 - Ratio In force Actual to Technical (or modelled) price
3 - Relative Price Movement for all in-force renewed contracts
4 - Terms and Conditions
5 - Change in rolling GWP for last 4 quarters vs. rolling GWP from previous 4 quarters
6 - Outlook (Absolute Pricing * Forecast Relative Price Movement)
|
 AHL: NYSE
FINANCIAL HIGHLIGHTS: GROUP SUMMARY Q2 2011
AHL: NYSE
7
Reinsurance
51.5
44.6
80.7
70.9
79.5
91.2
93.0
59.9
0
100
200
300
400
Q2 2010
Q2 2011
Property Catastrophe
Casualty
Other Property
Specialty
283.3
288.0
Total
283.3
288.0
262.1
294.2
0
200
400
600
800
Q2 2010
Q2 2011
Aspen Re
Aspen Insurance
545.4
582.2
Insurance
69.3
73.6
44.7
32.9
118.1
130.3
57.4
30.0
0
100
200
300
400
Q2 2010
Q2 2011
Property
Casualty
Marine, Energy and Transportation
Financial and Professional Lines
262.1
294.2 |
 AHL: NYSE
FINANCIAL HIGHLIGHTS: GROUP SUMMARY H1 2011
8
Reinsurance
237.4
244.0
226.0
183.2
154.4
135.7
162.2
155.6
0
200
400
600
800
1000
YTD 2010
YTD 2011
Property Catastrophe
Casualty Reinsurance
Other Property Reinsurance
Specialty Reinsurance
773.4
725.1
Insurance
106.0
112.2
81.9
52.5
228.7
254.1
58.2
109.6
0
200
400
600
YTD 2010
YTD 2011
Property
Casualty
Marine, Energy and Transportation
Financial and Professional Lines
474.8
528.4
Total
528.4
725.1
773.4
474.8
0
500
1000
1500
YTD 2010
YTD 2011
Aspen Re
Aspen Insurance
1,248.2
1,253.5 |
 AHL: NYSE
FINANCIAL HIGHLIGHTS: GROUP SUMMARY Q2 2011
Q2 2010
Q2 2011
9
Underwriting Revenues
545
6
539
480
582
56
526
460
0
200
400
600
800
GWP
Premiums
Ceded
NWP
NEP
Expenses
277
78
52
10
417
326
87
14
483
56
0
200
400
600
Loss & Loss
Expenses
Acquisition
Expenses
General
Admin
Expenses
Corporate
Expenses
Total
Expenses
Income
118
121
109
92
35
11
10
(6)
-40
0
40
80
120
160
Operating
Income Before
Tax
Income Before
Tax
Income After Tax
Retained Income
Contribution
63
58
(23)
59
-40
-20
0
20
40
60
80
Underwriting Income
Net Investment Income |
 Underwriting Revenues
1,248
129
1,119
948
1,254
219
1,035
912
0
200
400
600
800
1,000
1,200
1,400
GWP
Premiums
Ceded
NWP
NEP
Expenses
656
162
95
20
933
855
168
109
1,154
22
0
400
800
1,200
1,600
Loss & Loss
Expenses
Acquisition
Exp
Admin
Expenses
Corporate
Expenses
Total
Underwriting
Expenses
Income
125
141
127
92
(145)
(157)
(142)
(174)
-200
-100
0
100
200
Operating
Income Before
Tax
Income Before
Tax
Income After
Tax
Retained Income
Contribution
15
117
(242)
114
-300
-200
-100
0
100
200
Underwriting Income
Net Investment Income
AHL: NYSE
FINANCIAL HIGHLIGHTS: GROUP SUMMARY H1 2011
H1 2010
H1 2011
10
General |
 AHL: NYSE
KEY PERFORMANCE METRICS: Q2 2011 AND H1 2011
Q2 2010
Q2 2011
H1 2010
H1 2011
11
Ratio Analysis
69.2
17.1
12.1
98.4
93.8
18.4
14.4
126.6
0
20
40
60
80
100
120
140
Loss Ratio
Acquisition
Expense Ratio
General,
Administrative
and Corporate
Expense Ratio
Combined
Ratio
Ratio Analysis
57.7
16.2
13.0
86.9
71.0
18.9
15.1
105.0
0
20
40
60
80
100
120
Loss Ratio
Acquisition
Expense Ratio
General,
Administrative
and Corporate
Expense Ratio
Combined
Ratio |
 AHL: NYSE
RESULTS BY BUSINESS SEGMENT: Q2 2011
(*) Underwriting income is calculated as underwriting revenues, less underwriting
expenses. Q2 2010
Q2 2011
GWP
283
262
288
294
240
250
260
270
280
290
300
Reinsurance
Insurance
Underwriting Income *
67
6
5
(14)
-20
0
20
40
60
80
Reinsurance
Insurance
12 |
 AHL: NYSE
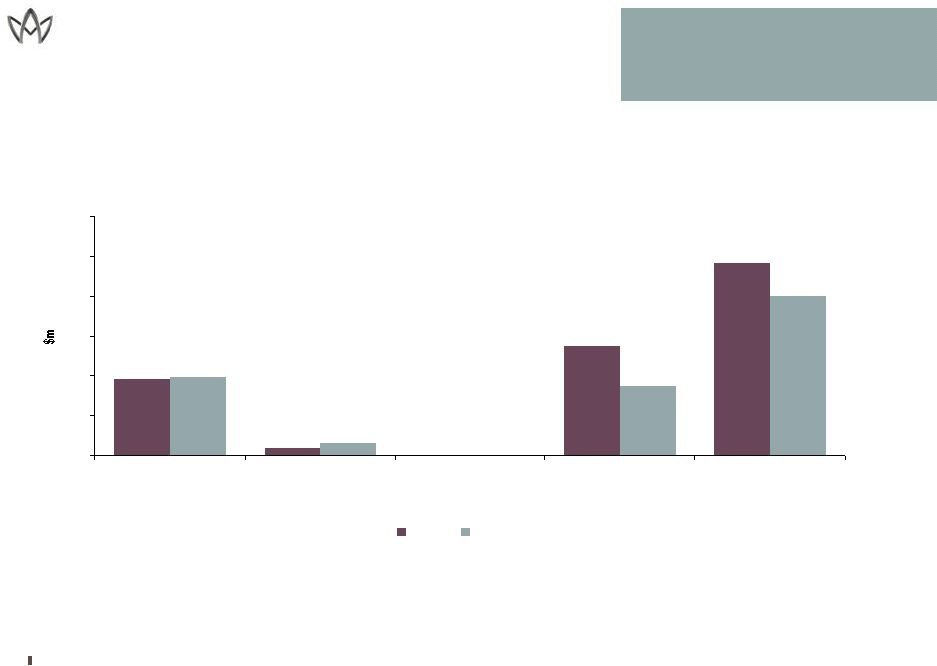
RESULTS BY BUSINESS SEGMENT: H1 2011
(*) Underwriting income is calculated as underwriting revenues, less underwriting
expenses. GWP
773
475
725
529
0
100
200
300
400
500
600
700
800
900
Reinsurance
Insurance
Underwriting Income *
27
5
8
(226)
-240
-190
-140
-90
-40
10
60
Reinsurance
Insurance
13
H1 2010
H1 2011 |
 AHL: NYSE
KEY PERFORMANCE METRICS: Q2 2011
14
Reinsurance
(10.4)%
(7.0)%
91 .4%
83.8%
24.2%
-50%
0%
50%
100%
150%
Q2 2010
Q2 2011
Prior year adj.
Adj. AY Combined Ratio
Catastrophe losses
76.8%
105.2%
Insurance
5.3%
(2.1)%
91.6%
94.9%
4.6%
-50%
0%
50%
100%
150%
Q2 2010
Q2 2011
Prior year adj.
Adj. AY Combined Ratio
Catastrophe losses
97.4%
96.9%
Total
(7.0)%
(2.2)%
96.2 %
89.1%
15.8%
-50%
0%
50%
100%
150%
Q2 2010
Q2 2011
Prior year adj.
Adj. AY Combined Ratio
Catastrophe losses
105.0%
86.9% |
 AHL: NYSE
KEY PERFORMANCE METRICS: H1 2011
15
Reinsurance
86.2%
19.8%
(6.9)%
(8.9)%
82.5%
64.4%
-50%
0%
50%
100%
150%
H1 2010
H1 2011
Prior year adj.
Adj. AY Combined Ratio
Catastrophe losses
95.4%
141.7%
Insurance
98.0%
95.4%
2.4%
-50%
0%
50%
100%
150%
H1 2010
H1 2011
Prior year adj.
Adj. AY Combined Ratio
Catastrophe losses
98.6%
97.8%
Total
93.6%
(3.3)%
(5.9)%
89.7%
12.0%
38.9%
-50%
0%
50%
100%
150%
H1 2010
H1 2011
Prior year adj.
Adj. AY Combined Ratio
Catastrophe losses
126.6%
98.4%
2.4%
(1.8%) |
 AHL: NYSE
FINANCIAL HIGHLIGHTS: TOTAL INVESTMENT
RETURN –
Q2 2011
16
58
6
82
146
59
10
121
-
52
0
30
60
90
120
150
180
Net Investment Income
Realized Investment
Gains/Losses
Other-Than-Temporary
Impairment Charges
Movement in Unrealized
Investment Gains/Losses
Total Investment Return
Q2 2010
Q2 2011
Annualized Total Investment
Return for the Quarter of 6.5% |
 AHL: NYSE
FINANCIAL HIGHLIGHTS: TOTAL INVESTMENT
RETURN –
H1 2011
17
117
18
108
114
18
19
151
243
-50
0
50
100
150
200
250
300
Net Investment Income
Realized Investment
Gains/Losses
Other-Than-Temporary
Impairment Charges
Movement in Unrealized
Investment Gains/Losses
Total Investment Return
H1 2010
H1 2011
Annualized Total Investment Return
for the Six Months of 4.1% |
 AHL: NYSE
FIXED INCOME PORTFOLIO BY ASSET TYPE
(US$ in millions)
ASSETS : INVESTMENT PORTFOLIO JUNE 30, 2011
TOTAL INVESTMENT PORTFOLIO AT MARKET VALUE
7,457.8
Short-term Securities
202.8
783.4
66.1
1,789.5
Equities
178.1
284.9
1,288.4
111.8
Cash and Cash Equivalents
1,074.1
754.4
107.2
559.9
193.5
Other Investments (Iris Re)
30.0
33.7
Q2 2011
1,485.0
1,822.7
1,461.7
2,688.4
Q1 2011
1,508.1
1,822.3
1,397.4
2,676.4
Unsecured Credit
Municipal bonds
Bonds backed by foreign
government
Foreign governments
Non-Agency Rated
Commercial Mortgage-
backed securities
Asset-backed securities
FDIC Guaranteed Corporate
bonds
Foreign corporates
Corporate bonds
Agency Debentures
Agency Rated Mortgage-
backed securities (GNMA,
FNMA, FHLB)
U.S. Government
Cash, Short-Term Securites and Other
Government/Agency
Structured Securities
18 |
 AHL: NYSE
ASPEN’S MODELLED WORLDWIDE NATURAL
CATASTROPHE
EXPOSURES
–
MAJOR
PERIL
ZONES
19
•
1 in 100 Year Tolerance: 17.5% of
Total Shareholders’
Equity
•
1 in 250 Year Tolerance: 25% of
Total Shareholders’
Equity
16.3%
10.4%
10.1%
8.3%
3.8%
1.7%
0%
5%
10%
15%
20%
US All Wind
Japan All Perils
European Wind
California EQ
US Pacific NW EQ
US Eastern EQ
100 year return period as % of Total Shareholders' Equity
20.5%
13.7%
12.8%
12.3%
6.7%
6.3%
0%
5%
10%
15%
20%
25%
US All Wind
European Wind
Japan All Perils
California EQ
US Pacific NW EQ
US Eastern EQ
250 year return period as % of Total Shareholders' Equity
Source: Aspen analysis using RMS v11.0 occurrence exceedance probability as at July 1,
2011 and Shareholders’ Equity of $3,104.6 million at June 30, 2011. US Wind
is a blend of RMS v11 and AIR v12.5 weighted 50% for each model. European Wind remains based on RMS v10 given v11 for this peril has only just been released and is currently being tested
|
 AHL: NYSE
2011 GUIDANCE
20
Actual 2010 Results
Initial Guidance
Revised
Guidance
April 28, 2011
Revised Guidance
July 28, 2011
Gross Written Premium
$2.1 billion
$2.1 billion ±
5%
$2.1 billion ±
5%
$2.1 billion ±
5%
% Premium Ceded
9.3% of GEP
8% -
12% of GEP
10% -14% of GEP
11% -14% of GEP
Combined Ratio
96.7%
93% -98%
105% -
110%
109% -
114%
Tax Rate
8.1%
8% to 12%
8% to 12%
8% to 12%
Remaining Cat-Load
$181 million
$170
million
(assuming normal loss
experience)
$140
million
(assuming normal loss
experience)
$110
million
(assuming normal loss
experience)
February 8, 2011 |
 AHL: NYSE
BUSINESS PERFORMANCE AND MARKET OUTLOOK: KEY
Key
Performance
Absolute
Pricing
Relative Price
Movement
Terms and
Conditions
Volume change
Outlook
1
2
3
4
5
6
Excellent
Excellent
Significantly Up
Excellent
Significantly Up
Excellent
Good
Good
Up
Good
Up
Good
Satisfactory
Satisfactory
Flat
Satisfactory
Flat
Satisfactory
Of Concern
Of Concern
Down
Of Concern
Down
Of Concern
Unsatisfactory
Unsatisfactory
Significantly Down
Unsatisfactory
Significantly Down
Unsatisfactory
21 |