Attached files
| file | filename |
|---|---|
| 8-K - FORM 8-K - TOTAL SYSTEM SERVICES INC | g27747ae8vk.htm |
| EX-99.1 - EX-99.1 - TOTAL SYSTEM SERVICES INC | g27747aexv99w1.htm |
Exhibit 99.2

| 2011 Second Quarter Results July 26, 2011 |

| Forward-Looking Statements This presentation and comments made by management contain forward-looking statements including, among others, statements regarding the expected future operating results of TSYS. These statements are based on management's current expectations and assumptions and are subject to risks, uncertainties and changes in circumstances. Forward-looking statements include all statements that are not historical facts and can be identified by the use of forward- looking terminology such as the words "believe," "expect," "anticipate," "intend," "plan," "estimate" or similar expressions. Actual results may differ materially from those set forth in the forward-looking statements due to a variety of factors. More information about these risks, uncertainties and factors may be found in TSYS' 2010 Annual Report on Form 10-K, Quarterly Reports on Form 10-Q and Current Reports on Form 8-K. TSYS does not assume any obligation to update any forward-looking statements as a result of new information, future developments or otherwise. 2 (c)2011 Total System Services, Inc.(r) Proprietary. All rights reserved worldwide. |

| Use of Non-GAAP Financial Measures This slide presentation contains certain non-GAAP financial measures determined by methods other than in accordance with generally accepted accounting principles. Such non-GAAP financial measures include the following: revenues before reimbursable items; operating margin excluding reimbursable items; revenues measured on a constant currency basis; the impact of termination fees on total revenues, operating income, income from continuing operations, and earnings per share from continuing operations; free cash flow; and EBITDA. The most comparable GAAP measures to these measures are revenues; operating margin; revenues; revenues, operating income, income from continuing operations and earnings per share from continuing operations; cash flows from operating activities; and net income, respectively. Management uses these non-GAAP financial measures to assess the performance of TSYS' core business. TSYS believes that these non-GAAP financial measures provide meaningful additional information about TSYS to assist investors in evaluating TSYS' operating results. These non- GAAP financial measures should not be considered as a substitute for operating results determined in accordance with GAAP and may not be comparable to other similarly titled measures of other companies. The computations of the non-GAAP financial measures used in this slide presentation are set forth in the Appendix to this slide presentation. 3 (c)2011 Total System Services, Inc.(r) Proprietary. All rights reserved worldwide. |

| Phil Tomlinson Chairman and Chief Executive Officer |

| Jim Lipham Chief Financial Officer |

| Consolidated Selected Financial Highlights 6 (c)2011 Total System Services, Inc.(r) Proprietary. All rights reserved worldwide. $ 447,554 $ 430,887 3.9 % Total Revenues $ 876,985 $ 844,350 3.9 % 380,211 362,739 4.8 Revenues Before Reimbursable Items 742,854 705,400 5.3 78,529 79,829 (1.6 ) Operating Income 151,557 159,541 (5.0 ) 53,747 49,977 7.5 Income from Continuing Operations Available to TSYS Common Shareholders 102,537 101,731 0.8 2,135.7 1,861.5 14.7 Total Cardholder Transactions (in millions) 4,088.5 3,601.0 13.5 $0.28 $0.25 10.1 Earnings Per Share from Continuing Operations Attributable to TSYS Common Shareholders $0.53 $0.52 3.0 YTD 2011 YTD 2010 Percent Change (in thousands except per share data) 2nd Qtr 2011 2nd Qtr 2010 Percent Change |

| Consolidated Selected Financial Highlights 7 (c)2011 Total System Services, Inc.(r) Proprietary. All rights reserved worldwide. $ 447,554 $ 421,359 6.2 % Total Revenues $ 876,985 $ 811,683 8.0 % 380,211 353,211 7.6 Revenues Before Reimbursable Items 742,854 672,733 10.4 78,529 70,301 11.7 Operating Income 151,557 126,874 19.5 53,747 43,892 22.5 Income from Continuing Operations Available to TSYS Common Shareholders 102,537 80,720 27.0 2,135.7 1,861.5 14.7 Total Cardholder Transactions (in millions) 4,088.5 3,601.0 13.5 $0.28 $0.22 25.4 Earnings Per Share from Continuing Operations Attributable to TSYS Common Shareholders $0.53 $0.41 29.8 YTD 2011 YTD 2010 Percent Change (in thousands except per share data) 2nd Qtr 2011 2nd Qtr 2010 Percent Change Excluding Termination Fees (non-GAAP) Excluding Termination Fees (non-GAAP) |

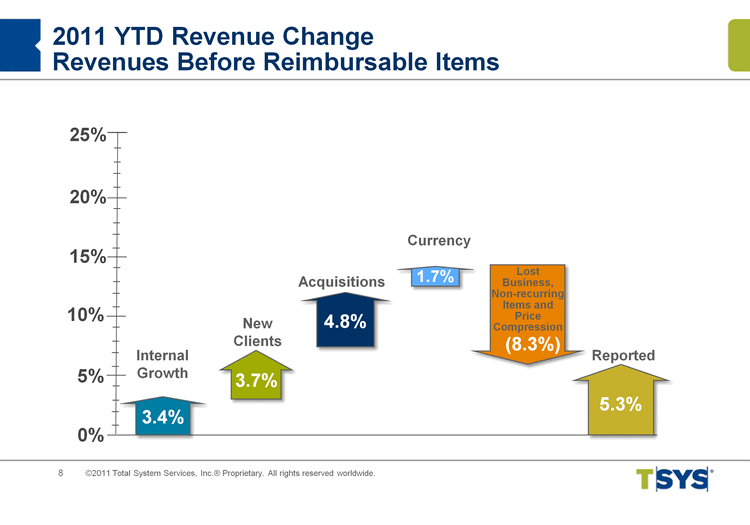
| 2011 YTD Revenue Change Revenues Before Reimbursable Items 8 (c)2011 Total System Services, Inc.(r) Proprietary. All rights reserved worldwide. 10% 25% 5% 0% 3.4% Internal Growth New Clients 3.7% Acquisitions 4.8% Lost Business, Non-recurring Items and Price Compression (8.3%) Reported 5.3% Currency 20% 15% 1.7% |

| Consolidated Accounts on File Portfolio Summary Consumer Credit 187.6 180.9 3.7 187.6 183.4 2.3 Government Services 30.0 27.0 11.3 30.0 29.0 3.6 Retail 23.7 23.6 0.4 23.7 24.6 (3.5 ) Total Consumer 241.3 231.5 4.2 241.3 237.0 1.8 Commercial 55.2 48.2 14.7 55.2 51.1 8.1 Other 6.7 5.5 20.1 6.7 6.3 5.6 Subtotal 303.2 285.2 6.3 303.2 294.4 3.0 Prepaid /Stored Value 72.8 47.6 53.1 72.8 62.3 16.9 Total AOF 376.0 332.8 13.0 376.0 356.7 5.4 (in millions) June 2011 June 2010 % Change June 2011 March 2011 % Change 9 (c)2011 Total System Services, Inc.(r) Proprietary. All rights reserved worldwide. |

| Key Drivers 2Q 2011 Year Over Year Segment Financial Highlights Client deconversion and termination fees $9.5 million in 2Q 2010 revenues associated with termination fees $3.7 million revenue decrease associated with deconverted clients Volumes Accounts on file were 328.3 million Total cardholder transactions were 1,795.1 million, an increase of 14.8% Revenues $233.9 million Excluding Reimbursables $198.8 million Operating Income $64.1 million Operating Margin 27.4% Excluding Reimbursables 32.2% Same Client Transactions 1,757.5 million Increase of 12.7% North America Services 10 (c)2011 Total System Services, Inc.(r) Proprietary. All rights reserved worldwide. |

| Key Drivers 2Q 2011 Year Over Year Segment Financial Highlights Favorable currency impact on revenues of $8.8 million Conversion of new clients Volumes Accounts on file were 47.8 million Total cardholder transactions were 340.6 million, an increase of 14.4% 11 (c)2011 Total System Services, Inc.(r) Proprietary. All rights reserved worldwide. Revenues $97.7 million Constant currency basis $88.9 million Operating Income $10.1 million Operating Margin 10.4% Excluding Reimbursables 10.8% Same Client Transactions 314.7 million Increase of 5.7% International Services |

| Key Drivers 2Q 2011 Year Over Year Segment Financial Highlights Acquisition of TermNet Decline in revenues associated with deconverted clients Volumes Point-of-Sale Transactions were 1,269.0 million, a decrease of 10.7% Excluding deconverted clients, Point-of-Sale Transactions increased 2.8% 12 (c)2011 Total System Services, Inc.(r) Proprietary. All rights reserved worldwide. Revenues $123.1 million Excluding Reimbursables $93.0 million Operating Income $25.7 million Operating Margin 20.9% Excluding Reimbursables 27.6% Merchant Services |

| Cash Flow Strength: 2011 TTM Consolidated Financial Highlights (in millions) TTM = Trailing Twelve Months 13 (c)2011 Total System Services, Inc.(r) Proprietary. All rights reserved worldwide. |

| Strategic Fit Growth Accretion Comparison Multiples Capital Structure Other TSYS M&A Financial Objectives Components Measurements 14 (c)2011 Total System Services, Inc.(r) Proprietary. All rights reserved worldwide. Payment industry Culture Geographic region Product Focus within the payment industry Culture fit with TSYS Leverage platform scale in new geographic areas Expand product offering Revenue EBITDA Margin Expansion Revenue growth of target improves TSYS' growth EBITDA growth of target improves TSYS' growth Achieve greater scale/higher margins Evaluate historical performance Cash GAAP Must generate cash accretion Should generate GAAP accretion in near term (Primary difference between cash is deal amortization) EV/EBITDA Price/Sales P/E Target's valuation compared to peers using various metrics Premium in-line with performance vs. peers Evaluate consolidated proforma metrics Remain investment grade Leverage no more than 2.5-3.0x Willing to leverage up for short period but would aggressively pay down leverage Historical leverage well below 1.0x Maintain flexibility through reasonable leverage Discounted Cash Flows Asset valuation Debt and equity obligations Target's returns in excess of WACC Goodwill/intangibles valuation Ensure TSYS standalone cash flow fulfills interest expense and dividend payments |

| Appendix |

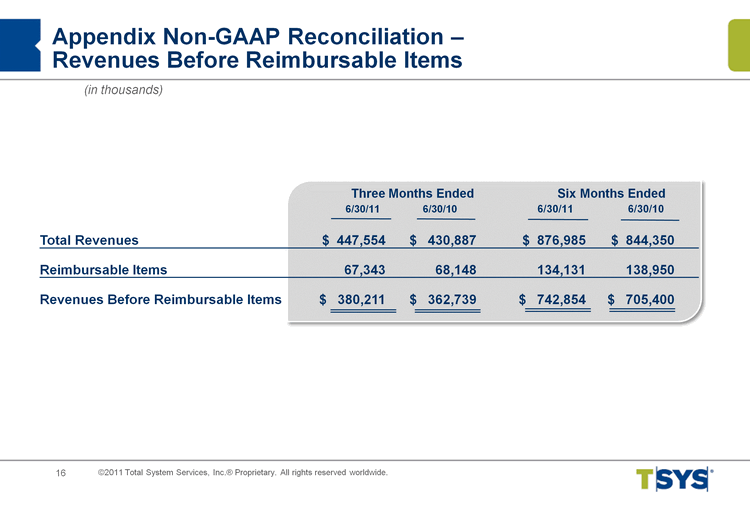
| Appendix Non-GAAP Reconciliation - Revenues Before Reimbursable Items Three Months Ended Six Months Ended 6/30/11 6/30/10 6/30/11 6/30/10 Total Revenues $ 447,554 $ 430,887 $ 876,985 $ 844,350 Reimbursable Items 67,343 68,148 134,131 138,950 Revenues Before Reimbursable Items $ 380,211 $ 362,739 $ 742,854 $ 705,400 (in thousands) 16 (c)2011 Total System Services, Inc.(r) Proprietary. All rights reserved worldwide. |

| Three Months Ended 6/30/11 6/30/10 Three Months Ended 6/30/11 6/30/10 Three Months Ended 6/30/11 6/30/10 Operating Income (a) $ 64,068 $ 66,218 $ 10,122 $ 11,673 $ 25,708 $ 23,367 Total Revenues (b) 233,903 236,810 97,670 77,987 123,084 123,906 Reimbursable Items 35,128 34,749 3,892 3,218 30,043 32,017 Revenues Before Reimbursable Items(c) 198,775 202,061 93,778 74,769 93,041 91,889 Operating Margin (a)/(b) 27.39 % 27.96 % 10.36 % 14.97 % 20.89 % 18.86 % Operating Margin Excluding Reimbursables (a)/(c) 32.23 % 32.77 % 10.79 % 15.61 % 27.63 % 25.43 % Segment Operating Income - Termination Fees (d) $9,528 Operating Income Excluding Termination Fees (e) 56,690 Termination fees (f) 9,528 Revenues before reimbursable items excluding Termination Fees (g) 192,533 Operating margin excluding reimbursables (e)/(g) 29.44 % Appendix Non-GAAP Reconciliation - Segment Operating Margin Excluding Reimbursable Items North America International Merchant (in thousands) 17 (c)2011 Total System Services, Inc.(r) Proprietary. All rights reserved worldwide. |

| Six Months Ended June 30, 2010 Three Months Ended June 30, 2010 GAAP Less Termination Fees Non-GAAP GAAP Less Termination Fees Non-GAAP Total Revenues $430,887 9,528 $421,359 $844,350 32,667 $811,683 Less Reimbursable Items $68,148 --- $68,148 $138,950 --- $138,950 Revenues Before Reimbursable Items $362,739 9,528 $353,211 $705,400 32,667 $627,733 Operating Income $79,829 9,528 $70,301 $159,541 32,667 $126,874 Income from Continuing Operations Available to TSYSCommon Shareholders $49,977 6,085 $43,892 $101,731 21,011 $80,720 Average Common Shares and Participating Securities 197,344 197,344 197,344 197,260 197,260 197,260 Earnings Per Share Available to TSYS Common Shareholders* $0.25 0.03 $0.22 $0.52 0.11 $0.41 Appendix Non-GAAP Reconciliation - Excluding Termination Fees (in thousands) NOTE: Earnings per share may not foot due to rounding. 18 (c)2011 Total System Services, Inc.(r) Proprietary. All rights reserved worldwide. |

| Six Months Ended 6/30/11 6/30/10 Percentage Change Three Months Ended 6/30/11 6/30/10 Percentage Change Appendix Non-GAAP Reconciliation - Constant Currency (1) Reflects current period results on a non-GAAP basis as if foreign currency rates did not change from the comparable prior year period. (2) Reflects the impact of calculated changes in foreign currency rates from the comparable period. (in thousands) Consolidated: Constant Currency (1) $ 438,806 $ 430,887 1.8 % $ 864,801 $ 844,350 2.4 % Foreign Currency (2) 8,748 --- 12,184 --- Total Revenues 447,554 430,887 3.9 % 876,985 844,350 3.9 % International Services: Constant Currency (1) $ 88,901 $ 77,987 14.0 % $ 176,163 $ 157,379 11.9 % Foreign Currency (2) 8,769 --- 12,217 --- Total Revenues $97,670 $77,987 25.2 % $188,380 $157,379 19.7 % 19 (c)2011 Total System Services, Inc.(r) Proprietary. All rights reserved worldwide. |

| Appendix Non-GAAP Reconciliation - EBITDA Trailing Twelve Months Ended 6/30/2011 Net Income $ 205,383 Adjusted for: Add: Discontinued Operations 2,544 Deduct: Equity in Income of Equity Investments (6,768 ) Add: Income Taxes 98,534 Add: Nonoperating expense 1,752 Add: Depreciation and Amortization 167,092 EBITDA $ 468,537 (in thousands) 20 (c)2011 Total System Services, Inc.(r) Proprietary. All rights reserved worldwide. |

| Appendix Non-GAAP Reconciliation - Free Cash Flow Trailing Twelve Months Ended 6/30/2011 Cash Flows from Operating Activities $ 392,746 Less: Purchase of Property and Equipment (41,901 ) Additions to Licensed Computer Software from Vendors (54,896 ) Additions to Internally Developed Computer Software (25,302 ) Additions to Contract Acquisition Costs (71,788 ) Free Cash Flow $ 198,859 (in thousands) 21 (c)2011 Total System Services, Inc.(r) Proprietary. All rights reserved worldwide. |
