Attached files
| file | filename |
|---|---|
| 8-K - FORM 8-K - OMNICARE INC | form8-k2qearnings.htm |
| EX-99.1 - EXHIBIT 99.1 - OMNICARE INC | exhibit99-1.htm |

Second Quarter 2011
Financial Results
Financial Results
Supplemental Slides
Exhibit 99.2

Forward-Looking Statements
Except for historical information discussed, the statements made today and
listed within the following presentation slides are forward-looking statements
that involve risks and uncertainties. Investors are cautioned that such
statements are only predictions and that actual events or results may differ
materially.
listed within the following presentation slides are forward-looking statements
that involve risks and uncertainties. Investors are cautioned that such
statements are only predictions and that actual events or results may differ
materially.
These forward-looking statements speak only as of the date this
presentation was originally given. We undertake no obligation to publicly
release the results of any revisions to the forward-looking statements made
today, to reflect events or circumstances after today or to reflect the
occurrence of unanticipated events.
presentation was originally given. We undertake no obligation to publicly
release the results of any revisions to the forward-looking statements made
today, to reflect events or circumstances after today or to reflect the
occurrence of unanticipated events.
To facilitate comparisons and enhance understanding of core operating
performance, certain financial measures have been adjusted from the
comparable amount under Generally Accepted Accounting Principles
(GAAP). A detailed reconciliation of adjusted numbers to GAAP is posted
in the Investor Relations section of our Web site at http://ir.omnicare.com.
Additionally, all amounts are presented on a continuing operations basis,
unless otherwise stated.
2

Table of Contents
Second Quarter 2011 Highlights………..……………………..……………..
Operating Metrics - Script Data……………………………………………….
Operating Metrics - Bed Data…………………………………………………
Adjusted Gross Profit………………...………………………………………...
Adjusted Net Income…………………………………………..………………
Cash Flows…………………………………………………...…………………
Cash Deployment………………..……………………………………..………
Capital Structure……………………………………………………………….
2011 Guidance………..…...…………………………………………………..
Longer-Term Targets……………………………………......…………………
Appendix………………………………………………………………………..
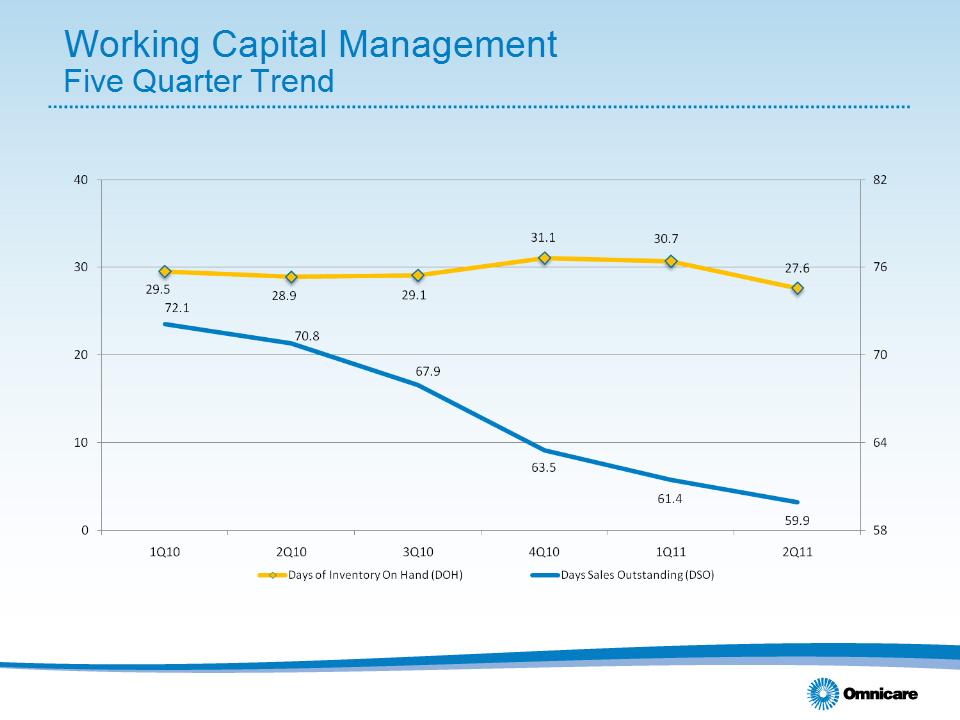
Working Capital Management………………………………………………..
Selected Branded Drug Patent Expirations…………………………….......
4
5
6
7
8
9
10
11
12
13
14
15
16
3

Second Quarter 2011 Highlights
• Gross profit increased 0.4% sequentially to $336.4M on 2.0% increase in sales
– Gross margin sequentially lower by 34 bps to 21.62%, reflecting seasonably weaker
quarter and full quarter impact of merit increase
quarter and full quarter impact of merit increase
• Scripts increased 2.0% over 2Q10; 1.0% lower than 1Q11
– Utilization, census weaker sequentially due to seasonality
– Generic dispensing rate increased 60 basis points sequentially
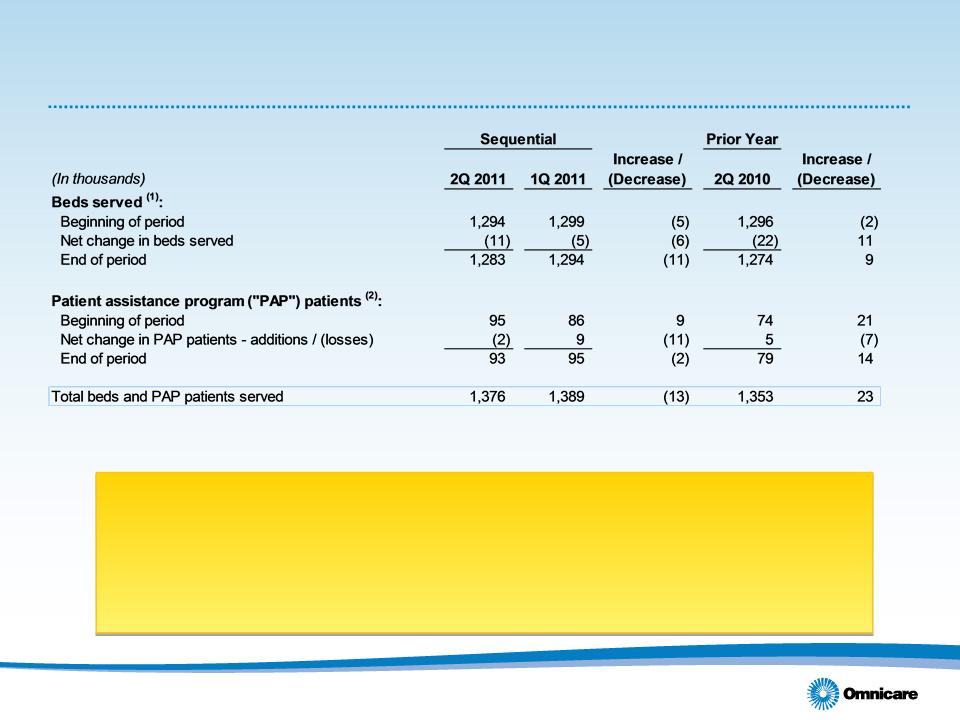
• Qtr. ending number of beds/patient assistance program (PAP) patients up 23,000
year-over-year
year-over-year
– PAP patients up 14,000; Beds 9,000 higher
– Net bed loss of 11,000 relatively even with 1Q11 organic net bed loss of 9,000
• Cash flows from continuing operations of $136.9M; 2011 YTD cash flows from
continuing operations of $281 million represents highest six-month start to any
year in the company’s history
continuing operations of $281 million represents highest six-month start to any
year in the company’s history
• Sequential adjusted EBITDA(1) relatively even at $146.3 million
• Adjusted EPS(1) of $0.50 as compared to 1Q11 of $0.51 and 2Q10 of $0.49
• Profitable GPO was divested in 2Q11
• $45.8 million returned to shareholders through share repurchases and dividends
4
(1) Excludes special items. A reconciliation of non-GAAP information has been attached to our press release and is also available on our Web site under
‘Supplemental Financial Information’ from the ‘Investors’ page.
‘Supplemental Financial Information’ from the ‘Investors’ page.

Operating Metrics
Script Data
Script Data
5
(1) 1Q 2011 and 2Q 2010 numbers revised to reflect the inclusion of over-the-counter scripts.
(2) Excludes scripts dispensed in Omnicare’s specialty businesses and other non-institutional settings.
(3) Generic prescriptions dispensed as a percentage of institutional pharmacy scripts excludes over-the-counter scripts.
• Scripts up 2.0% from 2Q10 driven
primarily by increased utilization
primarily by increased utilization
• Sequentially, scripts were down 1.0%
reflecting seasonal impact on
utilization, census
reflecting seasonal impact on
utilization, census
• Generic dispensing rate climbed 60 bps
sequentially to 78.0% due primarily to
additional generic drug introductions
sequentially to 78.0% due primarily to
additional generic drug introductions
Operating Metrics
Bed Data
Bed Data
6
(1) Beds reported as capacity in institutional settings and unique patients serviced in non-institutional settings (clinic, retail, hospice)
(2) PAP programs served by Omnicare’s specialty pharmacy business.
• 8.7% sequential improvement in bed losses, 130 bps sequential improvement
in customer retention rate to 93.7%
in customer retention rate to 93.7%
• Beds added by acquisition:
• 2Q11 - 0
• 1Q11 - 3,000
• 2Q10 - 2,000

Adjusted Gross Profit (1)
7
(2) Excludes special items. A reconciliation of non-GAAP information has been attached to our press release and is also available on our Web site under
‘Supplemental Financial Information’ from the ‘Investors’ page.
‘Supplemental Financial Information’ from the ‘Investors’ page.
(3) Includes all scripts dispensed in the Company’s Pharmacy Services.

Adjusted Net Income (1),(2)
8
(1) All numbers shown exclude special items and discontinued operations. A reconciliation of non-GAAP information has been attached to our press release
and is also available on our Web site under ‘Supplemental Financial Information’ from the ‘Investors’ page.
and is also available on our Web site under ‘Supplemental Financial Information’ from the ‘Investors’ page.
(2) Each amount is reported independently. The sum of the individual amounts may not equal the sum of the separately presented amounts due to rounding.

Cash Flows(1)
9
• Year-to-date cash flows from operating activities of continuing operations of $280.9M represents the largest cash flow generated in the
Company’s history in the first half of the fiscal year.
Company’s history in the first half of the fiscal year.
• 2Q11 cash flows benefitted from $23.3 million tax refund
• 2Q10 cash flows impacted by $37.9 million settlement payment and $7.3 million tender premium
• Sequential decrease in cash flow primarily resulting from interest payments on long-term debt being paid in 2Q
(1) Each amount is reported independently. The sum of individual amounts may not equal the sum of the separately presented amounts due to rounding.

Cash Deployment
10
(1) Through the first six months of 2011, Omnicare repurchased $175 million of 6.125% senior subordinated notes due 2013. During the first six months of
2010, Omnicare repurchased $125 million of senior term A loans due 2010 and $217 million of 6.75% senior subordinated notes due 2013.
2010, Omnicare repurchased $125 million of senior term A loans due 2010 and $217 million of 6.75% senior subordinated notes due 2013.
(2) Cumulative % Returned = (Dividends Paid + Share Repurchases) / 12/31/10 Market Capitalization of $2,961.0 million.
• Repurchased an additional 1.25 million
shares ($41.3 million) during 2Q11 (in
addition to 1.0 million shares
repurchased in 1Q11 and 4.4 million
repurchased in 2010)
shares ($41.3 million) during 2Q11 (in
addition to 1.0 million shares
repurchased in 1Q11 and 4.4 million
repurchased in 2010)
• $129 million of authorization remaining
under current share repurchase program
as of June 30, 2011.
under current share repurchase program
as of June 30, 2011.
• 2Q11 dividend increased 23% to $0.04
per share
per share

(1) Assumes convertible debentures due 2035 are put to the company in 2015 with related tax recapture included and debt amounts shown
are exclusive of unamortized debt discount.
are exclusive of unamortized debt discount.
Capital Structure
Goal is to smooth out maturities to limit refinancing risk, adding to
steps already taken in 2010 to improve our flexibility
steps already taken in 2010 to improve our flexibility
11

2011 Guidance
12
(1) Guidance provided on February 24, 2011
(2) Guidance provided on July 26, 2011.
(3) Excludes special items and discontinued operations.
|
|
Previous Guidance (1)
|
Current Guidance (2)
|
|
• Revenues
|
$6.0B to $6.1B
|
$6.0B to $6.1B
|
|
• Adjusted Diluted EPS (3)
|
$2.05 to $2.15
|
$2.05 to $2.15
|
|
• Cash Flow from Operations (3)
|
$375M to $425M
|
$400M to $450M
|
Increased cash flow guidance and reaffirmed sales and EPS guidance
(Note: original EPS guidance included Tidewater, which has been divested and reclassified to
discontinued operations for the full year - it generated $0.01 per share in the first quarter)
discontinued operations for the full year - it generated $0.01 per share in the first quarter)

Longer-Term Targets (1)
13
We believe investments made in 2011 will position the
company to begin achieving some of these targets in 2012
company to begin achieving some of these targets in 2012
(1) Not intended to represent expectations for any given year.
(2) Board approval required for share repurchases and/or dividends. The number could vary by year based on available acquisitions and capital
expenditure plans.
expenditure plans.
|
|
Target
|
|
• Adjusted Diluted EPS
|
Double digit three-year CAGR
for the year ending 2013
|
|
• Cash Flow from Operations
|
$450 million annually
|
|
• Capital Returned to Shareholders
|
Approximately 25% per year (2)
|
|
• Capital Structure
|
Focus on continued debt reduction,
management of maturity schedules
|

Appendix
14
15

16
(1) All generic launches are subject to change due to litigation or pediatric exclusivity.
(2) Drugs already launched shown in gray and italics
|
2Q 2011
|
3Q-4Q 2011
|
FY 2012
|
|
Aromasin
|
Entocort EC
|
Actos
|
|
Femara
|
Levaquin IV
|
Detrol
|
|
Furadantin Susp
|
Arixtra
|
Diovan
|
|
Concerta
|
Fazaclo
|
Geodon
|
|
Elastat
|
Gabitril
|
Lexapro
|
|
Ferrlecit
|
Lipitor
|
Lidoderm
|
|
Xibrom
|
Primaxin
|
Plavix
|
|
Carbatrol
|
Uroxatrol
|
Seroquel
|
|
Nasacort AQ
|
Zyprexa
|
Singulair
|
|
Levaquin tabs
|
|
Xopenex
|
|
Levaquin Oral Liq
|
|
|
Selected Branded Drug Patent Expirations (1),(2)

Second Quarter 2011
Financial Results
Financial Results
Supplemental Slides