Attached files
| file | filename |
|---|---|
| 8-K - FORM 8-K - OCCIDENTAL PETROLEUM CORP /DE/ | form8k-20110726.htm |
| EX-99.1 - EXHIBIT 99.1 - OCCIDENTAL PETROLEUM CORP /DE/ | ex99_1-20110726.htm |
| EX-99.2 - EXHIBIT 99.2 - OCCIDENTAL PETROLEUM CORP /DE/ | ex99_2-20110726.htm |
| EX-99.5 - EXHIBIT 99.5 - OCCIDENTAL PETROLEUM CORP /DE/ | ex99_5-20110726.htm |
| EX-99.3 - EXHIBIT 99.3 - OCCIDENTAL PETROLEUM CORP /DE/ | ex99_3-20110726.htm |
EXHIBIT 99.4

Occidental Petroleum Corporation
Second Quarter 2011 Earnings Conference Call
July 26, 2011
Second Quarter 2011 Earnings Conference Call
July 26, 2011
1

2
Second Quarter 2011 Earnings - Highlights
Second Quarter 2011 Earnings - Highlights
• Core Results - $1.8 Billion vs. $1.1 Billion in 2Q10
– Core EPS $2.23 (diluted) vs. $1.32 in 2Q10.
• Net Income - $1.8 Billion vs. $1.1 Billion in 2Q10
– EPS $2.23 (diluted) vs. $1.31 in 2Q10.
2

3
($ in millions)
• Core Results for 2Q11 of $2.6 Billion vs. $1.9 Billion in 2Q10
– The improvement in 2011 was driven mainly by higher commodity prices. Sales volumes for
2Q11 and 2Q10 were flat at 705 mboe p/d. Production volumes were 715 mboe p/d in 2Q11,
compared to 701 mboe p/d in 2Q10.
2Q11 and 2Q10 were flat at 705 mboe p/d. Production volumes were 715 mboe p/d in 2Q11,
compared to 701 mboe p/d in 2Q10.
Second Quarter 2011 Earnings - Oil & Gas
Segment Variance Analysis - 2Q11 vs. 2Q10
Segment Variance Analysis - 2Q11 vs. 2Q10
3

4
2Q11 2Q10
Reported Segment Earnings ($mm) $2,624 $1,867
WTI Oil Price ($/bbl) $102.56 $78.03
NYMEX Gas Price ($/mcf) $4.23 $4.18
Oxy’s Realized Prices
Worldwide Oil ($/bbl) $103.12 $74.39
+ 39% year-over-year
Worldwide NGLs ($/bbl) $57.67 $44.08
+ 31% year-over-year
US Natural Gas ($/mcf) $4.27 $4.19
+ 2% year-over-year
Second Quarter 2011 Earnings - Oil & Gas Segment
4

5
Second Quarter 2011 Earnings - Oil & Gas Production
Second Quarter 2011 Earnings - Oil & Gas Production
• Production guidance assumptions we gave in the 1Q11 conference
call assumed a $95 WTI average oil price.
call assumed a $95 WTI average oil price.
• Actual average 2Q11 oil price of $102.56 reduced our production
volumes by about 5 mboe p/d.
volumes by about 5 mboe p/d.
– Domestic production volumes were 424 mboe p/d, compared to our
guidance of 425 mboe p/d. The higher crude oil prices reduced Long
Beach volumes by about 1 mboe p/d.
guidance of 425 mboe p/d. The higher crude oil prices reduced Long
Beach volumes by about 1 mboe p/d.
– Latin America volumes were 33 mboe p/d.
– In the Middle East region:
• We recorded no production in Libya, consistent with our guidance.
• In Iraq, we produced 5 mboe p/d. The decline from 1Q11 volumes was due to
the timing of development spending.
the timing of development spending.
• Yemen production was 23 mboe b/d, compared to 33 mboe p/d in 1Q11. Civil
unrest and operational issues reduced our production by 3 mboe p/d. Higher
prices and lower development spending rates cut volumes by 7 mboe p/d.
unrest and operational issues reduced our production by 3 mboe p/d. Higher
prices and lower development spending rates cut volumes by 7 mboe p/d.
• The remainder of the Middle East had production of 230 mboe p/d, vs. 235
mboe p/d in 1Q11. Qatar’s production was lower by 7 mboe p/d mainly due to
planned maintenance and mechanical issues.
mboe p/d in 1Q11. Qatar’s production was lower by 7 mboe p/d mainly due to
planned maintenance and mechanical issues.
5

6
Second Quarter 2011 Earnings - Oil & Gas Sales
• Our 2Q11 sales volume guidance, which assumed a $95 WTI oil
price, was 725 mboe p/d, which translates to about 720 mboe
p/d at the higher actual prices for the quarter.
price, was 725 mboe p/d, which translates to about 720 mboe
p/d at the higher actual prices for the quarter.
• Our actual volumes were 705 mboe p/d.
• The lower volumes resulted mainly from the lower production
in Yemen and Qatar and the timing of liftings in Oman and
Qatar.
in Yemen and Qatar and the timing of liftings in Oman and
Qatar.
• 2Q11 realized prices improved for all our products vs. 1Q11.
• Our worldwide crude oil price was $103.12 p/b, an increase of
12%, worldwide NGLs were $57.67 p/b, an improvement of 10%,
and domestic natural gas prices were $4.27 p/mcf, an increase
of 1%.
12%, worldwide NGLs were $57.67 p/b, an improvement of 10%,
and domestic natural gas prices were $4.27 p/mcf, an increase
of 1%.
• The 2Q11 realized oil price represents 101% of the average WTI
price for the quarter.
price for the quarter.
6

7
Second Quarter 2011 Earnings - Oil & Gas
Segment - Cash Production Costs and Taxes
Segment - Cash Production Costs and Taxes
Second Quarter 2011 Earnings - Oil & Gas
Segment - Cash Production Costs and Taxes
Segment - Cash Production Costs and Taxes
• Oil and gas cash production costs were $11.88 a barrel
for the first six months of 2011, compared with last year's
twelve-month costs of $10.19 a barrel.
for the first six months of 2011, compared with last year's
twelve-month costs of $10.19 a barrel.
– The cost increase reflects more workover and maintenance
activity and higher support costs.
activity and higher support costs.
• Taxes - other than on income, which are directly related
to product prices, were $2.36 per barrel for the first half of
2011, compared to $1.83 per barrel for all of 2010.
to product prices, were $2.36 per barrel for the first half of
2011, compared to $1.83 per barrel for all of 2010.
• Total exploration expense was $62 mm in 2Q11.
7

8
($ in millions)
*Higher feedstock costs
• Core Results for 2Q11 were $253 mm vs. $219 mm in 1Q11.
– The second quarter results, one of the highest ever reported for the Chemical segment,
reflect higher margins and volumes across most product lines.
reflect higher margins and volumes across most product lines.
Second Quarter 2011 Earnings - Chemical
Segment Variance Analysis - 2Q11 vs. 1Q11
Segment Variance Analysis - 2Q11 vs. 1Q11
8
9
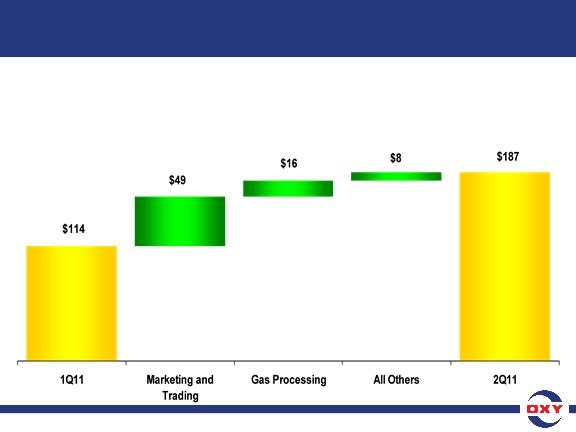
($ in millions)
• Core Results for 2Q11 were $187 mm vs. $114 mm in 1Q11,
and $13 mm in 2Q10.
and $13 mm in 2Q10.
– The increase from 1Q11 earnings was mainly due to higher marketing income and improved
margins in the gas processing business.
margins in the gas processing business.
Second Quarter 2011 Earnings - Midstream
Segment Variance Analysis - 2Q11 vs. 1Q11
Segment Variance Analysis - 2Q11 vs. 1Q11
9

10
Second Quarter 2011 Earnings - Taxes
• The worldwide effective tax rate was 38% for 2Q11.
– Our higher proportionate domestic income brought us closer to
the US statutory rates.
the US statutory rates.
• Our 2Q11 US and foreign tax rates are included in the
“Investor Relations Supplemental Schedules.”
“Investor Relations Supplemental Schedules.”
10

11
Second Quarter 2011 Earnings -
Six Months Results & Capital Spending
Six Months Results & Capital Spending
Second Quarter 2011 Earnings -
Six Months Results & Capital Spending
Six Months Results & Capital Spending
YTD2011 YTD2010
• Core Income ($mm) $3,412 $2,174
• Core EPS (diluted) $4.19 $2.67
• Net Income ($mm) $3,366 $2,127
• EPS (diluted) $4.13 $2.61
• Cash flow from operations for 1H11 was $5.6 billion.
• Capital spending was $3.0 billion for 1H11 of which $1.6
billion was spent in 2Q11.
billion was spent in 2Q11.
– Year to-date capital expenditures by segment were 85% in Oil and Gas,
13% in Midstream and the remainder in Chemicals.
13% in Midstream and the remainder in Chemicals.
11

12
Cash Flow
From
Operations
$5,600
From
Operations
$5,600
Beginning
Cash
$2,600
12/31/10
Cash
$2,600
12/31/10
($ in millions)
Shah - $500
Note: See attached GAAP reconciliation.
– Free cash flow from continuing operations after capex and dividends
but before acquisition and debt activity was about $1.8 billion.
but before acquisition and debt activity was about $1.8 billion.
Second Quarter 2011 Earnings -
2011 YTD Cash Flow
2011 YTD Cash Flow
12

13
Second Quarter 2011 Earnings -
Net Acquisition Expenditures
Net Acquisition Expenditures
Second Quarter 2011 Earnings -
Net Acquisition Expenditures
Net Acquisition Expenditures
• Our net acquisition expenditures in 1H11 were $1.2
billion, which are net of proceeds from the sale of our
Argentina operations.
billion, which are net of proceeds from the sale of our
Argentina operations.
• The acquisitions included the South Texas purchase, a
payment in connection with the signing of the Shah Field
Development Project and properties in California and the
Permian.
payment in connection with the signing of the Shah Field
Development Project and properties in California and the
Permian.
13

14
Second Quarter 2011 Earnings -
Shares Outstanding, Debt and ROE
Shares Outstanding, Debt and ROE
Shares Outstanding (mm) YTD11 6/30/11
Weighted Average Basic 812.5
Weighted Average Diluted 813.3
Basic Shares Outstanding 812.5
Diluted Shares Outstanding 813.3
6/30/11 12/31/10
Debt/Capital 11% 14%
• Our annualized ROE for 1H11 was 20%.
14

15
Second Quarter 2011 Earnings -
Oil and Gas Production & Sales - 2H11 Outlook
Oil and Gas Production & Sales - 2H11 Outlook
• At average oil prices of about $95 WTI, we expect the back
half of the year oil and gas production to be as follows:
half of the year oil and gas production to be as follows:
– Domestic volumes are expected to increase by about 3 - 4
mboe/d each month compared to the previous month;
mboe/d each month compared to the previous month;
– This should result in average 3Q11 production of about 430 to
432 mboe p/d;
432 mboe p/d;
– Latin America volumes should remain comparable to 2Q11;
– The Middle East region production is expected as follows:
• Consistent with 2Q11, we expect no production for Libya.
• In Iraq, we still are unable to reliably predict spending levels, which
have a related impact in cost recovery barrels.
have a related impact in cost recovery barrels.
• In Oman, production is expected to grow from our current gross
production of 210 mboe p/d to a year-end exit rate of 230 mboe p/d,
which should result in about a net 2 mboe p/d per quarter growth.
production of 210 mboe p/d to a year-end exit rate of 230 mboe p/d,
which should result in about a net 2 mboe p/d per quarter growth.
15

16
Second Quarter 2011 Earnings -
Oil and Gas Production & Sales - 2H11 Outlook
Oil and Gas Production & Sales - 2H11 Outlook
– The Middle East region production is expected as follows (cont’d):
• In Qatar, we expect to gradually regain the production rate lost due to
planned maintenance and mechanical issues resulting in about 3 mboe
p/d growth rate each quarter in 2H11, compared to the 2Q11 average.
planned maintenance and mechanical issues resulting in about 3 mboe
p/d growth rate each quarter in 2H11, compared to the 2Q11 average.
• In Dolphin and Bahrain, production is expected to be similar to 2Q11
levels.
levels.
• In Yemen, forecasting of production volumes remains difficult
although currently Oxy operated production has been partially
restored. We expect the range to be between 23 mboe p/d and 27
mboe p/d.
although currently Oxy operated production has been partially
restored. We expect the range to be between 23 mboe p/d and 27
mboe p/d.
– We expect a lifting in Iraq in 3Q11 of about 600,000 barrels of oil.
Including this lifting, we expect sales volumes to be about 725
mboe p/d at $95 WTI.
Including this lifting, we expect sales volumes to be about 725
mboe p/d at $95 WTI.
– A $5.00 increase in WTI would reduce our PSC volumes by about
3,500 boe/d.
3,500 boe/d.
– Our total year capital expenditures remains at $6.8 billion, same as
the guidance we gave last quarter.
the guidance we gave last quarter.
16

17
Second Quarter 2011 Earnings - 2H11 Outlook
• Commodity Price Sensitivity - Earnings
– At current market prices, a $1.00 per barrel change in oil prices
impacts oil and gas quarterly earnings before income taxes by
about $37 mm;
impacts oil and gas quarterly earnings before income taxes by
about $37 mm;
– The average 2Q11 WTI oil price was $102.56 per barrel;
– A $1.00 per barrel change in NGL prices impacts quarterly earnings
before income taxes by $7 mm.
before income taxes by $7 mm.
– A swing of $0.50 per mm BTU in domestic gas prices has a $34 mm
impact on quarterly pretax income;
impact on quarterly pretax income;
– The current NYMEX gas price is around $4.40 p/mcf.
• We expect 3Q11 exploration expense to be about $80 mm
for seismic and drilling for our exploration programs.
for seismic and drilling for our exploration programs.
17

18
Second Quarter 2011 Earnings - 2H11 Outlook
Second Quarter 2011 Earnings - 2H11 Outlook
• The Chemical segment 3Q11 earnings are expected to
moderate to about $225 mm, mostly due to seasonal
factors.
moderate to about $225 mm, mostly due to seasonal
factors.
– 3Q11 Chemical segment results are expected to reflect continued
strong export demand and overall good supply and demand
balances across most products offset by some seasonal factors
and turnarounds.
strong export demand and overall good supply and demand
balances across most products offset by some seasonal factors
and turnarounds.
– Historically, the fourth quarter is typically the weakest quarter
and generally earnings are about half of the third quarter.
and generally earnings are about half of the third quarter.
• We expect our combined worldwide tax rate in 3Q11 to
remain at about 38 percent.
remain at about 38 percent.
18

19
Second Quarter 2011 Earnings - Activity
Second Quarter 2011 Earnings - Activity
• In California, we expect our current drilling program
should result in more predictable production growth
going forward.
should result in more predictable production growth
going forward.
– The status of permitting is generally unchanged from the prior quarter.
– We have obtained enough permits to allow us to prosecute the program
at the present pace until year end.
at the present pace until year end.
– However, there remains some uncertainty around future permits,
particularly related to injection wells.
particularly related to injection wells.
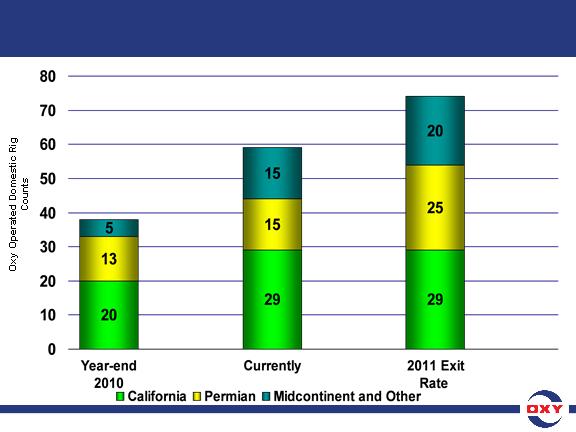
• Our overall rig count in the US has gone from 38 at the
end of 2010 to our current rate of 59 and is expected to
grow to 74 at the end of the year.
end of 2010 to our current rate of 59 and is expected to
grow to 74 at the end of the year.
– This represents a 25% growth in total rig count from current levels.
– The growth will be in Permian, the Williston Basin and South Texas.
– This program leads to continued production growth next year.
19
20
Second Quarter 2011 Earnings -
US Operated Rig Count
US Operated Rig Count
Second Quarter 2011 Earnings -
US Operated Rig Count
US Operated Rig Count
38
59
74
20

21
21