Attached files
| file | filename |
|---|---|
| 8-K - 8-K - TE Connectivity Ltd. | a11-17041_18k.htm |
| EX-99.1 - EX-99.1 - TE Connectivity Ltd. | a11-17041_1ex99d1.htm |
Exhibit 99.2
|
|
Q3 2011 Earnings Call July 20, 2011 |
|
|
Forward-Looking Statements and Non-GAAP Measures Forward-Looking Statements -- This presentation contains certain “forward-looking statements” within the meaning of the United States Private Securities Litigation Reform Act of 1995. These statements are based on management’s current expectations and are subject to risks, uncertainty and changes in circumstances, which may cause actual results, performance, financial condition or achievements to differ materially from anticipated results, performance, financial condition or achievements. All statements contained herein that are not clearly historical in nature are forward-looking and the words “anticipate,” “believe,” “expect,” “estimate,” “plan,” and similar expressions are generally intended to identify forward-looking statements. We have no intention and are under no obligation to update or alter (and expressly disclaim any such intention or obligation to do so) our forward-looking statements whether as a result of new information, future events or otherwise, except to the extent required by law. The forward-looking statements in this presentation include statements addressing our future financial condition and operating results. Examples of factors that could cause actual results to differ materially from those described in the forward-looking statements include, among others, business, economic, competitive and regulatory risks, such as developments in the credit markets; conditions affecting demand for products, particularly the automotive industry and the telecommunications, computer and consumer electronics industries; future goodwill impairment; competition and pricing pressure; fluctuations in foreign currency exchange rates and commodity prices; natural disasters and political, economic and military instability in countries in which we operate; compliance with current and future environmental and other laws and regulations; the possible effects on us of changes in tax laws, tax treaties and other legislation; the risk that ADC’s operations will not be successfully integrated into ours; and the risk that revenue opportunities, cost savings and other anticipated synergies from the transaction may not be fully realized or may take longer to realize than expected. More detailed information about these and other factors is set forth in our Annual Report on Form 10-K for the fiscal year ended Sept. 24, 2010 and Quarterly Reports on Form 10-Q for the quarterly periods ended Dec. 24, 2010 and Mar. 25, 2011, as well as in our Current Reports on Form 8-K and other reports filed by us with the Securities and Exchange Commission. Non-GAAP Measures -- Where we have used non-GAAP financial measures, reconciliations to the most comparable GAAP measure are provided, along with a disclosure on the usefulness of the non-GAAP measure, in this presentation. page 2/ July 20, 2011 |
|
|
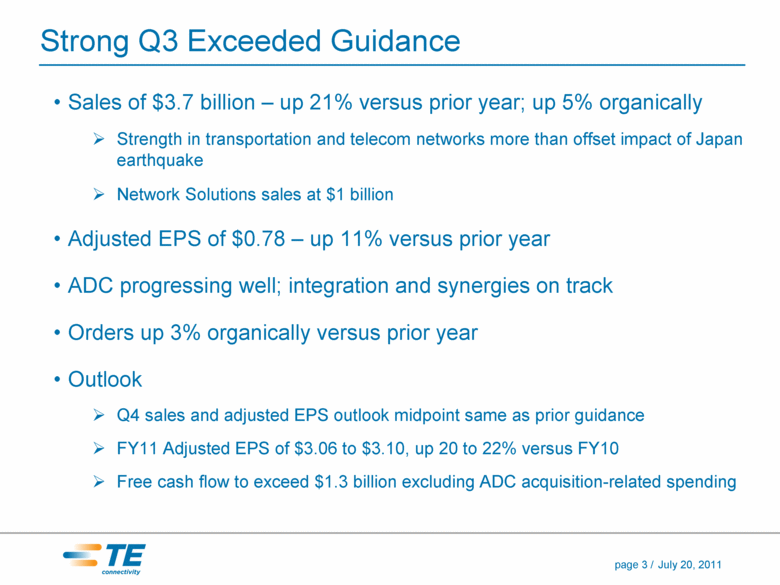
Strong Q3 Exceeded Guidance Sales of $3.7 billion – up 21% versus prior year; up 5% organically Strength in transportation and telecom networks more than offset impact of Japan earthquake Network Solutions sales at $1 billion Adjusted EPS of $0.78 – up 11% versus prior year ADC progressing well; integration and synergies on track Orders up 3% organically versus prior year Outlook Q4 sales and adjusted EPS outlook midpoint same as prior guidance FY11 Adjusted EPS of $3.06 to $3.10, up 20 to 22% versus FY10 Free cash flow to exceed $1.3 billion excluding ADC acquisition-related spending page 3/ July 20, 2011 |
|
|
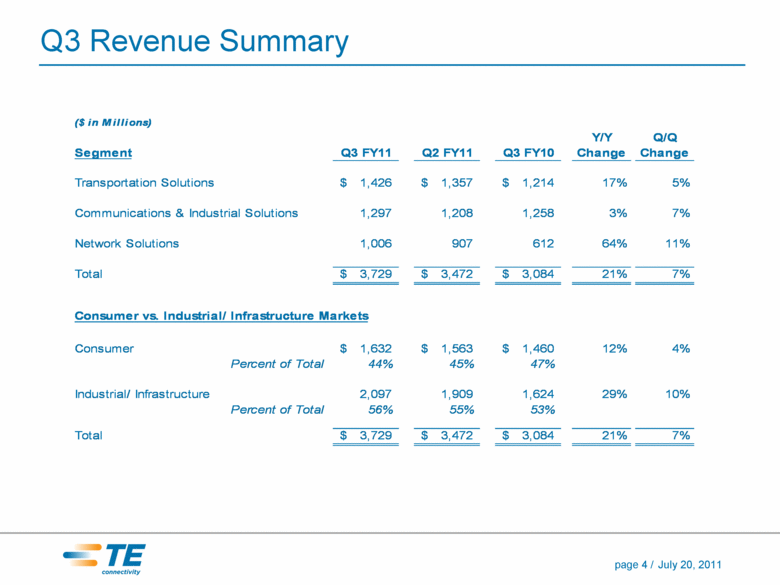
Q3 Revenue Summary Y/Y Change ($ in Millions) Q/Q Segment Q3 FY11 Q2 FY11 Q3 FY10 Change Transportation Solutions $ 1,426 $ 1,357 $ 1,214 17% 5% Communications & Industrial Solutions 1,297 1,208 1,258 3% 7% Network Solutions 1,006 907 612 64% 11% Total $ 3,729 $ 3,472 $ 3,084 21% 7% Consumer vs. Industrial/ Infrastructure Markets Consumer $ 1,632 $ 1,563 $ 1,460 12% 4% Percent of Total 44% 45% 47% Industrial/ Infrastructure 2,097 1,909 1,624 29% 10% Percent of Total 56% 55% 53% Total $ 3,729 $ 3,472 $ 3,084 21% 7% page 4/ July 20, 2011 |
|
|
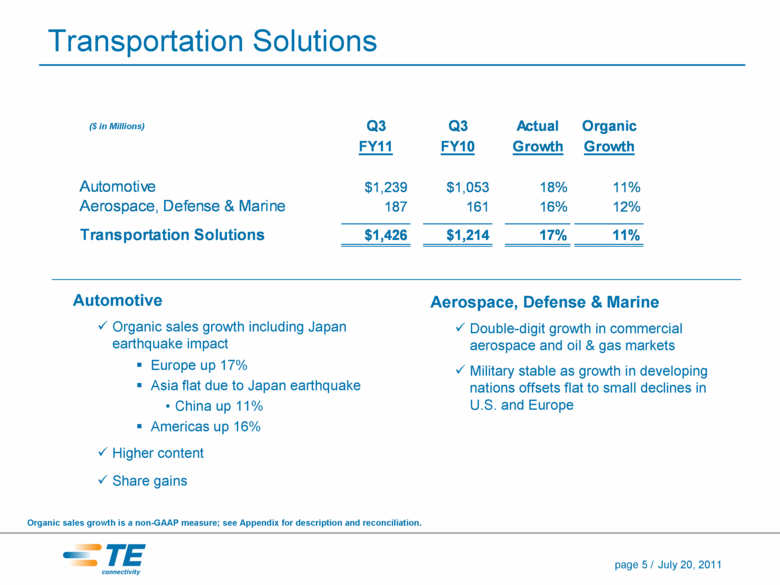
Transportation Solutions ($ in Millions) Q3 Q3 Actual Organic FY11 FY10 Growth Growth Automotive $1,239 $1,053 18% 11% Aerospace, Defense & Marine 187 161 16% 12% Transportation Solutions $1,426 $1,214 17% 11% Automotive Organic sales growth including Japan earthquake impact Europe up 17% Asia flat due to Japan earthquake China up 11% Americas up 16% Higher content Share gains Aerospace, Defense & Marine Double-digit growth in commercial aerospace and oil & gas markets Military stable as growth in developing nations offsets flat to small declines in U.S. and Europe Organic sales growth is a non-GAAP measure; see Appendix for description and reconciliation. page 5/ July 20, 2011 |
|
|
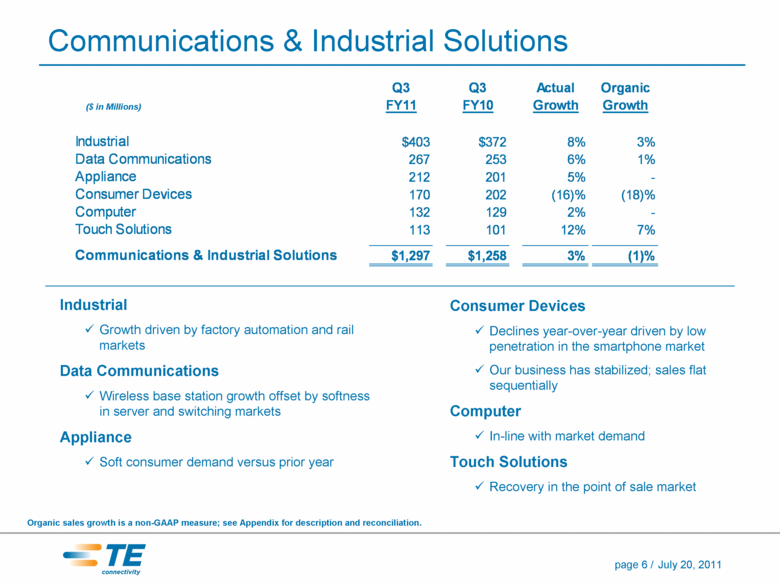
Q3 Q3 Actual Organic ($ in Millions) FY11 FY10 Growth Growth Industrial $403 $372 8% 3% Data Communications 267 253 6% 1% Appliance 212 201 5% - Consumer Devices 170 202 (16)% (18)% Computer 132 129 2% - Touch Solutions 113 101 12% 7% Communications & Industrial Solutions $1,297 $1,258 3% (1)% Consumer Devices Declines year-over-year driven by low penetration in the smartphone market Our business has stabilized; sales flat sequentially Computer In-line with market demand Touch Solutions Recovery in the point of sale market Communications & Industrial Solutions Organic sales growth is a non-GAAP measure; see Appendix for description and reconciliation. Industrial Growth driven by factory automation and rail markets Data Communications Wireless base station growth offset by softness in server and switching markets Appliance Soft consumer demand versus prior year page 6/ July 20, 2011 |
|
|
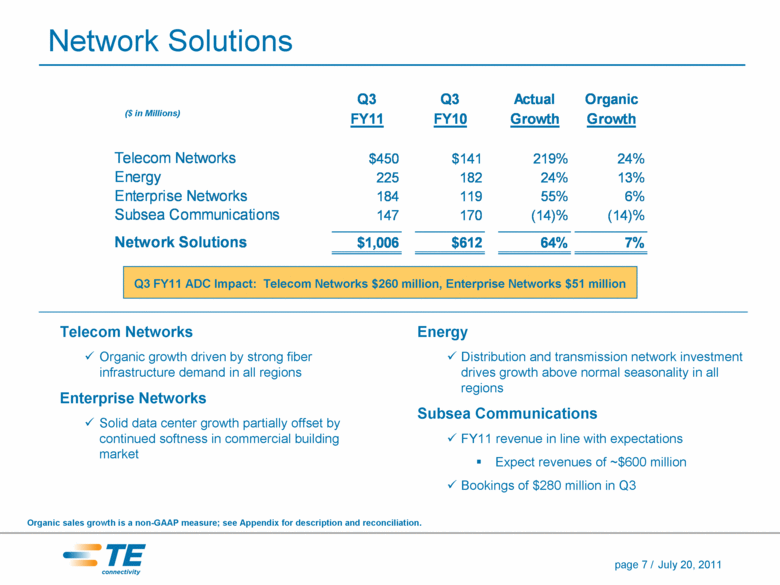
Q3 Q3 Actual Organic ($ in Millions) FY11 FY10 Growth Growth Telecom Networks $450 $141 219% 24% Energy 225 182 24% 13% Enterprise Networks 184 119 55% 6% Subsea Communications 147 170 (14)% (14)% Network Solutions $1,006 $612 64% 7% Network Solutions Organic sales growth is a non-GAAP measure; see Appendix for description and reconciliation. Energy Distribution and transmission network investment drives growth above normal seasonality in all regions Subsea Communications FY11 revenue in line with expectations Expect revenues of ~$600 million Bookings of $280 million in Q3 FY11 ADC Impact: Telecom Networks $260 million, Enterprise Networks $51 million Telecom Networks Organic growth driven by strong fiber infrastructure demand in all regions Enterprise Networks Solid data center growth partially offset by continued softness in commercial building market page 7/ July 20, 2011 |
|
|
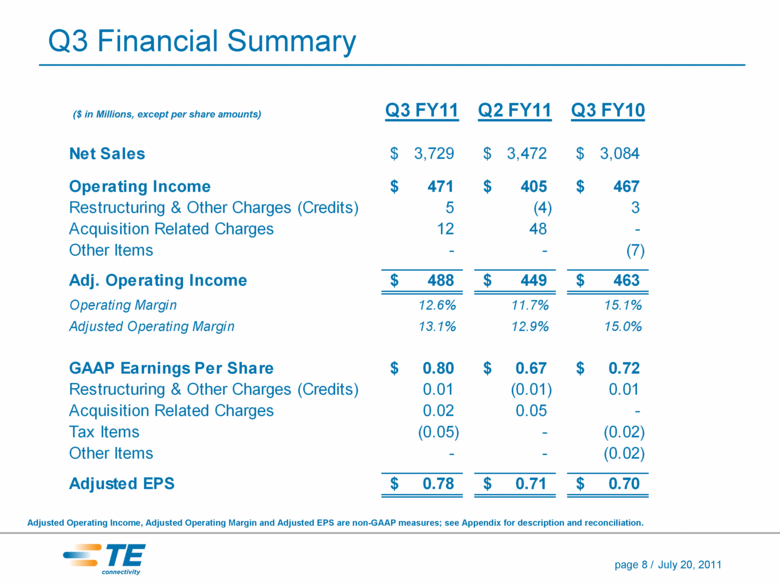
Q3 Financial Summary ($ in Millions, except per share amounts) Q3 FY11 Q2 FY11 Q3 FY10 Net Sales $ 3,729 $ 3,472 $ 3,084 Operating Income $ 471 $ 405 $ 467 Restructuring & Other Charges (Credits) 5 (4) 3 Acquisition Related Charges 12 48 - Other Items - - (7) Adj. Operating Income $ 488 $ 449 $ 463 Operating Margin 12.6% 11.7% 15.1% Adjusted Operating Margin 13.1% 12.9% 15.0% GAAP Earnings Per Share $ 0.80 $ 0.67 $ 0.72 Restructuring & Other Charges (Credits) 0.01 (0.01) 0.01 Acquisition Related Charges 0.02 0.05 - Tax Items (0.05) - (0.02) Other Items - - (0.02) Adjusted EPS $ 0.78 $ 0.71 $ 0.70 Adjusted Operating Income, Adjusted Operating Margin and Adjusted EPS are non-GAAP measures; see Appendix for description and reconciliation. page 8/ July 20, 2011 |
|
|
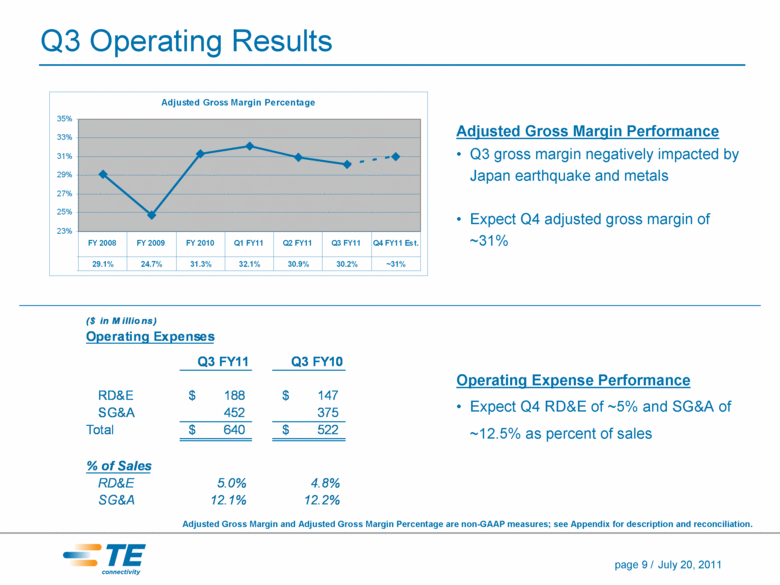
Q3 Operating Results Adjusted Gross Margin Performance Q3 gross margin negatively impacted by Japan earthquake and metals Expect Q4 adjusted gross margin of ~31% Operating Expense ($ in Millions) Q3 FY11 Q3 FY10 RD&E $ 188 $ 147 SG&A 452 375 Total $ 640 $ 522 % of Sales RD&E 5.0% 4.8% SG&A 12.1% 12.2% Operating Expense Performance Expect Q4 RD&E of ~5% and SG&A of ~12.5% as percent of sales Adjusted Gross Margin and Adjusted Gross Margin Percentage are non-GAAP measures; see Appendix for description and reconciliation. page 9/ July 20, 2011 |
|
|
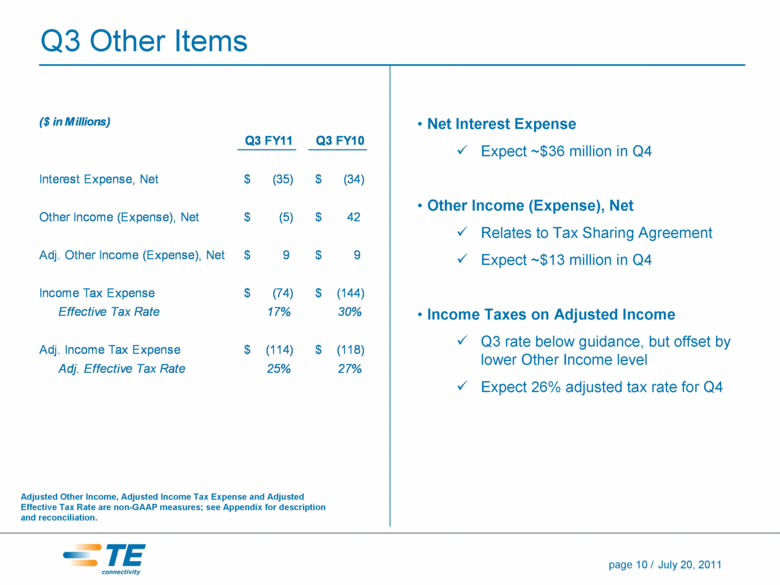
Q3 Other Items ($ in Millions) Q3 FY11 Q3 FY10 Interest Expense, Net $ (35) $ (34) Other Income (Expense), Net $ (5) $ 42 Adj. Other Income (Expense), Net $ 9 $ 9 Income Tax Expense $ (74) $ (144) Effective Tax Rate 17% 30% Adj. Income Tax Expense $ (114) $ (118) Adj. Effective Tax Rate 25% 27% Net Interest Expense Expect ~$36 million in Q4 Other Income (Expense), Net Relates to Tax Sharing Agreement Expect ~$13 million in Q4 Income Taxes on Adjusted Income Q3 rate below guidance, but offset by lower Other Income level Expect 26% adjusted tax rate for Q4 Adjusted Other Income, Adjusted Income Tax Expense and Adjusted Effective Tax Rate are non-GAAP measures; see Appendix for description and reconciliation. $9 page 10/ July 20, 2011 |
|
|
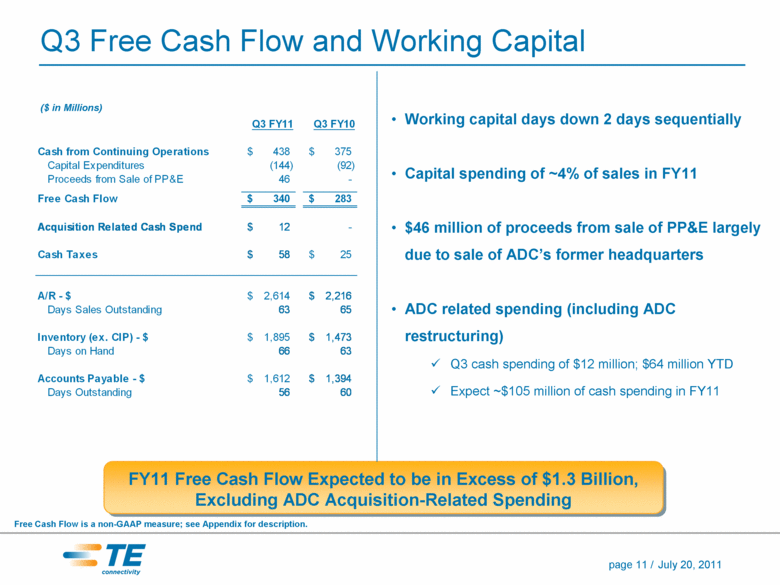
Q3 Free Cash Flow and Working Capital ($ in Millions) Q3 FY11 Q3 FY10 Cash from Continuing Operations $ 438 $ 375 Capital Expenditures (144) (92) Proceeds from Sale of PP&E 46 - Free Cash Flow $ 340 $ 283 Acquisition Related Cash Spend $ 12 - Cash Taxes $ 58 $ 25 A/R - $ $ 2,614 $ 2,216 Days Sales Outstanding 63 65 Inventory (ex. CIP) - $ $ 1,895 $ 1,473 Days on Hand 66 63 Accounts Payable - $ $ 1,612 $ 1,394 Days Outstanding 56 60 Working capital days down 2 days sequentially Capital spending of ~4% of sales in FY11 $46 million of proceeds from sale of PP&E largely due to sale of ADC’s former headquarters ADC related spending (including ADC restructuring) Q3 cash spending of $12 million; $64 million YTD Expect ~$105 million of cash spending in FY11 FY11 Free Cash Flow Expected to be in Excess of $1.3 Billion, Excluding ADC Acquisition-Related Spending Free Cash Flow is a non-GAAP measure; see Appendix for description. page 11/ July 20, 2011 |
|
|
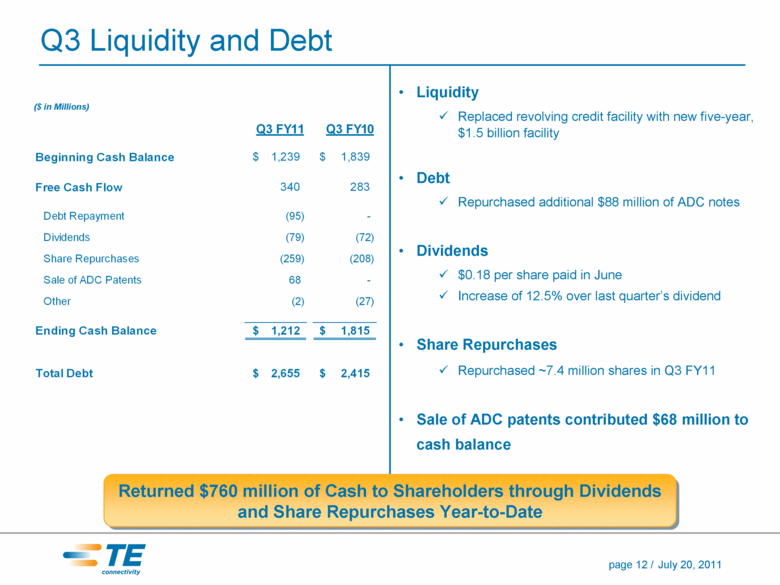
Q3 Liquidity and Debt ($ in Millions) Q3 FY11 Q3 FY10 Beginning Cash Balance $ 1,239 $ 1,839 Free Cash Flow 340 283 Debt Repayment (95) - Dividends (79) (72) Share Repurchases (259) (208) Sale of ADC Patents 68 - Other (2) (27) Ending Cash Balance $ 1,212 $ 1,815 Total Debt $ 2,655 $ 2,415 Liquidity Replaced revolving credit facility with new five-year, $1.5 billion facility Debt Repurchased additional $88 million of ADC notes Dividends $0.18 per share paid in June Increase of 12.5% over last quarter’s dividend Share Repurchases Repurchased ~7.4 million shares in Q3 FY11 Sale of ADC patents contributed $68 million to cash balance Returned $760 million of Cash to Shareholders through Dividends and Share Repurchases Year-to-Date page 12/ July 20, 2011 |
|
|
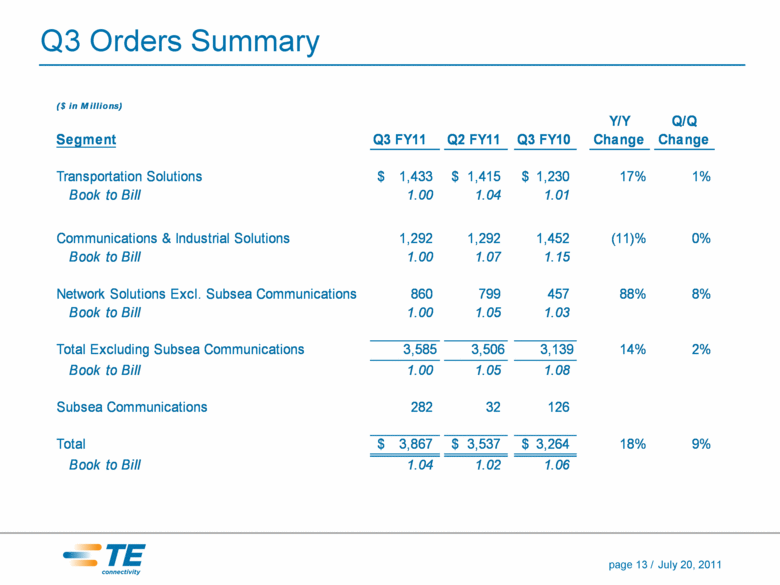
Q3 Orders Summary ($ in Millions) Y/Y Q/Q Segment Q3 FY11 Q2 FY11 Q3 FY10 Change Change Transportation Solutions $ 1,433 $ 1,415 $ 1,230 17% 1% Book to Bill 1.00 1.04 1.01 Communications & Industrial Solutions 1,292 1,292 1,452 (11)% 0% Book to Bill 1.00 1.07 1.15 Network Solutions Excl. Subsea Communications 860 799 457 88% 8% Book to Bill 1.00 1.05 1.03 Total Excluding Subsea Communications 3,585 3,506 3,139 14% 2% Book to Bill 1.00 1.05 1.08 Subsea Communications 282 32 126 Total $ 3,867 $ 3,537 $ 3,264 18% 9% Book to Bill 1.04 1.02 1.06 page 13/ July 20, 2011 |
|
|
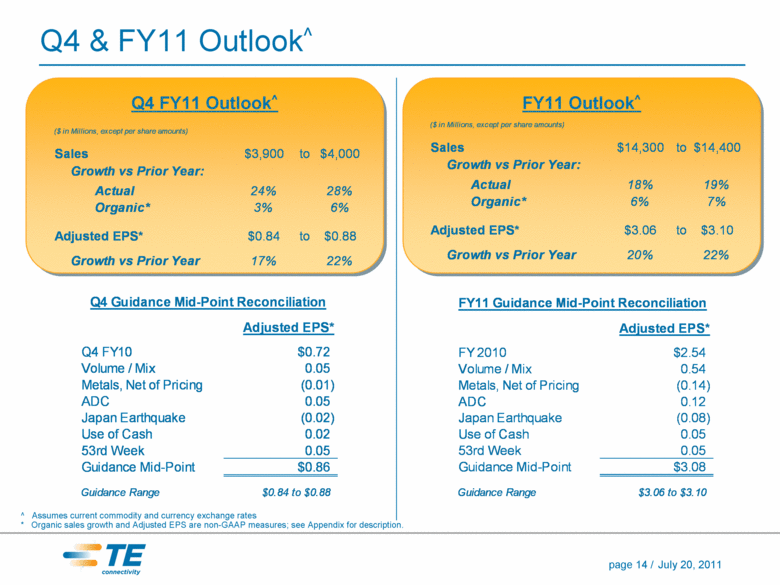
Q4 & FY11 Outlook^ Q4 FY11 Outlook^ ($ in Millions, except per share amounts) ($ in Millions, except per share amounts) Sales Sales $14,400 $3,900 to to $14,300 $4,000 Growth vs Prior Year: Growth vs Prior Year: Actual 19% 24% 18% 28% Organic* 3% 6% Adjusted EPS* $0.84 toto $3.10 $0.88 Growth vs Prior Year 20% 17% 22% 22% FY11 Outlook^ Actual 18% 19% Organic* 6% 7% Adjusted EPS* $3.06 Growth vs Prior Year Q4 Guidance Mid-Point Reconciliation Adjusted EPS* Q4 FY10 $0.72 Volume / Mix 0.05 Metals, Net of Pricing (0.01) ADC 0.05 Japan Earthquake (0.02) Use of Cash 0.02 53rd Week 0.05 Guidance Mid-Point $0.86 Guidance Range $0.84 to $0.88 FY11 Guidance Mid-Point Reconciliation Adjusted EPS* FY 2010 $2.54 Volume / Mix 0.54 Metals, Net of Pricing (0.14) ADC 0.12 Japan Earthquake (0.08) Use of Cash 0.05 53rd Week 0.05 Guidance Mid-Point $3.08 Guidance Range $3.06 to $3.10 ^ Assumes current commodity and currency exchange rates * Organic sales growth and Adjusted EPS are non-GAAP measures; see Appendix for description. page 14/ July 20, 2011 |
|
|
Q & A page 15/ July 20, 2011 |
|
|
Appendix page 16/ July 20, 2011 |
|
|
Non-GAAP Measures “Organic Sales Growth,” “Adjusted Gross Margin,” “Adjusted Gross Margin Percentage,” “Adjusted Operating Income,” “Adjusted Operating Margin,” “Adjusted Other Income, Net,” “Adjusted Income Tax Expense,” “Adjusted Effective Income Tax Rate,” ”Adjusted Income from Continuing Operations,” “Adjusted Earnings Per Share,” and “Free Cash Flow” (FCF) are non-GAAP measures and should not be considered replacements for GAAP* results. “Organic Sales Growth” is a useful measure used by us to measure the underlying results and trends in the business. The difference between reported net sales growth (the most comparable GAAP measure) and Organic Sales Growth (the non-GAAP measure) consists of the impact from foreign currency exchange rates, acquisitions, divestitures, and an additional week in the fourth quarter of the fiscal years which are 53 weeks in length. Organic Sales Growth is a useful measure of our performance because it excludes items that: i) are not completely under management’s control, such as the impact of changes in foreign currency exchange rates; or ii) do not reflect the underlying growth of the company, such as acquisition and divestiture activity and the impact of an additional week in the fourth quarter of the fiscal years which are 53 weeks in length. The limitation of this measure is that it excludes items that have an impact on our sales. This limitation is best addressed by using organic sales growth in combination with the GAAP results. See the accompanying tables to this presentation for the reconciliation presenting the components of Organic Sales Growth. We have presented gross margin and adjusted gross margin percentage before special items including charges or income related to restructuring and other charges and acquisition related charges ("Adjusted Gross Margin“ and “Adjusted Gross Margin Percentage”). We present Adjusted Gross Margin and Adjusted Gross Margin Percentage before special items to give investors a perspective on the underlying business results. Because we cannot predict the amount and timing of such items and the associated charges or gains that will be recorded in our financial statements, it is difficult to include the impact of those items in the forecast. We have presented operating income before special items including charges or income related to legal settlements and reserves, restructuring and other charges, and acquisition related charges (“Adjusted Operating Income”). We utilize Adjusted Operating Income to assess segment level core operating performance and to provide insight to management in evaluating segment operating plan execution and underlying market conditions. It is also a significant component in our incentive compensation plans. Adjusted Operating Income is a useful measure for investors because it better reflects our underlying operating results, trends, and the comparability of these results between periods. The difference between Adjusted Operating Income and operating income (the most comparable GAAP measure) consists of the impact of charges or income related to legal settlements and reserves, restructuring and other charges, and acquisition related charges that may mask the underlying operating results and/or business trends. The limitation of this measure is that it excludes the financial impact of items that would otherwise either increase or decrease our reported operating income. This limitation is best addressed by using Adjusted Operating Income in combination with operating income (the most comparable GAAP measure) in order to better understand the amounts, character and impact of any increase or decrease on reported results. We have presented operating margin before special items including charges or income related to legal settlements and reserves, restructuring and other charges, and acquisition related charges (“Adjusted Operating Margin”). We present Adjusted Operating Margin before special items to give investors a perspective on the underlying business results. It is also a significant component in our incentive compensation plans. Because we cannot predict the amount and timing of such items and the associated charges or gains that will be recorded in our financial statements, it is difficult to include the impact of those items in the forecast. We have presented other income, net before special items including tax sharing income related to certain proposed adjustments to prior period tax returns and other tax items (“Adjusted Other Income, Net”). We present Adjusted Other Income, Net as we believe that it is appropriate for investors to consider results excluding these items in addition to results in accordance with GAAP. The difference between Adjusted Other Income, Net and other income, net (the most comparable GAAP measure) consists of tax sharing income related to certain proposed adjustments to prior period tax returns and other tax items. The limitation of this measure is that it excludes the financial impact of items that would otherwise either increase or decrease other income, net. This limitation is best addressed by using Adjusted Other Income, Net in combination with other income, net (the most comparable GAAP measure) in order to better understand the amounts, character and impact of any increase or decrease in reported amounts. We have presented income tax expense after adjusting for the tax effect of special items including charges related to restructuring and other charges, acquisition related charges, and certain significant special tax items (“Adjusted Income Tax Expense”). We present Adjusted Income Tax Expense to provide investors further information regarding the tax effects of adjustments used in determining the non-GAAP financial measure Adjusted Income from Continuing Operations (as defined below). The difference between Adjusted Income Tax Expense and income tax expense (the most comparable GAAP measure) is the tax effect of adjusting items and certain significant special tax items. The limitation of this measure is that it excludes the financial impact of items that would otherwise either increase or decrease income tax expense. This limitation is best addressed by using Adjusted Income Tax Expense in combination with income tax expense (the most comparable GAAP measure) in order to better understand the amounts, character and impact of any increase or decrease in reported amounts. * U.S. Generally Accepted Accounting Principles page 17/ July 20, 2011 |
|
|
Non-GAAP Measures (cont.) We have presented effective income tax rate after adjusting for the tax effect of special items including charges related to restructuring and other charges, acquisition related charges, and certain significant special tax items (“Adjusted Effective Tax Rate”). We present Adjusted Effective Tax Rate to provide investors further information regarding the tax rate effects of adjustments used in determining the non-GAAP financial measure Adjusted Income from Continuing Operations (as defined below). The difference between Adjusted Effective Tax Rate and effective income tax rate (the most comparable GAAP measure) is the tax rate effect of the adjusting items and certain significant special tax items. The limitation of this measure is that it excludes the financial impact of items that would otherwise either increase or decrease the effective income tax rate. This limitation is best addressed by using Adjusted Effective Tax Rate in combination with effective income tax rate (the most comparable GAAP measure) in order to better understand the amounts, character and impact of any increase or decrease in reported amounts. We have presented income from continuing operations attributable to TE Connectivity Ltd. before special items including charges or income related to legal settlements and reserves, restructuring and other charges, acquisition related charges, tax sharing income related to certain proposed adjustments to prior period tax returns and other tax items, certain significant special tax items, and, if applicable, related tax effects (“Adjusted Income from Continuing Operations”). We present Adjusted Income from Continuing Operations as we believe that it is appropriate for investors to consider results excluding these items in addition to results in accordance with GAAP. Adjusted Income from Continuing Operations provides additional information regarding our underlying operating results, trends and the comparability of these results between periods. The difference between Adjusted Income from Continuing Operations and income from continuing operations attributable to TE Connectivity Ltd. (the most comparable GAAP measure) consists of the impact of charges or income related to legal settlements and reserves, restructuring and other charges, acquisition related charges, tax sharing income related to certain proposed adjustments to prior period tax returns and other tax items, certain significant special tax items, and, if applicable, related tax effects. The limitation of this measure is that it excludes the financial impact of items that would otherwise either increase or decrease our reported results. This limitation is best addressed by using Adjusted Income from Continuing Operations in combination with income from continuing operations attributable to TE Connectivity Ltd. (the most comparable GAAP measure) in order to better understand the amounts, character and impact of any increase or decrease in reported amounts. We have presented diluted earnings per share from continuing operations attributable to TE Connectivity Ltd. before special items, including charges or income related to legal settlements and reserves, restructuring and other charges, acquisition related charges, tax sharing income related to certain proposed adjustments to prior period tax returns and other tax items, certain significant special tax items, and, if applicable, related tax effects (“Adjusted Earnings Per Share”). We present Adjusted Earnings Per Share because we believe that it is appropriate for investors to consider results excluding these items in addition to results in accordance with GAAP. We believe such a measure provides a picture of our results that is more comparable among periods since it excludes the impact of special items, which may recur, but tend to be irregular as to timing, thereby making comparisons between periods more difficult. It is also a significant component in our incentive compensation plans. The limitation of this measure is that it excludes the financial impact of items that would otherwise either increase or decrease our reported results. This limitation is best addressed by using Adjusted Earnings Per Share in combination with diluted earnings per share from continuing operations attributable to TE Connectivity Ltd. (the most comparable GAAP measure) in order to better understand the amounts, character and impact of any increase or decrease on reported results. “Free Cash Flow” (FCF) is a useful measure of our cash generation which is free from any significant existing obligation. It is also a significant component in our incentive compensation plans. The difference between cash flows from operating activities (the most comparable GAAP measure) and FCF (the non-GAAP measure) consists mainly of significant cash outflows and inflows that we believe are useful to identify. FCF permits management and investors to gain insight into the amount that management employs to measure cash that is free from any significant existing obligation. The difference reflects the impact from: net capital expenditures, voluntary pension contributions, and cash impact of special items. Net capital expenditures are subtracted because they represent long-term commitments. Voluntary pension contributions are subtracted from the GAAP measure because this activity is driven by economic financing decisions rather than operating activity. We forecast our cash flow results excluding any voluntary pension contributions because we have not yet made a determination about the amount and timing of any such future contributions. In addition, our forecast excludes the cash impact of special items because we cannot predict the amount and timing of such items. page 18/ July 20, 2011 |
|
|
Non-GAAP Measures (cont.) The limitation associated with using FCF is that it subtracts cash items that are ultimately within management’s and the Board of Directors’ discretion to direct and that therefore may imply that there is less or more cash that is available for the company's programs than the most comparable GAAP measure. This limitation is best addressed by using FCF in combination with the GAAP cash flow results. FCF as presented herein may not be comparable to similarly-titled measures reported by other companies. The measure should be used in conjunction with other GAAP financial measures. Investors are urged to read our financial statements as filed with the Securities and Exchange Commission. Because we do not predict the amount and timing of special items that might occur in the future, and our forecasts are developed at a level of detail different than that used to prepare GAAP-based financial measures, we do not provide reconciliations to GAAP of our forward-looking financial measures. page 19/ July 20, 2011 |
|
|
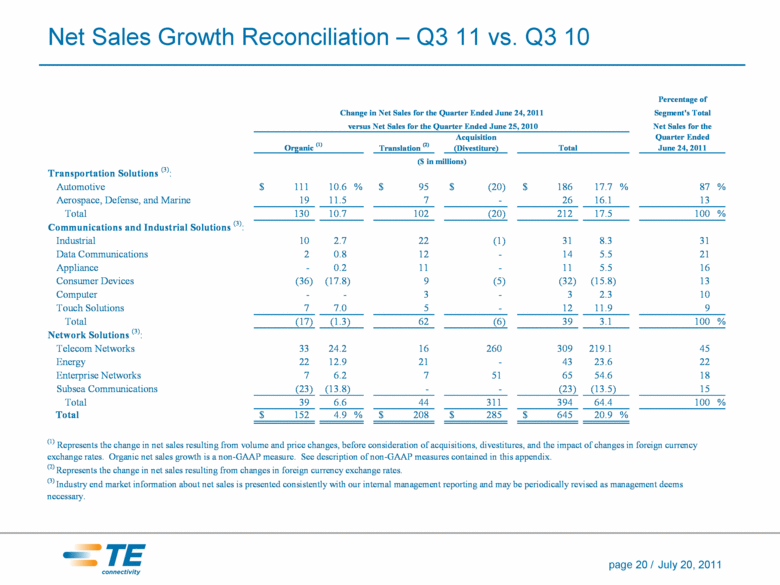
Net Sales Growth Reconciliation – Q3 11 vs. Q3 10 Translation (2) Acquisition (Divestiture) Transportation Solutions (3): Automotive 111 $ 10.6 % 95 $ (20) $ 186 $ 17.7 % 87 % Aerospace, Defense, and Marine 19 11.5 7 - 26 16.1 13 Total 130 10.7 102 (20) 212 17.5 100 % Communications and Industrial Solutions (3): Industrial 10 2.7 22 (1) 31 8.3 31 Data Communications 2 0.8 12 - 14 5.5 21 Appliance - 0.2 11 - 11 5.5 16 Consumer Devices (36) (17.8) 9 (5) (32) (15.8) 13 Computer - - 3 - 3 2.3 10 Touch Solutions 7 7.0 5 - 12 11.9 9 Total (17) (1.3) 62 (6) 39 3.1 100 % Network Solutions (3): Telecom Networks 33 24.2 16 260 309 219.1 45 Energy 22 12.9 21 - 43 23.6 22 Enterprise Networks 7 6.2 7 51 65 54.6 18 Subsea Communications (23) (13.8) - - (23) (13.5) 15 Total 39 6.6 44 311 394 64.4 100 % Total 152 $ 4.9 % 208 $ 285 $ 645 $ 20.9 % (1) Represents the change in net sales resulting from volume and price changes, before consideration of acquisitions, divestitures, and the impact of changes in foreign currency exchange rates. Organic net sales growth is a non-GAAP measure. See description of non-GAAP measures contained in this appendix. (2) Represents the change in net sales resulting from changes in foreign currency exchange rates. (3) Industry end market information about net sales is presented consistently with our internal management reporting and may be periodically revised as management deems necessary. ($ in millions) Quarter Ended June 24, 2011 versus Net Sales for the Quarter Ended June 25, 2010 Organic (1) Total Net Sales for the Percentage of Change in Net Sales for the Quarter Ended June 24, 2011 Segment's Total page 20/ July 20, 2011 |
|
|
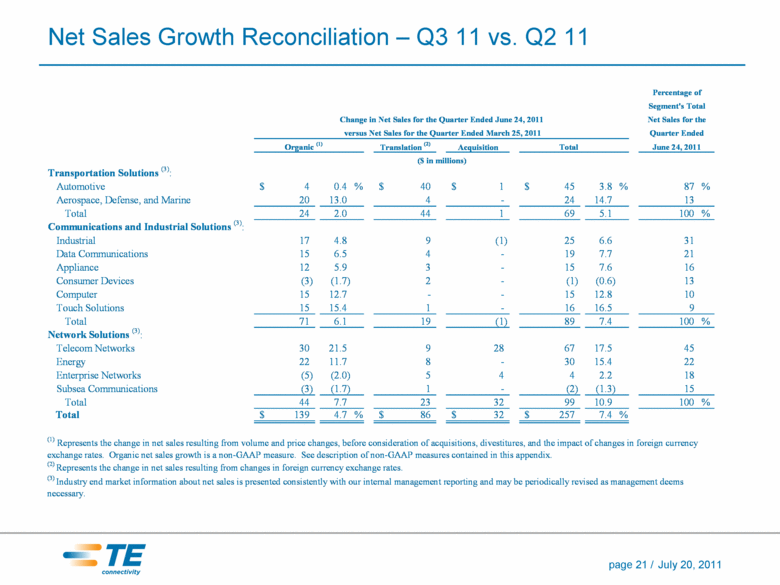
Net Sales Growth Reconciliation – Q3 11 vs. Q2 11 Translation (2) Acquisition Transportation Solutions (3): Automotive 4 $ 0.4 % 40 $ 1 $ 45 $ 3.8 % 87 % Aerospace, Defense, and Marine 20 13.0 4 - 24 14.7 13 Total 24 2.0 44 1 69 5.1 100 % Communications and Industrial Solutions (3): Industrial 17 4.8 9 (1) 25 6.6 31 Data Communications 15 6.5 4 - 19 7.7 21 Appliance 12 5.9 3 - 15 7.6 16 Consumer Devices (3) (1.7) 2 - (1) (0.6) 13 Computer 15 12.7 - - 15 12.8 10 Touch Solutions 15 15.4 1 - 16 16.5 9 Total 71 6.1 19 (1) 89 7.4 100 % Network Solutions (3): Telecom Networks 30 21.5 9 28 67 17.5 45 Energy 22 11.7 8 - 30 15.4 22 Enterprise Networks (5) (2.0) 5 4 4 2.2 18 Subsea Communications (3) (1.7) 1 - (2) (1.3) 15 Total 44 7.7 23 32 99 10.9 100 % Total 139 $ 4.7 % 86 $ 32 $ 257 $ 7.4 % (3) Industry end market information about net sales is presented consistently with our internal management reporting and may be periodically revised as management deems necessary. June 24, 2011 ($ in millions) Organic (1) Total (2) Represents the change in net sales resulting from changes in foreign currency exchange rates. versus Net Sales for the Quarter Ended March 25, 2011 (1) Represents the change in net sales resulting from volume and price changes, before consideration of acquisitions, divestitures, and the impact of changes in foreign currency exchange rates. Organic net sales growth is a non-GAAP measure. See description of non-GAAP measures contained in this appendix. Percentage of Net Sales for the Segment's Total Change in Net Sales for the Quarter Ended June 24, 2011 Quarter Ended page 21/ July 20, 2011 |
|
|
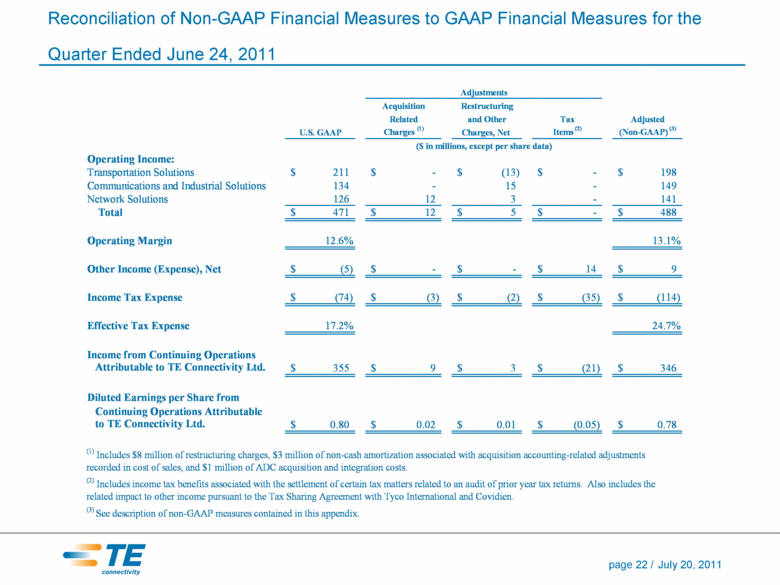
Reconciliation of Non-GAAP Financial Measures to GAAP Financial Measures for the Quarter Ended June 24, 2011 Acquisition Restructuring Related and Other Tax Adjusted U.S. GAAP Charges (1) Charges, Net Items (2) (Non-GAAP) (3) Operating Income: Transportation Solutions 211 $ - $ (13) $ - $ 198 $ Communications and Industrial Solutions 134 - 15 - 149 Network Solutions 126 12 3 - 141 Total 471 $ 12 $ 5 $ - $ 488 $ Operating Margin 12.6% 13.1% Other Income (Expense), Net (5) $ - $ - $ 14 $ 9 $ Income Tax Expense (74) $ (3) $ (2) $ (35) $ (114) $ Effective Tax Expense 17.2% 24.7% Income from Continuing Operations Attributable to TE Connectivity Ltd. 355 $ 9 $ 3 $ (21) $ 346 $ Diluted Earnings per Share from Continuing Operations Attributable to TE Connectivity Ltd. 0.80 $ 0.02 $ 0.01 $ (0.05) $ 0.78 $ (3) See description of non-GAAP measures contained in this appendix. (1) Includes $8 million of restructuring charges, $3 million of non-cash amortization associated with acquisition accounting-related adjustments recorded in cost of sales, and $1 million of ADC acquisition and integration costs. (2) Includes income tax benefits associated with the settlement of certain tax matters related to an audit of prior year tax returns. Also includes the related impact to other income pursuant to the Tax Sharing Agreement with Tyco International and Covidien. ($ in millions, except per share data) Adjustments page 22/ July 20, 2011 |
|
|
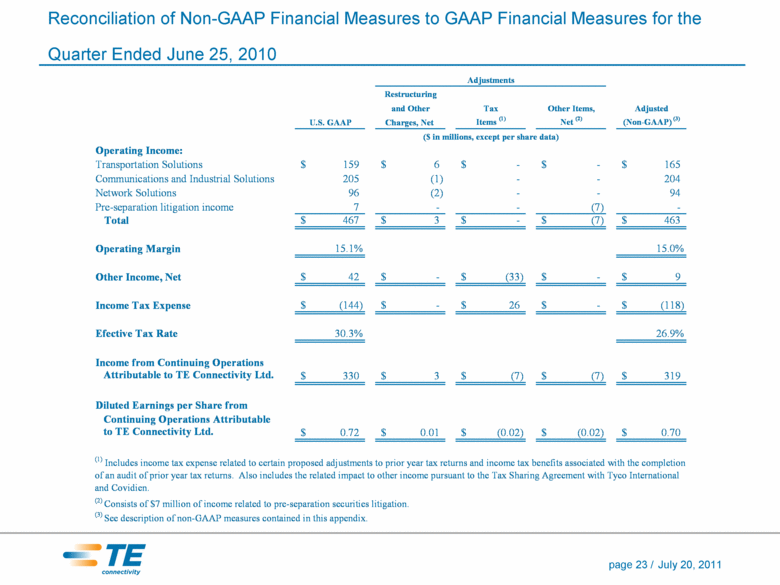
Reconciliation of Non-GAAP Financial Measures to GAAP Financial Measures for the Quarter Ended June 25, 2010 Restructuring and Other Tax Other Items, Adjusted U.S. GAAP Charges, Net Items (1) Net (2) (Non-GAAP) (3) Operating Income: Transportation Solutions 159 $ 6 $ - $ - $ 165 $ Communications and Industrial Solutions 205 (1) - - 204 Network Solutions 96 (2) - - 94 Pre-separation litigation income 7 - - (7) - Total 467 $ 3 $ - $ (7) $ 463 $ Operating Margin 15.1% 15.0% Other Income, Net 42 $ - $ (33) $ - $ 9 $ Income Tax Expense (144) $ - $ 26 $ - $ (118) $ Efective Tax Rate 30.3% 26.9% Income from Continuing Operations Attributable to TE Connectivity Ltd. 330 $ 3 $ (7) $ (7) $ 319 $ Diluted Earnings per Share from Continuing Operations Attributable to TE Connectivity Ltd. 0.72 $ 0.01 $ (0.02) $ (0.02) $ 0.70 $ (3) See description of non-GAAP measures contained in this appendix. ($ in millions, except per share data) (1) Includes income tax expense related to certain proposed adjustments to prior year tax returns and income tax benefits associated with the completion of an audit of prior year tax returns . Also includes the related impact to other income pursuant to the Tax Sharing Agreement with Tyco International and Covidien. (2) Consists of $7 million of income related to pre-separation securities litigation. Adjustments page 23/ July 20, 2011 |
|
|
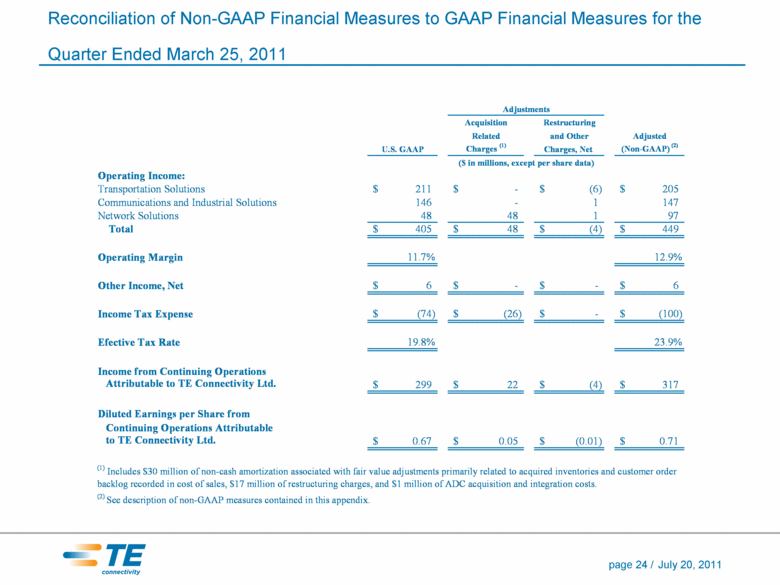
Reconciliation of Non-GAAP Financial Measures to GAAP Financial Measures for the Quarter Ended March 25, 2011 Acquisition Restructuring Related and Other Adjusted U.S. GAAP Charges (1) Charges, Net (Non-GAAP) (2) Operating Income: Transportation Solutions 211 $ - $ (6) $ 205 $ Communications and Industrial Solutions 146 - 1 147 Network Solutions 48 48 1 97 Total 405 $ 48 $ (4) $ 449 $ Operating Margin 11.7% 12.9% Other Income, Net 6 $ - $ - $ 6 $ Income Tax Expense (74) $ (26) $ - $ (100) $ Efective Tax Rate 19.8% 23.9% Income from Continuing Operations Attributable to TE Connectivity Ltd. 299 $ 22 $ (4) $ 317 $ Diluted Earnings per Share from Continuing Operations Attributable to TE Connectivity Ltd. 0.67 $ 0.05 $ (0.01) $ 0.71 $ (1) Includes $30 million of non-cash amortization associated with fair value adjustments primarily related to acquired inventories and customer order backlog recorded in cost of sales, $17 million of restructuring charges, and $1 million of ADC acquisition and integration costs. (2) See description of non-GAAP measures contained in this appendix. ($ in millions, except per share data) Adjustments page 24/ July 20, 2011 |
|
|
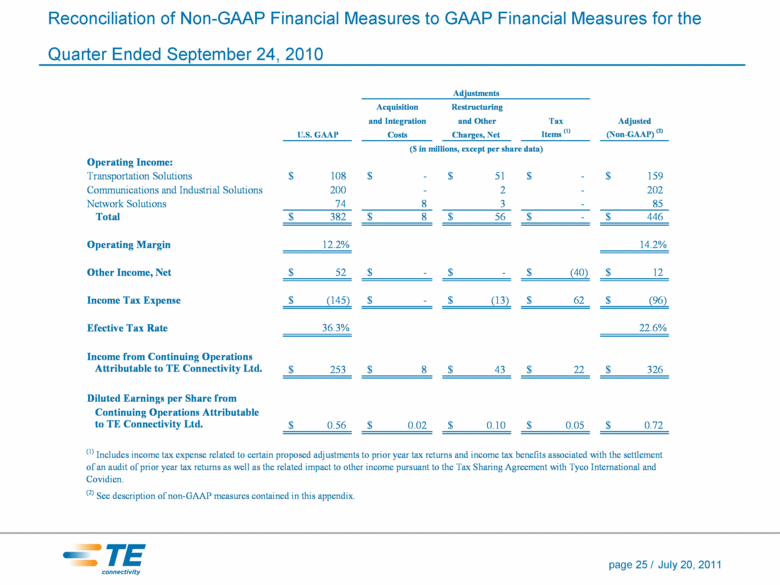
Reconciliation of Non-GAAP Financial Measures to GAAP Financial Measures for the Quarter Ended September 24, 2010 Acquisition Restructuring and Integration and Other Tax Adjusted U.S. GAAP Costs Charges, Net Items (1) (Non-GAAP) (2) Operating Income: Transportation Solutions 108 $ - $ 51 $ - $ 159 $ Communications and Industrial Solutions 200 - 2 - 202 Network Solutions 74 8 3 - 85 Total 382 $ 8 $ 56 $ - $ 446 $ Operating Margin 12.2% 14.2% Other Income, Net 52 $ - $ - $ (40) $ 12 $ Income Tax Expense (145) $ - $ (13) $ 62 $ (96) $ Efective Tax Rate 36.3% 22.6% Income from Continuing Operations Attributable to TE Connectivity Ltd. 253 $ 8 $ 43 $ 22 $ 326 $ Diluted Earnings per Share from Continuing Operations Attributable to TE Connectivity Ltd. 0.56 $ 0.02 $ 0.10 $ 0.05 $ 0.72 $ (2) See description of non-GAAP measures contained in this appendix. (1) Includes income tax expense related to certain proposed adjustments to prior year tax returns and income tax benefits associated with the settlement of an audit of prior year tax returns as well as the related impact to other income pursuant to the Tax Sharing Agreement with Tyco International and Covidien. ($ in millions, except per share data) Adjustments page 25/ July 20, 2011 |
|
|
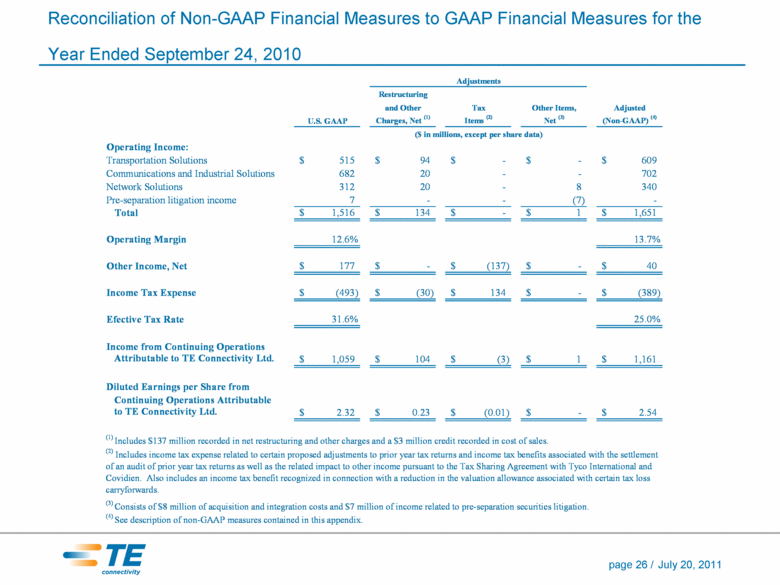
Reconciliation of Non-GAAP Financial Measures to GAAP Financial Measures for the Year Ended September 24, 2010 Restructuring and Other Tax Other Items, Adjusted U.S. GAAP Charges, Net (1) Items (2) Net (3) (Non-GAAP) (4) Operating Income: Transportation Solutions 515 $ 94 $ - $ - $ 609 $ Communications and Industrial Solutions 682 20 - - 702 Network Solutions 312 20 - 8 340 Pre-separation litigation income 7 - - (7) - Total 1,516 $ 134 $ - $ 1 $ 1,651 $ Operating Margin 12.6% 13.7% Other Income, Net 177 $ - $ (137) $ - $ 40 $ Income Tax Expense (493) $ (30) $ 134 $ - $ (389) $ Efective Tax Rate 31.6% 25.0% Income from Continuing Operations Attributable to TE Connectivity Ltd. 1,059 $ 104 $ (3) $ 1 $ 1,161 $ Diluted Earnings per Share from Continuing Operations Attributable to TE Connectivity Ltd. 2.32 $ 0.23 $ (0.01) $ - $ 2.54 $ Adjustments (4) See description of non-GAAP measures contained in this appendix. ($ in millions, except per share data) (3) Consists of $8 million of acquisition and integration costs and $7 million of income related to pre-separation securities litigation. (1) Includes $137 million recorded in net restructuring and other charges and a $3 million credit recorded in cost of sales. (2) Includes income tax expense related to certain proposed adjustments to prior year tax returns and income tax benefits associated with the settlement of an audit of prior year tax returns as well as the related impact to other income pursuant to the Tax Sharing Agreement with Tyco International and Covidien. Also includes an income tax benefit recognized in connection with a reduction in the valuation allowance associated with certain tax loss carryforwards. page 26/ July 20, 2011 |
|
|
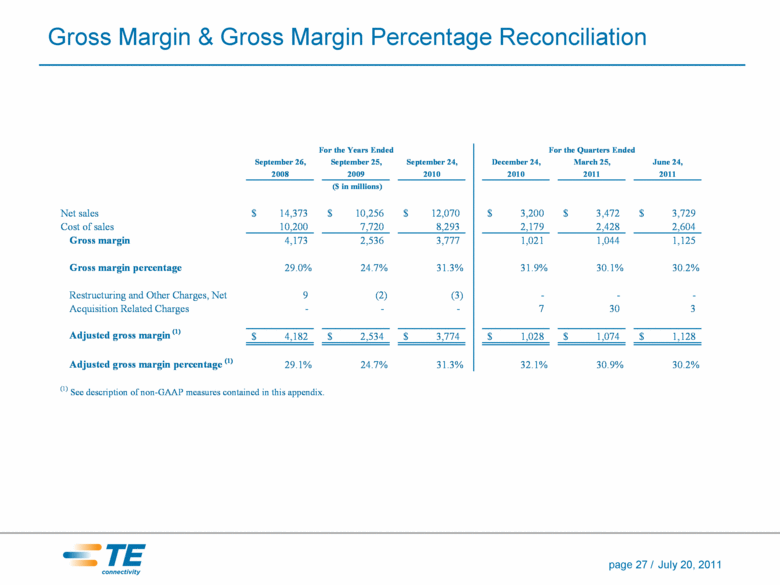
Gross Margin & Gross Margin Percentage Reconciliation September 26, September 25, September 24, December 24, March 25, June 24, 2008 2009 2010 2010 2011 2011 ($ in millions) Net sales 14,373 $ 10,256 $ 12,070 $ 3,200 $ 3,472 $ 3,729 $ Cost of sales 10,200 7,720 8,293 2,179 2,428 2,604 Gross margin 4,173 2,536 3,777 1,021 1,044 1,125 Gross margin percentage 29.0% 24.7% 31.3% 31.9% 30.1% 30.2% Restructuring and Other Charges, Net 9 (2) (3) - - - Acquisition Related Charges - - - 7 30 3 Adjusted gross margin (1) 4,182 $ 2,534 $ 3,774 $ 1,028 $ 1,074 $ 1,128 $ Adjusted gross margin percentage (1) 29.1% 24.7% 31.3% 32.1% 30.9% 30.2% (1) See description of non-GAAP measures contained in this appendix. For the Quarters Ended For the Years Ended page 27/ July 20, 2011 |

