Attached files
| file | filename |
|---|---|
| 8-K - FORM 8-K - TIDEWATER INC | d8k.htm |
| EX-99.2 - TRANSCRIPT TO THE 2011 ANNUAL MEETING OF STOCKHOLDERS - TIDEWATER INC | dex992.htm |
 DEAN E.
TAYLOR DEAN E. TAYLOR
Chairman, President and CEO
Chairman, President and CEO
JEFFREY M. PLATT
JEFFREY M. PLATT
Chief Operating Officer
Chief Operating Officer
QUINN P. FANNING
QUINN P. FANNING
Executive VP and CFO
Executive VP and CFO
FISCAL 2011 ANNUAL
SHAREHOLDERS’
MEETING
FISCAL 2011 ANNUAL
FISCAL 2011 ANNUAL
SHAREHOLDERS’
SHAREHOLDERS’
MEETING
MEETING
Exhibit 99.1
July 14, 2011
July 14, 2011 |
 In accordance
with the safe harbor provisions of the Private Securities Litigation Reform Act of 1995,
the Company notes that certain statements set forth in this presentation provide
other than historical information and are forward looking. The actual achievement of any
forecasted results, or the unfolding of future economic or business developments in a way
anticipated or projected by the Company, involve numerous risks and uncertainties that
may cause the Company’s actual performance to be materially different from that
stated or implied in the forward-looking statement. Among those risks and
uncertainties, many of which are beyond the control of the Company, include, without
limitation, volatility in worldwide energy demand and oil and gas prices; fleet additions
by competitors and industry overcapacity; changes in capital spending by customers in the
energy industry for offshore
exploration,
field
development
and
production;
changing
customer
demands
for vessel specifications, which may make some of our older vessels technologically
obsolete for certain customer projects or in certain markets; uncertainty of global
financial market conditions and difficulty in accessing credit or capital; acts of
terrorism and piracy; significant weather conditions; unsettled political conditions,
war, civil unrest and governmental actions, such as expropriation, especially in higher
risk countries where we operate; foreign currency fluctuations; labor influences
proposed by international conventions; increased regulatory burdens and oversight
following the Deepwater Horizon incident;
and enforcement of laws related to the
environment,
labor
and
foreign
corrupt
practices.
Readers
should
consider
all
of
these
risk factors as well as other information contained in this report.
Phone:
504.568.1010
Fax:
504.566.4580
Web:
www.tdw.com
Email:
connect@tdw.com
FORWARD-LOOKING STATEMENTS
FORWARD-LOOKING STATEMENTS
FORWARD-LOOKING STATEMENTS
2 |
 3
OPERATIONS REVIEW
Jeff Platt –
Chief Operating Officer
OPERATIONS REVIEW
OPERATIONS REVIEW
Jeff Platt –
Jeff Platt –
Chief Operating Officer
Chief Operating Officer
3 |
 4
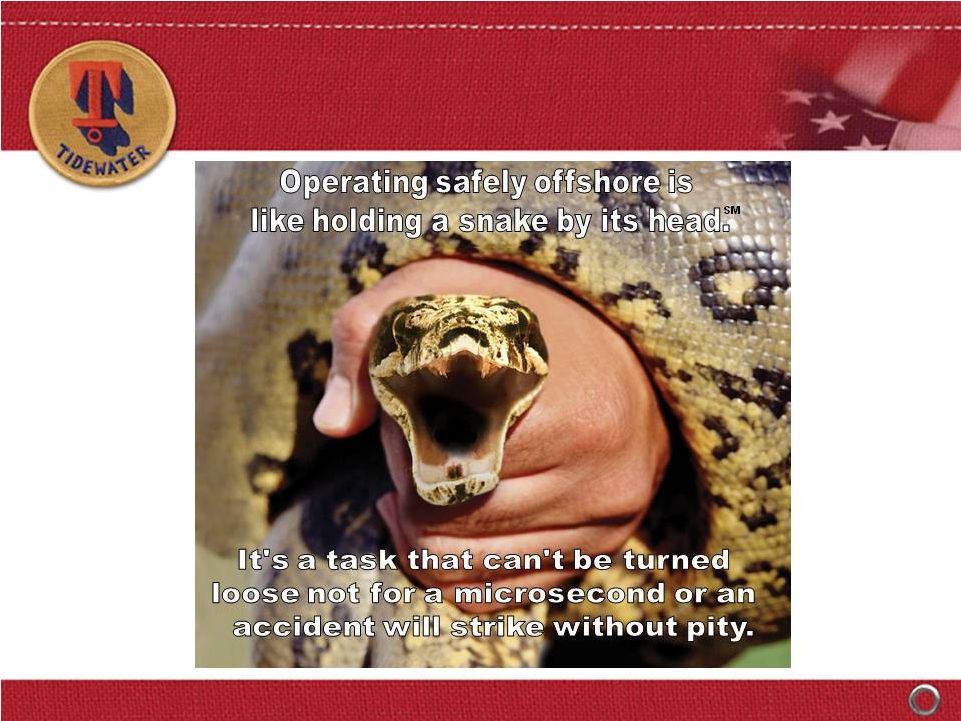
SAFETY –
A CONTINUED TOP PRIORITY
SAFETY –
SAFETY –
A CONTINUED TOP PRIORITY
A CONTINUED TOP PRIORITY
SM
4 |
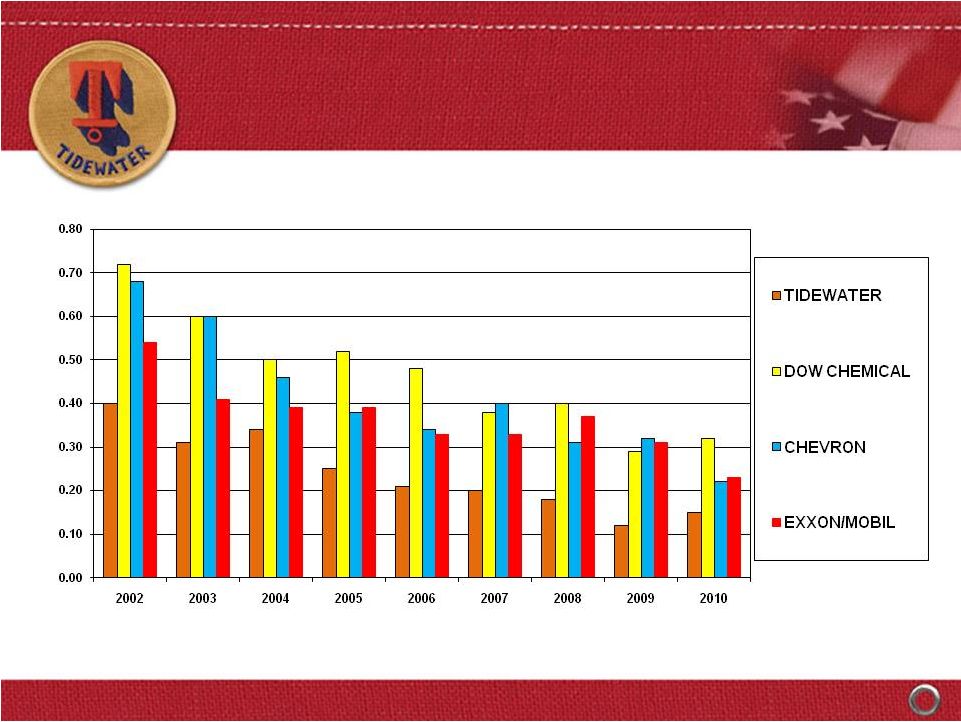 SAFETY RECORD RIVALS
LEADING COMPANIES
SAFETY RECORD RIVALS
SAFETY RECORD RIVALS
LEADING COMPANIES
LEADING COMPANIES
CALENDAR YEARS
TOTAL
RECORDABLE
INCIDENT
RATES
5 |
 6
Unique global footprint; 50+ years of Int’l
experience
Unmatched scale and scope of operations
International market opportunities
•
Growth
•
Longer contracts
•
Better utilization
•
Higher dayrates
Solid customer base of NOC’s and IOC’s
INTERNATIONAL STRENGTH
INTERNATIONAL STRENGTH
INTERNATIONAL STRENGTH |
 7
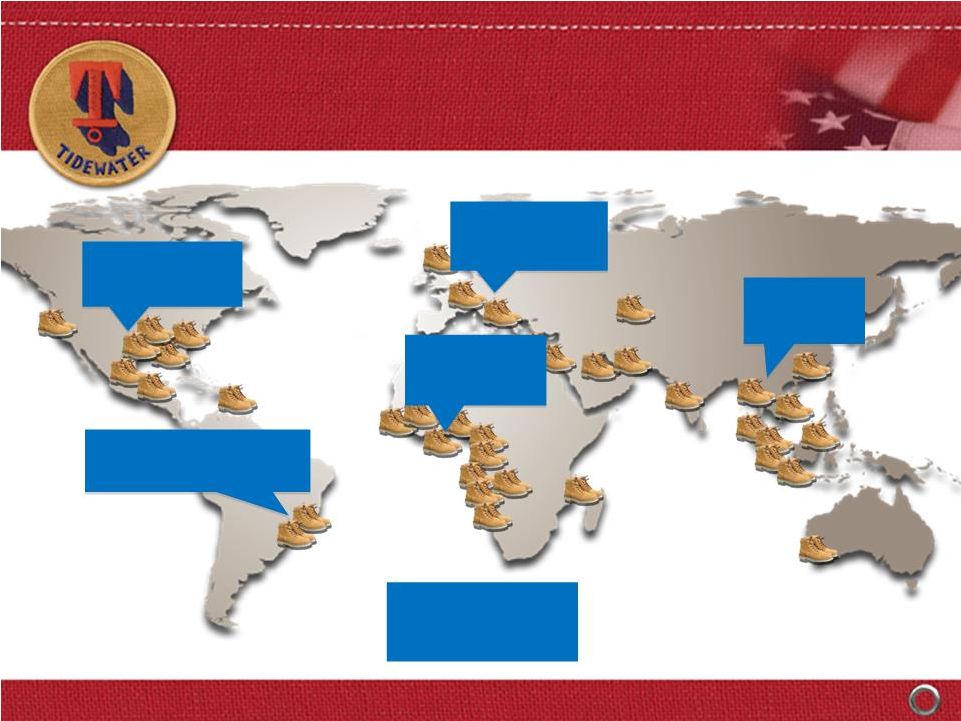
North America
16
(6%)
Central/South America
54
(20%)
West Africa
129
(47%)
Europe / M.E.
40
(14%)
Far East
35
(13%)
International / U.S.
2011: 94% / 6%
2000: 62% / 38%
OUR GLOBAL FOOTPRINT
Vessel Distribution by Region
(excludes stacked vessels –
as of 3/31/11)
OUR GLOBAL FOOTPRINT
OUR GLOBAL FOOTPRINT
Vessel Distribution by Region
Vessel Distribution by Region
(excludes stacked vessels –
(excludes stacked vessels –
as of 3/31/11)
as of 3/31/11) |
 8
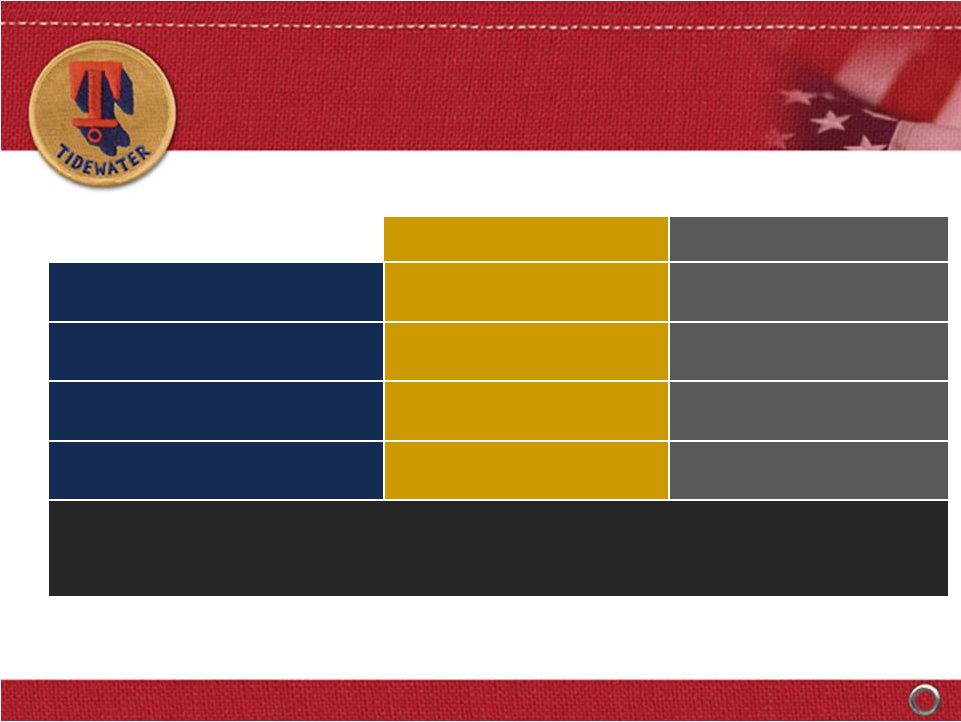
Vessel Count
Estimated Cost
AHTS
99
$1,743m
PSV’s
84
$1,755m
Crewboats & Tugs
67
$289m
TOTALS:
250
$3,787m
.
At 3/31/11, 193 new vessels in fleet with ~5.4 year average age
Vessel Commitments
Jan. ’00 –
March ‘11
29 additional vessels were delivered into our fleet in Fiscal 2011
29 additional vessels were delivered into our fleet in Fiscal 2011
(1) $3,293m (87%) funded through 3/31/11
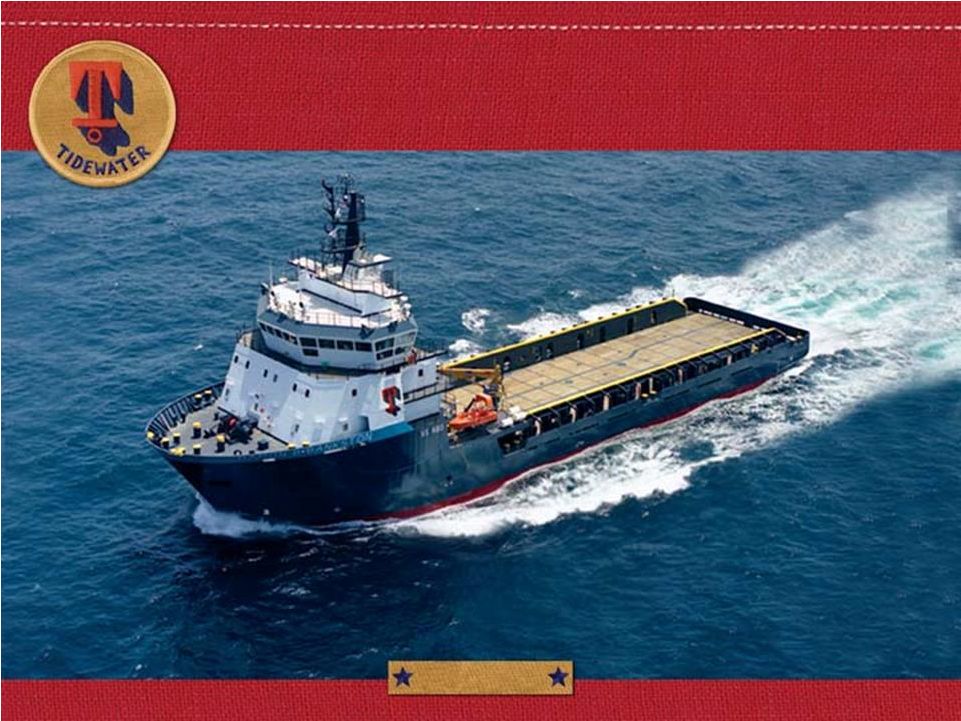
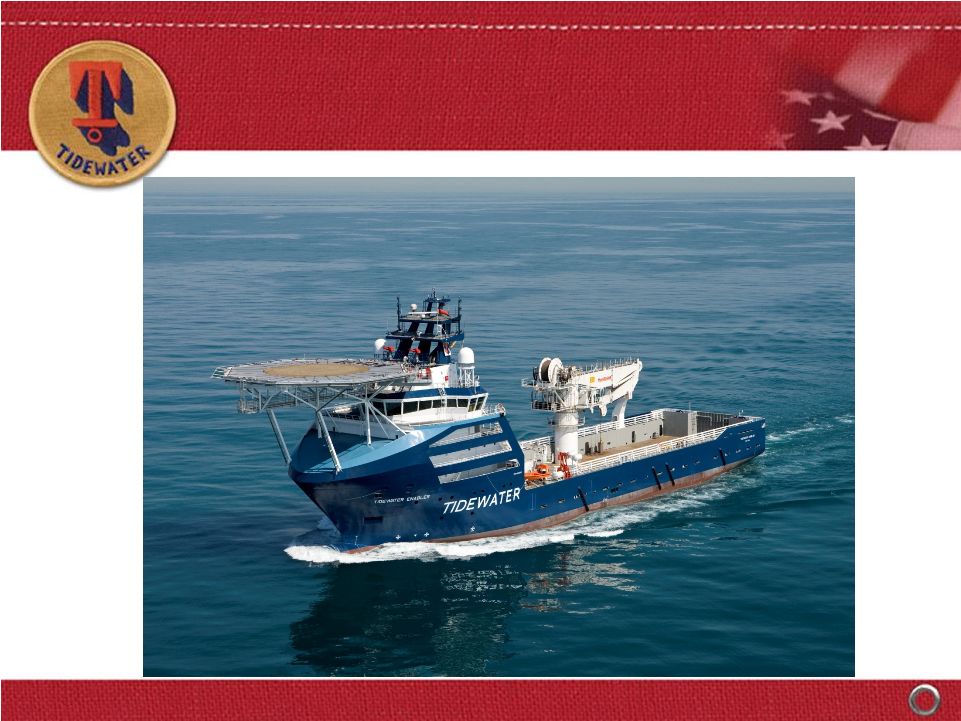
THE LARGEST MODERN FLEET
IN THE INDUSTRY….
THE LARGEST MODERN FLEET
THE LARGEST MODERN FLEET
IN THE INDUSTRY….
IN THE INDUSTRY….
(1) |
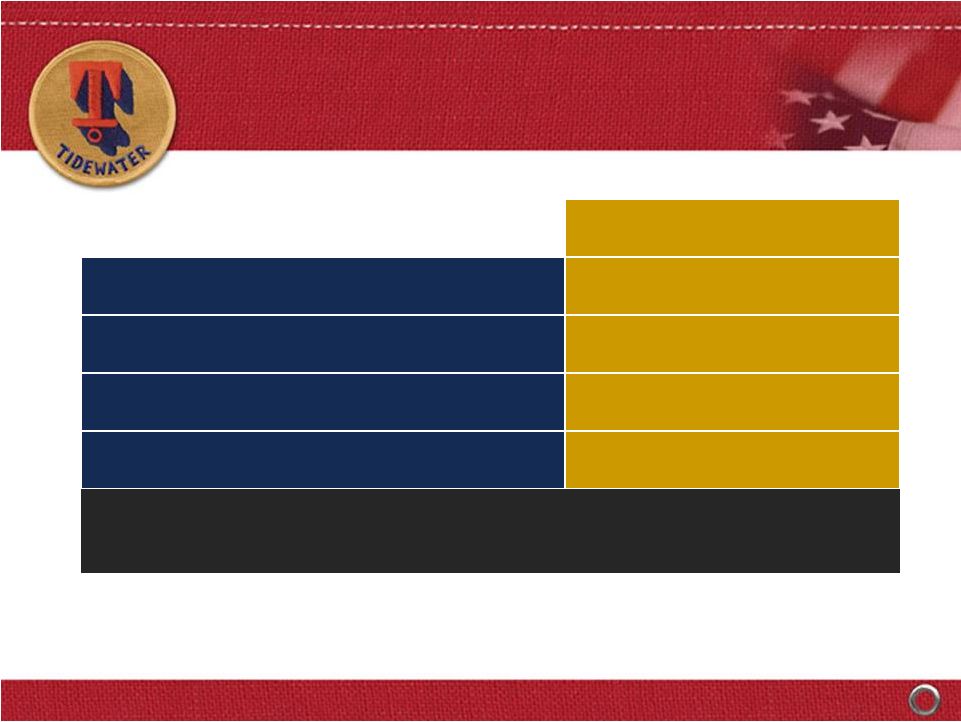 Count
AHTS
15
PSV
20
Crew and Tug
1
Total
36
Vessels Under Construction*
As of March 31, 2011
* Includes eight new vessels committed to purchase as of 3/31/11
Estimated
delivery
schedule
–
25
in
FY
‘12,
10
in
FY
‘13
and
1
thereafter.
CAPX of $368m in FY ‘12, $110m in FY ‘13 and $16m in FY ’14.
…. AND MORE TO COME
…. AND MORE TO COME
…. AND MORE TO COME
9 |
 10
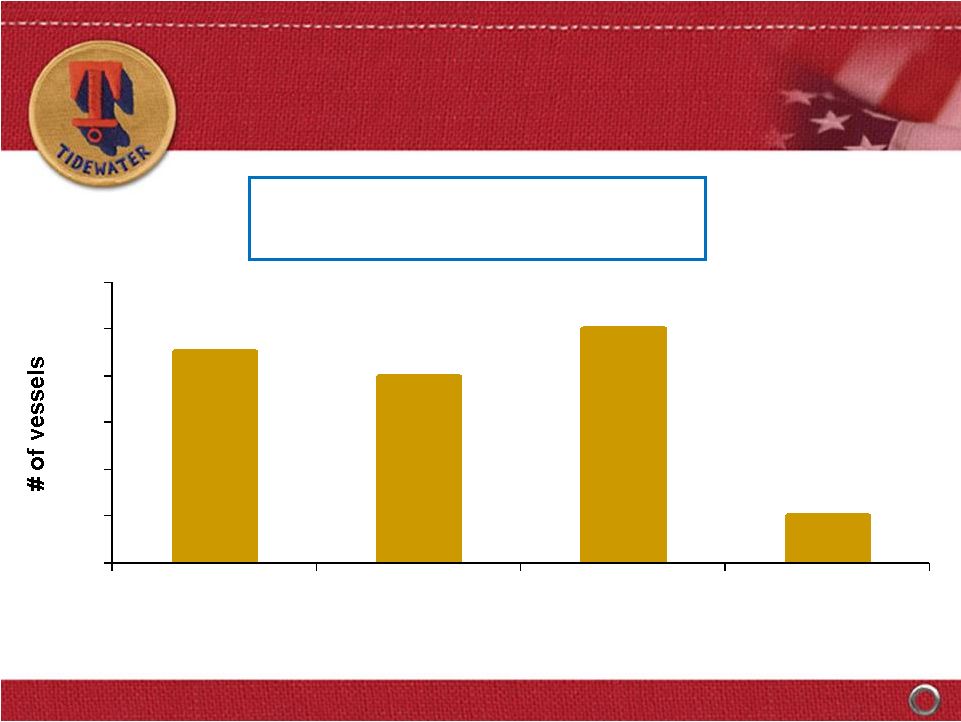
0
2
4
6
8
10
12
6/30/10 Qtr
9/30/10 Qtr
12/31/10 Qtr
3/31/11 Qtr
Amounts
depict
vessel
count
and
total
cost
in
quarter
commitment
was
made
to
acquire
(not
when
delivery
or
payments
were
made)
$179M
$179M
6 AHTS
3
PSV’s
29 new vessel commitments in Fiscal 2011
with total capital cost of ~$600 million
$177M
$177M
4 PSV’s
4 AHTS
1 PSV
9 AHTS
$139M
$139M
$101M
$101M
2
PSV’s
FISCAL 2011 NEW
VESSEL COMMITMENTS
FISCAL 2011 NEW
FISCAL 2011 NEW
VESSEL COMMITMENTS
VESSEL COMMITMENTS
Since 3/31/11, commitments for seven additional vessels (~$140m)
were finalized |
 11
FINANCIAL REVIEW
Quinn Fanning –
Chief Financial Officer
FINANCIAL REVIEW
FINANCIAL REVIEW
Quinn Fanning –
Quinn Fanning –
Chief Financial Officer
Chief Financial Officer |
 12
**
EPS in Fiscal 2004 is exclusive of the $.30 per share after tax impairment charge.
EPS in Fiscal 2006 is exclusive of the $.74 per share after tax gain from the
sale of six KMAR vessels. EPS in Fiscal 2007 is exclusive of $.37 per share of
after tax gains from the sale of 14 offshore tugs. EPS in Fiscal 2010 is
exclusive of $.66 per share Venezuelan provision, a $.70 per share tax benefit
related to favorable resolution of tax litigation and a $0.22 per share charge
for the proposed settlement with the SEC of the company’s FCPA matter. EPS in Fiscal 2011 is exclusive of total $0.21 per share charges for
settlements with DOJ and Government of Nigeria for FCPA matters,
a $0.08 per share charge related to participation in a multi-company
U.K.-based pension plan and a $0.06 per share impairment charge related to
certain vessels. Adjusted Return
On Avg. Equity
4.3% 7.2%
12.4%
18.5% 18.3%
19.5%
11.4% 4.0%
Adjusted EPS**
Adjusted EPS**
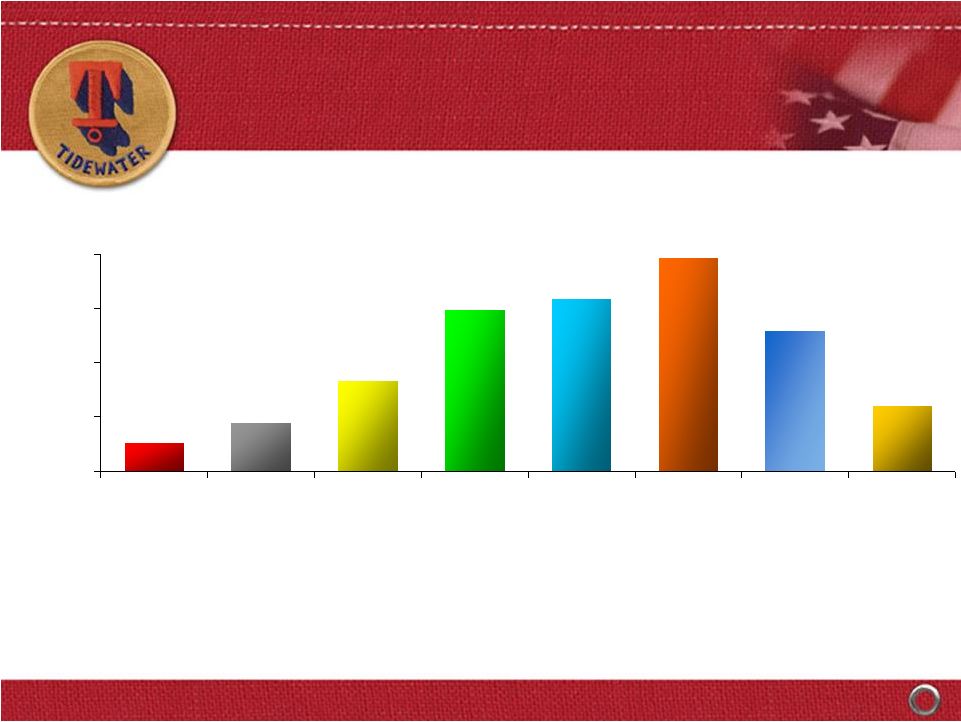
HISTORY OF EARNINGS GROWTH
AND SOLID THROUGH-CYCLE RETURNS
HISTORY OF EARNINGS GROWTH
HISTORY OF EARNINGS GROWTH
AND SOLID THROUGH-CYCLE RETURNS
AND SOLID THROUGH-CYCLE RETURNS
$2.40
$5.20
$7.89
$1.03
$1.78
$3.33
$5.94
$6.39
$0.00
$2.00
$4.00
$6.00
$8.00
Fiscal
2004
Fiscal
2005
Fiscal
2006
Fiscal
2007
Fiscal
2008
Fiscal
2009
Fiscal
2010
Fiscal
2011 |
 13
Over
a
12-year
period,
Tidewater
invested
$3.8
billion
in
CAPX
($3.3
billion
in
the
“new”
fleet),
and paid out $995 million through dividends and share repurchases. Over the
same period, CFFO and proceeds from dispositions were $3.4 billion and $690
million, respectively $0
$100
$200
$300
$400
$500
$600
$700
2000
2001
2002
2003
2004
2005
2006
2007
2008
2009
2010
2011
CAPX
Dividend
Share Repurchase
$ in millions
CFFO
Fiscal Year
FLEET RENEWAL & EXPANSION FUNDED BY
OPERATING CASH FLOW THROUGH FISCAL 2011
FLEET RENEWAL & EXPANSION FUNDED BY
FLEET RENEWAL & EXPANSION FUNDED BY
OPERATING CASH FLOW THROUGH FISCAL 2011
OPERATING CASH FLOW THROUGH FISCAL 2011 |
 14
Years Ended
3/31/11
3/31/10
Revenues
$1,055
$1,169
Adjusted Net Earnings*
$123
$269
Adjusted EPS*
$2.40
$5.20
Net Cash from Operations
$264
$328
Capital Expenditures
$615
$452
$ in Millions, Except Per Share Data
RECENT FINANCIAL RESULTS
REFLECT CYCLICAL DOWNTURN
RECENT FINANCIAL RESULTS
RECENT FINANCIAL RESULTS
REFLECT CYCLICAL DOWNTURN
REFLECT CYCLICAL DOWNTURN
* Adjusted Net Earnings and Adjusted EPS for the year ended 3/31/11 exclude an after-tax $4.35
million, or $0.09 per share, charge related to settlement with DOJ and an after-tax
$6.3 million, or $0.12 per share, charge related to settlement with the Government of Nigeria for FCPA matters, an after-tax $3.9 million, or
$0.08 per share, charge related to participation in a multi-company U.K.-based pension plan,
and an after-tax $3.0 million, or $0.06 per share, impairment charge related to
certain vessels. Adjusted net earnings and EPS for the year ended 3/31/10 exclude charges of $33.6 million, or $0.66 per share, related to provisions for
Venezuelan operations, $36.1 million, or $0.70 per share, tax benefit related to favorable resolution
of tax litigation and $11.4 million, or $0.22 per share, charge related to settlement with the
SEC for FCPA matters. |
 15
At March 31, 2011
Cash & Cash Equivalents
$246 million
Total Debt
$700 million
Shareholders Equity
$2,514 million
Net Debt / Net Capitalization
15%
Total Debt / Capitalization
22%
Pro forma liquidity as of 3/31/11 of +$800 million, including
$575 million available under credit facilities
STRONG FINANCIAL POSITION
PROVIDES STRATEGIC OPTIONALITY
STRONG FINANCIAL POSITION
STRONG FINANCIAL POSITION
PROVIDES STRATEGIC OPTIONALITY
PROVIDES STRATEGIC OPTIONALITY |
 16
Senior Unsecured Notes
$425 million
Average Life to Maturity
~ 9 years
Weighted Average Coupon
4.25%
Term Loan
$125 million
Revolving Line of Credit
$450 million
Term
Five years
Interest Rate
LIBOR plus 1.5% to
2.25%, based on leverage
Private Placement Financing:
Private Placement Financing:
New Credit Facilities:
New Credit Facilities:
< $50 million in debt maturities in Fiscal 2012
RECENT FINANCINGS WILL FUND GROWTH
AT ATTRACTIVE RELATIVE COST
RECENT FINANCINGS WILL FUND GROWTH
RECENT FINANCINGS WILL FUND GROWTH
AT ATTRACTIVE RELATIVE COST
AT ATTRACTIVE RELATIVE COST |
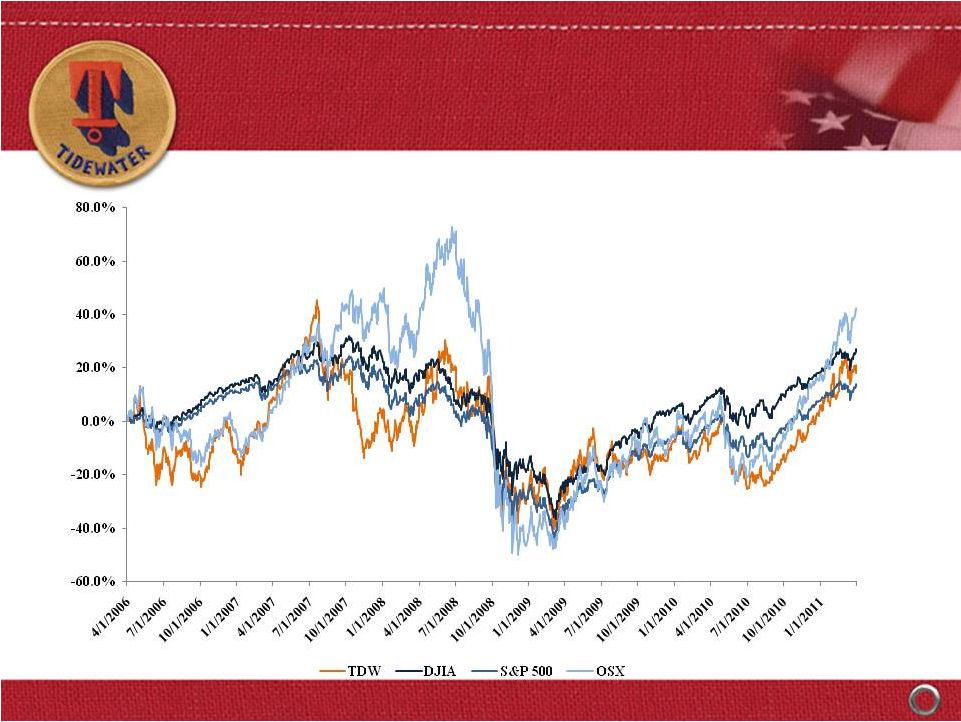 OSX
42% S&P 500 14%
DJIA 27%
TDW 18%
RETURNS vs the MARKET
FIVE YEAR STOCKHOLDER RETURN
RETURNS vs the MARKET
RETURNS vs the MARKET
FIVE YEAR STOCKHOLDER RETURN
FIVE YEAR STOCKHOLDER RETURN
17 |
 18
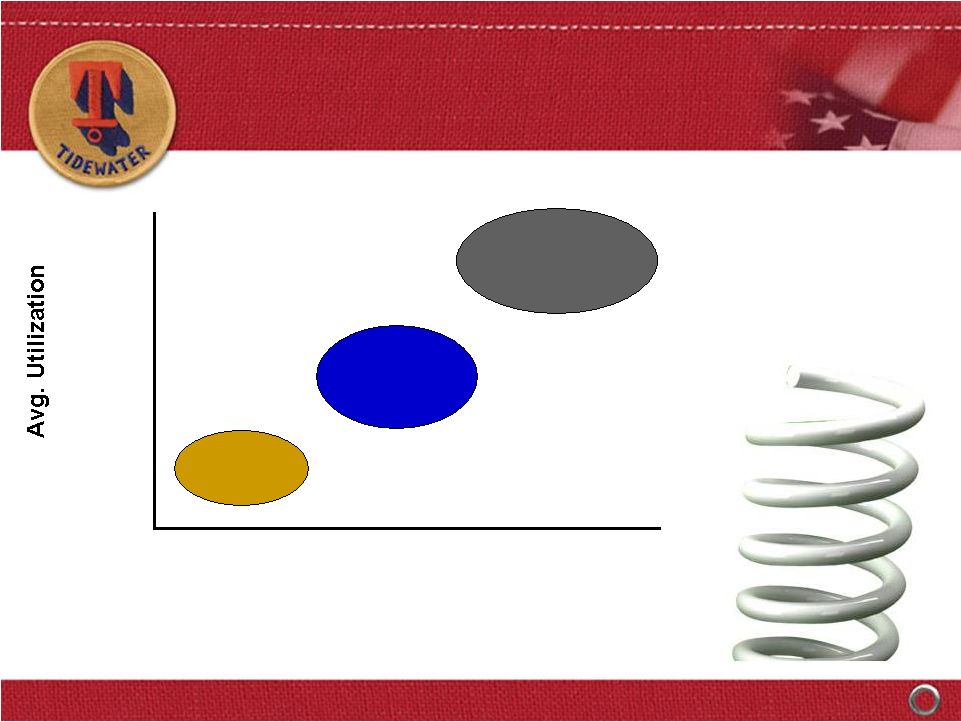
269 vessel assumption (193 current new vessels + 36 under construction + ~ 20
additional new vessels per year for two years).
WHERE COULD FISCAL 2014 FIND US?
Potential for Earnings Acceleration
WHERE COULD FISCAL 2014 FIND US?
WHERE COULD FISCAL 2014 FIND US?
Potential for Earnings Acceleration
Potential for Earnings Acceleration
Avg. Dayrates
$14,381*
$15,819
(+ 10%)
$17,400
(+ 10%)
85.8%*
85.0%
90.0%
~$4.00
EPS
~$5.60
EPS
~$9.10
EPS
* 3/31/11 fiscal year actual stats
This info is not meant to be a
prediction of future earnings
performance, but simply an
indication of earning sensitivities
resulting from future fleet
additions and reductions and
varying operating assumptions
~$400M+
EBITDA
~$520M+
EBITDA
~$730M+
EBITDA |
 19
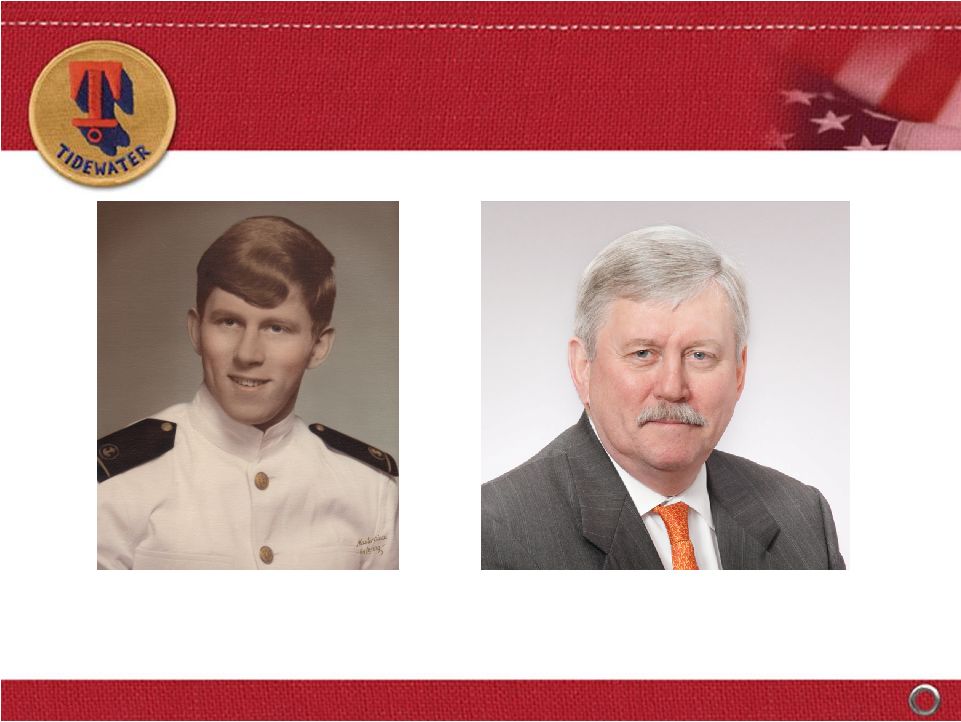
RETIREMENT OF
STEPHEN WALLACE DICK
RETIREMENT OF
RETIREMENT OF
STEPHEN WALLACE DICK
STEPHEN WALLACE DICK |
 20
THANKS FOR ALL YOU’VE DONE FOR
TIDEWATER OVER 38 YEARS
THANKS FOR ALL YOU’VE DONE FOR
THANKS FOR ALL YOU’VE DONE FOR
TIDEWATER OVER 38 YEARS
TIDEWATER OVER 38 YEARS |
 21
2011 TIDEWATER
CHAIRMAN’S AWARD OBJECTIVES
2011 TIDEWATER
2011 TIDEWATER
CHAIRMAN’S AWARD OBJECTIVES
CHAIRMAN’S AWARD OBJECTIVES
To recognize an individual or team that has:
Performed heroic acts in time of crisis
Significantly impacted the TDW business
Significantly contributed to our customer success or
relationships
Had a breakthrough idea or contribution resulting in
significant improvements for TDW
Went above and beyond on normal duties and
responsibilities to achieve greatness |
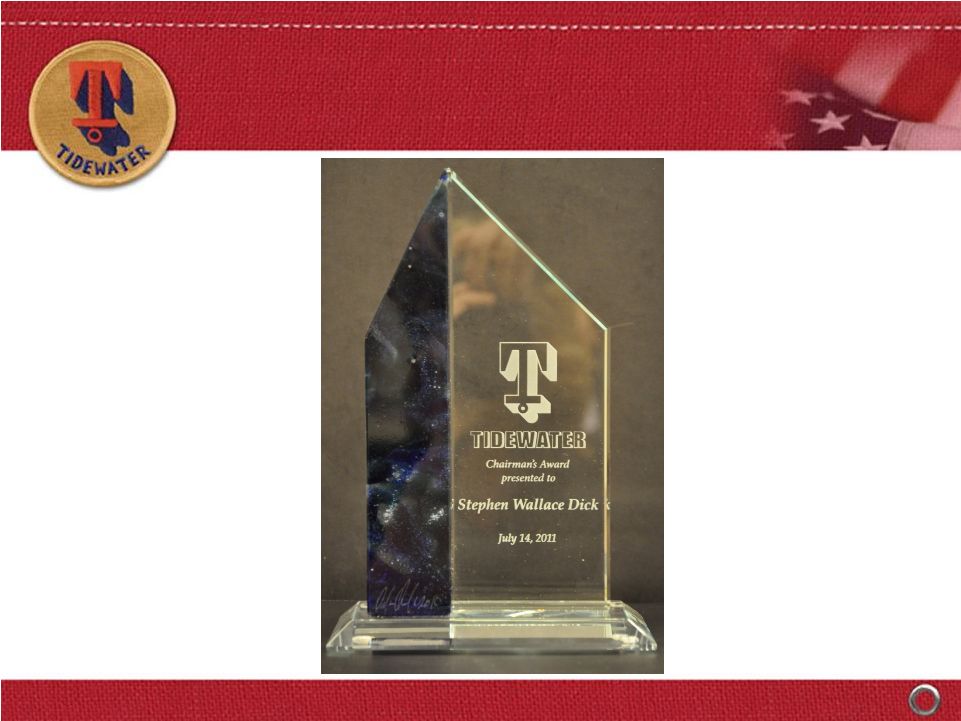 22
2011 TIDEWATER
CHAIRMAN’S AWARD
2011 TIDEWATER
2011 TIDEWATER
CHAIRMAN’S AWARD
CHAIRMAN’S AWARD |
 DEAN E.
TAYLOR DEAN E. TAYLOR
Chairman, President and CEO
Chairman, President and CEO
JEFFREY M. PLATT
JEFFREY M. PLATT
Chief Operating Officer
Chief Operating Officer
QUINN P. FANNING
QUINN P. FANNING
Executive VP and CFO
Executive VP and CFO
FISCAL 2011 ANNUAL
SHAREHOLDERS’
MEETING
FISCAL 2011 ANNUAL
FISCAL 2011 ANNUAL
SHAREHOLDERS’
SHAREHOLDERS’
MEETING
MEETING
July 14, 2011
July 14, 2011 |