Attached files
| file | filename |
|---|---|
| 8-K - TAIWAN FUND INC | v229171_8k.htm |
|
THE TAIWAN FUND, INC. (THE ‘FUND’)
|
|
|
MONTHLY INSIGHT
|
|
|
AT JUNE 30, 2011
|
|
|
IN BRIEF
|
|||
|
Net asset value per share
|
US$21.16 | ||
|
Market price
|
US$19.15 | ||
|
Premium/(discount)
|
(9.50 | %) | |
|
Fund size
|
US$393.0m |
Source: State Street Bank and Trust Company.
|
At June 30, 2011
|
US$ return
|
|||||||
|
Fund*
|
TAIEX Index†
|
|||||||
|
%
|
%
|
|||||||
|
One month
|
(1.4 | ) | (3.5 | ) | ||||
|
Three months
|
4.1 | 2.6 | ||||||
|
One year
|
43.1 | 37.5 | ||||||
|
Three years % pa
|
8.7 | 11.0 | ||||||
Past performance is not a guide to future returns.
Returns are annualized, except for periods of less than one year.
*Source: State Street Bank and Trust Company.
NAV performance.
†Source: TWSE. The index shown is the TAIEX Total Return Index.
SHANGHAI TEAM
The Martin Currie Shanghai Team
MANAGER’S COMMENTARY
The Taiwanese index fell by 3.5% in June, pulled down by the large technology stocks, as a number of CEOs became cautious about the second half year. However, the Fund, with its focus on domestic consumption, held up better and was down by just 1.4%.
Cross-strait news remained positive. The first wave of individual Chinese tourists arrived in Taiwan on June 28, 2011; so far only residents of Beijing, Shanghai and Xiamen need apply, but this should prove the thin end of the wedge. The daily ceiling is currently 500 tourists, but this seems likely to be raised to 900 in September. We are noticing that Taiwan’s department-store operators, including our invested Far Eastern Department Stores, are remodeling displays to appeal to Chinese tourists’ love of luxury brands. Chinese tourists are now estimated to account for 20% of sales in the ‘must-see’ Taipei 101 building, the highest in Taiwan. Medical institutions have started to provide high-end physical examination packages to Chinese visitors. Even Taiwanese property developers are targeting mainlanders, despite the fact that Taiwan’s government does not permit PRC citizens to buy property. Increased demand from visitors is coinciding with improving local sentiment to boost domestic consumption; the local consumer-confidence reading has remained above 85 for the past three months.
We have seen evidence of Japanese enterprises exploiting Taiwanese contacts to enter the Chinese market, thanks to the free-trade agreement signed between Taiwan and China. One example is Munsin, a Taiwanese company which distributes several Japanese brands (like Munsingwear, Comme Ca Du Mode and Anna Sui). The firm has been invited by the suppliers of those brands, Itochu and Isetan, to enlarge its China business. Meanwhile, Mitsubishi and NEC aim to build back-up production bases in Taiwan to act as a second source, given the supply disruption caused by the Japanese earthquake.
In May 2011, Taiwan’s exports increased 9.5% year on year to reach a record-high US$27 billion, though there is a sense that momentum is now slowing. The inflation rate remained low at 1.7%. The unemployment rate continued to fall, to 4.27%, a 33-month low. The exchange rate for the NT dollar against the US dollar remained flat at NT$28.8.
MONTHLY INSIGHT
INVESTMENT STRATEGY
The Fund is 86% invested with holdings in 53 companies.
We raised cash in mid-June, reflecting some concern about risks to the global economy over the summer from sovereign-debt issues.
We reduced our holding and took losses on Globe Union Industrial, where margins are being compressed by sluggish demand in American and European markets and rising raw-material costs. We also sold down Powercom as solar-inverter orders were postponed. We took some profits on TSRC, and sold down China Petrochemical Development and Continental Holdings, after good rallies.
Sales of the component distributor WPG Holdings and Taiwan Surface Mounting Technology, further cut our exposure to electronics (now just 18.8% compared to 49.7% in the index) as demand appears to be softening.
Chris Ruffle, Martin Currie Inc*
*Martin Currie Ltd and Heartland Capital Management Ltd (HCML) have established MC China Ltd (MCCL), as a joint venture company, to provide investment management or investment advisory services to the range of China investment products managed by Martin Currie.
MCCL has appointed Martin Currie Investment Management Ltd (MCIM), or its affiliates, as investment manager of Martin Currie’s China investment products. HCML has seconded both Chris Ruffle and Shifeng Ke to MCIM, or its affiliates, on a full time basis with the same roles and responsibilities as if they were full time employees.
Martin Currie Inc took over management of the Fund on May 8, 2010.
|
FUND DETAILS
|
|||
|
June 30, 2011
|
|||
|
Market cap
|
US$355.70m | ||
|
Shares outstanding
|
18,575,214 | ||
|
Exchange listed
|
NYSE
|
||
|
Listing date
|
1986 | ||
|
Investment manager
|
Martin Currie Inc
|
Source: State Street Bank and Trust Company.
|
PERFORMANCE
|
(US$ RETURNS) | |||||||
|
(US$ returns)
|
NAV %
|
Market price %
|
||||||
|
One month
|
(1.4 | ) | (2.0 | ) | ||||
|
Three months
|
4.1 | 2.6 | ||||||
|
Three years % pa
|
8.7 | 8.2 | ||||||
Past performance is not a guide to future returns. Returns are annualized, except for periods of less than one year.
Source: State Street Bank and Trust Company.
|
SECTOR ALLOCATION
|
||||||||
|
Fund %*
|
Benchmark %†
|
|||||||
|
Electronics
|
18.8 | 49.7 | ||||||
|
Finance
|
18.7 | 13.4 | ||||||
|
Wholesale and retail
|
14.5 | 5.9 | ||||||
|
Construction
|
7.2 | 1.9 | ||||||
|
Plastics
|
5.4 | 9.0 | ||||||
|
Healthcare
|
3.9 | — | ||||||
|
Foods
|
3.8 | 1.5 | ||||||
|
Textiles
|
3.6 | 2.0 | ||||||
|
Steel and iron
|
2.9 | 2.9 | ||||||
|
Transportation
|
2.5 | 2.5 | ||||||
|
Electric and machinery
|
1.7 | 1.3 | ||||||
|
Cement
|
1.1 | 1.4 | ||||||
|
Others
|
1.0 | 1.9 | ||||||
|
Chemicals
|
0.9 | 2.1 | ||||||
|
Rubber
|
— | 1.5 | ||||||
|
Automobile
|
— | 1.2 | ||||||
|
Electrical appliance & cable
|
— | 0.5 | ||||||
|
Glass and ceramics
|
— | 0.5 | ||||||
|
Tourism
|
— | 0.5 | ||||||
|
Paper and pulp
|
— | 0.3 | ||||||
|
Other assets and liabilities
|
14.0 | — | ||||||
*Source: State Street Bank and Trust Company.
†Source: TWSE.
|
15 LARGEST HOLDINGS*
|
|||||
|
42.7% of holdings
|
Sector
|
% of net
|
|||
|
assets
|
|||||
|
President Chain Store
|
Wholesale and retail
|
4.2 | |||
|
Chinatrust Financial Holding
|
Finance
|
3.5 | |||
|
Far Eastern Department Stores
|
Wholesale and retail
|
3.3 | |||
|
Wah Lee Industrial
|
Electronics
|
3.1 | |||
|
Clevo
|
Electronics
|
3.1 | |||
|
SinoPac Financial Holdings
|
Finance
|
2.9 | |||
|
Tung Ho Steel Enterprise
|
Steel and iron
|
2.9 | |||
|
Fubon Financial Holding
|
Finance
|
2.9 | |||
|
KGI Securities
|
Finance
|
2.8 | |||
|
Yuanta Financial Holding
|
Finance
|
2.8 | |||
|
Uni-President Enterprises
|
Foods
|
2.4 | |||
|
WT Microelectronics
|
Electronics
|
2.4 | |||
|
Nan Ya Plastics
|
Plastics
|
2.2 | |||
|
Test-Rite International
|
Wholesale and retail
|
2.2 | |||
|
Acer
|
Electronics
|
2.0 | |||
*Source: State Street Bank and Trust Company.
|
PERFORMANCE
|
(US$ returns at June 30, 2011) | |||||||||||||||||||||||||||||||
|
One month
|
Three months
|
Calendar year
|
One year
|
Three years
|
Five years
|
Ten years
|
Since launch
|
|||||||||||||||||||||||||
|
%
|
%
|
to date
|
%
|
% pa
|
% pa
|
% pa
|
% pa
|
|||||||||||||||||||||||||
|
%
|
||||||||||||||||||||||||||||||||
|
The Taiwan Fund, Inc.*
|
(1.4 | ) | 4.1 | 1.5 | 43.1 | 8.7 | 8.9 | 8.1 | 9.8 | |||||||||||||||||||||||
|
TAIEX Index†
|
(4.0 | ) | 2.0 | (2.1 | ) | 32.1 | 6.7 | 7.8 | 7.8 | 9.6 | ||||||||||||||||||||||
|
TAIEX Total Return Index†
|
(3.5 | ) | 2.6 | (1.6 | ) | 37.5 | 11.0 | 12.0 |
na
|
na
|
||||||||||||||||||||||
|
MSCI Taiwan Index†
|
(4.2 | ) | 1.7 | (2.6 | ) | 37.0 | 7.4 | 8.3 | 8.1 |
na
|
||||||||||||||||||||||
Past performance is not a guide to future returns. Returns are annualized, except for periods of less than one year.
*Source: State Street Bank and Trust Company. Launch date December 23, 1986. Returns for the Fund are historical total returns that reflect changes in net asset value per share during each period and assume that dividends and capital gains, if any, were reinvested.
†Source for index data: MSCI for the MSCI Taiwan Index and TWSE for the TAIEX Total Return Index and the TAIEX Index. For a full description of each index please see the index descriptions section.
Returns for the TAIEX Index are not total returns and reflect only changes in the share price but do not assume that cash dividends, if any, were reinvested, and thus are not strictly comparable to the Fund returns.
The TAIEX Total Return Index commenced January 1, 2003.
MONTHLY INSIGHT
PORTFOLIO IN FULL
|
|
||||||||||||||||||||
|
Company
|
% of
|
|||||||||||||||||||
|
Sector
|
(BGB ticker)
|
Price
|
Holding
|
Value US$
|
net assets
|
|||||||||||||||
|
ELECTRONICS
|
18.8 | |||||||||||||||||||
|
Wah Lee Industrial
|
3010 |
TT
|
NT$53.3 | 6,644,000 | $12,328,762 | 3.1 | ||||||||||||||
|
Clevo
|
2362 |
TT
|
NT$55.7 | 6,288,000 | $12,193,556 | 3.1 | ||||||||||||||
|
WT Microelectronics
|
3036 |
TT
|
NT$52.9 | 5,056,000 | $9,311,623 | 2.4 | ||||||||||||||
|
Acer
|
2353 |
TT
|
NT$50.0 | 4,567,000 | $7,949,936 | 2.0 | ||||||||||||||
|
Aurora
|
2373 |
TT
|
NT$56.2 | 2,711,000 | $5,304,305 | 1.3 | ||||||||||||||
|
Advantech
|
2395 |
TT
|
NT$97.6 | 1,341,000 | $4,556,604 | 1.2 | ||||||||||||||
|
MPI
|
6223 |
TT
|
NT$113.0 | 1,077,000 | $4,236,984 | 1.1 | ||||||||||||||
|
Chunghwa Telecom
|
2412 |
TT
|
NT$98.8 | 1,190,400 | $4,094,610 | 1.0 | ||||||||||||||
|
CHIPBOND Technology
|
6147 |
TT
|
NT$40.9 | 2,597,000 | $3,693,402 | 0.9 | ||||||||||||||
|
Taiflex Scientific
|
8039 |
TT
|
NT$61.8 | 1,600,000 | $3,442,477 | 0.9 | ||||||||||||||
|
Powercom
|
3043 |
TT
|
NT$49.1 | 1,830,000 | $3,128,205 | 0.8 | ||||||||||||||
|
Tatung
|
2371 |
TT
|
NT$13.3 | 4,770,897 | $2,209,095 | 0.6 | ||||||||||||||
|
Taiwan Surface Mounting Technology
|
6278 |
TT
|
NT$85.6 | 500,000 | $1,490,069 | 0.4 | ||||||||||||||
|
FINANCE
|
18.7 | |||||||||||||||||||
|
Chinatrust Financial Holding
|
2891 |
TT
|
NT$25.0 | 16,067,000 | $13,984,194 | 3.5 | ||||||||||||||
|
SinoPac Financial Holdings
|
2890 |
TT
|
NT$12.4 | 26,935,000 | $11,627,901 | 2.9 | ||||||||||||||
|
Fubon Financial Holding
|
2881 |
TT
|
NT$44.2 | 7,349,624 | $11,296,879 | 2.9 | ||||||||||||||
|
KGI Securities
|
6008 |
TT
|
NT$15.2 | 20,740,000 | $10,939,161 | 2.8 | ||||||||||||||
|
Yuanta Financial Holding
|
2885 |
TT
|
NT$19.9 | 15,741,000 | $10,905,562 | 2.8 | ||||||||||||||
|
China Life Insurance
|
2823 |
TT
|
NT$38.0 | 4,743,182 | $6,275,033 | 1.6 | ||||||||||||||
|
Shin Kong Financial Holding
|
2888 |
TT
|
NT$12.4 | 13,690,000 | $5,886,173 | 1.5 | ||||||||||||||
|
Union Bank of Taiwan
|
2838 |
TT
|
NT$10.4 | 7,507,000 | $2,718,081 | 0.7 | ||||||||||||||
|
WHOLESALE AND RETAIL
|
14.5 | |||||||||||||||||||
|
President Chain Store
|
2912 |
TT
|
NT$166.0 | 2,840,000 | $16,413,042 | 4.2 | ||||||||||||||
|
Far Eastern Department Stores
|
2903 |
TT
|
NT$57.5 | 6,559,500 | $13,131,103 | 3.3 | ||||||||||||||
|
Test-Rite International
|
2908 |
TT
|
NT$23.0 | 10,622,000 | $8,505,440 | 2.2 | ||||||||||||||
|
Mercuries & Associates
|
2905 |
TT
|
NT$27.5 | 7,704,100 | $7,375,938 | 1.9 | ||||||||||||||
|
PC Home Online
|
8044 |
TT
|
NT$180.5 | 922,125 | $5,794,682 | 1.5 | ||||||||||||||
|
Taiwan Tea
|
2913 |
TT
|
NT$19.7 | 8,231,000 | $5,645,228 | 1.4 | ||||||||||||||
|
CONSTRUCTION
|
7.2 | |||||||||||||||||||
|
Hung Poo Real Estate Development
|
2536 |
TT
|
NT$35.6 | 4,482,000 | $5,555,005 | 1.4 | ||||||||||||||
|
Ruentex Development
|
9945 |
TT
|
NT$40.4 | 3,829,000 | $5,378,876 | 1.4 | ||||||||||||||
|
Taiwan Land Development
|
2841 |
TT
|
NT$16.0 | 7,142,183 | $3,978,447 | 1.0 | ||||||||||||||
|
King’s Town Construction
|
2524 |
TT
|
NT$28.9 | 3,946,000 | $3,970,247 | 1.0 | ||||||||||||||
|
Good Friend International Holdings
|
2398 |
TT
|
NT$24.7 | 4,145,000 | $3,557,166 | 0.9 | ||||||||||||||
|
Goldsun Development & Construction
|
2504 |
TT
|
NT$14.4 | 6,798,000 | $3,408,053 | 0.9 | ||||||||||||||
|
Continental Holdings
|
3703 |
TT
|
NT$13.6 | 5,354,000 | $2,525,692 | 0.6 | ||||||||||||||
|
PLASTICS
|
5.4 | |||||||||||||||||||
|
Nan Ya Plastics
|
1303 |
TT
|
NT$76.6 | 3,217,000 | $8,579,115 | 2.2 | ||||||||||||||
|
China Petrochemical Development
|
1314 |
TT
|
NT$32.8 | 6,382,000 | $7,287,747 | 1.9 | ||||||||||||||
|
Yem Chio
|
4306 |
TT
|
NT$26.8 | 5,701,316 | $5,319,521 | 1.3 | ||||||||||||||
|
HEALTHCARE
|
3.9 | |||||||||||||||||||
|
St. Shine Optical
|
1565 |
TT
|
NT$435.5 | 392,000 | $5,943,426 | 1.5 | ||||||||||||||
|
Pacific Hospital Supply
|
4126 |
TT
|
NT$114.5 | 1,223,142 | $4,875,790 | 1.2 | ||||||||||||||
|
Excelsior Medical
|
4104 |
TT
|
NT$89.1 | 1,507,729 | $4,676,960 | 1.2 | ||||||||||||||
|
Company
|
% of
|
|||||||||||||||||||
|
Sector
|
(BGB ticker)
|
Price
|
Holding
|
Value US$
|
net assets
|
|||||||||||||||
|
FOODS
|
3.8 | |||||||||||||||||||
|
Uni-President Enterprises
|
1216 |
TT
|
NT$41.6 | 6,600,000 | $9,558,724 | 2.4 | ||||||||||||||
|
Lien Hwa Industrial
|
1229 |
TT
|
NT$21.8 | 4,564,000 | $3,463,895 | 0.9 | ||||||||||||||
|
Gourmet Master
|
2723 |
TT
|
NT$260.0 | 204,000 | $1,846,572 | 0.5 | ||||||||||||||
|
TEXTILES
|
3.6 | |||||||||||||||||||
|
Far Eastern New Century
|
1402 |
TT
|
NT$44.8 | 3,121,200 | $4,862,698 | 1.2 | ||||||||||||||
|
Makalot Industrial
|
1477 |
TT
|
NT$75.2 | 1,828,000 | $4,785,823 | 1.2 | ||||||||||||||
|
Li Peng Enterprise
|
1447 |
TT
|
NT$13.8 | 9,509,000 | $4,551,978 | 1.2 | ||||||||||||||
|
STEEL AND IRON
|
2.9 | |||||||||||||||||||
|
Tung Ho Steel Enterprise
|
2006 |
TT
|
NT$32.6 | 10,099,000 | $11,461,953 | 2.9 | ||||||||||||||
|
TRANSPORTATION
|
2.5 | |||||||||||||||||||
|
Farglory F T Z Investment Holding
|
5607 |
TT
|
NT$29.0 | 7,485,000 | $7,544,023 | 1.9 | ||||||||||||||
|
Taiwan High Speed Rail
|
2633 |
TT
|
NT$5.1 | 12,597,600 | $2,236,767 | 0.6 | ||||||||||||||
|
ELECTRIC AND MACHINERY
|
1.7 | |||||||||||||||||||
|
Yungtay Engineering
|
1507 |
TT
|
NT$57.3 | 3,274,000 | $6,531,244 | 1.7 | ||||||||||||||
|
CEMENT
|
1.1 | |||||||||||||||||||
|
Wei Mon Industry
|
8925 |
TT
|
NT$19.1 | 6,204,296 | $4,114,813 | 1.1 | ||||||||||||||
|
OTHERS
|
1.0 | |||||||||||||||||||
|
Globe Union Industrial
|
9934 |
TT
|
NT$24.7 | 4,481,000 | $3,853,315 | 1.0 | ||||||||||||||
|
CHEMICALS
|
0.9 | |||||||||||||||||||
|
China Steel Chemical
|
1723 |
TT
|
NT$153.5 | 654,000 | $3,495,013 | 0.9 | ||||||||||||||
|
OTHER ASSETS AND LIABILITIES, NET
|
$55,167,542 | 14.0 | ||||||||||||||||||
MONTHLY INSIGHT
THE TAIWAN FUND, INC. PREMIUM/DISCOUNT
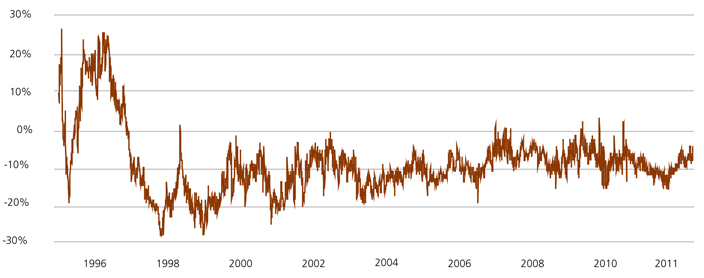
Source: State Street Bank and Trust Company as of June 30, 2011.
INDEX DESCRIPTIONS
TAIEX Index
The TWSE, or TAIEX Index is a capitalization-weighted index of all listed common shares traded on the Taiwan Stock Exchange. The index was based in 1966 and does not include re-invested dividends.
TAIEX Total Return Index
The TAIEX Total Return Index is a capitalization-weighted index of all listed common shares traded on the Taiwan Stock Exchange, based in 1966, which includes re-invested dividends.
MSCI Taiwan Index
The MSCI Total Return Taiwan Index is a free-float adjusted market capitalization index. The index represents Taiwanese companies that are available to investors worldwide. The Index has a base date of December 31, 1987. As of June 30, 2011, it contained 125 constituents.
OBJECTIVE
The Fund was launched on December 23, 1986 to allow US and other investors to access and participate in the growth of the economy and the stock market in Taiwan, the Republic of China. The Fund’s investment objective is to seek long-term capital appreciation primarily through investments in equity securities listed in Taiwan. The Fund is a diversified, closed-end management investment company listed on the New York Stock Exchange (NYSE) under the symbol ‘TWN’.
Taiwan, with its global market leadership in high technology goods and its significant investments throughout mainland China and Southeast Asian economies, is now an integral economic player in the Asia Pacific Region as well as around the world. Investing in Taiwan not only allows investors to capitalize on Taiwan’s dynamic economy, but also allows investors to reap the growth and investment potential of the mainland China and other emerging economies of the region.
CONTACTS
The Taiwan Fund, Inc.
c/o State Street Bank and Trust Company
2 Avenue de Lafayette
PO Box 5049
Boston, MA 02111
Tel: (1) 877-864-5056
www.thetaiwanfund.com
IMPORTANT INFORMATION
This document is issued and approved by Martin Currie Inc (MC Inc), as investment adviser of The Taiwan Fund, Inc. (the ‘Fund’). MC Inc is authorised and regulated by the Financial Services Authority (FSA) and incorporated under limited liability in New York, USA. Registered in Scotland (No BR2575), registered address Saltire Court, 20 Castle Terrace, Edinburgh, EH1 2ES. Information herein is believed to be reliable but has not been verified by MC Inc. MC Inc makes no representation or warranty and does not accept any responsibility in relation to such information or for opinion or conclusion which the reader may draw from this newsletter.
The Fund is classified as a diversified investment company under the US Investment Company Act of 1940 as amended. It meets the criteria of a closed ended US mutual fund and its shares are listed on the New York Stock Exchange. MC Inc has been appointed investment adviser to the Fund.
Investors are advised that they will not generally benefit from the rules and regulations of the United Kingdom Financial Services and Markets Act 2000 and the FSA for the protection of investors, nor benefit from the United Kingdom Financial Services Compensation Scheme, nor have access to the Financial Services Ombudsman in the event of a dispute. Investors will also have no rights of cancellation under the FSA’s Conduct of Business Sourcebook of the United Kingdom.
This newsletter does not constitute an offer of shares. MC Inc, its ultimate and intermediate holding companies, subsidiaries, affiliates, clients, directors or staff may, at any time, have a position in the market referred to herein, and may buy or sell securities, currencies, or any other financial instruments in such markets. The information or opinion expressed in this newsletter should not be construed to be a recommendation to buy or sell the securities, commodities, currencies or financial instruments referred to herein.
The information provided in this report should not be considered a recommendation to purchase or sell any particular security. There is no assurance that any securities discussed herein will remain in an account’s portfolio at the time you receive this report or that securities sold have not been repurchased.
It should not be assumed that any of the securities transactions or holdings discussed here were or will prove to be profitable, or that the investment recommendations or decisions we make in the future will be profitable or will equal the investment performance of the securities discussed herein.
Investing in the Fund involves certain considerations in addition to the risks normally associated with making investments in securities. The value of the shares issued by the Fund, and the income from them, may go down as well as up and there can be no assurance that upon sale, or otherwise, investors will receive back the amount originally invested. There can be no assurance that you will receive comparable performance returns, or that investments will reflect the performance of the stock examples contained in this document. Movements in foreign exchange rates may have a separate effect, unfavorable as well as favorable, on the gain or loss otherwise experienced on an investment. Past performance is not a guide to future returns. Accordingly, the Fund is only suitable for investment by investors who are able and willing to withstand the total loss of their investment. In particular, prospective investors should consider the following risks:
|
→
|
it should be noted that investment in the Fund is only suitable for sophisticated investors who are aware of the risk of investing in Taiwan and should be regarded as long term. Funds which invest in one country carry a higher degree of risk than those with portfolios diversified across a number of markets.
|
|
→
|
investment in the securities of smaller and unquoted companies can involve greater risk than is customarily associated with investment in larger, more established, companies. In particular, smaller companies often have limited product lines, markets or financial resources and their management may be dependent on a smaller number of key individuals. In addition, the market for stock in smaller companies is often less liquid than that for stock in larger companies, bringing with it potential difficulties in acquiring, valuing and disposing of such stock. Proper information for determining their value, or the risks to which they are exposed, may not be available.
|
|
→
|
investments within emerging markets such as Taiwan can be of higher risk. Many emerging markets, and the companies quoted on their stock exchanges, are exposed to the risks of political, social and religious instability, expropriation of assets or nationalization, rapid rates of inflation, high interest rates, currency depreciation and fluctuations and changes in taxation which may affect the Fund’s income and the value of its investments.
|
|
→
|
the marketability of quoted shares may be limited due to foreign investment restrictions, wide dealing spreads, exchange controls, foreign ownership restrictions, the restricted opening of stock exchanges and a narrow range of investors. Trading volume may be lower than on more developed stockmarkets, and equities are less liquid. Volatility of prices can also be greater than in more developed stockmarkets. The infrastructure for clearing, settlement and registration on the primary and secondary markets may be undeveloped. Under certain circumstances, there may be delays in settling transactions in some of the markets.
|

Martin Currie Inc, registered in Scotland (no BR2575)
Registered office: Saltire Court, 20 Castle Terrace, Edinburgh EH1 2ES
Tel: 44 (0) 131 229 5252 Fax: 44 (0) 131 228 5959 www.martincurrie.com
North American office: 1350 Avenue of the Americas, Suite 3010, New York, NY
10019, USA Tel: (1) 212 258 1900 Fax: (1) 212 258 1919
Authorised and registered by the Financial Services Authority and incorporated with
limited liability in New York, USA.
Please note: calls to the above numbers may be recorded.