Attached files
| file | filename |
|---|---|
| 8-K - FORM 8-K - JOHNSON CONTROLS INC | c65521e8vk.htm |
| EX-99.1 - EX-99.1 - JOHNSON CONTROLS INC | c65521exv99w1.htm |
Exhibit 99.2
| Quarterly update FY 2011 third quarter July 20, 2011 Exhibit 99.2 |

| Agenda Introduction Glen Ponczak, Vice President, Investor Relations Overview Steve Roell, Chairman and Chief Executive Officer Business results and financial review Bruce McDonald, Executive Vice President and Chief Financial Officer Q&A (conclude at noon Eastern time) FORWARD-LOOKING STATEMENT Johnson Controls, Inc. has made forward-looking statements in this document pertaining to its financial results for fiscal 2011 and beyond that are based on preliminary data and are subject to risks and uncertainties. All statements, other than statements of historical fact, are statements that are, or could be, deemed "forward-looking" statements and include terms such as "outlook," "expectations," "estimates" or "forecasts." For those statements, the Company cautions that numerous important factors, such as automotive vehicle production levels, mix and schedules, customer or supplier disruptions, energy and commodity prices, the strength of the U.S. or other economies, currency exchange rates, cancellation of or changes to commercial contracts as well as other factors discussed in Item 1A of Part I of the Company's most recent Form 10-k filing (filed November 23, 2010) could affect the Company's actual results and could cause its actual consolidated results to differ materially from those expressed in any forward-looking statement made by, or on behalf of, the Company. 2 |
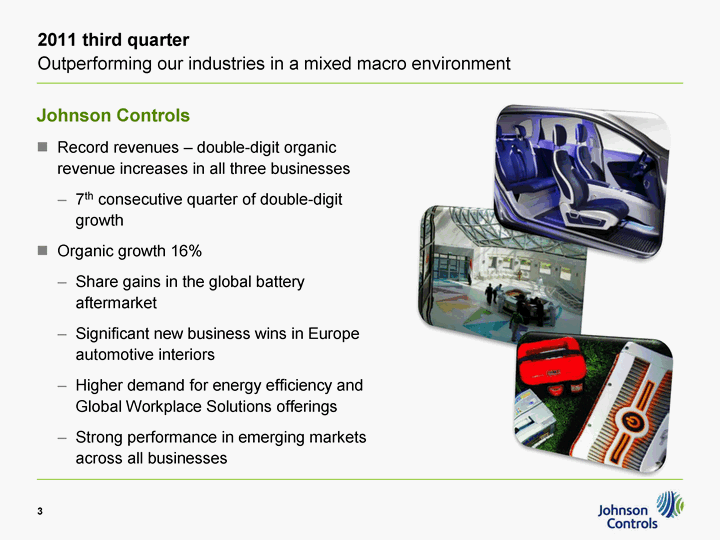
| 2011 third quarter Outperforming our industries in a mixed macro environment Johnson Controls Record revenues - double-digit organic revenue increases in all three businesses 7th consecutive quarter of double-digit growth Organic growth 16% Share gains in the global battery aftermarket Significant new business wins in Europe automotive interiors Higher demand for energy efficiency and Global Workplace Solutions offerings Strong performance in emerging markets across all businesses 3 |
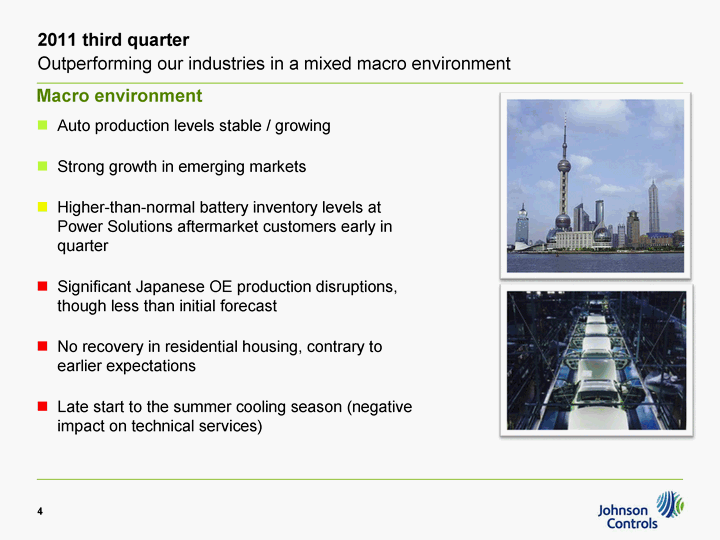
| 2011 third quarter Outperforming our industries in a mixed macro environment Macro environment Auto production levels stable / growing Strong growth in emerging markets Higher-than-normal battery inventory levels at Power Solutions aftermarket customers early in quarter Significant Japanese OE production disruptions, though less than initial forecast No recovery in residential housing, contrary to earlier expectations Late start to the summer cooling season (negative impact on technical services) 4 |
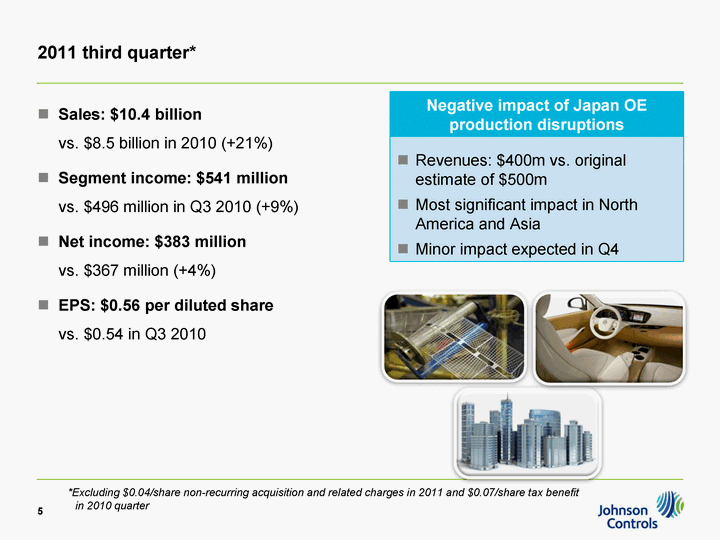
| 2011 third quarter* Sales: $10.4 billion vs. $8.5 billion in 2010 (+21%) Segment income: $541 million vs. $496 million in Q3 2010 (+9%) Net income: $383 million vs. $367 million (+4%) EPS: $0.56 per diluted share vs. $0.54 in Q3 2010 5 *Excluding $0.04/share non-recurring acquisition and related charges in 2011 and $0.07/share tax benefit in 2010 quarter Negative impact of Japan OE production disruptions Revenues: $400m vs. original estimate of $500m Most significant impact in North America and Asia Minor impact expected in Q4 |
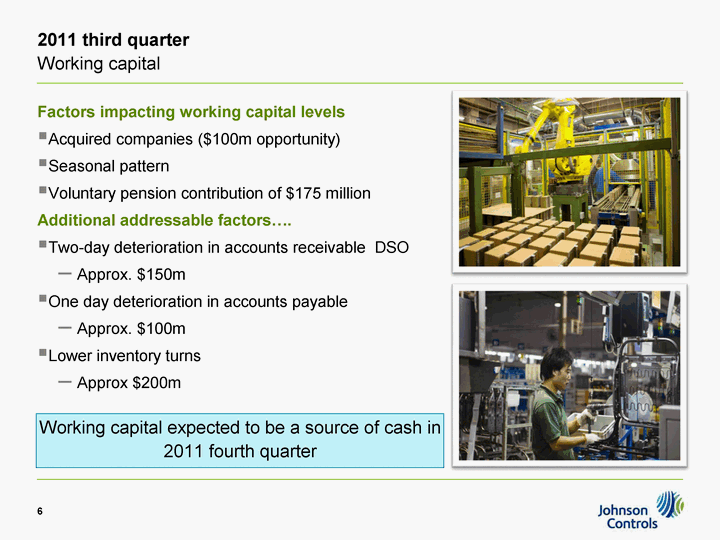
| 2011 third quarter Working capital Factors impacting working capital levels Acquired companies ($100m opportunity) Seasonal pattern Voluntary pension contribution of $175 million Additional addressable factors.... Two-day deterioration in accounts receivable DSO Approx. $150m One day deterioration in accounts payable Approx. $100m Lower inventory turns Approx $200m 6 Working capital expected to be a source of cash in 2011 fourth quarter |
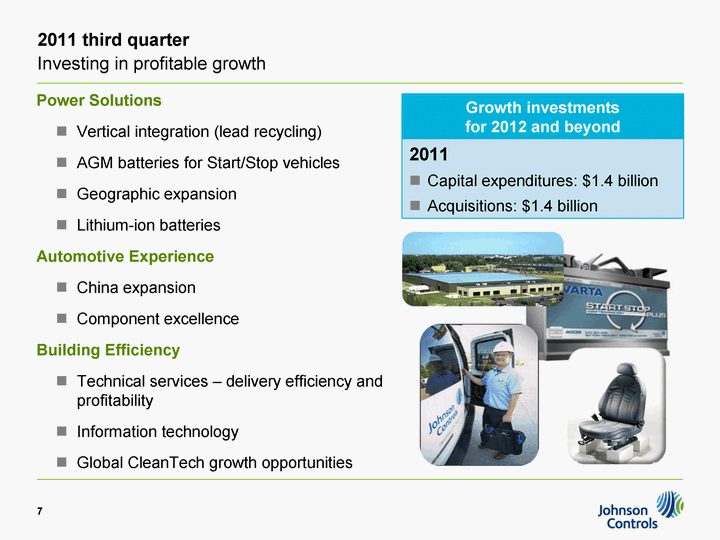
| 2011 third quarter Investing in profitable growth Power Solutions Vertical integration (lead recycling) AGM batteries for Start/Stop vehicles Geographic expansion Lithium-ion batteries Automotive Experience China expansion Component excellence Building Efficiency Technical services - delivery efficiency and profitability Information technology Global CleanTech growth opportunities 7 Growth investments for 2012 and beyond 2011 Capital expenditures: $1.4 billion Acquisitions: $1.4 billion |
| Business results 8 2011 third quarter |
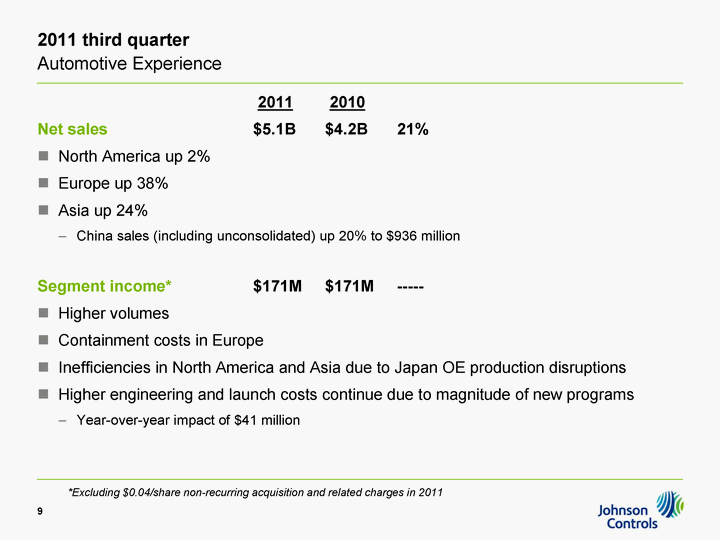
| 2011 third quarter Automotive Experience 2011 2010 Net sales $5.1B $4.2B 21% North America up 2% Europe up 38% Asia up 24% China sales (including unconsolidated) up 20% to $936 million Segment income* $171M $171M ----- Higher volumes Containment costs in Europe Inefficiencies in North America and Asia due to Japan OE production disruptions Higher engineering and launch costs continue due to magnitude of new programs Year-over-year impact of $41 million 9 *Excluding $0.04/share non-recurring acquisition and related charges in 2011 |
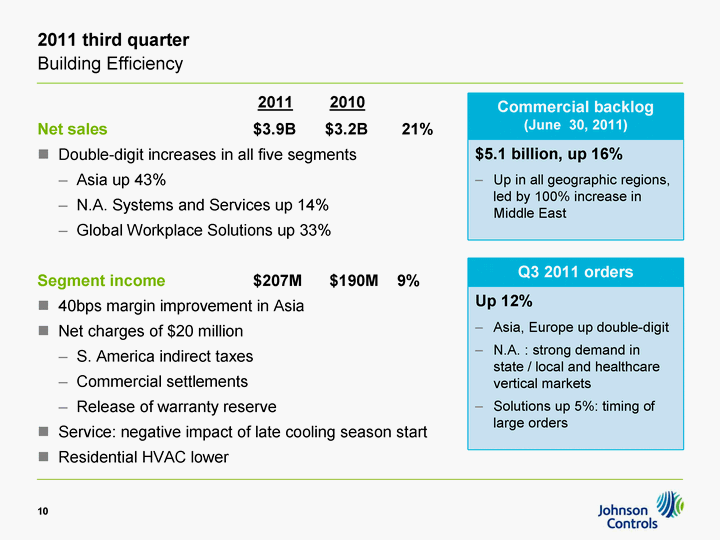
| 2011 third quarter Building Efficiency 2011 2010 Net sales $3.9B $3.2B 21% Double-digit increases in all five segments Asia up 43% N.A. Systems and Services up 14% Global Workplace Solutions up 33% Segment income $207M $190M 9% 40bps margin improvement in Asia Net charges of $20 million S. America indirect taxes Commercial settlements Release of warranty reserve Service: negative impact of late cooling season start Residential HVAC lower 10 Commercial backlog (June 30, 2011) $5.1 billion, up 16% Up in all geographic regions, led by 100% increase in Middle East Q3 2011 orders Up 12% Asia, Europe up double-digit N.A. : strong demand in state / local and healthcare vertical markets Solutions up 5%: timing of large orders |
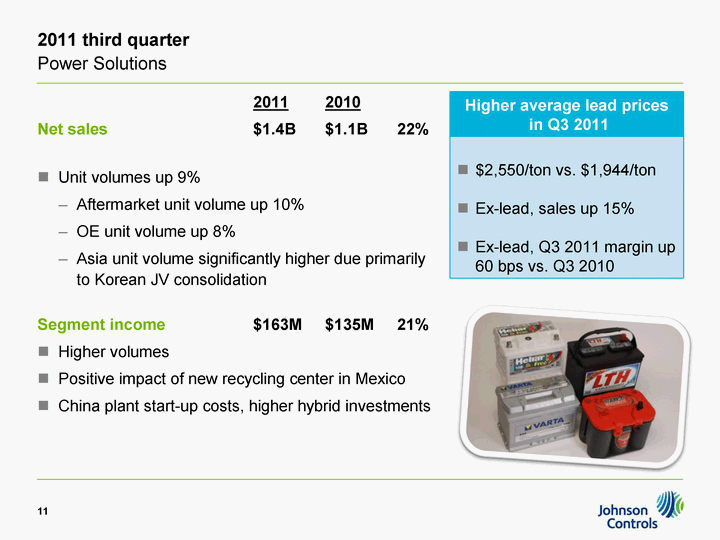
| 2011 third quarter Power Solutions 2011 2010 Net sales $1.4B $1.1B 22% Unit volumes up 9% Aftermarket unit volume up 10% OE unit volume up 8% Asia unit volume significantly higher due primarily to Korean JV consolidation Segment income $163M $135M 21% Higher volumes Positive impact of new recycling center in Mexico China plant start-up costs, higher hybrid investments China plant start-up costs, higher hybrid investments China plant start-up costs, higher hybrid investments China plant start-up costs, higher hybrid investments China plant start-up costs, higher hybrid investments China plant start-up costs, higher hybrid investments China plant start-up costs, higher hybrid investments China plant start-up costs, higher hybrid investments China plant start-up costs, higher hybrid investments China plant start-up costs, higher hybrid investments China plant start-up costs, higher hybrid investments China plant start-up costs, higher hybrid investments China plant start-up costs, higher hybrid investments China plant start-up costs, higher hybrid investments 11 Higher average lead prices in Q3 2011 $2,550/ton vs. $1,944/ton Ex-lead, sales up 15% Ex-lead, Q3 2011 margin up 60 bps vs. Q3 2010 |
| 2011 third quarter Financial review 12 |
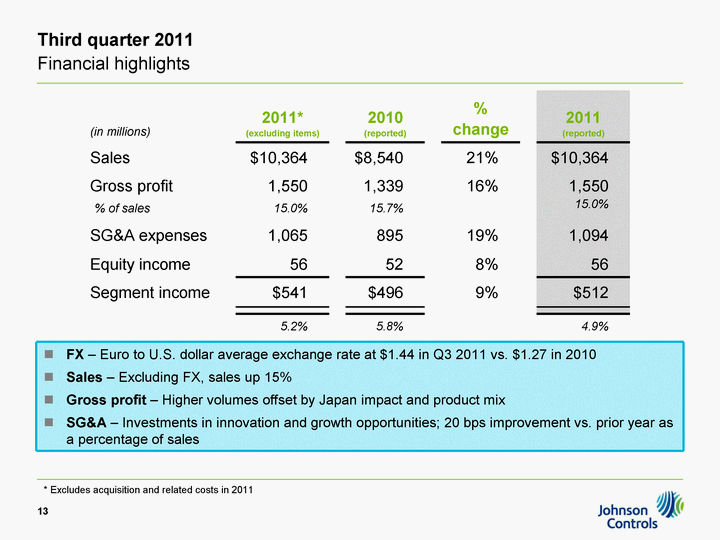
| Third quarter 2011 Financial highlights 13 (in millions) 2011* (excluding items) 2010 (reported) % change 2011 (reported) Sales $10,364 $8,540 21% $10,364 Gross profit % of sales 1,550 15.0% 1,339 15.7% 16% 1,550 15.0% SG&A expenses 1,065 895 19% 1,094 Equity income 56 52 8% 56 Segment income $541 $496 9% $512 5.2% 5.8% 4.9% FX - Euro to U.S. dollar average exchange rate at $1.44 in Q3 2011 vs. $1.27 in 2010 Sales - Excluding FX, sales up 15% Gross profit - Higher volumes offset by Japan impact and product mix SG&A - Investments in innovation and growth opportunities; 20 bps improvement vs. prior year as a percentage of sales * Excludes acquisition and related costs in 2011 |
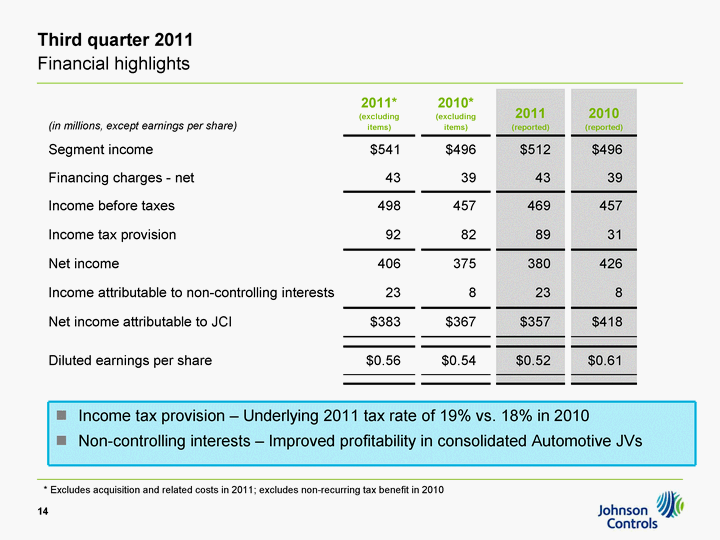
| Third quarter 2011 Financial highlights Income tax provision - Underlying 2011 tax rate of 19% vs. 18% in 2010 Non-controlling interests - Improved profitability in consolidated Automotive JVs 14 (in millions, except earnings per share) 2011* (excluding items) 2010* (excluding items) 2011 (reported) 2010 (reported) Segment income $541 $496 $512 $496 Financing charges - net 43 39 43 39 Income before taxes 498 457 469 457 Income tax provision 92 82 89 31 Net income 406 375 380 426 Income attributable to non-controlling interests 23 8 23 8 Net income attributable to JCI $383 $367 $357 $418 Diluted earnings per share $0.56 $0.54 $0.52 $0.61 * Excludes acquisition and related costs in 2011; excludes non-recurring tax benefit in 2010 |
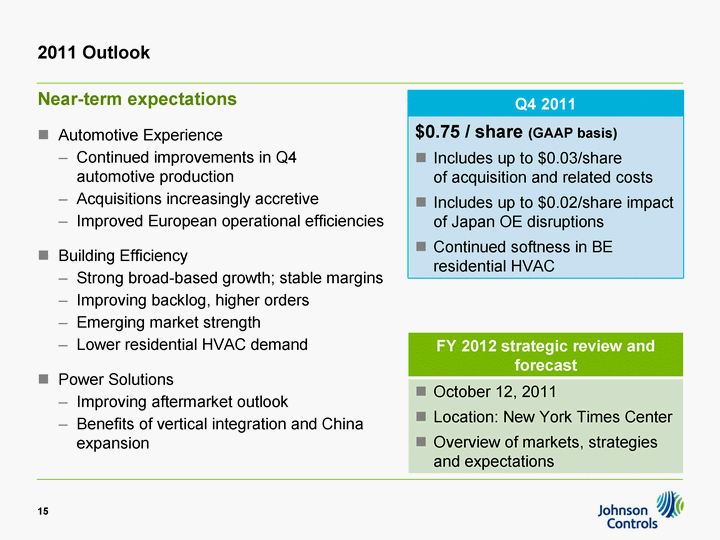
| 2011 Outlook Near-term expectations Automotive Experience Continued improvements in Q4 automotive production Acquisitions increasingly accretive Improved European operational efficiencies Building Efficiency Strong broad-based growth; stable margins Improving backlog, higher orders Emerging market strength Lower residential HVAC demand Power Solutions Improving aftermarket outlook Benefits of vertical integration and China expansion 15 FY 2012 strategic review and forecast October 12, 2011 Location: New York Times Center Overview of markets, strategies and expectations Q4 2011 $0.75 / share (GAAP basis) Includes up to $0.03/share of acquisition and related costs Includes up to $0.02/share impact of Japan OE disruptions Continued softness in BE residential HVAC |
