Attached files
| file | filename |
|---|---|
| 8-K - FORM 8-K - American Water Works Company, Inc. | d8k.htm |
 Institutional Investor Meetings
July 2011
Exhibit 99.1 |
 2
Certain
statements
in
this
presentation
are
forward-looking
statements
within
the
meaning
of
the
safe
harbor
provisions
of
the
Private
Securities
Litigation
Reform
Act
of
1995.
These
forward-looking
statements
are
predictions
based
on
our
current
expectations
and
assumptions
regarding
future
events
and
may
relate
to,
among
other
things,
our
future
financial
performance,
including
return
on
equity
performance,
our
growth
and
portfolio
optimization
strategies,
our
projected
capital
expenditures
and
related
funding
requirements,
our
ability
to
repay
debt,
our
ability
to
finance
current
operations
and
growth
initiatives,
the
impact
of
legal
proceedings
and
potential
fines
and
penalties,
business
process
and
technology
improvement
initiatives,
trends
in
our
industry,
regulatory
or
legal
developments
or
rate
adjustments.
Actual
results
could
differ
materially
because
of
factors
decisions
of
governmental
and
regulatory
bodies,
including
decisions
to
raise
or
lower
rates;
the
timeliness
of
regulatory
commissions’
actions
concerning
rates;
changes
in
laws,
governmental
regulations
and
policies,
including
environmental,
health
and
water
quality
and
public
utility
regulations
and
policies;
weather
conditions,
patterns
or
events,
including
drought
or
abnormally
high
rainfall;
changes
in
customer
demand
for,
and
patterns
of
use
of,
water,
such
as
may
result
from
conservation
efforts;
significant
changes
to
our
business
processes
and
corresponding
technology;
our
ability
to
appropriately
maintain
current
infrastructure;
our
ability
to
obtain
permits
and
other
approvals
for
projects;
changes
in
our
capital
requirements;
our
ability
to
control
operating
expenses
and
to
achieve
efficiencies
in
our
operations;
our
ability
to
obtain
adequate
and
cost-effective
supplies
of
chemicals,
electricity,
fuel,
water
and
other
raw
materials
that
are
needed
for
our
operations;
our
ability
to
successfully
acquire
and
integrate
water
and
wastewater
systems
that
are
complementary
to
our
operations
and
the
growth
of
our
business
or
dispose
of
assets
or
lines
of
business
that
are
not
complementary
to
our
operations
and
the
growth
of
our
business;
cost
overruns
relating
to
improvements
or
the
expansion
of
our
operations;
changes
in
general
economic,
business
and
financial
market
conditions;
access
to
sufficient
capital
on
satisfactory
terms;
fluctuations
in
interest
rates;
restrictive
covenants
in
or
changes
to
the
credit
ratings
on
our
current
or
future
debt
that
could
increase
our
financing
costs
or
affect
our
ability
to
borrow,
make
payments
on
debt
or
pay
dividends;
fluctuations
in
the
value
of
benefit
plan
assets
and
liabilities
that
could
increase
our
cost
and
funding
requirements;
our
ability
to
utilize
our
U.S.
and
state
net
operating
loss
carryforwards;
migration
of
customers
into
or
out
of
our
service
territories;
difficulty
in
obtaining
insurance
at
acceptable
rates
and
on
acceptable
terms
and
conditions;
the
incurrence
of
impairment
charges
ability
to
retain
and
attract
qualified
employees;
and
civil
disturbance,
or
terrorist
threats
or
acts
or
public
apprehension
about
future
disturbances
or
terrorist
threats
or
acts.
Any
forward-looking
statements
we
make,
speak
only
as
of
the
date
of
this
presentation.
Except
as
required
by
law,
we
do
not
have
any
obligation,
and
we
specifically
disclaim
any
undertaking
or
intention,
to
publicly
update
or
revise
any
forward-
looking
statements,
whether
as
a
result
of
new
information,
future
events,
changed
circumstances
or
otherwise.
Cautionary Statement Concerning Forward-Looking
Statements
July 2011 |
 July 2011
American Water: The Premier Water Services Provider in
North America
Geographic Diversity
(1)
Business Diversity
(1)
Market Capitalization: $5.2 Billion
Enterprise Value: $10.8 Billion
Average Daily Volume Traded: 1.1 Million shares
(1)
Based on 2010 Revenues
(2)
Market data as of 6/29/11
(3)
Market-Based includes Other
3
$601.2
$505.9
$232.0
$224.6
$181.7
$158.2
$123.4
NJ
PA
IL
MO
IN
CA
WVA
Regulated,
89.4%
Market
Based ,
(3)
10.6% |
 July 2011
4
American Water has achieved impressive Growth
since its IPO
* 2008 and 2009 exclude impairment charges. See slide 42 for reconciliation table
Earnings Per Share*
Cash Flow From
Operations
(millions)
$268
$210
$176
2010
2009
2008
$1.10
$1.25
$1.53
$552
$596
$775
2008
2009
2009
2010
2010
2008
Net Income
(millions) |
 The
US Water Industry |
 July 2011
The U.S. Water Industry
6
Key
Water
Sector
Themes
Aging
Infrastructure
Fragmented
Industry
Increasing
Environmental
Requirements
Capital
Availability
Technology |
 7
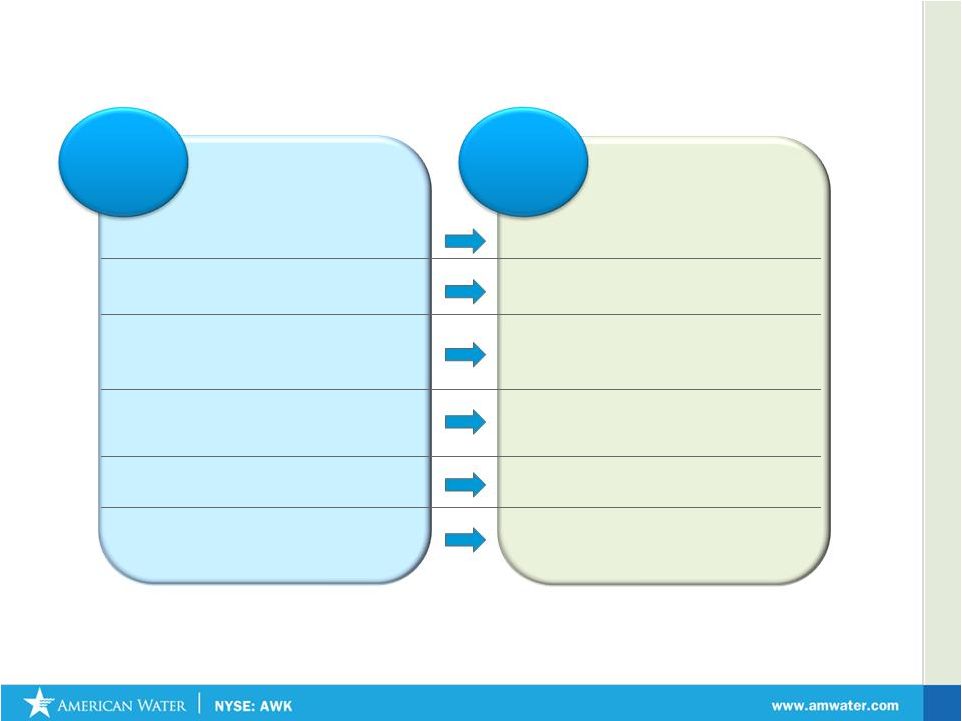
Water Industry Has a Favorable Utility Profile
Water Utility
Characteristics
Implications
•
Capital projects focused on maintaining
public health & safety standards
•
Regulators supportive of prudent projects
•
Water bills low portion of household budget
•
Essential
product
–
no
substitutes
•
Demand is more price inelastic than
electric or gas
•
Raw input costs (i.e. water and chemicals)
less volatile than other utility commodity
costs (i.e. coal and natural gas)
•
More stable rates for customers
•
Cost forecasting and regulatory lag is more
manageable
•
M&A primarily small tuck-ins enabling
targets to meet health & safety standards
•
Regulators generally support the
strengthening of water systems via M&A
•
Water storage more feasible and cheaper
than electricity or gas storage
•
Water utilities can be more cost efficient
and responsive to demand fluctuations
•
Large water utilities diversified across
multiple geographies
•
Mitigates impact of localized severe
weather conditions / regulatory outcomes
July 2011 |
 July 2011
Aging US Infrastructure Investment Remains Critical
*Source: U.S. Environmental Protection Agency’s 2007 Drinking Water
Infrastructure Needs Survey and Assessment. In billions, adjusted to January
2007 dollars. Transmission &
Distribution:
$200.8
Treatment:
$75.1
Storage:
$36.9
Source:
$19.8
Other:
$2.3
Total: $334.8 Billion
8
**Source: 2002 U.S. Environmental Protection Agency Clean Water and Drinking Water
Gap analysis US EPA Estimated 20 Year Total Needs
of US Public Water Systems*
American Society of Civil Engineers
(ASCE) grades US infrastructure
•
2009: $335 billion
•
2005: $277 billion
•
2002: $154 billion
•
2009 Grade: D-
•
2005 Grade: D-
•
2001 Grade: D
US EPA estimates upwards to $1 trillion needed for public
water and wastewater systems** |
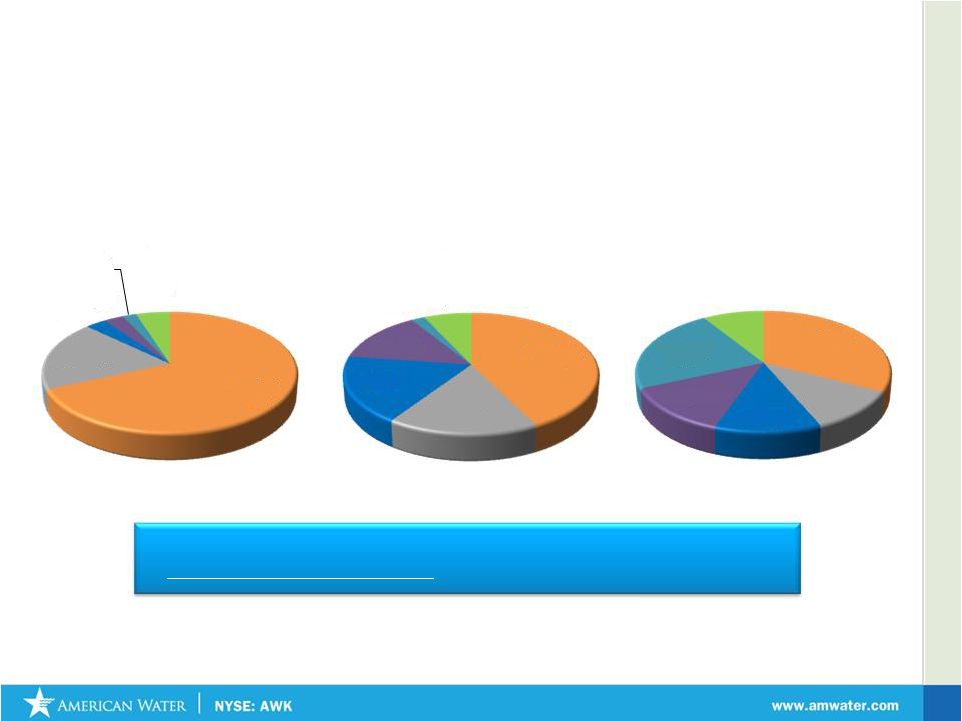 Without renewal or replacement of existing systems, pipe classified
as
poor,
very
poor
or
life
elapsed
will
increase
from
10%
to
44%
by
2020
Aging Pipe Infrastructure Network Propels Need for
Capital Expenditures
Percentage of Pipes by Classification
Source: American Water Works Association, Dawn of the Replacement Era: Reinvesting
in Drinking Water Infrastructure, May 2001
9
Excellent,
69%
Good, 19%
Fair, 3%
Poor,
3%
Very
Poor, 2%
Life
Elapsed,
5%
1980
Excellent,
43%
Good, 17%
Fair, 18%
Poor, 14%
Very
Poor, 2%
Life
Elapsed,
7%
2000
Excellent,
33%
Good, 11%
Fair, 12%
Poor, 13%
Very Poor,
23%
Life
Elapsed,
9%
2020
July 2011 |
 10
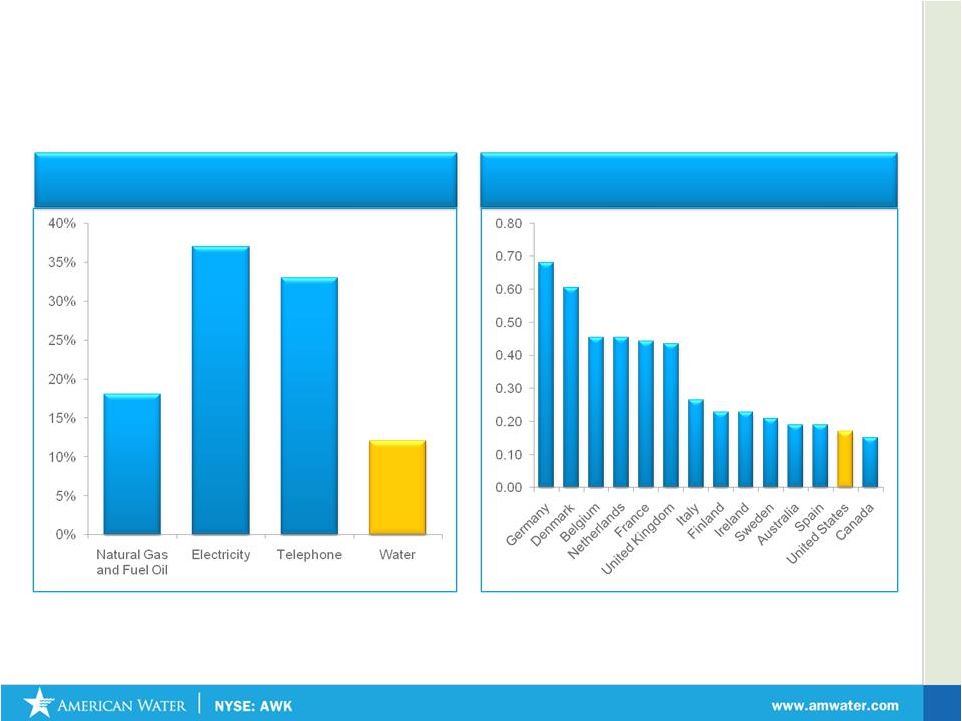
Water and wastewater rates in U.S. vs. other countries
(cents per gallon)
(1)
Source: 2008-2009 Bureau of Labor Statistics; Assumes four person
household. (2)
Canadian government data, using standard business conversions
(3)
Assumes purchasing parity pricing index
Domestically: % of Annual Household
Budget
(1)
Internationally: Cost comparison vs other
countries
(cents
per
gallon
(2)
)
July 2011 |
 American Water |
 July 2011
Note: Numbers may not total due to rounding.
12
Top Seven
States
Customers
Served
(2010)
% of
Total
2010
Revenues
($ mm)
% of
Total
Rate Base
Approved per
Last Rate
Case
Date of Last
Rate Case
DSIC
Test Year
(1)
Tariff
Structure
(2)
Pennsylvania
654,578
19.6%
$505.9
20.9%
$1,956,954,730
1/1/2011
Yes
Historic
Single
New Jersey
645,939
19.4%
$601.2
24.8%
1,771,009,863
1/1/2011
No
Historic
Single
Missouri
452,102
13.6%
$224.6
9.2%
791,837,186
7/1/2010
Yes
Historic
Multiple
Illinois
308,399
9.2%
$232.0
9.6%
607,356,502
4/23/2010
Yes
Future
Multiple
Indiana
284,568
8.5%
$181.7
7.5%
667,501,558
5/3/2010
Yes
Historic
Multiple
California
173,075
5.2%
$158.2
6.5%
337,529,472
7/1/2010
No
Future
Multiple
West Virginia
172,340
5.2%
$123.4
5.1%
427,325,204
4/18/2011
No
Historic
Single
NOTES:
(1)
In most cases historic test year includes adjustments for known and measurable
changes. (2)
Single Tariff Structure represents a single rate structure within a state whereas a
Multiple Tariff Structure includes many different tariffs by district or other subdivision within a
state.
American Water’s Regulated Presence
Largely residential customer base
promotes consistent operating results
Geographic presence hedges both
weather and regulatory risk
Scale enables multiple growth
opportunities across service areas
States we are in process of exiting Regulated Operations
|
 July 2011
13
Prudent Investments in US Water Infrastructure drive
Long Term Growth
Net Utility Plant ($ mm)
% Projected CAPEX by Purpose
*Net utility plant as of 1Q 2011 of $10,555,698 excluding Discontinued
Operations Quality of
Service, 20%
Other, 6%
Asset
Renewal,
44%
Regulatory
Compliance,
13%
Capacity
Expansion,
17%
$10,496,524
$10,555,698
Q4 2010
Q1 2011 |
 July 2011
American Water’s Portfolio Optimization Initiatives
•
Balanced Portfolio Analysis
•
Focus Achieving Authorized Rates
of Return
•
Monetize Non-Producing Assets
•
Focused Capital Resources
•
Selective Acquisition Opportunities
•
Leverage Internal Growth
14
Continue to Lower Costs
Focus on
Value Drivers
Redeploy Value Into Core
Growth Markets
Explore Opportunities for
Long
-Term Success
Drive Profitability and
Returns
Optimizing
Long-term Value
Through
Proactive
Management |
 July 2011
15
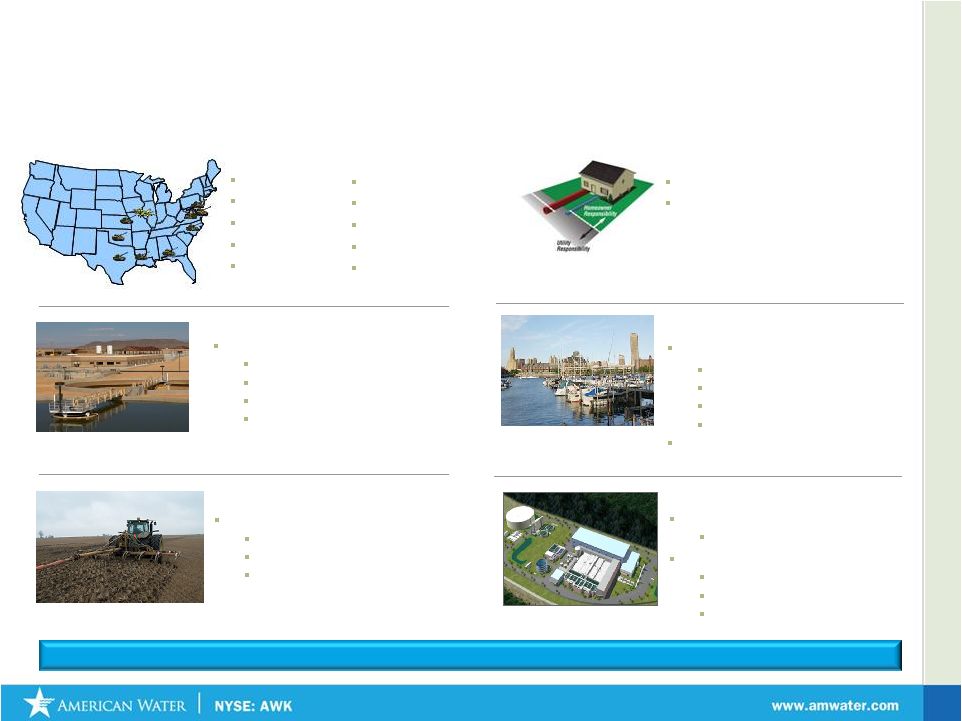
Our Market-Based Operations:
A Portfolio of Water Resource Services
For 2010, American Water reported $311.8 million of Market-Based Operations
revenues Contract Operations
Over 200 contracts**
Serving 3.1m people
Clarksville, IN
Seattle, WA
Warren Township, NJ
25 industrial contracts
Design, Build and Operate
20 current projects*
Lake Pleasant Plant, AZ
Fillmore, CA
Carnegie Abbey, RI
Seattle, WA
*Includes 16 AWM projects
**Includes 137 AWM and 48 EMC projects
Military Bases Privatization
Fort Bragg, NC
Fort Sill, OK
Fort Rucker, AL
Fort AP Hill, VA
Scott AFB, IL
Fort Polk, LA
Fort Hood, TX
Fort Belvoir, VA
Fort Meade, MD
Fort Leavenworth, KS
Biosolids Management
Canada
Halton, ON
Niagara, ON
Hamilton, ON
Emerging Water Technologies
Desalination plant
Tampa Bay Seawater, FL
Water Reuse; 22 Projects; 7 States
Gillette Stadium, MA
Battery Park, NY
Butterball Turkey, NC
Homeowner Services
Over 870,000 contracts
17 States |
 July 2011
16
Strategy Specifics: Homeowner Services Growth
Large
Untapped
Market
Strong
Growth
Potential
•
75
Million Single family homes in US
•
3%
Purchase water/sewer service contracts
•
American
Water
has
34%
market
share
•
61%
of HOS customers buy more than 1 product
•
EXTRAORDINARY
customer satisfaction
•
STRONG
contractor network
•
EFFICIENT
AND CONTROLLED
claims processes
•
12%
DEMONSTRATED
GROWTH
over
last
3
years |
 July 2011
17
Strategy Specifics: Market Size of Military Utility
Privatizations
2011-13
2014-16
Major Water/Wastewater Contracts
to be Awarded
Contracts Awarded to American Water
Contracts Awarded to Competitors
Contracts Programmed by Dept. of Defense for Award
2002
2005-07
2008-10
Major Water/Wastewater Awards to Date
7
12
4
Market Opportunity
represents approximately
$11Bn in Total Revenues
Over
$2
Billion
in
Revenues
Backlog
3
3
4 |
 Financial Update |
 July 2011
19
Total Shareholder Return : American Water vs. Indices
(July 12, 2010 –
July 12, 2011)
Shareholder Return
YTD
American Water
S&P 500
Dow Jones Utilities
+45.8%
+24.8%
+18.6% |
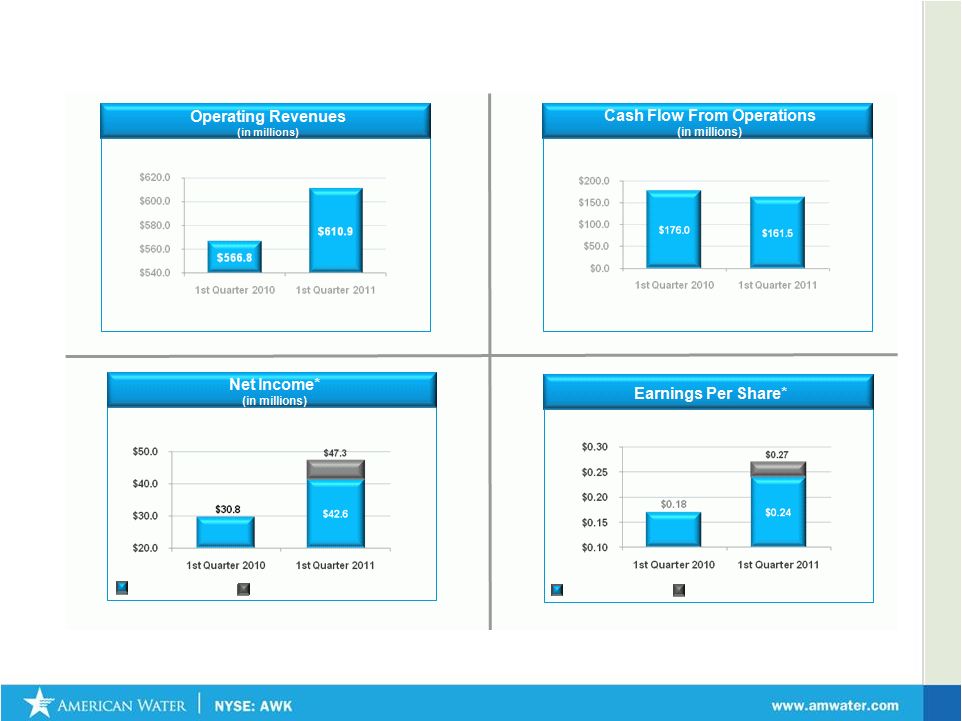 American Water: A Solid First Quarter
20
Adjusted Net Income
Adjustment for cessation of depreciation
Adjusted Net Income
Adjustment for cessation of depreciation
July 2011
* Adjusted Net Income reflects the effect of the cessation of depreciation on assets subject to
an agreement of sale – a Non-GAAP measure. Such depreciation would have been
$4.7 million, after tax, or $0.3 per share. See reconciliation table on Slide 41 |
 21
Regulated O&M Efficiency Ratio Continues to Improve
* O&M Efficiency Ratio (A Non-GAAP, unaudited measure) = operating
and maintenance expenses / revenues, adjusted
to
eliminate
revenues
and
expenses
related
to
purchased
water.
* Quarterly data reflects the effect of discontinued operations. (See table
in Appendix). 55%
50%
45%
40%
35%
30%
49.4%
48.2%
3/31/2010
3/31/2011
July 2011
Adjusted O & M Efficiency Ratio |
 22
Rate Cases Awarded That Will Have an Impact on 2011 Results
(As of July 13, 2011)
July 2011
($ in millions)
Effective Date
for new rates
ROE
Granted
Annualized
Increase to
Revenue
General Rate Cases:
Illinois
4/23/2010
10.38%
41.4
$
New Mexico (Edgewood)
5/10/2010
10.00%
0.5
Indiana
5/3/2010
10.00%
31.5
Virginia (Eastern)
5/8/2010
10.50%
0.6
Ohio
5/19/2010
9.34%
2.6
Missouri
7/1/2010
10.00%
28.0
California (Sac, LA, Lark)
7/1/2010
10.20%
14.6
Michigan
7/1/2010
10.50%
0.2
Kentucky
10/1/2010
9.70%
18.8
New Jersey
1/1/2011
10.30%
39.9
Pennsylvania Wastewater
1/1/2011
10.60%
8.4
Arizona
(Anthem,
etc.)
1/1/2011
9.50%
14.7
Tennessee
4/5/2011
10.00%
5.6
West Virginia
4/19/2011
9.75%
5.1
Subtotal -
General Rate Cases
211.9
$
Infrastructure Charges:
Pennsylvania
19.3
Indiana
5.4
Missouri
6.3
Illinois
1.7
Other
1.4
Subtotal -
Infrastructure Charges
34.1
$
Total
246.0
$ |
 Rate
Cases Awaiting Final Order 23
Docket /
Revenue Increase
ROE
Rate Base
Filing
Case Number
Date Filed
Filed
Requested
(Filed)
Status
Virginia*
PUE 2010-00001
03/08/10
6.9
$
11.50%
99.1
$
5
California
A 10-07-007
07/01/10
37.3
10.20%
409.6
3
Arizona
W-01303A-10-0448
11/03/10
20.8
11.50%
148.9
2
Hawaii
2010-0313
02/22/11
1.8
11.85%
25.2
3
Pennsylvania
R-2011-2232243
04/29/11
70.7
11.50%
2,096.2
2
New York
11-W-0200
04/29/11
9.6
11.50%
126.9
2
Iowa
RPU-2011-0001
04/29/11
5.1
11.35%
88.9
2
Indiana
44022
05/02/11
20.4
11.50%
733.4
2
New Mexico
11-00196-UT
05/18/11
2.6
11.75%
33.6
2
Missouri
WR-2011-0037
06/30/10
42.9
11.50%
845.6
2
Ohio
11-4161-WS-AIR
07/01/11
8.3
11.50%
92.3
1
Total
226.4
$
4,699.7
$
* Final Order not yet issued. Interim rates are in effect
Note: Above excludes rate case file in 2007 for Hawaii for which interim
rates have been in effect since October 2008
Index of Rate Case Status 1 - Case Filed
2 - Discovery (Data Requests, Investigation)
3 - Negotiations / Evidentiary Hearings / Briefings
4 - Recommended order issued / settlement reached, without interim rates
5 - Interim rates in effect, awaiting final order
July 2011 |
 125
years Investing in Water Infrastructure and paying Dividends to
Shareholders 24
July 2011
1886
1947
2003
2008
Dividend
paid to
private
holders
American Water
Listed on NYSE –
Dividend paid to
common
shareholders
RWE takes
AWK private.
Dividend
paid to
shareholder
AWK IPO
Lists on
NYSE. Pays
dividends to
common
shareholders
Watermain work in Pennsylvania. in the early 1900’s
Infrastructure improvement in New Jersey in 2009
|
 Quarterly Dividend Rate Increases
Recent Dividend History
•
Key component of American
Water’s total shareholder return
proposition
•
Dividend Growth –
Board of
Directors increased dividend 5%
to $0.23 or $0.92 annualized
•
Dividend Yield –
3.1% at
7/13/11
•
Growth in Dividend reflects
growth in Net Income
25
July 2011 |
 July 2011
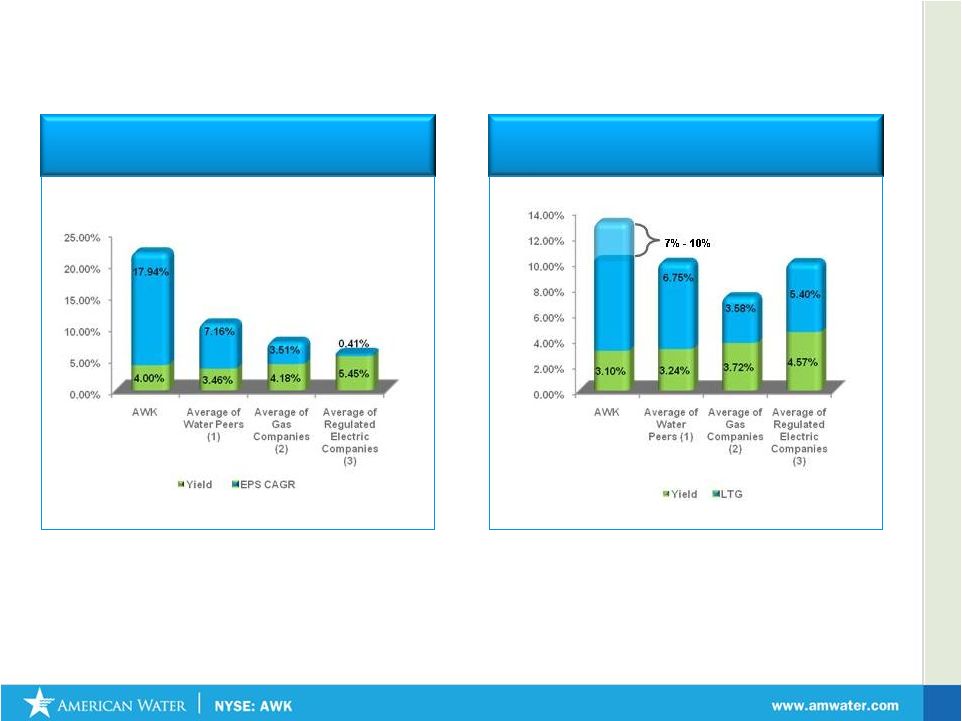
26
American Water’s past performance and future growth expectations
compare very favorably vs Water, Electric and Gas Peers
2008 –
2010
EPS CAGR + Average Dividend Yield
(4)
Total Shareholder Return
(Long Term Expected EPS Growth* and
Dividend Yield**)
1)
Water Companies Include: AWR, CTWS, CWT, MSEX, SJW,
WTR, YORW.
2)
Gas Companies include ATO, LG, GAS, NWN, PNY, SJI, SWX,
WGL.
3)
Regulated Electric Companies include HE, NU, TE, LNT, XEL,
SO, CNP, PCG, SCG, POR, DUK, UIL, PGN, AEP.
4)
Average monthly dividend yield for 2008 – 2010 period.
5)
Non GAAP: American Water EPS adjusted to exclude impairment
charges.
Source: Thomson Reuters
* For AWK represents 7-10% Long Term EPS CAGR market guidance . All other data from
First Call Consensus Estimates
** as of 7/11/11
Note: Consensus Estimates are calculated by First Call based on the earnings projections made by the
analysts who cover companies noted (other than AWK). Please note that any opinions, estimates
or forecasts regarding performance made by these analysts (and therefore the Consensus
estimate numbers) are theirs alone and do not represent opinions, forecasts or predictions of
American Water or its management. |
 July 2011
Source: Thomson Reuters
* PE data as of July 2011
27
American Water’s higher growth expectations are not
fully reflected in its PE multiple
P/E Compared with Total Return
CTWS
LG
MSEX
SWX
NWN
ATO
YORW
WGL
AWR
PCG
AEP
WTR
PNY
DUK
UIL
XEL
SJI
SO
CNP
NU
TE
AWK
CWT
HE
11.0x
16.0x
21.0x
6%
7%
8%
9%
10%
11%
12%
13%
14%
Forward P/E
Expected Total Return
SCG
POR
LNT
PGN |
 What
to Expect from American Water - 2011
Accomplishments
Start execution of Portfolio Optimization Initiative
Missouri acquisition closed May, Texas sale closed June
Filed for regulatory approvals for transactions in NM and AZ
Agreement to purchase Aqua’s NY subsidiary and sell to Aqua our Ohio
subsidiary Resolve Rate Cases worth $93 MM of filed Annualized Revenues
by December 31, 2011
Finalized Tennessee and West Virginia Rate Cases
Initiate state specific efforts to address declining usage
Addressed in rate cases filed in Iowa, Long Island, Pennsylvania, and
Indiana Continue reduction in Operating Efficiency Ratio
Operating
Efficiency
Ratio
improved
120
bps
in
the
first
quarter
2011
vs.
first
quarter
2010, an improvement of 2.5%
Increase Earned return on equity
ROE increased 39 bps or 6% over comparable last twelve months ending March 31,
2011 Expand Market Based businesses with focus on Homeowner Services &
Military Contract Operations
Homeowner Services entered into the Commercial Market
Optimize Municipal Contract Operations Business Model
July 2011
28 |
 July 2011
American Water –
A Compelling Value
Value Proposition
Market
Leader
Strong Visible
Growth
Proven
Management
Trades at
Discount to Peers
Sound Regulatory
Framework
29 |
 July 2011
Ed Vallejo
Vice
President
–
Investor
Relations
Muriel Lange
Manager
–
Investor
Relations
Tel: 856-566-4005
Fax: 856-782-2782
30
Edward.vallejo@amwater.com
Muriel.lange@amwater.com
Investor
Relations
Contacts: |
 Appendix |
 July 2011
32
Investment Thesis: Sustained 7-10% EPS Growth
Future Growth
New Services
Regulated Investments
Acquisitions
Operational Excellence/
Efficiencies
ROE improvement
Long Term Growth
Conceptual Representation |
 Rate
of Return Regulation in the United States Prudent Investment Drives Need for
Rate Cases American Water has experience in securing appropriate rates of
return and promoting constructive regulatory frameworks
Operating
Expenses
Taxes, Depr &
Amortization
WACC
Allowed
Return
Allowed
Return
Revenue
Requirement
Step 2
Step 1
+
+
x
=
=
33
Establish
Rate
Base
July 2011 |
 July 2011
34
AW Parent
Company
Debt
Equity (Capex)
Operating Expenses
Debt
Regulatory
Treatment
Net Income
Impact
•
Neutral, if interest costs
are deemed prudent
and fair to the
consumer by regulator
How is Net Income generated in Rate of Return Regulation?
Pass Through
1:1
Pass Through
1:1
Return of
(Depreciation)
Return on Equity
(ROE)
•
Neutral, if all operating
expenses are deemed
prudent and fair to the
consumer by regulator
•
Depreciation is neutral
if all depreciable assets
are in rate base
•
Rate Base x Earned
ROE + Gross Up for
Taxes is Added
Revenue
* Assuming no regulatory lag between rate cases
Debt
Equity
Equity
If all assets are included in the Company’s Rate Base and all operating
expenses are deemed prudent and recoverable by regulator, Company earns
allowed ROE* |
 Water
Utility Expenditures Water vs Other Utility Expenditures
Water Use in the Home
35
July 2011 |
 July 2011
Infrastructure Surcharges: A viable mechanism to
address Regulatory Lag
Infrastructure Surcharges allows companies to recover
infrastructure replacement costs without necessity of filing
full rate proceeding
States that currently allow use of infrastructure surcharges
Pennsylvania
Indiana
Illinois
Ohio
Surcharges are typically reset to zero when new base rates
become effective and incorporate the costs of the previous
surcharge investments
Delaware
New York
Missouri (St Louis County)
California -
Trial basis
36 |
 Case
in point: Increased investment in Pennsylvania’s Infrastructure
37
July 2011 |
 July 2011
Weighted Average Interest Rates
Debt Maturities at March 31, 2011
(in millions)
Parent Company Debt
* Amount excludes Preferred Stock with Mandatory Redemptions
38
$100 million of Parent Company debt swapped from 6.085% to 6 month LIBOR + 3.422%,
to mature with fixed-rate debt in 2017 |
 July 2011
Income Statement
39
($ in Thousands, except per share data)
Three Months Ended
March
31,
2011
2010
Operating revenues
$
610,936
$
566,762
Operating expenses
Operation and maintenance
320,571
305,642
Depreciation and amortization
88,019
82,056
General taxes
57,205
54,486
Loss (gain) on sale of assets
268
(71)
Total operating expenses, net
466,063
442,113
Operating income
144,873
124,649
Other income (expenses)
Interest, net
(76,482)
(78,696)
Allowance for other funds used during construction
2,916
2,146
Allowance for borrowed funds used during construction
1,242
1,382
Amortization of debt expense
(1,295)
(1,201)
Other, net
(1,141)
69
Total other income (expenses)
(74,760)
(76,300)
Income from continuing operations before income taxes
70,113
48,349
Provision for income taxes
28,649
18,669
Income from continuing operations
41,464
29,680
Income from discontinued operations, net of tax
5,868
1,128
Net income
$
47,332
$
30,808
Basic and diluted earnings per common share:
Income from continuing operations
$
0.24
$
0.17
Income from discontinued operations, net of tax
$
0.03
$
0.01
Net income
$
0.27
$
0.18
Average common shares outstanding during the period:
Basic
175,259
174,720
Diluted
176,048
174,796
Dividends per common share
$
0.22
$
0.21 |
  July
2011 First Quarter 2011 Reconciliation Tables
In thousands
2011
2010
Total Regulated Operation and Maintenance Expenses
270,157
$
256,312
$
Less: Regulated Purchased Water Expenses
21,100
20,633
Adjusted Regulated Operation and Maintenance Expenses (a)
249,057
$
235,679
$
Total Regulated Operating Revenues
537,395
$
498,197
$
Less: Regulated Purchased Water Revenues
21,100
20,633
Adjusted Regulated Operating Revenues (b)
516,295
$
477,564
$
Regulated Operations and Maintenance Efficiency Ratio (a)/(b)
48.2%
49.4%
In thousands except per share data
Three Months Ended
March 31,
2011
Net income
47,332
$
Less: Cessation of depreciation, net of tax
4,729
Adjusted net income, exclusive of the cessation of depreciation
associated with assets of discontinued operations
42,603
$
Basic earnings per common share:
Adjusted net income
0.24
$
Diluted earnings per common share:
Adjusted net income
0.24
$
with assets of discontinued operations (a Non-GAAP, unaudited number)
Three Months Ended
March 31,
Regulated Operations and Maintenance Efficiency Ratio (A Non-GAAP, unaudited measure)
Adjusted net income and earnings per share, exclusive of the cessation of depreciation associated
40 |
 July 2011
Financial Tables
GAAP and Non-GAAP Measures
Net Income (Loss) –
Earnings per Share
Excluding Impairment Charge
(A Non-GAAP Unaudited Number)
Historical
($ in thousands, except per share data)
2008
2009
2010
LTM
3/31/11
Net income (Loss)
($562,421)
($233,083)
$267,827
$284,351
Add: Impairment
750,000
450,000
0
0
Net income excluding impairment charge before associated tax benefit
187,579
216,917
267,827
284,351
Less: Income tax benefit relating to impairment charge
11,525
6,976
0
0
Net income excluding impairment charge
$176,054
$209,941
$267,827
$284,351
Income (loss) per common share:
Basic
($3.52)
($1.39)
$1.53
Diluted
($3.52)
($1.39)
$1.53
Net income per common share excluding impairment charge:
Basic
$1.10
$1.25
$1.53
Diluted
$1.10
$1.25
$1.53
41
Rate Base as of March 31, 2011
(1)
($ in Thousands)
Net Utility Plant
$10,421,125
Less
Advances for Construction
408,701
CIAC –
Contributions in Aid of Construction
932,355
Deferred income taxes
1,136,432
Deferred investment tax credits
30,588
Sub Total
$2,508,076
Rate Base
TOTAL
$7,913,049
(1)
An
approximation
of
rate
base,
which
includes
Net
Utility
Plant
not
yet
included
in
rate
base
pending
rate
case filings/outcomes |
 |