Attached files
| file | filename |
|---|---|
| EX-31.2 - EXHIBIT 31.2 - NATIONAL BEVERAGE CORP | ex31-2.htm |
| EX-21.1 - EXHIBIT 21.1 - NATIONAL BEVERAGE CORP | ex21-1.htm |
| EX-31.1 - EXHIBIT 31.1 - NATIONAL BEVERAGE CORP | ex31-1.htm |
| EX-32.2 - EXHIBIT 32.2 - NATIONAL BEVERAGE CORP | ex32-2.htm |
| EX-23.1 - EXHIBIT 23.1 - NATIONAL BEVERAGE CORP | ex23-1.htm |
| EX-32.1 - EXHIBIT 32.1 - NATIONAL BEVERAGE CORP | ex32-1.htm |
| EX-10.12 - EXHIBIT 10.12 - NATIONAL BEVERAGE CORP | ex10-12.htm |
United States
Securities and Exchange Commission
Washington, D.C. 20549
FORM 10-K
| [X] | Annual Report Pursuant to Section 13 or 15(d) of the Securities Exchange Act of 1934 |
For the fiscal year ended April 30, 2011
or
|
[ ]
|
Transition Report Pursuant to Section 13 or 15(d) of the Securities Exchange Act of 1934 |
For the transition period from __________ to _________
Commission file number 1-14170
NATIONAL BEVERAGE CORP.
(Exact name of Registrant as specified in its charter)
| Delaware | 59-2605822 | |
| (State of incorporation) | (I.R.S. Employer Identification No.) |
8100 SW Tenth Street, Suite 4000, Fort Lauderdale, Florida 33324
(Address of principal executive offices including zip code)
Registrant’s telephone number, including area code: (954) 581-0922
Securities registered pursuant to Section 12(b) of the Act:
| Title of each class | Name of each exchange on which registered | |
| Common Stock, par value $.01 per share | The NASDAQ Stock Market LLC |
Securities registered pursuant to Section 12(g) of the Act: None
Indicate by check mark if the Registrant is a well-known seasoned issuer, as defined in Rule 405 of the Securities Act. Yes ( ) No (X)
Indicate by check mark if the Registrant is not required to file reports pursuant to Section 13 or Section 15(d) of the Exchange Act. Yes ( ) No (X)
Indicate by check mark whether the Registrant (1) has filed all reports required to be filed by Section 13 or 15(d) of the Securities Exchange Act of 1934 during the preceding 12 months and (2) has been subject to such filing requirements for the past 90 days. Yes (X) No ( )
Indicate by check mark whether the Registrant has submitted electronically and posted on its corporate Web site, if any, every Interactive Data File required to be submitted and posted pursuant to Rule 405 of Regulation S-T during the preceding 12 months. Yes ( ) No ( )
Indicate by check mark if disclosure of delinquent filers pursuant to Item 405 of Regulation S-K is not contained herein, and will not be contained, to the best of Registrant’s knowledge, in definitive proxy or information statements incorporated by reference in Part III of this Form 10-K or any amendment to this Form 10-K. (X)
Indicate by check mark whether the Registrant is a large accelerated filer, an accelerated filer, a non-accelerated filer, or a smaller reporting company. See the definitions of “large accelerated filer,” “accelerated filer” and “smaller reporting company” in Rule 12b-2 of the Exchange Act.:
Large accelerated filer ( ) Accelerated filer (X) Non-accelerated filer ( ) Smaller reporting company ( )
Indicate by check mark whether the Registrant is a shell company (as defined in Rule 12b-2 of the Exchange Act). Yes ( ) No (X)
The aggregate market value of the common stock held by non-affiliates of Registrant computed by reference to the closing sale price on October 29, 2010 was approximately $160.4 million.
The number of shares of Registrant’s common stock outstanding as of July 5, 2011 was 46,229,355.
DOCUMENTS INCORPORATED BY REFERENCE
Portions of the Registrant’s Proxy Statement for the 2011 Annual Meeting of Shareholders are incorporated by reference in Part III of Form 10-K.
TABLE OF CONTENTS
|
PAGE
|
||
|
PART I
|
||
|
ITEM 1.
|
Business
|
2 |
|
ITEM 1A.
|
Risk Factors
|
7 |
|
ITEM 1B.
|
Unresolved Staff Comments
|
8 |
|
ITEM 2.
|
Properties
|
8 |
|
ITEM 3.
|
Legal Proceedings
|
8 |
|
ITEM 4.
|
[Removed and Reserved]
|
8 |
|
PART II
|
||
|
ITEM 5.
|
Market for Registrant’s Common Equity, Related Stockholder Matters and Issuer Purchases of Equity Securities
|
9 |
|
ITEM 6.
|
Selected Financial Data
|
11 |
|
ITEM 7.
|
Management’s Discussion and Analysis of Financial Condition and Results of Operations
|
12 |
|
ITEM 7A.
|
Quantitative and Qualitative Disclosure About Market Risk
|
17 |
|
ITEM 8.
|
Financial Statements and Supplementary Data
|
18 |
|
ITEM 9.
|
Changes in and Disagreements with Accountants on Accounting and Financial Disclosure
|
36 |
|
ITEM 9A.
|
Controls and Procedures
|
36 |
|
ITEM 9B.
|
Other Information
|
37 |
|
PART III
|
||
|
ITEM 10.
|
Directors, Executive Officers and Corporate Governance
|
37 |
|
ITEM 11.
|
Executive Compensation
|
38 |
|
ITEM 12.
|
Security Ownership of Certain Beneficial Owners and Management and Related Stockholder Matters
|
38 |
|
ITEM 13.
|
Certain Relationships and Related Transactions and Director Independence
|
38 |
|
ITEM 14.
|
Principal Accountant Fees and Services
|
38 |
|
PART IV
|
||
|
ITEM 15.
|
Exhibits and Financial Statement Schedules
|
38 |
|
SIGNATURES
|
39 | |
1
PART I
ITEM 1. BUSINESS
GENERAL
National Beverage Corp. develops, manufactures, markets and distributes a complete portfolio of quality beverage products throughout the United States. Incorporated in Delaware in 1985, National Beverage Corp. is a holding company for various operating subsidiaries. In this report, the terms “we,” “us,” “our,” “Company” and “National Beverage” mean National Beverage Corp. and its subsidiaries.
We consider ourselves to be a leader in the development and sale of flavored beverage products in the United States, offering a wide selection of flavored soft drinks, juices, sparkling waters, energy drinks and nutritionally-enhanced waters. Our flavor development spans over 100 years originating with our flagship brands, Shasta® and Faygo®, each of which has over 50 flavor varieties. We also offer the health-conscious consumer a diverse line of flavored beverage products, including Everfresh®, Home Juice® and Mr. Pure® 100% juice and juice-based products; LaCroix®, Crystal Bay® and ClearFruit® flavored, sparkling and spring water products; and ÀSanté® nutritionally-enhanced waters. In addition, we produce and market Rip It® energy drinks, Ohana® fruit-flavored drinks, St. Nick’s® holiday soft drinks, as well as effervescent powder beverage enhancers sold under the NutraFizz® brand name. Substantially all of our brands are produced in twelve manufacturing facilities that are strategically located near major metropolitan markets throughout the continental United States. To a lesser extent, we develop and produce soft drinks for certain retailers and beverage companies.
We utilize various means to maintain and strengthen our position as a cost-effective producer of beverage products. These include centralized purchasing of raw materials, vertical integration of the manufacturing process, close proximity to customer distribution centers, regionally targeted media promotions and the use of multiple distribution systems. We believe the strength of our brands and location of our manufacturing facilities distinguish us as a national supplier of beverages to national and regional retailers, mass merchandisers, wholesalers and discount stores.
Our strategy emphasizes the growth of our products by offering a branded beverage portfolio of proprietary flavors, supporting the franchise value of regional brands and expanding those brands with distinctive packaging and broad demographic emphasis, developing and acquiring innovative products tailored toward healthy lifestyles and appealing to the “quality-value” expectations of the family consumer. We believe the “regional share dynamics” of our brands results in more retailer sponsored promotional activities which perpetuate consumer loyalty within local markets.
PRODUCTS
Shasta and Faygo, our traditional soft drink brands that emphasize flavor variety and innovation, have been manufactured and marketed throughout the United States for a combined period of over 200 years. Established more than 120 years ago and distributed nationally, Shasta is the largest of National Beverage’s brands and includes multiple flavors of carbonated soft drinks as well as various water products. Established over 100 years ago, Faygo products are primarily distributed east of the Mississippi River and include a multi-flavored product line. We also produce and market other brands of soft drinks, juices, waters and other beverages, including Ritz®, Big Shot®, Everfresh, Mr. Pure, LaCroix, Crystal Bay, Ohana, Rip It, Mega Sport® and ÀSanté.
2
Our “fantasy of flavors” strategy emphasizes distinctively flavored soft drinks, energy drinks, juices and other specialty beverages. Although cola drinks account for approximately 50% of the soft drink industry’s domestic grocery channel volume, colas account for less than 20% of our total volume. We continue to emphasize expanding our beverage portfolio beyond traditional carbonated soft drinks through new product development inspired by “lifestyle enhancement” trends, innovative package enhancements and the development of products designed to provide functional benefits to the consumer. Such products include our lines of energy drinks and vitamin-enhanced waters. We intend to expand our product offerings through in-house development and acquisitions, to further our strategy within the evolving “functional” category geared toward consumer health and wellness.
MANUFACTURING
Our twelve manufacturing facilities are strategically located near major metropolitan markets across the continental United States, enabling us to efficiently manufacture and distribute beverages to substantially all geographic markets in the United States. Each manufacturing facility is generally equipped to produce both canned and bottled beverage products in a variety of package sizes. We utilize numerous package types and sizes, including cans ranging from eight to sixteen ounces and bottles ranging from seven ounces to three liters.
We believe that ownership of our bottling facilities provides an advantage over certain of our competitors that rely upon independent third party bottlers to manufacture and market their products. Since we control the national production, distribution and marketing of our brands, we believe we can more effectively manage product quality and customer service and respond quickly to changing market conditions.
We produce a substantial portion of the flavor concentrates used in our branded products. By controlling our own formulas throughout our bottling network, we can manufacture our products in accordance with uniform quality standards while tailoring flavors to regional taste preferences. We believe that the combination of a Company-owned bottling network servicing the United States, together with uniform standards for packaging, formulations and customer service, provides us with a strategic advantage in servicing national retailers and mass-merchandisers. We also maintain research and development laboratories at multiple locations. These laboratories continually test products for compliance with our strict quality control standards as well as conduct research for new products and flavors.
DISTRIBUTION
We utilize a hybrid distribution system to deliver our products through three primary distribution channels: take-home, convenience and food-service.
The take-home distribution channel consists of national and regional grocery stores, warehouse clubs, mass-merchandisers, wholesalers and dollar stores. We distribute our products to this channel through the warehouse distribution system and the direct-store delivery system. Under the warehouse distribution system, products are shipped from our manufacturing facilities to the retailer’s centralized distribution centers and then distributed by the retailer to each of its outlet locations with other goods. Products sold through the direct-store delivery system are distributed directly to the customer’s retail outlets by our direct-store delivery fleet and by independent distributors.
3
We distribute our products to the convenience channel through our own direct-store delivery fleet and those of independent distributors. The convenience channel consists of convenience stores, gas stations and other smaller “up-and-down-the-street” accounts. Because of the higher retail prices and margins that typically prevail, we have undertaken several measures to expand convenience channel distribution. These include development of products specifically targeted to this market, such as ClearFruit, Crystal Bay, Rip It and ÀSanté. Additionally, we have created proprietary and specialized packaging with distinctive graphics for these products.
Our food-service division distributes products to independent, specialized distributors who sell to hospitals, schools, military bases, airlines, hotels and food-service wholesalers. Also, our Company-owned direct-store delivery fleet distributes products to certain schools and other institutions.
Our take-home, convenience and food-service operations use vending machines and glass-door coolers as marketing and promotional tools for our brands. We provide vending machines and coolers on a placement or purchase basis to our customers. We believe vending and cooler equipment increases beverage sales, enhances brand awareness and develops brand loyalty.
SALES AND MARKETING
We sell and market our products through an internal sales force as well as select broker networks. Our sales force is organized to serve a specific market, focusing on one or more geographic territories, distribution channels or product lines. We believe this focus allows our sales group to provide high level, responsive service and support to our customers and markets.
Our sales and marketing programs emphasize maintaining and enhancing consumer brand recognition and loyalty and typically utilize a combination of regional advertising, special event marketing, endorsements and sponsorships, along with consumer coupon distribution. We retain advertising agencies to assist with media advertising programs for our brands. Additionally, we offer numerous promotional programs to retail customers, including cooperative advertising support, in-store advertising materials and other incentives. These elements allow us to tailor marketing and advertising programs to meet local and regional economic conditions and demographics. We also seek to maintain points of difference between our brands and those of our competitors by combining high product quality, flavor innovation, unique packaging designs and, for some product lines, value pricing. Additionally, we sponsor special holiday promotions including St. Nick’s soft drinks, which feature special holiday flavors and packaging.
Our “regional share dynamics” strategy emphasizes the acquisition and support of brands that have significant regional presence. We believe our brands enjoy a regional identification that foster long-term consumer loyalty and make them less vulnerable to brand substitution. In addition, “home-town” products often generate more aggressive retailer sponsored promotional activities and receive media exposure through community activities and other local events.
4
RAW MATERIALS
Our centralized procurement group maintains relationships with numerous suppliers of raw materials and packaging goods. By consolidating the purchasing function for our manufacturing facilities, we believe we are able to procure more competitive arrangements with our suppliers, thereby allowing us to compete as a low-cost producer of beverages.
The products we produce and sell are made from various materials, including sweeteners, juice concentrates, carbon dioxide, water, glass and plastic bottles, aluminum cans and ends, paper, cartons and closures. Most of our low-calorie soft drink products use sucralose, aspartame or Acesulfame-K. We manufacture a substantial portion of our flavor concentrates and purchase remaining raw materials from multiple suppliers.
Substantially all of the materials and ingredients we purchase are presently available from several suppliers, although strikes, weather conditions, utility shortages, governmental control or regulations, national emergencies, price or supply fluctuations or other events outside our control could adversely affect the supply of specific materials. A significant portion of our raw material purchases, including aluminum cans, plastic bottles and high fructose corn syrup, are derived from commodities. Therefore, pricing and availability tend to fluctuate based upon worldwide market conditions. Our ability to recover increased costs through higher pricing may be limited by the competitive environment in which we operate. In certain cases, we may elect to enter into multi-year agreements for the supply of these materials with one or more suppliers, the terms of which may include variable or fixed pricing, minimum purchase quantities and/or the requirement to purchase all supplies for specified locations. Additionally, we use derivative financial instruments to partially mitigate our exposure to changes in certain raw material costs.
SEASONALITY
Our sales are seasonal with the highest volume typically realized during the summer months. We have sufficient production capacity to meet seasonal increases without maintaining significant quantities of inventory in anticipation of periods of peak demand. Sales volume may be affected by weather conditions.
COMPETITION
The beverage industry is highly competitive and our competitive position varies in each of our market areas. Our products compete with many varieties of liquid refreshment, including soft drinks, water products, juices, fruit drinks, powdered drinks, coffees, teas, energy drinks, sports drinks, dairy-based drinks, functional beverages and various other nonalcoholic beverages. We compete with bottlers and distributors of national, regional and private label products. Several competitors, including the two that dominate the soft drink industry, PepsiCo, Inc. and The Coca-Cola Company, have greater financial resources than we have and aggressive promotion of their products can adversely affect sales of our brands. Principal methods of competition in the beverage industry are price and promotional activity, advertising and marketing programs, point-of-sale merchandising, retail space management, customer service, product differentiation, packaging innovations and distribution methods. We believe our Company differentiates itself through a diversified product portfolio, strong regional brand recognition, innovative flavor variety, attractive packaging, efficient distribution methods, specialized advertising and, for some product lines, value pricing.
5
TRADEMARKS
We own numerous trademarks for our brands that are significant to our business. We intend to continue to maintain all registrations of our significant trademarks and use the trademarks in the operation of our businesses.
GOVERNMENTAL REGULATION
The production, distribution and sale of our products in the United States are subject to the Federal Food, Drug and Cosmetic Act; the Dietary Supplement Health and Education Act of 1994; the Occupational Safety and Health Act; the Lanham Act; various environmental statutes; and various other federal, state and local statutes regulating the production, transportation, sale, safety, advertising, labeling and ingredients of such products. Our management believes that we are in compliance, in all material respects, with such existing legislation.
Certain states and localities prohibit the sale of certain beverages unless a deposit or tax is charged for containers. These requirements vary by each jurisdiction. Similar legislation has been proposed in certain other states and localities, as well as by Congress. We are unable to predict whether such legislation will be enacted or what impact its enactment would have on our business, financial condition or results of operations.
All of our facilities in the United States are subject to federal, state and local environmental laws and regulations. Compliance with these provisions has not had any material adverse effect on our financial or competitive position. We believe that our current practices and procedures for the control and disposition of toxic or hazardous substances comply in all material respects with applicable law. Compliance with or violation of any current or future regulations could require material expenditures or have a material adverse effect on our financial results.
EMPLOYEES
As of April 30, 2011, we employed approximately 1,200 people, of which approximately 300 are covered by collective bargaining agreements. We believe that relations with employees are generally good.
AVAILABLE INFORMATION
Our Annual Reports on Form 10-K, Quarterly Reports on Form 10-Q, Current Reports on Form 8-K, proxy statements and amendments to those reports are available free of charge on our website at www.nationalbeverage.com as soon as reasonably practicable after such reports are electronically filed with the Securities and Exchange Commission. In addition, our Code of Ethics is available on our website. The information on the Company’s website is not part of this Annual Report on Form 10-K or any other report that we file with, or furnish to, the Securities and Exchange Commission.
6
ITEM 1A. RISK FACTORS
In addition to other information in this Form 10-K, the following risk factors should be considered carefully in evaluating the Company’s business. Our business, financial condition and results of operations could be materially and adversely affected by any of these risks. Additional risks and uncertainties, including risks and uncertainties not presently known to the Company, or that the Company currently deems immaterial, may also impair our business and results of operations.
Changes in consumer preferences and taste. There has been an increasing focus on health and wellness by beverage consumers, which may reduce demand for caloric carbonated soft drinks and increase the consumption of products perceived to deliver health, wellness and/or functionality. If we do not adequately anticipate and react to changing demographics, consumer trends, health concerns and product preferences, our financial results could be adversely affected.
Competition. The beverage industry is extremely competitive. Our products compete with a broad range of beverage products, most of which are manufactured and distributed by companies with substantially greater financial, marketing and distribution resources. In order to generate future revenues and profits, we must continue to sell products that appeal to our customers and consumers. Discounting and other action by our competitors may make it more difficult to sustain revenues and profits.
Customer relationships. Our retail customer base has been consolidating over the last several years resulting in fewer customers with increased purchasing power. This increased purchasing power can limit our ability to increase pricing for our products with certain of our customers. Our inability to meet the demands of our larger customers could lead to a loss of business and adversely affect our financial results.
Raw materials and energy. The production of our products is dependent on certain raw materials, including aluminum, resin, linerboard and corn. In addition, the production and distribution of our products is dependent on energy sources, including natural gas, fuel and electricity. These items are subject to price volatility caused by numerous factors. Commodity price increases ultimately result in a corresponding increase in the cost of raw materials and energy. We may be limited in our ability to pass these increases on to our customers or may incur a loss in sales volume to the extent price increases are taken. In addition, strikes, weather conditions, governmental controls, national emergencies, natural disasters, supply shortages or other events could affect our continued supply of raw materials and energy. If raw materials or energy costs increase, or the availability is limited, our financial results could be adversely affected.
Governmental regulation. Our business and properties are subject to various federal, state and local laws and regulations, including those governing the production, packaging, quality, labeling and distribution of beverage products. In addition, various governmental agencies have considered imposing taxes on soft drinks and other sugar-sweetened beverages, including those sweetened with high fructose corn syrup. New laws or regulations or changes in existing laws or regulations could negatively affect our financial results through lower sales or higher operating costs.
7
ITEM 1B. UNRESOLVED STAFF COMMENTS
None.
ITEM 2. PROPERTIES
Our principal properties include twelve manufacturing facilities located in ten states, which aggregate approximately two million square feet. We own ten manufacturing facilities in the following states: California (2), Georgia, Kansas, Michigan (2), Ohio, Texas, Utah and Washington. Two manufacturing facilities, located in Maryland and Florida, are leased subject to agreements that expire through 2020. We believe our facilities are generally in good condition and sufficient to meet present needs.
The production of beverages is capital intensive but is not characterized by rapid technological change. The technological advances that have occurred have generally been of an incremental cost-saving nature, such as the industry’s conversion to lighter weight containers or improved blending processes that enhance ingredient yields. We are not aware of any anticipated industry-wide changes in technology that would adversely impact our current physical production capacity or cost of production.
We own and lease trucks, vans and automobiles used in the sale, delivery and distribution of our products. In addition, we lease office and warehouse space, transportation equipment, office equipment, information systems equipment and certain manufacturing equipment.
ITEM 3. LEGAL PROCEEDINGS
From time to time, we are a party to various litigation matters arising in the ordinary course of business. We do not expect the ultimate disposition of such matters to have a material adverse effect on our consolidated financial position or results of operations.
ITEM 4. [REMOVED AND RESERVED]
8
PART II
|
ITEM 5.
|
MARKET FOR REGISTRANT’S COMMON EQUITY, RELATED STOCKHOLDER MATTERS AND ISSUER PURCHASES OF EQUITY SECURITIES
|
The common stock of National Beverage Corp., par value $.01 per share, (“Common Stock”) is listed on The NASDAQ Global Select Market under the symbol “FIZZ”. The following table shows the range of high and low prices per share of the Common Stock for the fiscal quarters indicated:
|
Fiscal Year Ended
|
||||||||||||||||
|
April 30, 2011
|
May 1, 2010
|
|||||||||||||||
|
High
|
Low
|
High
|
Low
|
|||||||||||||
|
First Quarter
|
$ | 14.41 | $ | 10.77 | $ | 11.64 | $ | 9.25 | ||||||||
|
Second Quarter
|
$ | 15.23 | $ | 12.32 | $ | 12.00 | $ | 9.55 | ||||||||
|
Third Quarter
|
$ | 15.45 | $ | 12.44 | $ | 14.50 | $ | 10.37 | ||||||||
|
Fourth Quarter
|
$ | 14.69 | $ | 12.30 | $ | 11.82 | $ | 10.75 | ||||||||
At July 5, 2011, there were approximately 4,300 holders of our Common Stock, the majority of which hold their shares in the names of various dealers and/or clearing agencies.
The Company paid special cash dividends of $106,314,000 ($2.30 per share) on February 14, 2011 and $62,295,000 ($1.35 per share) on January 22, 2010. See Note 4 of Notes to Consolidated Financial Statements for certain restrictions on the payment of dividends.
In January 1998, the Board of Directors authorized the purchase of up to 800,000 shares of National Beverage common stock of which 502,060 shares have been purchased. There were no shares purchased during the last three fiscal years.
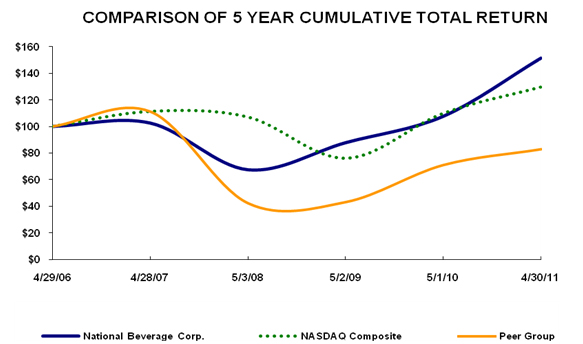
Performance Graph
The following graph shows a comparison of the five-year cumulative returns of an investment of $100 cash on April 29, 2006, assuming reinvestment of dividends, in (i) our Common Stock, (ii) the NASDAQ Composite Index and (iii) a company-constructed peer group consisting of Coca-Cola Bottling Company Consolidated and Cott Corporation. On October 2, 2010, the North American operations of Coca-Cola Enterprises Inc. were acquired by The Coca-Cola Company; therefore, Coca-Cola Enterprises is no longer included in the company-constructed peer group.
9
|
4/29/06
|
4/28/07
|
5/3/08
|
5/2/09
|
5/1/10
|
4/30/11
|
|||||||||||||||||||
|
National Beverage Corp.
|
$ | 100.00 | $ | 102.54 | $ | 67.53 | $ | 87.83 | $ | 107.64 | $ | 151.24 | ||||||||||||
|
NASDAQ Composite
|
100.00 | 111.24 | 107.01 | 75.98 | 109.83 | 129.57 | ||||||||||||||||||
|
Peer Group
|
100.00 | 111.04 | 42.48 | 43.30 | 71.01 | 82.86 | ||||||||||||||||||
10
ITEM 6. SELECTED FINANCIAL DATA
The following selected financial data should be read in conjunction with the Company’s financial statements and the accompanying notes listed in Item 8 of this report.
|
NATIONAL BEVERAGE CORP. AND SUBSIDIARIES
|
||||||||||||||||||||
|
(In thousands, except per share and footnote amounts)
|
||||||||||||||||||||
|
Fiscal Year Ended
|
||||||||||||||||||||
|
April 30,
|
May 1,
|
May 2,
|
May 3,
|
April 28,
|
||||||||||||||||
|
2011
|
2010
|
2009
|
2008 (1)
|
2007
|
||||||||||||||||
|
SUMMARY OF OPERATIONS:
|
||||||||||||||||||||
|
Net sales
|
$ | 600,193 | $ | 593,465 | $ | 575,177 | $ | 566,001 | $ | 539,030 | ||||||||||
|
Cost of sales
|
381,539 | 396,450 | 405,322 | 393,420 | 365,793 | |||||||||||||||
|
Gross profit
|
218,654 | 197,015 | 169,855 | 172,581 | 173,237 | |||||||||||||||
|
Selling, general and administrative expenses
|
155,885 | 145,159 | 131,918 | 138,447 | 137,212 | |||||||||||||||
|
Interest expense
|
99 | 120 | 107 | 109 | 106 | |||||||||||||||
|
Other income (expense) - net
|
(20 | ) | (351 | ) | 967 | 1,053 | 2,587 | |||||||||||||
|
Income before income taxes
|
62,650 | 51,385 | 38,797 | 35,078 | 38,506 | |||||||||||||||
|
Provision for income taxes
|
21,896 | 18,532 | 14,055 | 12,598 | 13,824 | |||||||||||||||
|
Net income
|
$ | 40,754 | $ | 32,853 | $ | 24,742 | $ | 22,480 | $ | 24,682 | ||||||||||
|
PER SHARE DATA:
|
||||||||||||||||||||
|
Basic net income (2)
|
$ | .88 | $ | .71 | $ | .54 | $ | .49 | $ | .54 | ||||||||||
|
Diluted net income (2)
|
.88 | .71 | .54 | .49 | .54 | |||||||||||||||
|
Closing stock price (2)
|
13.92 | 11.60 | 10.47 | 8.05 | 13.13 | |||||||||||||||
|
Cash dividends paid (3)
|
2.30 | 1.35 | - | .80 | - | |||||||||||||||
|
BALANCE SHEET DATA:
|
||||||||||||||||||||
|
Cash and equivalents (3)
|
$ | 7,372 | $ | 68,566 | $ | 84,140 | $ | 51,497 | $ | 65,579 | ||||||||||
|
Working capital (3)
|
30,930 | 92,898 | 117,840 | 89,396 | 97,684 | |||||||||||||||
|
Property, plant and equipment - net
|
55,337 | 53,401 | 56,141 | 57,639 | 57,369 | |||||||||||||||
|
Total assets (3)
|
182,810 | 240,359 | 265,682 | 239,122 | 257,632 | |||||||||||||||
|
Deferred income tax liability
|
14,548 | 15,597 | 16,517 | 16,624 | 15,217 | |||||||||||||||
|
Shareholders' equity (3)
|
80,336 | 141,572 | 170,012 | 144,625 | 157,361 | |||||||||||||||
|
Cash dividends paid (3)
|
106,314 | 62,295 | - | 36,711 | - | |||||||||||||||
|
(1) Fiscal 2008 consisted of 53 weeks.
|
|
(2) Basic net income per share is computed by dividing earnings applicable to common shares by the weighted average number of shares outstanding. Diluted net income per share includes the dilutive effect of stock options. Net income per share and the closing stock price have been adjusted for the 20% stock dividend distributed on June 22, 2007.
|
|
(3) The Company paid special cash dividends of $106,314,000 ($2.30 per share), $62,295,000 ($1.35 per share) and $36,711,000 ($.80 per share) on February 14, 2011, January 22, 2010 and August 17, 2007, respectively.
|
11
ITEM 7. MANAGEMENT’S DISCUSSION AND ANALYSIS OF FINANCIAL CONDITION AND RESULTS OF OPERATIONS
OVERVIEW
National Beverage Corp. develops, manufactures, markets and distributes a complete portfolio of quality beverage products throughout the United States. Incorporated in Delaware in 1985, National Beverage Corp. is a holding company for various operating subsidiaries. In this report, the terms “we,” “us,” “our,” “Company” and “National Beverage” mean National Beverage Corp. and its subsidiaries.
We consider ourselves to be a leader in the development and sale of flavored beverage products in the United States, offering a wide selection of flavored soft drinks, juices, sparkling waters, energy drinks and nutritionally-enhanced waters. Our flavor development spans over 100 years originating with our flagship brands, Shasta® and Faygo®, each of which has over 50 flavor varieties. We also offer the health-conscious consumer a diverse line of flavored beverage products, including Everfresh®, Home Juice® and Mr. Pure® 100% juice and juice-based products; LaCroix®, Crystal Bay® and ClearFruit® flavored, sparkling and spring water products; and ÀSanté® nutritionally-enhanced waters. In addition, we produce and market Rip It® energy drinks, Ohana® fruit-flavored drinks, St. Nick’s® holiday soft drinks, as well as effervescent powder beverage enhancers sold under the NutraFizz® brand name. Substantially all of our brands are produced in twelve manufacturing facilities that are strategically located near major metropolitan markets throughout the continental United States. To a lesser extent, we develop and produce soft drinks for certain retailers and beverage companies (“allied brands”).
Our strategy emphasizes the growth of our products by offering a branded beverage portfolio of proprietary flavors, supporting the franchise value of regional brands and expanding those brands with distinctive packaging and broad demographic emphasis, developing and acquiring innovative products tailored toward healthy lifestyles and appealing to the “quality-value” expectations of the family consumer. We believe the “regional share dynamics” of our brands results in more retailer sponsored promotional activities which perpetuate consumer loyalty within local markets.
Our focus is to increase penetration of our brands in the convenience channel through Company-owned and independent distributors. The convenience channel consists of convenience stores, gas stations and other smaller “up-and-down-the-street” accounts. Because of the higher retail prices and margins that typically prevail in this market, we have undertaken several measures to expand convenience channel distribution. These measures include development of new products and serving sizes specifically targeted for this market, such as ClearFruit, Crystal Bay, Rip It and ÀSanté. Additionally, we have created proprietary and specialized packaging with distinctive graphics for these products. We intend to continue our focus on enhancing growth in the convenience channel through both specialized packaging and innovative product development.
Beverage industry sales are seasonal with the highest volume typically realized during the summer months. Additionally, our operating results are subject to numerous factors, including fluctuations in the costs of raw materials, changes in consumer preference for beverage products and competitive pricing in the marketplace.
12
RESULTS OF OPERATIONS
Net Sales
Net sales for the fiscal year ended April 30, 2011 (“Fiscal 2011”) increased 1.1% to $600,193,000 as compared to $593,465,000 for the fiscal year ended May 1, 2010 (“Fiscal 2010”). The sales improvement is due to case volume growth of 13.2% for our premium brand portfolio, and a 1.2% increase in unit pricing resulting from favorable product mix changes. This sales improvement was partially offset by a 2.1% volume decline for branded carbonated soft drinks due to weak demand in certain regional markets.
Net sales for the fiscal year ended May 1, 2010 increased 3.2% to $593,465,000 as compared to $575,177,000 for the fiscal year ended May 2, 2009 (“Fiscal 2009”). The net sales increase reflects case volume growth of 1.2% for our energy drinks, juices and waters and 5.1% for branded carbonated soft drinks. In addition, unit pricing increased .9% largely due to favorable product mix changes. This improvement was partially offset by a decline in allied branded volume.
Gross Profit
Gross profit approximated 36.4% of net sales for Fiscal 2011, which represents a 3.2% margin improvement over Fiscal 2010. This gross margin improvement is primarily due to favorable changes in brand and package mix. Cost of sales decreased 3.7% on a per case basis.
Gross profit approximated 33.2% of net sales for Fiscal 2010 and 29.5% of net sales for Fiscal 2009. The gross margin improvement was due to higher sales volume, favorable changes in product mix and lower raw material costs. Cost of sales decreased 4.4% on a per case basis.
Shipping and handling costs are included in selling, general and administrative expenses, the classification of which is consistent with many beverage companies. However, our gross margin may not be comparable to companies that include shipping and handling costs in cost of sales. See Note 1 of Notes to Consolidated Financial Statements.
Selling, General and Administrative Expenses
Selling, general and administrative expenses were $155,885,000 or 26.0% of net sales for Fiscal 2011 compared to $145,159,000 or 24.5% of net sales for Fiscal 2010. The increase in expenses was primarily due to additional investment in expanded distribution, including expanded marketing and selling programs. Marketing costs reflect increased cooperative advertising programs with customers and increased brand support expenditures.
Selling, general and administrative expenses were $145,159,000 or 24.5% of net sales for Fiscal 2010 compared to $131,918,000 or 22.9% of net sales for Fiscal 2009. The increase in expenses was primarily due to higher marketing and administrative costs. Marketing costs reflect increased cooperative advertising programs with customers and increased brand support expenditures.
Interest Expense and Other Income-Net
Interest expense is comprised of interest on borrowings and fees related to maintaining lines of credit. Other income includes interest income of $140,000 for Fiscal 2011, $229,000 for Fiscal 2010 and $865,000 for Fiscal 2009. The decline in interest income for Fiscal 2011 and Fiscal 2010 was primarily due to lower investment yields. Other income for Fiscal 2009 includes a gain of $728,000 related to a legal settlement concerning certain leased property. See Note 7 of Notes to Consolidated Financial Statements.
13
Income Taxes
Our effective tax rate was approximately 34.9% for Fiscal 2011, 36.1% for Fiscal 2010 and 36.2% for Fiscal 2009. The difference between the effective rate and the federal statutory rate of 35% was primarily due to the effects of the manufacturing deduction and state income taxes. See Note 8 of Notes to Consolidated Financial Statements.
LIQUIDITY AND FINANCIAL CONDITION
Liquidity and Capital Resources
Our principal source of funds is cash generated from operations, which may be supplemented by borrowings available under our credit facilities. The Company maintains a $50,000,000 unsecured revolving credit facility of which $2,639,000 was utilized for standby letters of credit at April 30, 2011. On July 8, 2011, we entered into an additional revolving credit facility which increased our total credit availability to $75,000,000. We believe that existing capital resources will be sufficient to meet our capital requirements for the foreseeable future. See Note 4 of Notes to Consolidated Financial Statements.
We continually evaluate capital projects to expand our production capacity, enhance packaging capabilities or improve efficiencies at our manufacturing facilities. Expenditures for property, plant and equipment amounted to $11,389,000 for Fiscal 2011; there were no material capital expenditure commitments at April 30, 2011.
The Company paid special cash dividends of $106,314,000 ($2.30 per share) on February 14, 2011 and $62,295,000 ($1.35 per share) on January 22, 2010.
Pursuant to a management agreement, we incurred a fee to Corporate Management Advisors, Inc. (“CMA”) of approximately $6,002,000 for Fiscal 2011, $5,935,000 for Fiscal 2010 and $5,752,000 for Fiscal 2009. At April 30, 2011, management fees payable to CMA were $1,519,000. See Note 5 of Notes to Consolidated Financial Statements.
Cash Flows
During Fiscal 2011 and Fiscal 2010, cash flow was significantly impacted by the payment of two special cash dividends aggregating $168,609,000.
During Fiscal 2011, $55,302,000 was provided by operating activities, offset by $11,312,000 used in investing activities and a special cash dividend payment of $106,314,000. Cash provided by operating activities increased $917,000 primarily due to higher earnings and cash used in investing activities increased $2,998,000 due to expanded capital investments.
During Fiscal 2010, $54,385,000 was provided by operating activities, which was offset by $8,314,000 used in investing activities and $61,645,000 used in financing activities. Cash provided by operating activities increased $18,556,000 primarily due to higher earnings. Cash used in investing activities increased $4,823,000 due to changes in net marketable securities transactions and higher capital expenditures. Cash used in financing activities includes a special cash dividend payment of $62,295,000.
14
Financial Position
During Fiscal 2011, our working capital decreased $61,968,000 to $30,930,000 due to the special cash dividend paid in February 2011. Inventory decreased $1,319,000 due to reduced inventory quantities. Prepaid and other assets increased $4,219,000 primarily due to an increase in derivative assets. See Note 6 of Notes to Consolidated Financial Statements. At April 30, 2011, the current ratio was 1.4 to 1, as compared to 2.3 to 1 at May 1, 2010.
During Fiscal 2010, our working capital decreased $24,942,000 to $92,898,000 due to the special cash dividend paid in January 2010. Inventory decreased $4,940,000 due to lower raw material costs and reduced inventory levels. Prepaid and other assets decreased $1,368,000 primarily due to changes in income tax receivables. At May 1, 2010, the current ratio was 2.3 to 1, as compared to 2.7 to 1 at May 2, 2009.
CONTRACTUAL OBLIGATIONS
Contractual obligations at April 30, 2011 are payable as follows:
| (In thousands) | ||||||||||||||||||||
|
Total
|
Less Than
1 Year
|
1 to 3 Years
|
3 to 5 Years
|
More Than 5 Years
|
||||||||||||||||
|
Operating leases
|
$ | 17,202 | $ | 4,842 | $ | 4,946 | $ | 3,376 | $ | 4,038 | ||||||||||
|
Purchase commitments
|
77,571 | 49,874 | 27,697 | - | - | |||||||||||||||
|
Total
|
$ | 94,773 | $ | 54,716 | $ | 32,643 | $ | 3,376 | $ | 4,038 | ||||||||||
We have guaranteed the residual value of certain leased equipment in the amount of $11,300,000. If the proceeds from sale of such equipment are less than the balance required by the lease when the lease terminates in July 2012, the Company shall be required to pay the difference up to such guaranteed amount.
We contribute to certain pension plans under collective bargaining agreements based on hours worked and to a discretionary profit sharing plan. Contributions were $2,534,000 for Fiscal 2011, $2,309,000 for Fiscal 2010 and $2,304,000 for Fiscal 2009.
We maintain self-insured and deductible programs for certain liability, medical and workers’ compensation exposures. Other long-term liabilities include known claims and estimated incurred but not reported claims not otherwise covered by insurance, based on actuarial assumptions and historical claims experience. Since the timing and amount of claim payments vary significantly, we are not able to reasonably estimate future payments for the specific periods indicated in the table above. In connection with our self-insurance programs, we have standby letters of credit aggregating $2,639,000, which expire in fiscal 2012. We expect to renew these standby letters of credit.
OFF-BALANCE SHEET ARRANGEMENTS
We do not have any off-balance sheet arrangements that have, or are reasonably likely to have, a current or future material effect on our financial condition.
15
CRITICAL ACCOUNTING POLICIES
The preparation of financial statements in conformity with generally accepted accounting principles requires management to make estimates and assumptions that affect the amounts reported in the financial statements and accompanying notes. Although these estimates are based on management’s knowledge of current events and actions it may undertake in the future, they may ultimately differ from actual results. We believe that the critical accounting policies described in the following paragraphs comprise the most significant estimates and assumptions used in the preparation of our consolidated financial statements. For these policies, we caution that future events rarely develop exactly as estimated and the best estimates routinely require adjustment.
Credit Risk
We sell products to a variety of customers and extend credit based on an evaluation of each customer’s financial condition, generally without requiring collateral. Exposure to credit losses varies by customer principally due to the financial condition of each customer. We monitor our exposure to credit losses and maintain allowances for anticipated losses based on specific customer circumstances, credit conditions and historical write-offs.
Impairment of Long-Lived Assets
All long-lived assets, excluding goodwill and intangible assets not subject to amortization, are evaluated for impairment on the basis of undiscounted cash flows whenever events or changes in circumstances indicate that the carrying amount of an asset may not be recoverable. An impaired asset is written down to its estimated fair market value based on the best information available. Estimated fair market value is generally measured by discounting future cash flows. Goodwill and intangible assets not subject to amortization are evaluated for impairment annually or sooner if we believe such assets may be impaired. An impairment loss is recognized if the carrying amount or, for goodwill, the carrying amount of its reporting unit, is greater than its fair value.
Income Taxes
Our effective income tax rate is based on estimates of taxes which will ultimately be payable. Deferred taxes are recorded to give recognition to temporary differences between the tax bases of assets or liabilities and their reported amounts in the financial statements. Valuation allowances are established to reduce the carrying amounts of deferred tax assets when it is deemed, more likely than not, that the benefit of deferred tax assets will not be realized.
Insurance Programs
We maintain self-insured and deductible programs for certain liability, medical and workers’ compensation exposures. Accordingly, we accrue for known claims and estimated incurred but not reported claims not otherwise covered by insurance based on actuarial assumptions and historical claims experience.
Sales Incentives
We offer various sales incentive arrangements to our customers which require customer performance or achievement of certain sales volume targets. In those circumstances when the incentive is paid in advance, we amortize the amount paid over the period of benefit or contractual sales volume. When the incentive is paid in arrears, we accrue the expected amount to be paid over the period of benefit or expected sales volume. The recognition of these incentives involves the use of judgment related to performance and sales volume estimates that are made based on historical experience and other factors. Sales incentives are accounted for as a reduction of sales and actual amounts ultimately realized may vary from accrued amounts.
16
|
ITEM 7A.
|
QUANTITATIVE AND QUALITATIVE DISCLOSURES ABOUT MARKET RISK
|
Commodities
We purchase various raw materials, including aluminum cans, plastic bottles, high fructose corn syrup and various juice concentrates, the prices of which fluctuate based on commodity market conditions. Our ability to recover increased costs through higher pricing may be limited by the competitive environment in which we operate. At times, we manage our exposure to this risk through the use of supplier pricing agreements that enable us to establish the purchase prices for certain commodities. Additionally, we use derivative financial instruments to partially mitigate our exposure to changes in certain raw material costs.
Interest Rates
We had no debt-related interest rate exposure during Fiscal 2011. Our investment portfolio is comprised of highly liquid securities consisting primarily of short-term money market investments, the yields of which fluctuate based largely on short-term Treasury rates.
FORWARD-LOOKING STATEMENTS
National Beverage and its representatives may make written or oral statements relating to future events or results relative to our financial, operational and business performance, achievements, objectives and strategies. These statements are "forward-looking" within the meaning of the Private Securities Litigation Reform Act of 1995 and include statements contained in this report and other filings with the Securities and Exchange Commission and in reports to our stockholders. Certain statements including, without limitation, statements containing the words "believes," "anticipates," "intends," "plans," "expects," and "estimates" constitute "forward-looking statements" and involve known and unknown risk, uncertainties and other factors that may cause the actual results, performance or achievements of our Company to be materially different from any future results, performance or achievements expressed or implied by such forward-looking statements. Such factors include, but are not limited to, the following: general economic and business conditions, pricing of competitive products, success in acquiring other beverage businesses, success of new product and flavor introductions, fluctuations in the costs of raw materials and packaging supplies, ability to pass along cost increases to our customers, labor strikes or work stoppages or other interruptions in the employment of labor, continued retailer support for our products, changes in consumer preferences and our success in creating products geared toward consumers’ tastes, success in implementing business strategies, changes in business strategy or development plans, government regulations, taxes or fees imposed on the sale of our products, unseasonably cold or wet weather conditions and other factors referenced in this Form 10-K. We disclaim an obligation to update any such factors or to publicly announce the results of any revisions to any forward-looking statements contained herein to reflect future events or developments.
17
|
ITEM 8.
|
FINANCIAL STATEMENTS AND SUPPLEMENTARY DATA
|
NATIONAL BEVERAGE CORP. AND SUBSIDIARIES
|
CONSOLIDATED BALANCE SHEETS
|
||||||||
|
(In thousands, except share amounts)
|
||||||||
|
April 30,
|
May 1,
|
|||||||
|
2011
|
2010
|
|||||||
|
Assets
|
||||||||
|
Current assets:
|
||||||||
|
Cash and equivalents
|
$ | 7,372 | $ | 68,566 | ||||
|
Trade receivables - net of allowances of $452 (2011) and $509 (2010)
|
55,912 | 53,834 | ||||||
|
Inventories
|
33,353 | 34,672 | ||||||
|
Deferred income taxes - net
|
1,493 | 3,367 | ||||||
|
Prepaid and other assets
|
8,403 | 4,184 | ||||||
|
Total current assets
|
106,533 | 164,623 | ||||||
|
Property, plant and equipment - net
|
55,337 | 53,401 | ||||||
|
Goodwill
|
13,145 | 13,145 | ||||||
|
Intangible assets
|
1,615 | 1,615 | ||||||
|
Other assets
|
6,180 | 7,575 | ||||||
| $ | 182,810 | $ | 240,359 | |||||
|
Liabilities and Shareholders' Equity
|
||||||||
|
Current liabilities:
|
||||||||
|
Accounts payable
|
$ | 49,257 | $ | 48,428 | ||||
|
Accrued liabilities
|
26,214 | 23,170 | ||||||
|
Income taxes payable
|
132 | 127 | ||||||
|
Total current liabilities
|
75,603 | 71,725 | ||||||
|
Deferred income taxes - net
|
14,548 | 15,597 | ||||||
|
Other liabilities
|
12,323 | 11,465 | ||||||
|
Shareholders' equity:
|
||||||||
|
Preferred stock, 7% cumulative, $1 par value, aggregate liquidation
|
||||||||
|
preference of $15,000 - 1,000,000 shares authorized; 150,000
|
||||||||
|
shares issued
|
150 | 150 | ||||||
|
Common stock, $.01 par value - 75,000,000 shares authorized;
|
||||||||
|
50,262,139 shares (2011) and 50,188,819 shares (2010) issued
|
503 | 502 | ||||||
|
Additional paid-in capital
|
29,725 | 28,150 | ||||||
|
Retained earnings
|
65,207 | 130,767 | ||||||
|
Accumulated other comprehensive income
|
2,751 | 3 | ||||||
|
Treasury stock - at cost:
|
||||||||
|
Preferred stock - 150,000 shares
|
(5,100 | ) | (5,100 | ) | ||||
|
Common stock - 4,032,784 shares
|
(12,900 | ) | (12,900 | ) | ||||
|
Total shareholders' equity
|
80,336 | 141,572 | ||||||
| $ | 182,810 | $ | 240,359 | |||||
|
See accompanying Notes to Consolidated Financial Statements.
|
||||||||
18
|
NATIONAL BEVERAGE CORP. AND SUBSIDIARIES
|
||||||||||||
|
CONSOLIDATED STATEMENTS OF INCOME
|
||||||||||||
|
(In thousands, except per share amounts)
|
||||||||||||
| Fiscal Year Ended | ||||||||||||
|
April 30,
|
May 1,
|
May 2,
|
||||||||||
|
2011
|
2010
|
2009
|
||||||||||
|
Net sales
|
$ | 600,193 | $ | 593,465 | $ | 575,177 | ||||||
|
Cost of sales
|
381,539 | 396,450 | 405,322 | |||||||||
|
Gross profit
|
218,654 | 197,015 | 169,855 | |||||||||
|
Selling, general and administrative expenses
|
155,885 | 145,159 | 131,918 | |||||||||
|
Interest expense
|
99 | 120 | 107 | |||||||||
|
Other income (expense) - net
|
(20 | ) | (351 | ) | 967 | |||||||
|
Income before income taxes
|
62,650 | 51,385 | 38,797 | |||||||||
|
Provision for income taxes
|
21,896 | 18,532 | 14,055 | |||||||||
|
Net income
|
$ | 40,754 | $ | 32,853 | $ | 24,742 | ||||||
|
Net income per share:
|
||||||||||||
|
Basic
|
$ | .88 | $ | .71 | $ | .54 | ||||||
|
Diluted
|
$ | .88 | $ | .71 | $ | .54 | ||||||
|
Weighted average common shares outstanding:
|
||||||||||||
|
Basic
|
46,188 | 46,065 | 45,999 | |||||||||
|
Diluted
|
46,373 | 46,294 | 46,191 | |||||||||
|
See accompanying Notes to Consolidated Financial Statements.
|
||||||||||||
19
|
NATIONAL BEVERAGE CORP. AND SUBSIDIARIES
|
||||||||||||
|
CONSOLIDATED STATEMENTS OF SHAREHOLDERS' EQUITY
|
||||||||||||
|
(In thousands)
|
||||||||||||
|
Fiscal Year Ended
|
||||||||||||
|
April 30,
|
May 1,
|
May 2,
|
||||||||||
|
2011
|
2010
|
2009
|
||||||||||
|
Number of Common Shares Issued
|
||||||||||||
|
Beginning of year
|
50,189 | 50,045 | 49,982 | |||||||||
|
Stock options exercised
|
73 | 144 | 63 | |||||||||
|
End of year
|
50,262 | 50,189 | 50,045 | |||||||||
|
Preferred Stock
|
||||||||||||
|
Beginning and end of year
|
$ | 150 | $ | 150 | $ | 150 | ||||||
|
Common Stock
|
||||||||||||
|
Beginning of year
|
502 | 500 | 500 | |||||||||
|
Stock options exercised
|
1 | 2 | - | |||||||||
|
End of year
|
503 | 502 | 500 | |||||||||
|
Additional Paid-In Capital
|
||||||||||||
|
Beginning of year
|
28,150 | 27,153 | 26,508 | |||||||||
|
Stock options exercised
|
208 | 264 | 245 | |||||||||
|
Stock-based compensation
|
446 | 349 | 340 | |||||||||
|
Stock-based tax benefits
|
921 | 384 | 60 | |||||||||
|
End of year
|
29,725 | 28,150 | 27,153 | |||||||||
|
Retained Earnings
|
||||||||||||
|
Beginning of year
|
130,767 | 160,209 | 135,467 | |||||||||
|
Net income
|
40,754 | 32,853 | 24,742 | |||||||||
|
Cash dividends
|
(106,314 | ) | (62,295 | ) | - | |||||||
|
End of year
|
65,207 | 130,767 | 160,209 | |||||||||
|
Accumulated Other Comprehensive Income
|
||||||||||||
|
Beginning of year
|
3 | - | - | |||||||||
|
Cash flow hedges
|
2,748 | 3 | - | |||||||||
|
End of year
|
2,751 | 3 | - | |||||||||
|
Treasury Stock - Preferred
|
||||||||||||
|
Beginning and end of year
|
(5,100 | ) | (5,100 | ) | (5,100 | ) | ||||||
|
Treasury Stock - Common
|
||||||||||||
|
Beginning and end of year
|
(12,900 | ) | (12,900 | ) | (12,900 | ) | ||||||
|
Total Shareholders' Equity
|
$ | 80,336 | $ | 141,572 | $ | 170,012 | ||||||
|
Comprehensive Income
|
||||||||||||
|
Net income
|
$ | 40,754 | $ | 32,853 | $ | 24,742 | ||||||
|
Cash flow hedges
|
2,748 | 3 | - | |||||||||
|
Comprehensive income
|
$ | 43,502 | $ | 32,856 | $ | 24,742 | ||||||
|
See accompanying Notes to Consolidated Financial Statements.
|
||||||||||||
20
|
NATIONAL BEVERAGE CORP. AND SUBSIDIARIES
|
||||||||||||
|
CONSOLIDATED STATEMENTS OF CASH FLOWS
|
||||||||||||
|
(In thousands)
|
||||||||||||
| Fiscal Year Ended | ||||||||||||
|
April 30,
|
May 1,
|
May 2,
|
||||||||||
|
2011
|
2010
|
2009
|
||||||||||
|
Operating Activities:
|
||||||||||||
|
Net income
|
$ | 40,754 | $ | 32,853 | $ | 24,742 | ||||||
|
Adjustments to reconcile net income to net cash
|
||||||||||||
|
provided by operating activities:
|
||||||||||||
|
Depreciation and amortization
|
11,356 | 12,350 | 11,782 | |||||||||
|
Deferred income tax benefit
|
(694 | ) | (1,026 | ) | (474 | ) | ||||||
|
Loss on disposal of property, net
|
82 | 791 | 363 | |||||||||
|
Stock-based compensation
|
446 | 349 | 340 | |||||||||
|
Changes in assets and liabilities:
|
||||||||||||
|
Trade receivables
|
(2,078 | ) | (99 | ) | (4,549 | ) | ||||||
|
Inventories
|
1,319 | 4,940 | (858 | ) | ||||||||
|
Prepaid and other assets
|
(1,215 | ) | 8 | 2,774 | ||||||||
|
Accounts payable
|
829 | 423 | (1,798 | ) | ||||||||
|
Accrued and other liabilities
|
4,503 | 3,796 | 3,507 | |||||||||
|
Net cash provided by operating activities
|
55,302 | 54,385 | 35,829 | |||||||||
|
Investing Activities:
|
||||||||||||
|
Marketable securities purchased
|
- | - | (109,450 | ) | ||||||||
|
Marketable securities sold
|
- | - | 112,450 | |||||||||
|
Additions to property, plant and equipment
|
(11,389 | ) | (8,349 | ) | (6,658 | ) | ||||||
|
Proceeds from sale of property, plant and equipment
|
77 | 35 | 167 | |||||||||
|
Net cash used in investing activities
|
(11,312 | ) | (8,314 | ) | (3,491 | ) | ||||||
|
Financing Activities:
|
||||||||||||
|
Common stock cash dividend
|
(106,314 | ) | (62,295 | ) | - | |||||||
|
Proceeds from stock options exercised
|
209 | 266 | 245 | |||||||||
|
Stock-based tax benefits
|
921 | 384 | 60 | |||||||||
|
Net cash provided by (used in) financing activities
|
(105,184 | ) | (61,645 | ) | 305 | |||||||
|
Net (Decrease) Increase in Cash and Equivalents
|
(61,194 | ) | (15,574 | ) | 32,643 | |||||||
|
Cash and Equivalents - Beginning of Year
|
68,566 | 84,140 | 51,497 | |||||||||
|
Cash and Equivalents - End of Year
|
$ | 7,372 | $ | 68,566 | $ | 84,140 | ||||||
|
Other Cash Flow Information:
|
||||||||||||
|
Interest paid
|
$ | 101 | $ | 124 | $ | 107 | ||||||
|
Income taxes paid
|
20,816 | 18,541 | 11,114 | |||||||||
|
See accompanying Notes to Consolidated Financial Statements.
|
||||||||||||
21
NATIONAL BEVERAGE CORP. AND SUBSIDIARIES
Notes to Consolidated Financial Statements
National Beverage Corp. develops, manufactures, markets and distributes a complete portfolio of multi-flavored soft drinks, juice drinks, water and specialty beverages throughout the United States. Incorporated in Delaware in 1985, National Beverage Corp. is a holding company for various operating subsidiaries. When used in this report, the terms “we,” “us,” “our,” “Company” and “National Beverage” mean National Beverage Corp. and its subsidiaries.
|
1.
|
SIGNIFICANT ACCOUNTING POLICIES
|
Basis of Presentation
Our consolidated financial statements are prepared in accordance with accounting principles generally accepted in the United States. The consolidated financial statements include the accounts of National Beverage Corp. and all subsidiaries. All significant intercompany transactions and accounts have been eliminated. Our fiscal year ends the Saturday closest to April 30 and, as a result, an additional week is added every five or six years. Fiscal 2011, Fiscal 2010 and Fiscal 2009 consisted of 52 weeks.
Cash and Equivalents
Cash and equivalents are comprised of cash and highly liquid securities (consisting primarily of short-term money-market investments) with an original maturity of three months or less.
Derivative Financial Instruments
We use derivative financial instruments to partially mitigate our exposure to changes in raw material costs. All derivative financial instruments are recorded at fair value in our Consolidated Balance Sheets. We do not use derivative financial instruments for trading or speculative purposes. Credit risk related to derivative financial instruments is managed by requiring high credit standards for counterparties and frequent cash settlements. See Note 6.
Fair Value
The fair values of our cash and cash equivalents, trade receivables and accounts payable approximate their carrying amounts due to their short-term nature. The estimated fair values of our derivative financial instruments are calculated based on market rates to settle the instruments. These values represent the estimated amounts we would receive upon sale, taking into consideration current market prices and credit worthiness. See Note 6.
Impairment of Long-Lived Assets
All long-lived assets, excluding goodwill and intangible assets not subject to amortization, are evaluated for impairment on the basis of undiscounted cash flows whenever events or changes in circumstances indicate that the carrying amount of an asset may not be recoverable. An impaired asset is written down to its estimated fair market value based on the best information available. Estimated fair market value is generally measured by discounting future cash flows. Goodwill and intangible assets not subject to amortization are evaluated for impairment annually or sooner if we believe such assets may be impaired. An impairment loss is recognized if the carrying amount or, for goodwill, the carrying amount of its reporting unit, is greater than its fair value.
22
NATIONAL BEVERAGE CORP. AND SUBSIDIARIES
Notes to Consolidated Financial Statements (continued)
Income Taxes
Our effective income tax rate is based on estimates of taxes which will ultimately be payable. Deferred taxes are recorded to give recognition to temporary differences between the tax bases of assets or liabilities and their reported amounts in the financial statements. Valuation allowances are established to reduce the carrying amounts of deferred tax assets when it is deemed, more likely than not, that the benefit of deferred tax assets will not be realized.
Insurance Programs
We maintain self-insured and deductible programs for certain liability, medical and workers’ compensation exposures. Accordingly, we accrue for known claims and estimated incurred but not reported claims not otherwise covered by insurance, based on actuarial assumptions and historical claims experience.
Intangible Assets
Intangible assets as of April 30, 2011 and May 1, 2010 consisted of non-amortizable trademarks.
Inventories
Inventories are stated at the lower of first-in, first-out cost or market. Inventories at April 30, 2011 are comprised of finished goods of $20,215,000 and raw materials of $13,138,000. Inventories at May 1, 2010 are comprised of finished goods of $21,104,000 and raw materials of $13,568,000.
Marketing Costs
We are involved in a variety of marketing programs, including cooperative advertising programs with customers, to advertise and promote our products to consumers. Marketing costs are expensed when incurred, except for prepaid advertising and production costs which are expensed when the advertising takes place. Marketing costs, which are included in selling, general and administrative expenses, totaled $52,926,000 in Fiscal 2011, $44,749,000 in Fiscal 2010 and $34,860,000 in Fiscal 2009.
Net Income Per Share
Basic net income per share is computed by dividing net income by the weighted average number of common shares outstanding during the period. Diluted net income per share is calculated in a similar manner, but includes the dilutive effect of stock options, which amounted to 185,000 shares in Fiscal 2011, 229,000 shares in Fiscal 2010 and 192,000 shares in Fiscal 2009. Options to purchase 291,000 shares in Fiscal 2011, 18,000 shares in Fiscal 2010 and 33,000 shares in Fiscal 2009 were not included in the calculation of diluted net income per share because these options were antidilutive.
Property, Plant and Equipment
Property, plant and equipment are recorded at cost. Additions, replacements and betterments are capitalized, while maintenance and repairs that do not extend the useful life of an asset are expensed as incurred. Depreciation is recorded using the straight-line method over estimated useful lives of 7 to 30 years for buildings and improvements, and 3 to 15 years for machinery and equipment. Leasehold improvements are amortized using the straight-line method over the shorter of the remaining lease term or the estimated useful life of the improvement. When assets are retired or otherwise disposed, the cost and accumulated depreciation are removed from the respective accounts and any related gain or loss is recognized.
23
NATIONAL BEVERAGE CORP. AND SUBSIDIARIES
Notes to Consolidated Financial Statements (continued)
Revenue Recognition
Revenue from product sales is recognized when title and risk of loss pass to the customer, which generally occurs upon delivery. Our policy is not to allow the return of products once they have been accepted by the customer. However, on occasion, we have accepted returns or issued credit to customers, primarily for damaged goods. The amounts have been immaterial and, accordingly, we do not provide a specific valuation allowance for sales returns.
Sales Incentives
We offer various sales incentive arrangements to our customers which require customer performance or achievement of certain sales volume targets. In those circumstances when the incentive is paid in advance, we amortize the amount paid over the period of benefit or contractual sales volume. When the incentive is paid in arrears, we accrue the expected amount to be paid over the period of benefit or expected sales volume. The recognition of these incentives involves the use of judgment related to performance and sales volume estimates that are made based on historical experience and other factors. Sales incentives are accounted for as a reduction of sales and actual amounts ultimately realized may vary from accrued amounts.
Segment Reporting
We operate as a single operating segment for purposes of presenting financial information and evaluating performance. As such, the accompanying consolidated financial statements present financial information in a format that is consistent with the internal financial information used by management. We do not accumulate revenues by product classification and, therefore, it is impractical to present such information.
Shipping and Handling Costs
Shipping and handling costs are reported in selling, general and administrative expenses in the accompanying statements of income. Such costs aggregated $45,071,000 in Fiscal 2011, $43,004,000 in Fiscal 2010 and $44,096,000 in Fiscal 2009. Although our classification is consistent with many beverage companies, our gross margin may not be comparable to companies that include shipping and handling costs in cost of sales.
Stock-Based Compensation
Compensation expense for stock-based compensation awards is recognized over the vesting period based on the grant-date fair value estimated using the Black-Scholes model. See Note 9.
Trade Receivables
We record trade receivables at net realizable value, which includes an appropriate allowance for doubtful accounts. We extend credit based on an evaluation of each customer’s financial condition, generally without requiring collateral. Exposure to credit losses varies by customer principally due to the financial condition of each customer. We monitor our exposure to credit losses and maintain allowances for anticipated losses based on specific customer circumstances, credit conditions and historical write-offs. Activity in the allowance for doubtful accounts was as follows:
24
NATIONAL BEVERAGE CORP. AND SUBSIDIARIES
Notes to Consolidated Financial Statements (continued)
| (In thousands) | ||||||||||||
|
Fiscal 2011
|
Fiscal 2010
|
Fiscal 2009
|
||||||||||
|
Balance at beginning of year
|
$ | 509 | $ | 445 | $ | 266 | ||||||
|
Net charge to expense
|
67 | 340 | 221 | |||||||||
|
Net charge-off
|
(124 | ) | (276 | ) | (42 | ) | ||||||
|
Balance at end of year
|
$ | 452 | $ | 509 | $ | 445 | ||||||
As of April 30, 2011 and May 1, 2010, we did not have any customer that comprised more than 10% of trade receivables. No one customer accounted for more than 10% of net sales during any of the last three fiscal years.
Use of Estimates
The preparation of financial statements in conformity with generally accepted accounting principles requires management to make estimates and assumptions that affect the amounts reported in the financial statements and accompanying notes. Although these estimates are based on management’s knowledge of current events and anticipated future actions, actual results may vary from reported amounts.
|
2.
|
PROPERTY, PLANT AND EQUIPMENT
|
Property, plant and equipment as of April 30, 2011 and May 1, 2010 consisted of the following:
| (In thousands) | ||||||||
|
2011
|
2010
|
|||||||
|
Land
|
$ | 9,779 | $ | 9,779 | ||||
|
Buildings and improvements
|
47,374 | 44,415 | ||||||
|
Machinery and equipment
|
132,709 | 128,029 | ||||||
|
Total
|
189,862 | 182,223 | ||||||
|
Less accumulated depreciation
|
(134,525 | ) | (128,822 | ) | ||||
|
Property, plant and equipment – net
|
$ | 55,337 | $ | 53,401 | ||||
Depreciation expense was $9,294,000 for Fiscal 2011, $10,263,000 for Fiscal 2010 and $9,456,000 for Fiscal 2009.
25
NATIONAL BEVERAGE CORP. AND SUBSIDIARIES
Notes to Consolidated Financial Statements (continued)
|
3.
|
ACCRUED LIABILITIES
|
Accrued liabilities as of April 30, 2011 and May 1, 2010 consisted of the following:
| (In thousands) | ||||||||
|
2011
|
2010
|
|||||||
|
Accrued compensation
|
$ | 9,862 | $ | 8,192 | ||||
|
Accrued promotions
|
7,130 | 7,324 | ||||||
|
Accrued insurance
|
2,078 | 2,388 | ||||||
|
Other
|
7,144 | 5,266 | ||||||
|
Total
|
$ | 26,214 | $ | 23,170 | ||||
|
4.
|
DEBT
|
At April 30, 2011, a subsidiary of the Company maintained a $50,000,000 unsecured revolving credit facility with a bank (the “Credit Facility”). The Credit Facility expires on April 30, 2013 and, currently, any borrowings would bear interest at .3% above LIBOR or, at our election, .5% below the bank’s reference rate. At April 30, 2011, $2,639,000 of the Credit Facility was used for standby letters of credit and $47,361,000 was available for borrowings.
The Credit Facility requires the subsidiary to maintain certain financial ratios, principally debt to net worth and debt to EBITDA (as defined in the loan agreement), and contains other restrictions, none of which are expected to have a material effect on our operations or financial position. At April 30, 2011, we were in compliance with all loan covenants and approximately $1,320,000 of retained earnings was restricted from distribution.
On July 8, 2011, the subsidiary entered into an additional $25,000,000 unsecured revolving credit facility with a bank which expires on July 8, 2013 and contains similar financial covenants.
|
5.
|
CAPITAL STOCK AND TRANSACTIONS WITH RELATED PARTIES
|
The Company paid special cash dividends of $106,314,000 ($2.30 per share) on February 14, 2011 and $62,295,000 ($1.35 per share) on January 22, 2010.
In January 1998, the Board of Directors authorized the purchase of up to 800,000 shares of National Beverage common stock, of which 502,060 shares have been purchased. There were no shares purchased during the three fiscal years ended April 30, 2011.
The Company is a party to a management agreement with Corporate Management Advisors, Inc. (“CMA”), a corporation owned by our Chairman and Chief Executive Officer. Under the terms of the agreement, CMA provides, subject to the direction and supervision of the Board of Directors of the Company, (i) senior corporate functions (including supervision of the Company’s financial, legal, executive recruitment, internal audit and management information systems departments) as well as the services of a Chief Executive Officer and Chief Financial Officer, and (ii) services in connection with acquisitions, dispositions and financings by the Company, including identifying and profiling acquisition candidates, negotiating and structuring potential transactions and arranging financing for any such transaction. CMA, through its personnel, also provides, to the extent possible, the stimulus and creativity to develop an innovative and dynamic persona for the Company, its products and corporate image. In order to fulfill its obligations under the management agreement, CMA employs numerous individuals, whom, acting as a unit, provide management, administrative and creative functions for the Company. The management agreement provides that the Company will pay CMA an annual base fee equal to one percent of the consolidated net sales of the Company, and further provides that the Compensation and Stock Option Committee and the Board of Directors may from time to time award additional incentive compensation to CMA. No incentive compensation has been paid from the inception of the agreement through Fiscal 2011. We incurred management fees to CMA of $6,002,000 for Fiscal 2011, $5,935,000 for Fiscal 2010 and $5,752,000 for Fiscal 2009. Included in accounts payable at April 30, 2011 and May 1, 2010 were amounts due CMA of $1,519,000 and $2,823,000, respectively.
26
NATIONAL BEVERAGE CORP. AND SUBSIDIARIES
Notes to Consolidated Financial Statements (continued)
6. DERIVATIVE FINANCIAL INSTRUMENTS
We have entered into various aluminum swap contracts to partially mitigate our exposure to changes in the cost of aluminum cans through April 2012. The financial instruments were designated and accounted for as a cash flow hedge. Accordingly, gains or losses attributable to the effective portion of the cash flow hedge are reported in Accumulated Other Comprehensive Income (“AOCI”) and reclassified into earnings through cost of sales in the period in which the hedged transaction affects earnings. The ineffective portion of the change in fair value of our cash flow hedge was immaterial. The following summarizes the gains (losses) recognized in the Consolidated Statements of Income and AOCI relative to the cash flow hedge for Fiscal 2011 and Fiscal 2010:
|
(In thousands)
|
||||||||
|
Fiscal
|
Fiscal
|
|||||||
|
2011
|
2010
|
|||||||
|
Recognized in AOCI-
|
||||||||
|
Gain before income taxes
|
$ | 3,650 | $ | 603 | ||||
|
Less income tax provision
|
1,299 | 214 | ||||||
|
Net
|
2,351 | 389 | ||||||
|
Reclassified from AOCI to cost of sales-
|
||||||||
|
(Loss) gain before income taxes
|
(617 | ) | 599 | |||||
|
Less income tax (benefit) provision
|
(220 | ) | 213 | |||||
|
Net
|
(397 | ) | 386 | |||||
|
Net change to AOCI
|
$ | 2,748 | $ | 3 | ||||
As of April 30, 2011, the notional amount of our outstanding aluminum swap contracts was $15,302,000 and, assuming no change in the commodity prices, $4,069,000 of unrealized net gain (before tax) will be reclassified from AOCI and recognized in earnings over the next twelve months. See Note 1.
As of April 30, 2011 and May 1, 2010, the fair value of derivative assets was $4,271,000 and $4,000, respectively, which was included in Prepaid and other assets. Such valuation does not entail a significant amount of judgment and the inputs that are significant to the fair value measurement are Level 2 in the fair value hierarchy as they are observable market based inputs or unobservable inputs that are corroborated by market data.
27
NATIONAL BEVERAGE CORP. AND SUBSIDIARIES
Notes to Consolidated Financial Statements (continued)
7. OTHER (EXPENSE) INCOME
Other (expense) income consisted of the following:
|
(In thousands)
|
||||||||||||
|
Fiscal
|
Fiscal
|
Fiscal
|
||||||||||
|
2011
|
2010
|
2009
|
||||||||||
|
Interest income
|
$ | 140 | $ | 229 | $ | 865 | ||||||
|
Gain on legal settlement
|
- | - | 728 | |||||||||
|
Loss on disposal of property, net
|
(82 | ) | (291 | ) | (363 | ) | ||||||
|
Other (expense), net
|
(78 | ) | (289 | ) | (263 | ) | ||||||
|
Total
|
$ | (20 | ) | $ | (351 | ) | $ | 967 | ||||
8. INCOME TAXES
The provision for income taxes consisted of the following:
|
(In thousands)
|
||||||||||||
|
Fiscal
|
Fiscal
|
Fiscal
|
||||||||||
|
2011
|
2010
|
2009
|
||||||||||
|
Current
|
$ | 22,590 | $ | 19,558 | $ | 14,529 | ||||||
|
Deferred
|
(694 | ) | (1,026 | ) | (474 | ) | ||||||
|
Total
|
$ | 21,896 | $ | 18,532 | $ | 14,055 | ||||||
Deferred taxes are recorded to give recognition to temporary differences between the tax bases of assets or liabilities and their reported amounts in the financial statements. Valuation allowances are established to reduce the carrying amounts of deferred tax assets when it is deemed, more likely than not, that the benefit of deferred tax assets will not be realized. Deferred tax assets and liabilities as of April 30, 2011 and May 1, 2010 consisted of the following:
| (In thousands) | ||||||||
|
2011
|
2010
|
|||||||
|
Deferred tax assets:
|
||||||||
|
Accrued expenses and other
|
$ | 4,893 | $ | 4,995 | ||||
|
Inventory and amortizable assets
|
497 | 490 | ||||||
|
Total deferred tax assets
|
5,390 | 5,485 | ||||||
|
Deferred tax liabilities:
|
||||||||
|
Property
|
16,889 | 17,704 | ||||||
|
Intangibles and other
|
1,556 | 11 | ||||||
|
Total deferred tax liabilities
|
18,445 | 17,715 | ||||||
|
Net deferred tax liabilities
|
$ | 13,055 | $ | 12,230 | ||||
|
Current deferred tax assets – net
|
$ | 1,493 | $ | 3,367 | ||||
|
Noncurrent deferred tax liabilities – net
|
$ | 14,548 | $ | 15,597 | ||||
28
NATIONAL BEVERAGE CORP. AND SUBSIDIARIES
Notes to Consolidated Financial Statements (continued)
The reconciliation of the statutory federal income tax rate to our effective tax rate is as follows:
|
Fiscal
|
Fiscal
|
Fiscal
|
||||||||||
|
2011
|
2010
|
2009
|
||||||||||
|
Statutory federal income tax rate
|
35.0 | % | 35.0 | % | 35.0 | % | ||||||
|
State income taxes, net of federal benefit
|
2.4 | 2.8 | 2.4 | |||||||||
|
Manufacturing deduction benefit
|
(3.0 | ) | (2.0 | ) | (2.0 | ) | ||||||
|
Other differences
|
.5 | .3 | .8 | |||||||||
|
Effective income tax rate
|
34.9 | % | 36.1 | % | 36.2 | % | ||||||
As of April 30, 2011, the gross amount of unrecognized tax benefits was $4,687,000, of which approximately $448,000 was recognized as tax expense in Fiscal 2011. If we were to prevail on all uncertain tax positions, the net effect would be to reduce our tax expense by approximately $3,700,000. A reconciliation of the changes in the gross amount of unrecognized tax benefits, which amounts are included in “Other liabilities” in the accompanying consolidated balance sheets, is as follows:
|
(In thousands)
|
||||||||||||
|
Fiscal
|
Fiscal
|
Fiscal
|
||||||||||
|
2011
|
2010
|
2009
|
||||||||||
|
Beginning balance
|
$ | 3,997 | $ | 3,662 | $ | 3,166 | ||||||
|
Increases due to current period tax positions
|
857 | 391 | 533 | |||||||||
|
Decreases due to lapse of statute of limitations
|
(167 | ) | (56 | ) | (37 | ) | ||||||
|
Ending balance
|
$ | 4,687 | $ | 3,997 | $ | 3,662 | ||||||
We recognize accrued interest and penalties related to unrecognized tax benefits in income tax expense. As of April 30, 2011, unrecognized tax benefits included accrued interest of $560,000, of which approximately $59,000 was recognized as tax expense in Fiscal 2011.
We file annual income tax returns in the United States and in various state and local jurisdictions. A number of years may elapse before an uncertain tax position, for which we have unrecognized tax benefits, is audited and finally resolved. While it is often difficult to predict the final outcome or the timing of resolution of any particular uncertain tax position, we believe that our unrecognized tax benefits reflect the most probable outcome. We adjust these unrecognized tax benefits, as well as the related interest, in light of changing facts and circumstances. The resolution of any particular uncertain tax position could require the use of cash and an adjustment to our provision for income taxes in the period of resolution. Federal income tax returns for fiscal years subsequent to 2006 are subject to examination. Generally, the income tax returns for the various state jurisdictions are subject to examination for fiscal years ending after fiscal 2006.
9. STOCK-BASED COMPENSATION
Our stock-based compensation program is a broad-based program designed to attract and retain employees while also aligning employees’ interests with the interests of the stockholders.
29
NATIONAL BEVERAGE CORP. AND SUBSIDIARIES
Notes to Consolidated Financial Statements (continued)
The 1991 Omnibus Incentive Plan (the “Omnibus Plan”) provides for compensatory awards consisting of (i) stock options or stock awards for up to 4,800,000 shares of common stock, (ii) stock appreciation rights, dividend equivalents, other stock-based awards in amounts up to 4,800,000 shares of common stock and (iii) performance awards consisting of any combination of the above. The Omnibus Plan is designed to provide an incentive to the officers (including those who are also directors) and certain other key employees and consultants by making available to them an opportunity to acquire a proprietary interest or to increase such interest in National Beverage. The number of shares or options which may be issued under stock-based awards to an individual is limited to 1,680,000 during any year. Awards may be granted for no cash consideration or such minimal cash consideration as may be required by law. Options generally vest over a five-year period and expire after ten years.
The Special Stock Option Plan provides for the issuance of stock options to purchase up to an aggregate of 1,800,000 shares of common stock. Options may be granted for such consideration as determined by the Board of Directors. The vesting schedule and exercise price of these options are tied to the recipient’s ownership level of Common Stock and the terms generally allow for the reduction in exercise price upon each vesting period. The Board of Directors also authorized the issuance of options to purchase up to 50,000 shares of common stock to be issued at the direction of the Chairman.
The Key Employee Equity Partnership Program (“KEEP Program”) provides for the granting of stock options to purchase up to 240,000 shares of common stock to key employees, consultants, directors and officers. Participants who purchase shares of stock in the open market receive grants of stock options equal to 50% of the number of shares purchased, up to a maximum of 6,000 shares in any two-year period. Options under the KEEP Program are automatically forfeited in the event of the sale of shares originally acquired by the participant. Options are granted at an initial exercise price of 60% of the purchase price paid for the shares acquired and the exercise price reduces to the stock par value at the end of the six-year vesting period.
We account for our employee stock options under the fair value method of accounting using a Black-Scholes valuation model to measure stock option expense at the date of grant. Generally, stock option grants have an exercise price equal to the fair market value of our common stock on the date of grant and have a 10-year term. The fair value of stock options is amortized to expense over the vesting period.
Stock options granted in Fiscal 2011 and Fiscal 2010 were 301,500 shares and 3,000 shares, respectively. There were no stock options or other stock-based awards granted in Fiscal 2009. The weighted average Black-Scholes fair value assumptions for stock options granted are as follows: weighted average expected life of 7.5 years for Fiscal 2011 and 8.0 years for Fiscal 2010; weighted average expected volatility of 48.6% for Fiscal 2011 and 52.2% for Fiscal 2010; weighted average risk free interest rates of 2.8% for Fiscal 2011 and 3.4% for Fiscal 2010; and expected dividend yield of 4.3% for Fiscal 2011 and 4% for Fiscal 2010. The expected life of stock options was estimated based on historical experience. The expected volatility was estimated based on historical stock prices for a period consistent with the expected life of stock options. The risk free interest rate was based on the U.S. Treasury constant maturity interest rate whose term is consistent with the expected life of stock options. Forfeitures were estimated based on historical experience.
30
NATIONAL BEVERAGE CORP. AND SUBSIDIARIES
Notes to Consolidated Financial Statements (continued)
The following is a summary of stock option activity for Fiscal 2011:
| Number of Shares | Price(a) | |||
|
Options outstanding, beginning of year
|
414,120
|
$ |
3.96
|
|
|
Granted
|
301,500
|
11.34
|
||
|
Exercised
|
(73,320)
|
2.86
|
||
|
Cancelled
|
(40,680)
|
7.30
|
||
|
Options outstanding, end of year
|
601,620
|
7.51
|
||
|
Options exercisable, end of year
|
230,517
|
3.88
|
_______________________________
(a) Weighted average exercise price.
Stock-based compensation expense was $446,000 for Fiscal 2011, $349,000 for Fiscal 2010 and $340,000 for Fiscal 2009. The total fair value of shares vested was $135,000 for Fiscal 2011, $402,000 for Fiscal 2010 and $304,000 for Fiscal 2009. The total intrinsic value for stock options exercised was $799,000 for Fiscal 2011, $1,498,000 for Fiscal 2010 and $217,000 for Fiscal 2009. Net cash proceeds from the exercise of stock options were $209,000 for Fiscal 2011, $266,000 for Fiscal 2010 and $245,000 for Fiscal 2009. Stock based income tax benefits aggregated $921,000 for Fiscal 2011, $384,000 for Fiscal 2010 and $60,000 for Fiscal 2009. The weighted average fair value for stock options granted was $6.35 for Fiscal 2011 and $7.43 for Fiscal 2010.
As of April 30, 2011, unrecognized compensation expense related to the unvested portion of our stock options was $1,834,000, which is expected to be recognized over a weighted average period of 4.7 years. The weighted average remaining contractual term and the aggregate intrinsic value for options outstanding as of April 30, 2011 was 4.9 years and $3,854,000, respectively. The weighted average remaining contractual term and the aggregate intrinsic value for options exercisable as of April 30, 2011 was 3.6 years and $2,314,000, respectively.
We have a stock purchase plan which provides for the purchase of up to 1,536,000 shares of common stock by employees who (i) have been employed for at least two years, (ii) are not part-time employees and (iii) are not owners of five percent or more of National Beverage common stock. As of April 30, 2011, no shares have been issued under the plan.
10. COMMITMENTS AND CONTINGENCIES
We lease buildings, machinery and equipment under various non-cancelable operating lease agreements expiring at various dates through 2020. Certain of these leases contain scheduled rent increases and/or renewal options. Contractual rent increases are taken into account when calculating the minimum lease payment and recognized on a straight-line basis over the lease term. Rent expense under operating lease agreements totaled approximately $9,952,000 for Fiscal 2011, $8,920,000 for Fiscal 2010 and $7,679,000 for Fiscal 2009.
31
NATIONAL BEVERAGE CORP. AND SUBSIDIARIES
Notes to Consolidated Financial Statements (continued)
Our minimum lease payments under non-cancelable operating leases as of April 30, 2011 were as follows:
|
(In thousands)
|
||||
|
Fiscal 2012
|
$ | 4,842 | ||
|
Fiscal 2013
|
2,911 | |||
|
Fiscal 2014
|
2,035 | |||
|
Fiscal 2015
|
1,807 | |||
|
Fiscal 2016
|
1,569 | |||
|
Thereafter
|
4,038 | |||
|
Total minimum lease payments
|
$ | 17,202 | ||
We have guaranteed the residual value of certain leased equipment in the amount of $11,300,000. If the proceeds from sale of such equipment are less than the balance required by the lease when the lease terminates in July 2012, the Company shall be required to pay the difference up to such guaranteed amount.
The Company contributes to certain pension plans under collective bargaining agreements based on hours worked and to a discretionary profit sharing plan. Contributions were $2,534,000 for Fiscal 2011, $2,309,000 for Fiscal 2010 and $2,304,000 for Fiscal 2009.
We enter into various agreements with suppliers for the purchase of raw materials, the terms of which may include variable or fixed pricing and minimum purchase quantities. As of April 30, 2011, we had purchase commitments for raw materials of $49,874,000 for Fiscal 2012 and $27,697,000 for Fiscal 2013.
From time to time, we are a party to various litigation matters arising in the ordinary course of business. We do not expect the ultimate disposition of such matters to have a material adverse effect on our consolidated financial position or results of operations.
32
NATIONAL BEVERAGE CORP. AND SUBSIDIARIES
Notes to Consolidated Financial Statements (continued)
11. QUARTERLY FINANCIAL DATA (UNAUDITED)
|
(In thousands, except per share amounts)
|
||||||||||||||||
|
First Quarter
|
Second Quarter
|
Third Quarter
|
Fourth Quarter
|
|||||||||||||
|
Fiscal 2011
|
||||||||||||||||
|
Net sales
|
$ | 165,030 | $ | 151,127 | $ | 131,926 | $ | 152,110 | ||||||||
|
Gross profit
|
58,488 | 56,355 | 49,530 | 54,281 | ||||||||||||
|
Net income
|
12,053 | 10,207 | 7,407 | 11,087 | ||||||||||||
|
Net income per share – basic
|
$ | .26 | $ | .22 | $ | .16 | $ | .24 | ||||||||
|
Net income per share – diluted
|
$ | .26 | $ | .22 | $ | .16 | $ | .24 | ||||||||
|
Fiscal 2010
|
||||||||||||||||
|
Net sales
|
$ | 162,831 | $ | 149,571 | $ | 131,462 | $ | 149,601 | ||||||||
|
Gross profit
|
50,523 | 50,797 | 42,740 | 52,955 | ||||||||||||
|
Net income
|
9,793 | 8,324 | 5,525 | 9,211 | ||||||||||||
|
Net income per share – basic
|
$ | .21 | $ | .18 | $ | .12 | $ | .20 | ||||||||
|
Net income per share – diluted
|
$ | .21 | $ | .18 | $ | .12 | $ | .20 | ||||||||
33
REPORT OF INDEPENDENT REGISTERED PUBLIC ACCOUNTING FIRM
To the Board of Directors and Shareholders of
National Beverage Corp.
We have audited the accompanying consolidated balance sheets of National Beverage Corp. as of April 30, 2011 and May 1, 2010 and the related consolidated statements of income, shareholders' equity and cash flows for each of the years in the three-year period ended April 30, 2011. We also have audited National Beverage Corp.’s internal control over financial reporting as of April 30, 2011, based on criteria established in Internal Control — Integrated Framework issued by the Committee of Sponsoring Organizations of the Treadway Commission (COSO). National Beverage Corp.’s management is responsible for these financial statements, for maintaining effective internal control over financial reporting and for its assessment of the effectiveness of internal control over financial reporting included in the accompanying Management’s Report on Internal Control over Financial Reporting. Our responsibility is to express an opinion on these financial statements and an opinion on the Company's internal control over financial reporting based on our audits.
We conducted our audits in accordance with the standards of the Public Company Accounting Oversight Board (United States). Those standards require that we plan and perform the audits to obtain reasonable assurance about whether the financial statements are free of material misstatement and whether effective internal control over financial reporting was maintained in all material respects. Our audits of the financial statements included examining, on a test basis, evidence supporting the amounts and disclosures in the financial statements, assessing the accounting principles used and significant estimates made by management and evaluating the overall financial statement presentation. Our audit of internal control over financial reporting included obtaining an understanding of internal control over financial reporting, assessing the risk that a material weakness exists and testing and evaluating the design and operating effectiveness of internal control based on the assessed risk. Our audits also included performing such other procedures as we considered necessary in the circumstances. We believe that our audits provide a reasonable basis for our opinions.
A company's internal control over financial reporting is a process designed to provide reasonable assurance regarding the reliability of financial reporting and the preparation of financial statements for external purposes in accordance with generally accepted accounting principles. A company's internal control over financial reporting includes those policies and procedures that (1) pertain to the maintenance of records that, in reasonable detail, accurately and fairly reflect the transactions and dispositions of the assets of the company; (2) provide reasonable assurance that transactions are recorded as necessary to permit preparation of financial statements in accordance with generally accepted accounting principles and that receipts and expenditures of the company are being made only in accordance with authorizations of management and directors of the company; and (3) provide reasonable assurance regarding prevention or timely detection of unauthorized acquisition, use, or disposition of the company's assets that could have a material effect on the financial statements.
Because of its inherent limitations, internal control over financial reporting may not prevent or detect misstatements. Also, projections of any evaluation of effectiveness to future periods are subject to the risk that controls may become inadequate because of changes in conditions, or that the degree of compliance with the policies or procedures may deteriorate.
34
In our opinion, the financial statements referred to above present fairly, in all material respects, the financial position of National Beverage Corp. as of April 30, 2011 and May 1, 2010 and the results of its operations and its cash flows for each of the years in the three-year period ended April 30, 2011, in conformity with accounting principles generally accepted in the United States of America. Also in our opinion, National Beverage Corp. maintained, in all material respects, effective internal control over financial reporting as of April 30, 2011, based on criteria established in Internal Control—Integrated Framework issued by the Committee of Sponsoring Organizations of the Treadway Commission (COSO).
/s/ McGladrey & Pullen, LLP
Fort Lauderdale, Florida
July 14, 2011
35
ITEM 9. CHANGES IN AND DISAGREEMENTS WITH ACCOUNTANTS ON ACCOUNTING AND FINANCIAL DISCLOSURE
Not applicable.
ITEM 9A. CONTROLS AND PROCEDURES
Disclosure Controls and Procedures
As of the end of the period covered by this report, we carried out an evaluation, under the supervision and with the participation of the Company’s management, including our Chief Executive Officer and Principal Financial Officer, of the effectiveness of the design and operation of our “disclosure controls and procedures” (as defined in Rule 13a-15(e) of the Securities Exchange Act of 1934, as amended (the “Exchange Act”)). Based upon that evaluation, the Chief Executive Officer and Principal Financial Officer concluded that our disclosure controls and procedures were effective to ensure information required to be disclosed by us in reports we file or submit under the Exchange Act is (1) recorded, processed, summarized and reported within the time periods specified in SEC rules and forms and (2) accumulated and communicated to our management, including our Chief Executive Officer and Principal Financial Officer, to allow timely decisions regarding required disclosure.
Report on Internal Control over Financial Reporting
Our management is responsible for establishing and maintaining adequate internal control over financial reporting, as such term is defined in Rule 13a-15(f) of the Exchange Act. Under the supervision and with the participation of our management, including our Chief Executive Officer and Principal Financial Officer, we conducted an evaluation of the effectiveness of our internal control over financial reporting based on the framework in Internal Control – Integrated Framework issued by the Committee of Sponsoring Organizations of the Treadway Commission. Based on that evaluation, our management concluded that our internal control over financial reporting is effective as of April 30, 2011.
Management recognizes that there are inherent limitations in the effectiveness of any internal control over financial reporting, including the possibility of human error and the circumvention or overriding of internal control. Accordingly, even effective internal control over financial reporting can provide only reasonable assurance with respect to financial statement preparation. Further, because of changes in conditions, the effectiveness of internal control may vary over time.
McGladrey & Pullen, LLP, an independent registered public accounting firm, has audited the consolidated financial statements included in this Annual Report on Form 10-K and, as part of their audit, has issued their report, included herein, on the effectiveness of our internal control over financial reporting.
Changes in Internal Controls over Financial Reporting
There were no changes in our internal control over financial reporting during the quarter ended April 30, 2011 that have materially affected, or are reasonably likely to materially affect, our internal control over financial reporting.
36
|
ITEM 9B.
|
OTHER INFORMATION
|
Not applicable.
PART III
|
ITEM 10.
|
DIRECTORS, EXECUTIVE OFFICERS AND CORPORATE GOVERNANCE
|
The information required by Item 10 will be included under the captions “Election of Directors”, “Information as to Nominees and Other Directors”, “Information Regarding Meetings and Committees of the Board” and “Section 16(a) Beneficial Ownership Reporting Compliance” in the Company’s 2011 Proxy Statement and is incorporated herein by reference.
The following table sets forth certain information with respect to the officers of the Registrant as of April 30, 2011.
| Name | Age | Position with Company | ||
| Nick A. Caporella(1) | 75 | Chairman of the Board and Chief Executive Officer | ||
| Joseph G. Caporella(2) | 51 | President | ||
| Edward F. Knecht(3) | 76 | Executive Vice President - Procurement | ||
| George R. Bracken(4) | 66 | Senior Vice President – Finance | ||
| Dean A. McCoy(5) | 54 | Senior Vice President and Chief Accounting Officer |
_______________________________
|
(1)
|
Mr. Nick A. Caporella has served as Chairman of the Board, Chief Executive Officer and Director since the Company’s inception in 1985. Also, he serves as Chairman of the Nominating Committee. Since 1992, Mr. Caporella’s services have been provided to the Company by Corporate Management Advisors, Inc., a company which he owns.
|
|
(2)
|
Mr. Joseph G. Caporella has served as President since September 2002 and, prior to that, as Executive Vice President and Secretary since January 1991. Also, he has served as a Director since January 1987. Joseph G. Caporella is the son of Nick A. Caporella.
|
|
(3)
|
Mr. Edward F. Knecht was named Executive Vice President – Procurement in August 2005 and, prior to that date, served as President of Shasta Sweetener Corp., a wholly-owned subsidiary of the Company, since May 1998. Mr. Knecht retired on May 11, 2011.
|
|
(4)
|
Mr. George R. Bracken was named Senior Vice President - Finance in October 2000 and, prior to that date, served as Vice President and Treasurer since October 1996. Since 1992, Mr. Bracken’s services have been provided to the Company by Corporate Management Advisors, Inc.
|
|
(5)
|
Mr. Dean A. McCoy was named Senior Vice President and Chief Accounting Officer in October 2003 and, prior to that date, served as Senior Vice President - Controller since October 2000. Prior to October 2000, he served as Vice President - Controller since July 1993.
|
All officers serve until their successors are chosen and may be removed at any time by the Board of Directors. Officers are normally appointed each year at the first meeting of the Board of Directors after the annual meeting of shareholders.
37
|
ITEM 11.
|
EXECUTIVE COMPENSATION
|
The information required by Item 11 will be included under the captions “Executive Compensation and Other Information” and “Compensation Committee Interlocks and Insider Participation” in the Company’s 2011 Proxy Statement and is incorporated herein by reference.
|
ITEM 12.
|
SECURITY OWNERSHIP OF CERTAIN BENEFICIAL OWNERS AND MANAGEMENT AND RELATED STOCKHOLDER MATTERS
|
The information required by Item 12 will be included under the captions “Security Ownership” and “Equity Compensation Plan Information” in the Company’s 2011 Proxy Statement and is incorporated herein by reference.
|
ITEM 13.
|
CERTAIN RELATIONSHIPS AND RELATED TRANSACTIONS AND DIRECTOR INDEPENDENCE
|
The information required by Item 13 will be included under the captions “Certain Relationships and Related Party Transactions” and “Information Regarding Meetings and Committees of the Board” in the Company’s 2011 Proxy Statement and is incorporated herein by reference.
|
ITEM 14.
|
PRINCIPAL ACCOUNTANT FEES AND SERVICES
|
The information required by Item 14 will be included under the caption “Independent Auditors” in the Company’s 2011 Proxy Statement and is incorporated herein by reference.
PART IV
ITEM 15. EXHIBITS AND FINANCIAL STATEMENT SCHEDULES
|
(a)
|
The following documents are filed as part of this report:
|
Page | ||
|
1.
|
Financial Statements
|
|||
|
Consolidated Balance Sheets
|
18 | |||
|
Consolidated Statements of Income
|
19
|
|||
|
Consolidated Statements of Shareholders’ Equity
|
20
|
|||
|
Consolidated Statements of Cash Flows
|
21
|
|||
|
Notes to Consolidated Financial Statements
|
22
|
|||
|
Report of Independent Registered Public Accounting Firm
|
34 | |||
|
2.
|
Financial Statement Schedules
|
|||
|
Not applicable
|
||||
|
3.
|
Exhibits
|
|||
|
See Exhibit Index which follows.
|
||||
38
SIGNATURES
Pursuant to the requirements of Section 13 or 15(d) of the Securities Exchange Act of 1934, the Registrant has duly caused this report to be signed on its behalf by the undersigned, thereunto duly authorized.
|
NATIONAL BEVERAGE CORP.
|
|||
| Date: July 14, 2011 |
By:
|
/s/ Dean A. McCoy | |
| Dean A. McCoy | |||
| Senior Vice President and | |||
| Chief Accounting Officer | |||
Pursuant to the requirements of the Securities Exchange Act of 1934, this report has been signed below by the following persons on behalf of the Registrant and in the capacities indicated on July 14, 2011.
|
/s/ Nick A. Caporella
|
/s/ Cecil D. Conlee
|
|||
|
Nick A. Caporella
|
Cecil D. Conlee
|
|||
|
Chairman of the Board and
|
Director
|
|||
| Chief Executive Officer |
|
/s/ Joseph G. Caporella
|
/s/ Samuel C. Hathorn, Jr.
|
|||
|
Joseph G. Caporella
|
Samuel C. Hathorn, Jr.
|
|||
| President and Director |
Director
|
|||
|
/s/ George R. Bracken
|
/s/ Joseph P. Klock, Jr.
|
|||
|
George R. Bracken
|
Joseph P. Klock, Jr.
|
|||
| Senior Vice President – Finance |
Director
|
|||
|
(Principal Financial Officer)
|
|
/s/ Dean A. McCoy
|
/s/ Stanley M. Sheridan
|
|||
|
Dean A. McCoy
|
Stanley M. Sheridan
|
|||
| Senior Vice President and |
Director
|
|||
|
Chief Accounting Officer
|
39
|
Exhibit No.
|
Description
|
|
3.1
|
Restated Certificate of Incorporation(1)
|
|
3.2
|
Amended and Restated By-Laws(1)
|
|
10.1
|
Management Agreement between the Company and Corporate Management Advisors, Inc.(2) *
|
|
10.2
|
National Beverage Corp. Investment and Profit Sharing Plan(1) *
|
|
10.3
|
National Beverage Corp. 1991 Omnibus Incentive Plan(2) *
|
|
10.4
|
National Beverage Corp. 1991 Stock Purchase Plan(2) *
|
|
10.5
|
Amendment No. 1 to the National Beverage Corp. Omnibus Incentive Plan(3) *
|
|
10.6
|
National Beverage Corp. Special Stock Option Plan(4) *
|
|
10.7
|
Amendment No. 2 to the National Beverage Corp. Omnibus Incentive Plan (5) *
|
|
10.8
|
National Beverage Corp. Key Employee Equity Partnership Program(5) *
|
|
10.9
|
Second Amended and Restated Credit Agreement, dated June 30, 2008, between NewBevCo, Inc. and lender therein(6)
|
|
10.10
|
Amendment to National Beverage Corp. Special Stock Option Plan(7) *
|
|
10.11
|
Amendment to National Beverage Corp. Key Employee Equity Partnership Program(7) *
|
|
10.12
|
Credit Agreement, dated July 8, 2011, between NewBevCo, Inc. and lender therein(8)
|
|
21.1
|
Subsidiaries of Registrant(8)
|
|
23.1
|
Consent of Independent Registered Public Accounting Firm(8)
|
|
31.1
|
Certification of Chief Executive Officer pursuant to Section 302 of the Sarbanes-Oxley Act of 2002(8)
|
|
31.2
|
Certification of Principal Financial Officer pursuant to Section 302 of the Sarbanes-Oxley Act of 2002(8)
|
40
EXHIBIT INDEX
(continued)
|
Exhibit No.
|
Description
|
|
32.1
|
Certification of Chief Executive Officer pursuant to Section 906 of the Sarbanes-Oxley Act of 2002(8)
|
|
32.2
|
Certification of Principal Financial Officer pursuant to Section 906 of the Sarbanes-Oxley Act of 2002(8)
|
_________________________________
|
*
|
Indicates management contract or compensatory plan or arrangement.
|
|
(1)
|
Previously filed with the Securities and Exchange Commission as an exhibit to the Form S-1 Registration Statement (File No. 33-38986) on February 19, 1991 and is incorporated herein by reference.
|
|
(2)
|
Previously filed with the Securities and Exchange Commission as an exhibit to Amendment No. 1 to Form S-1 Registration Statement (File No. 33-38986) on July 26, 1991 and is incorporated herein by reference.
|
|
(3)
|
Previously filed with the Securities and Exchange Commission as an exhibit to Annual Report on Form 10-K for the fiscal year ended April 27, 1996 and is incorporated herein by reference.
|
|
(4)
|
Previously filed with the Securities and Exchange Commission as an exhibit to Registration Statement on Form S-8 (File No. 33-95308) on August 1, 1995 and is incorporated herein by reference.
|
|
(5)
|
Previously filed with the Securities and Exchange Commission as an exhibit to Annual Report on Form 10-K for the fiscal year ended May 3, 1997 and is incorporated herein by reference.
|
|
(6)
|
Previously filed with the Securities and Exchange Commission as an exhibit to Quarterly Report on Form 10-Q for the fiscal period ended January 29, 2011 and is incorporated herein by reference.
|
|
(7)
|
Previously filed with the Securities and Exchange Commission as an exhibit to Quarterly Report on Form 10-Q for the fiscal period ended January 31, 2009 and is incorporated herein by reference.
|
|
(8)
|
Filed herewith.
|
41