Attached files
| file | filename |
|---|---|
| EX-99.1 - TRANSCRIPT OF ALCOA INC. SECOND QUARTER 2011 EARNINGS CALL - Howmet Aerospace Inc. | dex991.htm |
| 8-K - FORM 8-K - Howmet Aerospace Inc. | d8k.htm |
 2
Quarter
2011
Earnings
Conference
July 11, 2011
Exhibit 99.2
nd |
 2
Cautionary Statement
rationale
for
the
use
of
the
non-GAAP
financial
measures
can
be
found
in
the
Appendix
to
this
presentation
and
on
our
website
at
www.alcoa.com
under the “Invest”
section. Any reference during the discussion today to EBITDA means adjusted
EBITDA, for which we have provided calculations and reconciliations in the
Appendix and on our website. Forward-Looking Statements
This presentation contains statements that relate to future events and expectations and as such
constitute forward-looking statements within the meaning of the Private Securities
Litigation Reform Act of 1995. Forward-looking statements include those containing such words as “estimates,”
“expects,” “forecasts,” “intends,” “outlook,”
“plans,” “projects,” “should,” “targets,” “will,” or other words of similar meaning. All statements that
reflect Alcoa’s expectations, assumptions, or projections about the future other than statements
of historical fact are forward-looking statements, including, without limitation, forecasts
concerning global demand for aluminum, aluminum end-market growth, aluminum consumption rates, or
other trend projections, targeted financial results or operating performance, and statements about
Alcoa’s strategies, targets, outlook, and business and financial prospects.
Forward-looking statements are subject to a number of known and unknown risks, uncertainties, and other
factors and are not guarantees of future performance. Important factors that could cause actual
results to differ materially from those in the forward-looking statements include: (a)
material adverse changes in aluminum industry conditions, including global supply and demand conditions
and fluctuations in London Metal Exchange-based prices for primary aluminum, alumina, and other
products, and fluctuations in indexed-based and spot prices for alumina; (b) unfavorable
changes in general business and economic conditions, in the global financial markets, or in the
markets served by Alcoa, including automotive and commercial transportation, aerospace, building and
construction, distribution, packaging, oil and gas, defense, and industrial gas turbine; (c)
the impact of changes in foreign currency exchange rates on costs and results, particularly the
Australian dollar, Brazilian real, Canadian dollar, Euro, and Norwegian Kroner; (d) increases in
energy costs, including electricity, natural gas, and fuel oil, or the unavailability or
interruption of energy supplies; (e) increases in the costs of other raw materials, including caustic soda and carbon
products; (f) Alcoa’s inability to achieve the level of revenue growth, cash generation, cost
savings, improvement in profitability and margins, fiscal discipline, or strengthening of
operations (including moving its alumina refining and aluminum smelting businesses down on the industry cost
curve and increasing revenues in its Flat-Rolled Products and Engineered Products and Solutions
segments), anticipated from its productivity improvement, cash sustainability and other
initiatives; (g) Alcoa’s inability to realize expected benefits from newly constructed, expanded or
acquired facilities or from international joint ventures as planned and by targeted completion dates,
including the joint venture in Saudi Arabia or the upstream operations in Brazil; (h)
political, economic, and regulatory risks in the countries in which Alcoa operates or sells products, including
unfavorable changes in laws and governmental policies, civil unrest, or other events beyond
Alcoa’s control; (i) the outcome of contingencies, including legal proceedings, government
investigations, and environmental remediation; (j) the business or financial condition of key customers,
suppliers, and business partners; (k) changes in tax rates or benefits; and (l) the other risk factors
summarized in Alcoa’s Form 10-K for the year ended December 31, 2010, Form 10-Q
for the quarter ended March 31, 2011, and other reports filed with the Securities and Exchange
Commission (SEC). Alcoa disclaims any obligation to update publicly any forward-looking
statements, whether in response to new information, future events or otherwise, except as
required by applicable law.
Non-GAAP Financial Measures
Some of the information included in this presentation is derived from Alcoa’s consolidated
financial information but is not presented in Alcoa’s financial statements prepared in
accordance with U.S. generally accepted accounting principles (GAAP). Certain of these data are considered
“non-GAAP financial measures” under SEC rules. These non-GAAP financial
measures supplement our GAAP disclosures and should not be considered an alternative to the
GAAP measure. Reconciliations to the most directly comparable GAAP financial measures and management’s
|
 Chuck McLane
Executive Vice President and Chief Financial Officer
|
 Q2
2011 – Giving A Success Story Its Due
4
$ Millions (except per share and /MT amounts)
2Q’10
1Q’11
2Q’11
YOY
Change
Sequential
Change
Alumina
3
Party
Sales
$701
$810
$926
32%
14%
ATOI
$94
$142
$186
98%
31%
Adjusted EBITDA/MT
$61
$71
$81
33%
14%
Primary Metals
3
Party
Sales
$1,710
$1,980
$2,145
25%
8%
ATOI
$109
$202
$201
84%
0%
Adjusted EBITDA/MT
$280
$438
$422
51%
-4%
Flat-Rolled Products
3
Party
Sales
$1,574
$1,892
$2,085
32%
10%
ATOI
$71
$81
$99
41%
23%
Adjusted EBITDA/MT
$361
$368
$393
9%
7%
Engineered Products & Solutions
3
Party
Sales
$1,122
$1,247
$1,370
22%
10%
ATOI
$107
$130
$149
39%
15%
Adjusted EBITDA Margin
17%
18%
19%
10%
3%
Consolidated Alcoa Inc.
Sales
$5,187
$5,958
$6,585
27%
11%
Income from Continuing Operations*
$139
$317
$364
162%
15%
Earnings per Share*
$0.13
$0.28
$0.32
146%
14%
Record
Record
*Excluding impact of restructuring and other special items
See appendix for reconciliations to GAAP and additional information
Record
Record
rd
rd
rd
rd |
 2 Quarter 2011 Financial Highlights
Income
from
Continuing
Operations
of
$326
million,
or
$0.28
per
share;
Excluding impact of restructuring and other special items, income from continuing
operations
of
$364
million,
or
$0.32
per
share,
up
14%
sequentially
and
up
146%
from second quarter 2010
Revenue
up
11%
sequentially
and
up
27%
versus
second
quarter
2010
Adjusted
EBITDA
of
$1.0
billion,
up
9%
sequentially
and
up
44%
from
second
quarter 2010
Alumina: $81 Adjusted EBITDA/MT, 23% better than ten-year
average of $66/MT Primary Metals: $422 Adjusted EBITDA/MT, 8%
better than ten-year average of $390/MT
Flat-Rolled Products: $393 Adjusted EBITDA/MT was record
result Engineered Products & Solutions: 19% Adjusted EBITDA
margin was record result Days Working
Capital
six
days
lower
than
second
quarter
2010
Debt
to
Capital
of
32.6%,
100
basis
points
lower
sequentially
Net debt balance reduced by $319 million, extended debt maturity
profile
5
See appendix for reconciliations to GAAP and additional information
nd |
 Income Statement Summary
$ Millions (except per share amounts)
2Q’10
1Q’11
2Q’11
YOY
Change
Sequential
Change
Sales
$5,187
$5,958
$6,585
$1,398
$627
Cost of Goods Sold
$4,210
$4,715
$5,247
$1,037
$532
COGS % Sales
81.2%
79.1%
79.7%
(1.5 % pts.)
0.6 % pts.
Selling, General Administrative, Other
$208
$245
$253
$45
$8
SGA % Sales
4.0%
4.1%
3.8%
(0.2 % pts.)
(0.3 % pts.)
Restructuring and Other Charges
$30
$6
$34
$4
$28
Effective Tax Rate
25.0%
27.3%
26.3%
1.3
% pts.
(1.0 % pts.)
Income from Continuing Operations
$137
$309
$326
$189
$17
Income Per Diluted Share
$0.13
$0.27
$0.28
$0.15
$0.01
6 |
 Restructuring and Other Special Items
$ Millions (except per share amounts)
2Q’10
1Q’11
2Q’11
Income from Continuing Operations
$137
$309
$326
Income Per Diluted Share
$0.13
$0.27
$0.28
Restructuring Related
($20)
($5)
($16)
Acquisition costs
-
($8)
-
Discrete Tax Items
$16
-
-
Mark-to-Market Derivatives
$22
$5
$10
Labor Negotiations
($13)
-
-
Debt Tender Offer
-
-
($32)
Rockdale Luminant Litigation
($7)
-
-
Special Items
($2)
($8)
($38)
Income from Continuing Operations excl Special Items
$139
$317
$364
Income per Diluted Share excluding Special Items
$0.13
$0.28
$0.32
7
See appendix for reconciliations to GAAP and additional information
|
 2
nd
Quarter
2011
vs.
1
st
Quarter
2011
Earnings
Bridge
Income from Continuing Operations excluding Restructuring & Other Special Items ($ millions) 8
Income from Continuing Operations excluding Restructuring & Other Special Items ($ millions) +$32
+$87
-$72
See appendix for reconciliations to GAAP and additional information
$317
$72
$40
$41
$20
$26
$15
$43
$14
$364
1Q11
LME
Currency
Volume
Restarts
Productivity
Energy
Raw
Materials
Other
2Q11 |
 2Q
10 1Q 11
2Q 11
Production (kmt)
3,890
4,024
4,144
3
rd
Party Shipments (kmt)
2,264
2,206
2,378
3
rd
Party Revenue ($ Millions)
701
810
926
ATOI ($ Millions)
94
142
186
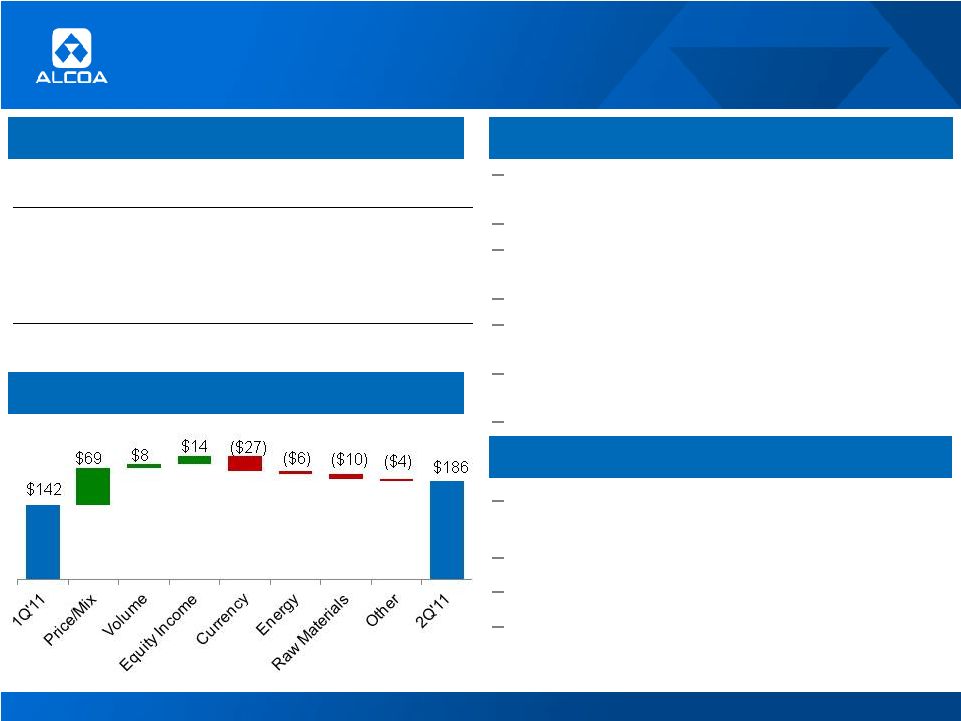
Alumina Segment Results and Outlook
2
nd
Quarter Results
3
rd
Quarter Outlook
2
nd
Quarter Business Highlights
9
Record
quarterly
production,
shipments
and
revenues
Realized third-party
alumina price up 7%
Continued
improvement
in
Adjusted
EBITDA/MT,
reaching $81
Highest
ATOI
since Q3 2008
Days
working
capital
down
10
days
from
Q2
2010
Negative
currency
impact
of
$27
million
primarily
driven by Australian dollar
Higher
fuel
oil
and
caustic
prices
20%
of
3
rd
party
shipments
on
spot
or
prior-
month indexed basis
Other
pricing
to
follow
two-month
lag
on
LME
Production
projected
to
increase
85
kmt
Energy, caustic
and other raw materials inflation
to persist
2
nd
Quarter Performance Bridge
$ Millions
See appendix for reconciliations to GAAP and additional information
|
 10
Alumina
Segment
Cost
Structure
and
Sensitivity
Refining Cost Structure
1
CMAI
-
Caustic
Soda
Average
Acquisition
-
FOB
USGC
($/D)
2
Bloomberg Daily Average -
Gulf Coast 3% Sulfur Fuel Oil ($/bbl)
3
NYMEX ($/mm BTU)
4
Natural gas information corresponds to Point Comfort, as Australia is priced on a
rolling 16 quarter average LME Cash
Caustic Soda Index
1
Index Prices
Aluminum $ / MT
Fuel
Oil
Index
2
Natural
Gas
3
Inventory
flow
Input Cost
Pricing
convention
Annual ATOI
Sensitivity
Fuel oil
1 –
2 months
Prior month
$4m per
$1/bbl
Natural gas
N/A
Spot
4
$16m per
$1/GJ
4
Caustic
soda
3 -
6 months
Spot & semi-
annual
$9m per
$10/DMT |
 2Q 10
1Q 11
2Q 11
Production (kmt)
893
904
945
3
rd
Party Shipments (kmt)
699
698
724
3
rd
Party Revenue ($ Millions)
1,710
1,980
2,145
3
rd
Party Price ($/MT)
2,309
2,682
2,830
ATOI ($ Millions)
109
202
201
Primary Metals
2
nd
Quarter Results
2
nd
Quarter Business Highlights
3rd Quarter Outlook
11
Production
up
5%
driven
by
U.S.
restarts
Realized
pricing
up
6%
sequentially
Adjusted
EBITDA/MT
of
$422,
$32
better
than
10
-year average
Days
working
capital
down
4
days
from
Q2
2010
Productivity
benefits continue
Restarts
at
U.S.
locations
turn
profitable
Negative
currency
impact
in
regions
outside
U.S.
Higher
raw
material
costs
Structural
increase
in
European
energy
costs
Pricing
to
follow
15-day
lag
to
LME
30
kmt
higher
production
volume
led
by
U.S.
region
Continued
productivity
benefits
as
the
U.S.
restarts deliver full quarter benefit
Coke
and
pitch
inflation
to
persist
$33
million
additional
energy
costs
largely
due
to structural increase in European energy
2nd Quarter Performance Bridge
$ Millions
See appendix for reconciliations to GAAP and additional information
|
 12
Smelting Cost Structure
1
PACE -
CPC USGC (PACE MidPoint
2
Platts Alumina Index
3
Pitch –
Pace Coal Tar Pitch (Liquid) Mid-Point
LME Cash
Index Prices
Aluminum $ / MT
CPC Index
1
Alumina Index
2
Liquid Pitch Index
3
Input
Cost
Inventory
flow
Pricing
convention
Annual
ATOI
Sensitivity
Coke
1 -
2 months
Spot, quarterly &
semi-annual
$9m per
$10/MT
Pitch
$2.5m per
$10/MT
1 -
2 months
Spot, quarterly &
semi-annual
Primary Metals Segment Cost Structure and Sensitivity
|
 13
3 Quarter Outlook
2 Quarter Business Highlights
2 Quarter Results
ATOI $ Millions
2Q 10
1Q 11
2Q 11
Flat-Rolled Products,
excl Russia, China & Other
71
84
86
Russia, China & Other
0
(3)
13
Total ATOI
71
81
99
Record
ATOI,
Adjusted
EBITDA
and
adjusted
EBITDA/MT,
led
by
volume
increases
Significant improvements in Russia and China
on top-line, bottom-line and productivity
Days
working
capital
down
1
day
from
Q2
2010
Progress toward 2013 $2.5 billion incremental
revenue target, 45 to 60% during 2011
Continued
productivity
improvements
Seasonal demand and strong end markets
Aero
and
commercial
transportation
demand
remains
strong
Additional
productivity
gains
expected
Seasonal impact
from
summer
plant
shutdowns,
with volume impact similar to prior years
Russia
demand
to
remain
strong,
however
China
demand
growth
slowing
2 Quarter Performance Bridge
$ Millions
Flat-Rolled Products
See appendix for reconciliations to GAAP and additional information
nd
nd
nd
rd |
 $
Millions 2Q 10
1Q 11
2Q 11
3 Party Revenue
1,122
1,247
1,370
ATOI
107
130
149
Adjusted EBITDA Margin
17%
18%
19%
Engineered Products and Solutions
14
2 Quarter Performance Bridge
$ Millions
2 Quarter Business Highlights
2 Quarter Results
22%
revenue
growth
from
Q2
2010,
supported by
rising volumes
15%
sequential
improvement
in
ATOI,
highest
since
Q2 2008
Record
Adjusted EBITDA margin rose 3%
sequentially and 10% versus Q2 2010
Days
working
capital
down
2
days
sequentially
Progress toward 2013 $1.6 billion incremental
revenue
target,
25
to
30%
during
2011
Productivity
gains
more
than
offset
cost
pressures
3 Quarter Outlook
Building
and
construction
market
remains
weak
Typical
seasonal
impact
from
summer
plant
slowdowns especially in the Europe region and
commercial transportation market
Share
gains
through
innovation
continue
across
all market sectors
Productivity
improvements to continue
See appendix for reconciliations to GAAP and additional information
rd
nd
nd
rd
nd |
 2
nd
Quarter 2011 Cash Flow Overview
($ Millions)
2Q’10
1Q’11
2Q’11
Net Income
$170
$366
$377
DD&A
$364
$361
$375
Change in Working Capital
($422)
($646)
($110)
Pension Contributions
($22)
($31)
($72)
Taxes / Other Adjustments
$210
($286)
$228
Cash from Operations
$300
($236)
$798
Dividends to Shareholders
($31)
($33)
($32)
Change in Debt
$35
$101
$30
Distributions to Noncontrolling Interest
($41)
($97)
($90)
Contributions from Noncontrolling Interest
$37
$121
$7
Other Financing Activities
$3
$33
$-
Cash from Financing Activities
$3
$125
($85)
Capital Expenditures
($213)
($204)
($272)
Other Investing Activities
($33)
($348)
($78)
Cash from Investing Activities
($246)
($552)
($350)
15
2Q’11 FCF
$526 million
$1.3 billion
of cash
Debt-to-Cap
in target
range at
32.6%
DWC better
by 6 Days
from Q2
2010
See appendix for reconciliations to GAAP and additional information
|
 Sustainable Reductions in Days Working Capital
16
2Q
2009
2Q
2010
2Q
2011
Sustained
historically low
days working
capital
performance
2Q
2009
2Q
2010
2Q
2011
2Q
2009
2Q
2010
2Q
2011
2Q
2009
2Q
2010
2Q
2011
2Q
2009
2Q
2010
2Q
2011
59
50
62
82
49
39
29
47
67
43
29
25
47
68
37
Alumina
Primary
Metals
FRP
EPS
Alcoa |
 2011 Cash Sustainability Operational Targets and Actual Performance
17
Sustaining Capital
Growth Capital
Ma’aden Invest
$400
Debt-to-cap
$ Millions
$197
$ Millions
$ Millions
%
2010
Actual
2011
Target
2011
YTD
$152
35.0%
34.9%
2010
Actual
2011
Target
2011
YTD
32.6%
$500
$445
2010
Actual
2011
Target
2011
YTD
$158
$1,000
$570
2010
Actual
2011
Target
2011
YTD
$318
Free Cash Flow
$ Millions
$0
$1,246
$86
2010
Actual
2011
Target *
2011
YTD
30.0%
•Target is to be free cash flow positive. See appendix for
reconciliations to GAAP and additional information Meeting Our
2011 Goals |
 Klaus Kleinfeld
Chairman and Chief Executive Officer
18 |
 Market Conditions in 2011 Continue Strong
19
Alcoa End Markets: Current Assessment of 2011 vs. 2010 Conditions
Source: Alcoa analysis
8%-11%
sales growth
1%-3%
sales growth
5%-8%
sales growth
4%-8%
sales growth
60%-65%
sales growth
26%-31%
sales growth
7%-12%
sales growth
4%-5%
sales growth
15%-20%
sales growth
2%-3%
sales growth
10%-12%
sales growth
9%-12%
sales decline
3%-6%
sales decline
5%-10% build
rate growth
7% sales
growth
0%-3%
sales growth
2%-3%
Sales decline
1%-3%
sales growth |
 15%
2011 Projected Primary Aluminum Consumption by Region (in mmt)
Russia
Brazil
Asia w/o China
North America
Europe
China
2010 vs. 2011
2011 Estimated Consumption
10%
21%
16%
10%
*Other
17%
44.5
2010 Actual
2011 Forecast
15%
20
2010 Global Demand
Growth Rate: 13%
2011 Global Demand
Growth Rate 12%
vs. 2010
(2011 ex China: 10%)
10%
India
15%
7%
*Other consists of: Middle East, Latin America ex Brazil, and Rest of World
including unallocated global increase 14%
End Market Developments Support Strong Demand Growth
6%
1.0
1.1
4%
4%
6%
6% |
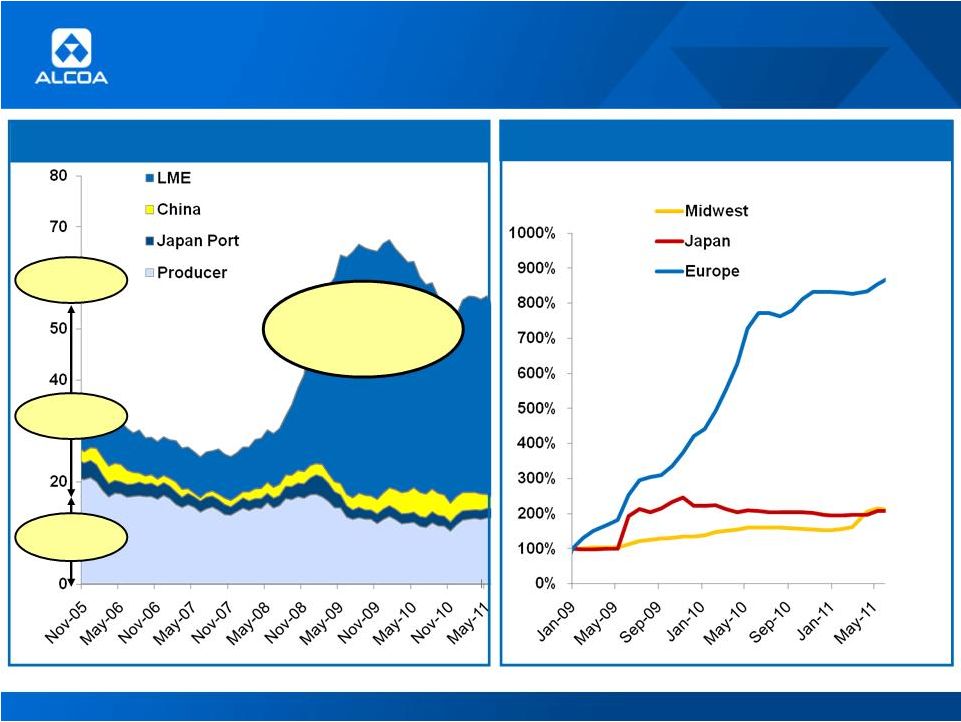 Inventories Flat Sequentially, but Higher Regional Premiums
21
$121 /MT
$215 /MT
$187 /MT
Source: Alcoa estimates, LME, SHFE, IAI, Marubeni, Platt’s Metals Week and
Metal Bulletin Global
Inventories
Flat vs. 1Q’11
56 days of
consumption
LME at 38
days
Non-LME at
18 days
Regional Premiums Continue Upwards
Inventories 7 days Lower Year-on-Year |
 Western
World
Annualized Production (May 2011)
25,515
Restarts and Expanded Capacity
739
Total Supply
26,254
Western World Consumption
(25,389)
(Deficit) Surplus
865
China
Annualized Production (May 2011)
18,144
Restarted and Expanded Capacity
206
Total Supply
18,350
Consumption
(19,100)
(Deficit) Surplus
(750)
2011 Primary Aluminum Surplus Tightens to 115 kmt
22
China
Western World
Production
Demand
Source: Alcoa estimates, Brook Hunt, CRU, CNIA, IAI
Production
Demand
2011E Aluminum Supply / Demand Balance (in kmt)
Deficit
Surplus |
 China: Recent Data Supports our 2011 Forecast
50% reduction
since May-10
Producers
are
challenged
by
cost
pressures
and
inefficiencies
Smelting:
Would add ~55,000 trucks or rail cars/year to
transport material over 2,000km between East
and West
Refining & Mining:
China Visible Stock (kmt)
Key Issues for Chinese Production
SHFE Primary Market Dynamics
Jan-10
Jul-10
Jan-11
Jul-09
Jan-09
Jun-11
Jan-10
Jul-10
Jan-11
Jul-09
Jan-09
Jun-11
*15%
Export
Duty
+
lost
17%
VAT
Refund
–
$90
regional
premium
**Assumes $120 premium (CIF MJP) for import purchase
–
45% of smelters are in the top quartile of the cost
curve
–
20% use outdated and inefficient technologies –
35% use power from the national grid (high cost) –
New projects / Move to the West
–
More than 50% of new projects based on coal-fired
power
–
Incoming raw materials and outgoing products to/from
East double logistics costs
–
Increasing congestion on Chinese roads leads to
added delays
–
37% of refineries are in the top quartile of the cost
curve, 78% in the top half
–
40% of refineries import bauxite
–
20 to 30% of bauxite mines recover bauxite from
underground
|
 2011 Global Alumina Balance Remains at Equilibrium
24
Source: Alcoa estimates, Brook Hunt, CRU, CNIA, IAI
China
Western World
2011 Annualized Production
34,100
Imports from Western World
1,600
Supply
35,700
Demand
(35,600)
(Deficit) / Surplus
100
2011 Annualized Production
53,700
Exports to China
(1,600)
Supply
52,100
Demand
(52,200)
(Deficit) / Surplus
(100)
Production
Demand
Balanced
2011E Alumina Supply / Demand Balance (in kmt) |
 Alumina:
Improving
Performance
from
Strong
Portfolio
25
Source: CRU; Platt’s Index; See appendix for Adjusted EBITDA
reconciliations Adjusted EBITDA per Metric Ton
–
Driving down the cost curve
–
Sao
Luis
and
Juruti
consistently
performing
at
high
levels
–
Ma’aden
Alcoa
Project,
lowest
cost
refinery
online
in
2014
–
Sustainable cost advantages
–
20%
of our 3
rd
Party SGA Sales now priced on an
alumina-indexed
or spot basis
Global Capacity: 18,100 kmt per year
Alumina Index Prices
2015 Cost Curve Targets
75
percentile
Alcoa
end 2015
23
Percentile
Alcoa
end 2010
30
Percentile
Cumulative Production (000MT)
25th
percentile
50th
percentile
Alumina Cost Curve
10 Yr Average ~ $66/MT
LME
Adjusted EBITDA/MT
rd
th
th |
 2015 Cost Curve Targets
Aluminum: Strong Performance Despite Stiff Headwinds
26
Source: CRU; See appendix for Adjusted EBITDA reconciliations
Aluminum Cost Curve
–
Driving down the cost curve
–
Ma’aden
Alcoa
Project,
lowest
cost
smelter
online in 2013
–
Sustainable cost advantages
–
Repowered
asset
base
–
Capturing optimal value from global casthouses
Global Capacity: 4,500 kmt per year
Adjusted EBITDA per Metric Ton
LME
Adjusted EBITDA/MT
10 YR Average ~ $390/MT |
 27
Potlines
Rolling Mill Earth Works
Ma’aden Alcoa Project Progresses On Schedule and Budget
First Locomotive
Rolling Mill Ground
Breaking
Paste Plant
Port |
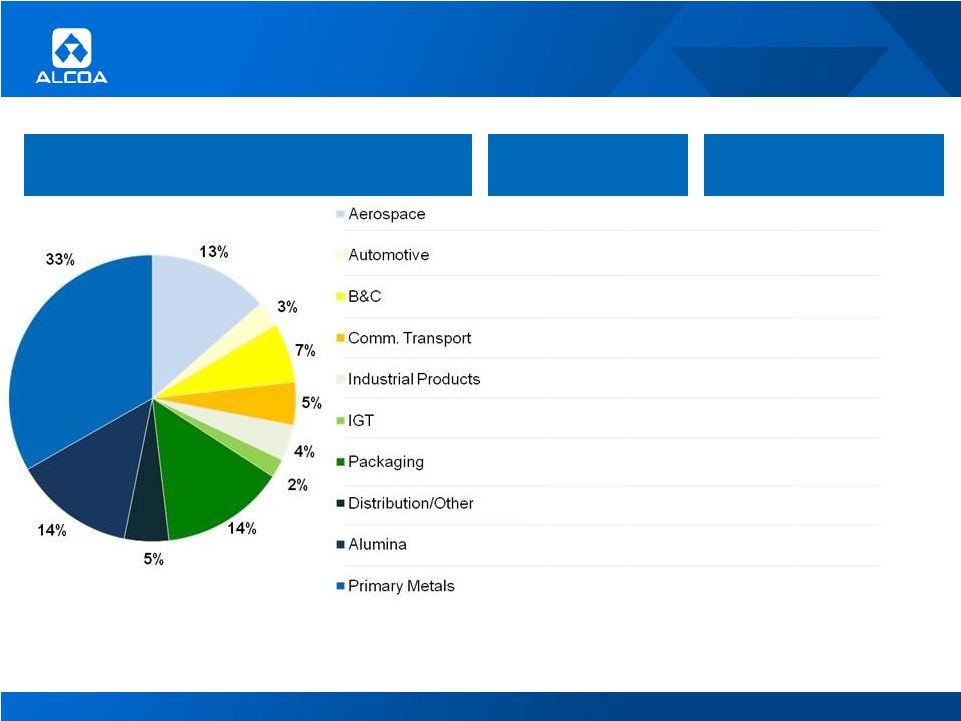
 Adjusted EBITDA & Adjusted EBITDA Margin
28
541
495
479
531
620
536
498
254
224
551
173
193
Adjusted EBITDA $Millions
Adjusted EBITDA % Sales
2011 YTD 3
rd
Party Sales by Market
85%
Utilization
–
32% revenue and 23% Adjusted EBITDA
growth
from
Q2
2010
–
On
track
to
reach
45
-
60%
of
the
2013
$2.5B
revenue
growth
target
in
2011
–
Aero,
Commercial
Transportation
&
Packaging
driving
profitable
growth
–
Growth
driven
by
new
regions
and
customers
–
China
and
Russia
continue
to
see
strong
market growth
Leveraging our strategic asset base
Record Adjusted EBITDA per MT
*Actual results from H1 2011 annualized to full year
See appendix for Adjusted EBITDA reconciliations
Total Shipments (mmt)
Adjusted EBITDA per MT
Flat Rolled Products: Strong Top-
and Bottom-Line Growth |
 Engineered Products: Continued Growth in Our Margins
Adjusted EBITDA & Adjusted EBITDA Margin
29
436
287
356
495
536
676
783
922
630
762
229
261
Adjusted EBITDA $Millions
2011 YTD 3
rd
Party Sales by Market
Strong Platform for Profitable Growth
Record Adjusted EBITDA Margins
3
Party Sales (US$ billions)
Adjusted EBITDA Margin
*Actual results from H1 2011 annualized to full year
See appendix for Adjusted EBITDA reconciliations
76%
Utilization
68%
Utilization
rd
–
22%
revenue
growth
from
Q2
2010
–
On
track
to
reach
2011
potential
of
25
-
30%
of
$1.6b
2013
revenue
growth
target
–
TransDigm
fastener
acquisition
integration
on
track
with
accretive
earnings
in
2011
–
Product
innovations
and
share
gains
accelerate
growth |
 Miracle Metal + Alcoa’s Innovations = Strong Growth for
Alcoa
30
Aluminum truck wheels are better…
Alcoa’s innovations go beyond…
Purchase
Price
Scrap Resale
Value
Fuel Efficiency & Cargo Capacity
Steel
Wheels
Aluminum
Wheels
+3%
Resale Value
Dura-Bright®
Proprietary coating
LvL ONE®
Wheels
5% lighter than
aluminum
competitors
Reduced
painting and
cleaning
With a more sustainable footprint.
-25%
Energy Usage
75%
Higher Yields:
Recaptures
3m
pounds
of scrap
$21m expansion for
advanced recycling and
casting
process
in
Barberton, OH
26 month
payback &
210% ROI for
our customers*
*Sample
calculation
for
a
long-haul
truck
with
22.5”
wheels,
as
calculated
by
Calculighter™
1,350 pounds
saved per
truck/trailer
Before
After
Increased
resale value
at end of life |
 Alcoa Takes Flight with Innovations in Aerospace
31
Carbon
Fiber
Alcoa
Innovations
1
-10%
Weight Savings
Alcoa
solutions
are
deployed
in
all
of
Airbus’
programs
First
use
of
Alcoa’s
Al/Li
Alloy
Plate
Carbon
Fiber
Alcoa
Innovations
1
-30%
Life Cycle Cost Savings
Technology: Re-Defining the Possible
Transforming Technology into Orders
Multi-year, ~$1 billion
agreement with Airbus
Leading
the
discussions
on
aero
structures
2
1
Using
Alcoa’s
new
Al/Li
alloys
and
advanced
structural
solutions
Costs to manufacture, operate and maintain
2 |
 Giving a Success Story its Due
32
Meeting our Aggressive Targets
EPS: $1.6b in Revenue Growth by 2013 ($b)
GRP: $2.5b in Revenue Growth by 2013 ($b)
*Excluding impact of restructuring and other special items
See appendix for reconciliations to GAAP and additional information
–
Aluminum demand
continues to grow at
12%
in 2011, end
markets remain
resilient
–
Year-over-year and
sequential profitable
growth
in all of our
segments and in
consolidated Alcoa
–
Firm actions to limit
inflationary pressures
in upstream businesses
–
Record results
in Flat-
Rolled Products and
Engineered Products &
Solutions
–
Improving liquidity
and
financial positions
Total Revenue (billion)
Income from Continuing Ops*
(million)
27%
11%
2Q’10
1Q’11
2Q’11
162%
15%
$6.6
$364
$317
$139
$5.2
$6.0
$6.3
$4.6
$4.0
$2.6
$8.8
$6.2
$3.4
to
$3.8
$2.4
to
$2.5
2010
2010
2011
YTD
2011
YTD
2013
Target
2013
Target
Q2: Sets a Successful Milestone |
 That's why …
Alcoa can't wait
Alcoa can't wait
…for tomorrow
…for tomorrow
A
A |
 A
34 |
 Roy Harvey
Director, Investor Relations
A
390 Park Avenue
New York, NY 10022-4608
Telephone: (212) 836-2674
www.alcoa.com
Additional Information
35 |
 Annual Sensitivity Summary
36
Currency Annual Net Income Sensitivity
+/-
$100/ = +/
-
$200
Million
LME Aluminum Annual Net Income Sensitivity
Australian $
+/-
$10 million
per 0.01 change in USD / AUD
Brazilian $
+/-
$ 3 million
per 0.01 change in BRL / USD
Euro €
+/-
$ 2 million
per 0.01 change in USD / EUR
Canadian $
+/-
$ 4 million
per 0.01 change in CAD / USD
Norwegian Kroner
+/-
$ 6 million
per 0.10 change in NOK / USD |
 Revenue Change by Market
6%
5%
12%
16%
9%
8%
13%
19%
14%
8%
21%
18%
27%
45%
8%
12%
41%
21%
32%
25%
2Q’11 Third Party Revenue
Sequential
Change
Year-Over-Year
Change
37 |
 Reconciliation of ATOI to Consolidated Net (Loss) Income
Attributable to Alcoa
38
(in millions)
1Q10
2Q10
3Q10
4Q10
2010
1Q11
2Q11
Total segment ATOI
$ 306
$ 381
$ 328
$
409
$ 1,424
$
555
$
635
Unallocated amounts (net of tax):
Impact of LIFO
(14)
(3)
(2)
3
(16)
(24)
(27)
Interest expense
(77)
(77)
(91)
(76)
(321)
(72)
(106)
Noncontrolling interests
(22)
(34)
(48)
(34)
(138)
(58)
(55)
Corporate expense
(67)
(59)
(71)
(94)
(291)
(67)
(76)
Restructuring and other charges
(122)
(21)
1
8
(134)
(6)
(22)
Discontinued operations
(7)
(1)
–
–
(8)
(1)
(4)
Other
(198)
(50)
(56)
42
(262)
(19)
(23)
Consolidated net (loss) income attributable to
Alcoa
$ (201)
$ 136
$ 61
$ 258
$ 254
$ 308
$ 322
|
 Reconciliation of Adjusted Income
39
(in millions, except per-
share amounts)
Income
Diluted EPS
Quarter ended
June 30,
2010
March 31,
2011
June 30,
2011
June 30,
2010
March 31,
2011
June 30,
2011
Net income attributable
to Alcoa
$ 136
$ 308
$ 322
$ 0.13
$ 0.27
$ 0.28
Loss from discontinued
operations
(1)
(1)
(4)
Income from
continuing
operations
attributable to Alcoa
137
309
326
0.13
0.27
0.28
Restructuring and
other charges
20
5
16
Discrete tax items*
(16)
–
–
Other special items**
(2)
3
22
Income from
continuing
operations
attributable to Alcoa
–
as adjusted
$ 139
$ 317
$ 364
0.13
0.28
0.32
Income from continuing operations attributable to Alcoa – as adjusted is a non-GAAP financial
measure. Management believes that this measure is meaningful to investors because
management reviews the operating results of Alcoa excluding the impacts of restructuring and other charges, discrete tax
items, and other special items (collectively, “special items”). There can be no
assurances that additional special items will not occur in future periods. To compensate
for this limitation, management believes that it is appropriate to consider both Income from continuing operations attributable to Alcoa
determined under GAAP as well as Income from continuing operations attributable to Alcoa – as
adjusted. *
Discrete tax items include the following:
for the quarter ended June 30, 2010, a benefit for a change in a Canadian provincial tax law
permitting tax returns to be filed in U.S. dollars ($24), a charge based on settlement
discussions of several matters with international taxing authorities ($18), and a benefit for the recovery of a portion of the unfavorable impact included
in the quarter ended March 31, 2010 related to unbenefitted losses in Russia, China, and Italy
($10). ** Other special items include the following:
for the quarter ended June 30, 2011, a net charge comprised of expenses for the early repayment of
Notes set to mature in 2013 due to the premiums paid under the tender offers and call option
and gains from the termination of related “in-the-money” interest rate swaps ($32) and favorable mark-to-market changes in certain
power derivative contracts ($10);
for the quarter ended March 31, 2011, costs related to acquisitions of the aerospace fastener business
of TransDigm Group Inc. and full ownership of carbothermic smelting technology from ORKLA ASA
($8) and favorable mark-to-market changes in certain power derivative contracts ($5); and
for the quarter ended June 30, 2010, favorable mark-to-market changes in derivative contracts
($22), a charge for costs associated with the potential strike and successful execution of a
new agreement with the United Steelworkers ($13), and a charge related to an unfavorable decision in Alcoa’s lawsuit against Luminant
related to the Rockdale, TX facility ($7).
•
•
•
• |
 Reconciliation of Free Cash Flow
40
(in millions)
Quarter ended
Year ended
Six months
ended
June 30,
2011
December 31,
2010
June 30,
2011
Cash provided from
operations
$ 798
$ 2,261
$ 562
Capital expenditures
(272)
(1,015)
(476)
Free cash flow
$ 526
$ 1,246
$ 86
Free Cash Flow is a non-GAAP financial measure. Management believes that this measure is
meaningful to investors because management reviews cash flows generated from operations after
taking into consideration capital expenditures due to the fact that these expenditures are
considered necessary to maintain and expand Alcoa’s asset base and are expected to
generate future cash flows from operations. It is important to note that Free Cash Flow
does not represent the residual cash flow available for discretionary expenditures since other
non-discretionary expenditures, such as mandatory debt service requirements, are not
deducted from the measure. |
 Reconciliation of Alcoa Adjusted EBITDA
41
($ in millions)
2001
2002
2003
2004
2005
2006
2007
2008
2009
2010
2Q10
1Q11
2Q11
Net income (loss)
attributable to
Alcoa
$ 908
$ 420
$ 938
$ 1,310
$ 1,233
$ 2,248
$ 2,564
$ (74)
$ (1,151)
$ 254
$ 136
$ 308
$ 322
Add:
Net income
attributable to
noncontrolling
interests
205
181
212
233
259
436
365
221
61
138
34
58
55
Cumulative effect
of accounting
changes
–
(34)
47
–
2
–
–
–
–
–
–
–
–
Loss (income)
from discontinued
operations
5
101
–
27
50
(22)
250
303
166
8
1
1
4
Provision (benefit)
for income taxes
524
307
367
546
464
853
1,623
342
(574)
148
57
138
136
Other (income)
expenses, net
(295)
(175)
(278)
(266)
(478)
(236)
(1,920)
(59)
(161)
5
(16)
(28)
(50)
Interest expense
371
350
314
271
339
384
401
407
470
494
119
111
163
Restructuring and
other charges
530
398
(28)
(29)
266
507
268
939
237
207
30
6
34
Provision for
depreciation,
depletion, and
amortization
1,144
1,037
1,110
1,142
1,227
1,252
1,244
1,234
1,311
1,450
363
361
375
Adjusted EBITDA
$ 3,392
$ 2,585
$ 2,682
$ 3,234
$ 3,362
$ 5,422
$ 4,795
$ 3,313
$ 359
$ 2,704
$ 724
$ 955
$ 1,039
Sales
$19,906
$17,691
$18,879
$21,370
$24,149
$28
,950
$29,280
$26,901
$18,439
$21,013
$ 5,187
$ 5,958
$ 6,585
Adjusted EBITDA
Margin
17%
15%
14%
15%
14%
19%
16%
12%
2%
13%
14%
16%
16%
Alcoa’s definition of Adjusted EBITDA (Earnings before interest, taxes, depreciation, and
amortization) is net margin plus an add-back for depreciation, depletion, and amortization. Net
margin is equivalent to Sales minus the following items: Cost of goods sold; Selling, general
administrative, and other expenses; Research and development expenses; and Provision for
depreciation, depletion, and amortization. Adjusted EBITDA is a non-GAAP financial
measure. Management believes that this measure is meaningful to investors because Adjusted
EBITDA provides additional information with respect to Alcoa’s operating performance and the
Company’s ability to meet its financial obligations. The Adjusted EBITDA presented may
not be comparable to similarly titled measures of other companies.
|
 Reconciliation of Alumina Adjusted EBITDA
42
($ in millions, except per
metric ton amounts)
2001
2002
2003
2004
2005
2006
2007
2008
2009
2010
2Q10
1Q11
2Q11
After-tax operating
income (ATOI)
$ 471
$ 315
$ 415
$ 632
$ 682
$ 1,050
$ 956
$ 727
$ 112
$ 301
$ 94
$ 142
$ 186
Add:
Depreciation, depletion,
and amortization
144
139
147
153
172
192
267
268
292
406
107
103
112
Equity (income)
loss
(1)
(1)
–
(1)
–
2
(1)
(7)
(8)
(10)
(4)
(3)
(22)
Income taxes
184
130
161
240
246
428
340
277
(22)
60
41
44
60
Other
(17)
(14)
(55)
(46)
(8)
(6)
2
(26)
(92)
(5)
(2)
–
(1)
Adjusted EBITDA
$ 781
$ 569
$ 668
$ 978
$ 1,092
$ 1,666
$ 1,564
$ 1,239
$ 282
$ 752
$ 236
$ 286
$ 335
Production (thousand
metric tons) (kmt)
12,527
13,027
13,841
14,343
14,598
15,128
15,084
15,256
14,265
15,922
3,890
4,024
4,144
Adjusted
EBITDA/Production ($
per metric ton)
$ 62
$ 44
$ 48
$ 68
$ 75
$ 110
$ 104
$ 81
$ 20
$ 47
$ 61
$ 71
$
81
Alcoa’s definition of Adjusted EBITDA (Earnings before interest, taxes, depreciation, and
amortization) is net margin plus an add-back for depreciation, depletion, and amortization. Net margin is equivalent to Sales
minus the following items: Cost of goods sold; Selling, general administrative, and other expenses;
Research and development expenses; and Provision for depreciation, depletion, and amortization. The Other line in
the table above includes gains/losses on asset sales and other nonoperating items. Adjusted
EBITDA is a non-GAAP financial measure. Management believes that this measure is meaningful to investors because
Adjusted EBITDA provides additional information with respect to Alcoa’s operating performance and
the Company’s ability to meet its financial obligations. The Adjusted EBITDA presented may not be comparable to
similarly titled measures of other companies. |
 Reconciliation of Primary Metals Adjusted EBITDA
43
($ in millions, except
per metric ton
amounts)
2001
2002
2003
2004
2005
2006
2007
2008
2009
2010
2Q10
1Q11
2Q11
After-tax operating
income (ATOI)
$ 905
$ 650
$ 657
$ 808
$ 822
$ 1,760
$ 1,445
$ 931
$ (612)
$ 488
$ 109
$ 202
$ 201
Add:
Depreciation,
depletion, and
amortization
327
300
310
326
368
395
410
503
560
571
142
141
142
Equity (income) loss
(52)
(44)
(55)
(58)
12
(82)
(57)
(2)
26
(1)
(1)
(1)
1
Income taxes
434
266
256
314
307
726
542
172
(365)
96
–
53
55
Other
(8)
(47)
12
20
(96)
(13)
(27)
(32)
(176)
(7)
–
1
–
Adjusted EBITDA
$ 1,606
$ 1,125
$ 1,180
$ 1,410
$ 1,413
$ 2,786
$ 2,313
$ 1,572
$ (567)
$ 1,147
$ 250
$ 396
$ 399
Production
(thousand metric
tons) (kmt)
3,488
3,500
3,508
3,376
3,554
3,552
3,693
4,007
3,564
3,586
893
904
945
Adjusted
EBITDA/Production
($ per metric ton)
$ 460
$ 321
$ 336
$ 418
$ 398
$ 784
$ 626
$ 392
$ (159)
$ 320
$ 280
$ 438
$ 422
Alcoa’s definition of Adjusted EBITDA (Earnings before interest, taxes, depreciation, and
amortization) is net margin plus an add-back for depreciation, depletion, and amortization. Net margin is equivalent to Sales minus the
following items: Cost of goods sold; Selling, general administrative, and other expenses; Research and
development expenses; and Provision for depreciation, depletion, and amortization. The Other line in the table above includes
gains/losses on asset sales and other nonoperating items. Adjusted EBITDA is a non-GAAP
financial measure. Management believes that this measure is meaningful to investors because Adjusted EBITDA provides additional
information with respect to Alcoa’s operating performance and the Company’s ability to meet
its financial obligations. The Adjusted EBITDA presented may not be comparable to similarly titled measures of other companies.
|
 Reconciliation of Flat-Rolled Products Adjusted EBITDA
44
($ in millions,
except per metric
ton amounts)
2001
2002
2003
2004
2005
2006
2007
2008
2009
2010
2Q10
1Q11
2Q11
2011
Annualized
After-tax operating
income (ATOI)
$ 253
$ 225
$ 222
$ 254
$ 278
$ 233
$ 178
$ (3)
$ (49)
$ 220
$ 71
$ 81
$ 99
$ 360
Add:
Depreciation,
depletion, and
amortization
167
184
190
200
220
223
227
216
227
238
57
58
60
236
Equity loss
2
4
1
1
–
2
–
–
–
–
–
–
–
–
Income taxes
124
90
71
75
121
58
92
35
48
92
28
33
35
136
Other
(5)
(8)
(5)
1
1
20
1
6
(2)
1
1
1
(1)
–
Adjusted EBITDA
$ 541
$ 495
$ 479
$ 531
$ 620
$
536
$ 498
$ 254
$ 224
$ 551
$ 157
$ 173
$ 193
$ 732
Total sales
$ 4,868
$ 4,571
$ 4,768
$ 6,042
$ 7,081
$ 8,610
$ 9,597
$ 9,184
$ 6,182
$ 6,457
$ 1,614
$ 1,961
$ 2,147
Adjusted EBITDA
Margin
11%
11%
10%
9%
9%
6%
5%
3%
4%
9%
10%
9%
9%
Total shipments
(thousand metric
tons) (kmt)
2,376
2,482
2,361
1,888
1,755
435
470
491
1,922
Adjusted
EBITDA/Total
shipments ($ per
metric ton)
$ 226
$ 201
$ 108
$ 119
$ 314
$ 361
$ 368
$ 393
$ 381
Alcoa’s definition of Adjusted EBITDA (Earnings before interest, taxes, depreciation, and
amortization) is net margin plus an add-back for depreciation, depletion, and amortization. Net margin is equivalent to Sales
minus the following items: Cost of goods sold; Selling, general administrative, and other expenses;
Research and development expenses; and Provision for depreciation, depletion, and amortization. The Other line
in the table above includes gains/losses on asset sales and other nonoperating items. Adjusted
EBITDA is a non-GAAP financial measure. Management believes that this measure is meaningful to investors
because Adjusted EBITDA provides additional information with respect to Alcoa’s operating
performance and the Company’s ability to meet its financial obligations. The Adjusted EBITDA presented may not be
comparable to similarly titled measures of other companies. |
 Reconciliation of Engineered Products and Solutions
Adjusted EBITDA
45
($ in millions)
2001
2002
2003
2004
2005
2006
2007
2008
2009
2010
2Q10
1Q11
2Q11
2011
Annualized
After-tax
operating income
(ATOI)
$ 189
$ 63
$ 124
$ 156
$ 271
$ 365
$ 435
$ 533
$ 315
$ 415
$ 107
$ 130
$ 149
$ 558
Add:
Depreciation,
depletion, and
amortization
186
150
166
168
160
152
163
165
177
154
38
38
41
158
Equity loss
(income)
–
–
–
–
–
6
–
–
(2)
(2)
–
(1)
–
(2)
Income taxes
61
39
55
65
116
155
192
222
139
195
48
62
72
268
Other
–
35
11
106
(11)
(2)
(7)
2
1
–
–
–
(1)
(2)
Adjusted EBITDA
$ 436
$ 287
$ 356
$ 495
$ 536
$ 676
$ 783
$ 922
$ 630
$ 762
$ 193
$ 229
$ 261
$ 980
Total sales
$ 4,141
$ 3,492
$ 3,905
$ 4,283
$ 4,773
$ 5,428
$ 5,834
$ 6,199
$ 4,689
$ 4,584
$ 1,122
$ 1,247
$ 1,370
$ 5,234
Adjusted EBITDA
Margin
11%
8%
9%
12%
11%
12%
13%
15%
13%
17%
17%
18%
19%
19%
Alcoa’s definition of Adjusted EBITDA (Earnings before interest, taxes,
depreciation, and amortization) is net margin plus an add-back for depreciation, depletion, and amortization. Net margin is equivalent
to
Sales
minus
the
following
items:
Cost
of
goods
sold;
Selling,
general
administrative,
and
other
expenses;
Research
and
development
expenses;
and
Provision
for
depreciation,
depletion,
and
amortization.
The
Other
line
in
the
table
above
includes
gains/losses
on
asset
sales
and
other
nonoperating
items.
Adjusted
EBITDA
is
a
non-GAAP
financial
measure.
Management
believes
that
this
measure
is
meaningful to investors because Adjusted EBITDA provides additional information with
respect to Alcoa’s operating performance and the Company’s ability to meet its financial obligations. The Adjusted
EBITDA presented may not be comparable to similarly titled measures of other
companies. |
 Reconciliation of Alcoa Net Debt
46
(in millions)
Quarter ended
March 31,
2011
June 30,
2011
Short-term borrowings
$ 221
$ 65
Long-term debt due within
one year
572
510
Long-term debt, less amount
due within one year
8,501
8,773
Total debt
9,294
9,348
Less: Cash and cash
equivalents
887
1,260
Net debt
$ 8,407
$ 8,088
Net debt is a non-GAAP financial measure. Management believes that this
measure is meaningful to investors because management assesses Alcoa’s
leverage position after factoring in available cash that could be used to repay
outstanding debt. |