Attached files
| file | filename |
|---|---|
| 8-K - ITT CORPORATION 8-K - ITT Inc. | a6788079.htm |
| EX-99.1 - EXHIBIT 99.1 - ITT Inc. | a6788079_ex991.htm |
Exhibit 99.2
July 11, 2011 FORM 10 FILINGS OVERVIEW ITT Engineered for Life
Safe Harbor Statement under the Private Securities Litigation Reform Act of 1995 (the “Act”): Certain material presented herein includes forward-looking statements intended to qualify for the safe harbor from liability established by the Private Securities Litigation Reform Act of 1995. These forward-looking statements include, but are not limited to, statements about the separation of ITT Corporation (“the Company”) into three independent publicly-traded companies (“the companies”), the terms and the effect of the separation, the nature and impact of such a separation, capitalization of the companies, future strategic plans and other statements that describe the companies’ business strategy, outlook, objectives, plans, intentions or goals, and any discussion of future operating or financial performance. Whenever used, words such as "anticipate," "estimate," "expect," "project," "intend," "plan," "believe," "target" and other terms of similar meaning are intended to identify such forward-looking statements. Forward-looking statements are uncertain and to some extent unpredictable, and involve known and unknown risks, uncertainties and other important factors that could cause actual results to differ materially from those expressed or implied in, or reasonably inferred from, such forward looking statements. Factors that could cause results to differ materially from those anticipated include, but are not limited to: Economic, political and social conditions in the countries in which we conduct our businesses; Changes in U.S. or International government defense budgets; Decline in consumer spending; Sales and revenues mix and pricing levels; Availability of adequate labor, commodities, supplies and raw materials; Interest and foreign currency exchange rate fluctuations and changes in local government regulations; Competition, industry capacity & production rates; Ability of third parties, including our commercial partners, counterparties, financial institutions and insurers, to comply with their commitments to us; Our ability to borrow or to refinance our existing indebtedness and availability of liquidity sufficient to meet our needs; Changes in the value of goodwill or intangible assets; Our ability to achieve stated synergies or cost savings from acquisitions or divestitures; The number of personal injury claims filed against the companies or the degree of liability; Uncertainties with respect to our estimation of asbestos liability exposures, third-party recoveries and net cash flow; Our ability to effect restructuring and cost reduction programs and realize savings from such actions; Government regulations and compliance therewith, including Dodd-Frank legislation; Changes in technology; Intellectual property matters; Governmental investigations; Potential future employee benefit plan contributions and other employment and pension matters; Contingencies related to actual or alleged environmental contamination, claims and concerns; Changes in generally accepted accounting principles; and Other factors set forth in our Annual Report on Form 10−K for the fiscal year ended December 31, 2010 and our other filings with the Securities and Exchange Commission. In addition, there are risks and uncertainties relating to the planned taxfree spinoffs of our Water and Defense businesses, including the timing and certainty of the completion of those transactions, whether those transactions will result in any tax liability, the operational and financial profile of the Company or any of its businesses after giving effect to the spinoff transactions, and the ability of each business to operate as an independent entity. The guidance for full-year 2011 is based on the Company’s current structure and does not give effect to the separation of our Water and Defense businesses into newly independent public companies. The Company undertakes no obligation to update any forward-looking statements, whether as a result of new information, future events or otherwise.
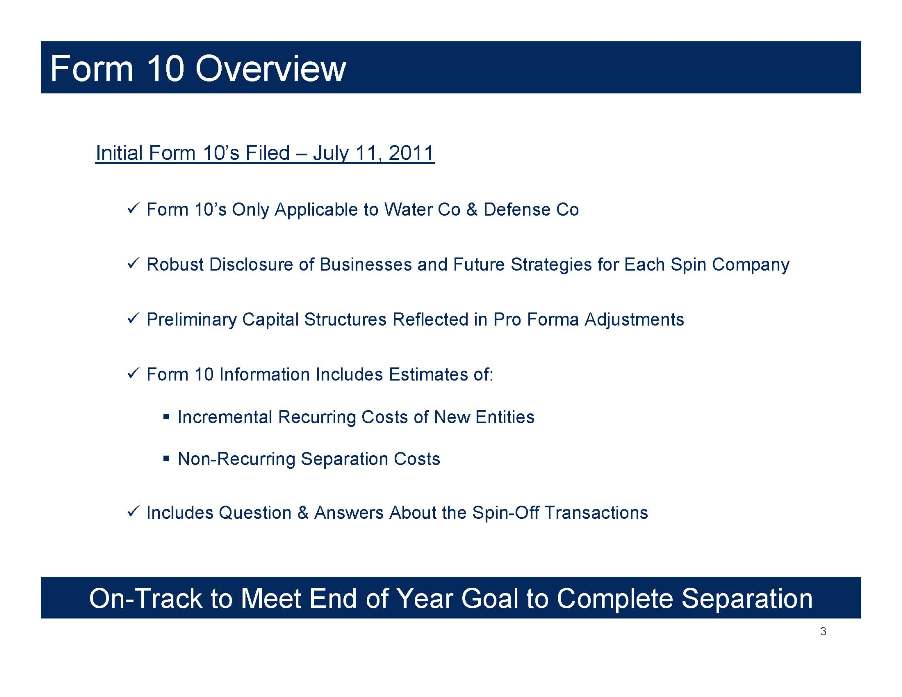
On-Track to Meet End of Year Goal to Complete Separation Form 10 Overview Initial Form 10’s Filed – July 11, 2011 Form 10’s Only Applicable to Water Co & Defense Co Robust Disclosure of Businesses and Future Strategies for Each Spin Company Preliminary Capital Structures Reflected in Pro Forma Adjustments Form 10 Information Includes Estimates of: Incremental Recurring Costs of New Entities Non Recurring Separation Costs Includes Question & Answers About the Spin-Off Transactions 3
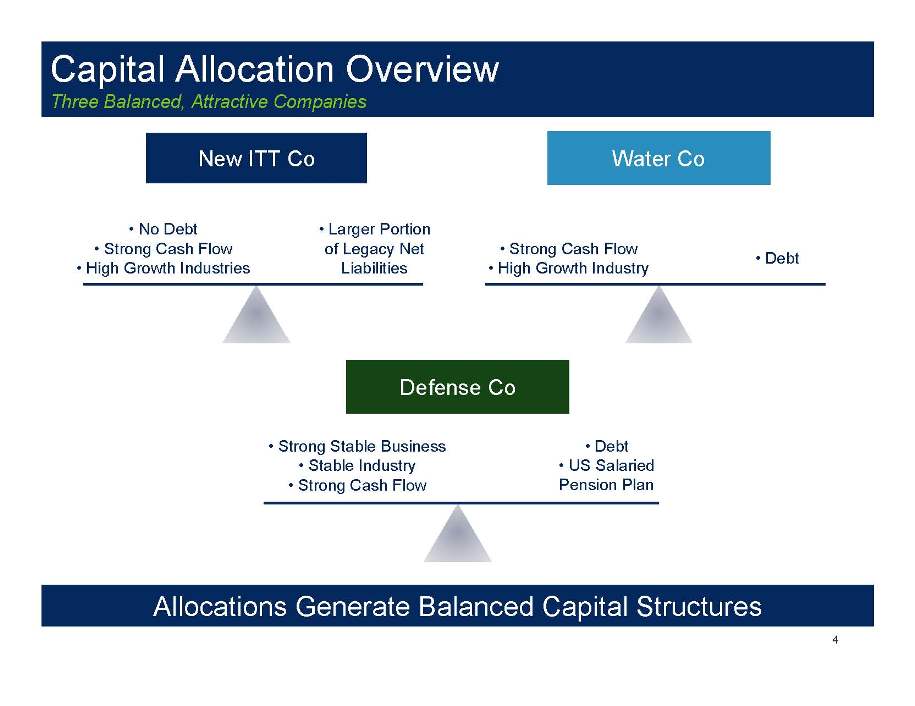
Capital Allocation Overview Three Balanced, Attractive Companies 4 Larger Portion of Legacy Net Liabilities No Debt Strong Cash Flow High Growth Industries Debt Strong Cash Flow High Growth Industry New ITT Co Water Co Defense Co Strong Stable Business Stable Industry Strong Cash Flow Debt US Salaried Pension Plan Allocations Generate Balanced Capital Structures
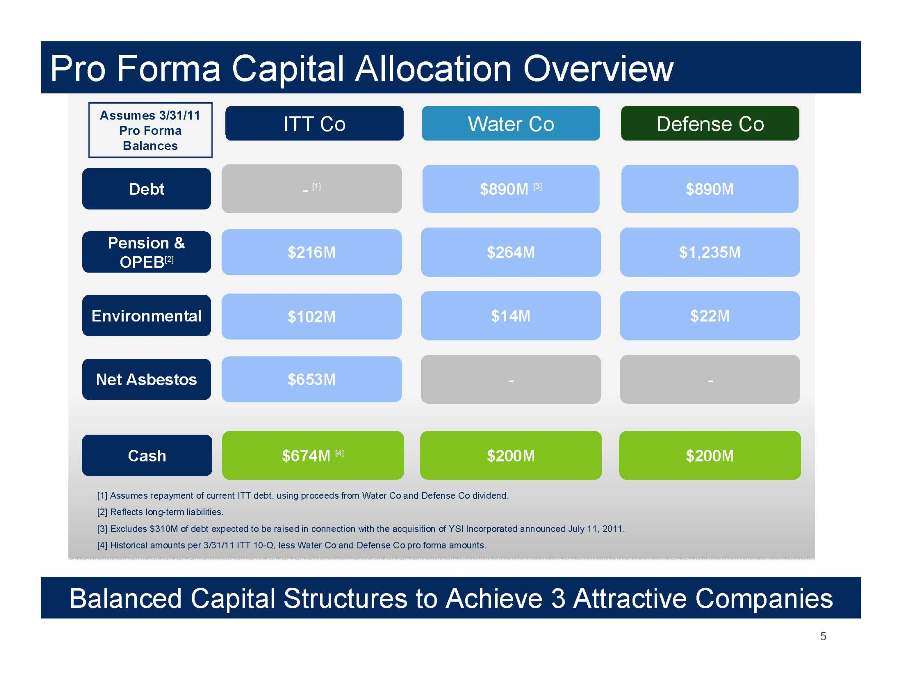
Pro Forma Capital Allocation Overview 5 Balanced Capital Structures to Achieve 3 Attractive Companies [1] Assumes repayment of current ITT debt, using proceeds from Water Co and Defense Co dividend. [2] Reflects long-term liabilities. [3] Excludes $310M of debt expected to be raised in connection with the acquisition of YSI Incorporated announced July 11, 2011. [4] Historical amounts per 3/31/11 ITT 10-Q, less Water Co and Defense Co pro forma amounts. Debt - [1] $890M [3] $890M ITT Co Water Co Defense Co - Net Asbestos - $653M $14M Environmental $22M $102M $264M Pension & OPEB[2] $1,235M $216M Assumes 3/31/11 Pro Forma Balances $200M Cash $674M [4] $200M
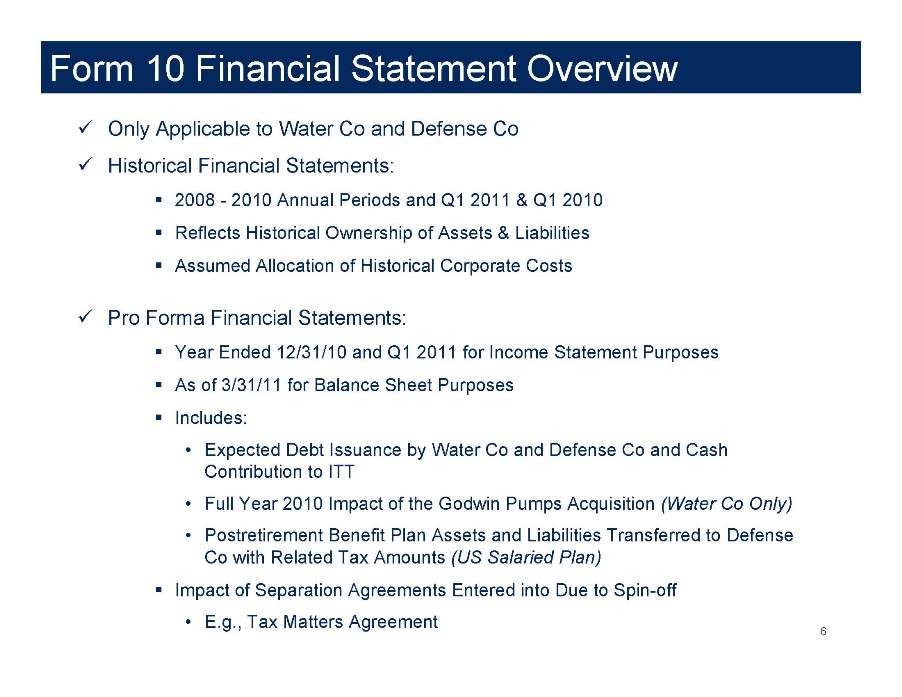
Form 10 Financial Statement Overview Only Applicable to Water Co and Defense Co Historical Financial Statements: 2008 - 2010 Annual Periods and Q1 2011 & Q1 2010 Reflects Historical Ownership of Assets & Liabilities Assumed Allocation of Historical Corporate Costs Pro Forma Financial Statements: Year Ended 12/31/10 and Q1 2011 for Income Statement Purposes As of 3/31/11 for Balance Sheet Purposes Includes: • Expected Debt Issuance by Water Co and Defense Co and Cash Contribution to ITT • Full Year 2010 Impact of the Godwin Pumps Acquisition (Water Co Only) • Postretirement Benefit Plan Assets and Liabilities Transferred to Defense Co with Related Tax Amounts (US Salaried Plan) Impact of Separation Agreements Entered into Due to Spin-off • E.g., Tax Matters Agreement 6
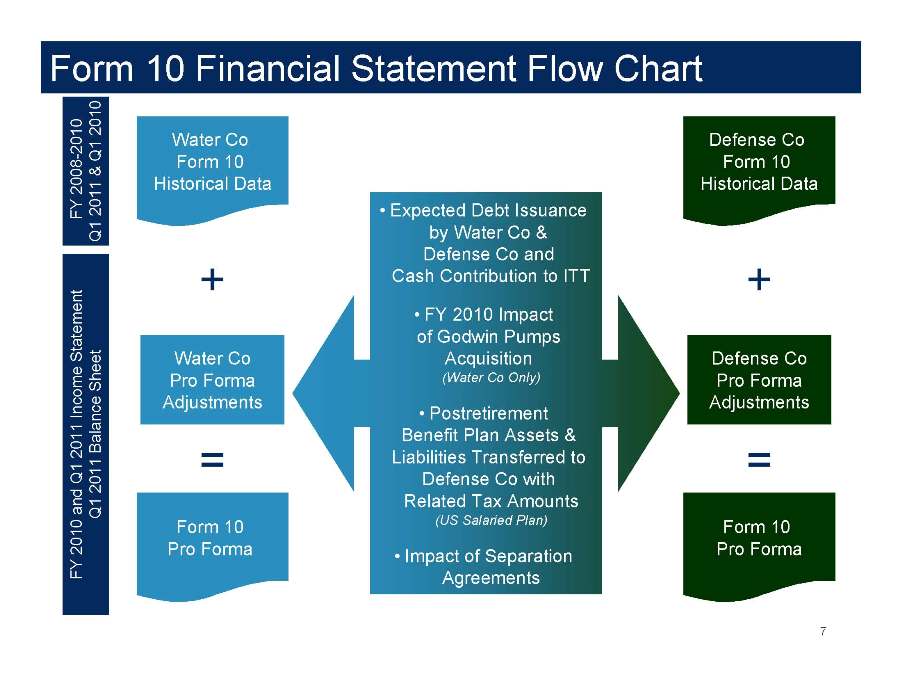
Form 10 Financial Statement Flow Chart Water Co Form 10 Historical Data Defense Co Form 10 Historical Data FY 2008-2010 Q1 2011 & Q1 2010 FY 2010 and Q1 2011 Income Statement Q1 2011 Balance Sheet + + = = Form 10 Pro Forma Form 10 Pro Forma • Expected Debt Issuance by Water Co & Defense Co and Cash Contribution to ITT • FY 2010 Impact of Godwin Pumps Acquisition (Water Co Only) • Postretirement Benefit Plan Assets & Liabilities Transferred to Defense Co with Related Tax Amounts (US Salaried Plan) • Impact of Separation Agreements 7 Water Co Pro Forma Adjustments Defense Co Pro Forma Adjustments
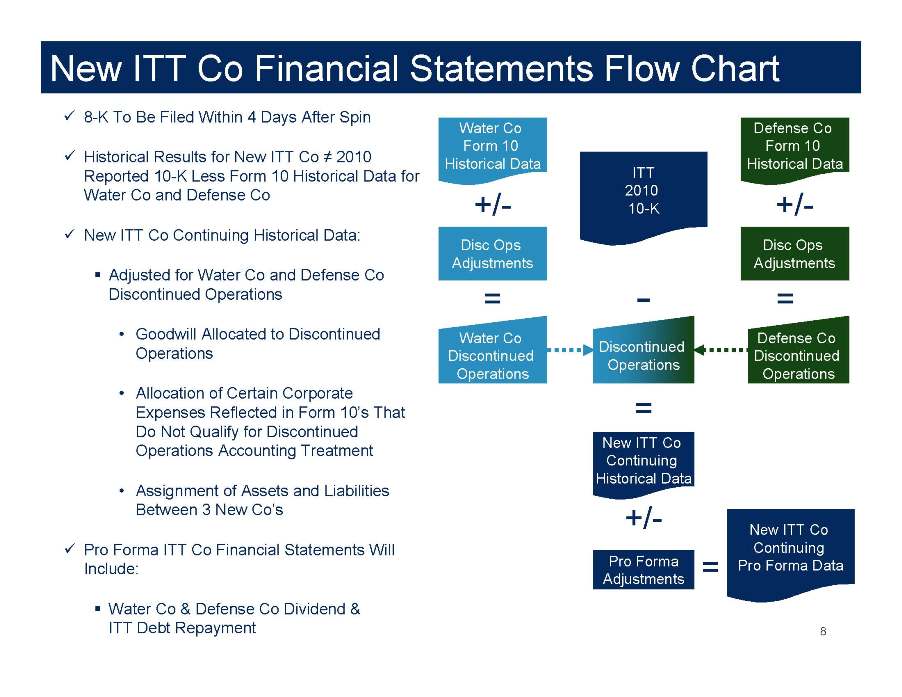
New ITT Co Financial Statements Flow Chart Water Co Form 10 Historical Data +/- = 8 Water Co Discontinued Operations ITT 2010 10-K Discontinued Operations = New ITT Co Continuing Historical Data +/- = New ITT Co Continuing Pro Forma Data Defense Co Form 10 Historical Data +/- = Defense Co Discontinued Operations Disc Ops Adjustments Disc Ops Adjustments Pro Forma Adjustments 8-K To Be Filed Within 4 Days After Spin Historical Results for New ITT Co ≠ 2010 Reported 10-K Less Form 10 Historical Data for Water Co and Defense Co New ITT Co Continuing Historical Data: Adjusted for Water Co and Defense Co Discontinued Operations • Goodwill Allocated to Discontinued Operations • Allocation of Certain Corporate Expenses Reflected in Form 10’s That Do Not Qualify for Discontinued Operations Accounting Treatment • Assignment of Assets and Liabilities Between 3 New Co’s Pro Forma ITT Co Financial Statements Will Include: Water Co & Defense Co Dividend & ITT Debt Repayment
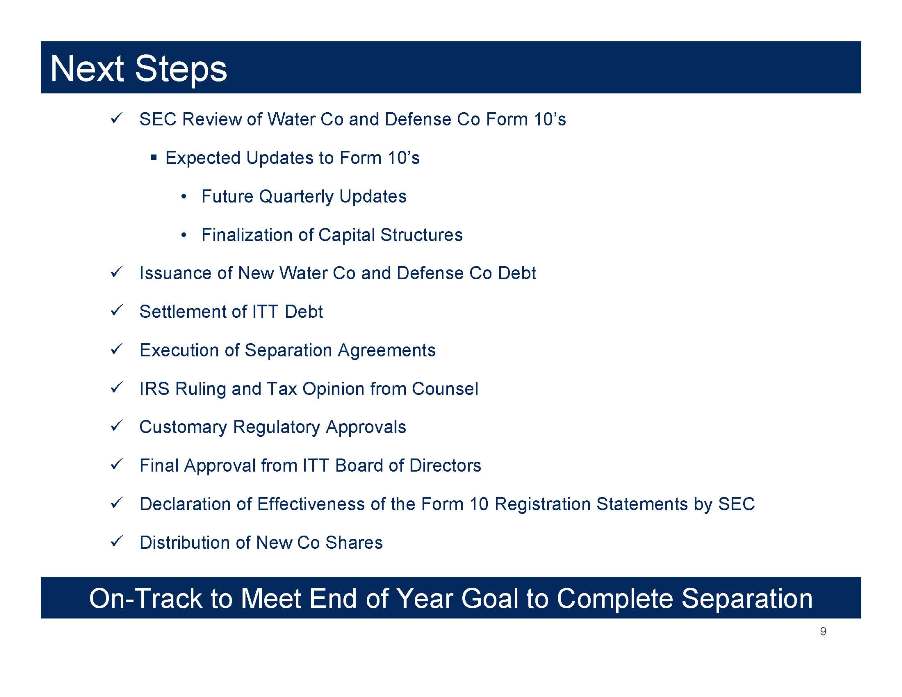
Next Steps SEC Review of Water Co and Defense Co Form 10’s Expected Updates to Form 10’s • Future Quarterly Updates • Finalization of Capital Structures Issuance of New Water Co and Defense Co Debt Settlement of ITT Debt Execution of Separation Agreements IRS Ruling and Tax Opinion from Counsel Customary Regulatory Approvals Final Approval from ITT Board of Directors Declaration of Effectiveness of the Form 10 Registration Statements by SEC Distribution of New Co Shares 9 On-Track to Meet End of Year Goal to Complete Separation
ITT July 11, 2011 Introducing the New ITT
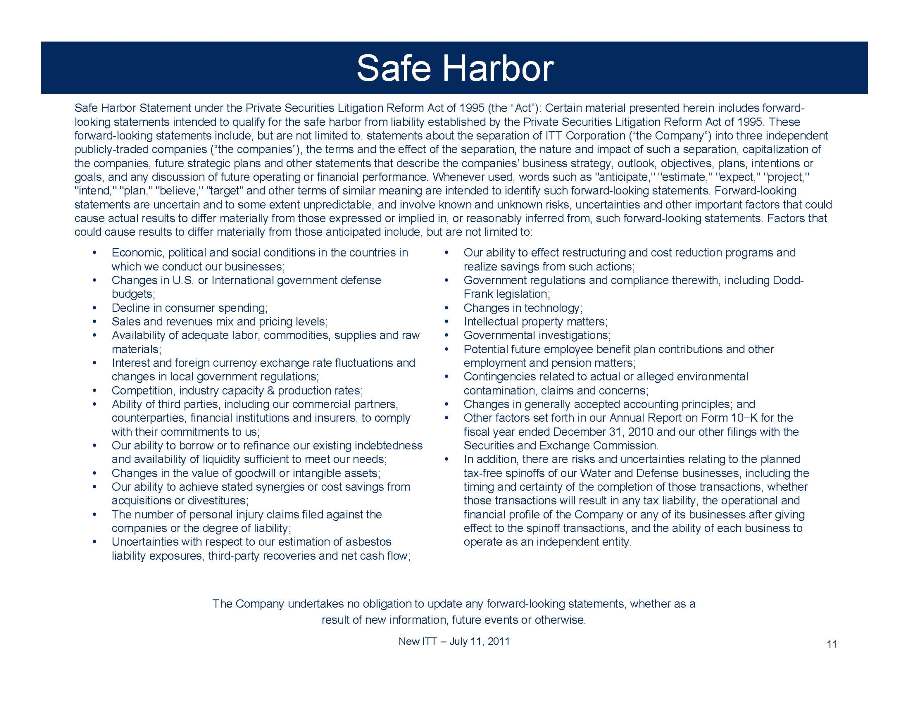
Safe Harbor 11 Safe Harbor Statement under the Private Securities Litigation Reform Act of 1995 (the “Act”): Certain material presented herein includes forward looking statements intended to qualify for the safe harbor from liability established by the Private Securities Litigation Reform Act of 1995. These forward-looking statements include, but are not limited to, statements about the separation of ITT Corporation (“the Company”) into three independent publicly-traded companies (“the companies”), the terms and the effect of the separation, the nature and impact of such a separation, capitalization of the companies, future strategic plans and other statements that describe the companies’ business strategy, outlook, objectives, plans, intentions or goals, and any discussion of future operating or financial performance. Whenever used, words such as "anticipate," "estimate," "expect," "project," "intend," "plan," "believe," "target" and other terms of similar meaning are intended to identify such forward-looking statements. Forward looking statements are uncertain and to some extent unpredictable, and involve known and unknown risks, uncertainties and other important factors that could cause actual results to differ materially from those expressed or implied in, or reasonably inferred from, such forward-looking statements. Factors that could cause results to differ materially from those anticipated include, but are not limited to: • Economic, political and social conditions in the countries in which we conduct our businesses; • Changes in U.S. or International government defense budgets; • Decline in consumer spending; • Sales and revenues mix and pricing levels; • Availability of adequate labor, commodities, supplies and raw materials; • Interest and foreign currency exchange rate fluctuations and changes in local government regulations; • Competition, industry capacity & production rates; • Ability of third parties, including our commercial partners, counterparties, financial institutions and insurers, to comply with their commitments to us; • Our ability to borrow or to refinance our existing indebtedness and availability of liquidity sufficient to meet our needs; • Changes in the value of goodwill or intangible assets; • Our ability to achieve stated synergies or cost savings from acquisitions or divestitures; • The number of personal injury claims filed against the companies or the degree of liability; • Uncertainties with respect to our estimation of asbestos liability exposures, third-party recoveries and net cash flow; • Our ability to effect restructuring and cost reduction programs and realize savings from such actions; • Government regulations and compliance therewith, including Dodd-Frank legislation; • Changes in technology; • Intellectual property matters; • Governmental investigations; • Potential future employee benefit plan contributions and other employment and pension matters; • Contingencies related to actual or alleged environmental contamination, claims and concerns; • Changes in generally accepted accounting principles; and • Other factors set forth in our Annual Report on Form 10−K for the fiscal year ended December 31, 2010 and our other filings with the Securities and Exchange Commission. • In addition, there are risks and uncertainties relating to the planned tax-free spinoffs of our Water and Defense businesses, including the timing and certainty of the completion of those transactions, whether those transactions will result in any tax liability, the operational and financial profile of the Company or any of its businesses after giving effect to the spinoff transactions, and the ability of each business to operate as an independent entity. New ITT – July 11, 2011 Diverse, Glo 2011 The Company undertakes no obligation to update any forward-looking statements, whether as a result of new information, future events or otherwise.
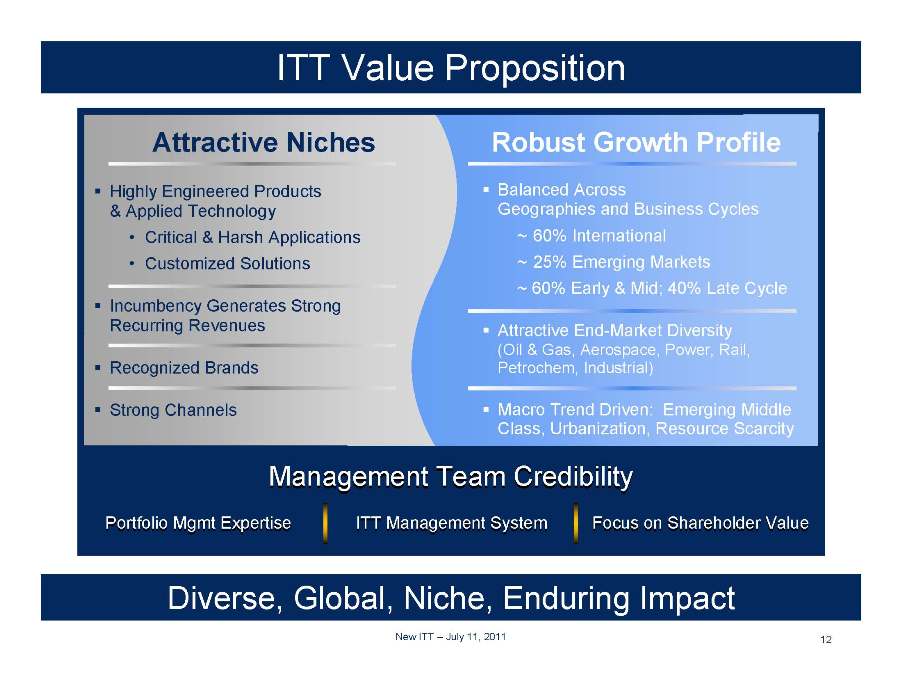
ITT Value Proposition Attractive Niches Robust Growth Profile Management Team Credibility Management Team Credibility Portfolio Mgmt Expertise Portfolio Mgmt Expertise ITT Management System ITT Management System Focus on Shareholder Value Focus on Shareholder Value Highly Engineered Products & Applied Technology • Critical & Harsh Applications • Customized Solutions Incumbency Generates Strong Recurring Revenues Recognized Brands Strong Channels Balanced Across Geographies and Business Cycles ~ 60% International ~ 25% Emerging Markets ~ 60% Early & Mid; 40% Late Cycle Attractive End-Market Diversity (Oil & Gas, Aerospace, Power, Rail, Petrochem, Industrial) Macro Trend Driven: Emerging Middle Class, Urbanization, Resource Scarcity 12
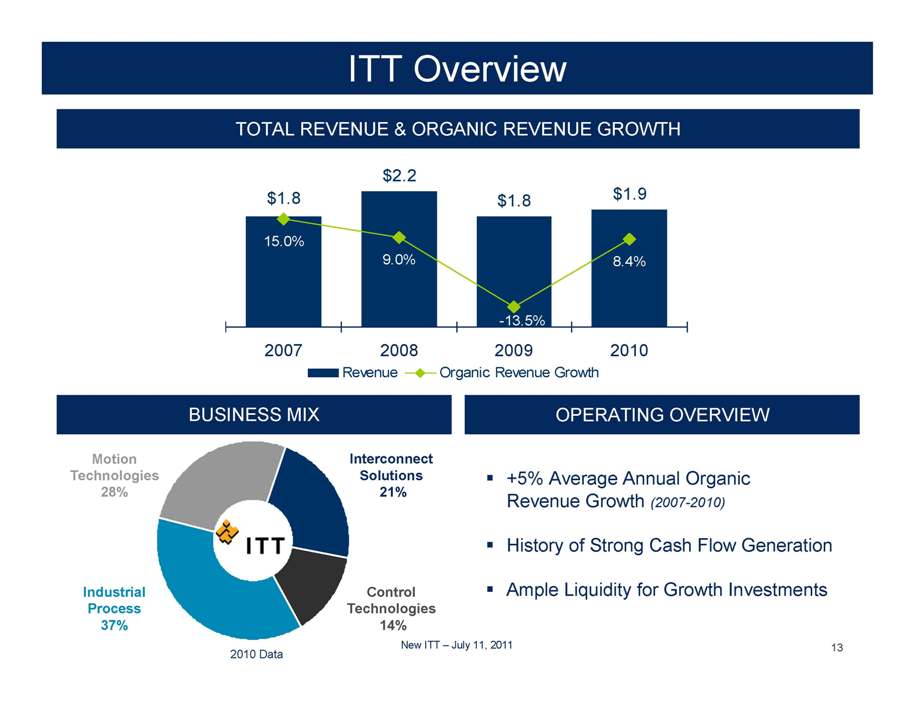
ITT Overview TOTAL REVENUE & ORGANIC REVENUE GROWTH $2.2 $1.8 $1.9 $1.8 8.4% -13.5% 15.0% 9.0% 2007 2008 2009 2010 -20% -10% 0% 10% 20% 30% Revenue Organic Revenue Growth OPERATING OVERVIEW 13 +5% Average Annual Organic Revenue Growth (2007-2010) History of Strong Cash Flow Generation Ample Liquidity for Growth Investments Motion Technologies 28% Control Technologies 14% Interconnect Solutions 21% Industrial Process 37% 2010 Data New ITT – July 11, 2011 Business Mix
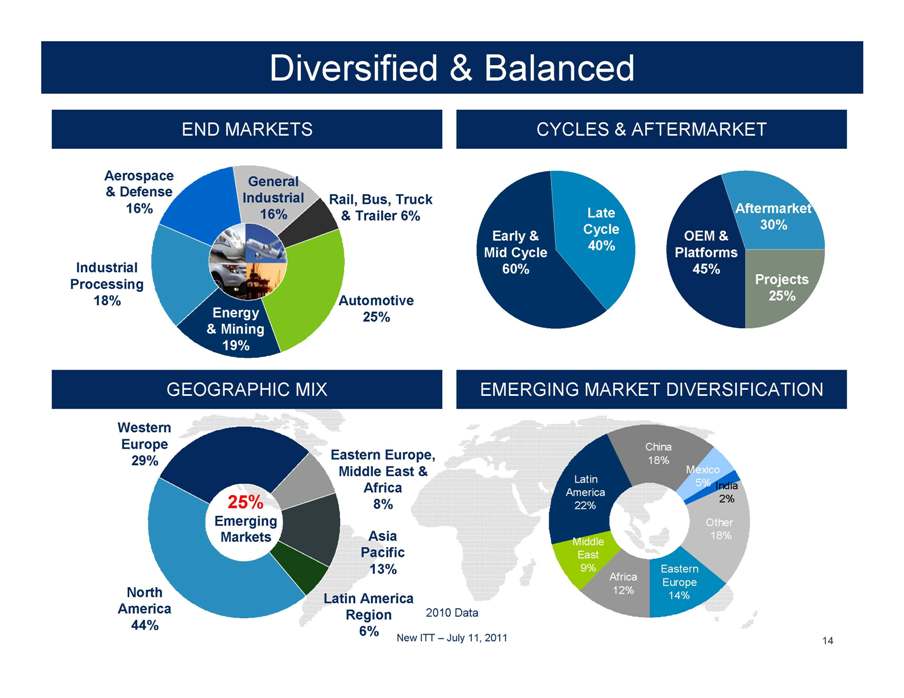
Diversified & Balanced 14 END MARKETS CYCLES & AFTERMARKET Early & Mid Cycle 60% OEM & Platforms 45% Aftermarket 30% Late Cycle 40% Projects 25% Automotive 25% Energy & Mining 19% Aerospace & Defense 16% Industrial Processing 18% General Industrial 16% Rail, Bus, Truck & Trailer 6% 2010 Data EMERGING MARKET DIVERSIFICATION GEOGRAPHIC MIX 25% Emerging Markets North America 44% Asia Pacific 13% Latin America Region 6% Western Europe 29% Eastern Europe, Middle East & Africa 8% India 2% Mexico 5% China 18% Latin America 22% Middle East 9% Africa 12% Eastern Europe 14% Other 18%
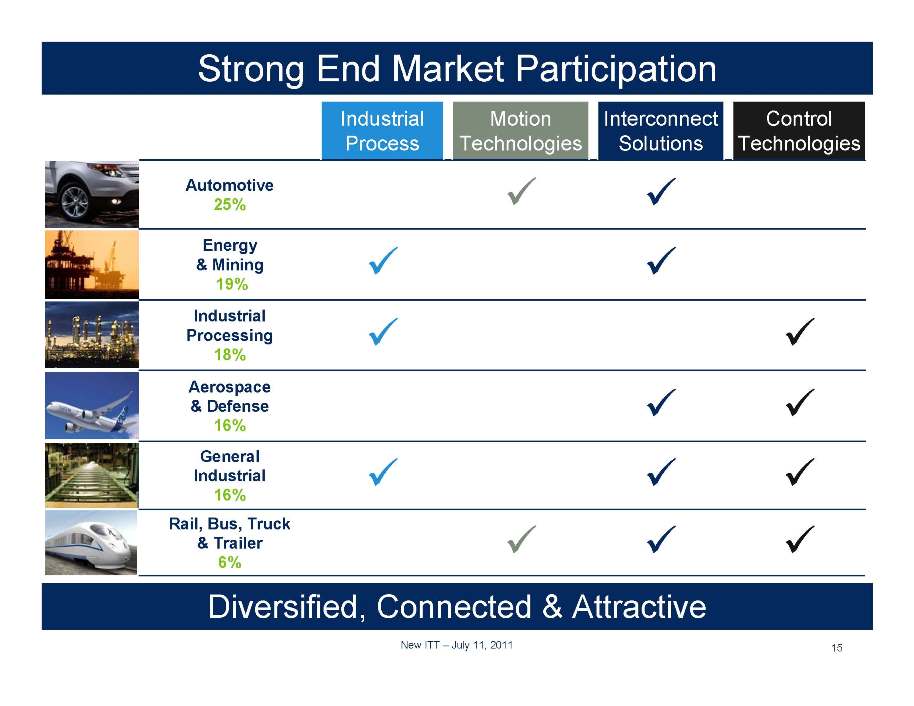
Strong End Market Participation General Industrial 16% Rail, Bus, Truck & Trailer 6% Aerospace & Defense 16% Industrial Processing 18% Energy & Mining 19% Automotive 25% Control Technologies Interconnect Solutions Motion Technologies Industrial Process Diversified, Connected & Attractive 15
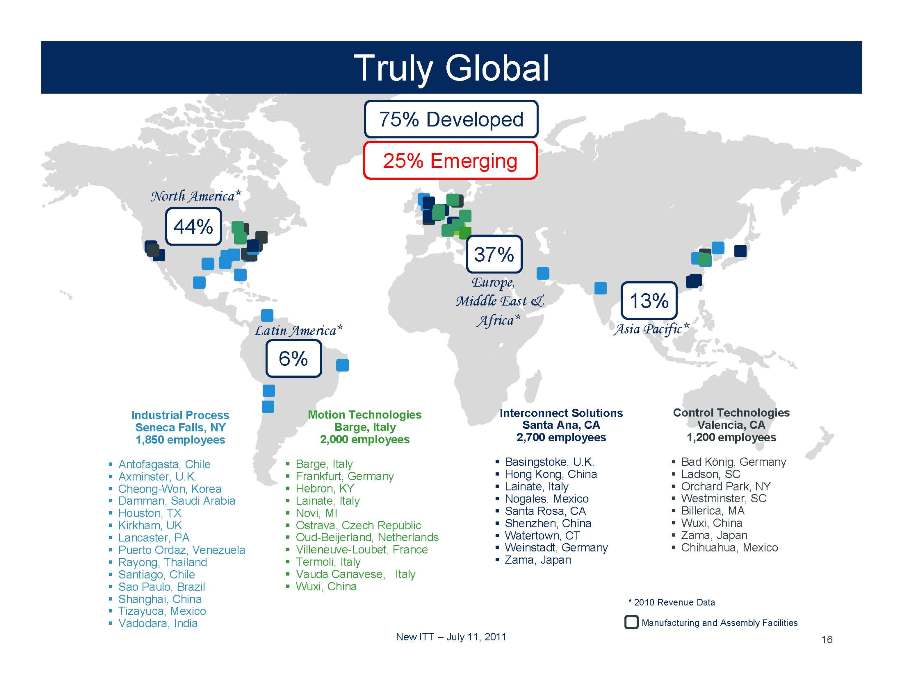
Truly Global North America* Latin America* Europe, Middle East & Africa* Asia Pacific* * 2010 Revenue Data 16 Manufacturing and Assembly Facilities 13% 37% 6% 44% 75% Developed 25% Emerging New ITT – July 11, 2011 Motion Technologies Barge, Italy 2,000 employees Barge, Italy Frankfurt, Germany Hebron, KY Lainate, Italy Novi, MI Ostrava, Czech Republic Oud-Beijerland, Netherlands Villeneuve-Loubet, France Termoli, Italy Vauda Canavese, Italy Wuxi, China Control Technologies Valencia, CA 1,200 employees Bad König, Germany Ladson, SC Orchard Park, NY Westminster, SC Billerica, MA Wuxi, China Zama, Japan Chihuahua, Mexico Interconnect Solutions Santa Ana, CA 2,700 employees Basingstoke, U.K. Hong Kong, China Lainate, Italy Nogales, Mexico Santa Rosa, CA Shenzhen, China Watertown, CT Weinstadt, Germany Zama, Japan Industrial Process Seneca Falls, NY 1,850 employees Antofagasta, Chile Axminster, U.K. Cheong-Won, Korea Damman, Saudi Arabia Houston, TX Kirkham, UK Lancaster, PA Puerto Ordaz, Venezuela Rayong, Thailand Santiago, Chile Sao Paulo, Brazil Shanghai, China Tizayuca, Mexico Vadodara, India * 2010 Revenue Data 16 Manufacturing and Assembly Facilities
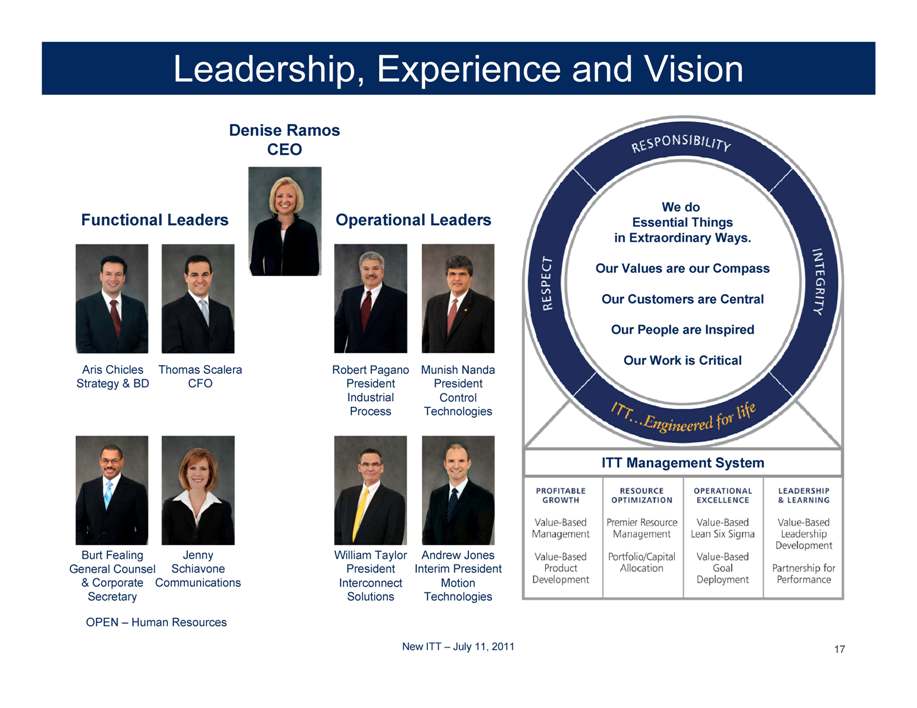
New ITT – July 11, 2011 Denise Ramos CEO Operational Leaders Leadership, Experience and Vision Functional Leaders Jenny Schiavone Communications Robert Pagano President Industrial Process William Taylor President Interconnect Solutions Andrew Jones Interim President Motion Technologies Munish Nanda President Control Technologies Burt Fealing General Counsel & Corporate Secretary Aris Chicles Strategy & BD Thomas Scalera CFO We do Essential Things in Extraordinary Ways. Our Values are our Compass Our Customers are Central Our People are Inspired Our Work is Critical ITT Management System 17 OPEN – Human Resources New ITT – July 11, 2011 Anticipated Board of Directors
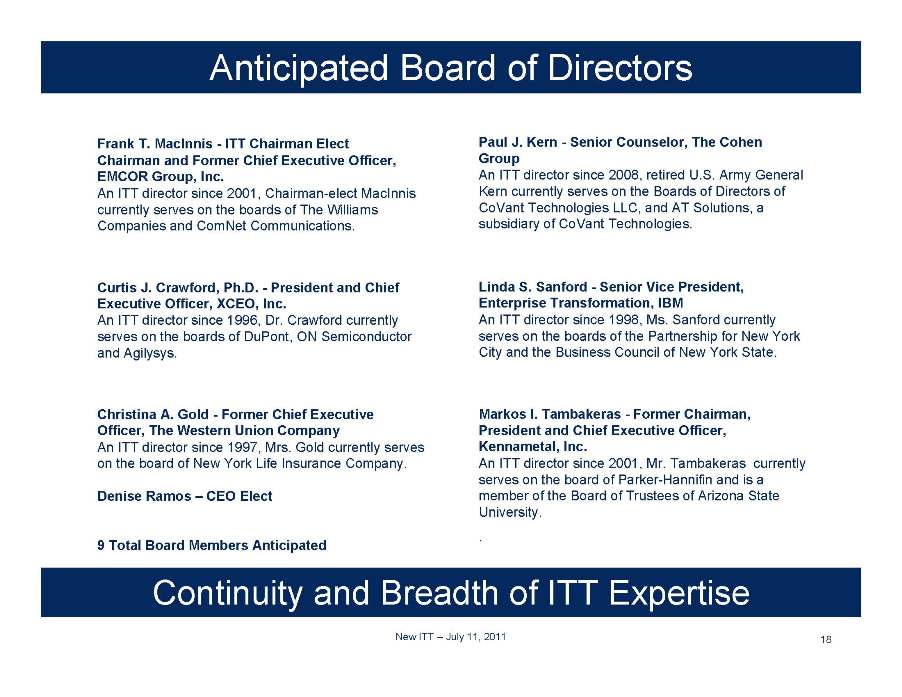
Anticipated Board of Directors Frank T. MacInnis - ITT Chairman Elect Chairman and Former Chief Executive Officer, EMCOR Group, Inc. An ITT director since 2001, Chairman-elect MacInnis currently serves on the boards of The Williams Companies and ComNet Communications. Curtis J. Crawford, Ph.D. - President and Chief Executive Officer, XCEO, Inc. An ITT director since 1996, Dr. Crawford currently serves on the boards of DuPont, ON Semiconductor and Agilysys. Christina A. Gold - Former Chief Executive Officer, The Western Union Company An ITT director since 1997, Mrs. Gold currently serves on the board of New York Life Insurance Company. Denise Ramos – CEO Elect 9 Total Board Members Anticipated Paul J. Kern - Senior Counselor, The Cohen Group An ITT director since 2008, retired U.S. Army General Kern currently serves on the Boards of Directors of CoVant Technologies LLC, and AT Solutions, a subsidiary of CoVant Technologies. Linda S. Sanford - Senior Vice President, Enterprise Transformation, IBM An ITT director since 1998, Ms. Sanford currently serves on the boards of the Partnership for New York City and the Business Council of New York State. Markos I. Tambakeras - Former Chairman, President and Chief Executive Officer, Kennametal, Inc. An ITT director since 2001, Mr. Tambakeras currently serves on the board of Parker-Hannifin and is a member of the Board of Trustees of Arizona State University. Continuity and Breadth of ITT Expertise 18
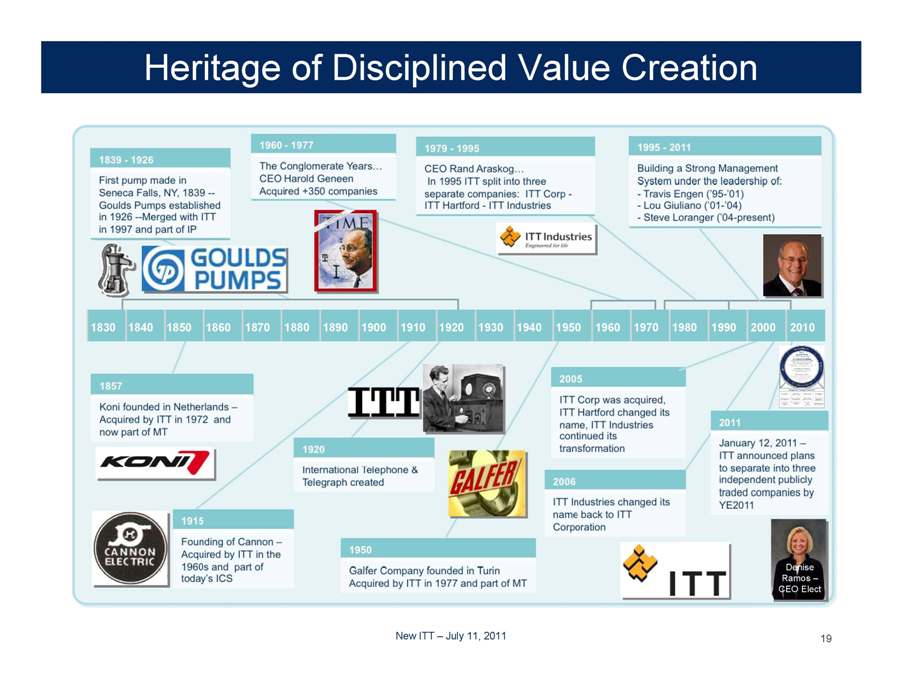
Heritage of Disciplined Value Creation 19 1839-1926 First pump made in Seneca Falls, NY , 1839 – Gould Pumps established in 1926 – Merged with ITT in 1997 and part of IP 1960-1977 The Conglomerate Years … CEO Harold Geneen Acquired +350 companies 1979-1995 CEO Rand Araskog … In 1995 ITT split into three separate companies: ITT Corp – ITT Hartford – ITT Industries 1995-2011 Building a Strong Management under the leadership of : Travis Engen (’95-’01) Lou Giuliano (’01-’04) Steve Loranger {’04-present) 1830 1840 1850 1860 1870 1880 1890 1900 1910 1920 1930 1940 1950 1960 1970 1980 1990 2000 2010 1857 Koni founded in Netherlands – Acquired of by ITT in 1972 and now part of MT 1920 International Telephone and Telegraph created 1915 – Founding of Cannon – Acquired by ITT in the 1960s and part of today’s ICS 1950 Galfer Company founded in Turin Acquired by ITT in 1977 and part of MT 2005 ITT Corp was acquired, ITT Hartford changed its name, ITT Industries continued its transformation 2006 ITT Industries changed its name back to ITT Corporation 2011 January 12, 2011 – ITT announced plans to separate into three independent publicly traded companies by YE2011 Denise Ramos – CEO Elect
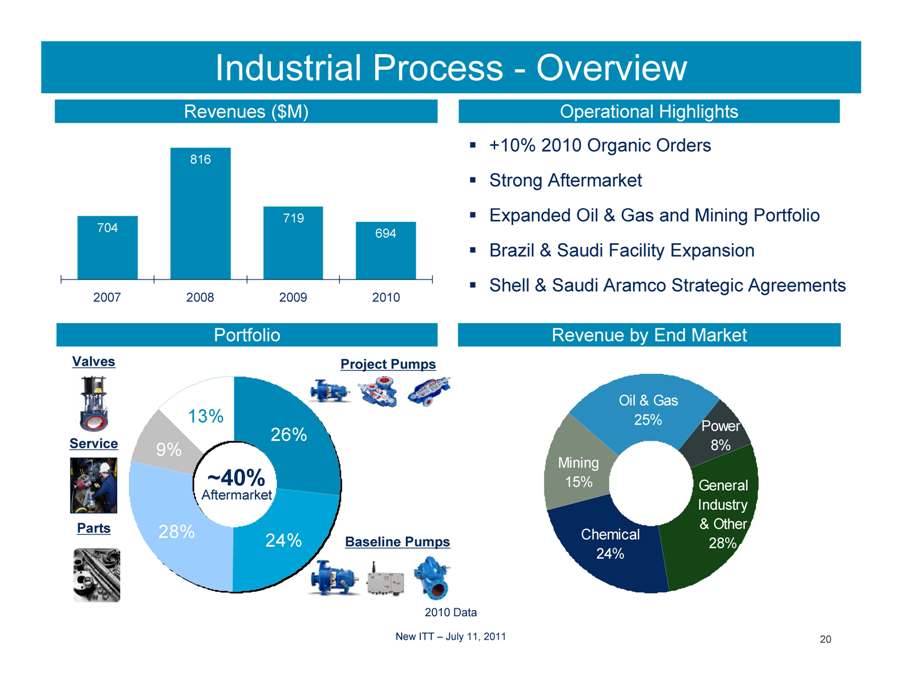
New ITT – July 11, 2011 Oil & Gas 25% Chemical 24% Mining 15% Power 8% General Industry & Other 28% 24% 9% 28% 26% 13% Industrial Process – Overview 704 816 719 694 2007 2008 2009 2010 Revenues ($M) Revenue by End Market Portfolio Valves Service Parts Baseline Pumps 20
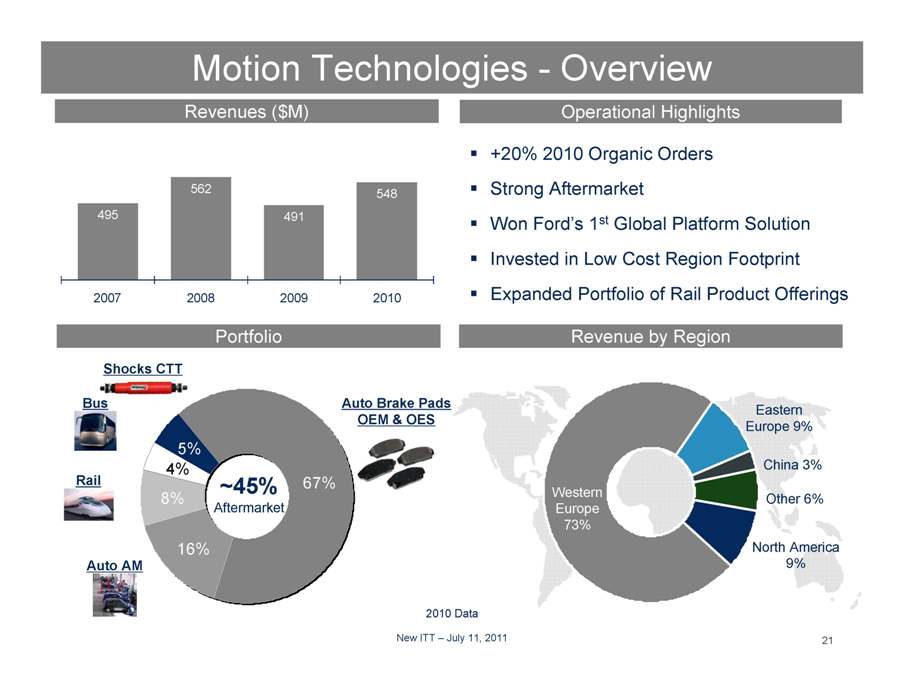
Motion Technologies – Overview 495 562 491 548 2007 2008 2009 2010 Revenues ($M) Revenue by Region Portfolio 21 Operational Highlights +20% 2010 Organic Orders Strong Aftermarket Won Ford’s 1st Global Platform Solution Invested in Low Cost Region Footprint Expanded Portfolio of Rail Product Offerings Western Europe 73% China 3% North America 9% Other 6% Eastern Europe 9% Auto Brake Pads OEM & OES Bus Rail Auto AM ~45% Aftermarket 2010 Data
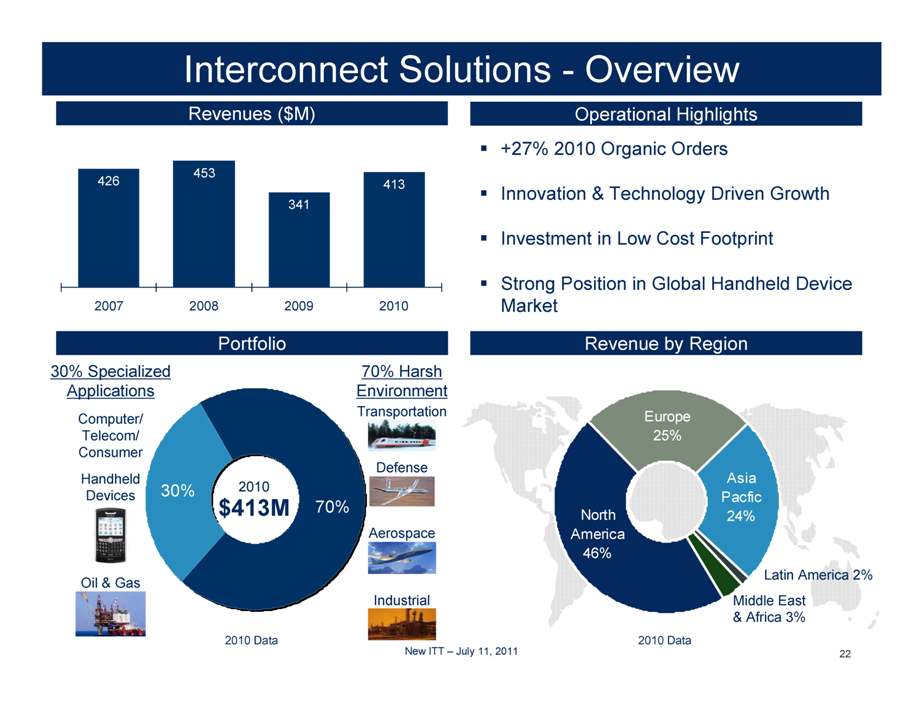
Interconnect Solutions – Overview Revenues ($M) Revenue by Region 70% Harsh Environment 30% Specialized Applications Latin America 2% Middle East & Africa 3% Transportation Defense Aerospace Industrial 2010 $413M 426 453 341 413 2007 2008 2009 2010 22 Portfolio Operational Highlights +27% 2010 Organic Orders Innovation & Technology Driven Growth Investment in Low Cost Footprint Strong Position in Global Handheld Device Market 2010 Data 2010 Data New ITT – July 11, 2011 60% 40%
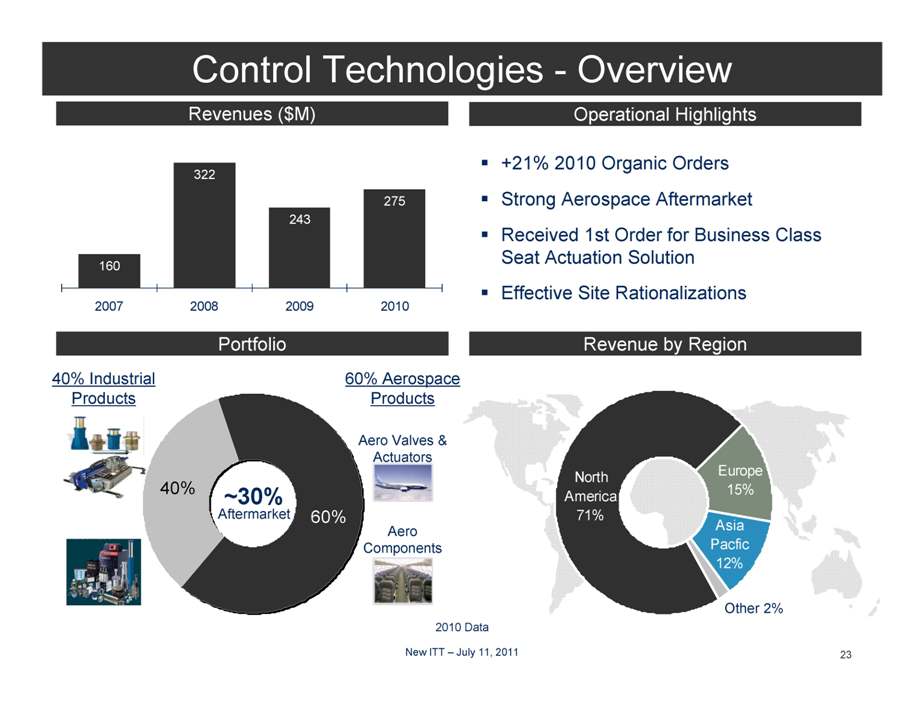
Control Technologies – Overview 160 322 243 275 2007 2008 2009 2010 Revenues ($M) Revenue by Region Asia Pacfic 12% Europe 15% North America 71% Other 2% 40% Industrial Products Aero Components Aero Valves & Actuators 60% Aerospace Products 23 ~30% Aftermarket 2010 Data Portfolio Operational Highlights +21% 2010 Organic Orders Strong Aerospace Aftermarket Received 1st Order for Business Class Seat Actuation Solution Effective Site Rationalizations New ITT – July 11, 2011
We Are Global Specialists in the Engineering and Manufacture of Critical Components that Drive a Diverse Array of Key Industries. We Create Enduring Impacts by Providing Highly Customized Solutions to the Hardest Technical Challenges that Our Valued Customers Face. We Are Leaders in Attractive Niches We Are Truly Global We Are Highly Engineered We Are Committed to a Disciplined Management System We Are ITT
July 11, 2011 ITT Appendix
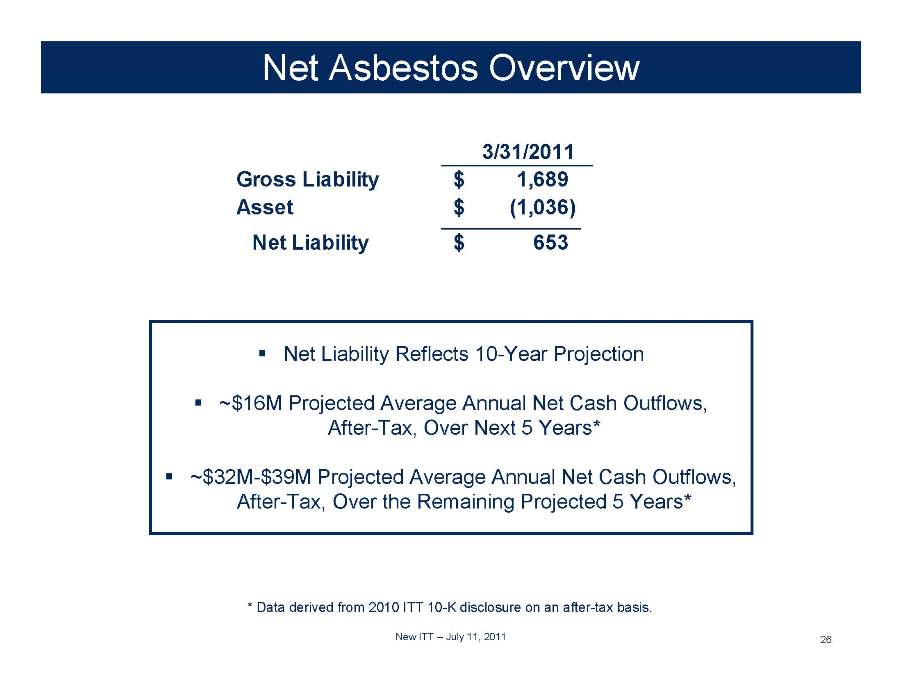
Net Asbestos Overview Net Liability Reflects 10-Year Projection ~$16M Projected Average Annual Net Cash Outflows, After-Tax, Over Next 5 Years* ~$32M-$39M Projected Average Annual Net Cash Outflows, After-Tax, Over the Remaining Projected 5 Years* 26 * Data derived from 2010 ITT 10-K disclosure on an after-tax basis. 3/31/2011 Gross Liability 1,689 $ Asset (1,036) $ Net Liability 653
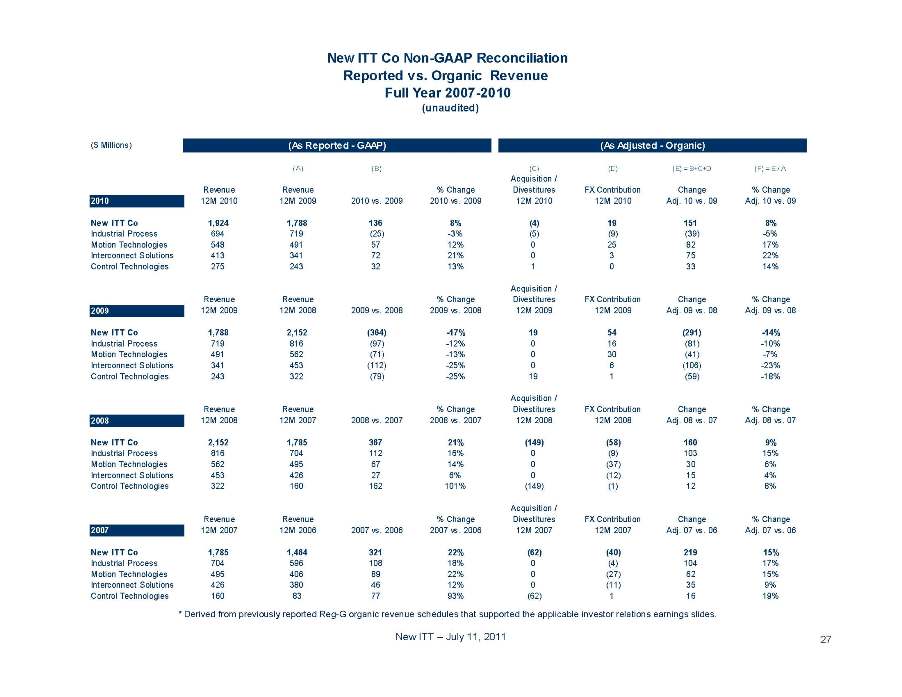
27 (unaudited) ($ Millions) (A) (B) (C) (D) (E) = B+C+D (F) = E / A Revenue Revenue % Change Acquisition / Divestitures FX Contribution Change % Change 2010 12M 2010 12M 2009 2010 vs. 2009 2010 vs. 2009 12M 2010 12M 2010 Adj. 10 vs. 09 Adj. 10 vs. 9 New ITT Co 1,924 1,788 136 8% (4) 19 151 8% Industrial Process 694 719 (25) -3% (5) (9) (39) -5% Motion Technologies 548 491 57 12% 0 25 82 17% Interconnect Solutions 413 341 72 21% 0 3 75 22% Control Technologies 275 243 32 13% 1 0 33 14% Revenue Revenue % Change Acquisition / Divestitures FX Contribution Change % Change 2009 12M 2009 12M 2008 2009 vs. 2008 2009 vs. 2008 12M 2009 12M 2009 Adj. 09 vs. 08 Adj. 09 vs. 08 New ITT Co 1,788 2,152 (364) -17% 19 54 (291) -14% Industrial Process 719 816 (97) -12% 0 16 (81) -10% Motion Technologies 491 562 (71) -13% 0 30 (41) -7% Interconnect Solutions 341 453 (112) -25% 0 6 (106) -23% Control Technologies 243 322 (79) -25% 19 1 (59) -18% Revenue Revenue % Change Acquisition / Divestitures FX Contribution Change % Change 2008 12M 2008 12M 2007 2008 vs. 2007 2008 vs. 2007 12M 2008 12M 2008 Adj. 08 vs. 07 Adj. 08 vs. 07 New ITT Co 2,152 1,785 367 21% (149) (58) 160 9% Industrial Process 816 704 112 16% 0 (9) 103 15% Motion Technologies 562 495 67 14% 0 (37) 30 6% Interconnect Solutions 453 426 27 6% 0 (12) 15 4% Control Technologies 322 160 162 101% (149) (1) 12 8% Revenue Revenue % Change Acquisition / Divestitures FX Contribution Change % Change 2007 12M 2007 12M 2006 2007 vs. 2006 2007 vs. 2006 12M 2007 12M 2007 Adj. 07 vs. 06 Adj. 07 vs. 06 New ITT Co 1,785 1,464 321 22% (62) (40) 219 15% Industrial Process 704 596 108 18% 0 (4) 104 17% Motion Technologies 495 406 89 22% 0 (27) 62 15% Interconnect Solutions 426 380 46 12% 0 (11) 35 9% Control Technologies 160 83 77 93% (62) 1 16 19% (As Reported - GAAP) (As Adjusted - Organic) New ITT Co Non-GAAP Reconciliation Reported vs. Organic Revenue Full Year 2007-2010 * Derived from previously reported Reg-G organic revenue schedules that supported the applicable investor relations earnings slides.
July 11, 2011 Water Co. Overview
29 Safe Harbor Statement Safe Harbor Statement under the Private Securities Litigation Reform Act of 1995 (the “Act”): Certain material presented herein includes forward-looking statements intended to qualify for the safe harbor from liability established by the Private Securities Litigation Reform Act of 1995. These forward-looking statements include, but are not limited to, statements about the separation of ITT Corporation (“the Company”) into three independent publicly-traded companies (“the companies”), the terms and the effect of the separation, the nature and impact of such a separation, capitalization of the companies, future strategic plans and other statements that describe the companies’ business strategy, outlook, objectives, plans, intentions or goals, and any discussion of future operating or financial performance. Whenever used, words such as "anticipate," "estimate," "expect," "project," "intend," "plan,""believe," "target" and other terms of similar meaning are intended to identify such forward-looking statements. Forward-looking statements are uncertain and to some extent unpredictable, and involve known and unknown risks, uncertainties and other important factors that could cause actual results to differ materially from those expressed or implied in, or reasonably inferred from, such forward-looking statements. Factors that could cause results to differ materially from those anticipated include, but are not limited to: • Economic, political and social conditions in the countries in which we conduct our businesses; • Changes in U.S. or International government defense budgets; • Decline in consumer spending; • Sales and revenues mix and pricing levels; • Availability of adequate labor, commodities, supplies and raw materials; • Interest and foreign currency exchange rate fluctuations and changes in local government regulations; • Competition, industry capacity & production rates; • Ability of third parties, including our commercial partners, counterparties, financial institutions and insurers, to comply with their commitments to us; • Our ability o borrow or to refinance our existing indebtedness and availability of liquidity sufficient o meet our needs; • Changes in the value of goodwill or intangible assets; • Our ability to achieve stated synergies or cost savings from acquisitions or divestitures; • The number of personal injury claims filed against the companies or the degree of liability; • Uncertainties with respect to our estimation of asbestos liability exposures, third-party recoveries and net cash flow; • Our ability to effect restructuring and cost reduction programs and realize savings from such actions; • Government regulations and compliance therewith, including Dodd-Frank legislation; • Changes in technology; • Intellectual property matters; • Governmental investigations; • Potential future employee benefit plan contributions and other employment and pension matters; • Contingencies related to actual or alleged environmental contamination, claims and concerns; • Changes in generally accepted accounting principles; and • Other factors set forth in our Annual Report on Form 10−K for the fiscal year ended December 31, 2010 and our other filings with the Securities and Exchange Commission. • In addition, there are risks and uncertainties relating to the planned tax-free spinoffs of our Water and Defense businesses, including the timing and certainty of the completion of those transactions, whether those transactions will result in any tax liability, the operational and financial profile of the Company or any of its businesses after giving effect to the spinoff transactions, and the ability of each business to operate as an independent entity. The Company undertakes no obligation to update any forward-looking statements, whether as a result of new information, future events or otherwise.
July 11, 2011 30 Water Co. Overview • Leading positions in attractive markets across the water industry • Among the largest equipment and service providers in water and wastewater • Global distribution channel with established brands • Leading transport, treatment and test capabilities • Global scale with local application engineering capabilities Deep application expertise provided to full spectrum of water customers
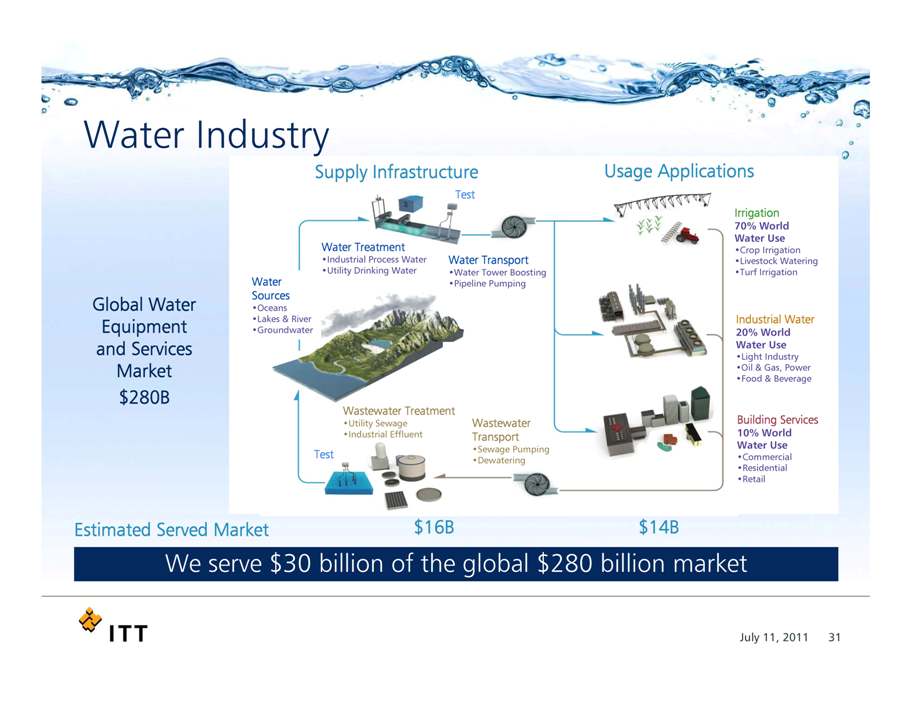
31 Water Industry Supply Infrastructure Water Sources •Oceans •Lakes & River •Groundwater Irrigation 70% World Water Use •Crop Irrigation •Livestock Watering •Turf Irrigation Industrial Water 20% World Water Use •Light Industry •Oil & Gas, Power •Food & Beverage Building Services 10% World Water Use •Commercial •Residential •Retail Test Wastewater Treatment •Utility Sewage •Industrial Effluent Wastewater Transport •Sewage Pumping •Dewatering Test Water Treatment •Industrial Process Water •Utility Drinking Water Water Transport •Water Tower Boosting •Pipeline Pumping We serve $30 billion of the global $280 billion market Usage Applications Global Water Equipment and Services Market $280B Estimated Served Market $16B $1
July 11, 2011 32 Water Co. Strengths Leading global brands and channels Culture of innovation and strong applications expertise Large installed base drives strong aftermarket revenue Diverse customer base and product portfolio Disciplined productivity providing multi-year margin expansion opportunities Management team with significant water industry and global public company experience World leader in design, manufacturing and applications of highly engineered products and services
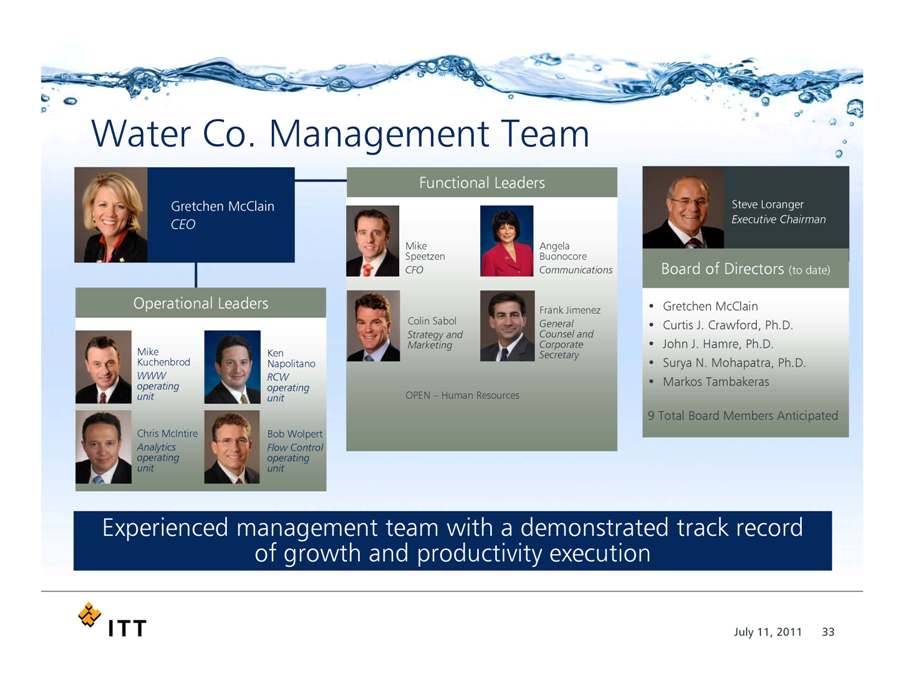
July 11, 2011 33 Water Co. Management Team Experienced management team with a demonstrated track record of growth and productivity execution Steve Loranger Executive Chairman Gretchen McClain CEO Mike Kuchenbrod WWW operating Unit Chris McIntire Analytics operating unit Ken Napolitano RCW operating unit Bob Wolpert Flow Control operating unit Functional Leaders Mike Speetzen CFO Angela Buonocore Communications Frank Jimenez General Counsel and Corporate Secretary Colin Sabol Strategy and Marketing Board of Directors (to date) • Gretchen McClain • Curtis J. Crawford, Ph.D. • John J. Hamre, Ph.D. • Surya N. Mohapatra, Ph.D. • Markos Tambakeras 9 Total Board Members Anticipated OPEN – Human Resources
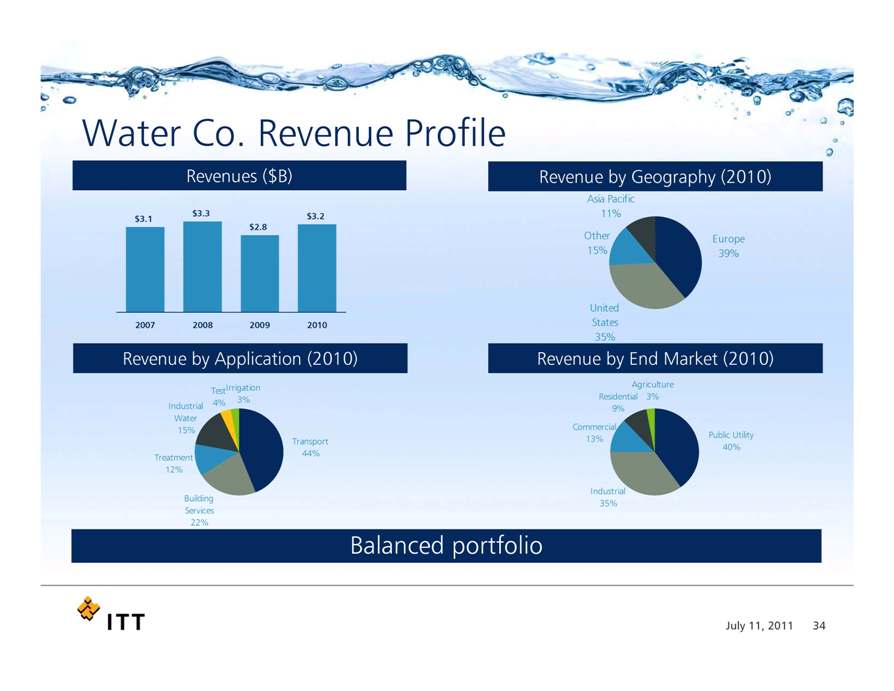
34 Public Utility 40% Industrial 35% Commercial 13% Residential 9% Agriculture 3% Transport 44% Building Services 22% Treatment 12% Industrial Water 15% Test 4% Irrigation 3% Water Co. Revenue Profile Balanced portfolio Revenues ($B) Revenue by Geography (2010) Europe 39% United States 35% Other 15% Asia Pacific 11% Revenue by End Market (2010) Revenue by Application (2010) $3.1 $3.3 $2.8 $3.2 2007 2008 2009 2010
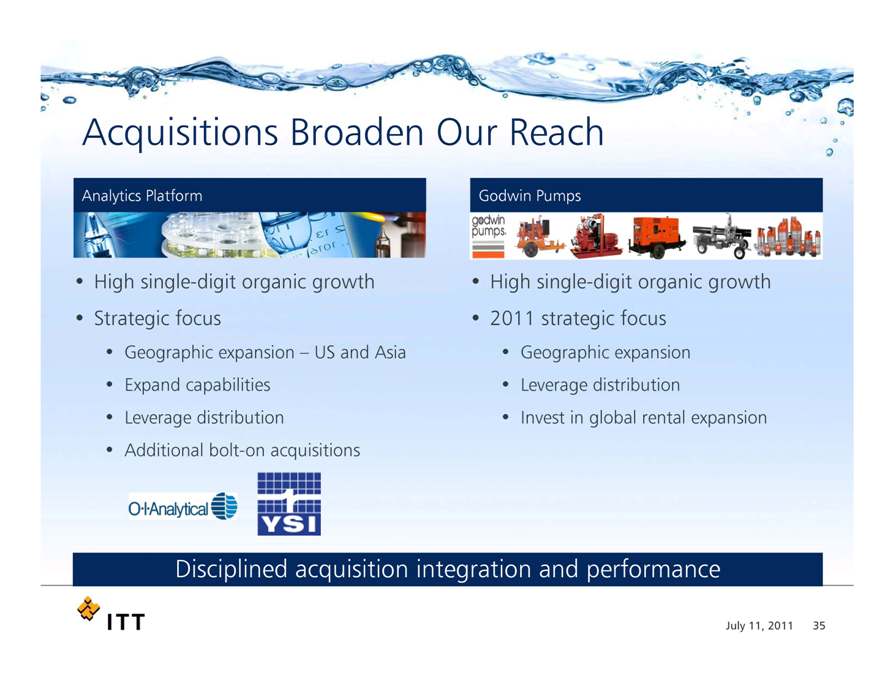
35 Acquisitions Broaden Our Reach • High single-digit organic growth • 2011 strategic focus • Geographic expansion • Leverage distribution • Invest in global rental expansion • High single-digit organic growth • Strategic focus • Geographic expansion – US and Asia • Expand capabilities • Leverage distribution • Additional bolt-on acquisitions Godwin Pumps Analytics Platform Disciplined acquisition integration and performance
Defense Co Overview July 11, 2011
37 Defense Co Safe Harbor Safe Harbor Statement under the Private Securities Litigation Reform Act of 1995 (the “Act”): Certain material presented herein includes forward‐looking statements intended to qualify for the safe harbor from liability established by the Private Securities Litigation Reform Act of 1995. These forward‐looking statements include, but are not limited to, statements about the separation of ITT Corporation (“the Company”) into three independent publicly‐traded companies (“the companies”), the terms and the effect of the separation, the nature and impact of such a separation, capitalization of the companies, future strategic plans and other statements that describe the companies’ business strategy, outlook, objectives, plans, intentions or goals, and any discussion of future operating or financial performance. Whenever used, words such as "anticipate," "estimate," "expect," "project," "intend," "plan," "believe," "target" and other terms of similar meaning are intended to identify such forward‐looking statements. Forward‐looking statements are uncertain and to some extent unpredictable, and involve known and unknown risks, uncertainties and other important factors that could cause actual results to differ materially from those expressed or implied in, or reasonably inferred from, such forward‐looking statements. Factors that could cause results to differ materially from those anticipated include, but are not limited to: The Company undertakes no obligation to update any forward-looking statements, whether as a result of new information, future events or otherwise. Economic, political and social conditions in the countries in which we conduct our businesses; Changes in U.S. or International government defense budgets; Decline in consumer spending; Sales and revenues mix and pricing levels; Availability of adequate labor, commodities, supplies and raw materials; Interest and foreign currency exchange rate fluctuations and changes in local government regulations; Competition, industry capacity & production rates; Ability of third parties, including our commercial partners, counterparties, financial institutions and insurers, to comply with their commitments to us; Our ability to borrow or to refinance our existing indebtedness and availability of liquidity sufficient to meet our needs; Changes in the value of goodwill or intangible assets; Our ability to achieve stated synergies or cost savings from acquisitions or divestitures; The number of personal injury claims filed against the companies or the degree of liability; Uncertainties with respect to our estimation of asbestos liability exposures, third‐party recoveries and net cash flow; Our ability to effect restructuring and cost reduction programs and realize savings from such actions; Government regulations and compliance therewith, including Dodd‐Frank legislation; Changes in technology; Intellectual property matters; Governmental investigations; Potential future employee benefit plan contributions and other employment and pension matters; Contingencies related to actual or alleged environmental contamination, claims and concerns; Changes in generally accepted accounting principles; and Other factors set forth in our Annual Report on Form 10−K for the fiscal year ended December 31, 2010 and our other filings with the Securities and Exchange Commission. In addition, there are risks and uncertainties relating to the planned tax‐free spinoffs of our Water and Defense businesses, including the timing and certainty of the completion of those transactions, whether those transactions will result in any tax liability, the operational and financial profile of the Company or any of its businesses after giving effect to the spinoff transactions, and the ability of each business to operate as an independent entity. The guidance for full‐year 2011 is based on the Company’s current structure and does not give effect to the separation of our Water and Defense businesses into newly independent public companies.
38 Defense Co Mission‐critical systems, sub‐systems and components for diverse customer needs – Cost‐efficient, platform‐agnostic product and service offerings Portfolio and investment priorities well aligned with U.S. DoD, FAA, NASA/NOAA, intelligence community, and global security priorities and trends Serves military, civil government and commercial customers in the U.S. and abroad Backlog position has benefited from a large fielded base for upgrades and sustainment Legacy of disciplined financial management translates to: – Reliable cash flows – Diversity of business – Investment decisions with no undue risk of program cancellations or high‐risk strategies Defense Co Overview
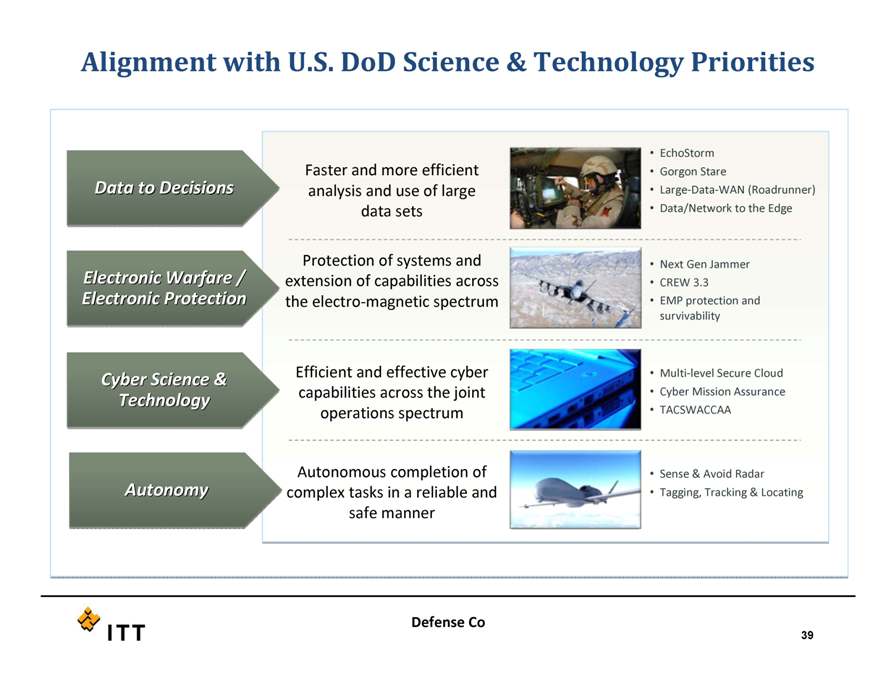
39 Defense Co Electronic Warfare / Electronic Warfare / Electronic Protection Electronic Protection Autonomy Autonomy Data to Decisions Data to Decisions Cyber Science & Cyber Science & Technology Technology Protection of systems and extension of capabilities across the electro‐magnetic spectrum • Next Gen Jammer • CREW 3.3 • EMP protection and survivability Autonomous completion of complex tasks in a reliable and safe manner • Sense & Avoid Radar • Tagging, Tracking & Locating Faster and more efficient analysis and use of large data sets • EchoStorm • Gorgon Stare • Large‐Data‐WAN (Roadrunner) • Data/Network to the Edge Efficient and effective cyber capabilities across the joint operations spectrum • Multi‐level Secure Cloud • Cyber Mission Assurance • TACSWACCAA Alignment with U.S. DoD Science & Technology Priorities
40 Defense Co Competitive Advantages Premier operating performance Attractive positions in long‐term growth areas including integrated electronic warfare, information exploitation, navigation and surveillance More diversified than most first‐tier suppliers Significant positions in non‐DoD markets (ATM, NASA, International) Platform agnostic solutions Superb brand equity among our customers – “Adaptive Ingenuity”
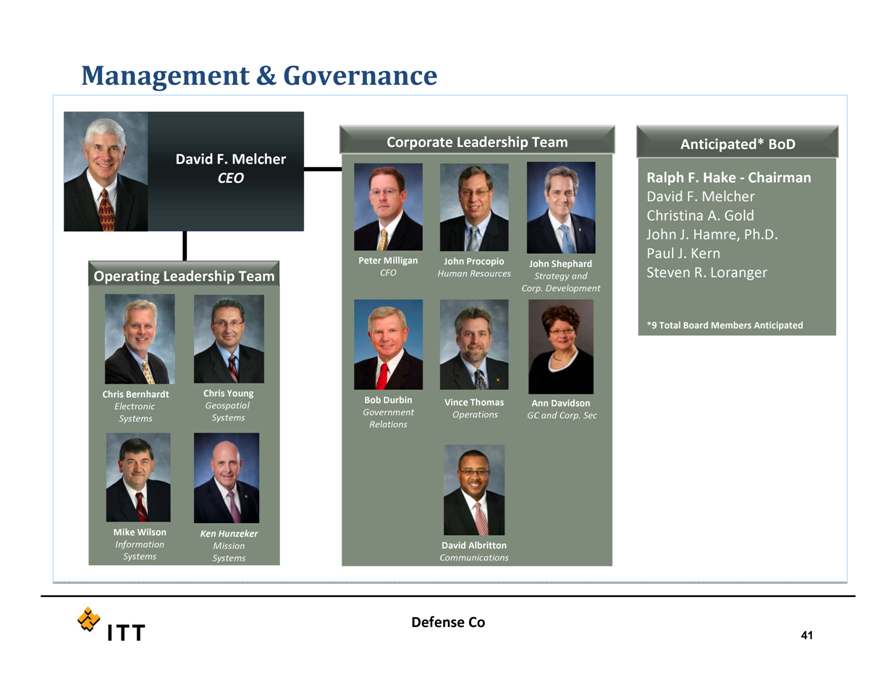
Defense Co Management & Governance Ralph F. Hake ‐ Chairman David F. Melcher Christina A. Gold John J. Hamre, Ph.D. Paul J. Kern Steven R. Loranger *9 Total Board Members Anticipated David F. Melcher CEO Mike Wilson Information Systems Chris Young Geospatial Systems Chris Bernhardt Electronic Systems Operating Leadership Team Ken Hunzeker Mission Systems Vince Thomas Operations Peter Milligan CFO John Procopio Human Resources Ann Davidson GC and Corp. Sec David Albritton Communications John Shephard Strategy and Corp. Development Bob Durbin Government Relations
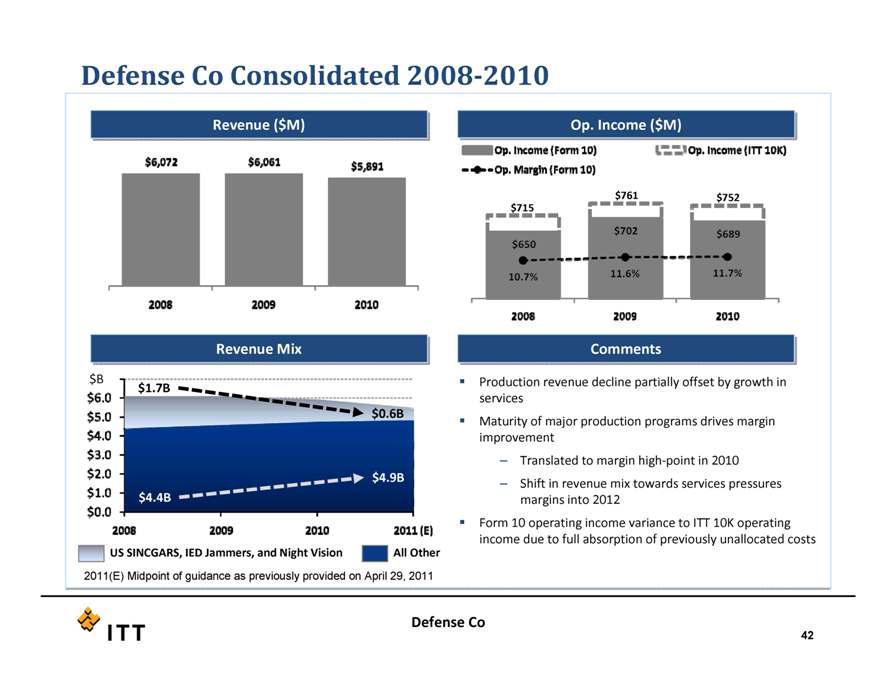
Defense Co Consolidated 2008 2010 Revenue ($M) Revenue ($M) Op. Income ($M) Op. Income ($M) Production revenue decline partially offset by growth in services Maturity of major production programs drives margin improvement – Translated to margin high‐point in 2010 – Shift in revenue mix towards services pressures margins into 2012 Form 10 operating income variance to ITT 10K operating income due to full absorption previously unallocated costs $715 $761 $752 Comments Comments Revenue Mix Revenue Mix $1.7B $0.6B $4.4B $4.9B $B US SINCGARS, IED Jammers, and Night Vision All Other 2011(E) Midpoint of guidance as previously provided on April 29, 2011 43 Defense Co Defense Co 2010 Revenue Segmentation Customers Customers Products vs. Services Products vs. Services Cost Plus vs. Fixed Price Cost Plus vs. Fixed Price Products 61% Services 39% Cost Plus 48% Fixed Price 52% ~27% Outside U.S. Armed Services Army Other Navy Air Force International (incl. FMS) Other Non‐DoD NASA Commercial FAA
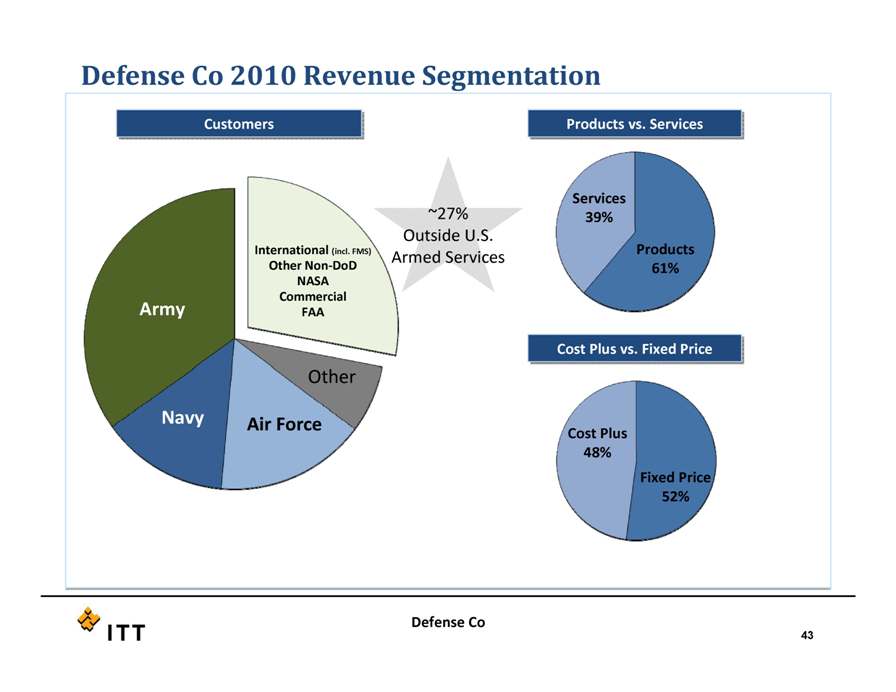
43 Defense Co Defense Co 2010 Revenue Segmentation Customers Customers Products vs. Services Products vs. Services Cost Plus vs. Fixed Price Cost Plus vs. Fixed Price Products 61% Services 39% Cost Plus 48% Fixed Price 52% ~27% Outside U.S. Armed Services Army Other Navy Air Force International (incl. FMS) Other Non‐DoD NASA Commercial FAA