Attached files
UNITED STATES
SECURITIES AND EXCHANGE COMMISSION
Washington, D.C. 20549
FORM 10-K
| þ | ANNUAL REPORT PURSUANT TO SECTION 13 OR 15(d) OF THE SECURITIES EXCHANGE ACT OF 1934: |
For the fiscal year ended April 30, 2011
OR
| ¨ | TRANSITION REPORT PURSUANT TO SECTION 13 OR 15(d) OF THE SECURITIES EXCHANGE ACT OF 1934 |
Commission File No. 000-24385
SCHOOL SPECIALTY, INC.
(Exact name of Registrant as specified in its charter)
| Wisconsin | 39-0971239 | |
| (State or other jurisdiction of incorporation or organization) |
(I.R.S. Employer Identification No.) | |
| W6316 Design Drive Greenville, Wisconsin |
54942 | |
| (Address of principal executive offices) | (Zip Code) | |
Registrant’s telephone number, including area code: (920) 734-5712
Securities registered pursuant to Section 12(b) of the Act:
| Title of each class |
Name of each exchange on which registered | |
| Common Stock, $0.001 par value | Nasdaq Global Select Market |
Securities registered pursuant to Section 12(g) of the Act: None
Indicate by check mark if the Registrant is a well-known seasoned issuer, as defined in Rule 405 of the Securities Act. Yes ¨ No þ
Indicate by check mark if the Registrant is not required to file reports pursuant to Section 13 or Section 15(d) of the Act. Yes ¨ No þ
Indicate by check mark whether the Registrant (1) has filed all reports required to be filed by Section 13 or 15(d) of the Securities Exchange Act of 1934 during the preceding 12 months (or for such shorter period that the Registrant was required to file such reports), and (2) has been subject to such filing requirements for the past 90 days. Yes þ No ¨
Indicate by check mark whether the registrant has submitted electronically and posted on its corporate website, if any, every Interactive Data File required to be submitted and posted pursuant to Rule 405 of Regulation S-T during the preceding 12 months (or for such shorter period that the registrant was required to submit and post such files). Yes ¨ No ¨
Indicate by check mark whether the Registrant is a large accelerated filer, an accelerated filer, a non-accelerated filer, or a smaller reporting company. See definitions of “large accelerated filer,” “accelerated filer” and “smaller reporting company” in Rule 12b-2 of the Exchange Act. (Check one):
| Large accelerated filer ¨ | Accelerated filer þ | Non-accelerated filer ¨ | Smaller reporting company ¨ | |||
| (Do not check if smaller reporting company) |
Indicate by check mark if disclosure of delinquent filers pursuant to Item 405 of Regulation S-K is not contained herein, and will not be contained, to the best of Registrant’s knowledge, in definitive proxy or information statements incorporated by reference in Part III of this Form 10-K or any amendment to this Form 10-K. þ
Indicate by check mark whether the registrant is a shell company (as defined in Rule 12b-2 of the Exchange Act). Yes ¨ No þ
The aggregate market value of the voting stock held by nonaffiliates of the Registrant, as of October 23, 2010, was approximately $245,994,592. As of June 10, 2011, there were 18,980,335 shares of the Registrant’s common stock outstanding.
DOCUMENTS INCORPORATED BY REFERENCE
Portions of the Proxy Statement for the Annual Meeting of Shareholders to be held on August 23, 2011 are incorporated by reference into Part III.
PART I
| Item 1. | Business |
Unless the context requires otherwise, all references to “School Specialty,” the “Company,” “we” or “our” refer to School Specialty, Inc. and its subsidiaries. Our fiscal year ends on the last Saturday in April of each year. In this Annual Report on Form 10-K (“Annual Report”), we refer to fiscal years by reference to the calendar year in which they end (e.g., the fiscal year ended April 30, 2011, is referred to as “fiscal 2011”).
Company Overview
School Specialty is a leading education company serving the pre-kindergarten through twelfth grade (“preK-12”) market with innovative and value-added instructional solutions that address the full spectrum of educational needs, from basic school supplies to standards-based curriculum solutions. The Company offers its products through two operating groups: Accelerated Learning and Educational Resources. Accelerated Learning provides core and supplemental curriculum programs that help educators deepen students’ subject matter understanding and accelerate the speed of learning. This group intends to expand its portfolio of instructional programs, combining print-based and digital instructional and assessment tools to deliver value to educators and build competitive advantages in the marketplace. The Educational Resources group offers educators the broadest range and deepest assortment of basic school supplies, supplemental learning products, classroom equipment and furniture available from a single supplier. That positioning creates competitive advantages in the ability to aggregate products and deliver materials in cross curricular and educational category kits. The group further differentiates itself through proprietary product development activities that result in innovative approaches to early childhood and student learning. In addition, the Company has begun offering a value-add consulting service to schools and school districts in order to provide time and money-saving options to school administrators.
Across both groups, we reach our customers through the industry’s largest sales force of approximately 540 professionals, 16.7 million catalogs, and our proprietary e-commerce websites. In fiscal 2011, we believe we sold products to approximately 70% of the estimated 130,000 schools in the United States and we believe we reached a majority of the 3.8 million teachers in those schools. For fiscal 2011 we generated revenues of $762.1 million.
The following is a more complete description of our two operating groups, or segments. Financial information about our segments, as well as geographic information, is included in Note 14 under Item 8, Financial Statements and Supplementary Data.
Accelerated Learning Segment Our Accelerated Learning segment is a preK-12 curriculum-based publisher of proprietary and nonproprietary products and services supporting the following areas:
| • | Science |
| • | Math |
| • | Reading and Math Intervention |
| • | Planning and Student Development |
| • | Coordinated School Health |
Products in our Accelerated Learning segment are typically sold to teachers, curriculum specialists and other educators with direct responsibility for advancing student outcomes.
Accelerated Learning develops standards-based curriculum products, supplemental curriculum materials, instructional programs and student assessment tools. Its offerings are both comprehensive and targeted to address specific learning needs, drive improved student performance, engage learners and accelerate the learning process.
1
A team of more than 50 product development associates create and work with an impressive stable of outside developers, authors, co-publishing strategic partners and consultants to develop educational products and solutions that satisfy curriculum standards and improve classroom teaching effectiveness.
Our product portfolio is guided by K-12 curriculum standards, which can vary by state, but there is a consistency that allows for the creation of nationally marketed programs with the occasional customized development of state-specific curriculum solutions. We believe our Accelerated Learning operating segment provides a very broad collection of educational programs that effectively combines supplemental curriculum solutions, academic planning and organization, inquiry based (hands-on) learning, comprehensive learning kits, extensive performance assessments, and consultant-led or web-delivered teacher training.
Our Accelerated Learning segment product lines include Wordly Wise 3000®, PremierTM Agendas, Delta EducationTM, FOSS®, CPO ScienceTM, Frey Scientific®, Educator’s Publishing Service, Academy of Reading®, ThinkMath!TM, MCI®, S.P.I.R.E. ® and SPARKTM. Our Accelerated Learning products and services accounted for approximately 30% of School Specialty revenues in fiscal 2011.
Educational Resources Segment Our Educational Resources segment provides supplemental educational materials to educators in the preK-12 market. Products include a comprehensive line of everyday consumables and instructional materials. Educational Resources products are marketed using a category management structure that focuses on customer segments within three primary product categories: Administrator, Educator and Furniture.
| • | The Administrator category offers basic classroom supplies, office products, janitorial and sanitation supplies, school equipment, technology products and paper. |
| • | The Educator category includes supplemental learning materials, teaching resources, upper-grade-level art supplies, early childhood products, physical education equipment and special needs equipment and classroom technology. |
| • | The Furniture category includes classroom furniture, library furniture, cafeteria furniture, office furniture, fixed furniture such as bleachers and lockers, as well as construction and project management services. |
We believe Educational Resources offers the broadest range and deepest assortment of basic school supplies, supplemental learning products, classroom equipment and furniture available from a single supplier. It also differentiates its offerings through proprietary product development that results in innovative instructional tools and service solutions for the education marketplace. Its ability to provide offerings across a broad range of educational categories, aggregate school purchases, and offer a suite of value-added professional services helps save school administrators’ time and money by providing solutions to supply chain issues, back-to-school logistics and construction management services.
Educational Resources products include both national brands and proprietary branded product. The segment’s well-known proprietary brands include Education Essentials®, Sportime®, Childcraft®, Sax® Arts & Crafts, Califone®, abc®, Abilitations®, School Smart®, Classroom SelectTM and Projects by Design®. Educational Resources products and services accounted for approximately 70% of School Specialty revenues for fiscal 2011.
As acquisitions have allowed us to solidify our leading position within the industry, expand our educational content and curriculum development capabilities, enhance our product and technology offerings and broaden our market reach. In addition, our disciplined integration execution has consistently enabled us to reduce redundant costs, increase buying power and consolidate call centers and distribution facilities, resulting in improved profitability for the businesses we have acquired. We remain focused on organic growth and will continue to pursue selective acquisition opportunities that we believe will enhance our position as the leading provider of supplemental educational products and services in the United States and Canada. Our business is highly seasonal, with peak sales levels occurring from June through October coinciding with the onset of traditional new school years.
2
School Specialty, Inc., founded in October 1959, was acquired by U.S. Office Products in May 1996. In June 1998, School Specialty was spun-off from U.S. Office Products in a tax-free transaction. Our common stock is listed on The Nasdaq Global Select Market under the symbol “SCHS.” In August 2000, we reincorporated from Delaware to Wisconsin. Our principal offices are located at W6316 Design Drive, Greenville, Wisconsin 54942, and our telephone number is (920) 734-5712. Our general website address is www.schoolspecialty.com. You may obtain, free of charge, copies of this Annual Report on Form 10-K as well as our Quarterly Reports on Form 10-Q and our Current Reports on Form 8-K (and amendments to those reports) filed with, or furnished to, the Securities Exchange Commission as soon as reasonably practicable after we have filed or furnished such reports by accessing our website at http://www.schoolspecialty.com, selecting “Investors” and then selecting the “SEC Filings” link. Information contained in any of our websites is not deemed to be a part of this Annual Report.
Industry Overview
The United States preK-12 education market is a large industry that has historically exhibited attractive and stable growth characteristics, despite fluctuations in the U.S. economy. For example, during the recessions of 1981-1983, 1991-1992 and 2001-2002, preK-12 education funding in the United States grew at compound annual growth rates (“CAGRs”) of 5.3%, 5.0% and 4.7%, respectively. However, the significant downturn in the general economy over 2008 through 2011 has had a major impact on all sectors of the economy, including education. State budget issues have negatively impacted school funding and, in turn, school spending more severely than in prior recessions. However, in the long term, we expect total educational expenditures (excluding capital outlays and interest on debt) to continue to rise when state funding returns to more normalized levels. While the current macroeconomic events have created an unprecedented reduction in school budgets, spending per student and student enrollment are the two primary drivers of future education expenditures, and each is predicted to rise over the next eight years. According to the National Center for Education Statistics, public and private preK-12 enrollment is projected to rise from 55.3 million in 2009-10 school year to 58.6 million by the 2019-20 school year. Total public school enrollment is projected to set new records each year from 2011 to 2019.
Our focus within the United States preK-12 education market is on supplemental educational products and equipment. Our customers are teachers, curriculum specialists, individual schools and school districts who purchase products and instructional solutions for school and classroom use. We believe that the supplemental educational products and equipment market has generally grown in line with education funding and represented a market in excess of $8.8 billion in 2009-10 school year.
We believe the supplemental educational products and equipment market is highly fragmented with over 3,000 retail and wholesale companies providing products and equipment, a majority of which are family- or employee-owned, regional companies that generate annual revenues under $10 million. We believe the increasing customer demands for single source suppliers, prompt order fulfillment and competitive pricing are acting as catalysts for industry consolidation. In addition, we believe these factors are more important in today’s economic environment, since school districts are moving toward increased centralization of their purchasing decision-making. This includes an increasing portion of school spending that is done through large purchasing cooperatives. We believe these changes are driving above-average growth in the demand for curriculum- and age-focused instructional and educational products. We believe that these industry trends will have a favorable competitive impact on our business, as we believe we are well positioned to utilize our operational capabilities, educational content and curriculum development expertise, and broad product offering to meet evolving customer demands.
3
Recent Acquisitions
We have acquired three businesses since fiscal May 2006. Purchase prices, net of cash acquired, ranged from $0.4 million to $11 million.
Fiscal 2011
Telex. On April 4, 2011, we completed the acquisition of a portion of the operating assets of Telex, a division of Bosch Security Systems, Inc. for an aggregate purchase price of $0.4 million. The assets acquired relate to Telex’s distribution of headphones, earphones, headsets, and their replaceable cords used in the education marketplace. The earphone and headphone models subject to the acquisition are the Discovery, Odyssey, Explorer and 610 models. This business has been integrated into the Company’s Califone business unit within the Educational Resources segment.
Fiscal 2010
AutoSkill International, Inc. On August 19, 2009, we completed the acquisition of AutoSkill International, Inc. (“AutoSkill”) for an aggregate purchase price of $12 million. AutoSkill is a leading education technology company that provides educators with reading and math intervention solutions for struggling students. This business has been integrated into the Company’s Educator’s Publishing Service business within the Accelerated Learning segment.
Fiscal 2008
Sitton Spelling. On November 30, 2007, we completed the acquisition of Sitton Spelling (“Sitton”) from Egger Publishing, Inc. for an all cash, aggregate purchase price of approximately $6 million. Sitton offers spelling and word skills programs to help educators in the area of reading intervention. Sitton also has professional development programs for educators through nationwide seminars conducted by independent trainers. This business has been integrated into the Company’s Educator’s Publishing Service business within the Accelerated Learning segment.
Competitive Strengths
We attribute our strong competitive position to the following key factors:
Clear Market Leader in Fragmented Industry. We are one of the largest providers of supplemental educational products and equipment to the preK-12 education markets in the United States and Canada. Within our industry, there are over 3,000 retail and wholesale competitors, a majority of which are family or employee-owned, regional companies that generate annual revenues under $10 million. We believe that our significantly greater scale and scope of operations relative to our education competitors provide several competitive advantages, including a broader product offering, significant purchasing power, a national distribution network and the ability to manage the seasonality and peak shipping requirements of the school purchasing cycle.
Relatively Stable Industry with Attractive Trends and Dynamics. Government funding for education has historically been a consistently popular political issue enjoying broad-based voter support. Public school expenditure data from the 1994-95 school year to the 2009-10 school year reveal year-over-year spending increases in each of those years, and a 15-year compounded annual increase of 4.9%. While current economic conditions are negatively affecting state budgets and education funding, supplemental educational products remain a small percentage of a school’s annual budget and a large majority of these products are consumable.
Largest Product Offering and Premier Brands. With over 75,000 items ranging from classroom supplies, furniture and playground equipment, and supplemental curriculum solutions, we believe we are the only national provider of a full range of supplemental educational products and equipment to meet substantially all of the
4
needs of schools and teachers in the preK-12 education market. Our breadth of offerings creates opportunities to repurpose or repackage traditional supplemental materials with supplemental curriculum solutions into kits or groups of related items that our customers value. In addition, we believe we have many of the most established brands in the industry that are recognized by educators across the country, with some brands more than 100 years old. We believe that the brand loyalty our products enjoy represents a significant competitive advantage. In addition, approximately 40% of our revenues are derived from our proprietary products, many of which are curriculum-based, which typically generate higher margins than our non-proprietary products.
Unparalleled Customer Reach and Relationships. We have developed a highly integrated, three-tiered sales and marketing approach which we believe provides us with an unparalleled ability to reach teachers and curriculum specialists as well as school district and individual school administrators. We reach our customers through the industry’s largest sales force of approximately 540 professionals, catalog mailings and our proprietary e-commerce websites. In fiscal 2011, we believe we sold products to approximately 70% of the estimated 130,000 schools in the United States and reached a majority of the 3.8 million teachers in those schools. We utilize our extensive customer databases to selectively target the appropriate customers for our catalog offerings. Additionally, we have invested heavily in the development of our e-commerce websites, which provide broad product offerings and which we believe generate higher internet sales than any of our education competitors. Our internet revenues, which were approximately 17.3% of our sales in fiscal 2011 compared to 16.9% of our sales in fiscal 2007, have increased as more school districts and teachers go online to order supplies.
Ability to Effectively Integrate and Improve Operating Margins of Acquired Businesses. We have completed three acquisitions since fiscal 2007. We typically establish a 6- to 12-month target for our integration process for which we form a focused transition team. The transition team is assigned the responsibility of integrating the acquired entity’s business systems, consolidating distribution centers, eliminating redundant expenses and any non-strategic product lines, as well as realizing sales and margin enhancements through cross merchandising and increased purchasing power. We have been able to rapidly improve the operating margins of the businesses we acquire by applying our extensive integration experience. We have also been able to improve revenue growth for certain acquired businesses through customer relationships, cross-merchandising and leveraging of our scale.
Highly Diversified Business Mix. Our broad product portfolio and extensive geographic reach minimize our concentration and exposure to any one school district, state, product or supplier. In fiscal 2011, our top 10 school district customers collectively accounted for less than 10% of revenues and our customers within any one state collectively accounted for less than 11% of revenues. For the same period, our top 100 products accounted for less than 11% of revenues. Products from our top 10 suppliers generated less than 23% of revenues in fiscal 2011. We believe this diversification somewhat limits our exposure to state and local funding cycles and to product demand trends.
Strong Historical Financial Performance, Attractive Cash Flow Attributes and Multiple Growth Opportunities. Prior to the recent economic slowdown and school funding shortfalls, we have historically demonstrated strong financial performance. Over 70% of our revenues are generated from the sale of consumable products, which typically need to be replaced each school year. The financial performance of our business remained relatively stable even during the state budget crises from 2001 to 2003 and 2009 to 2010. The Company was able to maintain financial stability, despite the revenue decline, due to its focus on cost reductions and aggressive management of working capital, which the Company believes will better position it to capitalize on future revenue growth when the economy and school funding return to more normal levels. We are continually focused on growing revenues within our Accelerated Learning and Educational Resources segments, increasing our mix of proprietary products and improving our operations. Due to our low maintenance capital expenditure requirements, we convert a significant percentage of our operating income to cash flow available for debt service, acquisitions and/or share repurchases. We also enjoy highly predictable working capital cycles. In addition, we believe we have multiple revenue growth and margin improvement opportunities, including enhancing our sales efforts in under-penetrated states, expanding our private-label business, further developing our educational
5
curriculum and technology offerings, increasing sourcing from overseas, optimizing direct marketing operations, increasing supply chain efficiency and pursuing strategic acquisitions. We also believe our movement toward organizing around product and customer categories, has better synchronized our go-to-market strategies, product development efforts and supplier relationships. We believe this transformation has created new revenue streams, cost efficiencies and profitability. We expect these new revenue streams to somewhat soften the impact of the near-term school spending decline.
Strong Management Team. We have a deep, experienced management team. Our executive management team and business unit leaders have an average of over 10 years of experience in the industry. Since David Vander Zanden, our Chief Executive Officer, joined us in 1998, our senior management team has been successful in growing our market share, diversifying our revenue streams into more profitable areas and improving the efficiency of our operations.
Growth Strategy
We use the following strategies to enhance our position as a leading provider of supplemental educational products and equipment:
Internal Growth. We are cautiously optimistic that schools are at or near the bottom of funding levels. As schools begin the slow return to more normalized spending we plan to increase our share of this spending and organically grow our revenues in the long-term by:
| • | Expanding our faster growing, higher margin Accelerated Learning products business; |
| • | Unifying our marketing efforts within a more centralized marketing structure; |
| • | Developing new curriculum, supplemental learning and technology solutions in response to industry trends and educator needs; |
| • | Increasing our focus and selling resources in under-penetrated states and districts, especially large districts; |
| • | Utilizing database marketing techniques and strategies to increase customer acquisition and retention; and |
| • | Seeking new channels for growth, such as expanding our relationships with both large purchasing cooperatives and third party internet resources. |
Margin Improvement. As we grow our revenues, we plan to increase margins by:
| • | Continuing to increase our mix of Accelerated Learning products, which, because of the large proportion of proprietary products, typically generate higher gross margins than our Educational Resources products; |
| • | Continuing to expand our private label business through the introduction of new products, including a new private label furniture line; |
| • | Increasing the efficiency and speed of delivery for products sourced from low-cost, overseas manufacturers; |
| • | Advancing the sophistication and effectiveness of our direct marketing operations; |
| • | Improving efficiencies of our supply chain activities, and driving overall efficiencies through our company-wide, lean-based process improvement program; |
| • | Evaluating the benefits consolidation of distribution centers and the elimination of redundant expenses of acquired businesses; and |
| • | Utilizing our purchasing scale to negotiate favorable supplier terms and conditions. |
6
Acquisitions. Our selective acquisition strategy and disciplined integration approach have allowed us to solidify our leading position within the supplemental educational products and equipment industry, and enhance our strong national marketing and distribution platform. This platform allows us to more readily integrate acquired brands, strengthen our Accelerated Learning brand portfolio, and enter supplemental learning categories in which we do not currently compete, such as music and social studies. We believe that our size and national presence give us an advantage as a potential acquirer in a consolidating industry.
The majority of our acquisitions have historically occurred in the second half of our fiscal year, which follows our peak shipping season. This allows us to devote our resources to the effective integration of acquired businesses prior to the upcoming selling season. We plan to continue to focus on acquisition candidates that expand our presence in Accelerated Learning products.
Product Lines
We market two broad categories of supplemental educational products and equipment: Accelerated Learning products and Educational Resources products. Our Accelerated Learning products enrich our Educational Resources product offering and create opportunities to cross merchandise our Accelerated Learning products, many of which are proprietary, to our Educational Resources customers.
Our Accelerated Learning offerings are focused in the following areas:
Planning and Student Development We believe we are the largest provider of planning and student development content in the United States and Canada, which is delivered through student agendas. Our offerings are focused on developing better personal, social and organizational skills, as well as serving as an effective tool for students and parents to track and monitor their daily activities, assignments and achievements. Many of our agendas are customized at the school level to include each school’s academic, athletic and extra-curricular activities. Our agendas are primarily marketed under the PremierTM brand name. We are also a leading publisher of school forms, including record books, grade books, teacher planners and other printed forms under the brand name Hammond & StephensTM.
Science Our leading science position, largely comprised of highly recognized proprietary or exclusive offerings, provides learning resources focused on promoting scientific education and inquiry, literacy and achievement to the preK-12 education market. Our products range from laboratory supplies, equipment and furniture to highly effective hands-on learning curriculums. Our science brands include FOSS® (Full Option Science System), Frey Scientific®, Delta Science ModulesTM, Delta Education, CPO ScienceTM, and Neo/SCI®. Our Science category also offers the core math curriculum ThinkMath!TM, as well as various supplemental math products. In addition to ThinkMath!TM, our math brands include Fast Food Math® and Math in a Nutshell®.
Literacy & Intervention Our reading and math intervention programs, which are standards- and curriculum-based products, are focused on providing educators and parents effective tools to encourage and enhance literacy and mathematics skills, serving the K-12 grade levels. Educators Publishing Service (EPS) provides tailored reading and language arts instruction for students with special needs and proprietary instructional materials for educators. Our Academy of Reading® and Academy of Math® products offer comprehensive reading, math and response to intervention solutions to help K-12 schools close the achievement gap for students who fall below proficiency benchmarks. Our print and technology resources combine to meet the instructional needs of students possessing learning disabilities or are at risk for reading and math failure.
Coordinated School Health We offer proven, research-based physical education and health solutions such as SPARKTM , which is a curriculum- and product-based program focused on promoting healthy, active lifestyles and combating childhood obesity. Each SPARK program provides a coordinated package of curriculum, on-site teacher training, and content-matched equipment from our Sportime® product line. The program maximizes physical activity during physical education classes by providing teachers with alternative games, dances and sports that ensure all students are actively engaged and learning.
7
Our Educational Resources offerings are focused in the following areas:
Administrator Category We believe we are the largest marketer of school and classroom supplies into the school market. Through our School Specialty Educational Resources catalogs, which offer both national brands and many of our proprietary School Smart® products, we provide an extensive offering of basic supplies that are consumed in the school and classrooms. This offering includes office products, classroom supplies, janitorial and sanitation supplies, school equipment, technology and paper. These products are commodity based and require efficient supply chain, distribution and logistics expertise to be competitive. As a result of our large distribution network and supply chain expertise position, our customers view us as a preferred supplier in the Administrator category. Our School Smart private label brand was launched in 2005. These products are primarily sourced direct from low-cost, overseas manufacturers, which we believe will allow us to enhance our product offering and improve profitability. Our School Smart brand is also represented in many of our Accelerated Learning offerings.
Educator Category We believe we are the largest marketer of educator supplies and learning materials. Our Educator category includes upper-grade-level art supplies, supplemental learning materials (reading, social studies, math and science), teaching resources, physical education equipment and classroom technology. Innovation, proprietary products, brand strength and direct merchandising are key success factors. These product offerings create opportunity for margin enhancement through innovation and unique assortments. The products in the Educator category serve the following areas:
Early Childhood. Our early childhood offering provides educators of young children with products that promote learning and development. Our full-line, highly proprietary offering provides educators with everything from advanced literacy and dramatic play to manipulatives, and basic arts and crafts. We manufacture award-winning early childhood wood furniture in our Bird-in-Hand WoodworksTM facility. Our well-known early childhood brands include Childcraft® and abc®.
Arts Education. Our leading market position is led by Sax® Arts & Crafts, which offers products and programs focused on nurturing creativity and self-expression through hands-on learning. The product line ranges from original cross-curricular lesson plans and teaching resource materials to basic art materials, such as paints, brushes and papers. Our arts education group is supported by our team of art consultants who proactively serve the education process locally and nationally by conducting workshops and providing curriculum assistance to art educators.
Physical Education & Health. We offer a full range of programs, solutions, resources and equipment designed to help improve student and staff wellness. Our products, which are primarily offered under our Sportime® brand, range from traditional sports equipment to unique and innovative products designed to encourage participation by all.
Special Learning Needs. We offer a full range of solutions for children with special learning needs through our Abilitations® and Integrations® product lines. Our proprietary solutions and products are designed to help educate children with learning, behavioral, sensory or physical differences and are focused on helping educators and therapists make a real difference in a child’s life.
Audio Technology. We are the leading provider of educator-inspired quality audio technology products, including state-of-the-art multi-media, audio visual and presentation equipment for the preK-12 education market. These products are marketed under the brand name Califone®.
Furniture Category We believe we are the largest source for school furniture in the United States, offering a full range of school-specific furniture and equipment. Our offering allows us to equip an entire facility, refurbish a specific location within a school, such as a cafeteria, gymnasium or media center, or to replace individual items such as student desks and chairs. We have launched a new product line of proprietary furniture under our Classroom SelectTM brand. This offering is a highly functional and outstanding quality classroom furniture line. We also have been granted exclusive franchises for certain furniture lines in specific territories. In addition, we offer our proprietary service, Projects by Design®, which provides turn-key needs assessment, budget analysis and project management for new construction projects.
8
Our product development managers apply their extensive education industry experience to design curriculum- and age-specific products to enhance the learning experience. New product ideas are reviewed with customer focus groups and advisory panels comprised of educators to ensure new offerings will be well received and meet an educational need.
Our merchandising managers, many of whom were educators, continually review and update the product lines for each business. They determine whether current offerings are attractive to educators and anticipate future demand. The merchandising managers also travel to product fairs and conventions seeking out new product lines. This annual review process results in a constant reshaping and expansion of the educational materials and products we offer.
For further information regarding our Accelerated Learning and Educational Resources segments, see our “Segment Information” in the Notes to Consolidated Financial Statements under Item 8, Financial Statements and Supplementary Data.
Intellectual Property
We maintain a number of patents, trademarks, trade names, service marks and other intangible property rights that we believe have significant value and are important to our business. Our trademarks, trade names and service marks include the following: School Specialty®, Education Essentials®, School Smart®, Projects by Design®, Academy of Reading®, Academy of Math®, abc School Supply®, Integrations®, Abilitations®, Brodhead Garrett®, Califone®, Childcraft®, ClassroomDirect®, Frey Scientific®, ThinkMath!TM, Hammond & StephensTM, Premier AgendasTM, Sax Arts & Crafts®, Sax Family & Consumer Sciences, SPARK TM, Sportime®, Delta Education®, Neo/SCI®, CPO Science®, EPS® and AutoSkill®. We also sell products under brands we license, such as FOSS® and FranklinCovey® Seven Habits.
Sales and Marketing
Supplemental educational product procurement decisions are generally made at the classroom level by teachers and curriculum specialists and at the district and school levels by administrators.
Our Accelerated Learning segment sales and marketing approach utilizes a field sales force of more than 210 professionals, supported by about 50 inside sales associates. The sales coverage is nationwide, with the largest student populated states served by a larger contingent of sales professionals. The field and inside sales associates are supported by 21 targeted catalogs and our brand-specific websites to deliver premium educational products to teachers and curriculum specialists.
Generally, for each Accelerated Learning product line, a major catalog containing its full product offering is distributed near the end of the calendar year and during the course of the year we mail additional supplemental catalogs. Schools, teachers and curriculum specialists can also access websites for product information and purchasing. Further, we believe that by cross-marketing our Accelerated Learning brands to Educational Resources customers, we can achieve substantial incremental sales.
Our Educational Resources segment sales and marketing approach utilizes a sales force of about 330 professionals, approximately 55 distinct catalogs titles, and School Specialty Online®, an e-commerce solution that enables us to tailor our product offerings and pricing to individual school districts and school administrators. In addition, by reorganizing using category management principles Educational Resources has targeted three primary product categories with specific customer characteristics: Administrator, Educator, and Furniture.
9
In the Administrator category, we leverage our national sales force, the largest distribution network in the market, and our supply chain expertise to reduce our customers’ cost of acquisition in the most commonly purchased, highest volume commodity items used by schools. In the Educator category, we market our products through direct marketing channels. We compete by offering deep assortments in the most commonly purchased products, by leveraging our size to reduce product costs, and by driving customer retention and acquisition through sophisticated database analytics. In the Furniture category, our unique Projects by Design® service gives us significant competitive advantages by providing customers with value-added construction management support, from interior design through installation and field support. In the non-construction segment of furniture, we capitalize on relationship selling through the largest direct sales force in the market.
Schools typically purchase supplemental educational products based on established relationships with relatively few vendors. We seek to establish and maintain these critical relationships by assigning accounts within a specific geographic territory to a local area account manager who is supported by a centrally located customer service team. The account managers frequently call on existing customers to ascertain and fulfill their supplemental educational resource needs. The customer service representatives maintain contact with these customers throughout the order cycle and assist in order processing.
We have a centralized and national sales, marketing, distribution and customer service structure. We believe that this structure significantly improves our effectiveness through better sales management, resulting in higher regional penetration and significant cost savings through the reduction of distribution centers.
Projects by Design. Projects by Design® is a service we provide our customers free of charge to aid in the design, building and renovation of schools. Our professional designers prepare a detailed analysis of the building and individual classrooms to optimize the layout of student and teacher desks, student lockers and other classroom equipment and fixtures. Customers have the ability to view prospective classrooms through our innovative software in order to efficiently manage the project. We believe this service makes us an attractive alternative to other furniture and school fixture suppliers.
Internet Operations. Our internet channel activities through School Specialty Online are focused on enhancing customer loyalty, driving down cost by receiving more orders electronically and creating a full customer self-service portal. Our brands are available through School Specialty Online which allows our customers a single access point for purchasing. Our systems provide functionality to meet the specific needs of school districts and school customers who generally purchase Educational Resources products as well as the needs of individual teachers and curriculum specialists who tend to buy Accelerated Learning products. School Specialty Online allows our customers to manage funding through the use of purchase order spending limitation, approval workflows, order management and reporting. In addition, we offer schools and districts the ability to fully integrate their procurement systems with School Specialty Online, which gives us another important link to our customers and a significant competitive advantage. It also includes other features that are more helpful to teachers, curriculum specialists and others with more sophisticated online ordering needs, including product search, custom catalogs and email notification, allowing users to have access to the full line of School Specialty products. We have maintained an electronic ordering system for the past 20 years and offer e-commerce solutions directed exclusively at the education market. Each of our Accelerated Learning product lines has a dedicated website for its own products. We also continue to explore expanding our offerings provided through third party internet sources. As such, we have added a new channel agreement with Amazon.com. Under the agreement, we have created our own branded storefront within the office and school segment of Amazon.com shopping portal. We believe that this new channel will allow us to reach educators and segments of the education space that we did not reach previously.
Pricing. Pricing for our Accelerated Learning and Educational Resources product offerings varies by product and market channel. We generally offer a negotiated discount from catalog prices for products from our Educational Resources catalogs, and respond to quote and bid requests. The pricing structure of proprietary Accelerated Learning products offered through direct marketing is generally less subject to negotiation.
10
Procurement
Non-Proprietary Products. Each year, we add new items to our catalogs. We purchase and stock these items before the catalogs are released so that we can immediately satisfy customer demand. We typically negotiate annual supply contracts with our vendors. Contracts with larger vendors usually provide negotiated pricing and/or extended terms and often include volume discounts and rebate programs. We have exclusive distribution rights on several furniture and equipment lines.
Proprietary Products. We develop many proprietary products and generally outsource the manufacturing of these items. We purchase non-proprietary Accelerated Learning products in a similar manner to that of our purchasing process for Educational Resources products. In fiscal 2010, we signed an agreement for the exclusive manufacture of our proprietary Classroom SelectTM furniture lines in China.
Global Sourcing. We are decreasing our product unit costs by consolidating our international supplier network. We are also improving product quality by being very selective in our off-shore alliances. Working in conjunction with our supply partners, we have streamlined our international procurement process, gained real-time visibility, added in-process checks, and established new systems and procedures to ensure product safety.
Private Label Product. We launched the School Smart brand in 2005. Since that time we have focused our strategy on providing a private brand alternative for educators, using a combination of off-shoring and out-sourcing of products. In fiscal 2011 our revenue for School Smart branded products was approximately $66.9 million. We continue to seek opportunities to optimize the balance of branded and private brand products and we believe that there are additional opportunities to grow sales through new products, product line extensions and new product configurations.
We maintain close and stable relationships with our vendors to facilitate a streamlined procurement process. At the same time, we continually review alternative supply sources in an effort to improve quality and customer satisfaction and reduce product cost. Increasingly, transactions with our vendors are processed through an electronic procurement process. This electronic process reduces costs and improves accuracy and efficiency in our procurement and fulfillment process. When more than one of our business units buys from the same vendor, we typically negotiate one contract to fully leverage our combined purchasing power.
Logistics
We believe we have one of the largest and most sophisticated distribution networks among our direct competitors with six fully automated and seamlessly integrated distribution centers, totaling approximately one and a half million square feet of operating space. We believe this network represents a significant competitive advantage for us, allowing us to reach any school in a fast and efficient fashion. We have enhanced our distribution model, allowing most of our customers to receive their orders one day after shipment. We utilize a third-party logistics provider in Asia to consolidate inbound shipments, lowering our transportation and inventory storage costs.
In order to maintain the proprietary nature of some of our products, we operate three manufacturing facilities. Our Lancaster, Pennsylvania plant manufactures wood furniture for our early childhood offerings. The Bellingham, Washington, and Fremont, Nebraska, facilities produce products for our agenda and forms offerings. Products that we manufacture accounted for less than 10% of sales during fiscal 2011, 2010 and 2009.
Information Systems
We believe that through the utilization of technology for process improvement in areas such as procurement, inventory management, customer order management, order fulfillment, and information management, we are able to offer customers more convenient and cost-effective ways to order products, improve the order fulfillment process to increase on-time and complete performance and effectively focus our sales and marketing strategies.
11
We have implemented a common enterprise resource planning (“ERP”) platform across the majority of our businesses. This platform has now replaced most of our existing systems and primarily includes software from Oracle’s E-Business suite. One of the major benefits from the common ERP platform is the consolidation of both product and customer information, which is designed to enhance our ability to execute our sales and marketing strategies. In addition, by utilizing common business systems across the Company, we have improved business processes, reduce cycle time and enhance integration between the business units. We believe the technologies of the new systems will readily support continued growth and integration of our existing and acquired businesses. Our distribution centers utilize interfaced warehouse management software to manage orders from our ERP and legacy systems.
Competition
We believe the supplemental educational products and equipment market is highly fragmented with over 3,000 companies providing products and equipment, many of which are family- or employee-owned, regional companies that generate annual revenues under $10 million. We also compete, to a much lesser extent, with alternate channel competitors such as office product contract stationers, office supply superstores, purchasing cooperatives and internet-based businesses. Their primary advantages over us include size, location, greater financial resources and purchasing power. Their primary disadvantage is that their product mix typically covers a very small portion of a school’s needs (measured by volume). We believe we compete favorably with these companies on the basis of service, product offering and customer reach.
Employees
As of June 10, 2011, we had approximately 1,919 full-time employees. To meet the seasonal demands of our customers, we employ many seasonal employees during the late spring and summer months. Historically, we have been able to meet our requirements for seasonal employment. None of our employees are represented by a labor union and we consider our relations with our employees to be very good.
Backlog
We had no material backlog at April 30, 2011. Our customers typically purchase products on an as-needed basis.
| Item 1A. | Risk Factors |
Forward-Looking Statements
Statements in this Annual Report which are not historical are “forward-looking” statements within the meaning of the Private Securities Litigation Reform Act of 1995. The forward-looking statements include: (1) statements made under Item 1, Business and Item 7, Management’s Discussion and Analysis of Financial Condition and Results of Operations, including, without limitation, statements with respect to internal growth plans, projected revenues, margin improvement, future acquisitions, capital expenditures and adequacy of capital resources; (2) statements included or incorporated by reference in our future filings with the Securities and Exchange Commission; and (3) information contained in written material, releases and oral statements issued by, or on behalf of, School Specialty including, without limitation, statements with respect to projected revenues, costs, earnings and earnings per share. Forward-looking statements also include statements regarding the intent, belief or current expectation of School Specialty or its officers. Forward-looking statements include statements preceded by, followed by or that include forward-looking terminology such as “may,” “should,” “believes,” “expects,” “anticipates,” “estimates,” “continues” or similar expressions.
12
All forward-looking statements included in this Annual Report are based on information available to us as of the date hereof. We do not undertake to update any forward-looking statements that may be made by or on behalf of us, in this Annual Report or otherwise. Our actual results may differ materially from those contained in the forward-looking statements identified above. Factors which may cause such a difference to occur include, but are not limited to, the risk factors set forth below.
Our business depends upon the growth of the student population and school expenditures and can be adversely impacted by fixed or declining school budgets.
Our growth strategy and profitability depend in part on growth in the student population and expenditures per student in preK-12 schools. The level of student enrollment is largely a function of demographics, while expenditures per student are affected by federal, state and local government budgets. For example, from 2002 to 2004, the industry was negatively affected by a generally weakened economic environment which placed pressure on some state and local budgets, the primary sources of school funding. This was evidenced, among other things, by the 5.7% decline in state tax revenue in 2002. In addition, the current macroeconomic weakness has resulted in significantly reduced school budgets. In school districts in states that primarily rely on local tax proceeds for funding, significant reductions in those proceeds for any reason can restrict district expenditures and impact our results of operations. Any significant and sustained decline in student enrollment and/or expenditures per student could have a material adverse effect on our business, financial condition, and results of operations. Because school budgets are fixed on a yearly basis, any shift by schools in expenditures during a given fiscal year to areas that are not part of our business, such as facility operating costs and employee related expenditures, could also materially affect our business.
The negative global macroeconomic conditions could impact the education funding provided by state and local governments.
The weakened economic environment has placed increased pressure on state and local government budgets, which are the primary source of school funding. The global economy is currently suffering from the effects of the latest recession which has led to a decline in consumer and business spending and confidence. This has resulted in our customers delaying or cutting school expenditures as the recession creates state and local budget deficits and uncertainty about future economic funding by state and local governments. The federal stimulus funds that were provided by the federal government to school districts helped education funding in 2009, but these federal funds have been fully distributed and many states have not been able to replace them due to declining state revenue. Significant and sustained declines in the per student funding levels provided for in state and local budgets, and delays or decreases in spending by our customers due to concerns about potential or actual declines in funding levels, could have a materially adverse impact on our business, financial condition and results of operations.
A continued decline in school spending will impact our ability to maintain operating margins.
We have seen a decline in our operating margin in fiscal 2011 as a result of the continued school spending cuts and our 15% revenue decline. The Company will continue to aggressively pursue further cost reductions if school spending continues to decline, but the Company will not cut costs in areas that it believes could have a significant impact on future revenue growth. To the extent we are unable to identify additional cost reductions that can be made consistent with our strategy and the weakness in school spending persists, our operating margin may decline. Additionally, spending declines can cause schools to consider purchasing lower priced products which will lower the Company’s margins.
Increased costs and other difficulties associated with the distribution of our products would adversely affect our results of operations.
Higher than expected costs and other difficulties associated with the distribution of our products could affect our results of operations. To the extent we incur difficulties or higher-than-expected costs related to updating our distribution centers, such costs may have a material adverse effect on our business, financial condition and results
13
of operations. Any disruption in our ability to service our customers may also impact our revenues or profits. Moreover, as we update our distribution model or change the product mix of our distribution centers, we may encounter unforeseen costs or difficulties that may have an adverse impact on our financial performance.
Our business is highly seasonal.
Because most of our customers want their school supplies delivered before or shortly after the commencement of the school year, we record most of our revenues from June to October. During this period, we receive, ship and bill the majority of orders for our products so that schools and teachers receive their products by the start of each school year. To the extent we do not sell our products to schools during the peak shipping season, many of such sales opportunities will be lost and will not be available in subsequent quarters. Our inventory levels increase in April through June in anticipation of the peak shipping season. We usually earn more than 100% of our annual net income in the first two quarters of our fiscal year and operate at a net loss in our third and fourth fiscal quarters. This seasonality causes our operating results and operating cash flows to vary considerably from quarter to quarter within our fiscal years.
If our key suppliers or service providers were unable to provide the products and services we require, our business could be adversely affected.
We depend upon a limited number of suppliers for some of our products, especially furniture and proprietary products. We also depend upon a limited number of service providers for the delivery of our products. If these suppliers or service providers are unable to provide the products or services that we require or materially increase their costs (especially during our peak season of June through October), our ability to deliver our products on a timely and profitable basis could be impaired and thus could have a material adverse effect on our business, financial condition and results of operations. Many of our agreements with our suppliers are terminable at any time or on short notice, with or without cause, and, while we consider our relationships with our suppliers to be good, we cannot assure that any or all of our relationships will not be terminated or that such relationships will continue as presently in effect.
Our business is highly competitive.
The market for supplemental educational products and equipment is highly competitive and fragmented. We estimate that over 3,000 companies market supplemental educational products and equipment to schools with preK-12 as a primary focus of their business. We also face competition from alternate channel marketers, including office supply superstores, office product contract stationers, and purchasing cooperatives that have not traditionally focused on marketing supplemental educational products and equipment. Our competitors impact the prices we are able to charge and we expect to continue to face pricing pressure from our competitors in the future, especially on our commodity-type products. These competitors are likely to continue to expand their product lines and interest in supplemental educational products and equipment. Some of these competitors have greater financial resources and buying power than we do. We believe that the supplemental educational products and equipment market will consolidate over the next several years, which could increase competition in both our markets and our search for attractive acquisition candidates. We also face increased competition and pricing pressure as a result of the accessibility of the internet.
If any of our key personnel discontinue their role with us, our business could be adversely affected.
Our business depends to a large extent on the abilities and continued efforts of current executive officers and senior management. We are also likely to depend heavily on the executive officers and senior management of businesses that we acquire in the future. If any of these people becomes unable or unwilling to continue in his or her role, or if we are unable to attract and retain other key personnel and qualified employees, our business could be adversely affected. We have employment contracts with many of our key officers. Other than the life insurance we have in place for our Chief Executive Officer, we do not have and do not intend to obtain key man life insurance covering any of our executive officers or other members of our management.
14
A failure to successfully implement our business strategy could materially and adversely affect our operations and growth opportunities.
Our ability to achieve our business and financial objectives is subject to a variety of factors, many of which are beyond our control, and we may not be successful in implementing our strategy. This includes limitations due to the inability to obtain financing and/or the restrictiveness of our debt covenants. In addition, the implementation of our strategy may not lead to improved operating results. We may decide to alter or discontinue aspects of our business strategy and may adopt alternative or additional strategies due to business or competitive factors or factors not currently expected, such as unforeseen costs and expenses or events beyond our control. Any failure to successfully implement our business strategy could materially and adversely affect our results of operations and growth opportunities.
We face risks associated with our increasing emphasis on imported goods and private label products.
Increases in the cost or a disruption in the flow of our imported goods may adversely impact our revenues and profits and have an adverse impact on our cash flows. Our business strategy includes an increased emphasis on offering private label products and sourcing quality merchandise directly from low-cost suppliers. As a result, we expect to rely more heavily on imported goods from China and other countries and we expect the sale of imported goods to continue to increase as a percentage of our total revenues. To the extent we rely more heavily on the sale of private label products, our potential exposure to product liability claims may increase. In addition, our reputation may become more closely tied to our private label products and may suffer to the extent our customers are not satisfied with the quality of such products. Private label products will also increase our risks associated with returns and inventory obsolescence. Our reliance on imported merchandise subjects us to a number of risks, including: (a) increased difficulties in ensuring quality control; (b) disruptions in the flow of imported goods due to factors such as raw material shortages, work stoppages, strikes, and political unrest in foreign countries; (c) problems with oceanic shipping, including shipping container shortages; (d) economic crises and international disputes; (e) increases in the cost of purchasing or shipping foreign merchandise resulting from a failure of the United States to maintain normal trade relations with China and the other countries we do business in; (f) import duties, import quotas, and other trade sanctions; and (g) increases in shipping rates imposed by the trans-Pacific shipping cartel. If imported merchandise becomes more expensive or unavailable, we may not be able to transition to alternative sources in time to meet our demands. A disruption in the flow of our imported merchandise or an increase in the cost of those goods due to these or other factors would significantly decrease our revenues and profits and have an adverse impact on our cash flows.
Currency exchange rates may impact our financial condition and results of operations and may affect the comparability of our results between financial periods.
To the extent we source merchandise from overseas manufacturers and sell products internationally, exchange rate fluctuations could have an adverse effect on our results of operations and ability to service our U.S. dollar-denominated debt. The majority of our debt is in U.S. dollars while a portion of our revenue is derived from imported products and international sales. Therefore, fluctuations in the exchange rate of foreign currencies versus the U.S. dollar could impact our costs and revenues. In addition, for the purposes of financial reporting, any change in the value of the foreign currencies against the U.S. dollar during a given financial reporting period would result in a foreign currency loss or gain. Consequently, our reported earnings could fluctuate as a result of foreign exchange translation and may not be comparable from period to period.
It is difficult to forecast our revenue stream given the seasonal purchasing patterns of our customers and delays in passage of state budgets.
The seasonal purchasing patterns of our customers, the fact that our customers typically purchase products on an as-needed basis, and the lack of visibility to education funding levels if state budgets are delayed make it difficult for us to accurately forecast our revenue stream, which may vary significantly from period to period. Financial analysts and others that may seek to project our future performance face similar difficulties. The
15
difficulty in accurately forecasting our revenue increases the likelihood that our financial results will differ materially from any projected financial results. Any shortfall in our financial results from our, or third-party, projected results could cause a decline in the trading price of our common stock and our convertible subordinated notes.
If we are unable to successfully identify and integrate acquisitions, our results of operations could be adversely affected.
A significant amount of our past growth has come from acquisitions. Future growth in our revenues and earnings will be impacted by our ability to continue to acquire and successfully integrate businesses. We cannot guarantee that we will be able to identify and acquire businesses on reasonable terms or at all. If we are unable to do so, our future growth may be limited, or our revenues could decline. In addition, the integration of acquired businesses with our existing business operations presents many challenges and can demand significant attention from our key managers. The demands placed upon the time of our management team may adversely affect the operation of our existing business. Managing and integrating acquired businesses may result in substantial costs, delays, or other operating or financial problems that could materially and adversely affect our financial condition and results of operations.
Key risks in making acquisitions involve:
| • | failure to execute as well or as quickly as anticipated on our integration plans, including the integration of acquired employees, operations, technologies and products with our existing business and products; |
| • | ineffective due diligence process on acquired business; |
| • | retention of business relationships with suppliers and customers of the acquired business; |
| • | loss of key personnel of the acquired business; |
| • | the diversion of our management during the integration process; and |
| • | resistance to cultural changes in the acquired organization. |
We have a material amount of goodwill, other intangible assets which were written-down.
At April 30, 2011, goodwill and intangible assets represented approximately 44.8% of our total assets. Goodwill is the amount by which the costs of an acquisition exceed the fair value of the net assets we acquire. We are required to evaluate whether our goodwill and indefinite-lived intangible assets have been impaired on an annual basis, or more frequently if indicators of impairment exist. As discussed in Note 5 to the consolidated financial statements in Item 8 of this report, the Company recorded impairment charges of $411.2 million and $0.2 million related to goodwill and an indefinite-lived tradename intangible, respectively, in the first quarter of fiscal 2011. The impairment was determined as part of the fair value assessment of these assets. Reductions in our net income caused by any additional write-down of our goodwill or intangible assets could materially adversely affect our results of operations.
We have a material amount of capitalized product development costs which might be written-down.
In addition, we had capitalized product development costs of $28.3 million and $24.5 million at April 30, 2011 and April 24, 2010, respectively, related to internally developed, which are amortized to expense over the lesser of five years or the product’s life cycle. Any changes in the estimated sales volume or life cycle of the underlying products could cause the currently capitalized costs or costs capitalized in the future to be impaired.
Our operations are dependent on our information systems.
We have integrated the operations of most of our divisions and subsidiaries, which operate on systems located at both our Greenville, Wisconsin, headquarters and our third-party hosted ERP system provider’s facilities. In addition, there are divisions running legacy systems hosted at their locations. All systems rely on
16
continuous telecommunication connections to the main computers. If any of these connections becomes disrupted, or unavailable, for an extended period of time, the disruption could materially and adversely affect our business, operations and financial performance. We also continue to introduce new information systems to achieve a common processing infrastructure for all of our businesses, particularly the new ERP platform described elsewhere in this report, which will displace existing legacy systems. As we implement the new systems, there is the potential for disruptions if the new systems do not perform as expected.
Even though we have taken precautions to protect ourselves from unexpected events that could interrupt new, existing and acquired business operations and systems, we cannot be sure that fire, flood or other natural disasters would not disable our systems and/or prevent them from communicating between business segments. The occurrence of any such event could have a material adverse effect on our business, results of operations and financial condition. We also face challenges in integrating the information systems of any companies we acquire. The costs associated with performing such integrations or any disruptions resulting from a failure to successfully make any such integration could materially impact our business.
We rely on our intellectual property in the design and marketing of our products.
We rely on certain trademarks, trade names and service names, along with licenses to use and exploit certain trademarks, trade names and service names (collectively, the “marks”) in the design and marketing of some of our products. We could lose our ability to use our brands if our marks were found to be generic or non-descriptive. While no single mark is material to our business, the termination of a number of these marks could have an adverse effect on our business. We also rely on certain copyrights, patents and licenses other than those described above, the termination of which could have an adverse effect on our business.
The agreements governing our debt contain various covenants that limit our discretion in the operation of our business, could prohibit us from engaging in transactions we believe to be beneficial and could lead to the acceleration of our debt and/or an increased cost of capital.
Our existing and future debt agreements impose and may impose operating and financial restrictions on our activities. These restrictions require us to comply with or maintain certain financial tests and ratios, and restrict our ability and our subsidiaries’ ability to:
| • | incur additional debt; |
| • | create liens; |
| • | make acquisitions; |
| • | redeem and/or prepay certain debt; |
| • | sell or dispose of a minority equity interest in any subsidiary or other assets; |
| • | make capital expenditures; |
| • | make certain investments; |
| • | enter new lines of business; |
| • | engage in consolidations, mergers and acquisitions; |
| • | repurchase or redeem capital stock; |
| • | guarantee obligations; |
| • | engage in certain transactions with affiliates; and |
| • | pay dividends and make other distributions. |
Our amended senior credit facility also requires us to comply with certain financial ratios, including a total leverage ratio, a senior leverage ratio and a minimum fixed charge coverage ratio. These restrictions on our
17
ability to operate our business could seriously harm our business by, among other things, limiting our ability to take advantage of financing, mergers and acquisitions, and other corporate opportunities. In the event that we fail to comply with the financial ratios contained in our amended and restated credit facility, the lenders could elect to declare all amounts outstanding to be immediately due and payable and terminate all commitments to extend further credit. If the lenders accelerate the repayment of borrowings, we may not have sufficient assets to repay our amended and restated credit facility. Also, should there be an event of default, or need to obtain waivers following an event of default, we may be subject to higher borrowing costs and/or more restrictive covenants in future periods.
See the Liquidity and Capital Resources section of Item 7, Management’s Discussion and Analysis of Financial Condition and Results of Operations, for a more detailed discussion of the Company’s projected compliance with these debt covenants.
| Item 1B. | Unresolved Staff Comments |
None.
| Item 2. | Properties |
Our corporate headquarters is located in a leased facility. The lease on this facility expires in April 2021. The facility is located at W6316 Design Drive, Greenville, Wisconsin, a combined office and warehouse facility of approximately 332,000 square feet, which also services both our Accelerated Learning and Educational Resources segments. In addition, we leased or owned the following principal facilities as of June 10, 2011:
| Locations |
Approximate Square Footage |
Owned/ Leased |
Lease Expiration | |||||
| Bellingham, Washington (1) |
48,000 | Leased | December 31, 2013 | |||||
| Bellingham, Washington (1) |
25,000 | Leased | January 31, 2014 | |||||
| Bellingham, Washington (1) |
14,000 | Leased | December 31, 2013 | |||||
| Cambridge, Massachusetts (1) |
18,000 | Leased | April 30, 2013 | |||||
| Fremont, Nebraska (1) |
95,000 | Leased | June 30, 2014 | |||||
| Fresno, California (2) |
163,000 | Leased | October 31, 2019 | |||||
| Lancaster, Pennsylvania (2) |
73,000 | Leased | December 31, 2012 | |||||
| Mansfield, Ohio (2) |
315,000 | Leased | November 30, 2020 | |||||
| Mount Joy, Pennsylvania (2) |
400,000 | Leased | December 31, 2024 | |||||
| Nashua, New Hampshire (1) |
348,000 | Leased | December 31, 2018 | |||||
| New Berlin, Wisconsin (1) |
16,000 | Leased | September 30, 2011 | |||||
| Norcross, Georgia (2) |
25,000 | Leased | February 28, 2016 | |||||
| Salina, Kansas (2) |
115,000 | Owned | — | |||||
| San Fernando, California (1) |
37,000 | Leased | July 31, 2012 | |||||
| (1) | Location primarily services the Accelerated Learning segment. |
| (2) | Location services both business segments. |
The 73,000 square foot Lancaster, Pennsylvania facility is used for manufacturing wood products and the Fremont, Nebraska and Bellingham, Washington facilities are used for production of agendas and school forms. The other facilities are distribution centers and/or office space. We believe that our properties, as enhanced for our ongoing expansion, are adequate to support our operations for the foreseeable future. We regularly review the utilization and consolidation of our facilities.
| Item 3. | Legal Proceedings |
The Company is not currently party to any material pending legal proceedings, other than ordinary routine litigation incidental to the Company’s business.
| Item 4. | Reserved |
18
EXECUTIVE OFFICERS OF THE REGISTRANT
As of June 10, 2011, the following persons served as executive officers of School Specialty:
| Name and Age of Officer |
||
| David J. Vander Zanden |
Mr. Vander Zanden became Chief Executive Officer of School Specialty in September 2002, after serving as Interim Chief Executive Officer since March 2002. Mr. Vander Zanden served as Chief Operating Officer from March 1998 to March 2002, as well as President from March 1998 to March 2007. From 1992 to March 1998, he served as President of Ariens Company, a manufacturer of outdoor lawn and garden equipment. Mr. Vander Zanden has served as a director of School Specialty since June 1998. | |
| David N. Vander Ploeg Age 52 |
Mr. Vander Ploeg joined School Specialty as Executive Vice President and Chief Financial Officer in April 2008. Mr. Vander Ploeg was most recently Chief Operating Officer of Dutchland Plastics Corp., a molded products manufacturer based in Oostburg, Wisconsin. Before joining Dutchland, he was Executive Vice President and Chief Financial Officer at Schneider National, Inc., Green Bay, Wisconsin, a global leader in transportation and logistics services. During a 24-year career at Schneider National, he advanced through several positions of increasing responsibility, including Director of Planning and Budgeting, Group Controller, Vice President of Finance, and Senior Vice President-Operating Chief Financial Officer, prior to being named Executive Vice President and Chief Financial Officer in 2004. Mr. Vander Ploeg is a director of Swift Transportation Company, a transportation services company. | |
| Steven F. Korte Age 56 |
Mr. Korte joined School Specialty in September 2005 as a result of the Delta Education LLC acquisition and was appointed President, Accelerated Learning and corporate Executive Vice President shortly thereafter. With the formation of the Company’s Accelerated Learning segment in fiscal 2009, Mr. Korte’s title became Executive Vice President of Accelerated Learning. From January 2004 to August 2005, Mr. Korte held the position of President and COO of Delta Education LLC. For the prior ten years 1994-2003, Mr. Korte was the President of Rigby Education/Harcourt Supplemental Publishers, a division of Reed Elsevier plc. | |
| Richmond Y. Holden Age 57 |
Mr. Holden joined School Specialty in May 2007 as a result of the Educational Publishing Services acquisition and was President, Educational Publishing Services (EPS). In March 2010, Mr. Holden was appointed Executive Vice President, Educational Resources. Prior to joining School Specialty, Mr. Holden was President and CEO of JL Hammett Co. During a 28 year career at JL Hammett Co he advanced through several positions of increasing responsibility, including Marketing, Technology and Operations, prior to being promoted to Chief Executive Officer in 1992. Mr. Holden is a director of Acme United Corporation, a supplier of cutting, measuring and safety products to the school, home office, hardware and industrial markets. | |
| Rachel P. McKinney Age 53 |
Ms. McKinney joined School Specialty in August 2007 as Executive Vice President and Chief Human Resources Officer. Before joining School Specialty, Ms. McKinney was Senior Vice President, Global Human Resources for DENTSPLY International, Inc., from March 2003 to August 2007, the world’s largest manufacturer and distributor of professional dental products in York, PA. Ms. McKinney’s prior executive management positions included Vice President of Human Resources-Business Critical Solutions Group for Compaq Computer/Hewlett Packard, Houston, Texas, and Vice President, Human Resources for Burger King Corporation’s Europe-Middle East-Africa region. |
19
The term of office of each executive officer is from one annual meeting of the Board of Directors until the next annual meeting of the Board of Directors or until a successor for each is selected. There are no arrangements or understandings between any of our executive officers and any other person (not an officer or director of School Specialty acting as such) pursuant to which any of our executive officers was selected as an officer of School Specialty.
20
PART II
| Item 5. | Market for Registrant’s Common Equity, Related Shareholder Matters and Issuer Purchases of Equity Securities |
Market Information
Our common stock is traded under the symbol “SCHS” on The Nasdaq Global Select Market. The table below sets forth the reported high and low closing sale prices for shares of our common stock, during the indicated quarters.
| Fiscal 2011 quarter ended |
High | Low | ||||||
| July 24, 2010 |
$ | 24.66 | $ | 17.60 | ||||
| October 23, 2010 |
19.17 | 12.53 | ||||||
| January 22, 2011 |
14.52 | 12.40 | ||||||
| April 30, 2011 |
16.20 | 13.05 | ||||||
| Fiscal 2010 quarter ended |
High | Low | ||||||
| July 25, 2009 |
$ | 22.47 | $ | 17.24 | ||||
| October 24, 2009 |
25.24 | 21.16 | ||||||
| January 23, 2010 |
24.82 | 21.28 | ||||||
| April 24, 2010 |
24.60 | 20.99 | ||||||
Holders
As of June 10, 2011, there were 1,756 record holders of our common stock.
Dividends
We have not declared or paid any cash dividends on our common stock to date. We currently intend to retain our future earnings to finance the growth, development and expansion of our business or for other endeavors deemed prudent including, but not limited to, repurchases of our common stock. Accordingly, we do not expect to pay cash dividends on our common stock in the foreseeable future. In addition, our ability to pay dividends may be restricted or prohibited from time to time by financial covenants in our credit agreements and debt instruments. Our current credit facility contains restrictions on, and in some circumstances may prevent our payment of dividends.
Share Repurchase Program
During fiscal 2011 and 2010, the Company did not repurchase any shares of its outstanding common stock. During fiscal 2009, the Company repurchased a total of 497,600 shares of its outstanding common stock at an aggregate purchase price of $15,250,000. The fiscal 2009 repurchases were made pursuant to share repurchase program approved by the Company’s Board of Directors on June 12, 2008, which authorized the repurchase of up to $50.0 million of the Company’s outstanding shares of common stock. As of April 30, 2011, the Company is authorized to repurchase shares of its common stock with an aggregate purchase price of up to $34.7 million under the share repurchase program authorized by the Board of Directors on June 12, 2008. Under the Credit Agreement entered into by the Company on April 23, 2010, as currently amended, there are various restrictions that would limit the aggregate fair market value of common stock the Company could repurchase to $5,000,000. However, certain consolidated leverage ratios must be satisfied in order to proceed with any repurchases.
During the five fiscal years ended April 30, 2011, the Company has repurchased a total of 5,420,210 shares of its issued and outstanding common stock at an aggregate purchase price of $186,637,000. Common stock acquired through the share repurchase programs is available for general corporate purposes.
21
PERFORMANCE GRAPH
The following graph compares the total shareholder return on our Common Stock since April 29, 2006 with that of the Russell 3000 Stock Market Index and a peer group index constructed by us. The companies included in our old peer group index are: Renaissance Learning, Inc. (RLRN) and Scholastic Corporation (SCHL). The companies included in our new peer group index are: Office Depot, Inc. (ODP), Staples, Inc. (SPLS), OfficeMax, Inc. (OMX), Cambium Learning Group, Inc. (ABCD) Archipelago Learning, Inc. (ARCL), The McGraw-Hill Companies, Inc. (MHP), Pearson PLC (PSO), Renaissance Learning, Inc. (RLN), Scholastic Corporation (SCHL), Scientific Learning Corp (SCIL) and Virco Manufacturing Corp (VIRC). The Company updated its peer group in fiscal 2011 to include these additional companies in order to better represent the preK-12 market for which we compete for investor dollars.
The total return calculations set forth below assume $100 invested on April 29, 2006, with reinvestment of any dividends into additional shares of the same class of securities at the frequency with which dividends were paid on such securities through April 30, 2011. The stock price performance shown in the graph below should not be considered indicative of potential future stock price performance.
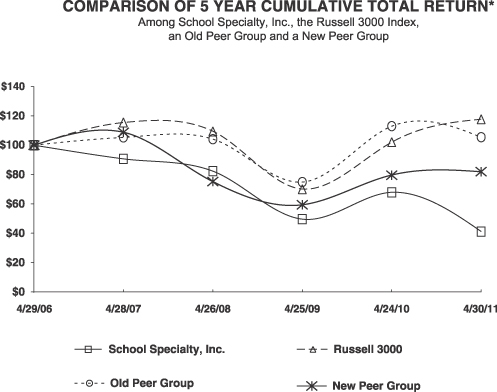
*$100 invested on 4/29/06 in stock or index, including reinvestment of dividends.
Fiscal year ending April 30.
| 4/29/06 | 4/28/07 | 4/26/08 | 4/25/09 | 4/24/10 | 4/30/11 | |||||||||||||||||||
| School Specialty, Inc. |
100.00 | 90.68 | 82.16 | 49.24 | 67.64 | 40.72 | ||||||||||||||||||
| Russell 3000 |
100.00 | 115.54 | 109.49 | 69.94 | 102.17 | 117.79 | ||||||||||||||||||
| Old Peer Group |
100.00 | 105.34 | 104.19 | 74.74 | 113.08 | 105.46 | ||||||||||||||||||
| New Peer Group |
100.00 | 108.75 | 74.98 | 59.13 | 79.48 | 81.59 | ||||||||||||||||||
22
| Item 6. | Selected Financial Data |
SELECTED FINANCIAL DATA
(In thousands, except per share data)
| Fiscal Year | ||||||||||||||||||||
| 2011 | 2010 | 2009 | 2008 | 2007 | ||||||||||||||||
| (53 weeks) | (52 weeks) | (52 weeks) | (52 weeks) | (52 weeks) | ||||||||||||||||
| Statement of Operations Data: |
||||||||||||||||||||
| Revenues |
$ | 762,078 | $ | 896,678 | $ | 1,046,980 | $ | 1,087,903 | $ | 1,043,152 | ||||||||||
| Cost of revenues |
454,557 | 517,530 | 618,377 | 626,661 | 597,515 | |||||||||||||||
| Gross profit |
307,521 | 379,148 | 428,603 | 461,242 | 445,637 | |||||||||||||||
| Selling, general and administrative expenses |
287,560 | 304,451 | 350,919 | 361,754 | 355,839 | |||||||||||||||
| Impairment charge and other |
411,390 | — | — | — | — | |||||||||||||||
| Operating (loss) income |
(391,429 | ) | 74,697 | 77,684 | 99,488 | 89,798 | ||||||||||||||
| Interest expense, net |
28,157 | 30,466 | 29,905 | 30,915 | 28,812 | |||||||||||||||
| Other expense |
— | — | 2,679 | 5,718 | 6,019 | |||||||||||||||
| Impairment of equity-method investment |
6,861 | — | — | — | — | |||||||||||||||
| Expense associated with convertible debt exchange |
1,920 | — | — | — | — | |||||||||||||||
| (Loss) income before provision for income taxes |
(428,367 | ) | 44,231 | 45,100 | 62,855 | 54,967 | ||||||||||||||
| (Benefit from) provision for income taxes |
(73,132 | ) | 17,678 | 17,972 | 23,870 | 23,885 | ||||||||||||||
| (Loss) earnings from continuing operations |
(355,235 | ) | 26,553 | 27,128 | 38,985 | 31,082 | ||||||||||||||
| Loss from operations of discontinued School Specialty Media business unit, net of income taxes |
— | — | — | (4,691 | ) | (21,179 | ) | |||||||||||||
| Losses of unconsolidated affiliate |
(1,038 | ) | (701 | ) | — | — | — | |||||||||||||
| Net (loss) income |
$ | (356,273 | ) | $ | 25,852 | $ | 27,128 | $ | 34,294 | $ | 9,903 | |||||||||
| Weighted average shares outstanding: |
||||||||||||||||||||
| Basic |
18,870 | 18,843 | 18,802 | 20,196 | 21,873 | |||||||||||||||
| Diluted |
18,870 | 18,874 | 18,895 | 20,708 | 22,545 | |||||||||||||||
| Basic (loss) earnings per share of common stock: |
||||||||||||||||||||
| (Loss) earnings from continuing operations |
$ | (18.88 | ) | $ | 1.37 | $ | 1.44 | $ | 1.93 | $ | 1.42 | |||||||||
| Loss from discontinued operations |
— | — | — | (0.23 | ) | $ | (0.97 | ) | ||||||||||||
| Total |
$ | (18.88 | ) | $ | 1.37 | $ | 1.44 | $ | 1.70 | $ | 0.45 | |||||||||
| Diluted (loss) earnings per share of common stock: |
||||||||||||||||||||
| (Loss) earnings from continuing operations |
$ | (18.88 | ) | $ | 1.37 | $ | 1.44 | $ | 1.88 | $ | 1.38 | |||||||||
| Loss from discontinued operations |
— | — | — | (0.22 | ) | $ | (0.94 | ) | ||||||||||||
| Total |
$ | (18.88 | ) | $ | 1.37 | $ | 1.44 | $ | 1.66 | $ | 0.44 | |||||||||
| April 30, 2011 |
April 24, 2010 |
April 25, 2009 |
April 26, 2008 |
April 28, 2007 |
||||||||||||||||
| Balance Sheet Data: |
||||||||||||||||||||
| Working (deficit) capital |
$ | (17,507 | ) | $ | 9,927 | $ | 43,753 | $ | 42,660 | $ | 46,021 | |||||||||
| Total assets |
637,544 | 1,067,820 | 1,077,205 | 1,119,481 | 1,113,033 | |||||||||||||||
| Long-term debt |
198,036 | 199,742 | 244,586 | 283,371 | 257,684 | |||||||||||||||
| Total debt |
296,279 | 332,139 | 371,657 | 405,550 | 375,356 | |||||||||||||||
| Shareholders’ equity |
201,629 | 551,188 | 510,279 | 499,500 | 540,184 | |||||||||||||||
23
| Item 7. | Management’s Discussion and Analysis of Financial Condition and Results of Operations (“MD&A”) |
You should read the following discussion and analysis in conjunction with our consolidated financial statements and related notes, included elsewhere in this Annual Report.
Background
We are a leading education company serving the preK-12 education market by providing products, programs and services that enhance student achievement and development to educators and schools across the United States and Canada. We offer more than 75,000 items through an innovative two-pronged marketing approach that targets both school administrators and individual teachers.
Our goal is to grow profitably as a leading provider of supplemental education products. We expect to achieve this goal over the long-term through both organic growth and through selective acquisitions. Although we experienced revenue declines in each of the last three fiscal years due primarily to the significant impact the current macroeconomic conditions have had on school spending, historically, we have grown through a combination of acquisitions and internal investments that drive organic growth. In the past few years, our growth strategies have been focused primarily on the curriculum-based supplemental products, and we expect that this focus will continue in the foreseeable future. While the number of acquisitions that we have completed has declined in the past three years, acquisitions remain a key strategy for us. Our future acquisition plans are focused primarily on acquiring curriculum-based products in disciplines where the Company’s current product offerings do not have the desired breadth and depth. In addition, the Company is committed to continuing to invest in its internal product development efforts in order to expand current offerings such as its science and reading intervention curricula. These growth plans, both through acquisitions and internal product development, will be mainly focused on curriculum-based products because these types of products provide a competitive advantage in their proprietary nature, and have typically provided greater profit margins to the Company. The Company’s annual revenue growth from curriculum-based products has been and will continue to be impacted by the cyclical nature of state adoptions of these products. Our state adoption revenue will continue to have significant variability between years due to the adoption schedules established by the individual states. The Company also remains committed to its commodity-type products and, while its acquisition strategy is more focused on curriculum-based supplemental products, the Company continues to invest resources towards increasing the Company’s market share for these commodity-type products.
Our gross margin has decreased from 42.7% in fiscal 2007 to 40.4% in fiscal 2011. This decrease primarily resulted from higher price discounts within the Educational Resources segment during fiscal 2011 in response to more competitive pricing with the market. Product mix has an impact on consolidated gross margins as the Accelerated Learning segment has traditionally experienced higher revenue growth than the Educational Resources segment. Also, the year to year variation in state adoption revenue, which is typically higher gross margin product, will have an impact on gross margin between years.
Our operating income from continuing operations was $89.8 million, $99.5 million, $77.7 million, and $74.7 million in fiscal 2007, fiscal 2008, fiscal 2009 and fiscal 2010, respectively. In fiscal 2011, our operating loss and margin were $391.4 million and -51.4% respectively. The primary decrease in operating income is due to the goodwill and intangible asset non-cash impairment charge of $411.4 million the Company recorded in the first quarter of fiscal 2011. Due to the significance of the impairment charge in fiscal 2011, the Company believes it is more meaningful to compare operating income and margin from continuing operations excluding the impairment charge to prior years operating income and margin from continuing operations. Excluding the impact of the impairment charge, the Company’s operating income and margin from continuing operations were $20.0 million and 2.6%, respectively. The Company’s business results have been negatively impacted by the
24
recent downturn in the economy. The current economic conditions resulted in revenue and profitability declines as cautious spending by schools and teachers and growing state budget deficits have created uncertainty as to upcoming education funding levels from the states. In response to this uncertainty around education funding, a potential period of reduced spending by schools and the uncertainty of the duration of any such reduction, all of which negatively impacted our revenues, the Company initiated a significant expense-reduction plan beginning in fiscal 2010 in order to better balance expenses and product costs with potentially lower revenue. These expense-reduction plans were accomplished through a combination of facility closures, furloughs, functional department consolidations that resulted in staff reductions and improvements in our control of product costs through negotiations with some of the Company’s larger vendors. These cost savings partially offset the revenue shortfall caused by the weakened economy.
In the first quarter of fiscal 2011, the Company performed its annual impairment test of goodwill and indefinite-lived intangible assets. The continued downturn in the economy and cautious spending by schools and districts pointed to an impairment triggering event at the end of the first quarter of fiscal 2011. The Company had year-over-year revenue and gross profit declines in excess of 20% during the first quarter of fiscal 2011 and its cost reduction activities could not keep pace with these steeper than expected declines. The Company recorded a $411.2 million and $0.2 million impairment related to goodwill and indefinite-lived intangible assets, respectively. See Note 5 of Notes to Consolidated Financial Statements for additional discussion of the impairment charge recorded for goodwill and indefinite-lived intangible assets.
The continued downturn in the economy as well as cautious spending by schools and districts also has had a negative effect on the Company’s investment in Carson-Dellosa Publishing, LLC (“Carson-Dellosa”). The Company reviews unaudited financial statements on a quarterly basis and audited financial statements on an annual basis for indicators of triggering events or circumstances that indicate a potential impairment. During the fourth quarter of fiscal 2011, the Company evaluated its investment in Carson-Dellosa for impairment and recorded a $6.9 million other-than-temporary impairment in other income (expense) in its Consolidated Statements of Operations. Carson-Dellosa is an unconsolidated affiliate in which the Company has a 35% ownership interest as described below. See Note 4 of Notes to Consolidated Financial Statements for additional discussion of the impairment charge recorded for the investment in unconsolidated affiliate.
Our business and working capital needs are highly seasonal, with peak sales levels occurring from June through October. During this period, we receive, ship and bill the majority of our business so that schools and teachers receive their products by the start of each school year. Our inventory levels increase in April through June in anticipation of the peak shipping season. The majority of shipments are made between June and October and the majority of cash receipts are collected from September through December. As a result, we usually earn more than 100% of our annual net income in the first two quarters of our fiscal year and operate at a net loss in our third and fourth fiscal quarters.
As expected, the fiscal 2011 back to school season was a difficult period as school funding remained under pressure. As such, the Company had a revenue decline of approximately 15% but is cautiously optimistic that school spending will begin to rebound in fiscal 2012. This optimism is based on modest improvements in the Company’s order rates for both segments in the fourth quarter of fiscal 2011. As revenue holds steady or increases into fiscal 2012, the Company’s ability to improve operating margins will be challenged as the Company begins to invest in the business through SG&A.
During fiscal 2011, the Company completed the acquisition of a portion of the operating assets of Telex (“Telex”) for an aggregate purchase price of $0.4 million. The assets acquired relate to Telex’s distribution of headphones, earphones, headsets, and their replaceable cords used in the education marketplace. The earphone and headphone models subject to the acquisition are the Discovery, Odyssey, Explorer and 610 models. This business has been integrated into the Company’s Califone business within the Educational Resources segment. The results of this business have been included in the accompanying consolidated financial statements under Item 8 since the date of acquisition and would not have had a material effect on the Company’s overall performance on a pro forma basis and did not have a material effect on the Company’s fiscal 2011 performance.
25
During fiscal 2010, the Company completed the acquisition of AutoSkill for an aggregate purchase price of $11.7 million. AutoSkill is a leading education technology company that provides educators with reading and math intervention solutions for struggling students. This business has been integrated into the Company’s Educator’s Publishing Service business within the Accelerated Learning segment. The results of AutoSkill have been included in the accompanying consolidated financial statements under Item 8 since the date of acquisition, would not have had a material effect on the Company’s overall performance on a pro forma basis and did not have a material effect on the Company’s fiscal 2010 performance.
During fiscal 2010, the Company completed the divestiture of the School Specialty Publishing (“SSP”) business unit to Carson-Dellosa Publishing, LLC (“Carson-Dellosa”), a newly-formed business entity. Under the divestiture agreement, the Company combined its publishing unit net assets with those of Cookie Jar Education, Inc. and received a 35% interest, accounted for under the equity method, in Carson-Dellosa Publishing, a newly formed entity.
Results of Continuing Operations
The following table sets forth certain information as a percentage of revenues on a historical basis concerning our results of operations for the fiscal years 2011, 2010 and 2009
| Fiscal Year | ||||||||||||
| 2011 | 2010 | 2009 | ||||||||||
| Revenues |
100.0 | % | 100.0 | % | 100.0 | % | ||||||
| Cost of revenues |
59.6 | 57.7 | 59.1 | |||||||||
| Gross profit |
40.4 | 42.3 | 40.9 | |||||||||
| Selling, general and administrative expenses |
37.7 | 34.0 | 33.5 | |||||||||
| Impairment charge |
54.0 | 0.0 | 0.0 | |||||||||
| Operating income (loss) |
-51.3 | 8.3 | 7.4 | |||||||||
| Interest expense, net |
3.7 | 3.4 | 2.9 | |||||||||
| Other expense |
0.0 | 0.0 | 0.3 | |||||||||
| Impairment of equity-method investment |
0.9 | 0.0 | 0.0 | |||||||||
| Expense associated with convertible debt exchange |
0.3 | 0.0 | 0.0 | |||||||||
| Income (loss) before provision for income taxes |
-56.2 | 4.9 | 4.2 | |||||||||
| Provision for (benefit from) income taxes |
-9.6 | 2.0 | 1.7 | |||||||||
| Earnings (loss) from continuing operations |
-46.6 | % | 2.9 | % | 2.5 | % | ||||||
Consolidated Results of Continuing Operations
Fiscal 2011 Compared to Fiscal 2010
The following discussion and analysis of fiscal 2011 results compared to fiscal 2010 results is based on a comparison of the Company’s results of operations from continuing operations.
Overview of Fiscal 2011
Revenues for fiscal 2011 decreased 15.0% to $762.1 million as compared to $896.7 million in fiscal 2010. The Educational Resources and Accelerated Learning segments experienced revenue declines of 16.6% and 11.5% in fiscal 2011, respectively. The revenue declines in both the Educational Resources and the Accelerated Learning segments were attributable primarily to the current macroeconomic conditions and the impact those conditions have had on state budget funding levels. According to the National Bureau of Economic Research, state revenue collections underperformed forecasts during the latest recession. Since approximately 50% of school funding is provided by states, the Company believes the decreased state revenues are adversely affecting
26
school funding and the related spending by schools. The Company is cautiously optimistic that the 2010 funding cycle may be the bottom of the school spending decline. State revenues, a key component of school funding, are projected to begin to rise in 2011, according to the National Conference of State Legislatures. Also contributing to the revenue decline in the supplies category within Educational Resources were execution issues in the Company’s pricing and bid strategies. The Company believes is has corrected both the pricing and bid strategies. Despite the decline in funding levels, the Company believes it can grow revenues by increasing market share.
Approximately 59% of the revenue decline in the Accelerated Learning segment was attributable to the fiscal 2010 divestiture of the School Specialty Publishing (“SSP”) business unit. The remaining decline is attributable to the school funding constraints which the Company believes are leading to school districts lengthening the decision-making cycles for curriculum purchases.
Competitive pressures have resulted in more significant price discounting, especially in the furniture and supply categories. Gross margin decreased 190 basis points to 40.4% in fiscal 2011 as compared to 42.3% in fiscal 2010. The decreased gross margin was related primarily to competitive pricing pressures in the Educational Resources segment. The Company expects this gross margin degradation to lessen in fiscal 2012 as it begins to implement new pricing programs.
Selling, general and administrative (“SG&A”) increased 370 basis points as a percent of revenue in fiscal 2011 as compared to fiscal 2010. The increase in SG&A as a percent of revenue is due to the fixed cost portion of SG&A being spread over a smaller revenue base. Total SG&A declined by $16.9 million in fiscal 2011 as compared to fiscal 2010. The Company’s full-time staffing is down approximately 175 individuals as compared to last year. When the Company begins to experience revenue growth, it expects to increase SG&A due to both volume-related costs and increased investments in the business.
We recorded $411.4 million of pre-tax impairment charges in the first quarter of fiscal 2011 primarily to reduce the carrying value of goodwill of the Education Resources reporting unit, which is part of the Educational Resources segment, and the Science and Planning and Student Development reporting units, which are part of the Accelerated Learning segment. The Company experienced a significant decline in revenue and operating income in the first quarter, as education spending continued to suffer from the ongoing economic downturn. This, coupled with the decline in the Company’s market capitalization during the first quarter of fiscal 2011, led to the determination during that period that goodwill and an indefinite-lived tradename were impaired. The Company also recorded a $6.9 million pre-tax impairment charge related to its investment in Carson-Dellosa in the fourth quarter of fiscal 2011. Carson-Dellosa experienced declines in its revenue and operating income in fiscal 2011, which led the Company to the determination that its investment was impaired in the fourth quarter of fiscal 2011.
Operating loss was $391.4 million in fiscal 2011 as compared to operating income of $74.7 million in fiscal 2010. Operating margins decreased from 8.3% in fiscal 2010 to 2.6% in fiscal 2011 excluding the impact of the impairment charge. The decrease in operating income is a result of declines in school spending in fiscal 2011 due to the uncertainty in education funding levels and state budgetary concerns.
Revenue
Revenues decreased 15.0% from $896.7 million in fiscal 2010 to $762.1 million in fiscal 2011, which was attributable to declines in both the Educational Resources and Accelerated Learning segments.
Educational Resources segment revenues decreased 16.6%, or $106.2 million, from $641.0 million in fiscal 2010 to $534.8 million in fiscal 2011. Revenue amounts for both periods were comprised solely of sales to external parties. The decline in Educational Resources segment revenue was comprised of a decline of approximately $50 million in the administrator and educator supplies product lines and a decline of approximately $56 million in the furniture product lines. The decline in the supplies category revenue was related to reductions in school spending as a result of on-going school funding issues, as well as execution issues in the Company’s pricing and bid strategy. The Company estimates that these execution issues resulted in approximately
27
$20 million of the revenue decline in the supplies category. The decline in the furniture category revenue was a result of the continued weakness in the school construction activity. While the Company does not anticipate any significant near-term improvement in school construction activity, the Company had an increase in orders for loose furniture in the fourth quarter of fiscal 2011 which the Company believes is an indicator of increasing market share. Decreased prices in response to competitive pressures in the high-volume commodity supplies and furniture categories contributed approximately $24 million of revenue decline for the segment.
Accelerated Learning segment revenues decreased 11.5%, or $29.6 million, from $256.2 million in fiscal 2010 (which included $0.6 million of intersegment revenues) to $226.6 million in fiscal 2011 (which is comprised of solely sales from external parties). The divestiture of SSP accounted for $17.5 million of the decline. The acquisition of AutoSkill, acquired in the second quarter of fiscal 2010 added $2.8 million of revenue in the first half of fiscal 2011. The remaining decrease of $14.9 million is a result of customer spending declines across all education categories due to education spending cuts by states, which the Company believes are affecting school districts’ spending decisions on purchasing new curriculum-based materials. The Company expects some modest revenue increase in fiscal 2012 due to state adoption schedules for science curriculum.
Gross Profit
Gross profit decreased 18.9% from $379.1 million in fiscal 2010 to $307.5 million in fiscal 2011. The decrease in consolidated revenue resulted in $56.9 million of the decline in gross profit had consolidated gross margin remained constant. The decrease in consolidated gross margin of 190 basis points decreased gross profit by $14.7 million. Gross margin as a percentage of revenue decreased 190 basis points from 42.3% in fiscal 2010 to 40.4% in fiscal 2011. The decreased gross margin was related to higher price discounts within the Educational Resources segment due to competitive pricing within the market. A shift in product mix between the Company’s segments account for approximately 20 basis points of gross margin improvement in fiscal 2011. The Accelerated Learning segment, which generates higher margin than the Educational Resources segment, accounted for 28.6% of the consolidated revenue in fiscal 2010 as compared to 29.7% of the consolidated revenue in fiscal 2011.
Educational Resources segment gross profit decreased $53.6 million, or 23.0%, from $233.0 million in fiscal 2010 to $179.4 million in fiscal 2011. The decrease in segment revenue resulted in approximately $38.6 million of the decline in gross profit had segment gross margin remained constant. Gross margin as a percentage of revenue decreased 280 basis points from 36.3% in fiscal 2010 to 33.5% in fiscal 2011. This decline in gross margin was related to higher price discounting in the furniture and high-volume commodity supply categories. The Company expects the rate of decline in gross margin to lessen in upcoming quarters of fiscal 2012 as pricing issues have been addressed for the current back-to-school season.
Accelerated Learning segment gross profit decreased $17.6 million, or 12.3%, from $143.4 million in fiscal 2010 to $125.9 million in fiscal 2011. The decrease in segment revenue resulted in $16.5 million of the decline in the gross profit, had segment gross margin remained constant. Gross margin as a percentage of revenue decreased 50 basis points from 56.0% in fiscal 2010 to 55.5% in fiscal 2011 resulted in a $1.1 million decrease in gross profit. The decrease in gross margin is a result of unfavorable product mix shift. This decreased gross margin was primarily related to expedited printing and freight costs for the agendas products which reduced gross margin by approximately 30 basis points.
Selling, General and Administrative Expenses
Selling, general and administrative expenses (“SG&A”) include selling expenses, the most significant of which are sales wages and commissions; operations expenses, which include customer service, warehouse and out-bound freight costs; catalog costs; general administrative overhead, which includes information systems, accounting, legal and human resources; and depreciation and intangible asset amortization expense.
28
SG&A as a percent of revenues increased from 34.0% of revenues in fiscal 2010 to 37.7% of revenues in fiscal 2011. SG&A decreased $16.9 million from $304.5 in fiscal 2010 to $287.6 in fiscal 2011. Approximately $1.6 million of the SG&A savings in fiscal 2011 is related to compensation related decisions made by management during the year, including furloughs for all employees. SG&A attributable to the Educational Resources and Accelerated Learning segments decreased a combined $22.6 million and Corporate SG&A increased $5.7 million in fiscal 2011 as compared to fiscal 2010. The increase in Corporate SG&A was related primarily to increases in technology spending to support the Company’s business systems and eCommerce platform and incremental depreciation related to the Company’s ERP system, which was offset by approximately $0.4 million related to the above mentioned compensation related decisions. SG&A as a percent of revenue increased from 34.0% in fiscal 2010 to 37.7% in fiscal 2011, as cost cutting actions did not keep pace with the decline in revenues.
Educational Resources segment SG&A decreased $16.8 million, or 10.0%, from $169.0 million in fiscal 2010 to $152.2 million in fiscal 2011. The segment experienced a decrease of approximately $9 million in its variable SG&A costs such as transportation, warehousing, and selling expenses associated with decreased revenues. In addition, the segment had a decline of approximately $3.0 million in its marketing costs primarily associated with a reduction in catalog amortization through reduced circulation of supplemental catalogs. The segment’s portion of the consolidated savings related to the above-mentioned compensation related decisions was approximately $0.7 million. The remaining decline is related to compensation savings due to reduced headcount. Educational Resources segment SG&A increased as a percent of revenues from 26.4% in fiscal 2010 to 28.5% in fiscal 2011.
Accelerated Learning segment SG&A decreased $5.8 million, or 5.7%, from $100.8 million in fiscal 2010 to $95.0 million in fiscal 2011. The divestiture of the SSP business led to a $7.4 million decrease in SG&A. Reduced volume led to approximately $1.0 million of a decrease in the segments variable costs such as transportation, warehousing, and selling expenses. In addition, the segment had a decrease of $1.7 million in its administrative as a result of the conversion of one of the operating units onto the Company’s ERP system. The segment’s portion of the consolidated savings related to the above-mentioned compensation related decisions was approximately $0.5 million. Partially offsetting these decreased expenses was an increase of approximately $3.0 million in selling and marketing expenses as a result of the expansion of the reading intervention and health sales forces. Accelerated Learning segment SG&A increased as a percent of revenues from 39.4% in fiscal 2010 to 41.9% in fiscal 2011.
Corporate SG&A increased by $5.7 million from $34.6 million in fiscal 2010 to $40.3 million in fiscal 2011. Of the $5.7 million increase in Corporate SG&A, approximately $3.8 million is related primarily to increases in technology spending to support the Company’s business systems and eCommerce platform and incremental depreciation related to the Company’s ERP system which was offset by approximately $0.4 million related to the above mentioned compensation related decisions.
Impairment
The impact of macro-economic conditions on school spending negatively impacted the fiscal 2011 back-to-school season. Declines in the Company’s current operating results and projections that fiscal 2012 results will be in line with recent results while the economy and school spending recover have significantly changed the Company’s projected cash flows used in the goodwill assessment as compared to prior year cash flow estimates. As a result of the goodwill and intangible asset impairment tests, the Company concluded in its assessment of goodwill and intangible asset impairment in the first quarter of fiscal 2011 that the carrying value amounts of certain reporting units exceeded their fair value. The goodwill impairment charge was $411.2 million, which consisted of $249.7 million, $55.4 million, and $106.1 million for the Educational Resources, Science, and Planning and Student Development reporting units, respectively. These goodwill impairment charges were determined by comparing the carrying value of each reporting unit’s goodwill with the implied fair value of goodwill for the reporting unit. An additional impairment of $0.2 million in the first quarter was related to an indefinite-lived tradename intangible. No impairment charges were recorded in fiscal 2010.
29
Net Interest Expense
Net interest expense decreased $2.3 million from $30.5 million in fiscal 2010 to $28.2 million in fiscal 2011. Approximately $3.1 million of the decrease in interest expense was related to the decreased non-cash interest expense associated with the convertible notes offset by an increase in the Company’s overall effective borrowing rate from 4.4% in fiscal 2010 to 5.1% in fiscal 2011. This increase in the effective borrowing rate was primarily related to the increased commitment fees in the Company’s existing credit facility as compared to its previous facility and an increased rate on the Company’s average borrowings. The commitment fees on the unused portion of the credit facility during the fiscal year were approximately 50 basis points as compared to approximately 25 basis points in the prior year. This increased interest expense by $0.6 million in fiscal 2011 as compared to fiscal 2010.
Other Expense
In the fourth quarter of fiscal 2011, the Company entered into exchange agreements with holders of $100.0 million in aggregate principal amount of the Company’s 3.75% Convertible Debentures due 2026 that were originally issued in 2006. In the exchange for their old debentures, the holders received new debentures with changes to the conversion, put and premium features. The Company incurred $1.9 million in issuance costs in conjunction with this exchange transaction. These costs have been expensed in fiscal 2011.
The Company recorded an impairment of its equity method investment in Carson-Dellosa in the fourth quarter of fiscal 2011. The value of the Company’s 35% ownership interest in the entity was evaluated in light of the impact that school spending declines have had on the projected cash flows of the equity investment. The decline in current and projected cash flows is resulting in the value of the Company’s ownership interest to be less than the Company’s carrying amount by $6.9 million. This write-down has been reflected in other expense. There was no write-down in fiscal 2010.
The Company’s share of the loss from this equity method investment is reflected in the losses of unconsolidated affiliate.
Provision for (Benefit from) Income Taxes
The benefit from income taxes was $73.1 million in fiscal 2011. The effective tax rate in fiscal 2011 was 17.1% as compared to 40.0% in fiscal 2010. The current year income tax benefit includes $66.5 million of income tax benefit related to the $411.4 million goodwill and non-amortizable asset impairment. Approximately $237.8 million of the goodwill impairment was related to non-deductible goodwill associated with past stock acquisitions for which a tax benefit was not recorded. The remaining goodwill and intangible asset impairment generated the $66.5 million of tax benefit. Due to the significant impact the impairment charge had on the effective tax rate, the Company believes the tax benefit and the effective tax rate excluding the $411.4 million impairment charge are more meaningful comparisons to last year’s comparable period. Excluding this goodwill and intangible asset impairment charge, the tax benefit for fiscal 2011 was $6.6 million as compared to a provision for income taxes of $17.7 million in fiscal 2010. The decline is related to the decrease in earnings before tax. Excluding this goodwill and indefinite-lived intangible asset impairment charge, the effective tax rate was 39.2% in fiscal 2011 as compared to 40.0% in fiscal 2010. The change in the effective tax rate is related primarily to the impact of the permanent items and state taxes on a lower tax base.
The effective income tax rate of 39.2% exceeds the federal statutory rate of 35% primarily due to state income taxes.
Fiscal 2010 Compared to Fiscal 2009
The following discussion and analysis of fiscal 2010 results compared to fiscal 2009 results is based on a comparison of the Company’s results of operations from continuing operations.
30
Overview of Fiscal 2010
Revenues for fiscal 2010 decreased 14.4% to $896.7 million as compared to $1.047 billion in fiscal 2009. In the second half of fiscal 2009, the Company experienced a significant decline in revenue as the macroeconomic conditions created uncertainty in the school districts related to state budget funding levels. This decline continued in fiscal 2010 as school budgets came under more pressure, which in turn, has led to cautious spending by our customers, especially in the furniture product lines within the Educational Resources segment, which accounted for well over one-half of the segment’s revenue decline. The decrease was also related to a decrease in state adoption revenue derived from the Company’s science curriculum-based offering.
The Company’s overall revenue mix shifted toward the Educational Resources segment, with the segment comprising 71.5% of revenues in fiscal 2010 as compared with 70.4% in fiscal 2009. Gross margins in the segment increased from 34.8% in fiscal 2009 to 36.3% in fiscal 2010. This increase was attributable to net price increases in excess of product cost increases as the segment executed on its initiatives to better align its pricing structure with product costs as well as a product mix shift towards administrator and educator supplies products within the Educational Resources segment, which carry higher gross margins than furniture products.
Operating income was $74.7 million in fiscal 2010 as compared to $77.7 million in fiscal 2009. Operating margins increased from 7.4% in fiscal 2009 to 8.3% in fiscal 2010. The decrease in operating income was a result of macroeconomic conditions in fiscal 2010 and reductions in fiscal 2010 school spending due to the uncertainty in education funding levels and state budgetary concerns. The operating margin increase was a result of both gross margin improvements and expense reductions resulting from compensation-related decisions, headcount reductions, operational consolidations and restructuring and other cost control initiatives.
Revenue
Revenues decreased 14.4% from $1.047 billion in fiscal 2009 to $896.7 million in fiscal 2010, which was attributable to declines in both the Educational Resources and Accelerated Learning segments.
Educational Resources segment revenues decreased 13.0%, or $96.0 million, from $737.1 million in fiscal 2009 to $641.1 million in fiscal 2010. Revenue amounts for both periods were comprised solely of sales to external parties. The decline in Educational Resources segment revenue was comprised of a decline of approximately $40 million, or approximately 9%, in the administrator and educator supplies product lines and a decline of approximately $56 million, or approximately 20%, in the furniture product lines. These declines were most directly attributable to the ongoing weakened economic conditions which we believe have negatively impacted school purchasing decisions. This was particularly noticeable in those states which have been more seriously affected by the economic decline, such as California, Florida, Illinois, and Michigan. The Company believes that its cost cutting initiatives partially contributed to the revenue decline through elimination of catalogs and the back-office consolidations that affected marketing and selling efforts. The larger decline in furniture product line is reflective of the fact that those purchases are more discretionary in nature and economic conditions led to reductions in school construction and renovation activities.
Accelerated Learning segment revenues decreased 17.4%, or $54.0 million, from $310.2 million in fiscal 2009 (which included $1.0 million of intersegment revenues) to $256.2 million in fiscal 2010 (which included $0.6 million of intersegment revenues). Approximately $21 million of the decline in Accelerated Learning segment revenue was due to the decrease in state adoption revenue of the Company’s curriculum-based products, primarily in the state of California, which the Company had anticipated would occur. In addition, the Company’s divestiture of its retail trade book business, School Specialty Publishing, resulted in a revenue decline of $12.9 million in fiscal 2010 as compared to fiscal 2009. Partially offsetting this decline was incremental revenue of $5.9 million related to the Company’s acquisition of AutoSkill. The remaining decline of approximately $26 million, or approximately 9%, was attributable to the impact that the downturn in the general economic conditions has had on school districts’ spending decisions.
31
Gross Profit
Gross profit decreased 11.5% from $428.6 million in fiscal 2009 to $379.1 million in fiscal 2010. The decrease in consolidated revenue resulted in $61.5 million of the decline in gross profit had consolidated gross margin remained constant offset by $12.0 million of gross margin increases. Gross margin increased 140 basis points from 40.9% in fiscal 2009 to 42.3% in fiscal 2010. The increase in gross margin was related to gross margin increases in both segments, as further discussed below. Partially offsetting the gross margin increase was approximately 20 basis points of gross margin decline related to the mix of revenue between segments. The Accelerated Learning segment, which generates higher margin than the Educational Resources segment, accounted for 29.6% of the consolidated revenue in fiscal 2009 as compared to 28.6% of the consolidated revenue in fiscal 2010.
Educational Resources segment gross profit decreased $23.6 million, or 9.2%, from $256.6 million in fiscal 2009 to $233.0 million in fiscal 2010. The decrease in segment revenue resulted in approximately $33.4 million of the decline in gross profit had segment gross margin remained constant. Partially offsetting the decline was approximately $9.8 million of incremental gross profit related to an increase of 150 basis points in segment gross margin from 34.8% in fiscal 2009 to 36.3% in fiscal 2010. Approximately 130 basis points of the gross margin improvement was related to the Company’s pricing initiatives which resulted in price increases in excess of product cost increases. This includes the impact of lower transportation costs which were related to the decreased fuel costs in fiscal 2010 as compared to fiscal 2009. The remaining gross margin improvement of approximately 20 basis points was a result of product mix. During fiscal 2010, the revenue shifted to more consumable products versus furniture, and the consumable products generate a higher gross margin than the furniture products.
Accelerated Learning segment gross profit decreased $25.5 million, or 15.1%, from $168.9 million in fiscal 2009 to $143.4 million in fiscal 2010. The decrease in segment revenue resulted in $29.5 million of the decline in gross profit, had segment gross margin remained constant. The decline was offset by an increase in gross margin as a percentage of revenue of 150 basis points from 54.5% in fiscal 2009 to 56.0% in fiscal 2010, which increased gross profit by $4.0 million. The increase in gross margin was a result of favorable product mix shift within the segment, primarily related to the incremental revenue from the AutoSkill acquisition, a higher margin business due to the software-content of its products, which increased gross margin by approximately 100 basis points. The remaining increase was related primarily to the divestiture of the School Specialty Publishing business in fiscal 2010, which generated lower gross margin than the segment’s overall gross margin.
Selling, General and Administrative Expenses
SG&A as a percent of revenues increased 50 basis points from 33.5% of revenues in fiscal 2009 to 34.0% of revenues in fiscal 2010. SG&A decreased $46.4 million from $350.9 million in fiscal 2009 to $304.5 million in fiscal 2010. Approximately $6.1 million of the SG&A reduction was attributable to compensation-related decisions during the year including, suspension of a Company 401(k) match, reduction in incentives, and a furlough for all employees. In addition, overall full-time employment declined by approximately 275 associates, or 12%, in fiscal 2010, which translates into approximately $15 million in compensation-related cost reductions. SG&A attributable to the Educational Resources and Accelerated Learning segments decreased a combined $34.3 million and Corporate SG&A decreased $12.1 million in fiscal 2010 as compared to fiscal 2009.
As a percent of revenue, Educational Resources segment SG&A increased from 26.3% in fiscal 2009 to 26.4% in fiscal 2010. The increase in SG&A as a percent of revenue was attributable to the fixed cost portion of SG&A being spread over a smaller revenue base. Educational Resources segment SG&A decreased $24.9 million, or 12.8%, from $193.9 million in fiscal 2009 to $169.0 million in fiscal 2010. The segment experienced a decrease of approximately $11 million in its variable SG&A costs such as transportation, warehousing, and selling expenses associated with decreased revenues. The segment’s portion of the savings from the above-mentioned compensation related decisions was approximately $1.7 million. Decreases in catalog circulation and the elimination of redundant catalog offerings contributed to a $2.3 million decline in catalog costs. Improvements in the current year fill rate for warehouse shipments has translated into approximately $7 million
32
of operational efficiency in both warehouse and transportation. The improved fill rate reduced the number of backorders. The remaining decline was related primarily to the compensation-savings associated with headcount reductions resulting from operational consolidations.
As a percent of sales, Accelerated Learning segment SG&A increased from 35.6% in fiscal 2009 to 39.4% in fiscal 2010. Accelerated Learning segment SG&A decreased $9.5 million, or 8.6% from $110.3 in fiscal 2009 to $100.8 million in fiscal 2010. The segment experienced a decrease of approximately $7 million in its variable SG&A costs such as transportation, warehousing, and selling expenses associated with decreased revenues. The segment’s portion of savings from the above-mentioned compensation-related decisions was approximately $1.3 million. The divestiture of the School Specialty Publishing business led to a $5.3 million decrease in SG&A, which was largely offset by the acquisition of AutoSkill, which increased SG&A by $5.0 million. The remaining reduction is related primarily to compensation savings associated with headcount reductions. The increase in SG&A as a percentage of revenue was due to the base non-variable costs in comparison to decreased revenue.
Corporate SG&A decreased by $12.1 million from $46.7 million in fiscal 2009 to $34.6 million in fiscal 2010. Of the $12.1 million decrease in Corporate SG&A, approximately $3.1 million was related to the above-mentioned compensation-related decisions, approximately $1.7 million was related to fiscal 2009 expense incurred for the closing of the Lyons, New York distribution center and approximately $0.9 million was due to stock-based compensation expense. Corporate also had a $1.6 million dollar decrease in marketing expense as some corporate marketing associates were moved into the segments. The remaining Corporate SG&A decrease was related primarily to the lower compensation and benefit costs associated with headcount reductions. These headcount reductions were a function of a combination of back office consolidation as well as staffing reductions made to address the revenue decline.
Net Interest Expense
On April 26, 2009, the Company adopted FASB ASC Topic 470-20, “Debt with Conversion and Other Options.” Net interest expense including the impact of the adoption of FASB ASC Topic 470-20 was $30.5 million in fiscal 2010 compared to $29.9 million in fiscal 2009. The non-cash interest related to the adoption of FASB ASC Topic 470-20 was $13.1 million in fiscal 2010 compared to $12.0 in fiscal 2009.
A reduction in the overall effective borrowing rate from 4.5% in fiscal 2009 to 4.4% in fiscal 2010 reduced interest expense by approximately $0.7 million. An $8.0 million dollar decrease in the Company’s average outstanding borrowings in fiscal 2010 as compared to fiscal 2009 contributed approximately $0.3 million of interest expense decrease. Partially offsetting the decreases was $0.5 million of additional debt issuance amortization mainly related to the early retirement of the Company’s prior Amended and Restated Credit Agreement, which was replaced with a new Credit Agreement in April 2010.
Other Expense
Other expense, which primarily consists of the discount and loss on the Company’s accounts receivable securitization, was $0 in fiscal 2010 as compared to $2.7 million in fiscal 2009. This decrease was due to the non-renewal of the Company’s securitization facility, which expired on January 28, 2009.
Provision for Income Taxes
Provision for income taxes decreased to $17.7 million in fiscal 2010 from $18.0 million in fiscal 2009. The decrease was due to lower pre-tax income. The effective income tax rate was 40.0% in fiscal 2010 as compared to 39.8% in fiscal 2009.
The effective income tax rate exceeded the federal statutory rate of 35% in both years primarily due to the impact of state and foreign taxes.
33
Liquidity and Capital Resources
At April 30, 2011, the Company had negative working capital of $17.5 million. Our capitalization at April 30, 2011 was $497.9 million and consisted of debt of $296.3 million and shareholders’ equity of $201.6 million.
On February 16, 2011, the Company amended its credit agreement to provide greater flexibility on financial covenant ratios to allow the Company to continue to invest in its initiatives and to provide flexibility related to the refinancing of its convertible subordinated notes. The amendment, among other things, reduced the overall credit facility capacity from $350.0 million to $300.0 million, with the ability to convert up to $125 million of the revolving commitment to a delayed draw term loan to be used to refinance the Company’s convertible notes. Covenant modifications included increases in both the total and senior leverage ratios, while the facility’s interest rate will generally increase 750 basis points on borrowings, depending on Company leverage.
The Company’s credit facility matures on April 23, 2014 and, as amended, provides for $300.0 million of availability, which consists of $175.0 million of a revolving loan and a delayed draw term loan of up to $125.0 million. The delayed draw term loan can be used to refinance a portion of the Company’s convertible debt. In certain circumstances, unused amounts on the delayed draw term loan can be converted to availability on the revolver. The amount outstanding as of April 30, 2011 under the revolving and incremental term loans was $91.3 million and $0, respectively. The credit facility is secured by substantially all of the Company’s assets and contains certain financial and other covenants. During fiscal 2011, the Company borrowed under our credit facility primarily to meet seasonal working capital requirements. The Company’s borrowings are usually significantly higher during the first two quarters of the fiscal year to meet the working capital requirements of our peak selling season. As of April 30, 2011, the Company’s effective interest rate on borrowings under our credit facility was 4.0%, which excludes amortization of loan origination fee costs and the commitment fees on unborrowed funds. During fiscal 2011, the Company paid commitment fees on unborrowed funds under the credit facility of $1.3 million and amortized loan origination fee costs of $1.0 million related to the credit facility. The credit facility contains certain financial covenants, including a consolidated total and senior leverage ratio, a consolidated fixed charge ratio and a limitation on consolidated capital expenditures and places certain limitations on our ability to repurchase our common stock. The Company was in compliance with these covenants and restrictions at April 30, 2011.
The Company closely evaluates its expected ability to remain in compliance with the consolidated total leverage and interest coverage ratios due to the ratios’ sensitivity to the Company’s financial results. The recent economic trends impacting the Company’s performance, such as the decline in school funding which had led to a decrease in the Company’s revenues and margins, have put pressure on the Company’s ability to remain in compliance with these ratios. Based on current forecasts reflected in our most recent guidance, the Company may be unable to maintain compliance with one or both of these financial covenants during fiscal 2012. The Company may need to work with its lenders to secure a waiver or amend such ratios in the near future. Any amendment or waiver would result in additional bank fees and more restrictive terms, and may increase the cost of any future borrowings.
Holders of the Company’s $133.0 million, 3.75% convertible subordinated notes due 2023 presented $132.9 million in aggregate principle amount of the notes to the Company for redemption during the second quarter of fiscal 2011. The remaining outstanding amount of this issuance, $0.1 million, was called by the Company during the second quarter of fiscal 2011. The Company satisfied the $133.0 million repayment in cash by borrowing on its credit facility.
In November 2006, we sold $200.0 million of convertible subordinated debentures due 2026 (the “2006 Debentures”). The 2006 Debentures are unsecured, subordinated obligations of the Company, pay interest at 3.75% per annum on each May 30th and November 30th, and are convertible upon satisfaction of certain conditions. In connection with any such conversion, the Company will deliver cash equal to the lesser of the
34
aggregate principal amount of debentures to be converted and the Company’s total conversion obligation, and will deliver, at its option, cash or shares of the Company’s common stock in respect of the remainder, if any, of the Company’s conversion obligation. The initial conversion rate is 19.4574 shares per $1,000 principal amount of debentures, which represents an initial conversion price of approximately $51.39 per share. The outstanding 2006 Debentures are redeemable at the Company’s option on or after November 30, 2011. On November 30, 2011, 2016 and 2021 and upon the occurrence of certain circumstances, holders will have the right to require us to repurchase all or some of the debentures.
On March 1, 2011 we exchanged $100.0 million in aggregate principal amount of the outstanding 2006 Debentures, for $100.0 million convertible debentures also due November 30, 2026 (the “New Debentures”). These New Debentures are unsecured, subordinated obligations of the Company, pay interest at 3.75% per annum on each May 30th and November 30th, and are convertible upon satisfaction of certain conditions. Principal will accrete on the New Debentures at a rate of 3.9755% per year, compounding on a semi-annual basis. In connection with any such conversion, the Company will deliver cash equal to the lesser of the aggregate principal amount of New Debentures to be converted and the Company’s total conversion obligation, and will deliver, at its option, cash or shares of the Company’s common stock in respect of the remainder, if any, of the Company’s conversion obligation. The initial conversion rate is 44.2087 shares per $1,000 principal amount of New Debentures, which represents an initial conversion price of approximately $22.62 per share. The New Debentures are redeemable at the Company’s option on or after May 30, 2014. On November 30, 2014, 2018 and 2022 and upon the occurrence of certain circumstances, holders will have the right to require us to repurchase all or some of the New Debentures.
Net cash provided by operating activities decreased $52.1 million from $112.1 million in fiscal 2010 to $60.0 million for fiscal 2011. The decline in net income, adjusted for the after-tax impact of non-cash items is contributing approximately $32 million to the decline in operating cash flow. The retirement of and exchange of convertible debt resulted in a reduction in deferred tax liabilities of approximately $41 million, which reduced operating cash flow net of accrued or refundable income taxes, by $28 million. Partially offsetting this decrease in cash provided by operating activities was year-over-year working capital improvements, particularly in accounts payable net of inventory increases.
Working capital decreased $27.3 million in fiscal 2011 compared to fiscal 2010. The change in working capital is primarily due to the $37.7 million increase in accounts payable. The increase in accounts payable is due to planned inventory purchases in the fourth quarter of fiscal 2011 for the upcoming back-to-school season as well as extended payment terms with vendors. The Company was also able to reduce its accounts receivable in fiscal 2011. The Company’s accounts receivable balances declined by $5.3 million due to improved collections which is reflected in a reduction in day’s sales outstanding by 5 days. Inventories increased $11.4 million due to advanced purchases to avoid price increases from vendors as well as the build up for the selling season. Accrued liabilities increased by approximately $6.8 million primarily due to accrued income taxes as of the fiscal year ended April 30, 2011.
Net cash used in investing activities for fiscal 2011 was $25.2 million, compared to $36.8 million for fiscal 2010. The decrease in cash used in investing activities was primarily attributable to three transactions in fiscal 2010. The Company used cash for the $11.7 million and $1.8 million purchase price acquisition of AutoSkill and ThinkMath!TM, respectively. In addition the Company received $2.0 million during fiscal 2010 attributable to the sale of the Company’s Lyons, New York facility.
Net cash used in financing activities was $46.0 million in fiscal 2011 as compared to $56.1 million in fiscal 2010. The decrease of $10.1 million in net cash used in financing activities is attributable to $91.3 million of debt outstanding on the Company’s revolving credit facility in fiscal 2011 as compared to $0 in fiscal 2010 offset by the Company’s redemption of its $133.0 million 3.75% convertible subordinated notes due 2023 in the second quarter of fiscal 2011 as well as a reduction of cash used in investing activities.
35
On June 12, 2008, we announced that our Board of Directors approved a new share repurchase program, which allows us to purchase up to $50.0 million of our outstanding common stock. As of April 30, 2011, $34.7 million of this repurchase authorization is remaining. Purchases under the share repurchase program may be made from time to time in the open market or through privately negotiated transactions. Common stock acquired through the share repurchase program will be available for general corporate purposes. However, the Company’s amended credit facility limits the Company’s ability to repurchase shares of its common stock.
We anticipate that our cash flow from operations, borrowings available from our existing credit facility and other sources of capital will be sufficient to meet our liquidity requirements for operations, including anticipated capital expenditures, share repurchases and our contractual obligations for the foreseeable future.
We expect our fiscal 2012 capital expenditures to be approximately $12.0 million and to consist primarily of software costs related to the continued implementation of the new ERP platform and warehouse management costs. We expect our investment in product development to be approximately $8.0 million.
Off Balance Sheet Arrangements
The Company’s accounts receivable securitization facility expired January 28, 2009 and the Company elected to not renew the facility due to the significant cost increases in accounts receivable asset-backed securities markets compared to the costs of other sources of liquidity available to the Company. The Company had originally entered into the facility for the purpose of reducing the Company’s variable rate interest expense. However, in the current rate environment, the facility was not providing any material reduction in the Company’s variable rate interest expense and a renewed facility would have actually resulted in an increase to the Company’s variable rate interest expense. The facility permitted advances up to $175.0 million from July 1 through November 30 of each year, and advances up to $75.0 million from December 1 through June 30 of each year. Costs associated with the sale of receivables, primarily related to the discount and loss on sale, for the fiscal year 2009 were $2.7. The decrease in these costs was related to a combination of decreased discount rates and the termination of the securitization facility.
These costs are included as a component of other expense in our consolidated statements of operations.
Summary of Contractual Obligations
The following table summarizes our contractual debt and operating lease obligations as of April 30, 2011:
| Payments Due (in thousands) |
||||||||||||||||||||
| Total | Less than 1 year |
1 - 3 years |
3 - 5 years |
More than 5 years |
||||||||||||||||
| Long-term debt obligations (1) |
$ | 111,554 | $ | 93,369 | $ | 4,136 | $ | 4,171 | $ | 9,878 | ||||||||||
| Convertible subordinated notes (2)(3) |
191,421 | 97,347 | — | 94,074 | — | |||||||||||||||
| Operating lease obligations |
46,242 | 7,432 | 12,066 | 8,122 | 18,622 | |||||||||||||||
| Purchase obligations (4) |
— | — | — | — | — | |||||||||||||||
| Total contractual obligations |
$ | 349,217 | $ | 198,148 | $ | 16,202 | $ | 106,367 | $ | 28,500 | ||||||||||
| (1) | Long-term debt obligations include principal and interest payments on our credit facility and sale-leaseback obligations, assuming these obligations remain outstanding until maturity at current or contractually defined interest rates. |
| (2) | Convertible subordinated debentures of $100,000 are recorded as maturing in more than five years as the bonds are not currently convertible. The debentures can be redeemed at the option of the Company no earlier than November 30, 2011. The amounts reflected for these debentures include accrued interest at the balance sheet date and interest at 3.75% through November 30, 2011. |
36
| (3) | Convertible subordinated debentures of $100,000 are recorded as maturing in more than five years as the bonds are not currently convertible. The debentures can be redeemed at the option of the Company no earlier than November 30, 2014. The amounts reflected for these debentures include accrued interest at the balance sheet date and interest at 3.75% through November 30, 2014. |
| (4) | As of April 30, 2011, we did not have any material long-term purchase obligations. The Company’s short-term purchase obligations as of April 30, 2011 were primarily for the purchase of inventory in the normal course of business. |
Fluctuations in Quarterly Results of Operations
Our business is subject to seasonal influences. Our historical revenues and profitability have been dramatically higher in the first two quarters of our fiscal year, primarily due to increased shipments to customers coinciding with the start of each school year. Quarterly results also may be materially affected by the timing of acquisitions, the timing and magnitude of costs related to such acquisitions, variations in our costs for the products sold, the mix of products sold and general economic conditions. Moreover, the operating margins of companies we acquire may differ substantially from our own, which could contribute to further fluctuation in quarterly operating results. Therefore, results for any quarter are not indicative of the results that we may achieve for any subsequent fiscal quarter or for a full fiscal year.
The following table sets forth certain unaudited consolidated quarterly financial data for fiscal years 2011 and 2010 (in thousands, except per share data). We derived this quarterly data from our unaudited consolidated financial statements.
| Fiscal 2011 | ||||||||||||||||||||
| First | Second | Third | Fourth | Total | ||||||||||||||||
| Revenues |
$ | 252,984 | $ | 291,879 | $ | 89,859 | $ | 127,356 | $ | 762,078 | ||||||||||
| Gross profit |
108,072 | 117,522 | 32,949 | 48,978 | 307,521 | |||||||||||||||
| Operating income (loss) |
(381,166 | ) | 38,204 | (26,220 | ) | (22,247 | ) | (391,429 | ) | |||||||||||
| Earnings (loss) from continuing operations, net of income taxes |
(331,627 | ) | 18,235 | (19,200 | ) | (22,643 | ) | (355,235 | ) | |||||||||||
| Equity in earnings (losses) of unconsolidated affiliate, net of tax |
— | (135 | ) | (950 | ) | 47 | (1,038 | ) | ||||||||||||
| Net income (loss) |
(331,627 | ) | 18,100 | (20,150 | ) | (22,596 | ) | (356,273 | ) | |||||||||||
| Basic earnings per share of common stock: |
||||||||||||||||||||
| Earnings (loss) from continuing operations |
$ | (17.58 | ) | $ | 0.96 | $ | (1.07 | ) | $ | (1.20 | ) | $ | (18.88 | ) | ||||||
| Total |
$ | (17.58 | ) | $ | 0.96 | $ | (1.07 | ) | $ | (1.20 | ) | $ | (18.88 | ) | ||||||
| Diluted earnings per share of common stock: |
||||||||||||||||||||
| Earnings (loss) from continuing operations |
$ | (17.58 | ) | $ | 0.96 | $ | (1.07 | ) | $ | (1.20 | ) | $ | (18.88 | ) | ||||||
| Total |
$ | (17.58 | ) | $ | 0.96 | $ | (1.07 | ) | $ | (1.20 | ) | $ | (18.88 | ) | ||||||
37
| Fiscal 2010 | ||||||||||||||||||||
| First | Second | Third | Fourth | Total | ||||||||||||||||
| Revenues |
$ | 330,367 | $ | 346,146 | $ | 103,126 | $ | 117,039 | $ | 896,678 | ||||||||||
| Gross profit |
142,791 | 143,105 | 42,418 | 50,834 | 379,148 | |||||||||||||||
| Operating income (loss) |
54,539 | 56,660 | (22,591 | ) | (13,911 | ) | 74,697 | |||||||||||||
| Earnings (loss) from continuing operations, net of income taxes |
28,429 | 29,597 | (18,210 | ) | (13,263 | ) | 26,553 | |||||||||||||
| Equity in earnings (losses) of unconsolidated affiliate, net of tax |
— | — | (241 | ) | (460 | ) | (701 | ) | ||||||||||||
| Net income (loss) |
28,429 | 29,597 | (18,451 | ) | (13,723 | ) | 25,852 | |||||||||||||
| Basic earnings per share of common stock: |
||||||||||||||||||||
| Earnings (loss) from continuing operations |
$ | 1.51 | $ | 1.57 | $ | (0.98 | ) | $ | (0.73 | ) | $ | 1.37 | ||||||||
| Total |
$ | 1.51 | $ | 1.57 | $ | (0.98 | ) | $ | (0.73 | ) | $ | 1.37 | ||||||||
| Diluted earnings per share of common stock: |
||||||||||||||||||||
| Earnings (loss) from continuing operations |
$ | 1.51 | $ | 1.57 | $ | (0.98 | ) | $ | (0.73 | ) | $ | 1.37 | ||||||||
| Total |
$ | 1.51 | $ | 1.57 | $ | (0.98 | ) | $ | (0.73 | ) | $ | 1.37 | ||||||||
Inflation
Inflation, particularly in fuel and other oil-related costs, has had and could continue to have an effect on our results of operations and our internal and external sources of liquidity.
Critical Accounting Policies
We believe the policies identified below are critical to our business and the understanding of our results of operations. The impact and any associated risks related to these policies on our business are discussed throughout MD&A where applicable. Refer to the notes to our consolidated financial statements in Item 8 for detailed discussion on the application of these and other accounting policies. The preparation of the consolidated financial statements requires management to make estimates and assumptions that affect the reported amounts of assets and liabilities and the disclosure of contingent assets and liabilities at the date of the financial statements and the reported amounts of revenues and expenses during the reporting period. We evaluate our estimates and assumptions on an ongoing basis and base them on a combination of historical experience and various other assumptions that we believe to be reasonable under the circumstances. Actual results could differ from those estimates. Our critical accounting policies that require significant judgments and estimates and assumptions used in the preparation of our consolidated financial statements are as follows:
Revenue Recognition
Revenue, net of estimated returns and allowances, is recognized upon the shipment of products or upon the completion of services provided to customers, which corresponds to the time when risk of ownership transfers, the selling price is fixed, the customer is obligated to pay, collectability is reasonably assured and we have no significant remaining obligations. Cash received in advance from customers is deferred on our balance sheet as a current liability and recognized upon the shipment of products or upon the completion of services provided to the customers.
Catalog Costs and Related Amortization
We spend over $20 million annually to produce and distribute catalogs. We accumulate all direct costs incurred, net of vendor cooperative advertising payments, in the development, production and circulation of our catalogs on our balance sheet until such time as the related catalog is mailed. They are subsequently amortized into SG&A over the expected sales realization cycle, which is one year or less. Consequently, any difference
38
between our estimated and actual revenue stream for a particular catalog and the related impact on amortization expense is neutralized within a period of one year or less. Our estimate of the expected sales realization cycle for a particular catalog is based on, among other possible considerations, our historical sales experience with identical or similar catalogs and our assessment of prevailing economic conditions and various competitive factors. We track our subsequent sales realization, reassess the marketplace, and compare our findings to our previous estimate and adjust the amortization of our future catalogs, if necessary.
Development Costs
We accumulate external and certain internal costs incurred in the development of our products which can include a master copy of a book, video or other media, on our balance sheet. As of April 30, 2011, we had $28.3 million in development costs and other, net, on our balance sheet. A majority of these costs are associated with science and reading intervention businesses. The capitalized development costs are subsequently amortized into cost of revenues over the expected sales realization cycle of the products, which is typically five years. During fiscal 2011, we amortized development costs of $5.3 million to expense related to our continuing businesses. We continue to monitor the expected sales realization cycle for each product, and will adjust the remaining expected life of the development costs or recognize an impairment, if warranted.
Goodwill and Intangible Assets, and Long-Lived Assets
At April 30, 2011, goodwill and intangible assets represented approximately 44.8% of our total assets. We review our goodwill and other indefinite life intangible assets for impairment annually, or more frequently if indicators of impairment exist. A significant amount of judgment is involved in determining if an indicator of impairment has occurred. Such indicators may include, among others: a significant decline in our expected future cash flows; a sustained, significant decline in our stock price and market capitalization; a significant adverse change in legal factors or in the business climate; unanticipated competition; the testing for recoverability of a significant asset group within a reporting unit; and slower growth rates. Any adverse change in these factors could have a significant impact on the recoverability of these assets and could have a material impact on our consolidated financial statements.
As it relates to goodwill and indefinite life intangible assets, we apply the impairment rules in accordance with FASB ASC Topic 350, “Intangibles—Goodwill and Other Options”. As required by FASB ASC Topic 350, the recoverability of these assets is subject to a fair value assessment, which includes judgments regarding financial projections, including forecasted cash flows and discount rates, and comparable market values. As it relates to finite life intangible assets, we apply the impairment rules as required by FASB ASC Topic 360-10-15, “Impairment or Disposal of Long-Lived Assets” which also requires significant judgments related to the expected future cash flows attributable to the intangible asset. Key assumptions used in the impairment analysis include, but are not limited to, expected future cash flows, business plan projections, revenue growth rates, and the discount rate utilized for discounting such cash flows. The impact of modifying any of these assumptions can have a significant impact on the estimate of fair value and, thus, the estimated recoverability, or impairment, if any, of the asset.
As discussed in Note 5 to the consolidated financial statements in Item 8 of this report, the Company recorded impairment charges of $411.2 million and $0.2 million related to goodwill and an indefinite-lived tradename intangible, respectively, in connection with the reconsideration event at the end of the first quarter of fiscal 2011. The impairment was determined as part of the fair value assessment of these assets.
Indicators of impairment that were identified during the assessment were a significant decline in our stock price and market capitalization and a decline in our expected future cash flows. The Company’s market capitalization declined approximately 24% during the first quarter of fiscal 2011. In addition, the decline in expected future cash flows was related to the continued deteriorating economic conditions that we believe have resulted in decreased funding of education which, in turn, has caused schools to reduce spending levels. These reductions led to a 23.4% revenue decline in the first quarter of fiscal 2011 as compared to the first quarter of
39
fiscal 2010. During the second, third and fourth quarters of fiscal 2011, the Company reviewed both its current market capitalization and future cash flow projections and concluded no evidence of further impairment existed.
We tested goodwill for impairment by determining the fair value of the Company’s reporting units using a combined income (discounted cash flow) and market approach (guideline public company comparables) valuation model. The details regarding the determination of the fair value of the reporting units, including the key assumptions used in the impairment analysis, are discussed in Item 8, Note 5 of this report. The impact of modifying any of these assumptions can have a significant impact on the estimate of fair value and, thus, the estimated recoverability, or impairment, if any, of the asset. Changes in estimates or the application of alternative assumptions could have produced significantly different results.
During the first quarter fiscal 2011 impairment analysis, the Company determined that its Education Resources, Science and Planning and Student Development reporting units had goodwill balances that were impaired. The fair value assessment of the two remaining reporting units with goodwill balances, Califone and Reading, indicated that the goodwill balances of these two reporting units were not impaired as the fair value exceeded the carrying value of the units. Since the modification of assumptions used in the valuation model can have a significant impact on the fair value, the Company performed a sensitivity analysis for the Califone and Reading reporting units. This analysis was completed assuming a 100 basis point increase in the discount rate and a 100 basis point decrease in the terminal growth rate. The Company believes these assumptions have the most sensitivity in the valuation model. The results of this sensitivity analysis are as follows:
| Decrease in FV of | ||||||||
| Reading | Califone | |||||||
| 100 basis point increase in discount rate |
$ | (9,258 | ) | $ | (2,294 | ) | ||
| 100 basis point decrease in terminal growth rate |
$ | (4,121 | ) | $ | (1,215 | ) | ||
Because the valuation of the Reading and Califone reporting units concluded the fair value exceeded carrying value by $52,154 and $5,769, respectively, the decreases in fair value for the sensitivity analysis would not have impaired the goodwill assessment of these two reporting units.
| Item 7A. | Quantitative and Qualitative Disclosures About Market Risk |
Our financial instruments include cash and cash equivalents, accounts receivable, accounts payable, accrued liabilities and debt. Market risks relating to our operations result primarily from changes in interest rates. Our borrowings under our credit facility are primarily dependent upon LIBOR rates. Assuming no change in our financial structure, if variable interest rates were to have averaged 100 basis points higher during fiscal 2011 and fiscal 2010, pre-tax earnings would have decreased by approximately $3.4 million and $4.0 million respectively. This amount was determined by considering a hypothetical 100 basis point increase in interest rates on average variable-rate debt outstanding. The estimated fair value of long-term debt approximated its carrying value at April 30, 2011 and April 24, 2010, with the exception of our convertible debt, which at April 30, 2011 had a carrying value of $200.0 million and a fair market value of $206.4 million, and at April 24, 2010 had a carrying value of $333.0 million and a fair market value of $324.7 million.
40
| Item 8. | Financial Statements and Supplementary Data |
REPORT OF INDEPENDENT REGISTERED PUBLIC ACCOUNTING FIRM
To the Board of Directors and Shareholders of
School Specialty, Inc.
Greenville, Wisconsin
We have audited the accompanying consolidated balance sheets of School Specialty, Inc. and subsidiaries (the “Company”) as of April 30, 2011 and April 24, 2010, and the related consolidated statements of operations, shareholders’ equity, and cash flows for each of the three fiscal years in the period ended April 30, 2011. Our audits also included the consolidated financial statement schedule listed in the Index at Item 15(a)(2). We also have audited the Company’s internal control over financial reporting as of April 30, 2011, based on criteria established in Internal Control—Integrated Framework issued by the Committee of Sponsoring Organizations of the Treadway Commission. The Company’s management is responsible for these consolidated financial statements and consolidated financial statement schedule, for maintaining effective internal control over financial reporting, and for its assessment of the effectiveness of internal control over financial reporting, included in the accompanying Management’s Report on Internal Control Over Financial Reporting. Our responsibility is to express an opinion on these consolidated financial statements and consolidated financial statement schedule and an opinion on the Company’s internal control over financial reporting based on our audits.
We conducted our audits in accordance with the standards of the Public Company Accounting Oversight Board (United States). Those standards require that we plan and perform the audit to obtain reasonable assurance about whether the consolidated financial statements are free of material misstatement and whether effective internal control over financial reporting was maintained in all material respects. Our audits of the consolidated financial statements included examining, on a test basis, evidence supporting the amounts and disclosures in the consolidated financial statements, assessing the accounting principles used and significant estimates made by management, and evaluating the overall consolidated financial statement presentation. Our audit of internal control over financial reporting included obtaining an understanding of internal control over financial reporting, assessing the risk that a material weakness exists, testing and evaluating the design and operating effectiveness of internal control based on the assessed risk. Our audits also included performing such other procedures as we considered necessary in the circumstances. We believe that our audits provide a reasonable basis for our opinions.
A company’s internal control over financial reporting is a process designed by, or under the supervision of, the company’s principal executive and principal financial officers, or persons performing similar functions, and effected by the company’s board of directors, management, and other personnel to provide reasonable assurance regarding the reliability of financial reporting and the preparation of financial statements for external purposes in accordance with generally accepted accounting principles. A company’s internal control over financial reporting includes those policies and procedures that (1) pertain to the maintenance of records that, in reasonable detail, accurately and fairly reflect the transactions and dispositions of the assets of the company; (2) provide reasonable assurance that transactions are recorded as necessary to permit preparation of financial statements in accordance with generally accepted accounting principles and that receipts and expenditures of the company are being made only in accordance with authorizations of management and directors of the company; and (3) provide reasonable assurance regarding prevention or timely detection of unauthorized acquisition, use, or disposition of the company’s assets that could have a material effect on the financial statements.
Because of the inherent limitations of internal control over financial reporting, including the possibility of collusion or improper management override of controls, material misstatements due to error or fraud may not be prevented or detected on a timely basis. Also, projections of any evaluation of the effectiveness of the internal control over financial reporting to future periods are subject to the risk that the controls may become inadequate because of changes in conditions, or that the degree of compliance with the policies or procedures may deteriorate.
41
In our opinion, the consolidated financial statements referred to above present fairly, in all material respects, the financial position of School Specialty, Inc. and subsidiaries as of April 30, 2011 and April 24, 2010, and the results of their operations and their cash flows for each of the three fiscal years in the period ended April 30, 2011, in conformity with accounting principles generally accepted in the United States of America. Also, in our opinion, such consolidated financial statement schedule, when considered in relation to the basic consolidated financial statements taken as a whole, presents fairly, in all material respects, the information set forth therein. Also, in our opinion, the Company maintained, in all material respects, effective internal control over financial reporting as of April 30, 2011, based on the criteria established in Internal Control—Integrated Framework issued by the Committee of Sponsoring Organizations of the Treadway Commission.
/s/ DELOITTE & TOUCHE LLP
Milwaukee, Wisconsin
July 1, 2011
42
FINANCIAL STATEMENTS
SCHOOL SPECIALTY, INC.
CONSOLIDATED BALANCE SHEETS
(In Thousands, Except Share Data)
| April 30, 2011 |
April 24, 2010 |
|||||||
| ASSETS |
||||||||
| Current assets: |
||||||||
| Cash and cash equivalents |
$ | 9,821 | $ | 21,035 | ||||
| Accounts receivable, less allowance for doubtful accounts of $1,951 and $2,104, respectively |
67,442 | 72,734 | ||||||
| Inventories, net |
111,266 | 99,910 | ||||||
| Deferred catalog costs |
16,639 | 13,593 | ||||||
| Prepaid expenses and other current assets |
14,516 | 14,318 | ||||||
| Refundable income taxes |
— | 1,539 | ||||||
| Deferred taxes |
— | 9,867 | ||||||
| Total current assets |
219,684 | 232,996 | ||||||
| Property, plant and equipment, net |
65,571 | 66,607 | ||||||
| Goodwill |
129,390 | 540,248 | ||||||
| Intangible assets, net |
155,889 | 166,552 | ||||||
| Development costs and other, net |
36,383 | 33,118 | ||||||
| Deferred taxes long-term |
10,227 | — | ||||||
| Investment in unconsolidated affiliate |
20,400 | 28,299 | ||||||
| Total assets |
$ | 637,544 | $ | 1,067,820 | ||||
| LIABILITIES AND SHAREHOLDERS’ EQUITY |
||||||||
| Current liabilities: |
||||||||
| Current maturities of long-term debt |
$ | 98,243 | $ | 132,397 | ||||
| Accounts payable |
85,639 | 47,954 | ||||||
| Accrued compensation |
7,972 | 7,501 | ||||||
| Accrued income taxes |
11,855 | — | ||||||
| Deferred taxes |
4,454 | — | ||||||
| Deferred revenue |
3,600 | 4,312 | ||||||
| Other accrued liabilities |
25,428 | 30,905 | ||||||
| Total current liabilities |
237,191 | 223,069 | ||||||
| Long-term debt less current maturities |
198,036 | 199,742 | ||||||
| Deferred taxes |
— | 92,398 | ||||||
| Other liabilities |
688 | 1,423 | ||||||
| Total liabilities |
435,915 | 516,632 | ||||||
| Commitments and contingencies |
||||||||
| Shareholders’ equity: |
||||||||
| Preferred stock, $0.001 par value per share, 1,000,000 shares authorized; none outstanding |
— | — | ||||||
| Common stock, $0.001 par value per share, 150,000,000 shares authorized; 24,290,345 and 24,280,097 shares issued, respectively |
24 | 24 | ||||||
| Capital paid-in excess of par value |
441,335 | 436,959 | ||||||
| Treasury stock, at cost—5,420,210 and 5,420,210 shares, respectively |
(186,637 | ) | (186,637 | ) | ||||
| Accumulated other comprehensive income |
26,390 | 24,052 | ||||||
| (Accumulated deficit)/Retained earnings |
(79,483 | ) | 276,790 | |||||
| Total shareholders’ equity |
201,629 | 551,188 | ||||||
| Total liabilities and shareholders’ equity |
$ | 637,544 | $ | 1,067,820 | ||||
See accompanying notes to consolidated financial statements.
43
SCHOOL SPECIALTY, INC.
CONSOLIDATED STATEMENTS OF OPERATIONS
(In Thousands, Except Per Share Amounts)
| For the Fiscal Year Ended | ||||||||||||
| April 30, 2011 |
April 24, 2010 |
April 25, 2009 |
||||||||||
| Revenues |
$ | 762,078 | $ | 896,678 | $ | 1,046,980 | ||||||
| Cost of revenues |
454,557 | 517,530 | 618,377 | |||||||||
| Gross profit |
307,521 | 379,148 | 428,603 | |||||||||
| Selling, general and administrative expenses |
287,560 | 304,451 | 350,919 | |||||||||
| Impairment Charge |
411,390 | — | — | |||||||||
| Operating income |
(391,429 | ) | 74,697 | 77,684 | ||||||||
| Other (income) expense: |
||||||||||||
| Interest expense |
28,157 | 30,532 | 30,238 | |||||||||
| Interest income |
— | (66 | ) | (333 | ) | |||||||
| Other |
— | — | 2,679 | |||||||||
| Impairment of equity-method investment |
6,861 | — | — | |||||||||
| Expense associated with convertible debt exchange |
1,920 | — | — | |||||||||
| (Loss) income before provision for income taxes |
(428,367 | ) | 44,231 | 45,100 | ||||||||
| (Benefit from) provision for income taxes |
(73,132 | ) | 17,678 | 17,972 | ||||||||
| (Loss) income before (losses) income from investment in unconsolidated affiliate |
(355,235 | ) | 26,553 | 27,128 | ||||||||
| Losses of unconsolidated affiliate |
(1,038 | ) | (701 | ) | — | |||||||
| Net (loss) income |
$ | (356,273 | ) | $ | 25,852 | $ | 27,128 | |||||
| Weighted average shares outstanding: |
||||||||||||
| Basic |
18,870 | 18,843 | 18,802 | |||||||||
| Diluted |
18,870 | 18,874 | 18,895 | |||||||||
| Basic (loss) earnings per share of common stock: |
(18.88 | ) | 1.37 | 1.44 | ||||||||
| Diluted (loss) earnings per share of common stock: |
(18.88 | ) | 1.37 | 1.44 | ||||||||
See accompanying notes to condensed consolidated financial statements.
44
SCHOOL SPECIALTY, INC.
CONSOLIDATED STATEMENTS OF SHAREHOLDERS’ EQUITY
FOR THE FISCAL YEARS ENDED APRIL 30, 2011, APRIL 24, 2010 and APRIL 25, 2009
(In Thousands)
| Common Stock | Capital Paid-in Excess of Par Value |
Treasury Stock, at Cost |
Accumulated Other Comprehensive Income |
(Accumulated Deficit) / Retained Earnings |
Total Shareholders’ Equity |
Total Comprehensive Income (Loss) |
||||||||||||||||||||||||||
| Shares | Dollars | |||||||||||||||||||||||||||||||
| Balance at April 26, 2008 |
23,631 | 24 | 421,895 | (171,387 | ) | 25,158 | 223,810 | 499,500 | ||||||||||||||||||||||||
| Issuance of common stock in conjunction with stock option exercises |
612 | — | 3,195 | 3,195 | ||||||||||||||||||||||||||||
| Tax benefit on option exercises |
5,572 | 5,572 | ||||||||||||||||||||||||||||||
| Share-based compensation expense |
4,488 | 4,488 | ||||||||||||||||||||||||||||||
| Treasury stock purchases |
(15,250 | ) | (15,250 | ) | ||||||||||||||||||||||||||||
| Foreign currency translation adjustment |
(14,354 | ) | (14,354 | ) | (14,354 | ) | ||||||||||||||||||||||||||
| Net income |
27,128 | 27,128 | 27,128 | |||||||||||||||||||||||||||||
| Total comprehensive income |
12,774 | |||||||||||||||||||||||||||||||
| Balance at April 25, 2009 |
24,243 | 24 | 435,150 | (186,637 | ) | 10,804 | 250,938 | 510,279 | ||||||||||||||||||||||||
| Issuance of common stock in conjunction with stock option exercises, net |
37 | — | 117 | 117 | ||||||||||||||||||||||||||||
| Tax deficiency on option exercises |
(756 | ) | (756 | ) | ||||||||||||||||||||||||||||
| Share-based compensation expense |
2,448 | 2,448 | ||||||||||||||||||||||||||||||
| Foreign currency translation adjustment |
13,248 | 13,248 | 13,248 | |||||||||||||||||||||||||||||
| Net income |
25,852 | 25,852 | 25,852 | |||||||||||||||||||||||||||||
| Total comprehensive income |
39,100 | |||||||||||||||||||||||||||||||
| Balance at April 24, 2010 |
24,280 | 24 | 436,959 | (186,637 | ) | 24,052 | 276,790 | 551,188 | ||||||||||||||||||||||||
| Issuance of common stock in conjunction with stock option exercises, net |
10 | — | — | — | ||||||||||||||||||||||||||||
| Exchange of convertible debt |
3,387 | 3,387 | ||||||||||||||||||||||||||||||
| Issuance of convertible debt |
(1,302 | ) | (1,302 | ) | ||||||||||||||||||||||||||||
| Tax deficiency on option exercises |
(555 | ) | (555 | ) | ||||||||||||||||||||||||||||
| Share-based compensation expense |
2,846 | 2,846 | ||||||||||||||||||||||||||||||
| Foreign currency translation adjustment |
2,338 | 2,338 | 2,338 | |||||||||||||||||||||||||||||
| Net loss |
(356,273 | ) | (356,273 | ) | (356,273 | ) | ||||||||||||||||||||||||||
| Total comprehensive loss |
(353,935 | ) | ||||||||||||||||||||||||||||||
| Balance at April 30, 2011 |
24,290 | 24 | 441,335 | (186,637 | ) | 26,390 | (79,483 | ) | 201,629 | |||||||||||||||||||||||
See accompanying notes to consolidated financial statements.
45
SCHOOL SPECIALTY, INC.
CONSOLIDATED STATEMENTS OF CASH FLOWS
(In Thousands)
| For the Fiscal Year Ended | ||||||||||||
| April 30, 2011 |
April 24, 2010 |
April 25, 2009 |
||||||||||
| Cash flows from operating activities: |
||||||||||||
| Net income (loss) |
$ | (356,273 | ) | $ | 25,852 | $ | 27,128 | |||||
| Adjustments to reconcile net income to net cash provided by operating activities: |
||||||||||||
| Depreciation and intangible asset amortization expense |
27,832 | 26,847 | 24,315 | |||||||||
| Amortization of development costs |
5,334 | 5,067 | 6,401 | |||||||||
| Loss from unconsolidated affiliate |
1,038 | 701 | — | |||||||||
| Amortization of debt fees and other |
2,162 | 2,420 | 1,394 | |||||||||
| Share-based compensation expense |
2,846 | 2,448 | 4,488 | |||||||||
| Impairment of goodwill and intangible assets |
411,390 | — | — | |||||||||
| Impairment of equity-method investment |
6,861 | — | — | |||||||||
| Expense associated with convertible debt exchange |
1,920 | — | — | |||||||||
| Deferred taxes |
(89,392 | ) | 5,981 | 6,011 | ||||||||
| Loss on disposal of property, equipment and other |
— | 652 | 490 | |||||||||
| Non-cash convertible debt interest expense |
9,999 | 13,062 | 12,033 | |||||||||
| Changes in current assets and liabilities (net of assets acquired and liabilities assumed in business combinations): |
||||||||||||
| Change in amounts sold under receivables securitization, net |
— | — | (50,000 | ) | ||||||||
| Accounts receivable |
5,783 | 29,008 | 21,867 | |||||||||
| Inventories |
(11,297 | ) | 13,586 | 22,313 | ||||||||
| Deferred catalog costs |
(3,046 | ) | 1,944 | (692 | ) | |||||||
| Prepaid expenses and other current assets |
1,347 | 1,417 | 10,860 | |||||||||
| Accounts payable |
38,430 | (9,267 | ) | (8,484 | ) | |||||||
| Accrued liabilities |
5,076 | (7,659 | ) | (6,910 | ) | |||||||
| Net cash provided by operating activities |
60,010 | 112,059 | 71,214 | |||||||||
| Cash flows from investing activities: |
||||||||||||
| Cash paid for acquisitions, net of cash acquired |
(360 | ) | (11,700 | ) | — | |||||||
| Additions to property, plant and equipment |
(15,789 | ) | (13,832 | ) | (11,622 | ) | ||||||
| Proceeds from note receivable |
— | 700 | 2,485 | |||||||||
| Acquisition of intangible and other assets |
— | (1,800 | ) | — | ||||||||
| Investment in product development costs |
(9,052 | ) | (10,035 | ) | (8,523 | ) | ||||||
| Proceeds from disposal of property, plant and equipment |
— | 2,083 | 186 | |||||||||
| Investment in unconsolidated affiliate |
— | (2,226 | ) | — | ||||||||
| Net cash used in investing activities |
(25,201 | ) | (36,810 | ) | (17,474 | ) | ||||||
| Cash flows from financing activities: |
||||||||||||
| Proceeds from bank borrowings |
810,600 | 304,400 | 680,000 | |||||||||
| Repayment of debt and capital leases |
(720,068 | ) | (356,979 | ) | (725,890 | ) | ||||||
| Redemption of convertible debt |
(133,000 | ) | — | — | ||||||||
| Purchase of treasury stock |
— | — | (15,250 | ) | ||||||||
| Payment of debt fees and other |
(3,555 | ) | (3,623 | ) | 603 | |||||||
| Proceeds from exercise of stock options |
— | 117 | 3,195 | |||||||||
| Excess income tax benefit from exercise of stock options |
— | — | 1,439 | |||||||||
| Net cash used in financing activities |
(46,023 | ) | (56,085 | ) | (55,903 | ) | ||||||
| Net increase (decrease) in cash and cash equivalents |
(11,214 | ) | 19,164 | (2,163 | ) | |||||||
| Cash and cash equivalents, beginning of period |
21,035 | 1,871 | 4,034 | |||||||||
| Cash and cash equivalents, end of period |
$ | 9,821 | $ | 21,035 | $ | 1,871 | ||||||
| Supplemental disclosures of cash flow information: |
||||||||||||
| Interest paid |
$ | 17,137 | $ | 14,639 | $ | 16,801 | ||||||
| Income taxes paid |
$ | 4,320 | $ | 11,681 | $ | 6,750 | ||||||
46
SCHOOL SPECIALTY, INC.
CONSOLIDATED STATEMENT OF CASH FLOWS—(Continued)
(In Thousands)
The Company paid cash in connection with certain business combinations accounted for under the purchase method in the fiscal years ended April 30, 2011 and April 24, 2010. There was no cash paid in connection with business combinations during the fiscal year ended April 25, 2009. The fair values of the assets and liabilities of the acquired companies are presented as follows:
| For the Fiscal Year Ended April 30, 2011 |
For the Fiscal Year Ended April 24, 2010 |
|||||||
| Accounts receivable |
$ | — | $ | 1,887 | ||||
| Inventories |
55 | 85 | ||||||
| Prepaid expenses and other current assets |
— | 103 | ||||||
| Property, plant and equipment |
20 | 137 | ||||||
| Goodwill |
— | 3,242 | ||||||
| Intangible assets |
285 | 7,530 | ||||||
| Accounts payable |
— | (275 | ) | |||||
| Accrued liabilities |
— | (393 | ) | |||||
| Other liabilities |
— | (616 | ) | |||||
| Net assets acquired |
$ | 360 | $ | 11,700 | ||||
See accompanying notes to consolidated financial statements.
47
SCHOOL SPECIALTY, INC.
NOTES TO CONSOLIDATED FINANCIAL STATEMENTS
FOR THE FISCAL YEARS ENDED APRIL 30, 2011, APRIL 24, 2010 AND APRIL 25, 2009
(In Thousands, Except Per Share Amounts)
NOTE 1—ORGANIZATION AND BASIS OF PRESENTATION
School Specialty, Inc. and subsidiaries (the “Company”) is an education company, serving the preK-12 market, with leading brands that provide educators with innovative and proprietary products, programs and services designed to help educators engage and inspire students of all ages and abilities, with operations primarily in the United States and Canada.
The accompanying consolidated financial statements and related notes to consolidated financial statements include the accounts of School Specialty, Inc., its subsidiaries and the companies acquired in business combinations from their respective dates of acquisition. All inter-company accounts and transactions have been eliminated.
As of the beginning of fiscal 2010, the Company adopted Financial Accounting Standards Board (“FASB”) Accounting Standard Codification (“ASC”) Topic 470-20, “Debt with Conversion and Other Options” (“FASB ASC Topic 470-20”). The adoption of FASB ASC Topic 470-20 required an adjustment of convertible debt, deferred taxes, equity, and interest expense and required the Company to retrospectively adjust the previously reported consolidated financial statements.
NOTE 2—SUMMARY OF SIGNIFICANT ACCOUNTING POLICIES
Use of Estimates
The preparation of financial statements in conformity with accounting principles generally accepted in the United States requires management to make estimates and assumptions that affect the reported amounts of assets and liabilities and the disclosure of contingent assets and liabilities at the date of the financial statements and the reported amounts of revenues and expenses during the reporting period. Actual results could differ from those estimates.
Definition of Fiscal Year
The Company’s fiscal year ends on the last Saturday in April in each year. As used in these consolidated financial statements and related notes to consolidated financial statements, “fiscal 2011,” “fiscal 2010” and “fiscal 2009” refer to the Company’s fiscal years ended April 30, 2011, April 24, 2010 and April 25, 2009, respectively. The year ended April 30, 2011 represents a 53 week year, while the years ended April 24, 2010 and April 25, 2009 represent 52 week years.
Cash and Cash Equivalents
The Company considers cash investments with original maturities of three months or less from the date of purchase to be cash equivalents.
Inventories
Inventories, which consist primarily of products held for sale, are stated at the lower of cost or market on a first-in, first-out basis in accordance with FASB ASC Topic 330, “Inventories”. Excess and obsolete inventory reserves recorded were $11,496 and $13,790 as of April 30, 2011 and April 24, 2010, respectively.
48
SCHOOL SPECIALTY, INC.
NOTES TO CONSOLIDATED FINANCIAL STATEMENTS—(Continued)
FOR THE FISCAL YEARS ENDED APRIL 30, 2011, APRIL 24, 2010 AND APRIL 25, 2009
(In Thousands, Except Per Share Amounts)
Property, Plant and Equipment
Property, plant and equipment are stated at cost. Additions and improvements are capitalized, whereas maintenance and repairs are expensed as incurred. Depreciation of property, plant and equipment is calculated using the straight-line method over the estimated useful lives of the respective assets. The estimated useful lives range from twenty-five to forty years for buildings and their components and three to fifteen years for furniture, fixtures and equipment. Property and equipment leased under sale-leaseback obligations and capital leases are amortized over the lesser of its useful life or its lease term.
Goodwill and Non-amortizable Intangible Assets
Goodwill represents the excess of cost over the fair value of net assets acquired in business combinations accounted for under the purchase method. Certain intangible assets including a perpetual license agreement and various trademarks and tradenames are estimated to have indefinite lives and are not subject to amortization. Under FASB ASC Topic 350, “Intangibles—Goodwill and Other,” goodwill and indefinite-lived intangible assets are not subject to amortization but rather must be tested for impairment annually or more frequently if events or circumstances indicate they might be impaired. The Company performs the annual impairment test during the first quarter of each fiscal year. Amortizable intangible assets include customer relationships, publishing rights, non-compete agreements, trademarks and tradenames, order backlog and copyrights and are being amortized over their estimated useful lives. As a result of a reconsideration event at the end of the first quarter of fiscal 2011, the Company recorded goodwill and indefinite-lived intangible impairment charges of $411,190 and $200, respectively in fiscal 2011. See note 5 for details of these impairment charges.
Impairment of Long-Lived Assets
As required by FASB ASC Topic 360-10-35 “Impairment or Disposal of Long-Lived Assets,” the Company reviews property, plant and equipment, definite-lived intangible assets and development costs for impairment if events or circumstances indicate an asset might be impaired. The Company assesses impairment based on undiscounted cash flows and records any impairment based on estimated fair value determined using discounted cash flows.
Development Costs
Development costs represent external and internal costs incurred in the development of a master copy of a book, workbook, video or other supplemental educational materials and products. The Company capitalizes development costs and amortizes these costs into costs of revenues over the lesser of five years or the product’s life cycle in amounts proportionate to expected revenues. At April 30, 2011 and April 24, 2010, net development costs totaled $28,281 and $24,489, respectively, and are included as a component of development costs and other assets, net, in the consolidated balance sheets.
Fair Value of Financial Instruments
In accordance with FASB ASC Topic 825, “Financial Instruments” and FASB ASC Topic 820, “Fair Value Measurements and Disclosures,” the carrying amounts of the Company’s financial instruments including cash and cash equivalents, accounts receivable, including retained interests in securitized receivables, accounts payable, and accrued liabilities approximate fair value given the short maturity of these instruments. The estimated fair value of the amounts outstanding under the credit facility approximated its carrying value at
49
SCHOOL SPECIALTY, INC.
NOTES TO CONSOLIDATED FINANCIAL STATEMENTS—(Continued)
FOR THE FISCAL YEARS ENDED APRIL 30, 2011, APRIL 24, 2010 AND APRIL 25, 2009
(In Thousands, Except Per Share Amounts)
April 30, 2011 given the variable interest rates included with this facility. The Company’s convertible debt had a carrying value of $200,000 and a fair market value of $206,416 at April 30, 2011, and a carrying value of $333,000 and a fair market value of $324,668 at April 24, 2010, as determined using the closing bid prices as reported on the National Association of Securities Dealers, Inc.’s Portal Market on April 30, 2011 and April 24, 2010, respectively. The Company’s sale-leaseback obligations had a carrying value of $13,559 and $14,325 and a fair market value of $14,827 and $15,792 at April 30, 2011 and April 24, 2010, respectively, as determined using estimated interest rates available at April 30, 2011 and April 24, 2010 for similar long-term borrowings.
U.S. GAAP defines fair value as the price that would be received for an asset or paid to transfer a liability (exit price) in an orderly transaction between market participants in the principal or most advantageous market for the asset or liability. U.S. GAAP also classifies the inputs used to measure fair value into the following hierarchy:
| Level 1: | Quoted prices in active markets for identical assets or liabilities. | |
| Level 2: | Quoted prices in active markets for similar assets or liabilities, quoted prices for identical or similar assets or liabilities in markets that are not active, or input other than quoted prices that are observable for the asset or liability. | |
| Level 3: | Unobservable inputs for the asset or liability. | |
Income Taxes
In accordance with FASB ASC Topic 740, “Income Taxes”, Income taxes have been computed utilizing the asset and liability approach which requires the recognition of deferred tax assets and liabilities for the tax consequences of temporary differences by applying enacted statutory tax rates applicable to future years to differences between the financial statement carrying amounts and the tax basis of existing assets and liabilities. Valuation allowances are provided when it is anticipated that some or all of a deferred tax asset is not likely to be realized.
Revenue Recognition
Revenue, net of estimated returns and allowances, is recognized upon the shipment of products or upon the completion of services provided to customers, which corresponds to the time when risk of ownership transfers, the selling price is fixed, the customer is obligated to pay, collectability is reasonably assured and the Company has no significant remaining obligations. Cash received in advance from customers is deferred on the balance sheet as a current liability and recognized upon the shipment of products or upon the completion of services provided to customers.
50
SCHOOL SPECIALTY, INC.
NOTES TO CONSOLIDATED FINANCIAL STATEMENTS—(Continued)
FOR THE FISCAL YEARS ENDED APRIL 30, 2011, APRIL 24, 2010 AND APRIL 25, 2009
(In Thousands, Except Per Share Amounts)
Concentration of Credit Risks
The Company grants credit to customers in the ordinary course of business. The majority of the Company’s customers are school districts and schools. Concentration of credit risk with respect to trade receivables is limited due to the significant number of customers and their geographic dispersion. During fiscal 2011, 2010 and 2009, no customer represented more than 10% of revenues or accounts receivable.
Vendor Rebates
The Company receives reimbursements from vendors (vendor rebates) based on annual purchased volume of products from its respective vendors. The Company’s vendor rebates are earned based on pre-determined percentage rebates on the purchased volume of products within a calendar year. The majority of the rebates are not based on minimum purchases or milestones, and therefore the Company recognizes the rebates on an accrual basis and reduces cost of revenues over the estimated period the related products are sold.
Deferred Catalog Costs
Deferred catalog costs represent costs which have been paid to produce Company catalogs, net of vendor cooperative advertising payments, which will be used in and benefit future periods. Deferred catalog costs are amortized in amounts proportionate to expected revenues over the life of the catalog, which is one year or less. Amortization expense related to deferred catalog costs is included in the consolidated statements of operations as a component of selling, general and administrative expenses. Such amortization expense for fiscal years 2011, 2010 and 2009 was $20,731, $24,424 and $27,045, respectively.
Restructuring
The Company accounts for restructuring costs associated with both the closure or disposal of distribution centers and severance related to headcount reductions in accordance with FASB ASC Topic 712, “Compensation—Retirement Benefits.” During fiscal 2011, the Company recorded $1,986 of severance expense. During fiscal 2010, the Company recorded $4,010 of severance expense, facility costs and lease terminations. During fiscal 2009, the Company recorded $3,912 of expenses primarily related to severance, facility costs and impairment of non-facility related fixed assets associated with the closing of the Company’s Lyons, New York distribution center. As of April 30, 2011, April 24, 2010 and April 25, 2009, there was $361, $1,526 and $1,445, respectively, of accrued restructuring costs recorded in other accrued liabilities on the consolidated balance sheet primarily related to various cost reduction activities.
Shipping and Handling Costs
In accordance with FASB ASC Topic 605-45-45, “Revenue Recognition—Principal Agent Considerations—Other Presentation,” the Company accounts for shipping and handling costs billed to customers as a component of revenues. The Company accounts for shipping and handling costs incurred as a cost of revenues for shipments made directly from vendors to customers. For shipments made from the Company’s warehouses, the Company accounts for shipping and handling costs incurred as a selling, general and administrative expense. The amount of shipping and handling costs included in selling, general and administrative expenses for fiscal years 2011, 2010 and 2009 was $33,635, $34,183 and $46,188, respectively.
51
SCHOOL SPECIALTY, INC.
NOTES TO CONSOLIDATED FINANCIAL STATEMENTS—(Continued)
FOR THE FISCAL YEARS ENDED APRIL 30, 2011, APRIL 24, 2010 AND APRIL 25, 2009
(In Thousands, Except Per Share Amounts)
Foreign Currency Translation
The financial statements of foreign subsidiaries have been translated into U.S. dollars in accordance with FASB ASC Topic 830, “Foreign Currency Matters.” All balance sheet accounts have been translated using the exchange rates in effect at the balance sheet date. Amounts in the statements of operations have been translated using the weighted average exchange rate for the year. Resulting translation adjustments are included in foreign currency translation adjustment within other comprehensive income.
Share-Based Compensation Expense
The Company accounts for its share-based compensation plans under the recognition and measurement principles of FASB ASC Topic 718, “Compensation—Stock Compensation” and FASB ASC Topic 505, “Equity-Based Payments to Non-Employees”. See Note 13.
NOTE 3—BUSINESS COMBINATIONS
Fiscal 2011
During the fourth quarter of fiscal 2011, the Company completed the acquisition of a portion of the operating assets of Telex, a division of Bosch Security Systems, Inc. for an aggregate purchase price of $360. The assets acquired relate to Telex’s distribution of headphones, earphones, headsets, and their replaceable cords used in the education marketplace. The earphone and headphone models subject to the acquisition are the Discovery, Odyssey, Explorer and 610 models. This business has been integrated into the Company’s Califone business unit within the Educational Resources segment. The results of this acquisition have been included in the accompanying condensed consolidated financial statements since the date of acquisition, would not have had a material effect on the Company’s overall performance on a pro forma basis, and did not have a material effect on the Company’s fiscal 2011 performance.
Fiscal 2010
During the second quarter of fiscal 2010, the Company completed the acquisition of AutoSkill International, Inc. (“AutoSkill”) for an aggregate purchase price of $11,700. This transaction was funded in cash through borrowings under the Company’s credit facility. AutoSkill is a leading education technology company that provides educators with reading and math intervention solutions for struggling students. This business has been integrated into the Company’s Educator’s Publishing Service business within the Accelerated Learning segment. Net assets acquired included $2,075 of current assets, $137 of fixed assets, $7,530 of amortizable intangible assets and $3,242 of goodwill, all of which are deductible for tax purposes. The results of AutoSkill have been included in the accompanying condensed consolidated financial statements since the date of acquisition, would not have had a material effect on the Company’s overall performance on a pro forma basis, and did not have a material effect on the Company’s fiscal 2010 performance.
52
SCHOOL SPECIALTY, INC.
NOTES TO CONSOLIDATED FINANCIAL STATEMENTS—(Continued)
FOR THE FISCAL YEARS ENDED APRIL 30, 2011, APRIL 24, 2010 AND APRIL 25, 2009
(In Thousands, Except Per Share Amounts)
NOTE 4—INVESTMENT IN UNCONSOLIDATED AFFILIATE
Investment in unconsolidated affiliate is accounted for under the equity method, and consisted of the following:
| Percent- Owned |
April 30, 2011 | April 24, 2010 | ||||||||||
| Carson-Dellosa Publishing, LLC |
35 | % | $ | 20,400 | $ | 28,299 | ||||||
On November 13, 2009, the Company completed the divestiture of the School Specialty Publishing business unit to Carson-Dellosa Publishing, LLC, a newly-formed business entity. Under the divestiture agreement, the Company combined its publishing unit net assets with those of Cookie Jar Education, Inc. and received a 35% interest, accounted for under the equity method, in Carson-Dellosa Publishing. The fair value of the Company’s total contribution was $29,438, including cash of $2,226, which was materially consistent with the book value of the Company net assets contributed. For the year-ended April 30, 2011, the Company recorded a pre-tax loss of $1,038 resulting from its 35% minority equity interest in Carson-Dellosa Publishing, LLC.
The Company reviews unaudited financial statements on a quarterly basis and audited financial statements on an annual basis for indicators of triggering events or circumstances that indicate a potential impairment. During the fourth quarter of fiscal 2011, the Company evaluated its investment in Carson-Dellosa for impairment and based on updated current forward-looking projections, and concluded it had an other-than-temporary impairment. As such, the Company recorded a $6.9 million impairment in other income (expense) in its Consolidated Statements of Operations. The resulting fair value of $20.4 million was estimated using a discounted cash flow model and is considered a Level 3 fair value measurement due to the use of significant unobservable inputs related to the timing and amount of future equity distributions based on projections of Carson-Dellosa’s future financing structure, contractual and market-based revenues and operating costs.
In performing the impairment assessment, the Company estimated the fair value of its reporting units using the Income Approach (discounted cash flow analysis). The discounted cash flow (“DCF”) valuation method requires an estimation of future cash flows of an entity and then discounting those cash flows to their present value using an appropriate discount rate. The discount rate selected should reflect the risks inherent in the projected cash flows. The key inputs and assumptions of the DCF method are the projected cash flows, the terminal value of the reporting unit and the discount rate. The growth rate used for the terminal value calculation was 5% and the discount rate was 13.9%.
The investment amount represents the Company’s maximum exposure to loss as a result of the Company’s ownership interest. Losses are reflected in “Losses of unconsolidated affiliate.”
53
SCHOOL SPECIALTY, INC.
NOTES TO CONSOLIDATED FINANCIAL STATEMENTS—(Continued)
FOR THE FISCAL YEARS ENDED APRIL 30, 2011, APRIL 24, 2010 AND APRIL 25, 2009
(In Thousands, Except Per Share Amounts)
NOTE 5—GOODWILL AND OTHER INTANGIBLE ASSETS
The following table presents details of the Company’s intangible assets, including the range of useful lives, excluding goodwill:
| April 30, 2011 |
Gross Value | Accumulated Amortization |
Net Book Value |
|||||||||
| Amortizable intangible assets: |
||||||||||||
| Customer relationships (10 to 17 years) |
$ | 36,998 | $ | (20,631 | ) | $ | 16,367 | |||||
| Publishing rights (15 to 25 years) |
113,260 | (28,797 | ) | 84,463 | ||||||||
| Non-compete agreements (3.5 to 10 years) |
7,110 | (6,471 | ) | 639 | ||||||||
| Tradenames and trademarks (5 to 30 years) |
3,504 | (1,041 | ) | 2,463 | ||||||||
| Order backlog and other (less than 1 to 13 years) |
2,634 | (1,807 | ) | 827 | ||||||||
| Perpetual license agreements (10 years) |
14,506 | (3,496 | ) | 11,010 | ||||||||
| Total amortizable intangible assets |
178,012 | (62,243 | ) | 115,769 | ||||||||
| Non-amortizable intangible assets: |
||||||||||||
| Tradenames and trademarks |
40,120 | — | 40,120 | |||||||||
| Total non-amortizable intangible assets |
40,120 | — | 40,120 | |||||||||
| Total intangible assets |
$ | 218,132 | $ | (62,243 | ) | $ | 155,889 | |||||
| April 24, 2010 |
Gross Value | Accumulated Amortization |
Net Book Value |
|||||||||
| Amortizable intangible assets: |
||||||||||||
| Customer relationships (10 to 17 years) |
$ | 36,568 | $ | (18,121 | ) | $ | 18,447 | |||||
| Publishing rights (15 to 25 years) |
113,260 | (23,211 | ) | 90,049 | ||||||||
| Non-compete agreements (3.5 to 10 years) |
7,110 | (5,877 | ) | 1,233 | ||||||||
| Tradenames and trademarks (5 to 30 years) |
3,504 | (850 | ) | 2,654 | ||||||||
| Order backlog and other (less than 1 to 13 years) |
2,634 | (1,576 | ) | 1,058 | ||||||||
| Perpetual license agreements (10 years) |
14,506 | (1,715 | ) | 12,791 | ||||||||
| Total amortizable intangible assets |
177,582 | (51,350 | ) | 126,232 | ||||||||
| Non-amortizable intangible assets: |
||||||||||||
| Tradenames and trademarks |
40,320 | — | 40,320 | |||||||||
| Total non-amortizable intangible assets |
40,320 | — | 40,320 | |||||||||
| Total intangible assets |
$ | 217,902 | $ | (51,350 | ) | $ | 166,552 | |||||
Intangible asset amortization expense included in selling, general and administrative expenses for fiscal years 2011, 2010 and 2009 was $10,814, $10,738 and $8,431, respectively.
Estimated intangible asset amortization expense for each of the five succeeding fiscal years is:
| 2012 |
$ | 10,534 | ||
| 2013 |
$ | 9,959 | ||
| 2014 |
$ | 9,665 | ||
| 2015 |
$ | 9,449 | ||
| 2016 |
$ | 9,258 |
54
SCHOOL SPECIALTY, INC.
NOTES TO CONSOLIDATED FINANCIAL STATEMENTS—(Continued)
FOR THE FISCAL YEARS ENDED APRIL 30, 2011, APRIL 24, 2010 AND APRIL 25, 2009
(In Thousands, Except Per Share Amounts)
The following information presents changes to goodwill during the two-year period ended April 30, 2011:
| Reporting Units | Educational Resources Segment |
Reporting Units | Accelerated Learning Segment |
Total | ||||||||||||||||||||||||||||||||||||
| (in $000’s) | Education Resources |
Califone | Science | Planning and Student Development |
Reading | Publishing | Health | |||||||||||||||||||||||||||||||||
| Balance at April 25, 2009 |
$ | 249,695 | $ | 14,852 | $ | 264,547 | $ | 75,652 | $ | 170,353 | $ | 14,232 | $ | 7,534 | $ | — | $ | 267,771 | $ | 532,318 | ||||||||||||||||||||
| Acquisitions |
— | — | — | — | — | 3,242 | — | — | $ | 3,242 | 3,242 | |||||||||||||||||||||||||||||
| Divestitures |
— | — | — | — | — | — | (7,534 | ) | — | $ | (7,534 | ) | (7,534 | ) | ||||||||||||||||||||||||||
| Currency translation adjustment |
— | — | — | — | 12,222 | — | — | — | $ | 12,222 | 12,222 | |||||||||||||||||||||||||||||
| Balance at April 24, 2010 |
$ | 249,695 | $ | 14,852 | $ | 264,547 | $ | 75,652 | $ | 182,575 | $ | 17,474 | $ | — | $ | — | $ | 275,701 | $ | 540,248 | ||||||||||||||||||||
| Currency translation adjustment |
— | — | — | — | 332 | — | — | — | $ | 332 | 332 | |||||||||||||||||||||||||||||
| Impairment losses |
(249,695 | ) | — | (249,695 | ) | (55,372 | ) | (106,123 | ) | — | — | — | $ | (161,495 | ) | (411,190 | ) | |||||||||||||||||||||||
| Balance at April 30, 2011 |
$ | — | $ | 14,852 | $ | 14,852 | $ | 20,280 | $ | 76,784 | $ | 17,474 | $ | — | $ | — | $ | 114,538 | $ | 129,390 | ||||||||||||||||||||
In accordance with the accounting guidance on goodwill and other intangible assets, the Company performs its impairment test of goodwill at the reporting unit level and indefinite-lived intangible assets at the unit of account level during the first quarter of each fiscal year, or more frequently if events or circumstances change that would more likely than not reduce the fair value of its reporting units below their carrying values. The following discussion relates to the goodwill and other intangible assets impairment test performed as a result of the reconsideration event at the end of the first quarter of fiscal 2011.
According to ASC Topic 350-20-20, a reporting unit is the level at which goodwill impairment is tested. A reporting unit can be an operating segment or one level below an operating segment, also known as a component. ASC Topic 350-20-35-34 states that a component of an operating segment is a reporting unit if the component constitutes a business for which discrete financial information is available for segment management to regularly review the operating results of that component. As of April 24, 2010, the Company had six reporting units, five of which had goodwill balances. The Educational Resources segment consists of the Education Resources and Califone reporting units. The Accelerated Learning segment consists of the Science, Planning and Student Development, Reading, and Health reporting units. The goodwill for each reporting unit is shown in the table above.
The accounting guidance requires a two-step method for determining goodwill impairment. In the first step, the Company determined the fair value of the reporting unit, generally by utilizing a combination of the income approach (weighted 90%) and the market approach (weighted 10%) derived from comparable public companies. The Company believes that each approach has its merits. However, in the instances where we have utilized both approaches, the Company has weighted the income approach more heavily than the market approach because the Company believes that management’s assumptions generally provide greater insight into the reporting unit’s fair value. This fair value determination was categorized as level 3 in the fair value hierarchy pursuant to FASB ASC Topic 820, “Fair Value Measurements and Disclosures”. The estimated fair value of the reporting units was dependent on several significant assumptions, including earnings projections and discount rates.
55
SCHOOL SPECIALTY, INC.
NOTES TO CONSOLIDATED FINANCIAL STATEMENTS—(Continued)
FOR THE FISCAL YEARS ENDED APRIL 30, 2011, APRIL 24, 2010 AND APRIL 25, 2009
(In Thousands, Except Per Share Amounts)
In performing the impairment assessment, the Company estimated the fair value of its reporting units using the following valuation methods and assumptions:
| 1. | Income Approach (discounted cash flow analysis)—the discounted cash flow (“DCF”) valuation method requires an estimation of future cash flows of an entity and then discounting those cash flows to their present value using an appropriate discount rate. The discount rate selected should reflect the risks inherent in the projected cash flows. The key inputs and assumptions of the DCF method are the projected cash flows, the terminal value of the reporting units and the discount rate. The growth rates used for the terminal value calculations and the discount rates of the respective reporting units were as follows: |
| Terminal Value Growth Rates |
Discount Rate |
|||||||
| Education Resources |
2.0 | % | 12.0 | % | ||||
| Califone |
2.0 | % | 11.5 | % | ||||
| Science |
6.0 | % | 14.5 | % | ||||
| Planning and Student Development |
3.0 | % | 11.9 | % | ||||
| Reading |
2.0 | % | 13.7 | % | ||||
| Health |
2.0 | % | 13.7 | % | ||||
| 2. | Market Approach (market multiples)—this method begins with the identification of a group of peer companies in the same or similar industries as the company reporting unit being valued. A valuation average multiple is then computed for the peer group based upon a valuation metric. The Company selected a ratio of enterprise value to projected earnings before interest, taxes, depreciation and amortization (“EBITDA”) and a ratio of enterprise value to projected revenue as appropriate valuation metrics. These two metrics were evenly weighted for the Education Resources, Reading, and Planning and Student Development reporting units. Various operating performance measurements of the reporting unit being valued are then benchmarked against the peer group and a discount rate or premium is applied to reflect favorable or unfavorable comparisons. The resulting multiple is then applied to the reporting unit being valued to arrive at an estimate of its fair value. A control premium is then applied to the equity value. The Company selected 11 companies that were deemed relevant to the Planning and Student Development and Reading reporting units and 10 companies that were deemed relevant to the Education Resources and Califone reporting units under the guideline public company method to provide an indication of value. A control premium was then applied to the enterprise value of the reporting unit. The control premium was established based on a review of transactions over an 18 month period. The resulting multiples and control premiums were as follows: |
| EBITDA Multiples |
Revenue Multiples |
Control Premium |
||||||||||
| Education Resources |
8.5x | 0.4x | 13.4 | % | ||||||||
| Califone |
6.5x | N/A | 13.4 | % | ||||||||
| Reading |
7.1x | 2.2x | 17.9 | % | ||||||||
| Planning and Student Development |
6.4x | 1.5x | 17.9 | % | ||||||||
The Company did not use the market approach for the Science reporting unit because of the variability in revenue due to the curriculum adoption schedule. The Company did not use the market approach for the Health reporting unit because of the reporting unit’s lack of financial history.
Based upon the assessment performed in the first quarter of fiscal 2011, the Education Resources, Science and Planning and Student Development reporting units failed step one of the goodwill impairment test, requiring a step two analysis with respect to those reporting units. In step two, the Company allocated the fair value of the
56
SCHOOL SPECIALTY, INC.
NOTES TO CONSOLIDATED FINANCIAL STATEMENTS—(Continued)
FOR THE FISCAL YEARS ENDED APRIL 30, 2011, APRIL 24, 2010 AND APRIL 25, 2009
(In Thousands, Except Per Share Amounts)
reporting units to all of the assets and liabilities of the reporting units, including any unrecognized intangible assets, in a hypothetical calculation to determine the implied fair value of the goodwill. The impairment charge, if any, is measured as the difference between the implied fair value of goodwill and its carrying value.
As a result of this analysis, $411,190 of goodwill was considered impaired during the first quarter of fiscal 2011. Assumptions utilized in the impairment analysis are subject to significant management judgment. Changes in estimates or the application of alternative assumptions could have produced significantly different results. As shown above in the table, the Education Resources reporting unit, which is part of the Educational Resources segment, and the Science and Planning and Student Development reporting units, which are part of the Accelerated Learning segment, were determined to have an impairment of their goodwill balance as of July 24, 2010.
The Company believed the first quarter was the appropriate quarter for conducting its assessment since the Company’s business is highly seasonal, with approximately 75% of its revenue and over 100% of its net income occurring in the first two quarters of the fiscal year. The Company has historically had much better insight into the projected annual performance during the first quarter due to the timing of school budgets and ordering by schools and school districts. The fiscal 2011 impairment charge was due in part to the continued deterioration of school spending amid the continuation of state budget challenges and school spending cuts. During the first quarter of fiscal 2011, the Company experienced a steeper than expected decline in actual revenue, 23.4%, and operating income, 44.6%, prior to the impact of the impairment charge. Additionally, the Company has experienced a decline in its market capitalization beginning in fiscal 2009 and which continued into the first quarter of fiscal 2011. As of April 24, 2010, the Company’s market capitalization was $463,538, compared to the Company’s book value of $551,188 on that date. As of the end of the first quarter ended July 24, 2010, the Company’s market capitalization had decreased by an additional $109,461 to $354,077. During the second, third and fourth quarters of fiscal 2011, the Company reviewed both its current market capitalization and future cash flow projections and concluded no evidence of further impairment existed.
The Company also performed an impairment test of its intangible assets during the first quarter of fiscal 2011, and concluded that a $200 impairment charge related to a non-amortizable trademark in the Educational Resources segment was necessary. During the second and third quarters of fiscal 2011, the Company concluded no evidence of further impairments existed. The following table presents a summary of the carrying value of indefinite-lived intangible assets:
| Educational Resources |
Accelerated Learning |
Total | ||||||||||
| Tradenames |
$ | — | $ | 38,890 | $ | 38,890 | ||||||
| Trademarks |
1,430 | — | 1,430 | |||||||||
| Impairment loss |
(200 | ) | — | (200 | ) | |||||||
| Balance at April 30, 2011: |
$ | 1,230 | $ | 38,890 | $ | 40,120 | ||||||
57
SCHOOL SPECIALTY, INC.
NOTES TO CONSOLIDATED FINANCIAL STATEMENTS—(Continued)
FOR THE FISCAL YEARS ENDED APRIL 30, 2011, APRIL 24, 2010 AND APRIL 25, 2009
(In Thousands, Except Per Share Amounts)
NOTE 6—PROPERTY, PLANT AND EQUIPMENT
Property, plant and equipment consist of the following:
| April 30, 2011 |
April 24, 2010 |
|||||||
| Land |
$ | 158 | $ | 158 | ||||
| Projects in progress |
10,326 | 2,787 | ||||||
| Buildings and leasehold improvements |
29,867 | 29,752 | ||||||
| Furniture, fixtures and other |
90,503 | 108,968 | ||||||
| Machinery and warehouse equipment |
39,463 | 39,397 | ||||||
| Total property, plant and equipment |
170,317 | 181,062 | ||||||
| Less: Accumulated depreciation |
(104,746 | ) | (114,455 | ) | ||||
| Net property, plant and equipment |
$ | 65,571 | $ | 66,607 | ||||
Depreciation expense related to continuing operations for fiscal years 2011, 2010 and 2009 was $17,018, $16,109 and $15,921, respectively.
NOTE 7—DEBT
Long-Term Debt
Long-term debt consists of the following:
| April 30, 2011 |
April 24, 2010 |
|||||||
| Credit Agreement, maturing in 2014 |
91,300 | — | ||||||
| 3.75% Convertible Subordinated Notes due 2023, issued 2003, net of unamortized discount |
— | 131,625 | ||||||
| 3.75% Convertible Subordinated Notes due 2026, issued 2006, net of unamortized discount |
97,347 | 186,183 | ||||||
| New 3.75% Convertible Subordinated Notes due 2026, issued 2011, net of unamortized discount |
94,074 | — | ||||||
| Sale-leaseback obligations, effective rate of 8.97%, expiring in 2020 |
13,558 | 14,325 | ||||||
| Capital lease obligations |
— | 6 | ||||||
| Total debt |
296,279 | 332,139 | ||||||
| Less: Current maturities |
(98,243 | ) | (132,397 | ) | ||||
| Total long-term debt |
$ | 198,036 | $ | 199,742 | ||||
Credit Agreement
On February 1, 2006, the Company entered into an Amended and Restated Credit Agreement. The Amended and Restated Credit Agreement has been terminated as the Company entered into a new Credit Agreement on April 23, 2010. The Amended and Restated Credit Agreement in place throughout fiscal 2010 provided for a $350,000 revolving loan and an available $100,000 incremental term loan. Interest accrued at a rate of, at the Company’s option, either a Eurodollar rate plus an applicable margin of up to 1.75%, or the lender’s base rate
58
SCHOOL SPECIALTY, INC.
NOTES TO CONSOLIDATED FINANCIAL STATEMENTS—(Continued)
FOR THE FISCAL YEARS ENDED APRIL 30, 2011, APRIL 24, 2010 AND APRIL 25, 2009
(In Thousands, Except Per Share Amounts)
plus an applicable margin of up to 0.50%. The Company also paid a commitment fee on the revolving loan of up to 0.375% on unborrowed funds. The Amended and Restated Credit Agreement was secured by substantially all of the assets of the Company and contained certain financial covenants, including a consolidated total and senior leverage ratio, a consolidated fixed charge coverage ratio and a limitation on consolidated capital expenditures. The Company was in compliance with these covenants at April 23, 2010, when the Amended and Restated Credit Agreement was terminated and the new Credit Agreement became effective. The effective interest rate under the Amended and Restated Credit Agreement for fiscal 2010 was 4.57%, which includes amortization of the loan origination fees of $750 and commitment fees on unborrowed funds of $684. The effective interest rate under the Amended and Restated Credit Agreement for fiscal 2009 was 4.90%, which includes amortization of the loan origination fees of $312 and commitment fees on unborrowed funds of $695. The revolving loan provided for a letter of credit sub-facility of up to $15,000, under which no amount was outstanding as of April 23, 2010. As of April 25, 2009, $51,900 was outstanding on the revolving loan and reflected as non-currently maturing, long-term debt in the accompanying balance sheets.
On April 23, 2010, the Company entered into a Credit Agreement which replaced the Company’s previous Amended and Restated Credit Agreement dated as of February 1, 2006. During the fourth quarter of fiscal 2011, the Company amended the Credit Agreement. The amended Credit Agreement matures on April 23, 2014 and provides borrowing capacity of $300,000. This capacity consists of a revolving loan of $175,000 and a delayed draw term loan of up to $125,000, which can be used to refinance a portion of the Company’s convertible notes. To the extent a lesser amount than $125,000 is used on the delay draw term loan, the Company can elect to increase the revolving portion of the facility by the difference. Interest accrues at a rate of, at the Company’s option, either a Eurodollar rate plus an applicable margin of up to 4.50%, or the lender’s base rate plus an applicable margin of up to 3.50%. The Company also pays a commitment fee on the revolving loan and delayed draw term loan of 0.50% on unborrowed funds. The effective interest rate under the credit facility for fiscal 2011 was 6.89%, which includes amortization of loan origination fees of $1,015 and commitment fees on unborrowed funds of $1,314. The revolving loan provides for a letter of credit sub-facility of up to $15,000, under which $2,695 was issued and outstanding as of April 30, 2011. As of April 30, 2011, the outstanding balance on the revolving loan of $91,300 was reflected as non-currently maturing, long-term debt in the accompanying consolidated balance sheets. The Credit Agreement is secured by substantially all of the assets of the Company and contains certain financial covenants, including a consolidated total and senior leverage ratio, a consolidated fixed charge coverage ratio and a limitation on consolidated capital expenditures. The Company was in compliance with these covenants at April 30, 2011.
The Company closely evaluates its expected ability to remain in compliance with the consolidated total leverage and interest coverage ratios due to the ratios’ sensitivity to the Company’s financial results. The recent economic trends impacting the Company’s performance, such as the decline in school funding which led to a decrease in the Company’s revenue and margins, have put pressure on the Company’s ability to remain in compliance with these ratios. Based on current forecasts reflected in the Company’s most recent guidance, the Company may be unable to maintain compliance with one or both of these financial covenants during fiscal 2012. The Company may need to work with its lenders to secure a waiver or amend such ratios in the near future. Any amendment or waiver would result in additional bank fees and more restrictive terms, and may increase the cost of any future borrowings.
Convertible Notes
FASB ASC Topic 470-20 requires the issuer of certain convertible debt instruments that may be settled in cash (or other assets) on conversion to separately account for the liability (debt) and equity (conversion option) components of the instrument in a manner that reflects the market interest rate at debt issuance without the conversion feature. The Company has three convertible debt instruments outstanding during portions of fiscal
2011 that are subject to FASB ASC Topic 470-20. The new standard requires that a fair value be assigned to the
59
SCHOOL SPECIALTY, INC.
NOTES TO CONSOLIDATED FINANCIAL STATEMENTS—(Continued)
FOR THE FISCAL YEARS ENDED APRIL 30, 2011, APRIL 24, 2010 AND APRIL 25, 2009
(In Thousands, Except Per Share Amounts)
equity conversion option of the Company’s $133,000, 3.75% convertible subordinated notes due 2023 (the “2003 Notes”), which were no longer outstanding as of the second quarter of fiscal 2011, the Company’s $100,000, 3.75% convertible subordinated debentures due 2026 (the “2006 Debentures”) and the Company’s new $100,000 3.75% convertible subordinated notes due 2026 (the “New Debentures”) (collectively, the “Convertibles Notes”) as of July 14, 2003, November 22, 2006 and March 1, 2011, respectively, the respective dates of issuance of the Convertible Notes. This change results in a corresponding decrease in the value assigned to the carrying value of the debt portion of the instruments.
The values assigned to the debt portions of the Convertible Notes were determined based on market interest rates for similar debt instruments without the conversion feature as of the respective July 14, 2003, November 22, 2006 and March 1, 2011 issuance dates of the Convertible Notes. The difference in market interest rates versus the coupon rates on the Convertible Notes results in non-cash interest that is amortized into interest expense over the expected terms of the Convertible Notes. For purposes of the valuation, the Company used an expected term of seven years for the Convertible Notes issued on July 14, 2003, an expected term of five years for the Convertible Notes issued on November 22, 2006 and an expected term of four years for the Convertible Notes issued March 1, 2011, which corresponds with the first anniversary date the holders of the respective Convertible Notes originally could put their Convertible Notes back to the Company.
The seven year anniversary occurred on July 30, 2010 for the 2003 Notes. All of the 2003 Notes were repaid during the second quarter of fiscal 2011 using proceeds from the Credit Agreement. The five year anniversary will occur on November 30, 2011 for the 2006 Debentures and the four year anniversary will occur on November 30, 2014 for the New Debentures.
During 2003, the Company sold an aggregate principal amount of $133,000 of convertible subordinated notes due in 2023. The Company used the total net proceeds from the offering of $128,999 to repay a portion of the debt outstanding under the Company’s credit facility. All of the notes were repaid during the second quarter of fiscal 2011 using proceeds from the Credit Agreement. The notes carried an annual coupon interest rate of 3.75% until August 1, 2010, at which time the notes provided that they would cease bearing interest and the original principal amount of each note would commence increasing daily by the annual rate of 3.75%. The notes became convertible into shares of the Company’s common stock at an initial conversion price of $40.00 per share during fiscal 2006 and were recorded as a current liability. Holders of the notes were entitled to surrender the notes for conversion at any time from October 1, 2005 until July 31, 2023. Holders that exercised their right to convert the notes would have received up to the accreted principal amount in cash, with the balance of the conversion obligation, if any, in shares of Company common stock or cash, at the Company’s discretion. No notes were converted into shares of common stock.
On November 22, 2006, the Company issued $200,000 of convertible subordinated debentures due 2026. The debentures are unsecured, subordinated obligations of the Company, pay interest at 3.75% per annum on each May 30th and November 30th, and are convertible upon satisfaction of certain conditions. In connection with any such conversion, the Company will deliver cash equal to the lesser of the aggregate principal amount of debentures to be converted or the Company’s total conversion obligation, and will deliver, at its option, cash or shares of its common stock in respect of the remainder, if any, of its conversion obligation. The initial conversion rate is .0194574 shares per $1 principal amount of debentures, which represents an initial conversion price of approximately $51.39 per share. The debentures are redeemable at the Company’s option on or after November 30, 2011. On November 30, 2011, 2016 and 2021 and upon the occurrence of certain circumstances, holders will have the right to require the Company to repurchase all or some of the debentures.
On March 1, 2011, the Company entered into separate, privately negotiated exchange agreements under which it retired $100 million in aggregate principal of the then outstanding 2006 Debentures in exchange for the issuance of $100 million in aggregate principal of the New Debentures. The New Debentures will pay interest semi-annually at a rate of 3.75% per year in respect of each $1,000 original principal amount of New Debentures
60
SCHOOL SPECIALTY, INC.
NOTES TO CONSOLIDATED FINANCIAL STATEMENTS—(Continued)
FOR THE FISCAL YEARS ENDED APRIL 30, 2011, APRIL 24, 2010 AND APRIL 25, 2009
(In Thousands, Except Per Share Amounts)
(the “Original Principal Amount”) on each May 30th and November 30th, and the principal will accrete on the principal amount of the New Debentures (including the Original Principal Amount) at a rate of 3.9755% per year, compounding on a semi-annual basis (such principal amount, including any accretions thereon, the “Accreted Principal Amount”). The New Debentures will be convertible, at the option of the Company, into cash or a combination of cash and shares of Company common stock, par value $.001 per share (“Company Common Stock”), upon satisfaction of certain conditions set forth below. The initial conversion rate is 44.2087 shares for each $1,000 of Original Principal Amount (subject to adjustment in certain events), which represents an initial conversion price of approximately $22.62 per share. However, the Company will not issue any shares of Company common stock pursuant to the New Debenture if, after giving affect to such issuance, the aggregate number of shares issued pursuant to the New Debentures would exceed 19.99% of the number of shares of Company Common Stock outstanding as of March 1, 2011, unless the Company first receives the approval of the Company’s shareholders, which the Company has no obligation to seek. The New Debentures will mature on November 30, 2026, unless earlier redeemed, repurchased or converted. Holders of the New Debentures have the option to require the Company to purchase the New Debentures outstanding on November 30, 2014, November 30, 2018 and November 30, 2022 at a price equal to 100% of the Accreted Principal Amount of the New Debentures delivered for repurchase plus any accrued and unpaid interest on the Original Principal Amount of the New Debentures delivered for repurchase. The Company has the right to redeem the New Debentures beginning May 30, 2014 at a price equal to 100% of the Accreted Principal Amount of the New Debentures to be redeemed plus any accrued but unpaid interest on the Original Principal Amount of the New Debentures redeemed.
The following table provides additional information about the Convertible Notes.
| As of April 30, 2011 | As of April 24, 2010 | |||||||||||||||
| ($ and shares in thousands, except conversion prices) |
New Debentures |
2006 Debentures |
2003 Notes | 2006 Debentures |
||||||||||||
| Carrying amount of the equity component |
$ | 6,774 | $ | 19,026 | $ | 29,854 | $ | 38,052 | ||||||||
| Principal amount of the liability component |
100,000 | 100,000 | 133,000 | 200,000 | ||||||||||||
| Unamortized discount of liability component |
21,826 | 2,653 | 1,375 | 13,817 | ||||||||||||
| Net carrying amount of liability component |
94,074 | 97,347 | 131,625 | 186,183 | ||||||||||||
| Remaining amortization period of discount |
43 months | 7 months | 3 months | 19 months | ||||||||||||
| Conversion price |
$ | 22.62 | $ | 51.39 | $ | 40.00 | $ | 51.39 | ||||||||
| Number of shares to be issued upon conversion |
4,421 | 1,946 | 3,325 | 3,892 | ||||||||||||
| Effective interest rate on liability component |
9.5 | % | 8.5 | % | 8.0 | % | 8.5 | % | ||||||||
The following table presents the associated interest cost related to the Convertible Notes, which consists of both the contractual interest coupon and amortization of the discount on the liability component.
| 2003 Notes | New Debentures | 2006 Debentures (b) | ||||||||||||||||||||||
| (in thousands) |
Year Ended April 30, 2011 |
Year Ended April 24, 2010 |
Year Ended April 30, 2011 |
Year Ended April 24, 2010 |
Year Ended April 30, 2011 |
Year Ended April 24, 2010 |
||||||||||||||||||
| Non-cash interest cost (a) |
$ | 1,375 | $ | 5,236 | $ | 846 | N/A | $ | 7,778 | $ | 7,826 | |||||||||||||
| Cash interest cost |
1,248 | 4,974 | 625 | N/A | 6,563 | 7,479 | ||||||||||||||||||
| (a) | Amounts represent the impact of adoption of FASB ASC Topic 470-20 on interest expense for the years ended April 24, 2010. |
| (b) | In the fourth quarter of fiscal 2011, the Company exchanged $100 million in aggregate principal amount of the outstanding $200 million 2006 Debentures for $100 million in aggregate principal amount of the New Debentures. |
61
SCHOOL SPECIALTY, INC.
NOTES TO CONSOLIDATED FINANCIAL STATEMENTS—(Continued)
FOR THE FISCAL YEARS ENDED APRIL 30, 2011, APRIL 24, 2010 AND APRIL 25, 2009
(In Thousands, Except Per Share Amounts)
The estimated fair value of the Company’s New Debentures and 2006 Debentures, each with an initial face value of $100,000, issued 2011 and 2006, respectively, at April 30, 2011 was approximately $106,166 and $100,250, respectively, and the carrying value was $94,074 and $97,347, respectively. The estimated fair value was determined using Level 2 inputs as described in FASB ASC Topic 825, “Financial Instruments.”
Sale-leaseback Obligations
The Company entered into two sale-leaseback transactions during fiscal 2001 which are accounted for as financings due to a technical default provision within the leases which could allow, under remote circumstances, for continuing ownership involvement by the Company in the two properties.
Maturities of Long-Term Debt
Maturities of long-term debt, including capital lease obligations, for subsequent fiscal years, are as follows:
| 2012 |
$ | 98,243 | ||
| 2013 |
979 | |||
| 2014 |
186,444 | |||
| 2015 |
1,171 | |||
| 2016 |
1,319 | |||
| Thereafter |
8,123 | |||
| Total maturities of long-term debt |
$ | 296,279 | ||
The amounts related to the convertible debt in fiscal 2011 and fiscal 2014 have been adjusted for FASB ASC Topic 470-20.
NOTE 8—SECURITIZATION OF ACCOUNTS RECEIVABLE
The Company and certain of its U.S. subsidiaries entered into an agreement (the “Receivables Facility”) in November 2000 with a financial institution whereby it sold on a continuous basis an undivided interest in all eligible trade accounts receivable. Pursuant to the Receivables Facility, the Company formed New School, Inc. (“NSI”), a wholly-owned, special purpose, bankruptcy-remote subsidiary. As such, the assets of NSI were available first and foremost to satisfy the claims of the creditors of NSI. NSI was formed for the sole purpose of buying and selling receivables generated by the Company and certain subsidiaries of the Company. NSI does not meet the conditions of a qualifying Special Purpose Entity and therefore the results of NSI have been included in the Company’s consolidated results for financial reporting purposes. Under the Receivables Facility, the Company and certain subsidiaries transferred without recourse all their accounts receivables to NSI. NSI, in turn, sold an undivided interest in these receivables. The Company received a fee from the financial institution for billing and collection functions, which remained the responsibility of the Company, which approximated the fair value of the Company’s obligations.
This two-step transaction was accounted for as a sale of receivables under the provision of FASB ASC Topic 860, “Transfers and Servicing.” The facility expired on January 28, 2009 and the Company elected to not renew the agreement due to the expected future expenses of the facility compared to other sources of liquidity available to the Company. Costs associated with the sale of receivables, primarily related to the discount and loss on sale, were $2,679 and are included in other expenses in the consolidated statement of operations for fiscal
62
SCHOOL SPECIALTY, INC.
NOTES TO CONSOLIDATED FINANCIAL STATEMENTS—(Continued)
FOR THE FISCAL YEARS ENDED APRIL 30, 2011, APRIL 24, 2010 AND APRIL 25, 2009
(In Thousands, Except Per Share Amounts)
years 2009. Supplemental information related to the accounts receivable securitization transactions is provided below. Proceeds under accounts receivable securitization and collections as servicer of receivables sold have been netted in the accompanying consolidated statements of cash flows under the caption, “Change in amounts sold under receivables securitization, net.”
| Fiscal 2009 | ||||
| Proceeds under accounts receivable securitization |
$ | 622,428 | ||
| Collections as servicer of receivables sold |
(672,428 | ) | ||
| Retained interest in accounts receivable at end of period |
$ | — | ||
| Cash flows from retained interests |
553,234 | |||
NOTE 9—INCOME TAXES
The provision for income taxes consists of:
| Fiscal 2011 | Fiscal 2010 | Fiscal 2009 | ||||||||||
| Current income tax expense from continuing operations: |
||||||||||||
| Federal |
$ | 15,740 | $ | 7,010 | $ | 6,765 | ||||||
| State |
654 | 2,565 | 2,351 | |||||||||
| Foreign |
(134 | ) | 2,122 | 2,845 | ||||||||
| Total |
16,260 | 11,697 | 11,961 | |||||||||
| Deferred income tax expense from continuing operations |
||||||||||||
| Federal |
(83,419 | ) | 5,600 | 6,499 | ||||||||
| State |
(5,960 | ) | 497 | (468 | ) | |||||||
| Foreign |
(13 | ) | (66 | ) | — | |||||||
| Total |
(89,392 | ) | 5,981 | 6,011 | ||||||||
| Total provision for income taxes |
$ | (73,132 | ) | $ | 17,678 | $ | 17,972 | |||||
Deferred taxes are comprised of the following:
| April 30, 2011 | April 24, 2010 | April 25, 2009 | ||||||||||
| Current deferred tax assets (liabilities): |
||||||||||||
| Inventory |
$ | 6,480 | $ | 8,240 | $ | 8,761 | ||||||
| Allowance for doubtful accounts |
737 | 799 | 1,655 | |||||||||
| Accrued liabilities |
(50 | ) | 828 | (611 | ) | |||||||
| Convertible debt instruments |
(12,596 | ) | — | — | ||||||||
| Net operating loss carryforward |
975 | — | — | |||||||||
| Total current deferred tax assets (liabilities) |
(4,454 | ) | 9,867 | 9,805 | ||||||||
| Long-term deferred tax assets (liabilities): |
||||||||||||
| Foreign Tax Credit Carryforward |
7,194 | — | — | |||||||||
| Net operating loss carryforward |
2,519 | 4,793 | 4,784 | |||||||||
| Property and equipment |
(11,002 | ) | (10,833 | ) | (11,070 | ) | ||||||
| Accrued liabilities |
10,327 | 12,473 | 14,125 | |||||||||
| Intangible assets |
(2,467 | ) | (64,536 | ) | (59,354 | ) | ||||||
| Investment in noncontrolling interest |
4,631 | 2,061 | — | |||||||||
| Convertible debt instruments |
(975 | ) | (36,356 | ) | (34,594 | ) | ||||||
| Total long-term deferred tax assets (liabilities) |
10,227 | (92,398 | ) | (86,109 | ) | |||||||
| Net deferred tax assets (liabilities) |
$ | 5,773 | $ | (82,531 | ) | $ | (76,304 | ) | ||||
63
SCHOOL SPECIALTY, INC.
NOTES TO CONSOLIDATED FINANCIAL STATEMENTS—(Continued)
FOR THE FISCAL YEARS ENDED APRIL 30, 2011, APRIL 24, 2010 AND APRIL 25, 2009
(In Thousands, Except Per Share Amounts)
At April 30, 2011, the Company has state net operating losses of approximately $70,387, which expire during fiscal years 2012 – 2030. The Company believes that the realization of the deferred tax assets is more likely than not, based on the expectation that the Company will generate the necessary taxable income in future periods and, accordingly, no valuation reserve has been provided. As of April 30, 2011, the Company has no unremitted earnings from foreign investments.
The Company’s effective income tax rate varied from the U.S. federal statutory tax rate as follows:
| Fiscal 2011 | Fiscal 2010 | Fiscal 2009 | ||||||||||
| U.S. federal statutory rate |
35.0 | % | 35.0 | % | 35.0 | % | ||||||
| State income taxes, net of federal income tax benefit |
1.3 | % | 4.8 | % | 2.9 | % | ||||||
| Foreign income tax |
0.1 | % | -0.2 | % | 1.5 | % | ||||||
| Share-based compensation |
0.0 | % | 0.0 | % | 0.2 | % | ||||||
| Meals and entertainment, inventory donations and other |
0.1 | % | 0.4 | % | 0.2 | % | ||||||
| Goodwill and intangible asset impairment |
-19.4 | % | 0.0 | % | 0.0 | % | ||||||
| Effective income tax rate |
17.1 | % | 40.0 | % | 39.8 | % | ||||||
The Company files income tax returns with the U.S., various U.S. states, and foreign jurisdictions. The most significant tax return the Company files is with the U.S. The Company’s tax returns are no longer subject to examination by the U.S. for fiscal years before 2007. The Company has various tax audits and appeals in process at any given time. It is not anticipated that any adjustments resulting from tax examinations or appeals would result in a material change to the Company’s financial position or results of operations.
As of April 30, 2011, April 24, 2010 and April 25, 2009, the Company’s liability for unrecognized income tax benefits, net of federal tax benefits, were $688, $1,423 and $1,406, respectively, all of which would impact the effective tax rate if recognized. The Company does not expect any material changes in the amount of unrecognized tax benefits within the next twelve months. The Company classifies accrued interest and penalties related to unrecognized tax benefits as income tax expense in the consolidated statements of operations. The amounts of accrued interest and penalties included in the liability for uncertain tax positions are not material.
64
SCHOOL SPECIALTY, INC.
NOTES TO CONSOLIDATED FINANCIAL STATEMENTS—(Continued)
FOR THE FISCAL YEARS ENDED APRIL 30, 2011, APRIL 24, 2010 AND APRIL 25, 2009
(In Thousands, Except Per Share Amounts)
The following table summarizes the activity related to the Company’s gross liability for unrecognized tax benefits:
| Balance at April 26, 2008.. |
$ | 1,662 | ||
| Increase related to current year tax provision |
320 | |||
| Expiration of that statute of limitations for tax assessments |
(57 | ) | ||
| Adjustments to provision related to assessments |
(519 | ) | ||
| Balance at April 25, 2009 |
$ | 1,406 | ||
| Increase related to current year tax provision |
(2 | ) | ||
| Expiration of that statute of limitations for tax assessments |
(2 | ) | ||
| Adjustments to provision related to assessments |
724 | |||
| Balance at April 24, 2010 |
$ | 2,126 | ||
| Increase related to current year tax provision |
— | |||
| Expiration of that statute of limitations for tax assessments |
17 | |||
| Adjustments to provision related to assessments |
(1,455 | ) | ||
| Balance at April 30, 2011 |
$ | 688 | ||
NOTE 10—OPERATING LEASE COMMITMENTS
The Company leases various types of warehouse and office facilities and equipment, under noncancelable lease agreements which expire at various dates. Future minimum lease payments under noncancelable operating leases for the Company’s fiscal years are as follows:
| 2012 |
7,432 | |||
| 2013 |
6,651 | |||
| 2014 |
5,415 | |||
| 2015 |
4,160 | |||
| 2016 |
3,962 | |||
| Thereafter |
18,622 | |||
| Total minimum lease payments |
$ | 46,242 | ||
Rent expense related to continuing operations for fiscal 2011, 2010 and 2009, was $9,453, $9,573 and $10,516, respectively.
NOTE 11—EMPLOYEE BENEFIT PLANS
The Company sponsors the School Specialty, Inc. 401(k) Plan (the “401(k) Plan”) which allows employee contributions in accordance with Section 401(k) of the Internal Revenue Code. The Company has the discretion to match a portion of employee contributions and virtually all full-time employees are eligible to participate in the 401(k) Plan after 90 days of service. In fiscal 2010, the Company amended its 401(k) plan agreement to make the match discretionary. In fiscal 2011 and 2010, the Company did not make any 401(k) match due to the current economic conditions. In fiscal 2009, the Company’s matching contribution expense was $1,927.
65
SCHOOL SPECIALTY, INC.
NOTES TO CONSOLIDATED FINANCIAL STATEMENTS—(Continued)
FOR THE FISCAL YEARS ENDED APRIL 30, 2011, APRIL 24, 2010 AND APRIL 25, 2009
(In Thousands, Except Per Share Amounts)
NOTE 12—SHAREHOLDERS’ EQUITY
Share Repurchase Programs
During fiscal 2011 and 2010, the Company did not repurchase any shares of its outstanding common stock. During fiscal 2009, the Company repurchased a total of 498 shares of its outstanding common stock at an aggregate purchase price of $15,250 under a Board of Director approved repurchase authorization. As of April 30, 2011, the Company was authorized to purchase shares of its common stock with an aggregate purchase price up to approximately $34,750 in connection with the share repurchase plan. Under the Credit Agreement entered into by the Company on April 23, 2010, as currently amended, there are various restrictions that would limit the aggregate fair market value of common stock the Company could repurchase to $5,000. However, certain consolidated leverage ratios must be satisfied in order to proceed with any repurchases.
During the four fiscal years ended April 30, 2011, the Company has repurchased a total of 5,420 shares of its issued and outstanding common stock at an aggregate purchase price of $186,637. Common stock acquired through the share repurchase programs is available for general corporate purposes and is reflected as Treasury Stock in the accompanying consolidated balance sheets.
Earnings Per Share (“EPS”)
Basic EPS excludes dilution and is computed by dividing income available to common shareholders by the weighted average number of common shares outstanding for the period. Diluted EPS reflects the potential dilution that could occur if securities to issue common stock were exercised or otherwise issued. The following information presents the Company’s computations of basic and diluted EPS for the periods presented in the consolidated statements of operations:
| Income (Numerator) |
Shares (Denominator) |
Per Share Amount |
||||||||||
| Fiscal 2011: |
||||||||||||
| Basic EPS |
$ | (356,273 | ) | 18,870 | $ | (18.88 | ) | |||||
| Effect of dilutive employee stock options |
— | |||||||||||
| Effect of dilutive non-vested stock units |
— | |||||||||||
| Diluted EPS |
$ | (356,273 | ) | 18,870 | $ | (18.88 | ) | |||||
| Fiscal 2010: |
||||||||||||
| Basic EPS |
$ | 25,852 | 18,843 | $ | 1.37 | |||||||
| Effect of dilutive employee stock options |
— | 16 | ||||||||||
| Effect of dilutive non-vested stock units |
— | 15 | ||||||||||
| Diluted EPS |
$ | 25,852 | 18,874 | $ | 1.37 | |||||||
| Fiscal 2009 (As Adjusted, See Note 7): |
||||||||||||
| Basic EPS |
$ | 27,128 | 18,802 | $ | 1.44 | |||||||
| Effect of dilutive employee stock options |
— | 67 | ||||||||||
| Effect of dilutive non-vested stock units |
— | 26 | ||||||||||
| Diluted EPS |
$ | 27,128 | 18,895 | $ | 1.44 | |||||||
66
SCHOOL SPECIALTY, INC.
NOTES TO CONSOLIDATED FINANCIAL STATEMENTS—(Continued)
FOR THE FISCAL YEARS ENDED APRIL 30, 2011, APRIL 24, 2010 AND APRIL 25, 2009
(In Thousands, Except Per Share Amounts)
The Company had additional employee stock options outstanding of 1,529, 1,514 and 1,518 during fiscal 2011, 2010 and 2009, respectively, which were not included in the computation of diluted EPS because they were anti-dilutive.
The $133,000, 3.75% convertible subordinated notes had no impact on the Company’s denominator for computing diluted EPS because, although the notes were convertible, the average market price of the Company’s stock during the periods presented was less than the initial conversion price per share. See Note 8.
The $100,000, 3.75% convertible subordinated debentures, 2006 Debentures, had no current impact on the Company’s denominator for computing diluted EPS because conditions under which the debentures may be converted have not been satisfied. See Note 8.
The new $100,000, 3.75% convertible subordinated debentures, New Debentures, had no current impact on the Company’s denominator for computing diluted EPS because conditions under which the debentures may be converted have not been satisfied. See Note 8.
NOTE 13—SHARE-BASED COMPENSATION EXPENSE
Employee Stock Plans
The Company has three share-based employee compensation plans under which awards were outstanding as of April 30, 2011: the School Specialty, Inc. 1998 Stock Incentive Plan (the “1998 Plan”), the School Specialty, Inc. 2002 Stock Incentive Plan (the “2002 Plan”), and the School Specialty, Inc. 2008 Equity Incentive Plan (the “2008 Plan”). All plans have been approved by the Company’s shareholders. The purpose of the 1998 Plan, the 2002 Plan and the 2008 Plan is to provide directors, officers, key employees and consultants with additional incentives by increasing their ownership interests in the Company. No new grants may be made under the 1998 Plan, which expired on June 8, 2008. Under the 2002 Plan, the maximum number of equity awards available for grant is 1,500 shares. Under the 2008 Plan, the maximum number of equity awards available for grant is 2,000 shares.
A summary of option transactions for fiscal 2009, fiscal 2010 and fiscal 2011 follows:
| Options Outstanding | Options Exercisable | |||||||||||||||
| Options | Weighted- Average Exercise Price |
Options | Weighted- Average Exercise Price |
|||||||||||||
| Balance at April 26, 2008 |
2,707 | $ | 26.69 | 1,980 | $ | 23.01 | ||||||||||
| Granted |
176 | 27.88 | ||||||||||||||
| Exercised |
(1,086 | ) | 16.56 | |||||||||||||
| Canceled |
(167 | ) | 33.46 | |||||||||||||
| Balance at April 25, 2009 |
1,630 | $ | 32.87 | 1,067 | $ | 32.29 | ||||||||||
| Granted |
313 | 20.30 | ||||||||||||||
| Exercised |
(122 | ) | 17.49 | |||||||||||||
| Canceled |
(356 | ) | 33.33 | |||||||||||||
| Balance at April 24, 2010 |
1,465 | $ | 31.35 | 957 | $ | 34.02 | ||||||||||
| Granted |
255 | 18.88 | ||||||||||||||
| Exercised |
(15 | ) | 16.06 | |||||||||||||
| Canceled |
(199 | ) | 32.10 | |||||||||||||
| Balance at April 30, 2011 |
1,506 | $ | 29.29 | 988 | $ | 33.61 | ||||||||||
67
SCHOOL SPECIALTY, INC.
NOTES TO CONSOLIDATED FINANCIAL STATEMENTS—(Continued)
FOR THE FISCAL YEARS ENDED APRIL 30, 2011, APRIL 24, 2010 AND APRIL 25, 2009
(In Thousands, Except Per Share Amounts)
The following tables detail supplemental information regarding stock options outstanding at April 30, 2011:
| Weighted Average Remaining Contractual Term |
Aggregate Intrinsic Value |
|||||||
| Options outstanding |
6.14 | $ | 10 | |||||
| Options vested and expected to vest |
6.09 | 9 | ||||||
| Options exercisable |
4.91 | — | ||||||
| Options Outstanding |
Options Exercisable | |||||||||
| Range of Exercise Prices |
Options |
Weighted- |
Weighted- Average |
Options |
Weighted- Average | |||||
| $13.41 – $24.10 |
617 | 7.42 | $20.14 | 169 | $21.99 | |||||
| $24.11 – $31.58 |
228 | 5.75 | 30.29 | 167 | 30.22 | |||||
| $31.59 – $36.82 |
328 | 4.58 | 36.14 | 319 | 36.14 | |||||
| $36.83 – $39.71 |
333 | 5.58 | 38.80 | 333 | 38.80 | |||||
| 1,506 | 6.14 | $29.29 | 988 | $33.61 | ||||||
Options are generally exercisable beginning one year from the date of grant in cumulative yearly amounts of twenty-five percent of the shares granted and generally expire ten years from the date of grant. Options granted to directors and non-employee officers of the Company vest over a three year period, twenty percent after the first year, fifty percent (cumulative) after the second year and one hundred percent (cumulative) after the third year. The Company’s option plans allow for the net settlement of the exercise price and related employee tax withholding liabilities for non-qualified stock option exercises. For fiscal 2011, approximately 3 new shares were issued upon the exercise of stock options, 12 shares were tendered to satisfy the exercise price, and zero shares were surrendered to satisfy employee tax liabilities.
During fiscal 2011 and 2010, the Company granted 77 and 78 non-vested stock unit (“NSU”) awards to certain members of the Company’s management under the amended and restated 2002 Plan. The NSUs are performance-based awards that vest at the end of a three-year cycle and will result in the issuance of shares of the Company’s common stock if performance goals are achieved at a threshold level or above. The NSUs will be settled in shares of Company common stock with actual shares awarded ranging from 80% to 200% of the target number of shares based on actual performance. The NSUs granted in fiscal 2011 and fiscal 2010 are subject to a one-year performance metric and three-year vesting period. Company performance was at 88% of the target for the fiscal 2010 awards and the associated expense related to the fiscal 2010 award has been adjusted to 88%, accordingly, and will be recognized over the vesting period which is three years of service from the date of grant. The vesting date for the fiscal 2010 NSU awards will occur on June 22, 2012. The approximate fair value of awards granted during fiscal 2011 and 2010 is $1,468 and $1,590, respectively, provided the performance goals are achieved at the target level. The Company is recognizing share-based compensation expense related to performance-based NSU awards on a straight-line basis over the vesting period adjusted for changes in the expected level of performance. During the fiscal year ended April 30, 2011, the Company recognized expense of $345 ($211 net of tax) related to the NSU awards. During the fiscal year ended April 24, 2010, the Company recognized income of $917 ($561 net of tax) related to the NSU awards. The income was the result of the Company not achieving the threshold level of the performance goals for the fiscal 2008 NSU awards.
During fiscal 2011 and 2010, the Company granted 10 and 7 time-based NSU awards to independent members of the Company’s Board of Directors with an approximate fair value of $194 and $146, respectively.
68
SCHOOL SPECIALTY, INC.
NOTES TO CONSOLIDATED FINANCIAL STATEMENTS—(Continued)
FOR THE FISCAL YEARS ENDED APRIL 30, 2011, APRIL 24, 2010 AND APRIL 25, 2009
(In Thousands, Except Per Share Amounts)
The awards vest one year from the date of grant and the Company is recognizing share-based compensation expense related to these awards on a straight-line basis over the vesting period. For the fiscal year ended April 30, 2011, 7 new shares were issued upon the vesting of the Board of Director NSUs granted in fiscal 2010. During the fiscal year ended April 30, 2011 and April 24, 2010, the Company recognized $186 ($114 net of tax) and $155 ($95 net of tax) of expense related to these awards, respectively.
During fiscal 2011, the Company awarded 118 time-based restricted stock units (“RSU”) to employees of the Company under the 2008 Plan. The RSUs awarded to senior management vest in cumulative increments of thirty percent after the third year from the date of grant, sixty percent after the fourth year and one-hundred percent after the fifth year. The RSUs awarded to other employees vest in cumulative increments of thirty percent after the second year from the date of grant, sixty percent after the third year and one-hundred percent after the fourth year. The approximate fair value of the awards granted during fiscal 2011 was $2,250. During the fiscal year ended April 30, 2011, the Company recognized $284 ($174 net of tax) of expense related to time-based RSU awards.
During the fiscal years ended April 30, 2011 and April 24, 2010, the Company recognized $2,846 ($2,031 related to stock options, $531 related to NSU awards, and $284 related to RSU awards) and $2,448 ($3,210 related to stock options, net of $762 of income related to NSU awards), respectively, in share-based compensation expense which is reflected in selling, general and administrative expenses in the accompanying consolidated statements of operations. The fiscal 2011 and fiscal 2010 income tax benefit recognized related to share-based compensation expense was $1,104 and $960, respectively. The Company recognizes share-based compensation expense ratably over the vesting period of each award along with cumulative adjustments for changes in the expected level of attainment for performance-based awards. As of April 30, 2011, total unrecognized share-based compensation expense related to stock options was $2,717, net of estimated forfeitures, total unrecognized share-based compensation expense related to NSUs was $721 and total unrecognized share-based compensation expense related to RSUs was $1,417, which the Company expects to recognize over a weighted average period of approximately two years.
The weighted average fair value of options granted during fiscal 2011, 2010 and 2009, was $6.72, $7.27 and $8.94, respectively. The fair value of options is estimated on the date of grant using the Black-Scholes single option pricing model with the following weighted average assumptions:
| Fiscal 2011 | Fiscal 2010 | Fiscal 2009 | ||||||||||
| Average-risk free interest rate |
2.00 | % | 2.89 | % | 3.25 | % | ||||||
| Expected volatility |
35.01 | % | 33.11 | % | 27.29 | % | ||||||
| Expected term |
5.5 years | 5.5 years | 5.5 years | |||||||||
| Fiscal 2011 | Fiscal 2010 | Fiscal 2009 | ||||||||||
| Total intrinsic value of stock options exercised |
$ | 61 | $ | 824 | $ | 15,372 | ||||||
| Cash received from stock option exercises |
— | 117 | 3,194 | |||||||||
| Income tax deficiency/benefit from the exercise of stock options |
(555 | ) | (756 | ) | 5,572 | |||||||
69
SCHOOL SPECIALTY, INC.
NOTES TO CONSOLIDATED FINANCIAL STATEMENTS—(Continued)
FOR THE FISCAL YEARS ENDED APRIL 30, 2011, APRIL 24, 2010 AND APRIL 25, 2009
(In Thousands, Except Per Share Amounts)
NOTE 14—SEGMENT INFORMATION
The Company determines its operating segments based on the information utilized by the chief operating decision maker, the Company’s Chief Executive Officer, to allocate resources and assess performance. Based on this information, the Company has determined that it operates in two operating segments, Educational Resources and Accelerated Learning, which also constitute its reportable segments. The Company operates principally in the United States, with limited operations in Canada. The Educational Resources segment offers products that include basic classroom supplies and office products, supplemental learning materials, physical education equipment, classroom technology, and furniture. The Accelerated Learning segment is a PreK-12 curriculum-based publisher of proprietary and non-proprietary products in the categories of science, reading and literacy, coordinated school health, and planning and student development. The accounting policies of the segments are the same as those described in Summary of Significant Accounting Policies. Intercompany eliminations represent intercompany sales primarily from our Accelerated Learning segment to our Educational Resources segment, and the resulting profit recognized on such intercompany sales.
While a significant majority of revenue and assets are derived from the Company’s U.S. operations, we had Canadian revenue of $32,325, $30,703, and $32,313 for fiscal years 2011, 2010, and 2009 respectively, and long-term assets of $28,460, $69,214, and $56,927 for fiscal years 2011, 2010, and 2009 respectively. These long-term assets are primarily Goodwill and Intangible Assets. The majority of the revenue is reflected in the Accelerated Learning segment and all of the assets are in the Accelerated Learning segment.
The following table presents segment information:
| Fiscal 2011 | Fiscal 2010 | Fiscal 2009 | ||||||||||
| Revenues: |
||||||||||||
| Educational Resources |
$ | 534,803 | $ | 641,048 | $ | 737,068 | ||||||
| Accelerated Learning Group |
226,607 | 256,157 | 310,203 | |||||||||
| Corporate and intercompany eliminations |
668 | (527 | ) | (291 | ) | |||||||
| Total |
$ | 762,078 | $ | 896,678 | $ | 1,046,980 | ||||||
| Operating (loss) income and income before taxes: |
||||||||||||
| Educational Resources (2) |
$ | (222,708 | ) | $ | 63,969 | $ | 62,747 | |||||
| Accelerated Learning Group (2) |
(130,666 | ) | 42,624 | 58,603 | ||||||||
| Corporate and intercompany eliminations |
(38,055 | ) | (31,896 | ) | (43,666 | ) | ||||||
| Operating (loss) income |
(391,429 | ) | 74,697 | 77,684 | ||||||||
| Interest expense and other |
36,938 | 30,466 | 32,584 | |||||||||
| (Loss) income before taxes |
$ | (428,367 | ) | $ | 44,231 | $ | 45,100 | |||||
| Identifiable assets: |
||||||||||||
| Educational Resources |
$ | 179,689 | $ | 422,236 | $ | 450,002 | ||||||
| Accelerated Learning Group |
355,561 | 517,571 | 535,622 | |||||||||
| Corporate assets (1) |
102,294 | 128,013 | 91,581 | |||||||||
| Total |
$ | 637,544 | $ | 1,067,820 | $ | 1,077,205 | ||||||
70
SCHOOL SPECIALTY, INC.
NOTES TO CONSOLIDATED FINANCIAL STATEMENTS—(Continued)
FOR THE FISCAL YEARS ENDED APRIL 30, 2011, APRIL 24, 2010 AND APRIL 25, 2009
(In Thousands, Except Per Share Amounts)
| Fiscal 2011 | Fiscal 2010 | Fiscal 2009 | ||||||||||
| Depreciation and amortization of intangible assets and development costs: |
||||||||||||
| Educational Resources |
$ | 7,257 | $ | 7,031 | $ | 6,733 | ||||||
| Accelerated Learning Group |
14,763 | 15,186 | 14,547 | |||||||||
| Corporate |
11,146 | 9,697 | 9,436 | |||||||||
| Total |
33,166 | 31,914 | 30,716 | |||||||||
| Expenditures for property, plant and equipment, intangible and other assets and development costs: |
||||||||||||
| Educational Resources |
$ | 1,338 | $ | 1,559 | $ | 1,942 | ||||||
| Accelerated Learning Group |
11,447 | 20,177 | 8,832 | |||||||||
| Corporate |
12,355 | 11,461 | 9,371 | |||||||||
| Total |
25,140 | 33,197 | 20,145 | |||||||||
| (1) | Identifiable corporate assets include distribution related assets of $26,930, $29,993 and $24,345, as of April 30, 2011, April 24, 2010 and April 25, 2009, respectively, for which depreciation is allocated to the Educational Resources segment. Depreciation expense allocated to Educational Resources segment was $2,513, $2,972 and $3,107 for fiscal 2011, fiscal 2010 and fiscal 2009, respectively. |
| (2) | In the first quarter of fiscal 2011, the Company recorded an impairment charge related to its goodwill and indefinite-lived intangible assets of $249,895 and $161,495 in its Educational Resources and Accelerated Learning Segments, respectively. |
NOTE 15—COMMITMENTS AND CONTINGENCIES
Various claims and proceedings arising in the normal course of business are pending against the Company. The results of these matters are not expected to have a material adverse effect on the Company’s consolidated financial position, results of operations or cash flows.
The Company determined, based on an ongoing state tax audit, that the Delta Education, LLC (“Delta”) subsidiary had a liability to the state that survived the Company’s acquisition of Delta in fiscal 2006. The Company has estimated the potential exposure for this liability, including interest and net of federal tax benefit, to be a range of $2,300 to $7,600, depending upon the resolution of certain outstanding issues related to the liability. The Company’s best estimate of this liability is $4,000. The final determination of the amount of the liability due is not expected to be finalized until fiscal 2011, or thereafter. The Company is continuing to negotiate with the state, and it may have claims against various third parties to recover some or all of the amount of the liability.
71
SCHOOL SPECIALTY, INC.
NOTES TO CONSOLIDATED FINANCIAL STATEMENTS—(Continued)
FOR THE FISCAL YEARS ENDED APRIL 30, 2011, APRIL 24, 2010 AND APRIL 25, 2009
(In Thousands, Except Per Share Amounts)
NOTE 16—QUARTERLY FINANCIAL DATA (UNAUDITED)
The following presents certain unaudited quarterly financial data for fiscal 2011 and fiscal 2010:
| Fiscal 2011 | ||||||||||||||||||||
| First | Second | Third | Fourth | Total | ||||||||||||||||
| Revenues |
$ | 252,984 | $ | 291,879 | $ | 89,859 | $ | 127,356 | $ | 762,078 | ||||||||||
| Gross profit |
108,072 | 117,522 | 32,949 | 48,978 | 307,521 | |||||||||||||||
| Operating income (loss) |
(381,166 | ) | 38,204 | (26,220 | ) | (22,247 | ) | (391,429 | ) | |||||||||||
| Earnings (loss) from continuing operations, net of income taxes |
(331,627 | ) | 18,235 | (19,200 | ) | (22,643 | ) | (355,235 | ) | |||||||||||
| Equity in earnings (losses) of unconsolidated affiliate, net of tax |
— | (135 | ) | (950 | ) | 47 | (1,038 | ) | ||||||||||||
| Net income (loss) |
(331,627 | ) | 18,100 | (20,150 | ) | (22,596 | ) | (356,273 | ) | |||||||||||
| Basic earnings per share of common stock: |
||||||||||||||||||||
| Earnings (loss) from continuing operations |
$ | (17.58 | ) | $ | 0.96 | $ | (1.07 | ) | $ | (1.20 | ) | $ | (18.88 | ) | ||||||
| Total |
$ | (17.58 | ) | $ | 0.96 | $ | (1.07 | ) | $ | (1.20 | ) | $ | (18.88 | ) | ||||||
| Diluted earnings per share of common stock: |
||||||||||||||||||||
| Earnings (loss) from continuing operations |
$ | (17.58 | ) | $ | 0.96 | $ | (1.07 | ) | $ | (1.20 | ) | $ | (18.88 | ) | ||||||
| Fiscal 2010 | ||||||||||||||||||||
| First | Second | Third | Fourth | Total | ||||||||||||||||
| Revenues |
$ | 330,367 | $ | 346,146 | $ | 103,126 | $ | 117,039 | $ | 896,678 | ||||||||||
| Gross profit |
142,791 | 143,105 | 42,418 | 50,834 | 379,148 | |||||||||||||||
| Operating income (loss) |
54,539 | 56,660 | (22,591 | ) | (13,911 | ) | 74,697 | |||||||||||||
| Earnings (loss) from continuing operations, net of income taxes |
28,429 | 29,597 | (18,210 | ) | (13,263 | ) | 26,553 | |||||||||||||
| Equity in earnings (losses) of unconsolidated affiliate, net of tax |
— | — | (241 | ) | (460 | ) | (701 | ) | ||||||||||||
| Net income (loss) |
28,429 | 29,597 | (18,451 | ) | (13,723 | ) | 25,852 | |||||||||||||
| Basic earnings per share of common stock: |
||||||||||||||||||||
| Earnings (loss) from continuing operations |
$ | 1.51 | $ | 1.57 | $ | (0.98 | ) | $ | (0.73 | ) | $ | 1.37 | ||||||||
| Total |
$ | 1.51 | $ | 1.57 | $ | (0.98 | ) | $ | (0.73 | ) | $ | 1.37 | ||||||||
| Diluted earnings per share of common stock: |
||||||||||||||||||||
| Earnings (loss) from continuing operations |
$ | 1.51 | $ | 1.57 | $ | (0.98 | ) | $ | (0.73 | ) | $ | 1.37 | ||||||||
| Total |
$ | 1.51 | $ | 1.57 | $ | (0.98 | ) | $ | (0.73 | ) | $ | 1.37 | ||||||||
The summation of quarterly net income per share may not equate to the calculation for the full fiscal year as quarterly calculations are performed on a discrete basis.
Our business is subject to seasonal influences. Our historical revenues and profitability have been dramatically higher in the first two quarters of our fiscal year, primarily due to increased shipments to customers coinciding with the start of each school year. Quarterly results also may be materially affected by the timing of acquisitions, the timing and magnitude of costs related to such acquisitions, variations in our costs for the products sold, the mix of products sold and general economic conditions. Moreover, the operating margins of companies we acquire may differ substantially from our own, which could contribute to further fluctuation in quarterly operating results. Therefore, results for any quarter are not indicative of the results that we may achieve for any subsequent fiscal quarter or for a full fiscal year.
72
| Item 9. | Changes in and Disagreements with Accountants on Accounting and Financial Disclosure |
Not applicable
| Item 9A. | Controls and Procedures |
Evaluation of Disclosure Controls and Procedures
Based on an evaluation as of the end of the period covered by this annual report, the Company’s principal executive officer and principal financial officer have concluded that the Company’s disclosure controls and procedures (as defined in Rule 13a-15(e) under the Securities Exchange Act of 1934 (the “Exchange Act”)) are effective for the purposes set forth in the definition of the Exchange Act rules.
Management’s Report on Internal Control Over Financial Reporting
Management is responsible for establishing and maintaining adequate internal control over financial reporting. As such term is defined in Exchange Act Rule 13a-15(f), internal control over financial reporting is a process designed by, or under the supervision of, the principal executive and principal financial officers, or persons performing similar functions, and effected by the board of directors, management and other personnel, to provide reasonable assurance regarding the reliability of financial reporting and the preparation of financial statements for external purposes in accordance with accounting principles generally accepted in the United States. Internal control over financial reporting includes those policies and procedures that:
| (1) | pertain to the maintenance of records that, in reasonable detail, accurately and fairly reflect the transactions and dispositions of assets of the Company; |
| (2) | provide reasonable assurance that transactions are recorded as necessary to permit preparation of the financial statements in accordance with accounting principles generally accepted in the United States, and that receipts and expenditures of the Company are being made only in accordance with authorizations of management and the directors of the Company; and |
| (3) | provide reasonable assurance regarding prevention of unauthorized acquisition, use, or disposition of the Company’s assets that could have a material effect on the financial statements. |
Management conducted an evaluation of the effectiveness of the Company’s internal control over financial reporting based on the criteria in Internal Control—Integrated Framework issued by the Committee of Sponsoring Organizations of the Treadway Commission. Based on this evaluation under the criteria, management concluded that the Company’s internal control over financial reporting was effective as of April 30, 2011.
The Company’s internal control over financial reporting as of April 30, 2011 has been audited by Deloitte & Touche LLP, an independent registered public accounting firm, as stated in their report dated July 1, 2011, which is included herein.
Changes in Internal Controls
No change in our internal control over financial reporting occurred during our most recent fiscal quarter that materially affected, or is reasonably likely to materially effect, our internal control over financial reporting.
73
| Item 9B. | Other Information |
Not applicable
PART III
| Item 10. | Directors, Executive Officers and Corporate Governance |
| (a) | Executive Officers. Reference is made to “Executive Officers of the Registrant” in Part I hereof. |
| (b) | Directors. The information required by this Item is set forth in our Proxy Statement for the Annual Meeting of Shareholders to be held on August 23, 2011, under the caption “Proposal One: Election of Directors,” which information is incorporated by reference herein. |
| (c) | Section 16 Compliance. The information required by this Item is set forth in our Proxy Statement for the Annual Meeting of Shareholders to be held on August 23, 2011, under the caption “Section 16(a) Beneficial Ownership Reporting Compliance,” which information is incorporated by reference herein. |
| (d) | We have adopted a Code of Ethics that applies to our directors, officers and employees, including the principal executive officer, principal financial officer, principal accounting officer and controller. The Code of Ethics is posted on our internet website at www.schoolspecialty.com. We intend to satisfy the disclosure requirement under Item 406 of Regulation S-K by posting such information on our internet website. |
| (e) | There were no material changes in fiscal 2011 to the procedures by which the Company’s shareholders may recommend nominees to the Company’s Board of Directors. |
| (f) | The Company has a separately-designated standing Audit Committee of its Board of Directors. The Audit Committee is responsible for oversight of the Company’s accounting and financial reporting processes and the audit of the Company’s financial statements. The Audit Committee currently consists of three members, including Mr. Trucksess (Chairman), Mr. Lay and Ms. Dout, each of whom is “independent” under the listing standards of the Nasdaq Stock Market. Mr. Trucksess, Mr. Lay and Ms. Dout have each been determined by the Board of Directors to be an “audit committee financial expert” for purposes of the SEC’s rules. The Audit Committee has adopted, and the Board of Directors has approved, a charter for the Audit Committee. The Audit Committee held four meetings in fiscal 2011. |
| Item 11. | Executive Compensation |
The information required by this Item is set forth in our Proxy Statement for the Annual Meeting of Shareholders to be held on August 23, 2011, under the captions “Executive Compensation Discussion and Analysis,” and “Compensation Committee Interlocks and Insider Participation,” which information is incorporated by reference herein.
| Item 12. | Security Ownership of Certain Beneficial Owners and Management and Related Shareholder Matters |
The information required by this Item is set forth in our Proxy Statement for the Annual Meeting of Shareholders to be held on August 23, 2011, under the captions “Security Ownership of Management and Certain Beneficial Owners” and “Executive Compensation Discussion and Analysis,” which information is incorporated by reference herein.
| Item 13. | Certain Relationships and Related Transactions, and Director Independence |
The information required by this Item is set forth in our Proxy Statement for the Annual Meeting of Shareholders to be held on August 23, 2011, under the captions “Related Party Transactions” and “Corporate Governance,” which information is incorporated by reference herein.
74
| Item 14. | Principal Accounting Fees and Services |
The information required by this Item is set forth in our Proxy Statement for the Annual Meeting of Shareholders to be held on August 23, 2011, under the caption “Audit Committee Report,” which information is incorporated by reference herein.
75
PART IV
| Item 15. | Exhibits and Financial Statement Schedules |
(a)(1) Financial Statements (See Part II, Item 8).
Consolidated Financial Statements
Report of Independent Registered Public Accounting Firm
Consolidated Balance Sheets as of April 30, 2011 and April 24, 2010
Consolidated Statements of Operations for the fiscal years ended April 30, 2011, April 24, 2010 and April 25, 2009
Consolidated Statements of Shareholders’ Equity for the fiscal years ended April 30, 2011, April 24, 2010 and April 25, 2009
Consolidated Statements of Cash Flows for the fiscal years ended April 30, 2011, April 24, 2010 and April 25, 2009
Notes to Consolidated Financial Statements
(a)(2) Financial Statement Schedule (See Exhibit 99.1).
Schedule for the fiscal years ended April 30, 2011, April 24, 2010 and April 25, 2009: Schedule II—Valuation and Qualifying Accounts.
(a)(3) Exhibits.
See (b) below
(b) Exhibits.
See the Exhibit Index, which is incorporated by reference herein
(c) Financial Statements Excluded from Annual Report to Shareholders.
Not applicable
76
SIGNATURES
Pursuant to the requirements of Section 13 or 15(d) of the Securities Exchange Act of 1934, the Registrant has caused this report to be signed on its behalf by the undersigned, thereunto duly authorized, on July 1, 2011.
| SCHOOL SPECIALTY, INC. | ||
| By: | /s/ DAVID J. VANDER ZANDEN | |
| David J. Vander Zanden Chief Executive Officer (Principal Executive Officer) | ||
| By: | /s/ DAVID N. VANDER PLOEG | |
| David N. Vander Ploeg Executive Vice President and Chief Financial Officer (Principal Financial and Accounting Officer) | ||
Each person whose signature appears below hereby constitutes and appoints David J. Vander Zanden and David N. Vander Ploeg, and each of them, as his or her true and lawful attorney-in-fact and agent, with full power of substitution, to sign on his or her behalf individually and in the capacity stated below and to perform any acts necessary to be done in order to file any and all amendments to this Annual Report on Form 10-K, and to file the same, with all exhibits thereto and all other documents in connection therewith and each of the undersigned does hereby ratify and confirm all that said attorney-in-fact and agent, or his substitutes, shall do or cause to be done by virtue thereof.
Pursuant to the requirements of the Securities Exchange Act of 1934, this report has been signed by the following persons in the capacities and on the dates indicated below.
| Name |
Title |
Date | ||
| /s/ DAVID J. VANDER ZANDEN David J. Vander Zanden |
Chief Executive Officer and Director (Principal Executive Officer) | July 1, 2011 | ||
| /s/ DAVID N. VANDER PLOEG David N. Vander Ploeg |
Executive Vice President and Chief Financial Officer (Principal Financial and Accounting Officer) |
July 1, 2011 | ||
| /s/ TERRY L. LAY Terry L. Lay |
Chairman of the Board | July 1, 2011 | ||
| /s/ JONATHAN J. LEDECKY Jonathan J. Ledecky |
Director | July 1, 2011 | ||
| /s/ EDWARD C. EMMA Edward C. Emma |
Director | July 1, 2011 | ||
| /s/ HERBERT A. TRUCKSESS, III Herbert A. Trucksess, III |
Director | July 1, 2011 | ||
| /s/ JACQUELINE F. WOODS Jacqueline F. Woods |
Director | July 1, 2011 | ||
| /s/ A. JACQUELINE DOUT A. Jacqueline Dout |
Director | July 1, 2011 | ||
INDEX TO EXHIBITS
| Exhibit Number |
Document Description | |
| 3.1 | Articles of Incorporation of School Specialty, Inc., incorporated herein by reference to Appendix B of the School Specialty, Inc. definitive Proxy Statement dated July 24, 2000. | |
| 3.2 | Articles of Amendment dated August 18, 2009, incorporated herein by reference to Exhibit 3.2 to School Specialty, Inc.’s Annual Report on Form 10-K for the fiscal year ended April 24, 2010. | |
| 3.3 | Amended and Restated By-Laws of School Specialty, Inc., Effective as of November 16, 2010 incorporated herein by reference to Exhibit 3.1(a) to the Company’s Current Report on Form 8-K dated November 16, 2010. | |
| 4.1 | Amended & Restated Credit Agreement dated as of February 1, 2006 among School Specialty, Inc. and the guarantors and lenders named therein, incorporated herein by reference to Exhibit 4.1 of School Specialty, Inc.’s Quarterly Report on Form 10-Q for the period ended January 28, 2006. | |
| 4.2 | Amended and Restated Security Agreement dated as of February 1, 2006 given by School Specialty, Inc. and the other grantors named therein and Bank of America, N.A. as Collateral Agent, incorporated herein by reference to Exhibit 4.2 of School Specialty, Inc.’s Quarterly Report on Form 10-Q for the period ended January 28, 2006. | |
| 4.3 | Pledge Agreement dated February 1, 2006 given by School Specialty, Inc. and the other pledgors named therein to Bank of America, N.A. as Collateral Agent, incorporated herein by reference to Exhibit 4.3 of School Specialty, Inc.’s Quarterly Report on Form 10-Q for the period ended January 28, 2006. | |
| 4.4 | Consent dated June 5, 2006 to the Amended & Restated Credit Agreement dated as of February 1, 2006 (Exhibit 4.2), incorporated herein by reference to Exhibit 4.1 of School Specialty Inc.’s Quarterly Report on Form 10-Q for the period ended July 29, 2006. | |
| 4.5 | Indenture by and between School Specialty, Inc. and The Bank of New York Trust Company, N.A. dated as of November 22, 2006, incorporated herein by reference to Exhibit 4.1 of School Specialty, Inc.’s Current Report on Form 8-K dated November 22, 2006. | |
| 4.6 | First Amendment dated December 3, 2007, to the Amended & Restated Credit Agreement dated as of February 1, 2008 among School Specialty, Inc. and the guarantors and lenders named therein, incorporated herein by reference to Exhibit 4.1 of School Specialty, Inc.’s Quarterly Report on Form 10-Q for the period ended January 26, 2008. | |
| 4.7 | Consent and Second Amendment dated June 10, 2009, to the Amended and Restated Credit Agreement dated as of February 1, 2006, among School Specialty, Inc. and the guarantors and lenders named therein, incorporated by reference to Exhibit 4.1 of School Specialty, Inc.’s Quarterly Report on Form 10-Q for the period ended July 25, 2009. | |
| 4.8 | Certain other long-term debt as described in the Notes to Consolidated Financial Statements. School Specialty, Inc. agrees to furnish the Commission, upon request, copies of any instruments defining the rights of holders of any such long-term debt described in the Notes to Consolidated Financial Statements and not filed herewith. | |
| 4.9 | Credit Agreement dated as of April 23, 2010 among School Specialty, Inc. and the guarantors and lenders named therein, incorporated herein by reference to Exhibit 4.1 of School Specialty, Inc.’s Current Report on Form 8-K dated April 23, 2010. | |
| 4.10 | Security Agreement dated as of April 23, 2010 given by School Specialty, Inc. and the other grantors named therein and Bank of America, N.A., as Administrative Agent, incorporated herein by reference to Exhibit 4.3 of School Specialty, Inc.’s Current Report on Form 8-K dated April 23, 2010. | |
| Exhibit Number |
Document Description | |
| 4.11 | Pledge Agreement dated as of April 23, 2010 given by School Specialty, Inc. and the other pledgors named therein and Bank of America, N.A., as Administrative Agent, incorporated herein by reference to Exhibit 4.2 of School Specialty, Inc.’s Current Report on Form 8-K dated April 23, 2010. | |
| 4.12 | First Amendment, dated as of February 16, 2011, to the Credit Agreement dated as of April 23, 2010 among School Specialty, Inc. and the guarantors and lenders named therein, incorporated by reference to Exhibit 4.1 the Company’s Current Report on Form 8-K dated as of February 16, 2011. | |
| 4.13 | Form of Indenture dated as of March 1, 2011 between School Specialty, Inc. and The Bank of New York Mellon Trust Company, N.A., incorporated herein by reference to Exhibit 4.1 to the Company’s Current Report on Form 8-K dated as of February 23, 2011. | |
| 10.1* | Employment Agreement dated November 5, 2002, effective September 1, 2002, between David J. Vander Zanden and School Specialty, Inc., incorporated herein by reference to Exhibit 10.1 of School Specialty, Inc.’s Quarterly Report on Form 10-Q for the period ended October 26, 2002. | |
| 10.2* | Employment agreement dated December 6, 2005 between Steven Korte and School Specialty, Inc., incorporated herein by reference to Exhibit 10.2 of School Specialty, Inc.’s Quarterly Report on Form 10-Q for the period ended July 29, 2006. | |
| 10.3* | Employment agreement dated April 21, 2008 between David Vander Ploeg and School Specialty, Inc., incorporated herein by reference to Exhibit 10.1 of School Specialty, Inc.’s Current Report on Form 8-K dated April 16, 2008. | |
| 10.4* | Amended and Restated 1998 Stock Incentive Plan, amended as of May 5, 2008, incorporated herein by reference to Exhibit 10.6 of School Specialty, Inc.’s Annual Report on Form 10-K for the period ended April 26, 2008. | |
| 10.5* | Amended and Restated 2002 Stock Incentive Plan, amended as of May 5, 2008, incorporated herein by reference to Exhibit 10.7 of School Specialty, Inc.’s Annual Report on Form 10-K for the period ended April 26, 2008. | |
| 10.6* | Amended and Restated School Specialty, Inc. Incentive Bonus Plan, amended as of June 13, 2007, incorporated by reference to Appendix A of School Specialty, Inc.’s Proxy Statement on Schedule 14A for the 2007 Annual Meeting filed on July 24, 2007. | |
| 10.7* | School Specialty, Inc. 2008 Equity Incentive Plan, incorporated herein by reference to Appendix A to the Company’s Proxy Statement in Schedule 14A for the Company’s 2008 Annual Meeting filed on July 10, 2008. | |
| 10.8* | Form of non-employee Director non-vested stock unit (NSU) agreement under the Amended and Restated School Specialty, Inc. 2002 Stock Incentive Plan, incorporated herein by reference to Exhibit 10.2 of School Specialty, Inc.’s Quarterly Report on Form 10-Q for the period ended July 26, 2008. | |
| 10.9* | Amendment to Employment Agreement for David J. Vander Zanden, incorporated herein by reference to Exhibit 10.1 of School Specialty, Inc.’s Current Report on Form 8-K filed June 27, 2011. | |
| Exhibit Number |
Document Description | |
| 10.10* | Amendment to Employment Agreement for David N. Vander Ploeg, incorporated herein by reference to Exhibit 10.3 of School Specialty, Inc.’s Quarterly Report on Form 10-Q for the period ended January 24, 2009. | |
| 10.11* | Amendment to Employment Agreement for Steven F. Korte, incorporated herein by reference to Exhibit 10.4 of School Specialty, Inc.’s Quarterly Report on Form 10-Q for the period ended January 24, 2009. | |
| 10.12 | Agreement between School Specialty, Inc. and MSD Capital, L.P., dated as of April 11, 2006, incorporated by reference to Exhibit 10.1 of School Specialty’s Current Report on Form 8-K dated April 11, 2006. | |
| 10.13* | Employment agreement dated March 15, 2010 between Richmond Y. Holden and School Specialty, Inc., incorporated herein by reference to Exhibit 10.1 of School Specialty, Inc.’s Current Report on Form 8-K dated March 5, 2010. | |
| 10.14* | Employment Agreement dated August 28, 2007 between Rachel P. McKinney and School Specialty, Inc, incorporated herein by reference to Exhibit 10.18 to School Specialty, Inc.’s Annual Report on Form 10-K for the fiscal year ended April 24, 2010. | |
| 10.15* | Amendment to Employment Agreement dated December 31, 2008 for Rachel P. McKinney, incorporated herein by reference to Exhibit 10.19 to School Specialty, Inc.’s Annual Report on Form 10-K for the fiscal year ended April 24, 2010. | |
| 10.16 | Form of Exchange Agreement dated as of March 1, 2011, incorporated herein by reference to Exhibit 10.1 to the Company’s Current Report on Form 8-K dated as of February 23, 2011. | |
| 12.1 | Statement Regarding Computation of Ratio of Earnings to Fixed Charges. | |
| 14.1 | School Specialty, Inc. Code of Business Conduct/Ethics dated February 17, 2004, incorporated herein by reference to Exhibit 14.1 of School Specialty, Inc.’s Annual Report on Form 10-K for the period ended April 24, 2004. | |
| 21.1 | Subsidiaries of School Specialty, Inc. | |
| 23.1 | Consent of Deloitte & Touche LLP. | |
| 31.1 | Rule13a-14(a)/15d-14(a) Certification, by Chief Executive Officer. | |
| 31.2 | Rule13a-14(a)/15d-14(a) Certification, by Chief Financial Officer. | |
| 32.1 | Section 1350 Certification by Chief Executive Officer. | |
| 32.2 | Section 1350 Certification by Chief Financial Officer. | |
| 99.1 | Schedule II—Valuation and Qualifying Accounts. | |
| * | Management contract or compensatory plan or arrangement. |