Attached files
| file | filename |
|---|---|
| EX-23.1 - CONSENT OF PRICEWATERHOUSECOOPERS LLP - Manning & Napier, Inc. | dex231.htm |
Table of Contents
As filed with the Securities and Exchange Commission on July 1, 2011
Registration No. 333-
UNITED STATES
SECURITIES AND EXCHANGE COMMISSION
Washington, D.C. 20549
FORM S-1
REGISTRATION STATEMENT
UNDER
THE SECURITIES ACT OF 1933
MANNING & NAPIER, INC.
(Exact name of registrant as specified in its charter)
| Delaware | 6282 | 45-2609100 | ||
| (State or other jurisdiction of incorporation or organization) |
(Primary Standard Industrial Classification Code Number) |
(I.R.S. Employer Identification Number) |
290 Woodcliff Drive
Fairport, New York 14450
(585) 325-6880
(Address, including zip code, and telephone number, including area code, of registrant’s principal executive offices)
Richard B. Yates
Chief Legal Officer
Manning & Napier, Inc.
290 Woodcliff Drive
Fairport, New York 14450
(585) 325-6880
(Name, address, including zip code, and telephone number, including area code, of agent for service)
Copies to:
| Harold Levine Irwin A. Kishner Herrick, Feinstein LLP 2 Park Avenue New York, New York 10016 (212) 592-1400 |
Raymond B. Check Cleary Gottlieb Steen & Hamilton LLP One Liberty Plaza New York, New York 10006 (212) 225-2000 |
Approximate date of commencement of proposed sale to the public: As soon as practicable after the effective date of this Registration Statement.
If any of the securities being registered on this Form are to be offered on a delayed or continuous basis pursuant to Rule 415 under the Securities Act of 1933, check the following box. ¨
If this Form is filed to register additional securities for an offering pursuant to Rule 462(b) under the Securities Act, check the following box and list the Securities Act registration statement number of the earlier effective registration statement for the same offering. ¨
If this Form is a post-effective amendment filed pursuant to Rule 462(c) under the Securities Act, check the following box and list the Securities Act registration statement number of the earlier effective registration statement for the same offering. ¨
If this Form is a post-effective amendment filed pursuant to Rule 462(d) under the Securities Act, check the following box and list the Securities Act registration statement number of the earlier effective registration statement for the same offering. ¨
Indicate by check mark whether the registrant is a large accelerated filer, an accelerated filer, a non-accelerated filer, or a small reporting company. See the definitions of “large accelerated filer,” “accelerated filer,” and “smaller reporting company” in Rule 12b-2 of the Exchange Act.
| Large accelerated filer ¨ | Accelerated filer ¨ | |
| Non-accelerated filer þ (Do not check if a smaller reporting company) | Smaller reporting company ¨ |
CALCULATION OF REGISTRATION FEE
| Title of each class of securities to be registered |
Proposed maximum aggregate offering price (1)(2) |
Amount of registration fee |
||||||
| Class A common stock, $0.01 par value per share |
$ | 250,000,000 | $ | 29,025 | ||||
| (1) | Includes additional shares of Class A common stock which the underwriters have the option to purchase to cover overallotments, if any. |
| (2) | Estimated solely for purposes of computing the amount of the registration fee pursuant to Rule 457(o) under the Securities Act of 1933. |
The Registrant hereby amends this Registration Statement on such date or dates as may be necessary to delay its effective date until the Registrant shall file a further amendment which specifically states that this Registration Statement shall thereafter become effective in accordance with Section 8(a) of the Securities Act of 1933 or until the Registration Statement shall become effective on such date as the Commission, acting pursuant to said Section 8(a), may determine.
Table of Contents
The information in this prospectus is not complete and may be changed. We may not sell these securities until the registration statement filed with the Securities and Exchange Commission is effective. This prospectus is not an offer to sell these securities and it is not soliciting an offer to buy these securities in any state where the offer or sale is not permitted.
Subject to Completion
Preliminary Prospectus dated July 1, 2011
PROSPECTUS
Shares

Class A Common Stock
This is Manning & Napier, Inc.’s initial public offering. We are selling shares of our Class A common stock and the selling stockholder is selling shares of our Class A common stock. We will not receive any proceeds from the sale of shares to be offered by the selling stockholder.
We expect the public offering price to be between $ and $ per share. Currently, no public market exists for the shares. After pricing of the offering, we expect that the shares will trade on the under the symbol “MN.”
Upon completion of this offering, William Manning, our Chairman and controlling stockholder, will hold a majority of the combined voting power of our capital stock through his ownership of 100% of our outstanding Class B common stock.
Investing in our Class A common stock involves risks that are described in the “Risk Factors” section beginning on page 16 of this prospectus.
| Per Share |
Total |
|||||||
| Public offering price |
$ | $ | ||||||
| Underwriting discount |
$ | $ | ||||||
| Proceeds, before expenses, to us |
$ | $ | ||||||
| Proceeds, before expenses, to the selling stockholder |
$ | $ | ||||||
The underwriters may also exercise their option to purchase up to an additional shares of the Class A common stock from us at the public offering price, less the underwriting discount, for 30 days after the date of this prospectus to cover overallotments, if any.
Neither the Securities and Exchange Commission nor any state securities commission has approved or disapproved of these securities or determined if this prospectus is truthful or complete. Any representation to the contrary is a criminal offense.
The shares will be ready for delivery on or about , 2011.
BofA Merrill Lynch
The date of this prospectus is , 2011.
Table of Contents
| Page | ||||
| 1 | ||||
| 16 | ||||
| 35 | ||||
| 36 | ||||
| 46 | ||||
| 47 | ||||
| 48 | ||||
| 49 | ||||
| Unaudited Pro Forma Combined Consolidated Financial Information |
50 | |||
| Selected Historical Combined Consolidated Financial And Other Data |
57 | |||
| Management’s Discussion And Analysis Of Financial Condition And Results Of Operations |
60 | |||
| 82 | ||||
| 94 | ||||
| 97 | ||||
| 101 | ||||
| 114 | ||||
| 115 | ||||
| 117 | ||||
| 120 | ||||
| Material U.S. Federal Tax Considerations For U.S. And Non-U.S. Holders Of Our Class A Common Stock |
122 | |||
| 126 | ||||
| 132 | ||||
| 132 | ||||
| 132 | ||||
| F-1 | ||||
i
Table of Contents
We are responsible for the information contained in this prospectus and in any free writing prospectus we may authorize to be delivered to you. We have not, and the selling stockholder and the underwriters have not, authorized anyone to give you any other information, and take no responsibility for any other information that others may give you. We and the selling stockholder are offering to sell, and seeking offers to buy, shares of our Class A common stock only in jurisdictions where offers and sales are permitted. The information contained in this prospectus is accurate only as of the date of this prospectus, regardless of the time of delivery of this prospectus or of any sale of our Class A common stock.
BASIS OF PRESENTATION
Except as otherwise indicated herein or as the context otherwise requires, in this prospectus:
| • | “Manning & Napier,” “the Company,” “we,” “our,” and “us” refers to Manning & Napier, Inc. and, unless the context otherwise requires, its direct and indirect subsidiaries, including Manning & Napier Group, and predecessors, including the Manning & Napier Companies; |
| • | “Manning & Napier Group” refers to Manning & Napier Group, LLC, a limited liability company organized under the laws of the State of Delaware, and, unless the context otherwise requires, its direct and indirect subsidiaries and predecessors; |
| • | “M&N Group Holdings” refers to M&N Group Holdings, LLC, a limited liability company organized under the laws of the State of Delaware; |
| • | “Manning & Napier Companies” refers to, collectively, Manning & Napier Advisors, Inc., or MNA, Manning & Napier Advisory Advantage Corporation, or AAC, Manning & Napier Alternative Opportunities, Inc., or MNAO, Manning & Napier Capital Company, LLC, or MNCC, Manning & Napier Investor Services, Inc., or MNBD, Manning & Napier Information Services, LLC, or MNIS, and Perspective Partners LLC, or PPI, each as in effect prior to the reorganization transactions; |
| • | “Manning & Napier Associates” refers to Manning & Napier Associates, LLC, a limited liability company organized under the laws of the State of New York and an affiliate of Manning & Napier. |
| • | “this offering” refers to the offering of our Class A common stock offered hereby; |
| • | “collective investment trusts” refers to the pools of retirement plan assets maintained by a bank or trust company that we manage; |
| • | “portfolios” refers to the separate accounts in which we manage our clients’ investments and the mutual funds, collective investment trusts or other pooled investment vehicles for which we are investment adviser or sub-advisor; |
| • | “management services” refers to the investment management services we provide to clients who engage us to manage their investments; and |
| • | “client” and “clients” refer to investors who access our management services. |
In this prospectus, we rely on and refer to certain market and industry data and forecasts related thereto. We obtained this information and these statistics from sources other than us, which we have supplemented where necessary with information from publicly available sources and our own internal estimates. We use these sources and estimates and believe them to be reliable, but we cannot give you any assurance that any of the projected results will be achieved.
None of the information in this prospectus or the registration statement of which this prospectus forms a part constitutes either an offer or a solicitation to buy or sell any of our products, nor is any such information a recommendation for any of our products or management services.
ii
Table of Contents
This summary highlights information contained elsewhere in this prospectus. This summary may not contain all of the information that may be important to you. You should read the entire prospectus carefully together with our combined consolidated financial statements and the related notes appearing elsewhere in this prospectus before you decide to invest in our Class A common stock. This prospectus contains forward-looking statements, which involve risks and uncertainties. Our actual results could differ materially from those anticipated in such forward-looking statements as a result of certain factors, including those discussed under the heading “Risk Factors” and other sections of this prospectus.
Overview
We are an independent investment management firm that provides a broad range of investment solutions through separately managed accounts, mutual funds and collective investment trust funds. Founded in 1970, we offer equity and fixed income portfolios as well as a range of blended asset portfolios, such as life cycle funds, that use a mix of stocks and bonds. Since 1999, we have achieved strong relative growth in discretionary assets under management, or AUM. From December 31, 1999 through March 31, 2011, our AUM has increased from $6.9 billion to $42.6 billion, representing a compound annual growth rate of 17.5% during a period that included two significant bear markets. Our growth in AUM resulted in an increase in our revenues from $50.2 million for the year ended December 31, 1999 to $255.5 million for the year ended December 31, 2010.
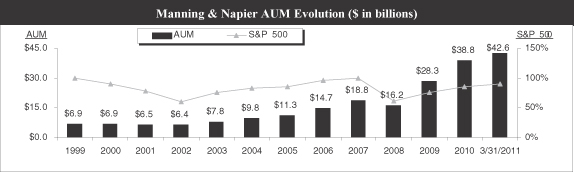
Note: Reflects our AUM over the periods indicated compared to the performance of the market, represented by the benchmarked return of the S&P 500 relative to its level at the end of 1999. Data as of December 31 of each respective year, unless otherwise indicated.
We employ a disciplined investment process that seeks to avoid areas of speculation and invest in what we view as under-valued market segments, under the principle that today’s market prices drive future potential investment return. Initially, this approach helped us build a strong client base of high net worth individuals and middle market institutions, and we maintain these relationships in many targeted geographic regions. This foundation allowed us to expand our business to serve the needs of larger institutions, investment consultants and other intermediaries, which has been a strong driver of recent growth.
We have focused on building an internal organization of specialists to provide additional consultative services beyond investment management, which we believe helps us build close relationships with our clients through multiple service touch points and a solutions-oriented approach. Taken together with strong investment performance across portfolios, our consultative, total-solutions approach has allowed us to achieve a significantly lower-than-industry average annual separate account cancellation rate through difficult market environments. According to Cerulli Associates, the average annual industry redemption rate, or cancellation rate, for separate accounts was 23.3% for the period 2002 through 2010 and 24.9% over the last five years ending December 31,
1
Table of Contents
2010, as compared to our average annual cancellation rates of 3.9% and 3.6%, respectively, during such periods. We have experienced net positive cash flows in both our separate accounts and our mutual funds for each of the last four years and thus far in 2011.
Our research process is analyst- and team-driven. Our mutual funds have earned a number of industry accolades, including a finalist ranking for Morningstar’s international manager of the decade and multiple Lipper awards. As of March 31, 2011, 15 of the 17 funds eligible for Morningstar ratings, representing 87% of our total mutual fund AUM, are rated four or five stars by Morningstar. From January 1, 2000 through March 31, 2011, a period of time that included two significant bear markets, many of our mutual funds and similarly managed separate account portfolios experienced strong cumulative returns well in excess of the returns earned by broad equity market indexes.
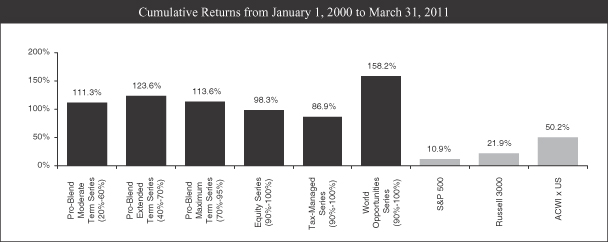
Note: Represents cumulative returns for the mutual funds set forth above from January 1, 2000 to March 31, 2011. Percentages in parentheses represent mutual fund equity range.
We have separate account portfolios that mirror each of the mutual funds illustrated above, each of which has earned similar cumulative investment returns to those we have earned for our mutual funds.
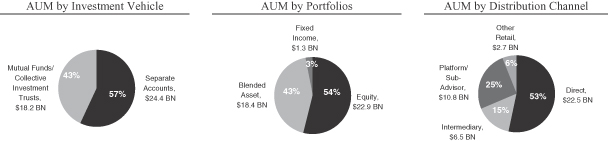
We offer our investment management capabilities primarily through direct sales to high net worth individuals and institutions, as well as through third-party intermediaries, including wirehouse brokers, independent financial advisors, and institutional investment consultants. Our AUM as of March 31, 2011 by investment vehicle, portfolios and distribution channel were as follows:
As of March 31, 2011, we had 414 employees, including William Manning, our Chairman and controlling stockholder, and the 47 other employee-owners, most of whom are based in Fairport, New York.
2
Table of Contents
Immediately following the completion of this offering, these employee-owners will collectively own approximately % of Manning & Napier Group, through which we conduct all of our business. Our culture of employee ownership strongly aligns our interests with those of our clients’ by delivering strong investment performance and solutions.
Industry Trends
We believe the following key market trends will continue to drive the growth of our business and increase the value of our service offerings:
Increased Focus on Management of Employee Benefit Plans. Rapidly rising healthcare costs are eroding the ability of many employees to fund adequate retirement savings and employers are increasingly concerned with the financial hurdles their employees face. According to Deloitte Consulting LLP, approximately 75% of employers surveyed indicate that they plan to make or have already made changes to the design of their health and welfare plans to address these concerns. At the same time, employees increasingly are looking for customized advice. We believe employers will be increasingly interested in working with providers that can take a holistic view of benefit plan design and can help solve problems with both retirement benefit plans and health benefit plans.
Growth of Defined Contribution Plans and Enhanced Role for Life Cycle Funds. We believe the large and growing retirement savings industry increasingly requires investment advice and retirement help for employees. As a result of the Pension Protection Act of 2006 and subsequent U.S. Department of Labor guidelines, plan sponsors are now actively seeking automatic retirement savings solutions for their employees. We expect auto-enrollment will be a driver of even greater participant balances in the future and life cycle funds, and target date funds in particular, will continue to see increased demand as more plan sponsors use such funds as the default option within their plans. Cerulli Associates estimates assets in life cycle funds will increase by 40% per year from 2009 through 2015. We believe life cycle and target date fund providers with a documented track record of proven results will garner increasing assets in this space, especially when bundled with broad employee education services.
Focus on Intergenerational Planning. A 2011 U.S. Trust survey of Americans with at least $3 million in investments indicates that nearly 40% do not have a comprehensive estate plan and more than 27% have never discussed intergenerational wealth transfer with their financial advisor. We anticipate significant opportunities for investment managers that can position themselves as trusted advisors to high net worth investors.
Heightened Interest in Risk Management. Following the credit crisis and global bear market in 2008 and early 2009, investors and financial advisors have become increasingly interested in absolute return strategies, or strategies that seek positive returns over full market cycles. A 2010 survey of financial advisors and brokers by Putnam Investments states that 59% of advisors were likely to recommend absolute return strategies to their clients. We believe our active and unconstrained investment approach within our blended asset class portfolios is well suited to meet the demand for absolute return strategies using traditional asset classes and is likely to be less expensive than alternative investment-based strategies with similar absolute return goals.
Demand for Non-U.S. Investments. With more than 50% of the global market capitalization represented by non-U.S. companies, U.S. investors are increasingly looking to diversify their assets through non-U.S. investments. We believe U.S. investors are under-allocated in global equities relative to global benchmarks, particularly in the defined contribution channel, with only 7% of defined contribution assets invested in non-U.S. equities. We believe investors will strive to select managers with experience and proven results to meet their more diversified and global investing requirements as well as those with the flexibility to allocate assets to and within foreign markets, among both developed and emerging countries.
3
Table of Contents
Our Competitive Strengths
Team-Based Investment Approach. We rely on a team-based investment approach and a robust investment process that has resulted in consistent returns over time that are well in excess of market benchmarks. Our investment team consists of 39 “bottom-up” equity research analysts with global industry responsibilities and 27 “top-down” economists, statistical analysts and fixed income analysts. Investment decisions are overseen by our Senior Research Group, which is a team of ten senior analysts who manage our portfolios. We believe this team approach, rather than relying on traditional individual portfolio managers, has provided and will continue to provide consistency to our investment process and results over the long-term.
Track Record of Consistent Investment Excellence through Multiple Market Cycles. We have a track record of superior long-term investment returns across our key portfolios relative to our competitors and the relevant benchmarks. Fifteen of our 17 mutual funds, representing more than $15 billion in AUM, have a Morningstar rating of 4 or 5 stars. Lipper Fund Awards 2010 named Manning & Napier’s World Opportunities Series as the “Best International Multi-Cap Core Fund over 10 years” and their 2011 Fund Awards named our International Series as the “Best International Multi-Cap Core Fund” over three years. Our track record of consistent outperformance is instrumental in attracting and retaining clients as well as in maintaining good relationships with consultants who recommend our services.
High Client Retention through a Solutions-Oriented Approach. Our average annual separate account cancellation rate was 3.6% over the last five years ending December 31, 2010, as compared to an industry rate of 25% according to Cerulli Associates. For many of our clients, we provide an array of services to help them identify their funding and investment requirements and then design solutions that are specific to the client’s needs. We believe our long history of providing consultative services to complement our investment process has allowed us to form stronger relationships with our clients and has helped to reduce turnover during challenging market environments.
Strong Record of Net New Business Generation. Our AUM and revenue has grown consistently over the period from December 31, 1999 to March 31, 2011 despite two bear markets. We have experienced positive net cash flows every quarter since the last stock market peak in the fourth quarter of 2007. Our contraction in AUM during the 2008-2009 market downturn was relatively mild primarily due to continued strong new business flows driven by our absolute return orientation and our low client cancellation rate. Our strong organic growth has allowed us to maintain positive revenue momentum during periods of sustained market declines and establish a solid base to build on during periods of economic expansion.
Culture of Product Innovation. We have a company-wide culture of product innovation that is designed to anticipate the needs of the clients we serve. For example, we developed our first life cycle mutual fund in 1993, when there were only seven life cycle funds listed on Morningstar. More recently, we launched technology driven products and services to assist both employers and employees with their health and wealth planning. Given our culture of innovation, we believe that we are well-positioned to take advantage of new opportunities in the ever-changing marketplace.
Diversified Client Base through Multiple Channels. We distribute our products and services through direct sales as well as by leveraged distribution through financial intermediaries, platforms and investment consultants. Overall, our client base is well-diversified across both individual and institutional client types, with our largest direct client relationship representing only 1.3% of our total AUM as of March 31, 2011. As of March 31, 2011, our largest third-party relationship accounted for approximately 5% of our total AUM. This broad distribution has made our business less susceptible to losses from any one client or channel and has contributed to the stability of our earnings.
4
Table of Contents
Experienced Management Team and Investment Professionals. In 2003, William Manning turned over management responsibilities to our current executive management team. This team has, on average, 22 years of experience with our company and an average of 28 years of experience in the asset management industry. Patrick Cunningham has been with us since 1992 and was named our chief executive officer in June 2010, and the majority of the members of our Senior Research Group started their investment careers with us. These long-standing tenures illustrate the continuity and commitment of our team that we believe will be important to our success in the future.
Our Strategy
Our strategy for continued success is focused on the following:
Expand our Direct Channel. Our high-touch direct distribution channel has allowed us to build strong relationships with our clients over time. We plan to expand our direct sales presence geographically, filling in new regions along the east coast and expanding farther west. Our direct channel will remain focused on identifying geographic regions within which our representatives form key relationships with centers of influence, business owners and other referral networks.
Broaden our Intermediary Channel. We are focused on the attractive 401(k) marketplace, which is characterized by positive cash flows and low cancellation rates. In addition to building relationships directly with plan sponsors, we are focusing our wholesale staff on identifying advisors and other financial intermediaries that work primarily with defined contribution plans. We expect significant future growth opportunities within this channel as we begin to target wire-house advisors, retirement plan advisors and other intermediaries that work with small- to mid-sized 401(k) plans.
Focus on the Convergence of Health and Wealth Benefits. Our strong relationship with employers positions us well for the opportunities provided by the convergence of health and wealth benefits in employer decision making. We are focused on providing consultative services to employers to address these key concerns through unique plan design alternatives and technology-based tools to help employers and advisors effectively reach large numbers of employees with tailored retirement and health plan guidance. We will continue to develop and potentially acquire products and services to help employers best address these key issues regarding retirement and health benefit plans.
Develop New Products in Response to Market Opportunities. The on-going development of products and consultative services in response to current and prospective client needs has been a source of significant growth. We remain committed to understanding the key areas of concern for various client types and developing solutions to meet these needs. Continued product and service development will likely require building additional resources and areas of expertise, and we are continuing to add resources where solving key problems can strengthen our relationships with clients.
Summary Risk Factors
An investment in our Class A common stock involves substantial risks and uncertainties. These risks and uncertainties include, among others, the following:
| • | Our revenues are dependent on the market value and composition of our AUM, all of which are subject to fluctuation due to factors outside of our control. |
| • | The loss of key investment professionals or members of our senior management team could have an adverse effect on our business. |
| • | We derive substantially all of our revenues from contracts and relationships that may be terminated upon short or no notice. |
5
Table of Contents
| • | We may be required to reduce the fees we charge, which could have an adverse effect on our profit margins and results of operations. |
| • | Several of our portfolios involve investing principally in the securities of non-U.S. companies, which involve foreign currency exchange, tax, political, social and economic uncertainties and risks. |
| • | Control of a majority of the combined voting power of our capital stock by William Manning, and ownership of % of Manning & Napier Group’s ownership interests by our existing owners, including William Manning, may give rise to conflicts of interest. |
The foregoing is not a comprehensive list of the risks and uncertainties we face. Investors should carefully consider all of the information in this prospectus, including information under “Risk Factors,” prior to making an investment in our Class A common stock.
Structure and Reorganization
The diagram below depicts our organizational structure after the reorganization transactions and the consummation of this offering.
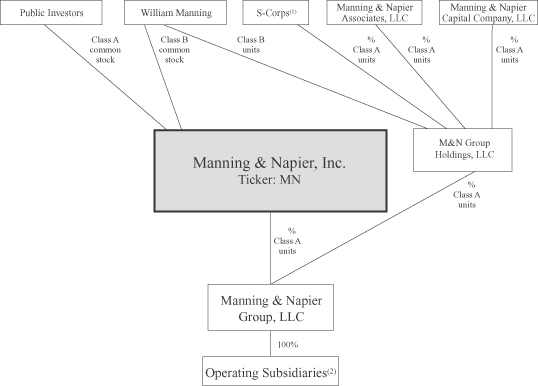
| (1) | Represents Manning & Napier Advisors, Inc., Manning & Napier Advisory Advantage Corporation, Manning & Napier Investor Services, Inc. and Manning & Napier Alternative Opportunities, Inc. |
| (2) | Represents (i) the newly formed limited liability companies which will have assets contributed by Manning & Napier Advisors, Inc., Manning & Napier Advisory Advantage Corporation, Manning & Napier Investor Services, Inc. and Manning & Napier Alternative Opportunities, Inc., and (ii) Perspective Partners LLC, Manning & Napier Information Services, LLC and Exeter Trust Company. |
6
Table of Contents
Reorganization Transactions
We will enter into a series of transactions to reorganize our capital structure in connection with this offering. We refer throughout this prospectus to the transactions described below as the reorganization transactions or the reorganization.
Revisions to our Organizational Structure. Prior to the reorganization transactions and this offering, we were a group of privately-held, affiliated companies comprising the Manning & Napier Companies. Five of these companies were majority owned by William Manning, our Chairman and controlling stockholder, with a minority interest held by 47 of our employees, and two of these companies were majority owned by William Manning, with a minority interest held by B. Reuben Auspitz, our Vice-Chairman. See “Our Structure and Reorganization—Structure Prior to the Reorganization Transactions.”
Prior to the reorganization transactions and this offering, we had a mandatory redemption obligation upon the death of William Manning to pay a formula-derived amount to his estate. Our liability related to this mandatory redemption obligation was calculated each fiscal quarter, and the change in the liability was reflected as a non-cash interest expense. Such mandatory obligation will terminate immediately prior to the consummation of this offering and we will no longer reflect non-cash interest expense or the liability related to such obligation. See “Management’s Discussion and Analysis of Financial Condition and Results of Operations.”
Capital Stock. Immediately prior to the consummation of this offering, we will amend and restate our certificate of incorporation to authorize two classes of common stock, Class A common stock and Class B common stock. We will issue shares of Class A common stock to the public pursuant to this offering and, immediately prior to the consummation of this offering, we will issue shares of our Class B common stock to William Manning and shares of our Class A common stock to the selling stockholder. Each share of Class A common stock will entitle its holder to one vote per share. The holder of our Class B common stock will have a majority of the combined voting power of our capital stock through his ownership of 100% of our outstanding Class B common stock. See “Description of Capital Stock.”
Equity Ownership Interests. In connection with the reorganization transactions, additional ownership interests in M&N Group Holdings will be granted to William Manning. In addition, certain of the Manning & Napier Companies will amend and restate their respective shareholders’ agreements, pursuant to which, among other things, the vesting terms related to the current ownership interests of our employees, including our named executive officers other than William Manning, will be amended. Such individuals will be entitled to 15% of their pre-reorganization ownership interests upon the consummation of this offering, and an additional 5% of such ownership interests will vest as of each of the first, second and third anniversaries of the consummation of this offering, provided such individuals are employed by us as of such date (employment-based vesting). The remaining ownership interests will be subject to performance-based vesting as of each of the first, second and third anniversaries of this offering (subject to an initial two-year lockup period and other selling restrictions), to be determined by a vesting committee of MNA (performance-based vesting). Such new vesting terms will not result in dilution to the number of outstanding shares of our Class A common stock. As a result of such vesting requirements, we will recognize non-cash compensation charges which will be fully realized by the end of 2014. We will also recognize an additional one-time non-cash compensation charge in 2011 related to the additional ownership interests that will be granted to William Manning.
Notwithstanding these vesting requirements, the amended and restated shareholders’ agreements will provide that, in the event William Manning sells any portion of his interests in the Manning & Napier Companies following the consummation of this offering, our other employee-owners will have the right to sell a pro rata amount of such individuals’ ownership interest in Manning & Napier Group, and if any individual does not at such time have fully vested ownership interests sufficient to allow such participation, an amount of their ownership interests will vest to the extent necessary to allow them to participate in the pro rata sale. In addition, the board of
7
Table of Contents
directors of MNA has limited the aggregate sales in any calendar year by our employees, other than William Manning, of their respective interests to a number of shares equal to 1.5% (or such higher percentage as determined by the board of directors of MNA in its sole discretion) of the number of shares that would be outstanding immediately after this offering if M&N Group Holdings exchanged 100% of its units for shares of our Class A common stock. This 1.5% limit will not apply to ownership interests entitled to vest as a result of sales by William Manning as described above or to the employment-based vesting as described above.
See “Our Structure and Reorganization—Equity Ownership Interests.”
Exchange Agreement. Prior to the consummation of this offering, we will enter into an exchange agreement with M&N Group Holdings, the direct holder of all of the Class A units of Manning & Napier Group that are not held by us, which in the aggregate is equivalent to % of our Class A common stock on a fully diluted as-exchanged basis.
Pursuant to the terms and conditions of the exchange agreement, prior to this offering, M&N Group Holdings exchanged Class A units of Manning & Napier Group for shares of our Class A common stock, of which shares are being sold in this offering by M&N Group Holdings on behalf of William Manning and shares are being sold in this offering by M&N Group Holdings on behalf of certain of our employees, including our named executive officers.
In addition, subject to certain restrictions set forth in the exchange agreement:
| • | with respect to the Class A units and Class B units of Manning & Napier Group, which are sometimes collectively referred to herein as units, that are attributable to the interests of William Manning in M&N Group Holdings, commencing on the first anniversary of this offering, M&N Group Holdings may exchange up to 15% of such units (equivalent to shares of our Class A common stock on a fully diluted as-exchanged basis) per year on behalf of William Manning; provided, that with respect to the exchanges permitted as of the first anniversary of the consummation of this offering, the 15% limit will be reduced by the units exchanged for shares of our Class A common stock sold in this offering on his behalf; and |
| • | with respect to the Class A units of Manning & Napier Group that are attributable to the interests of the other holders of M&N Group Holdings, all of whom are our employees, including our named executive officers, other than William Manning: |
| - | commencing on the first anniversary of the consummation of this offering, M&N Group Holdings may exchange up to 5% of such Class A units (equivalent to shares of our Class A common stock on a fully diluted as-exchanged basis) on behalf of such holders; and |
| - | commencing on the second anniversary of the consummation of this offering, M&N Group Holdings may exchange the remaining Class A units, subject to the vesting requirements and selling restrictions as set forth above. |
For any units of Manning & Napier Group exchanged following the consummation of this offering, we will (i) pay an amount of cash equal to the number of units exchanged multiplied by the value of one share of our Class A common stock, or, at our election, (ii) issue shares of our Class A common stock on a one-for-one basis, subject, in each case, to customary adjustments for stock splits, stock dividends and reclassifications and other similar transactions. As we receive units of Manning & Napier Group that are exchanged, our ownership of Manning & Napier Group will increase.
8
Table of Contents
In addition, we intend to award equity-based incentives to certain employees pursuant to the Manning & Napier, Inc. 2011 Equity Compensation Plan, or the 2011 Plan, to align their interests with our stockholders. From time to time following the consummation of this offering, the holders of units of Manning & Napier Group granted pursuant to the 2011 Plan, if any, shall become parties to the exchange agreement. Following the satisfaction of any vesting conditions set forth in the applicable agreements granting such holders such units or as otherwise determined by the compensation committee, such holders may exchange such units for (i) an amount of cash equal to the number of units exchanged multiplied by the value of one share of our Class A common stock, or, at our election, (ii) shares of our Class A common stock on a one-for-one basis, subject, in each case, to customary adjustments for stock splits, stock dividends and reclassifications and other similar transactions. As we receive units of Manning & Napier Group that are exchanged, our ownership of Manning & Napier Group will increase.
See “Our Structure and Reorganization—Offering Transactions—Exchange Agreement.”
Tax Receivable Agreement. Simultaneously with this offering, we will enter into a tax receivable agreement with the holders of Class A units of Manning & Napier Group, under which we will be required to pay to the holders of such Class A units 85% of the applicable cash savings, if any, in U.S. federal, state, local and foreign income tax that we actually realize, or are deemed to realize in certain circumstances, in periods after this offering as a result of any step-up in tax basis in Manning & Napier Group’s assets resulting from (i) our purchases or exchanges of such Class A units for cash or shares of our Class A common stock (including the exchanges of Class A units in connection with the reorganization transactions) and (ii) payments under the tax receivable agreement, including any tax benefits related to imputed interest deemed to be paid by us as a result of such agreement.
There is a possibility that not all of the 85% of the applicable cash savings will be paid to the exchanging holder of Class A units at the time described above. If we determine that, all or a portion of such applicable tax savings is in doubt, we will pay to the holders of such Class A units the amount attributable to the portion of the applicable tax savings that we determine is not in doubt and pay the remainder at such time as we reasonably determine the actual tax savings or that the amount is no longer in doubt.
See “Our Structure and Reorganization—Offering Transactions—Tax Receivable Agreement.”
Our Principal Stockholder
Upon and after the consummation of this offering, William Manning will hold a majority of the combined voting power of our capital stock through his ownership of 100% of our outstanding Class B common stock. Accordingly, William Manning will have the ability to approve or disapprove certain transactions and matters, including material corporate transactions.
Corporate Information
We were incorporated on June 22, 2011 under the laws of the State of Delaware. Our principal executive office is located at 290 Woodcliff Drive, Fairport, New York 14450, and our telephone number at that office is (585) 325-6880. The website address of our operating company is www.manning-napier.com. This website and information contained on, or that can be accessed through, the website are not part of this prospectus.
9
Table of Contents
THE OFFERING
| Class A common stock offered by us |
shares of Class A common stock. |
| Class A common stock offered by M&N Group Holdings, the selling stockholder |
shares of Class A common stock. |
| Class A common stock to be outstanding immediately after this offering |
shares of Class A common stock. If all units of Manning & Napier Group, other than those held by us, were exchanged for shares of our Class A common stock immediately after the reorganization, shares of Class A common stock would be outstanding immediately after this offering. |
| Class B common stock to be outstanding immediately after this offering |
shares of Class B common stock. |
| Use of proceeds |
We estimate that our net proceeds from this offering will be approximately $ million, based on an assumed initial public offering price of $ per share (the mid-point of the price range set forth on the cover page of this prospectus) and after deducting underwriting discounts and commissions and estimated offering expenses payable by us of $ million. We will not receive any proceeds from the sale of Class A common stock by the selling stockholder participating in this offering. The selling stockholder will receive all of the net proceeds from the sale of its shares of Class A common stock in this offering. |
| We intend to use the net proceeds from the sale of our Class A common stock in this offering for general corporate purposes and strategic growth opportunities, including potential acquisitions. The net proceeds the selling stockholder receives from this offering will be distributed to the individuals, including William Manning, on whose behalf the selling stockholder is selling shares of our Class A common stock in this offering. See “Use of Proceeds.” |
| Risk factors |
See “Risk Factors” on page 16 of this prospectus for a discussion of factors you should carefully consider before deciding to invest in our Class A common stock. |
| Voting rights |
One vote per share of Class A common stock. The holder of our Class B common stock will control a majority of the vote on all matters submitted to a vote of stockholders. |
| Dividend policy |
Upon the completion of this offering, we will have no material assets other than our ownership of Class A units of Manning & Napier Group. Accordingly, our ability to pay dividends will depend on distributions from Manning & Napier Group. We intend to cause Manning & Napier Group to make distributions to us with available |
10
Table of Contents
| cash generated from its subsidiaries’ operations in an amount sufficient to cover any dividends we may pay. If Manning & Napier Group makes such distributions, any other holders of its units will be entitled to receive equivalent distributions on a pro rata basis. |
| The declaration and payment of all future dividends, if any, will be at the sole discretion of our board of directors. In determining the amount of any future dividends, our board of directors will take into account: |
| • | the financial results of Manning & Napier Group; |
| • | our available cash, as well as anticipated cash requirements, including any debt servicing; |
| • | our capital requirements and the capital requirements of our subsidiaries, including Manning & Napier Group; |
| • | contractual, legal, tax and regulatory restrictions on, and implications of, the payment of dividends by us to our stockholders or by Manning & Napier Group to us, including the obligation of Manning & Napier Group to make tax distributions to its unitholders, including us; |
| • | general economic and business conditions; and |
| • | any other factors that our board of directors may deem relevant. |
| Following this offering, we intend to pay quarterly cash dividends. We expect that our first dividend will be paid in the quarter of and will be approximately $ per share of our Class A common stock. However, there is no assurance that sufficient cash will be available to pay any such dividends. See “Dividend Policy.” |
| Listing symbol |
“MN” |
The number of shares of our Class A common stock to be outstanding after the completion of this offering excludes shares of Class A common stock reserved for issuance upon the exchange of units of Manning & Napier Group held by or that may be granted to M&N Group Holdings.
Unless otherwise indicated, all information in this prospectus assumes and reflects:
| • | an initial public offering price of $ per share, the mid-point of the estimated initial public offering price range set forth on the cover page of this prospectus; and |
| • | no exercise by the underwriters of their right to purchase up to an aggregate of additional shares to cover overallotments, if any. |
11
Table of Contents
Summary Selected Historical and Pro Forma Combined Consolidated Financial Data
The following tables set forth summary selected historical combined consolidated financial data of the Manning & Napier Companies as of the dates and for the periods indicated. The summary selected combined consolidated statements of income data for the years ended December 31, 2008, 2009 and 2010, and the summary selected combined consolidated statements of financial condition data as of December 31, 2009 and 2010 have been derived from the Manning & Napier Companies’ audited combined consolidated financial statements included elsewhere in this prospectus. The summary selected combined consolidated statements of income data for the three months ended March 31, 2010 and 2011 and the summary selected combined consolidated statement of financial condition as of March 31, 2011 have been derived from the Manning & Napier Companies’ unaudited combined consolidated financial statements included elsewhere in this prospectus. These unaudited combined consolidated financial statements have been prepared on substantially the same basis as our audited combined consolidated financial statements and include all adjustments that we consider necessary for a fair statement of our combined consolidated statements of income and financial condition for the periods and as of the dates presented therein. Our results for the three months ended March 31, 2011 are not necessarily indicative of our results for a full fiscal year.
The following table also presents the summary selected unaudited pro forma combined consolidated financial data of Manning & Napier, to give effect to all of the transactions described under “Unaudited Pro Forma Combined Consolidated Financial Information,” including the reorganization transactions and this offering. You should read the following summary selected historical combined consolidated financial data of the Manning & Napier Companies and the unaudited pro forma financial information of Manning & Napier together with “Our Structure and Reorganization,” “Unaudited Pro Forma Combined Consolidated Financial Information,” “Management’s Discussion and Analysis of Financial Condition and Results of Operations” and the historical combined consolidated financial statements and related notes included elsewhere in this prospectus.
12
Table of Contents
| Manning & Napier Companies | Manning & Napier, Inc. | |||||||||||||||||||||||||||
| Year Ended December 31, |
Three Months Ended March 31, |
Pro
Forma Year Ended December 31, |
Pro Forma Three Months Ended March 31, |
|||||||||||||||||||||||||
| 2008 | 2009 | 2010 | 2010 | 2011 | 2010 | 2011 | ||||||||||||||||||||||
| (unaudited) | (unaudited) | |||||||||||||||||||||||||||
| (in millions, except per share data) | ||||||||||||||||||||||||||||
| Statements of income data: |
||||||||||||||||||||||||||||
| Operating revenues |
||||||||||||||||||||||||||||
| Investment management services revenues |
$ | 145.6 | $ | 162.7 | $ | 255.5 | $ | 57.2 | $ | 78.0 | $ | $ | ||||||||||||||||
| Total operating revenues |
145.6 | 162.7 | 255.5 | 57.2 | 78.0 | |||||||||||||||||||||||
| Operating expenses |
||||||||||||||||||||||||||||
| Compensation and related costs |
46.3 | 55.6 | 78.4 | 16.8 | 22.9 | (1) | (1) | |||||||||||||||||||||
| Sub-transfer agent and shareholder service costs |
13.1 | 19.9 | 36.8 | 8.5 | 11.7 | |||||||||||||||||||||||
| Other operating costs |
20.7 | 22.3 | 25.3 | 5.8 | 6.2 | |||||||||||||||||||||||
| Total operating expenses |
80.1 | 97.8 | 140.5 | 31.1 | 40.8 | |||||||||||||||||||||||
| Total operating income |
65.5 | 64.9 | 115.0 | 26.1 | 37.2 | |||||||||||||||||||||||
| Non-operating income (loss) |
||||||||||||||||||||||||||||
| Interest expense on shares subject to mandatory redemption (2) |
(6.7 | ) | (10.0 | ) | (61.2 | ) | (16.2 | ) | (13.3 | ) | ||||||||||||||||||
| Interest expense |
(0.1 | ) | — | (0.1 | ) | — | — | |||||||||||||||||||||
| Interest and dividend income |
0.6 | 0.1 | 0.1 | — | — | |||||||||||||||||||||||
| Net capital gains (losses) on investments |
0.1 | (0.2 | ) | — | — | — | ||||||||||||||||||||||
| Total non-operating income (loss) |
(6.1 | ) | (10.1 | ) | (61.2 | ) | (16.2 | ) | (13.3 | ) | ||||||||||||||||||
| Income before provision for income taxes |
59.4 | 54.8 | 53.8 | 9.9 | 23.9 | |||||||||||||||||||||||
| Provision for income taxes |
0.4 | 0.4 | 0.7 | 0.2 | 0.2 | |||||||||||||||||||||||
| Net income |
$ | 59.0 | $ | 54.4 | $ | 53.1 | $ | 9.7 | $ | 23.7 | $ | $ | ||||||||||||||||
| Less: net income attributable to noncontrolling interests |
||||||||||||||||||||||||||||
| Net income attributable to Manning & Napier, Inc. |
||||||||||||||||||||||||||||
| Per share data: |
||||||||||||||||||||||||||||
| Net income per share |
||||||||||||||||||||||||||||
| Weighted average shares used in basic and diluted net income per share |
||||||||||||||||||||||||||||
| (1) | In connection with the reorganization transactions, certain of the Manning & Napier Companies will modify the vesting terms related to the current ownership interests of our employees, including our named executive officers, other than William Manning. Such individuals will be entitled to 15% of their ownership interests upon the consummation of this offering, and 15% of their ownership interests over the subsequent three years. The remaining ownership interests will be subject to performance-based vesting over such three year period (subject to an initial two-year lockup period and other selling restrictions), to be determined by a vesting committee of MNA. Such new vesting terms will not result in dilution to the number of outstanding shares of our Class A common stock. As a result of such vesting requirements, we will recognize non-cash compensation charges through 2014. |
| (2) | Within interest expense, we have recognized expenses related to a mandatory redemption obligation upon the death of William Manning to pay a formula-driven amount to his estate. Our liability related to this mandatory redemption obligation was calculated each fiscal quarter, and the change in the liability was reflected as non-cash interest expense. Such mandatory redemption obligation will terminate immediately prior to the consummation of this offering and we will no longer reflect non-cash interest expense or the liability related to such obligations. |
13
Table of Contents
| Manning & Napier Companies |
Manning & Napier, Inc. |
|||||||||||||||
| As of December 31, |
As of March 31, |
Pro Forma as of March 31, |
||||||||||||||
| 2009 | 2010 | 2011 | 2011 | |||||||||||||
| (unaudited) | (unaudited) | |||||||||||||||
| (in millions) | ||||||||||||||||
| Statements of financial condition data: |
||||||||||||||||
| Total assets |
$ | 53.4 | $ | 68.3 | $ | 90.1 | $ | |||||||||
| Shares liability subject to mandatory redemption (1) |
109.1 | 170.3 | 183.6 | |||||||||||||
| Total liabilities |
136.7 | 212.1 | 219.2 | |||||||||||||
| (1) | Prior to this offering, we had a mandatory redemption obligation upon the death of William Manning to pay a formula-driven amount to his estate. Our liability related to this mandatory redemption obligation was calculated each fiscal quarter, and the change in the liability was reflected as non-cash interest expense. Such mandatory redemption obligation will terminate immediately prior to the consummation of this offering and we will no longer reflect non-cash interest expense or the liability related to such obligation. |
| Manning & Napier Companies | Manning & Napier, Inc. | |||||||||||||||||||||||||||
| Year Ended December 31, | Three Months Ended March 31, |
Pro Forma Year Ended December 31, |
Pro Forma Three Months Ended March 31, |
|||||||||||||||||||||||||
| 2008 | 2009 | 2010 | 2010 | 2011 | 2010 | 2011 | ||||||||||||||||||||||
| (in millions, except per share data) | ||||||||||||||||||||||||||||
| Selected unaudited operating data: |
||||||||||||||||||||||||||||
| Assets under management (1) |
$ | 16,231.4 | $ | 28,271.3 | $ | 38,841.7 | $ | 31,192.8 | $ | 42,564.1 | $ | $ | ||||||||||||||||
| Adjusted EBITDA (2) |
66.7 | 65.8 | 116.4 | 26.4 | 37.5 | |||||||||||||||||||||||
| Economic net income (2) |
||||||||||||||||||||||||||||
| Economic net income per share |
||||||||||||||||||||||||||||
| Net client cash flows(3) |
3,099.7 | 6,698.9 | 6,464.0 | 1,917.6 | 2,036.0 | |||||||||||||||||||||||
| Market appreciation (depreciation)(4) |
(5,664.0 | ) | 5,341.0 | 4,106.4 | 1,003.9 | 1,686.4 | ||||||||||||||||||||||
| (1) | Reflects the amount of money we managed for our clients as of the last day of the period. |
| (2) | Our management uses non-GAAP financial measures to evaluate the profitability and efficiency of our business model. See page 15 of this prospectus for a reconciliation of these non-GAAP financial measures. Our non-GAAP financial measures may differ from similar measures used by other companies, even if similar terms are used to identify such measures. |
| (3) | Reflects the amount of money our clients placed with us for management, and withdrew from our management, during the period, excluding appreciation (depreciation) due to market performance and fluctuations in exchange rates. |
| (4) | Represents the appreciation (depreciation) of the value of our AUM during the period due to market performance and fluctuations in exchange rates, as well as income, such as dividends, earned on AUM. |
14
Table of Contents
Our management uses Adjusted EBITDA, economic income and economic net income as financial measures to evaluate the profitability and efficiency of our business model. Adjusted EBITDA, economic income and economic net income are not presented in accordance with GAAP. Economic income excludes from income before provision for income taxes:
| • | the non-cash interest expense associated with the liability for shares subject to mandatory redemption; and |
| • | the reorganization-related share based compensation, which results in non-cash compensation expense reported over the vesting period. |
Historically, EBITDA has included adjustments for provision for income taxes, interest income and expense and depreciation and amortization. On a pro forma basis, Adjusted EBITDA also includes an adjustment for reorganization-related share based compensation. Economic net income assumes that all of our economic income would be subject to federal, state and local income tax.
| Manning & Napier Companies | Manning & Napier, Inc. | |||||||||||||||||||||||||||
| Year Ended December 31, |
Three Months Ended March 31, |
Pro Forma Year Ended December 31, |
Pro Forma Three Months Ended March 31, |
|||||||||||||||||||||||||
| 2008 | 2009 | 2010 | 2010 | 2011 | 2010 | 2011 | ||||||||||||||||||||||
| (unaudited) | (unaudited) | |||||||||||||||||||||||||||
| (dollar amounts in million, except for per share data) | ||||||||||||||||||||||||||||
| Reconciliation of non-GAAP financial measures: |
||||||||||||||||||||||||||||
| Net income |
$ | 59.0 | $ | 54.4 | $ | 53.1 | $ | 9.7 | $ | 23.7 | $ | $ | ||||||||||||||||
| Provision for income taxes |
0.4 | 0.4 | 0.7 | 0.2 | 0.2 | |||||||||||||||||||||||
| Income before provision for income taxes |
59.4 | 54.8 | 53.8 | 9.9 | 23.9 | |||||||||||||||||||||||
| Reorganization-related share-based compensation(1) |
||||||||||||||||||||||||||||
| Interest expense on shares subject to mandatory redemption(2) |
6.7 | 10.0 | 61.2 | 16.2 | 13.3 | |||||||||||||||||||||||
| Economic income |
66.1 | 64.8 | 115.0 | 26.1 | 37.2 | |||||||||||||||||||||||
| Interest expense |
0.1 | — | 0.1 | — | — | |||||||||||||||||||||||
| Interest income |
(0.6 | ) | (0.1 | ) | (0.1 | ) | — | — | ||||||||||||||||||||
| Depreciation and amortization |
1.1 | 1.1 | 1.4 | 0.3 | 0.3 | |||||||||||||||||||||||
| Adjusted EBITDA |
$ | 66.7 | $ | 65.8 | $ | 116.4 | $ | 26.4 | $ | 37.5 | ||||||||||||||||||
| Economic income |
66.1 | 64.8 | 115.0 | 26.1 | 37.2 | |||||||||||||||||||||||
| Pro forma provision for income taxes |
||||||||||||||||||||||||||||
| Economic net income |
||||||||||||||||||||||||||||
| Economic net income per share |
||||||||||||||||||||||||||||
| Operating revenue |
$ | 145.6 | $ | 162.7 | $ | 255.5 | $ | 57.2 | $ | 78.0 | ||||||||||||||||||
| Net income margin percentage |
40.5 | % | 33.4 | % | 20.8 | % | 17.0 | % | 30.4 | % | ||||||||||||||||||
| Adjusted EBITDA margin percentage |
45.8 | % | 40.4 | % | 45.6 | % | 46.2 | % | 48.1 | % | ||||||||||||||||||
| Economic net income margin percentage |
||||||||||||||||||||||||||||
| (1) | In connection with the reorganization transactions, certain of the Manning & Napier Companies will modify the vesting terms related to the current ownership interests of our employees, including our named executive officers, other than William Manning. Such individuals will be entitled to 15% of their ownership interests upon the consummation of this offering, and 15% of their ownership interests over the subsequent three years. The remaining ownership interests will be subject to performance-based vesting over such three year period (subject to an initial two-year lockup period and other selling restrictions), to be determined by a vesting committee of MNA. Such new vesting terms will not result in dilution to the number of outstanding shares of our Class A common stock. As a result of such vesting requirements, we will recognize non-cash compensation charges through 2014. |
| (2) | Within interest expense, we have recognized expenses related to a mandatory redemption obligation upon the death of William Manning to pay a formula-driven amount to his estate. Our liability related to this mandatory redemption obligation was calculated each fiscal quarter, and the change in the liability was reflected as non-cash interest expense. Such mandatory redemption obligation will terminate immediately prior to the consummation of this offering and we will no longer reflect non-cash interest expense or the liability related to such obligation. |
15
Table of Contents
Investing in our Class A common stock involves a high degree of risk. You should carefully consider the risks described below, together with the other information contained in this prospectus, before making your decision to invest in shares of our Class A common stock. We cannot assure you that any of the events discussed in the risk factors below will not occur. These risks could have an adverse impact on our business, results of operations, financial condition and cash flows. If any of the following risks develops into an actual event, the trading price of our Class A common stock could decline, and you could lose all or part of your investment.
Risks Related to our Business
Our revenues are dependent on the market value and composition of our AUM, all of which are subject to fluctuation due to factors outside of our control.
We derive the majority of our revenue from investment management fees, typically calculated as a percentage of the market value of our AUM. As a result, our revenues are dependent on the value and composition of our AUM, all of which are subject to fluctuation due to many factors, including:
| • | Declines in prices of securities in our portfolios. The prices of the securities held in the portfolios we manage may decline due to any number of factors beyond our control, including, among others, declining stock or commodities markets, a general economic downturn, political uncertainty or acts of terrorism. |
| • | Redemptions and other withdrawals. Our investors generally may withdraw their funds at any time, on very short notice and without any significant penalty. A substantial portion of our revenue is derived from investment advisory agreements that are terminable by clients upon short notice or no notice and investors in the mutual funds we advise can redeem their investments in those funds at any time without prior notice. Our growth in AUM in recent years has included new clients and portfolios that may not have the same client retention characteristics as we have experienced in the past. In addition, in a declining stock market, the pace of redemptions could accelerate. |
| • | Investment performance. If our portfolios perform poorly as compared with our competitors or applicable third-party benchmarks, or the rankings of mutual funds we manage decline, we may lose existing AUM and have difficulty attracting new assets. |
| • | Declines in fixed income markets. For fixed income investments, the value of our AUM may decline as a result of changes in interest rates, available liquidity in the markets in which a security trades, an issuer’s actual or perceived creditworthiness, or an issuer’s ability to meet its obligations. |
If any of these factors cause a decline in our AUM, it would result in lower investment management fees. If our revenues decline without a commensurate reduction in our expenses, our net income will be reduced and our business will be adversely affected.
The loss of key investment professionals or members of our senior management team could have an adverse effect on our business.
We depend on the skills and expertise of qualified investment professionals and our success depends on our ability to retain key employees, including members of our senior management team. Our investment professionals possess substantial experience in investing and have been primarily responsible for the historically strong investment performance we have achieved. We particularly depend on our Senior Research Group, which is a team of ten senior analysts who manage our portfolios, and our executive management team, which is a group of five individuals led by Patrick Cunningham, our chief executive officer. The loss of any of these key individuals could limit our ability to successfully execute our business strategy and could have an adverse effect on our business.
16
Table of Contents
Any of our investment or management professionals may resign at any time, subject to various covenants not to compete with us. In addition, employee-owners are subject to additional covenants not to compete. We do not carry any key man insurance on any employees at this time.
Competition for qualified investment, management, marketing and client service professionals is intense and we may fail to successfully attract and retain qualified personnel in the future. Our ability to attract and retain these personnel will depend heavily on the amount and structure of compensation and opportunities for equity ownership we offer. In connection with our transition to a public company, we intend to implement a compensation structure that uses a combination of cash and equity-based incentives as appropriate. We intend for overall compensation levels to remain commensurate with amounts paid to our named executive officers and other key employees in the past. However, our compensation may not be effective to recruit and retain the personnel we need, especially if our equity-based compensation does not return significant value to employees. Any cost-reduction initiative or adjustments or reductions to compensation could negatively impact our ability to retain key personnel. In addition, changes to our management structure, corporate culture and corporate governance arrangements, including the changes associated with, and resulting from, our reorganization and this offering, could negatively impact our ability to retain key personnel.
We derive substantially all of our revenues from contracts and relationships that may be terminated upon short or no notice.
We derive substantially all of our revenues from investment advisory and sub-advisor agreements, all of which are terminable by clients upon short notice or no notice and without any significant penalty. Our investment management agreements with mutual funds, as required by law, are generally terminable by the funds’ board of directors or a vote of the majority of the funds’ outstanding voting securities on not more than 60 days’ written notice. After an initial term, each fund’s investment management agreement must be approved and renewed annually by such fund’s board, including by its independent members. In addition, all of our separate account clients and some of the pooled investment vehicles, including mutual funds, that we sub-advise have the ability to re-allocate all or any portion of the assets that we manage away from us at any time with little or no notice. These investment management agreements and mutual fund and collective investment trust client relationships may be terminated or not renewed for any number of reasons. The decrease in revenues that could result from the termination of a material client relationship or group of client relationships could have an adverse effect on our business.
We may be required to reduce the fees we charge, which could have an adverse effect on our profit margins and results of operations.
Our current fee structure may be subject to downward pressure due to a variety of factors, including a trend in recent years toward lower fees in the investment management industry. We may be required to reduce fees with respect to both the separate accounts we manage and the mutual funds we advise. In addition, we may charge lower fees to attract future new business as compared to our existing business, which may result in us having to reduce our fees with respect to our existing business accordingly. The investment management agreements pursuant to which we advise mutual funds are terminable on short notice and, after an initial term, are subject to an annual process of review and renewal by the funds’ boards. As part of that annual review process, the fund board considers, among other things, the level of compensation that the fund has been paying us for our services, and that process may result in the renegotiation of our fee structure or increase our obligations, thus increasing the cost of our performance. Any fee reductions on existing or future new business could have an adverse effect on our profit margins and results of operations.
Several of our portfolios involve investing principally in the securities of non-U.S. companies, which involve foreign currency exchange risk, and tax, political, social and economic uncertainties and risks.
As of March 31, 2011, approximately 37% of our AUM across all of our portfolios was invested in securities of non-U.S. companies. Fluctuations in foreign currency exchange rates could negatively affect the
17
Table of Contents
returns of our clients who are invested in these strategies. In addition, an increase in the value of the U.S. dollar relative to non-U.S. currencies is likely to result in a decrease in the U.S. dollar value of our AUM, which, in turn, could result in lower revenue since we report our financial results in U.S. dollars.
Investments in non-U.S. issuers may also be affected by tax positions taken in countries or regions in which we are invested as well as political, social and economic uncertainty, particularly as a result of the recent decline in global economic conditions. Declining tax revenues may cause governments to assert their ability to tax the local gains and/or income of foreign investors (including our clients), which could adversely affect clients’ interests in investing outside their home markets. Many financial markets are not as developed, or as efficient, as the U.S. financial markets and, as a result, those markets may have limited liquidity and higher price volatility and lack established regulations. Liquidity may also be adversely affected by political or economic events, government policies, social or civil unrest within a particular country, and our ability to dispose of an investment may also be adversely affected if we increase the size of our investments in smaller non-U.S. issuers. Non-U.S. legal and regulatory environments, including financial accounting standards and practices, may also be different, and there may be less publicly available information about such companies. These risks could adversely affect the performance of our strategies that are invested in securities of non-U.S. issuers and may be particularly acute in the emerging or less developed markets in which we invest.
We derive a substantial portion of our revenues from our Core Non-U.S. Equity portfolios.
As of March 31, 2011, approximately 31% of our AUM were invested in our Core Non-U.S. Equity portfolios. As a result, a substantial portion of our operating results depends upon the performance of our Core Non-U.S. Equity portfolios, and our ability to retain client assets in such portfolios. If a significant portion of the investors in our Core Non-U.S. Equity portfolios decide to withdraw their investments or terminate their investment management agreements for any reason, including poor investment performance or adverse market conditions, our revenues from these portfolios would decline, which could have an adverse effect on our earnings and financial condition.
The investment performance and/or the growth of our AUM may be constrained if appropriate investment opportunities are not available or if we close certain of our portfolios.
Our ability to deliver strong investment performance depends in large part on our ability to identify appropriate investment opportunities in which to invest client assets. If we are unable to identify sufficient appropriate investment opportunities for existing and new client assets on a timely basis, our investment performance could be adversely affected. The risk that sufficient appropriate investment opportunities may be unavailable is influenced by a number of factors, including general market conditions, and is likely to increase as and if our AUM increases, particularly if these increases occur very rapidly.
If we determine that sufficient investment opportunities are not available for some or all of our portfolios, or we believe that in order to continue to produce attractive returns from some or all of our portfolios we should limit the growth of those strategies, as we have done in the past, we may choose to limit the growth of the portfolio by limiting the rate at which we accept additional client assets for management under the portfolio, closing the portfolio to all or substantially all new investors or otherwise taking action to limit the flow of assets into the portfolio. If we misjudge the point at which it would be optimal to limit access to or close a portfolio, the investment performance of the portfolio could be negatively impacted. In addition, if we close access to a portfolio, we may offer a new portfolio to our clients, but we cannot guarantee that such new portfolio will attract clients or perform in a manner consistent with the closed portfolio.
The significant growth we have experienced over the past nine years has been and may continue to be difficult to sustain, and we may have difficulty managing our growth effectively.
Our AUM have increased from $6.4 billion as of December 31, 2002 to $42.6 billion as of March 31, 2011. The rapid growth in our AUM represents a significant rate of growth that has been and may continue to be
18
Table of Contents
difficult to sustain. In particular, as the absolute amount of our AUM increases, it will be more difficult to maintain levels of growth similar to those we have experienced in the past. The future growth of our business will depend on, among other things:
| • | our ability to retain key investment professionals; |
| • | our ability to devote sufficient resources to maintaining existing portfolios and to selectively develop new portfolios; |
| • | our success in achieving superior investment performance from our portfolios; |
| • | our ability to maintain and extend our distribution capabilities; |
| • | our ability to deal with changing market conditions; |
| • | our ability to maintain adequate financial and business controls; and |
| • | our ability to comply with new legal and regulatory requirements arising in response to both the increased sophistication of the investment management industry and the significant market and economic events of the last few years. |
Unless our growth results in an increase in our revenues that is proportionate to the increase in our costs associated with this growth, our future profitability will be adversely affected. In addition, failure to successfully diversify into new asset classes may adversely affect our growth strategy and our future profitability.
Our portfolios may not obtain attractive returns under certain market conditions or at all.
The goal of our investment process is to provide competitive absolute returns over full market cycles. Accordingly, our portfolios may not perform well during certain periods of time or under certain market conditions as compared to benchmarks or other investment managers’ strategies, which may negatively affect our ability to retain clients and attract new clients. We are likely to be most out of favor when the markets are running on price momentum and market prices become disconnected from underlying investment fundamentals, as was the case during the late 1990s as the technology market and mega cap stocks fueled the broad market upward. During and shortly following such periods of relative under performance, we are likely to see our highest levels of client turnover, even if our absolute returns are positive. Loss of client assets and the failure to attract new clients could adversely affect our revenues and growth.
The historical returns of our existing portfolios may not be indicative of their future results or of the portfolios we may develop in the future.
We have presented the historical returns of our existing portfolios under “Business—Our Competitive Strengths—Track Record of Consistent Investment Excellence through Multiple Market Cycles.” The historical returns of our portfolios and the ratings and rankings we or the mutual funds that we advise have received in the past should not be considered indicative of the future results of these portfolios or of any other portfolios that we may develop in the future. The investment performance we achieve for our clients varies over time and the variance can be wide. The ratings and rankings we or the mutual funds we advise have received are typically revised monthly. The historical performance and ratings and rankings included in this prospectus are as of March 31, 2011 and for periods then ended except where otherwise stated. The performance we have achieved and the ratings and rankings received at subsequent dates and for subsequent periods may be higher or lower and the difference could be material. Our portfolios’ returns have benefited during some periods from investment opportunities and positive economic and market conditions. In other periods, such as in 2008 and the first quarter of 2009, general economic and market conditions have negatively affected our portfolios’ returns. These negative conditions may occur again, and in the future we may not be able to identify and invest in profitable investment opportunities within our current or future portfolios.
19
Table of Contents
We depend on third-party distribution sources to market our portfolios and access our client base.
Our ability to attract additional assets to manage is dependent on our access to third-party intermediaries. We gain access to mutual fund investors and some retail and institutional clients through third parties, including mutual fund platforms and financial intermediaries. As of March 31, 2011, the largest relationship we have with a financial intermediary represents 5% of our total AUM and the mutual fund platform representing the largest portion of our fund assets represents an additional 5.5% of our total AUM. We compensate most of the intermediaries through which we gain access to investors in our mutual funds by paying fees, most of which are based on a percentage of assets invested in our mutual funds through that intermediary and with respect to which that intermediary provides services. These distribution sources and client bases may not continue to be accessible to us on terms we consider commercially reasonable, or at all. Limiting or the total absence of such access could have an adverse effect on our results of operations. Many of these consultants review and evaluate our products and our firm from time to time. Poor reviews or evaluations of a particular product, portfolio or us as an investment management firm may result in client withdrawals or may impair our ability to attract new assets through these intermediaries. In addition, the recent economic downturn and consolidation in the broker-dealer industry may lead to reduced distribution access and increases in fees we are required to pay to intermediaries. If such increased fees should be required, refusal to pay them could restrict our access to those client bases while paying them could adversely affect our profitability.
Our efforts to establish new portfolios or new products or services may be unsuccessful and could negatively impact our results of operations and our reputation.
As part of our growth strategy, we may seek to take advantage of opportunities to develop new portfolios consistent with our philosophy of managing portfolios to meet our clients’ objectives and using a team investment approach. The costs associated with establishing a new portfolio initially likely will exceed the revenues that the portfolio generates. If any such new portfolio performs poorly or fails to attract sufficient assets to manage, our results of operations could be negatively impacted. Further, a new portfolio’s poor performance may negatively impact our reputation and the reputation of our other portfolios within the investment community. In addition, we have developed and may seek from time to time to develop new products and services to take advantage of opportunities involving technology, insurance, participant and plan sponsor education and other products beyond investment management. The development of these products and services could involve investment of financial and management resources and may not be successful in developing client relationships, which could have an adverse effect on our business. The cost to develop these products initially will likely exceed the revenue they generate. If establishing new portfolios or offering new products or services requires hiring new personnel, to the extent we are unable to recruit and retain sufficient personnel, we may not be successful in further diversifying our portfolios, client assets and business, which could have an adverse effect on our business and future prospects.
Our failure to comply with investment guidelines set by our clients, including the boards of mutual funds, and limitations imposed by applicable law, could result in damage awards against us and a loss of our AUM, either of which could adversely affect our reputation, results of operations or financial condition.
When clients retain us to manage assets on their behalf, they generally specify certain guidelines regarding investment allocation that we are required to follow in managing their portfolios. In addition, the boards of mutual funds we manage generally establish similar guidelines regarding the investment of assets in those funds. We are also required to invest the mutual funds’ assets in accordance with limitations under the U.S. Investment Company Act of 1940, as amended, or the 1940 Act, and applicable provisions of the Internal Revenue Code of 1986, as amended, or the Code. Other clients, such as plans subject to the Employee Retirement Income Security Act of 1974, as amended, or ERISA, or non-U.S. funds, require us to invest their assets in accordance with applicable law. Our failure to comply with any of these guidelines and other limitations could result in losses to clients or investors in our products which, depending on the circumstances, could result in our obligation to make clients whole for such losses. If we believed that the circumstances did not justify a
20
Table of Contents
reimbursement, or clients believed the reimbursement we offered was insufficient, clients could seek to recover damages from us, withdraw assets from our products or terminate their investment management agreement with us. Any of these events could harm our reputation and adversely affect our business.
A change of control of our company could result in termination of our investment advisory agreements.
Under the 1940 Act, each of the investment advisory agreements for Securities and Exchange Commission, or SEC, registered mutual funds that our affiliate, MNA, advises automatically terminates in the event of its assignment, as defined under the 1940 Act. If such an assignment were to occur, MNA could continue to act as adviser to any such fund only if that fund’s board of directors and stockholders approved a new investment advisory agreement, except in the case of certain of the funds that we sub-advise for which only board approval would be necessary. In addition, under the U.S. Investment Advisers Act of 1940, as amended, or the Advisors Act, each of the investment advisory agreements for the separate accounts we manage may not be assigned without the consent of the client. An assignment may occur under the 1940 Act and the Advisers Act if, among other things, MNA undergoes a change of control. If such an assignment occurs, we cannot be certain that MNA will be able to obtain the necessary approvals from the boards and stockholders of the mutual funds that it advises or the necessary consents from separate account clients.
Operational risks may disrupt our business, result in losses or limit our growth.
We are heavily dependent on the capacity and reliability of the communications, information and technology systems supporting our operations, whether developed, owned and operated by us or by third parties. Operational risks such as trading or operational errors or interruption of our financial, accounting, trading, compliance and other data processing systems, whether caused by fire, natural disaster or pandemic, power or telecommunications failure, act of terrorism or war or otherwise, could result in a disruption of our business, liability to clients, regulatory intervention or reputational damage, and thus adversely affect our business. Some types of operational risks, including, for example, trading errors, may be increased in periods of increased volatility, which can magnify the cost of an error. Although we have back-up systems in place, our back-up procedures and capabilities in the event of a failure or interruption may not be adequate, and the fact that we operate our business out of multiple physical locations may make such failures and interruptions difficult to address on a timely and adequate basis. As and if our client base, number of portfolios and/or physical locations increase, developing and maintaining our operational systems and infrastructure may become increasingly challenging, which could constrain our ability to expand our business. Any upgrades or expansions to our operations or technology to accommodate increased volumes of transactions or otherwise may require significant expenditures and may increase the probability that we will suffer system degradations and failures. In addition, if we are unsuccessful in executing any such upgrades or expansions, we may instead have to hire additional employees, which could increase operational risk due to human error. We also depend on our headquarters in Fairport, New York, where a majority of our employees, administration and technology resources are located, for the continued operation of our business. Any significant disruption to our headquarters could have an adverse effect on our business.
We depend on third-party service providers for services that are important to our business, and an interruption or cessation of such services by any such service providers could have an adverse effect on our business.
We depend on a number of service providers, including custodial and clearing firms, and vendors of communications and networking products and services. We cannot assure you that any of these providers will be able to continue to provide these services in an efficient manner or that they will be able to adequately expand their services to meet our needs. An interruption or malfunction in or the cessation of an important service by any third-party and our inability to make alternative arrangements in a timely manner, or at all, could have an adverse impact on our business, financial condition and operating results.
21
Table of Contents
Employee misconduct could expose us to significant legal liability and reputational harm.
We operate in an industry in which integrity and the confidence of our clients are of critical importance. Accordingly, if any of our employees engage in illegal or suspicious activities or other misconduct, we could be subject to regulatory sanctions and suffer serious harm to our reputation, financial condition, client relationships and ability to attract new clients. For example, our business often requires that we deal with confidential information. If our employees were to improperly use or disclose this information, even if inadvertently, we could suffer serious harm to our reputation, financial condition and current and future business relationships. It is not always possible to deter employee misconduct, and the precautions we take to detect and prevent this activity may not always be effective. In addition, the SEC recently has increased its scrutiny of the use of non-public information obtained from corporate insiders by professional investors. Misconduct by our employees, or even unsubstantiated allegations of misconduct, could result in an adverse effect on our reputation and our business.
Improper disclosure of personal data could result in liability and harm our reputation.
We and our service providers store and process personal client information. It is possible that the security controls, training and other processes over personal data may not prevent the improper disclosure of client information. Such disclosure could harm our reputation as well and subject us to liability, resulting in increased costs or loss of revenue.
Failure to properly address conflicts of interest could harm our reputation, business and results of operations.
As we expand the scope of our business and our client base, we must continue to monitor and address any conflicts between our interests and those of our clients. The SEC and other regulators have increased their scrutiny of potential conflicts of interest, and we have implemented procedures and controls that we believe are reasonably designed to address these issues. However, appropriately dealing with conflicts of interest is complex and if we fail, or appear to fail, to deal appropriately with conflicts of interest, we could face reputational damage, litigation or regulatory proceedings or penalties, any of which could adversely affect our reputation, business and results of operations.
If our techniques for managing risk are ineffective, we may be exposed to material unanticipated losses.
In order to manage the significant risks inherent in our business, we must maintain effective policies, procedures and systems that enable us to identify, monitor and control our exposure to operational, legal and reputational risks. Our risk management methods may prove to be ineffective due to their design or implementation, or as a result of the lack of adequate, accurate or timely information or otherwise. If our risk management efforts are ineffective, we could suffer losses that could have an adverse effect on our financial condition or operating results. Additionally, we could be subject to litigation, particularly from our clients, and sanctions or fines from regulators. Our techniques for managing risks in client portfolios may not fully mitigate the risk exposure in all economic or market environments, or against all types of risk, including risks that we might fail to identify or anticipate.
The cost of insuring our business is substantial and may increase.
Our insurance costs are substantial and can fluctuate significantly from year to year. In addition, certain insurance coverage may not be available or may only be available at prohibitive costs. As we renew our insurance policies, we may be subject to additional costs resulting from rising premiums, the assumption of higher deductibles or co-insurance liability and, to the extent certain of our mutual funds purchase separate director and officer or errors and omissions liability coverage, an increased risk of insurance companies disputing responsibility for joint claims. In addition, we intend to obtain additional liability insurance for our directors and officers in connection with this offering. Higher insurance costs and incurred deductibles, as with any expense, would reduce our net income.
22
Table of Contents
We may elect to pursue growth in the United States and abroad through acquisitions or joint ventures, which would expose us to risks inherent in assimilating new operations, expanding into new jurisdictions, and making non-controlling minority investments in other entities.
In order to maintain and enhance our competitive position, we may review and pursue acquisition and joint venture opportunities. We cannot assure we will identify and consummate any such transactions on acceptable terms or have sufficient resources to accomplish such a strategy. In addition, any strategic transaction can involve a number of risks, including:
| • | additional demands on our staff; |
| • | unanticipated problems regarding integration of investor account and investment security recordkeeping, operating facilities and technologies, and new employees; |
| • | adverse effects in the event acquired intangible assets or goodwill become impaired; and |
| • | the existence of liabilities or contingencies not disclosed to or otherwise known by us prior to closing such a transaction. |
Risks Related to our Industry
We are subject to extensive regulation.
We are subject to extensive regulation for our investment management business and operations, including regulation by the SEC under the 1940 Act and the Advisers Act, by the U.S. Department of Labor under ERISA, and by the Financial Industry Regulatory Authority, Inc., or FINRA. The U.S. mutual funds we advise are registered with and regulated by the SEC as investment companies under the 1940 Act. The Advisers Act imposes numerous obligations on investment advisers including record keeping, advertising and operating requirements, disclosure obligations and prohibitions on fraudulent activities. The 1940 Act imposes similar obligations, as well as additional detailed operational requirements, on registered investment companies, which must be adhered to by their investment advisers. The U.S. mutual funds that we advise and our broker-dealer subsidiary are each subject to the USA PATRIOT Act of 2001, which requires them to know certain information about their clients and to monitor their transactions for suspicious financial activities, including money laundering. The U.S. Office of Foreign Assets Control, or OFAC, has issued regulations requiring that we refrain from doing business, or allow our clients to do business through us, in certain countries or with certain organizations or individuals on a list maintained by the U.S. government. In addition, Manning & Napier Benefits, LLC is a registered insurance broker with the New York State Insurance Department and, as such, is subject to various insurance and health-related rules and regulations.
Our failure to comply with applicable laws or regulations could result in fines, censure, suspensions of personnel or other sanctions, including revocation of our registration as an investment adviser. Even if a sanction imposed against us or our personnel is small in monetary amount, the adverse publicity arising from the imposition of sanctions against us by regulators could harm our reputation, result in withdrawal by our clients from our products and impede our ability to retain clients and develop new client relationships, which may reduce our revenues.
We face the risk of significant intervention by regulatory authorities, including extended investigation and surveillance activity, adoption of costly or restrictive new regulations and judicial or administrative proceedings that may result in substantial penalties. Among other things, we could be fined or be prohibited from engaging in some of our business activities. The requirements imposed by our regulators are designed to ensure the integrity of the financial markets and to protect customers and other third parties who deal with us, and are not designed to protect our stockholders. Accordingly, these regulations often serve to limit our activities, including through net capital, customer protection and market conduct requirements.
23
Table of Contents
The regulatory environment in which we operate is subject to continual change, and regulatory developments designed to increase oversight could adversely affect our business.
The legislative and regulatory environment in which we operate has undergone significant changes in the recent past. We believe that significant regulatory changes in our industry are likely to continue on a scale that exceeds the historical pace of regulatory change, which is likely to subject industry participants to additional, more costly and generally more punitive regulation. For example, on July 21, 2010, the Dodd-Frank Wall Street Reform and Consumer Protection Act, or Dodd-Frank, was enacted. Dodd-Frank introduces considerable changes to financial industry regulation, which could impact our business in significant ways. These new laws and regulations can be expected to place greater compliance and administrative burdens on us, which likely will increase our expenses without increasing our revenues. However, many of Dodd-Frank’s provisions require the adoption of regulations by various federal agencies and departments and it is difficult to predict all of the effects Dodd-Frank may have on us until final rules have been adopted.
New laws or regulations, or changes in the enforcement of existing laws or regulations, applicable to us and our clients could adversely affect our business. Our ability to function in this environment will depend on our ability to constantly monitor and promptly react to legislative and regulatory changes. There have been a number of highly publicized regulatory inquiries that have focused on the investment management industry. These inquiries already have resulted in increased scrutiny of the industry and new rules and regulations for mutual funds and investment managers. This regulatory scrutiny may limit our ability to engage in certain activities that might be beneficial to our shareholders. Further, adverse results of regulatory investigations of mutual fund, investment advisory and financial services firms could tarnish the reputation of the financial services industry generally and mutual funds and investment advisers more specifically, causing investors to avoid further fund investments or redeem their account balances. Redemptions would decrease our AUM, which would reduce our advisory revenues and net income.
In addition, recently there has been intense public and regulatory interest in 401(k) plan fees and expenses. Lawsuits have been brought against plan sponsors and service providers charging that they breached their fiduciary duties related to such fees and expenses, and the U.S. Department of Labor has imposed substantial additional fee disclosure requirements. These developments may adversely affect our business.
Further, as a result of the recent economic downturn, acts of serious fraud in the investment management industry and perceived lapses in regulatory oversight, U.S. and non-U.S. governmental and regulatory authorities may increase regulatory oversight of our business. We may be adversely affected as a result of new or revised legislation or regulations imposed by the SEC, other U.S. governmental regulatory authorities or self-regulatory organizations that supervise the financial markets. We also may be adversely affected by changes in the interpretation or enforcement of existing laws and rules by these governmental authorities and self-regulatory organizations, as well as by U.S. courts. It is impossible to determine the extent of the impact of any new laws, regulations or initiatives that may be proposed, or whether any of the proposals will become law. Compliance with any new laws or regulations could make compliance more difficult and expensive and affect the manner in which we conduct business.
The investment management industry is intensely competitive.
The investment management industry is intensely competitive, with competition based on a variety of factors, including investment performance, investment management fee rates, continuity of investment professionals and client relationships, the quality of services provided to clients, corporate positioning and business reputation, continuity of selling arrangements with intermediaries and differentiated products. A number of factors, including the following, serve to increase our competitive risks:
| • | a number of our competitors have greater financial, technical, marketing and other resources, more comprehensive name recognition and more personnel than we do; |
| • | potential competitors have a relatively low cost of entering the investment management industry; |
24
Table of Contents
| • | the recent trend toward consolidation in the investment management industry, and the securities business in general, has served to increase the size and strength of a number of our competitors; |
| • | some investors may prefer to invest with an investment manager that is not publicly traded based on the perception that a publicly traded asset manager may focus on the manager’s own growth to the detriment of investment performance for clients; |
| • | some competitors may invest according to different investment styles or in alternative asset classes that the markets may perceive as more attractive than the portfolios we offer; |
| • | some competitors may operate in a different regulatory environment than we do, which may give them certain competitive advantages in the investment products and portfolio structures that they offer; |
| • | other industry participants, hedge funds and alternative asset managers may seek to recruit our investment professionals; and |
| • | some competitors charge lower fees for their investment services than we do. |
If we are unable to compete effectively, our revenues could be reduced and our business could be adversely affected.
The investment management industry faces substantial litigation risks, which could adversely affect our business, financial condition or results of operations or cause significant reputational harm to us.
We depend to a large extent on our network of relationships and on our reputation to attract and retain client assets. If a client is not satisfied with our services, its dissatisfaction may be more damaging to our business than client dissatisfaction would be to other types of businesses. We make investment decisions on behalf of our clients that could result in substantial losses to them. If our clients suffer significant losses, or are otherwise dissatisfied with our services, we could be subject to the risk of legal liabilities or actions alleging negligent misconduct, breach of fiduciary duty, breach of contract, unjust enrichment and/or fraud. These risks are often difficult to assess or quantify and their existence and magnitude often remain unknown for substantial periods of time, even after an action has been commenced. We may incur significant legal expenses in defending against litigation whether or not we engaged in conduct as a result of which we might be subject to legal liability. Substantial legal liability or significant regulatory action against us could adversely affect our business, financial condition or results of operations or cause significant reputational harm to us.
Catastrophic and unpredictable events could have an adverse effect on our business.
A terrorist attack, war, power failure, cyber-attack, natural disaster or other catastrophic or unpredictable event could adversely affect our future revenues, expenses and earnings by:
| • | decreasing investment valuations in, and returns on, the assets that we manage; |
| • | causing disruptions in national or global economies that decrease investor confidence and make investment products generally less attractive; |
| • | interrupting our normal business operations; |
| • | sustaining employee casualties, including loss of our key members of our senior management team or our investment team; |
| • | requiring substantial expenditures and expenses to repair, replace and restore normal business operations; and |
| • | reducing investor confidence. |
25
Table of Contents
We have a disaster recovery plan to address certain contingencies, but we cannot be assured that this plan will be sufficient in responding or ameliorating the effects of all disaster scenarios. If our employees or vendors we rely upon for support in a catastrophic event are unable to respond adequately or in a timely manner, we may lose clients resulting in a decrease in AUM which may have an adverse effect on revenues and net income.
Risks Related to Our Structure and the Reorganization
Control of a majority of the combined voting power of our capital stock by William Manning, and ownership of % of Manning & Napier Group’s ownership interests by our existing owners, including William Manning, may give rise to conflicts of interest.
Immediately after the consummation of this offering, William Manning will hold a majority of the combined voting power of our capital stock through his ownership of 100% of our outstanding Class B common stock. Accordingly, William Manning, acting alone, will have the ability to approve or disapprove substantially all transactions and other matters submitted to a vote of shareholders, including those relating to the tax receivable agreement, the exchange agreement and other material corporate transactions, such as a merger, consolidation, dissolution or sale of all or substantially all of our assets, the issuance or redemption of certain additional equity interests, and the election of directors. These voting and class approval rights may enable William Manning to consummate transactions that may not be in the best interests of holders of our Class A common stock or, conversely, prevent the consummation of transactions that may be in the best interests of holders of our Class A common stock. In addition, although he will have voting control of Manning & Napier, all of William Manning’s economic interests in us will be in the form of his indirect interests in Manning & Napier Group, the payments he may receive from Manning & Napier under the tax receivable agreement, and the proceeds he may receive as a result of M&N Group Holdings exchanging the interests attributable to him in Manning & Napier Group for cash or, at our election, shares of our Class A common stock and, in the case of exchanges for shares of our Class A common stock, from selling such Class A common stock. As a result, William Manning’s economic interests may conflict with the interests of Manning & Napier and its public stockholders.
Immediately after the reorganization transactions and the consummation of this offering, our existing owners, including William Manning, will indirectly hold, through their ownership of M&N Group Holdings, approximately % of the ownership interests in Manning & Napier Group which, as discussed elsewhere in this prospectus, is our sole source of revenue. M&N Group Holdings is an entity controlled by William Manning, who indirectly owns a total of % of the ownership interests in Manning & Napier Group, and all of the other owners of interests in M&N Group Holdings are current employees of ours, including our executive officers. The interests of these existing owners may conflict with our interests and the interests of the holders of our Class A common stock. Decisions of our existing owners with respect to Manning & Napier Group, including those relating to the tax receivable agreement, the exchange agreement and the structuring of future transactions, may take into consideration these existing owners’ tax or other considerations even where no similar benefit would accrue to us or the holders of our Class A common stock.
We will recognize substantial non-cash compensation expense through 2014, which is likely to cause our net income to be negative for 2011 and 2012.
In connection with the reorganization transactions, certain of the Manning & Napier Companies will amend and restate their shareholders’ agreements, pursuant to which, among other things, the vesting terms related to the current ownership interests of our employees, including our named executive officers, other than William Manning, will be amended. As a result, we will be required to recognize substantial non-cash compensation expense in each year through 2014. Further, additional ownership interests will be granted to William Manning in connection with the reorganization transactions. As a result, we will be required to recognize a one-time non-cash compensation expense equal to approximately $ million in 2011. These expenses will significantly reduce our reported GAAP net income for those years, and it is likely that our net income for 2011 and 2012 will be negative as a result. See “Our Structure and Reorganization—Agreement with Employee Minority Shareholders.”
26
Table of Contents
Because we are a “controlled company” within the meaning of the listing rules, our board of directors is not required to consist of a majority of independent directors, and you may not have the same protections afforded to stockholders of companies that are subject to all of the corporate governance requirements of the . William Manning will have a controlling influence over our board, and the interests of William Manning may conflict with the interests of our other stockholders.
Because William Manning will hold a majority of the combined voting power of our capital stock through his ownership of 100% of our outstanding Class B common stock, we will be considered a “controlled company” for the purposes of the listing requirements. As such, we are permitted to, and may, opt out of the corporate governance requirements that our board of directors, our compensation committee and our nominating and corporate governance committee meet the standard of independence established by . As a result, our board of directors and compensation committee may have more directors who do not meet the independence standards than they would if those standards were to apply. In particular, so long as we are a “controlled company,” we will be exempt from the rule that requires that a board be comprised of a majority of “independent directors.” Further, William Manning will have a controlling influence over our board, as William Manning will have sufficient voting power to elect the entire board, and our certificate of incorporation permits stockholders to remove directors at any time with or without cause. In addition, although we have established a nominating and corporate governance committee, we may opt out of the ’s requirement that such committee contain independent directors. You will not have the same protections afforded to stockholders of companies that are subject to all of the corporate governance requirements of the , and circumstances may occur in which the interests of William Manning could conflict with the interests of our other stockholders.
Our ability to pay regular dividends to our stockholders is subject to the discretion of our board of directors and may be limited by our structure and applicable provisions of Delaware law.
Following completion of this offering, we intend to declare cash dividends on our Class A common stock as described in “Dividend Policy.” However, our board of directors may, in its sole discretion, change the amount or frequency of dividends or discontinue the payment of dividends entirely. In addition, because of our structure, we will be dependent upon the ability of our subsidiaries to generate earnings and cash flows and distribute them to us so that we may pay dividends to our stockholders. We expect to cause Manning & Napier Group to make distributions to its members, including us, in an amount sufficient for us to pay dividends. However, its ability to make such distributions will be subject to its and its subsidiaries’ operating results, cash requirements and financial condition, the applicable laws of the State of Delaware, which may limit the amount of funds available for distribution, and its compliance with covenants and financial ratios related to any indebtedness it has or may incur in the future. As a consequence of these various limitations and restrictions, we may not be able to make, or may have to reduce or eliminate, the payment of dividends on our Class A common stock. Any change in the level of our dividends or the suspension of the payment thereof could adversely affect the market price of our Class A common stock.
We will depend on distributions from Manning & Napier Group to pay taxes and expenses, including payments under the tax receivable agreement, but Manning & Napier Group’s ability to make such distributions will be subject to various limitations and restrictions.
Upon the consummation of this offering, we will use all of the net proceeds we receive from this offering to purchase Class A units in Manning & Napier Group. Accordingly, upon the consummation of this offering, we will have no material assets other than our ownership of Class A units of Manning & Napier Group and will have no independent means of generating revenue. Manning & Napier Group will be treated as a partnership for U.S. federal income tax purposes and, as such, will not be subject to U.S. federal income tax. Instead, taxable income will be allocated to holders of its units, including us. Accordingly, we will incur income taxes on our allocable share of any net taxable income of Manning & Napier Group. Under the terms of its amended and restated limited liability company operating agreement, Manning & Napier Group will be obligated to make tax distributions to holders of its units, including us. In addition to tax expenses, we also will incur
27
Table of Contents
expenses related to our operations, including expenses under the tax receivable agreement, which we expect will be significant. We intend, as its managing member, to cause Manning & Napier Group to make distributions in an amount sufficient to allow us to pay our taxes and operating expenses, including any payments due under the tax receivable agreement. However, Manning & Napier Group’s ability to make such distributions will be subject to various limitations and restrictions. If we do not have sufficient funds to pay tax or other liabilities to fund our operations, we may have to borrow funds, which could adversely affect our liquidity and financial condition and subject us to various restrictions imposed by any such lenders. To the extent that we are unable to make payments under the tax receivable agreement for any reason, such payments will be deferred and will accrue interest until paid.
We will be required to pay holders of units of Manning & Napier Group for certain tax benefits we may claim as a result of the tax basis step up we realize in connection with the future purchases or exchanges of those units for shares of our Class A common stock, and the amounts we may pay could be significant.
Our existing owners will hold a substantial portion of the ownership interests in Manning & Napier Group after the reorganization transactions and the consummation of this offering. Any future purchases or exchanges of their units of Manning & Napier Group for cash or, at our election, shares of our Class A common stock are expected to produce favorable tax attributes for us. When we acquire such units from existing holders, both the existing basis and the anticipated basis adjustments are likely to increase, for tax purposes, depreciation and amortization deductions allocable to us from Manning & Napier Group and therefore reduce the amount of income tax we would otherwise be required to pay in the future. This increase in tax basis may also decrease gain, or increase loss, on future dispositions of certain capital assets to the extent the increased tax basis is allocated to those capital assets.
Simultaneously with this offering, we will enter into a tax receivable agreement with the other holder of Class A units of Manning & Napier Group, pursuant to which we will be required to pay to such holders of such Class A units 85% of the applicable cash savings, if any, in U.S. federal, state, local and foreign income tax that we actually realize, or are deemed to realize in certain circumstances, in periods after this offering as a result of any step-up in tax basis in Manning & Napier Group’s assets resulting from (i) our purchases or exchanges of such Class A units for cash or, at our election, shares of our Class A common stock (including the purchases or exchanges of Class A units in connection with the reorganization transactions) and (ii) payments under the tax receivable agreement, including any tax benefits related to imputed interest deemed to be paid by us as a result of such agreement.
We expect that the payments we will be required to make under the tax receivable agreement will be substantial. Assuming no material changes in the relevant tax law, that the exchange of Class A units would result in depreciable or amortizable basis and that we earn sufficient taxable income to realize all tax benefits that are subject to the tax receivable agreement, we expect that the reduction in tax payments for us associated with the purchase or exchange of all of the Class A units held by M&N Group Holdings would aggregate approximately $ over a 15-year period based on an assumed price of $ per share of our Class A common stock (the mid-point of the estimated initial public offering price range set forth on the cover page of this prospectus). Under such scenario, we would be required to pay the holders of such Class A units 85% of such amount, or $ , over the same 15-year period. The actual amounts may materially differ from these hypothetical amounts, as potential future reductions in tax payments for us and tax receivable agreement payments by us will be calculated using the market value of our Class A common stock and the prevailing tax rates at the time of purchase or exchange and will be dependent on us generating sufficient future taxable income to realize the benefit. In general, increases in the market value of our shares or in prevailing tax rates will increase the amounts we pay under the tax receivable agreement. See “Our Structure and Reorganization—Offering Transactions—Tax Receivable Agreement.”
The actual increase in tax basis, as well as the amount and timing of any payments under the tax receivable agreement, will vary depending upon a number of factors, including:
| • | the timing of exchanges by the holders of units of Manning & Napier Group, the number of units exchanged, or the price of our Class A common stock, as the case may be, at the time of the exchange; |
28
Table of Contents
| • | the amount and timing of the taxable income we generate in the future and the tax rate then applicable; and |
| • | the portion of our payments under the tax receivable agreement constituting imputed interest and whether the purchases or exchanges result in depreciable or amortizable basis. |
There is a possibility that not all of the 85% of the applicable cash savings will be paid to the exchanging holder of Class A units at the time described above. If we determine that all or a portion of such applicable tax savings is in doubt, we will pay to the holders of such Class A units the amount attributable to the portion of the applicable tax savings that we determine is not in doubt and pay the remainder at such time as we determine the actual tax savings or that the amount is no longer in doubt.
Payments under the tax receivable agreement, if any, will be made pro rata among all tax receivable agreement holders entitled to payments on an annual basis to the extent we have sufficient taxable income to utilize the increased depreciation and amortization charges. The availability of sufficient taxable income to utilize the increased depreciation and amortization expense will not be determined until such time as the financial results for the year in question are known and tax estimates prepared, which typically occurs within 90 days after the end of the applicable taxable year.
In certain cases, payments under the tax receivable agreement to holders of Manning & Napier Group units may be accelerated and/or significantly exceed the actual benefits we realize in respect of the tax attributes subject to the tax receivable agreement.
The tax receivable agreement provides that upon certain mergers, asset sales, other forms of business combinations or other changes of control, or if, at any time, we elect an early termination of the tax receivable agreement, our, or our successor’s, obligations under the tax receivable agreement with respect to all Class A units of Manning & Napier Group, whether or not such units have been exchanged or acquired before or after such transaction, would be based on certain assumptions, including that we would have sufficient taxable income to fully utilize the deductions arising from the increased tax deductions and tax basis and other benefits related to entering into the tax receivable agreement. As a result, (i) we could be required to make payments under the tax receivable agreement that are greater than or less than the specified percentage of the actual benefits we realize in respect of the tax attributes subject to the tax receivable agreement and (ii) if we elect to terminate the tax receivable agreement early, we would be required to make an immediate payment equal to the present value of the anticipated future tax benefits, which payment may be made significantly in advance of the actual realization of such future benefits. In these situations, our obligations under the tax receivable agreement could have a substantial negative impact on our liquidity and could have the effect of delaying, deferring or preventing certain mergers, asset sales, other forms of business combinations or other changes of control. There can be no assurance that we will be able to finance our obligations under the tax receivable agreement. If we were to elect to terminate the tax receivable agreement immediately after this offering, based on an assumed price of $ per share of our Class A common stock (the mid-point of the estimated initial public offering price range set forth on the cover page of this prospectus), we estimate that we would be required to pay $ in the aggregate under the tax receivable agreement. See “Our Structure and Reorganization—Offering Transactions—Tax Receivable Agreement.”
If we were deemed an investment company under the 1940 Act as a result of our ownership of Manning & Napier Group, applicable restrictions could make it impractical for us to continue our business as contemplated and could have an adverse effect on our business.
We do not believe that we are an “investment company” under the 1940 Act. Because we, as the sole managing member of Manning & Napier Group, control the management of and operate Manning & Napier Group, we believe that our interest in Manning & Napier Group is not an “investment security” as such term is used in the 1940 Act. If we were to cease participation in the management of Manning & Napier Group or not be deemed to control Manning & Napier Group, our interest in Manning & Napier Group could be deemed an
29
Table of Contents
“investment security” for purposes of the 1940 Act. A person may be an “investment company” if it owns investment securities having a value exceeding 40% of the value of its total assets (exclusive of U.S. government securities and cash items). Upon consummation of this offering, our sole asset will be our equity investment in Manning & Napier Group. A determination that such investment is an investment security could cause us to be deemed an investment company under the 1940 Act and to become subject to the registration and other requirements of the 1940 Act. In addition, we do not believe that we are an investment company under Section 3(b)(1) of the 1940 Act because we are not primarily engaged in a business that causes us to fall within the definition of “investment company.” The 1940 Act and the rules thereunder contain detailed prescriptions for the organization and operations of investment companies. Among other things, the 1940 Act and the rules thereunder limit or prohibit transactions with affiliates, impose limitations on the issuance of debt and equity securities, prohibit the issuance of stock options, and impose certain governance requirements. We and Manning & Napier Group intend to conduct our operations so that we will not be deemed an investment company. However, if we nevertheless were to be deemed an investment company, restrictions imposed by the 1940 Act, including limitations on our capital structure and our ability to transact with affiliates, could make it impractical for us to continue our business as contemplated and could have an adverse effect on our business, financial condition and results of operations.
Risks Related to our Class A Common Stock and this Offering
There is no existing market for our Class A common stock, and we do not know if one will develop, to provide you with adequate liquidity.
Prior to this offering, there has not been a public market for our Class A common stock and we cannot predict the extent to which investor interest in us will lead to the development of an active trading market on the national securities exchange on which we list, or otherwise, or how liquid that market might become. If an active trading market does not develop, you may have difficulty selling your shares of Class A common stock at an attractive price, or at all. The initial public offering price for our Class A common stock will be determined by negotiations between us and the representative of the underwriters and may not be indicative of prices that will prevail in the open market following this offering. Accordingly, you may not be able to resell shares of our Class A common stock at prices equal to or greater than the price you paid in this offering and you may suffer a loss on your investment.
The market price and trading volume of our Class A common stock may be volatile, and your investment in our Class A common stock could suffer a decline in value.
The stock markets have experienced extreme price and volume fluctuations that have affected and continue to affect the market prices of equity securities of many companies. These fluctuations have often been unrelated or disproportionate to the operating performance of those companies. These broad market and industry fluctuations, as well as general economic, political and market conditions such as recessions, interest rate changes or international currency fluctuations, may negatively affect the market price of our Class A common stock. If the market price of our Class A common stock after this offering does not exceed the initial public offering price, you may not realize any return on your investment in us and may lose some or all of your investment.
Some of the factors that could negatively affect the price of our Class A common stock, or result in fluctuations in the price or trading volume of our Class A common stock, include:
| • | actual or anticipated variations in our quarterly operating results; |
| • | failure to meet the market’s earnings expectations; |
| • | publication of research reports about us or the investment management industry, or the failure of securities analysts to cover our Class A common stock after this offering; |
| • | departures of any members of our senior management team or additions or departures of other key personnel; |
| • | adverse market reaction to any indebtedness we may incur or securities we may issue in the future; |
30
Table of Contents
| • | changes in market valuations of similar companies; |
| • | actual or anticipated poor performance in one or more of the portfolios we offer; |
| • | changes or proposed changes in laws or regulations, or differing interpretations thereof, affecting our business, or enforcement of these laws and regulations, or announcements relating to these matters; |
| • | adverse publicity about the investment management industry generally, or particular scandals, specifically; |
| • | litigation and governmental investigations; |
| • | enforcement by us or our competitors of significant acquisitions, strategic partnerships or divestitures; |
| • | actions by stockholders; |
| • | conversion or exchange of units of Manning & Napier Group for shares of our Class A common stock or the expectation that such conversions or exchanges may occur; and |
| • | general market and economic conditions. |
Future sales of our Class A common stock in the public market or perceptions that such sales may occur could lower our stock price, and any additional capital raised by us through the sale of equity or securities convertible into equity may dilute your ownership in us.
The market price of our Class A common stock could decline as a result of sales of a large number of shares of our Class A common stock available for sale after completion of this offering, or the perception that such sales could occur. These sales, or the possibility that these sales may occur, also may make it more difficult for us to raise additional capital by selling equity securities in the future, at a time and price that we deem appropriate.
After the consummation of this offering, we will have shares of Class A common stock outstanding. Of our outstanding shares, and excluding the shares offered hereby by the selling stockholder, , or %, will be restricted from immediate resale under the “lock-up” agreements between us and all of our directors, officers and stockholders and the underwriters described in the section entitled “Underwriting” herein, but may be sold into the market after those “lock-up” restrictions expire, in certain limited circumstances as set forth in the “lock-up” agreements, or if they are waived by Merrill Lynch Pierce, Fenner & Smith, Incorporated, in its discretion. The outstanding shares subject to the “lock-up” restrictions will generally become available for sale following the expiration of the lock-up agreements, which is 180 days after the date of this prospectus, subject to the volume limitations and manner-of-sale requirements under Rule 144 of the Securities Act of 1933, as amended, or the Securities Act. In addition, pursuant to the terms of an exchange agreement that we will enter into with M&N Group Holdings, the direct holder of units of Manning & Napier Group, subject to certain restrictions set forth therein and as described elsewhere in this prospectus, M&N Group Holdings will be entitled to exchange such units for an aggregate of up to shares of our Class A common stock, subject to customary adjustments. In addition, the holders of any units of Manning & Napier Group issued subsequent to this offering will also become parties to the exchange agreement and such units, pursuant to the terms of the exchange agreement, will also be exchangeable for shares of our Class A common stock. We will also enter into a registration rights agreement pursuant to which the shares of Class A common stock issued upon such exchanges will be eligible for resale, subject to certain limitations set forth therein. See “Our Structure and Reorganization—Offering Transactions—Exchange Agreement.”
31
Table of Contents
We cannot predict the size of future issuances of our Class A common stock or the effect, if any, that future issuances and sales of shares of our Class A common stock may have on the market price of our Class A common stock. Sales or distributions of substantial amounts of our Class A common stock, including shares issued in connection with an acquisition, or the perception that such sales or distributions could occur, may cause the market price of our Class A common stock to decline.
The disparity in the voting rights among the classes of our capital stock may have a potential adverse effect on the price of our Class A common stock.
Each share of our Class A common stock will entitle its holder to one vote on all matters to be voted on by stockholders generally, while the holder of our Class B common stock will control a majority of the vote on all matters submitted to a vote of all stockholders. The difference in voting rights could adversely affect the value of our Class A common stock if, for example, investors view, or any potential future purchaser of our company views, the superior voting rights of the Class B common stock to have value or to delay or deter a change of control.
You will suffer immediate and substantial dilution and may experience additional dilution in the future, including as a result of the issuance of Class A units of Manning & Napier Group in connection with future acquisitions.
We expect that the initial public offering price per share of our Class A common stock will be substantially higher than the pro forma net tangible book value per share of our Class A common stock immediately after this offering, as well as after giving effect to the potential exchange of all outstanding units of Manning & Napier Group for shares of our Class A common stock. As a result, you will pay a price per share that substantially exceeds the per share book value of our assets after subtracting our liabilities. At an offering price of $ (the mid-point of the estimated initial public offering price range set forth on the cover page of this prospectus), you will incur immediate and substantial dilution in an amount of $ per share of our Class A common stock.
In addition, we may issue shares of our Class A common stock or units of Manning & Napier Group in connection with future acquisitions or grants under the 2011 Plan. If we grant exchange rights with respect to the issuance of the units of Manning & Napier Group that allow its holder to exchange such units for shares of our Class A common stock, you will incur dilution in the percentage of the issued and outstanding shares of Class A common stock that you own at such time.
We have broad discretion in the use of the net proceeds to us from this offering and may not use them in a manner in which our stockholders would consider appropriate.
We cannot specify with certainty the particular uses of the net proceeds that we will receive from this offering. Our management will have broad discretion in the application of the net proceeds, including for any of the purposes described under the heading “Use of Proceeds” included elsewhere in this prospectus. Our stockholders may not agree with the manner in which our management chooses to allocate and spend the net proceeds. The failure by our management to apply these funds effectively could have an adverse effect on our business. Pending their use, we may invest the net proceeds from this offering in a manner that does not produce income or that loses value.
Fulfilling our public company financial reporting and other regulatory obligations will be expensive and time consuming, may strain our resources and if we fail to comply with such obligations, our business, operating results and stock price could be adversely affected.
As a public company, we will be subject to the reporting requirements of the Securities Exchange Act of 1934, as amended, or the Exchange Act, and will be required to implement specific corporate governance
32
Table of Contents
practices and adhere to a variety of reporting requirements under the Sarbanes-Oxley Act of 2002, or Sarbanes-Oxley, and the related rules and regulations of the SEC, as well as the rules of the national securities exchange on which we list.
In accordance with Section 404 of Sarbanes-Oxley, our management will be required to conduct an annual assessment of the effectiveness of our internal control over financial reporting and include a report on these internal controls in the annual reports on Form 10-K we will file with the SEC. In addition, we will be required to have our independent registered public accounting firm provide an opinion regarding the effectiveness of our internal controls. We expect that after the consummation of this offering, we will become an accelerated or large accelerated filer, and accordingly our annual reports, beginning with our annual report for the fiscal year ending December 31, 2012, must also contain a statement that our independent registered public accounting firm has issued an attestation report on the effectiveness of our internal control over financial reporting.
In order to achieve timely compliance with Section 404 of Sarbanes-Oxley, we have begun a process to evaluate our internal control over financial reporting. Our efforts to comply with Section 404 have resulted in, and are likely to continue to result in, significant costs, the commitment of time and operational resources and the diversion of management’s attention. If our management identifies one or more material weaknesses in our internal control over financial reporting, we will be unable to assert that our internal control over financial reporting is effective. If we are unable to assert that our internal control over financial reporting is effective, or if our independent registered public accounting firm is unable to express an opinion on the effectiveness of our internal control over financial reporting, market perception of our financial condition and the trading price of our stock may be adversely affected and customer perception of our business may suffer.
Further, the Exchange Act will require us to file annual, quarterly and current reports with respect to our business and financial condition. Compliance with these requirements will place significant additional demands on our legal, accounting and finance staff and on our accounting, financial and information systems and will increase our legal and accounting compliance costs as well as our compensation expense as we will be required to hire additional accounting, tax, finance and legal staff with the requisite technical knowledge.
As a public company we will also need to enhance our investor relations, legal and corporate communications functions. These additional efforts may strain our resources and divert management’s attention from other business concerns, which could have an adverse effect on our business, financial condition and results of operations.
Our corporate documents and Delaware law will contain provisions that could discourage, delay or prevent a change in control of our company.
Our amended and restated certificate of incorporation and amended and restated bylaws will contain provisions that may make the acquisition of our company more difficult. These provisions:
| • | authorize the issuance of undesignated preferred stock, the terms of which may be established and the shares of which may be issued without stockholder approval, and which may include super voting, special approval, dividend, or other rights or preferences superior to the rights of the holders of our Class A common stock; |
| • | prohibit stockholder action by written consent, which requires all stockholder actions to be taken at a meeting of our stockholders; |
| • | provide that the board of directors is expressly authorized to make, alter, or repeal our amended and restated bylaws; |
33
Table of Contents
| • | establish advance notice requirements for nominations for elections to our board of directors or for proposing matters that can be acted upon by stockholders at stockholder meetings; and |
| • | establish a dual class structure of our voting stock, granting the holder of our Class B common stock majority voting rights. |
These anti-takeover provisions and other provisions under Delaware law could discourage, delay or prevent a transaction involving a change in control of our company, even if doing so would benefit the holders of our Class A common stock.
Any issuance of preferred stock could make it difficult for another company to acquire us or could otherwise adversely affect holders of our Class A common stock, which could depress the price of our Class A common stock.
Upon completion of this offering, our board of directors will have the authority to issue preferred stock and to determine the preferences, limitations and relative rights of shares of preferred stock and to fix the number of shares constituting any series and the designation of such series, without any further vote or action by our stockholders. Our preferred stock could be issued with voting, liquidation, dividend and other rights superior to the rights of our Class A common stock. The potential issuance of preferred stock may delay or prevent a change in control of us, discouraging bids for our Class A common stock at a premium over the market price, and adversely affect the market price and the voting and other rights of the holders of our Class A common stock.
If securities or industry analysts do not publish research or publish inaccurate or unfavorable research about our business, our stock price and trading volume could decline.
The trading market for our Class A common stock will depend in part on the research and reports that securities or industry analysts publish about us or our business. We do not currently have and may never obtain research coverage by securities and industry analysts. If no securities or industry analysts commence coverage of our company, the trading price for our Class A common stock would be negatively impacted. If we obtain securities or industry analyst coverage and if one or more of the analysts who covers us downgrades our stock or publishes inaccurate or unfavorable research about our business, our stock price would likely decline. If one or more of these analysts ceases coverage of us or fails to publish reports on us regularly, demand for our stock could decrease, which could cause our stock price and trading volume to decline.
34
Table of Contents
This prospectus contains “forward-looking statements.” Such statements can be identified by the use of forward-looking terminology such as “believes,” “expects,” “may,” “estimates,” “will,” “should,” “intends,” “plans” or “anticipates” or the negative thereof or other variations thereon or comparable terminology, or by discussions of strategy. Readers are cautioned that any such forward-looking statements are not guarantees of future performance and may involve significant risks and uncertainties, and that actual results may vary materially from those in the forward-looking statements as a result of various factors.
Prospective investors are cautioned not to place undue reliance on forward-looking statements. All written and oral forward-looking statements attributable to us or persons acting on our behalf are qualified in their entirety by those cautionary statements. Any forward-looking statements which we make in this prospectus speak only as of the dates of such statements, and we undertake no obligation to update any such factors or to publicly announce the result of any revisions to any of the forward-looking statements contained in this prospectus to reflect future events or developments. Comparisons of results for current and any prior periods are not intended to express any future trends or indications of future performance, unless expressed as such, and should only be viewed as historical data.
Forward-looking statements include, but are not limited to, statements about:
| • | our anticipated future results of operations and operating cash flows; |
| • | our business plans and investment policies; |
| • | our competitive position and the effects of competition on our business; |
| • | potential growth opportunities available to us; |
| • | the recruitment and retention of our employees; |
| • | our expected levels of compensation for our employees and the effect of compensation on our ability to attract and retain employees; |
| • | our potential operating performance, achievements, efficiency and cost reduction efforts; |
| • | our expected tax rate; |
| • | our intention to pay dividends; |
| • | our expectation with respect to the economy, capital markets, the market for asset management services and other industry trends; |
| • | the benefits to our business resulting from the effects of the reorganization; and |
| • | the impact of future legislation and regulation, and changes in existing legislation and regulation, on our business. |
35
Table of Contents
OUR STRUCTURE AND REORGANIZATION
Structure Prior to the Reorganization Transactions
Prior to the reorganization transactions and this offering, we were a group of privately-held, affiliated companies comprising the Manning & Napier Companies. Five of these companies, Manning & Napier Advisors, Inc., Manning & Napier Advisory Advantage Corporation, Manning & Napier Investor Services, Inc., Manning & Napier Capital Company, LLC and Manning & Napier Alternative Opportunities, Inc., were majority owned by William Manning, our Chairman and controlling stockholder, with a minority interest held by 47 of our employees. Two of these companies, Manning & Napier Information Services, LLC and Perspective Partners LLC, through Manning & Napier Associates, LLC, were majority owned by William Manning, with a minority interest held by B. Reuben Auspitz, our Vice-Chairman.
Prior to this offering, we had a mandatory redemption obligation upon the death of William Manning to pay a formula-derived amount to his estate. Our liability related to this mandatory redemption obligation was calculated each fiscal quarter, and the change in the liability was reflected as a non-cash interest expense. Such mandatory obligation will terminate immediately prior to the consummation of this offering and we will no longer reflect non-cash interest expense or the liability related to such obligation. See “Management’s Discussion and Analysis of Financial Condition and Results of Operations.”
Reorganization Transactions and Post-IPO Structure
In connection with this offering, we entered into the following series of transactions to reorganize our capital structure:
| • | Each of MNA, AAC, MNBD and MNAO contributed all of its assets and liabilities to a corresponding newly formed limited liability company subsidiary in exchange for 100% of the equity interests of such new subsidiary. |
| • | MNA, AAC, MNBD, MNCC, MNAO and Manning & Napier Associates formed M&N Group Holdings and (i) each of MNA, AAC, MNBD and MNAO contributed 100% of its new subsidiary’s equity interests to M&N Group Holdings in exchange for an aggregate of Class A units of M&N Group Holdings, (ii) MNCC contributed 100% of its equity interests in Exeter Trust Company, its wholly owned subsidiary, to M&N Group Holdings in exchange for Class A units of M&N Group Holdings and (iii) Manning & Napier Associates contributed 100% of its equity interests in MNIS and PPI to M&N Group Holdings in exchange for Class A units of M&N Group Holdings. In addition, William Manning was granted Class B units of M&N Group Holdings in connection with such contributions. |
| • | Immediately following such contributions, M&N Group Holdings contributed 100% of its equity interests in such new subsidiaries, Exeter Trust Company, MNIS and PPI to Manning & Napier Group in exchange for Class A units of Manning & Napier Group. |
Pursuant to the terms of an exchange agreement between M&N Group Holdings and Manning & Napier, prior to this offering M&N Group Holdings exchanged of its Class A units of Manning & Napier Group for shares of our Class A common stock. M&N Group Holdings is selling such shares of our Class A common stock on account for William Manning and certain other persons (all of whom are our employees, including our named executive officers) in this offering. See “—Offering Transactions—Exchange Agreement” and “Principal and Selling Stockholders.”
36
Table of Contents
The diagram below depicts our organizational structure after the reorganization transactions and the consummation of this offering.
| (1) | Represents Manning & Napier Advisors, Inc., Manning & Napier Advisory Advantage Corporation, Manning & Napier Investor Services, Inc. and Manning & Napier Alternative Opportunities, Inc. |
| (2) | Represents (i) the newly formed limited liability companies which will have assets contributed by Manning & Napier Advisors, Inc., Manning & Napier Advisory Advantage Corporation, Manning & Napier Investor Services, Inc. and Manning & Napier Alternative Opportunities, Inc., and (ii) Perspective Partners LLC, Manning & Napier Information Services, LLC and Exeter Trust Company. |
Manning & Napier, Inc.
We were incorporated in Delaware on June 22, 2011. Immediately prior to the consummation of this offering, we will amend and restate our certificate of incorporation to authorize two classes of common stock, Class A common stock and Class B common stock. Our common stock will have the terms described below and, in more detail, under “Description of Capital Stock.”
Class A Common Stock
We will issue shares of Class A common stock to the public pursuant to this offering. Each share of Class A common stock will entitle its holder to one vote and economic rights in us, including rights to dividends and distributions upon liquidation.
37
Table of Contents
Class B Common Stock
Immediately prior to the consummation of this offering, we will issue shares of our Class B common stock to William Manning. The holder of our Class B common stock will control a majority of the vote on all matters submitted to a vote of stockholders, but William Manning will not have any economic rights in us by virtue of his ownership of Class B common stock, whether rights to dividends, distributions or otherwise upon liquidation.
Manning & Napier Group, LLC
Upon consummation of this offering, we will conduct all of our business activities through our principal operating subsidiary, Manning & Napier Group, and its subsidiaries. Immediately prior to the consummation of this offering, the limited liability company agreement of Manning & Napier Group will be amended and restated to reclassify the limited liability company interests held by the members as Class A units and authorize the issuance of Class B units. The amended and restated limited liability company agreement will appoint Manning & Napier, Inc. as its sole managing member. In connection with the reorganization transactions, any remaining retained earnings will be distributed to our employee-owners prior to the consummation of this offering.
Holders of Class A units and Class B units will have certain voting rights as described under “—Offering Transactions—Amended and Restated Limited Liability Company Agreement of Manning & Napier Group—Voting.” Net profits and net losses and distributions of profits of Manning & Napier Group generally will be allocated and made to its members pro rata in accordance with the number of units of Manning & Napier Group they hold. Distributions to members upon a liquidation of Manning & Napier Group will be made to its members pro rata in proportion to their capital account balances, subject to the claims of creditors and the rights of all members to their proportionate shares of undistributed profits. The balance of each member’s capital account as a percentage of the aggregate capital account balances of all members will generally correspond to that member’s respective percentage interest in the profits of Manning & Napier Group.
Upon the consummation of this offering, Manning & Napier will contribute all of the net proceeds it receives from this offering to Manning & Napier Group, and Manning & Napier Group will issue to Manning & Napier a number of Class A units equal to the number of shares of Class A common stock that Manning & Napier has issued in this offering. As a result of the reorganization transactions described above, the consummation of this offering and the application of a portion of the net proceeds therefrom to purchase Class A units:
| • | we will hold Class A units, representing approximately %, of Manning & Napier Group, or Class A units, representing approximately %, if the underwriters exercise in full their option to purchase additional shares; |
| • | we will be the sole managing member of Manning & Napier Group and, as such, we will solely and exclusively manage the business, property and affairs of Manning & Napier Group; |
| • | M&N Group Holdings will hold the remaining Class A units, representing approximately %, of Manning & Napier Group, or Class A units, representing approximately %, if the underwriters exercise in full their option to purchase additional shares; |
| • | through their ownership of our Class A common stock, public stockholders will collectively have approximately % of the voting power in Manning & Napier, or approximately % if the underwriters exercise in full their option to purchase additional shares; |
| • | through his ownership of 100% of our outstanding Class B common stock, William Manning will hold a majority of the combined voting power in Manning & Napier; and |
38
Table of Contents
| • | through his indirect ownership of Class A and Class B units of M&N Group Holdings, William Manning will hold approximately % of the interests in Manning & Napier Group. |
Subject to certain restrictions set forth in the exchange agreement and described elsewhere in this prospectus, the holders of units of Manning & Napier Group will have the right to exchange such units for either cash or, at our election, shares of our Class A common stock on a one-for-one basis, subject to customary adjustments for stock splits, stock dividends and reclassifications and other similar transactions, to be determined by us in our sole discretion. As such unitholders exchange their units, we will receive a number of units, as applicable, of Manning & Napier Group either equal to the number of shares of our Class A common stock that they receive or in consideration of the cash purchase price. See “—Offering Transactions—Exchange Agreement.”
Under the terms of its amended and restated limited liability company agreement, Manning & Napier Group will be obligated to distribute to us, the holders of Class A units and the holders of Class B units cash payments for the purposes of funding tax obligations in respect of the taxable income and net capital gain that is allocated to us, the holders of Class A units and the holders of Class B units, respectively, as members of Manning & Napier Group. The amounts available to Manning & Napier Group for distributions to us for the payment of dividends will be determined after Manning & Napier Group has made distributions for purposes of funding any such tax obligations. The determination to pay dividends, if any, to the holders of our Class A common stock out of any distributions we receive from Manning & Napier Group with respect to our Class A units will be made by our board of directors. If our board of directors exercises its discretion not to authorize the payment of dividends to the holders of our Class A common stock, the holders of our Class A common stock would not receive dividend distributions relating to our pro rata share of the income earned by Manning & Napier Group, even if Manning & Napier Group makes such distributions to us. See “Dividend Policy.”
Equity Ownership Interests
In connection with the reorganization transactions, additional ownership interests in M&N Group Holdings will be granted to William Manning. In addition, certain of the Manning & Napier Companies will amend and restate their respective shareholders’ agreements, pursuant to which, among other things, the vesting terms related to the current ownership interests of our employees, including our named executive officers other than William Manning, will be amended. Such individuals will be entitled to 15% of their pre-reorganization ownership interests upon the consummation of this offering, and an additional 5% of such ownership interests will vest as of each of the first, second and third anniversaries of the consummation of this offering, provided such individuals are employed by us as of such date (employment-based vesting). The remaining ownership interests will be subject to performance-based vesting as of each of the first, second and third anniversaries of this offering (subject to an initial two-year lockup period and other selling restrictions), to be determined by a vesting committee of MNA (performance-based vesting). Such new vesting terms will not result in dilution to the number of outstanding shares of our Class A common stock.
Notwithstanding these vesting requirements, the amended and restated shareholders’ agreements will provide that, in the event William Manning sells any portion of his interests in the Manning & Napier Companies following the consummation of this offering, our other employee-owners will have the right to sell a pro rata amount of such individuals’ ownership interest in Manning & Napier Group, and if any individual does not at such time have fully vested ownership interests sufficient to allow such participation, an amount of their ownership interests will vest to the extent necessary to allow them to participate in the pro rata sale. In addition, the board of directors of MNA has limited the aggregate sales in any calendar year by our employees, other than William Manning, of their respective interests to a number of shares equal to 1.5% (or such higher percentage as determined by the board of directors of MNA in its sole discretion) of the number of shares that would be outstanding immediately after this offering if M&N Group Holdings exchanged 100% of its units for shares of our Class A common stock. This 1.5% limit will not apply to ownership interests entitled to vest as a result of sales by William Manning as described above or to the employment-based vesting as described above.
39
Table of Contents
As a result of such vesting requirements, we will recognize non-cash compensation charges which will be fully realized by the end of 2014. We will also recognize an additional one-time non-cash compensation charge equal to approximately $ million related to the additional ownership interests that will be granted to William Manning in connection with the reorganization transactions. Assuming (i) the sale of $ shares of our Class A common stock in this offering by the selling stockholder on behalf of certain of these individuals at an assumed initial public offering price of $ per share (the mid-point of the estimated initial public offering price range set forth on the cover page of this prospectus) and (ii) the satisfaction of all vesting conditions, including any performance-based vesting, related to the interests of the minority shareholders of the Manning & Napier Companies, we estimate these non-cash compensation charges over the next four calendar years to be as follows:
| (in millions) | ||||
| 2011 |
$ | |||
| 2012 |
$ | |||
| 2013 |
$ | |||
| 2014 |
$ | |||
Offering Transactions
Exchange Agreement
Prior to the consummation of this offering, we will enter into an exchange agreement with M&N Group Holdings, the direct holder of all of the Class A units of Manning & Napier Group that are not held by us, which in the aggregate is equivalent to % of our Class A common stock on a fully diluted as-exchanged basis.
Pursuant to the terms and conditions of the exchange agreement, prior to this offering, M&N Group Holdings exchanged Class A units of Manning & Napier Group for shares of our Class A common stock, of which shares are being sold in this offering by M&N Group Holdings on behalf of William Manning and shares are being sold in this offering by M&N Group Holdings on behalf of certain of our employees, including our named executive officers.
In addition, subject to certain restrictions set forth in the exchange agreement:
| • | with respect to the Class A units and Class B units of Manning & Napier Group, which are sometimes collectively referred to herein as units, that are attributable to the interests of William Manning in M&N Group Holdings, commencing on the first anniversary of this offering, M&N Group Holdings may exchange up to 15% of such units (equivalent to shares of our Class A common stock on a fully diluted as-exchanged basis) per year on behalf of William Manning; provided, that with respect to the exchanges permitted as of the first anniversary of the consummation of this offering, the 15% limit will be reduced by the units exchanged for shares of our Class A common stock sold in this offering on his behalf; and |
| • | with respect to the Class A units of Manning & Napier Group that are attributable to the interests of the other holders of M&N Group Holdings, all of whom are our employees, including our named executive officers other than William Manning: |
| - | commencing on the first anniversary of the consummation of this offering, M&N Group Holdings may exchange up to 5% of such Class A units (equivalent to shares of our Class A common stock on a fully diluted as-exchanged basis) on behalf of such holders; and |
| - | commencing on the second anniversary of the consummation of this offering, M&N Group Holdings may exchange the remaining Class A units, subject to the vesting requirements and selling restrictions as set forth above. |
For any units of Manning & Napier Group exchanged following the consummation of this offering, we will (i) pay an amount of cash equal to the number of units exchanged multiplied by the value of one
40
Table of Contents
share of our Class A common stock, or, at our election, (ii) issue shares of our Class A common stock on a one-for-one basis, subject, in each case, to customary adjustments for stock splits, stock dividends and reclassifications and other similar transactions. As we receive units of Manning & Napier Group that are exchanged, our ownership of Manning & Napier Group will increase.
In addition, we intend to award equity-based incentives to certain employees pursuant to the 2011 Plan to align their interests with our stockholders. From time to time following the consummation of this offering, the holders of units of Manning & Napier Group granted pursuant to the 2011 Plan, if any, shall become parties to the exchange agreement. Following the satisfaction of any vesting conditions set forth in the applicable agreements granting such holders such units or as otherwise determined by the compensation committee, such holders may exchange such units for (i) an amount of cash equal to the number of units exchanged multiplied by the value of one share of our Class A common stock, or, at our election, (ii) shares of our Class A common stock on a one-for-one basis, subject, in each case, to customary adjustments for stock splits, stock dividends and reclassifications and other similar transactions. As we receive units of Manning & Napier Group that are exchanged, our ownership of Manning & Napier Group will increase.
Pursuant to the exchange agreement, a holder may not exchange units if we determine that such exchange would be prohibited by law or regulation. In addition, we may impose additional restrictions on exchange that we determine to be necessary or advisable so that Manning & Napier Group is not treated as a “publicly traded partnership” for U.S. federal income tax purposes.
Registration Rights Agreement
In connection with this offering, we will enter into a registration rights agreement with the holders of units of Manning & Napier Group, pursuant to which the shares of our Class A common stock issued upon exchange of their units, if any, will be eligible for resale, subject to the resale timing and manner limitations described below.
Pursuant to the registration rights agreement, we will commit to file, following the first anniversary of the consummation of this offering, a shelf registration statement registering shares of our Class A common stock that may be issued upon the exchange of units of Manning & Napier Group pursuant to the exchange agreement. We also will commit to use our reasonable best efforts to cause the SEC to declare the shelf registration statement effective as soon as reasonably practicable thereafter and to keep such shelf registration statement continuously effective until the date on which all securities included in such shelf registration statement have been sold in accordance with the plan and method of distribution set forth therein.
We have agreed in the registration rights agreement to indemnify the participating holders, solely in their capacity as selling stockholders, against any losses or damages resulting from any untrue statement, or omission, of any material fact contained in any registration statement, prospectus or any amendments or supplements thereto pursuant to which they may sell the shares of our Class A common stock that they receive upon exchange of their units, except to the extent such liability arose from the selling stockholder’s misstatement or omission of a material fact, and the participating holders have agreed to indemnify us against all losses caused by their misstatements or omissions of a material fact relating to them.
We will pay all expenses incident to our performance of, or compliance with, any registration or marketing of securities pursuant to the registration rights agreement. The selling stockholders will pay their respective portions of all underwriting discounts, commissions and transfer taxes relating to the sale of their shares of our Class A common stock pursuant to the registration rights agreement.
41
Table of Contents
Amended and Restated Limited Liability Company Agreement of Manning & Napier Group, LLC
As a result of the reorganization, we will conduct all of our business activities through our principal operating subsidiary, Manning & Napier Group, and its subsidiaries. The operations of Manning & Napier Group, and the rights and obligations of its members, including us, will be set forth in an amended and restated limited liability company agreement of Manning & Napier Group, a form of which will be filed as an exhibit to the registration statement of which this prospectus forms a part. The following is a description of the material terms of this agreement.
Governance. We will serve as sole managing member of Manning & Napier Group. As such, we will control its business and affairs and will be responsible for the management of its business.
Economic Rights of Members. Manning & Napier Group will have Class A units and Class B units. Net profits and net losses and distributions of profits of Manning & Napier Group generally will be allocated and made to its members pro rata in accordance with the number of Class A units and Class B units of Manning & Napier Group they hold.
Voting. Each Class A unit and Class B unit will entitle its holder to one vote for each such Class A unit and Class B unit, respectively.
Transfer Restriction. Except to certain permitted transferees, including the members of M&N Group Holdings, and in connection with the exchange agreement, no member of Manning & Napier Group may transfer all or any portion of its units, whether vested or unvested, without the prior written consent of the managing member, which may be withheld in our sole discretion.
Indemnification and Exculpation. Manning & Napier Group will indemnify us, as its sole managing member, and our directors and officers against any losses, claims, damages, liabilities, expenses (including legal fees and expenses), judgments, fines, settlements and other amounts arising from any and all claims, demands, actions, suits or proceedings, whether civil, criminal, administrative or investigative, that are imposed on, incurred by or asserted against us or our directors and officers as a result of or arising out of the amended and restated limited liability company agreement, Manning & Napier Group, its assets, business or affairs or our activities, in our capacity as the managing member, or the activities of our directors and officers serving in their capacity as such, or otherwise on behalf of Manning & Napier Group to the extent within the scope of the authority reasonably believed to be conferred on us or such directors and officers. Notwithstanding the foregoing, neither we nor our directors or officers will be indemnified for any loss or other amount to the extent such loss or other amount arises out of (i) our failure, or the failure of our directors or officers, as applicable, to act in good faith and in a manner believed to be in the best interests of Manning & Napier Group or (ii) our, or our directors’ or officers’, as applicable, gross negligence or willful misconduct.
Manning & Napier Group will also advance the expenses (including reasonable legal fees and expenses) incurred by the indemnified parties in advance of a final disposition of such matters so long as the indemnified party undertakes to repay the expenses if it is determined that the party is not entitled to indemnification.
We, as the managing member, and our directors and officers will not be liable to Manning & Napier Group for any losses or other amounts imposed on, incurred by or asserted against Manning & Napier Group or any other indemnified party as a result of or arising out of any of our activities, in our capacity as the managing member, or the activities of our directors and officers serving in their capacity as such, to the extent within the scope of the authority reasonably believed to be conferred on us or such directors and officers, except to the extent such losses or other amounts arise out of (i) our failure, or the failure of our directors or officers, as applicable, to act in good faith and in a manner believed to be in the best interests of Manning & Napier Group or (ii) our, or our directors’ or officers’, as applicable, gross negligence or willful misconduct.
42
Table of Contents
Amendments. The amended and restated limited liability company agreement may be amended with the written consent of the managing member and M&N Group Holdings; provided, the managing member may, without the consent of any of the other members, amend the amended and restated limited liability company agreement to (i) satisfy any requirements, conditions, guidelines or opinions imposed by any governmental agency or by statute if the managing member deems such amendment to be in the best interests of Manning & Napier Group, (ii) ensure that Manning & Napier Group will not be treated as a “publicly traded partnership” under the Code or comply with any requirements of the Code, the regulations promulgated thereunder and the rulings of the IRS with respect to the tax treatment of Manning & Napier Group as a partnership for federal income tax purposes, or (iii) change the name of Manning & Napier Group. Notwithstanding the foregoing, no amendment that would affect any member in a manner that is disproportionate to the manner in which other members holding the same series or class of units is affected may be made without the consent of the members holding a majority of the class or series of units that would be disproportionately affected by such amendment.
Tax Receivable Agreement
Pursuant to the exchange agreement described above, following the consummation of this offering we may be required to acquire Class A units of Manning & Napier Group from their holders in exchange for cash or, at our option, shares of our Class A common stock. Manning & Napier Group intends to have an election under Section 754 of the Code in effect for taxable years in which purchases or exchanges of the Class A units of Manning & Napier Group will occur. Pursuant to the Section 754 election, each future purchase or exchange of such Class A units is expected to result in the purchaser of such units receiving an increase in the tax basis of tangible and intangible assets of Manning & Napier Group. When we acquire Class A units of Manning & Napier Group from existing members, we expect that the anticipated basis adjustments will increase, for tax purposes, the tax basis in the Manning & Napier Group’s assets attributable to the Class A units we acquire. The higher tax basis will increase depreciation and amortization deductions allocable to us from Manning & Napier Group and therefore reduce the amount of income tax we would otherwise be required to pay in the future. This increase in tax basis may also decrease gain, or increase loss, on future dispositions of certain capital assets to the extent increased tax basis is allocated to those capital assets.
Simultaneously with this offering, we will enter into a tax receivable agreement with the other holder of Class A units of Manning & Napier Group, pursuant to which we will be required to pay to such holders of such Class A units 85% of the applicable cash savings, if any, in U.S. federal, state, local and foreign income tax that we actually realize, or are deemed to realize in certain circumstances, in periods after this offering as a result of any step-up in tax basis in Manning & Napier Group’s assets resulting from (i) our purchases or exchanges of such Class A units for cash or, at our election, shares of our Class A common stock (including the purchases or exchanges in connection with the reorganization transactions) and (ii) payments under the tax receivable agreement, including any tax benefits related to imputed interest deemed to be paid by us as a result of such agreement.
There is a possibility that not all of the 85% of the applicable cash savings will be paid to the exchanging holder of Class A units at the time described above. If we determine that all or a portion of such applicable tax savings is in doubt, we will pay to the holders of such Class A units the amount attributable to the portion of the applicable tax savings that we determine is not in doubt and pay the remainder at such time as we reasonably determine the actual tax savings or that the amount is no longer in doubt.
For purposes of the tax receivable agreement, cash savings in tax are calculated by comparing our actual income tax liability to the amount we would have been required to pay had we not been able to utilize any of the tax benefits subject to the tax receivable agreement, unless certain assumptions apply, as discussed herein. The term of the tax receivable agreement will continue until 60 years after the last exchange of Class A units that are the subject of the tax receivable agreement all such tax benefits have been utilized or expired, unless we exercise our rights to terminate the tax receivable agreement or payments under the agreement are accelerated in connection with a change of control (as described below). The actual increase in tax basis, as well as the amount and timing of any payments under the agreement, will vary depending upon a number of factors, including the
43
Table of Contents
timing of exchanges by the holders of Class A units of Manning & Napier Group, the number of units exchanged the price of our Class A common stock at the time of the exchange, the extent to which such exchanges are taxable, the amount and timing of the taxable income we generate in the future and the tax rate then applicable and the portion of our payments under the tax receivable agreement constituting imputed interest or depreciable or amortizable basis.
We expect that the payments we will be required to make under the tax receivable agreement will be substantial. Assuming no material changes in the relevant tax law, that our exchange of Class A units would result in depreciable or amortizable basis and that we earn sufficient taxable income to realize all tax benefits that are subject to the tax receivable agreement, we expect that the reduction in tax payments for us associated with the purchase or exchange of all of the Class A units held by M&N Group Holdings would aggregate approximately $ over a 15-year period based on an assumed price of $ per share of our Class A common stock (the mid-point of the estimated initial public offering price range set forth on the cover page of this prospectus). Under such scenario, we would be required to pay the holders of such Class A units 85% of such amount, or $ , over the same 15-year period. The actual amounts may materially differ from these hypothetical amounts, as potential future reductions in tax payments for us and tax receivable agreement payments by us will be calculated using the market value of our Class A common stock and the prevailing tax rates at the time of purchase or exchange and will be dependent on us generating sufficient future taxable income to realize the benefit. In general, increases in the market value of our shares or in prevailing tax rates will increase the amounts we pay under the tax receivable agreement.
In addition, we will not be reimbursed for any payments previously made if such basis increases or other benefits are subsequently disallowed, except that excess payments made to any such holder will be netted against payments otherwise to be made, if any, to such holder after our determination of such excess. We might not determine that we have paid such excess for a number of years following such payment. As a result, in such circumstances, we could make payments under the tax receivable agreement that are greater than our actual cash tax savings.
The tax receivable agreement provides that upon certain mergers, asset sales, other forms of business combinations or other changes of control, or if, at any time, we elect an early termination of the tax receivable agreement, our, or our successor’s, obligations under the tax receivable agreement with respect to all Class A units of Manning & Napier Group, whether or not such units have been exchanged or acquired before or after such transaction, would be based on certain assumptions, including that we would have sufficient taxable income to fully utilize the deductions arising from the increased tax deductions and tax basis and other benefits related to entering into the tax receivable agreement. As a result, (i) we could be required to make payments under the tax receivable agreement that are greater than or less than the specified percentage of the actual benefits we realize in respect of the tax attributes subject to the tax receivable agreement and (ii) if we elect to terminate the tax receivable agreement early, we would be required to make an immediate payment equal to the present value of the anticipated future tax benefits attributable to depreciable and amortizable assets, which payment may be made significantly in advance of the actual realization of such future benefits, and additional payments upon the sale of non-amortizable assets. There is a possibility that not all of the early termination payment will be made to the exchanging holder of Class A units at the time described above. If we determine that all or a portion of such early termination payment is in doubt, we will pay to the holders of such Class A units the amount attributable to the portion of the early termination payment that we determine is not in doubt and pay the remainder at such time as we determine the actual tax savings or that the amount is no longer in doubt. In these situations, our obligations under the tax receivable agreement could have a substantial negative impact on our liquidity and could have the effect of delaying, deferring or preventing certain mergers, asset sales, other forms of business combinations or other changes of control. There can be no assurance that we will be able to finance our obligations under the tax receivable agreement. If we were to elect to terminate the tax receivable agreement immediately after this offering, based on an assumed price of $ per share of our Class A common stock (the mid-point of the estimated initial public offering price range set forth on the cover page of this prospectus), we estimate that we would be required to pay $ in the aggregate under the tax receivable agreement.
44
Table of Contents
Payments under the tax receivable agreement, if any, will be made pro rata among all tax receivable agreement holders entitled to payments on an annual basis to the extent we have sufficient taxable income to utilize the increased depreciation and amortization charges. The availability of sufficient taxable income to utilize the increased depreciation and amortization expense will not be determined until such time as the financial results for the year in question are known and tax estimates prepared, which typically occurs within 90 days after the end of the applicable taxable year. We expect to make payments under the tax receivable agreement, to the extent they are required, within 145 days after the end of the taxable year in which the increased depreciation and amortization expense was utilized. Interest on such payments will begin to accrue at a rate of % from the due date (without extensions) of such tax return for each such applicable taxable year of Manning & Napier.
The impact the tax receivable agreement will have on our consolidated financial statements will be the establishment of a liability, which will be increased upon the exchanges of Class A units of Manning & Napier Group for shares of our Class A common stock representing 85% of the estimated future tax benefits, if any, relating to the increase in tax basis associated with the Class A units we receive as a result of exchanges by unitholders of Manning & Napier Group. The amount and timing of any payments will vary based on a number of factors, including the timing of future exchanges, the number of units exchanged, the price of our Class A common stock at the time of any exchange, the extent to which such exchanges are taxable, the availability of amortization or depreciation deductions with respect to the intangible assets and the amount and timing of our income; depending upon the outcome of these factors, we may be obligated to make substantial payments pursuant to the tax receivable agreement. In light of the numerous factors affecting our obligation to make such payments, however, the timing and amount of any such actual payments are not certain at this time.
Decisions made by our existing owners in the course of running our business, such as with respect to mergers, asset sales, other forms of business combinations or other changes in control, may influence the timing and amount of payments that are received by an exchanging or selling existing owner under the tax receivable agreement. For example, the earlier disposition of assets following an exchange or acquisition transaction will generally accelerate payments under the tax receivable agreement and increase the present value of such payments, and the disposition of assets before an exchange or acquisition transaction will increase an existing owner’s tax liability without giving rise to any rights of an existing owner to receive payments under the tax receivable agreement.
Because of our structure, our ability to make payments under the tax receivable agreement is dependent on the ability of Manning & Napier Group to make distributions to us. The ability of Manning & Napier Group to make such distributions will be subject to, among other things, the applicable provisions of Delaware law that may limit the amount of funds available for distribution to its members, of which we are one. To the extent that we are unable to make payments under the tax receivable agreement for any reason, such payments will be deferred and will accrue interest until paid.
45
Table of Contents
We estimate that we will receive approximately $ million in net proceeds from this offering, or $ million if the underwriters’ overallotment option is exercised in full, based on an assumed initial public offering price of $ per share (the mid-point of the price range set forth on the cover page of this prospectus) and after deducting the underwriting discounts and commissions and estimated expenses payable by us.
Manning & Napier will use the net proceeds received from this offering to purchase Class A units of Manning & Napier Group. Manning & Napier Group expects to use such proceeds for general corporate purposes and strategic growth opportunities, including potential acquisitions. However, as of the date of this prospectus, we have no agreement relating to any material acquisition or investment.
We will not receive any proceeds from the sale of shares of Class A common stock offered by the selling stockholder participating in this offering. The net proceeds the selling stockholder receives from this offering will be distributed to the individuals, including William Manning, on whose behalf the selling stockholder is selling shares of our Class A common stock in this offering.
We have not yet determined the amount of net proceeds to be used for any specific purpose. Accordingly, management will have significant flexibility in applying the net proceeds of this offering. Pending the application of the net proceeds from this offering, the net proceeds may be invested in short-term securities or other investment products.
46
Table of Contents
Following this offering, we intend to pay quarterly cash dividends. We expect that our first dividend will be paid in the quarter of and will be $ per share of our Class A common stock. We intend to fund our initial dividend, as well as any future dividends, from our portion of distributions made by Manning & Napier Group, from its available cash generated from operations. William Manning, as the holder of our Class B common stock, will not be entitled to any cash dividends in his capacity as a Class B stockholder, but will, in his capacity as an indirect holder of Class A units of Manning & Napier Group, generally participate on a pro rata basis in distributions by Manning & Napier Group.
The declaration and payment of all future dividends, if any, will be at the sole discretion of our board of directors. In determining the amount of any future dividends, our board of directors will take into account:
| • | the financial results of Manning & Napier Group; |
| • | our available cash, as well as anticipated cash requirements, including any debt servicing; |
| • | our capital requirements and the capital requirements of our subsidiaries, including Manning & Napier Group; |
| • | contractual, legal, tax and regulatory restrictions on, and implications of, the payment of dividends by us to our stockholders or by Manning & Napier Group to us, including the obligation of Manning & Napier Group to make tax distributions to its unitholders, including us; |
| • | general economic and business conditions; and |
| • | any other factors that our board of directors may deem relevant. |
Upon consummation of this offering, we will have no material assets other than our ownership of Class A units of Manning & Napier Group and, accordingly, will depend on distributions from Manning & Napier Group to fund any dividends we may pay. As managing member of Manning & Napier Group, we will determine the timing and amount of any distributions to be paid to its members. We intend to cause Manning & Napier Group to distribute cash to its members, including us, in an amount sufficient to cover dividends, if any, declared by us. If we do cause Manning & Napier Group to make such distributions, holders of units of Manning & Napier Group will be entitled to receive equivalent distributions on a pro rata basis.
Our dividend policy has certain risks and limitations, particularly with respect to liquidity. Although we expect to pay dividends according to our dividend policy, we may not pay dividends according to our policy, or at all, if, among other things, Manning & Napier Group is unable to make distributions to us as a result of its operating results, cash requirements and financial condition, its making certain mandatory distributions to its members relating to their income tax liability, the applicable laws of the State of Delaware, which may limit the amount of funds available for distribution, and its compliance with covenants and financial ratios related to any indebtedness it may incur in the future. See “Management’s Discussion and Analysis of Financial Condition and Results of Operations—Liquidity and Capital Resources.”
We are taxable as a corporation for U.S. federal income tax purposes and therefore holders of our Class A common stock will not be taxed directly on our earnings. Distributions of cash or other property that we pay to our stockholders will constitute dividends for U.S. federal income tax purposes to the extent paid from our current or accumulated earnings and profits, as determined under U.S. federal income tax rules. If the amount of a distribution by us to our stockholders exceeds our current and accumulated earnings and profits, such excess will be treated first as a tax-free return of capital to the extent of a holder’s adjusted tax basis in the Class A common stock and thereafter as capital gain.
47
Table of Contents
The following table sets forth our cash and cash equivalents and our total capitalization as of March 31, 2011 on an actual basis and on an as adjusted basis to give effect to the sale of shares of our Class A common stock in this offering at an assumed initial public offering price of $ per share, the mid-point of the estimated initial public offering price range set forth on the cover page of this prospectus, the application of the net proceeds as described in “Use of Proceeds,” and the reorganization transactions.
This table should be read in conjunction with “Management’s Discussion and Analysis of Financial Condition and Results of Operations” and the consolidated financial statements and notes thereto appearing elsewhere in this prospectus.
| As of March 31, 2011 | ||||||||
| Actual | As adjusted (1) | |||||||
| (unaudited) | ||||||||
| (in thousands) | ||||||||
| Cash and cash equivalents |
$ | 47,759 | $ | |||||
| Liabilities |
||||||||
| Liabilities other than shares liability subject to mandatory redemption |
35,555 | |||||||
| Shares liability subject to mandatory redemption |
183,607 | |||||||
| Total liabilities |
219,162 | |||||||
| Shareholders’ deficit and partners’ capital |
||||||||
| Class A common stock, par value $0.01 per share ( shares authorized, and shares issued and outstanding, as adjusted) |
— | |||||||
| Class B common stock, par value $0.01 per share ( shares authorized, and shares issued and outstanding, as adjusted) |
— | |||||||
| Common stock, par value $0.01 per share (10,000,000 shares authorized, 2,565,322 shares issued and outstanding and 5,224,050 shares issued and outstanding subject to mandatory redemption) (2) |
103 | |||||||
| Additional paid-in capital |
1,970 | |||||||
| Retained earnings (deficit) |
(133,285 | ) | ||||||
| Accumulated other comprehensive income |
554 | |||||||
| Partners’ equity |
1,583 | |||||||
| Total shareholders’ deficit and partners’ capital attributable to the Manning & Napier Companies |
(129,075 | ) | ||||||
| Non-controlling interest |
38 | |||||||
| Total shareholders’ deficit and partners’ capital |
(129,037 | ) | ||||||
| Total liabilities and shareholders’ deficit and partners’ capital |
$ | 90,125 | $ | |||||
| (1) | A $1.00 increase/(decrease) in the assumed initial public offering price of $ per share, which is the mid-point of the price range listed on the cover page of this prospectus, would increase/(decrease) the as adjusted amount of each of cash and cash equivalents, additional paid-in capital and total capitalization by approximately $ million, assuming that the number of shares offered by us, as set forth on the cover page of this prospectus, remains the same and after deducting underwriting discounts and commissions and estimated offering expenses payable by us. |
If the underwriters’ option to purchase an additional shares of Class A common stock in this offering is exercised in full, the as adjusted amount of each of additional paid-in capital and total capitalization would increase by approximately $ million, and we would have shares of our Class A common stock issued and outstanding.
| (2) | Number of shares authorized, issued and outstanding represents the capitalization of each of MNA, AAC, MNAO and MNBD, singly and not in the aggregate, both prior to and subsequent to the reorganization transactions and this offering. The “Actual” number represents the aggregate capital of MNA, AAC, MNAO and MNBD. After giving effect to the reorganization transactions and this offering, we will not own any of the issued and outstanding common stock of these entities, and the only assets of these entities will be % of the Class A units of M&N Group Holdings. Prior to this offering, we had a mandatory redemption obligation upon the death of William Manning to pay a formula-driven amount to his estate. Pursuant to such obligation, 5,224,050 shares of common stock of each of the entities were subject to mandatory redemption. Such mandatory redemption obligation will terminate immediately prior to the consummation of this offering. See “Our Structure and Reorganization.” |
The number of shares of our Class A common stock to be outstanding after the completion of this offering excludes shares of Class A common stock reserved for issuance upon the exchange of units of Manning & Napier Group held by or that may be granted to M&N Group Holdings.
48
Table of Contents
Dilution is the amount by which the offering price paid by the purchasers of our Class A common stock to be sold in this offering will exceed the net tangible book value per share of our Class A common stock immediately after this offering. Our pro forma net tangible book value as of March 31, 2011 was $ million, or $ per share of Class A common stock. “Net tangible book value” per share represents the amount of our total tangible assets reduced by the amount of our total liabilities, divided by the number of shares of Class A common stock outstanding as of March 31, 2011. Our as adjusted net tangible book value as of March 31, 2011, assuming no changes in our net tangible book value other than the sale of shares of Class A common stock in this offering at an assumed initial offering price of $ per share (the mid-point of the price range set forth on the cover of this prospectus) and application of estimated net proceeds of $ from such sale after deducting the underwriting discounts and commissions and estimated offering expenses, would have been approximately $ , or $ per share. This represents an immediate increase in pro forma net tangible book value of $ per share to existing stockholders and an immediate dilution of $ per share to new investors. Immediate dilution is the difference between the purchase price per share paid by a new investor and the net tangible book value of each share immediately after this offering.
The following table illustrates this per share dilution:
| Assumed initial public offering price per share |
$ | |||||||
| Net tangible book value per share before this offering |
$ | |||||||
| Increase in net tangible book value per share attributable to cash payments made by new investors |
||||||||
| Pro forma net tangible book value per share after this offering |
||||||||
| Dilution of net tangible book value per share to new investors |
$ | |||||||
A $1.00 increase (decrease) in the assumed initial public offering price of $ per share (the mid-point of the price range set forth on the cover of this prospectus) would increase (decrease) our net tangible book value (deficit) by $ million, the net tangible book value (deficit) per share after this offering by $ per share and the decrease in net tangible book value (deficit) to new investors in this offering by $ per share, assuming the number of shares offered by us, as set forth on the cover page of this prospectus, remains the same and after deducting the estimated underwriting discounts and commissions and estimated offering expenses.
The following table summarizes the number of shares purchased from us and the total consideration and average price per share paid to us, by existing holders of Class A common stock, and the total number of shares purchased from the Company, the total consideration paid to the Company and the price per share paid by new investors purchasing shares in this offering:
| Shares purchased | Total consideration | Average price per share |
||||||||||||||||||
| Number | Percent | Amount | Percent | |||||||||||||||||
| Existing holders of Class A common stock |
% | $ | % | $ | ||||||||||||||||
| Investors purchasing Class A common stock in this offering |
||||||||||||||||||||
| Total |
100 | % | $ | 100 | % | $ | ||||||||||||||
If the underwriters’ overallotment is purchased in full:
| • | the percentage of our shares of Class A common stock held by our existing holders of Class A common stock will decrease to shares, or approximately % of the total number of shares of Class A common stock outstanding after this offering; and |
| • | the number of our shares of Class A common stock held by investors purchasing Class A common stock in this offering will increase to shares, or approximately % of the total number of shares of Class A common stock outstanding after this offering. |
49
Table of Contents
UNAUDITED PRO FORMA COMBINED CONSOLIDATED FINANCIAL INFORMATION
The unaudited pro forma combined consolidated statement of income for the year ended December 31, 2010 and for the three months ended March 31, 2011 present our combined consolidated results of operations giving pro forma effect to the items listed below as if such transactions occurred on January 1, 2010. The unaudited pro forma combined consolidated statement of financial condition as of March 31, 2011 presents our combined consolidated financial condition giving pro forma effect to the items listed below as if such transactions occurred on March 31, 2011. The pro forma adjustments are based on available information and upon assumptions that our management believes are reasonable in order to reflect, on a pro forma basis, the impact of these transactions on the historical financial information of the Manning & Napier Companies.
The unaudited pro forma combined consolidated financial information should be read together with “Our Structure and Reorganization,” “Management’s Discussion and Analysis of Financial Condition and Results of Operations” and the historical combined consolidated financial statements and related notes included elsewhere in this prospectus.
The pro forma adjustments principally give effect to:
| • | the reorganization transactions described in “Our Structure and Reorganization;” |
| • | the issuance of shares of Class B common stock to William Manning, our Chairman and controlling stockholder; |
| • | the elimination of our mandatory redemption obligation upon the death of William Manning to pay a formula-driven amount to his estate. Pursuant to such mandatory redemption obligation, 5,224,050 shares of common stock of each of MNA, AAC, MNAO and MNBD were subject to mandatory redemption. Such obligation will terminate immediately prior to the consummation of this offering; |
| • | a one-time non-cash compensation charge in 2011, equal to approximately $ million, related to the additional ownership interests in M&N Group Holdings granted to William Manning in connection with the reorganization transactions; |
| • | non-cash compensation charges through 2014, resulting from amendments to the vesting terms related to the current ownership interests of our employees, including our named executive officers, other than William Manning, in certain of the Manning & Napier Companies. These new vesting terms will not result in any dilution to the outstanding shares of our Class A common stock; |
| • | the sale of shares of our Class A common stock by us in this offering at an assumed offering price of $ per share (the mid-point of the price range set forth on the cover of this prospectus); |
| • | the purchase by us of units of Manning & Napier Group pursuant to the exchange agreement and the related effects of the tax receivable agreement. See “Our Structure and Reorganization—Offering Transactions—Exchange Agreement” and “Our Structure and Reorganization—Offering Transactions—Tax Receivable Agreement;” and |
| • | in the case of the unaudited pro forma combined consolidated statements of income, a provision for corporate income taxes on the income attributable to us at an effective rate of %, reflecting assumed federal, state and local income taxes. |
We have not made any pro forma adjustments to our compensation and related costs, or any of our other expense items, relating to reporting, compliance or investor relations costs, or other incremental costs that we may incur as a public company, including costs relating to compliance with Section 404 of the Sarbanes-Oxley Act.
50
Table of Contents
The unaudited pro forma combined consolidated financial information is included for informational purposes only and does not purport to reflect the results of operations or financial condition of the Manning & Napier Companies that would have occurred had we operated as a public company during the periods presented. The unaudited pro forma combined consolidated financial information should not be relied upon as being indicative of our results of operations or financial condition had the reorganization transactions described under “Our Structure and Reorganization” and the use of the estimated net proceeds from this offering as described under “Use of Proceeds” occurred on the dates assumed. The unaudited pro forma combined consolidated financial information also does not project our results of operations or financial condition for any future period or date.
51
Table of Contents
Unaudited Pro Forma Combined Consolidated
Statement of Income
For the Year Ended December 31, 2010
| Manning & Napier Companies Actual |
Pro Forma Adjustments |
Manning & Napier, Inc. Pro Forma |
||||||||||||||
| (in thousands, except share and per share amounts) | ||||||||||||||||
| Revenues |
||||||||||||||||
| Investment management services revenue |
$ | 255,472 | ||||||||||||||
| Expenses |
||||||||||||||||
| Compensation and related costs |
78,416 | (1 | ) | |||||||||||||
| Sub-transfer agent and shareholder service costs |
36,830 | |||||||||||||||
| Other operating costs |
25,284 | |||||||||||||||
| Total operating expenses |
140,530 | |||||||||||||||
| Operating income |
114,942 | |||||||||||||||
| Non-operating income (loss) |
||||||||||||||||
| Interest expense on shares subject to mandatory redemption |
(61,243 | ) | (2 | ) | ||||||||||||
| Interest expense |
(16 | ) | ||||||||||||||
| Interest and dividend income |
126 | |||||||||||||||
| Net capital gains (losses) on investments |
1 | |||||||||||||||
| Total non-operating loss |
(61,132 | ) | ||||||||||||||
| Income before provision for income taxes |
53,810 | |||||||||||||||
| Provision for income taxes |
712 | (3 | ) | |||||||||||||
| Net income attributable to the controlling and the noncontrolling interests |
$ | 53,098 | ||||||||||||||
| Less: Net income attributable to the noncontrolling interests |
(4 | ) | ||||||||||||||
| Net income (loss) attributable to Manning & Napier, Inc. |
||||||||||||||||
| Net income available to Class A common stock per basic and diluted share |
||||||||||||||||
| Weighted average basic and diluted shares of Class A common stock outstanding |
(5 | ) | ||||||||||||||
The accompanying notes are an integral part of this unaudited pro forma combined consolidated financial statement.
52
Table of Contents
Unaudited Pro Forma Combined Consolidated
Statement of Income
For the Three Months Ended March 31, 2011
| Manning & Napier Companies Actual |
Pro Forma Adjustments |
Manning & Napier, Inc. Pro Forma |
||||||||||||||
| (in thousands, except share and per share amounts) | ||||||||||||||||
| Revenues |
||||||||||||||||
| Investment management services revenue |
$ | 78,040 | ||||||||||||||
| Expenses |
||||||||||||||||
| Compensation and related costs |
22,894 | (1 | ) | |||||||||||||
| Sub-transfer agent and shareholder service costs |
11,695 | |||||||||||||||
| Other operating costs |
6,225 | |||||||||||||||
| Total operating expenses |
40,814 | |||||||||||||||
| Operating income |
37,226 | |||||||||||||||
| Non-operating income (loss) |
||||||||||||||||
| Interest expense on shares subject to mandatory redemption |
(13,288 | ) | (2 | ) | ||||||||||||
| Interest expense |
(9 | ) | ||||||||||||||
| Interest and dividend income |
14 | |||||||||||||||
| Net capital gains (losses) on investments |
3 | |||||||||||||||
| Total non-operating loss |
(13,280 | ) | ||||||||||||||
| Income before provision for income taxes |
23,946 | |||||||||||||||
| Provision for income taxes |
286 | (3 | ) | |||||||||||||
| Net income attributable to the controlling and the noncontrolling interests |
$ | 23,660 | ||||||||||||||
| Less: Net income attributable to the noncontrolling interests |
(4 | ) | ||||||||||||||
| Net income (loss) attributable to Manning & Napier, Inc. |
||||||||||||||||
| Net income available to Class A common stock per Basic and Diluted share |
||||||||||||||||
| Weighted average basic and diluted shares of Class A common stock outstanding |
(5 | ) | ||||||||||||||
The accompanying notes are an integral part of this unaudited pro forma combined consolidated financial statement.
53
Table of Contents
| (1) | In connection with the reorganization transactions, certain of the Manning & Napier Companies will modify the vesting terms related to the current ownership interests of our employees, including our named executive officers, other than William Manning. Such individuals will be entitled to 15% of their ownership interests upon the consummation of this offering, and 15% of their ownership interests over the subsequent three years. The remaining ownership interests will be subject to performance-based vesting over such three year period (subject to an initial two-year lockup period and other selling restrictions), to be determined by a vesting committee of MNA. Such new vesting terms will not result in dilution to the number of outstanding shares of our Class A common stock. As a result of such vesting requirements, we will recognize non-cash compensation charges through 2014. |
| (2) | Prior to this offering, we had a mandatory obligation upon the death of William Manning to pay a formula-driven amount to his estate. Our liability related to this mandatory redemption obligation was calculated each fiscal quarter, and the change in the liability was reflected as non-cash interest expense. Such mandatory redemption obligation will terminate immediately prior to the consummation of this offering and we will no longer reflect non-cash interest expense or the liability related to such obligation. |
| (3) | As flow through entities, the Manning & Napier Companies were not historically subject to income taxes. An adjustment has been made to include assumed taxes at an effective tax rate of % and % for the twelve months ended December 31, 2010 and three months ended March 31, 2011, respectively, reflecting assumed federal, state and local income taxes. |
| (4) | As described in “Our Structure and Reorganization,” we will be the sole managing member of Manning & Napier Group. We will own less than 100% of the economic interests in Manning & Napier Group, but will control the management of Manning & Napier Group. |
| (5) | Represents the issuance of an aggregate of shares of our Class A common stock in connection with this offering. Our shares of Class B common stock do not share in our earnings and are therefore not included in the weighted average shares outstanding or net income (loss) available per share. |
54
Table of Contents
Unaudited Pro Forma Combined Consolidated
Statement of Financial Condition
As of March 31, 2011
| Manning
& Napier Companies Actual |
Pro Forma Adjustments |
Manning & Napier, Inc. Pro Forma |
||||||||||||||
| (in thousands, except share and per share amounts) | ||||||||||||||||
| Assets |
||||||||||||||||
| Cash and cash equivalents |
$ | 47,759 | (1 | ) | ||||||||||||
| Accounts receivable |
18,474 | |||||||||||||||
| Accounts receivable—Manning & Napier Fund, Inc. |
13,377 | |||||||||||||||
| Marketable securities |
5,103 | |||||||||||||||
| Property and equipment, net |
3,014 | |||||||||||||||
| Prepaid expenses and other assets |
2,398 | |||||||||||||||
| Deferred tax asset |
— | (2 | ) | |||||||||||||
| Total assets |
$ | 90,125 | ||||||||||||||
| Liabilities |
||||||||||||||||
| Accounts payable |
773 | |||||||||||||||
| Accrued expenses and other liabilities |
23,455 | |||||||||||||||
| Deferred revenue |
11,174 | |||||||||||||||
| Stock purchase note payable |
153 | |||||||||||||||
| Shares liability subject to mandatory redemption |
183,607 | (3 | ) | |||||||||||||
| Amounts payable under tax receivable agreement |
— | (2 | ) | |||||||||||||
| Total liabilities |
219,162 | |||||||||||||||
| Commitment and contingencies |
— | |||||||||||||||
| Shareholders’ deficit and partners’ capital |
||||||||||||||||
| Class A common stock, par value $0.01 per share; shares authorized, and shares issued and outstanding, as adjusted) |
— | (1 | ) | |||||||||||||
| Class B common stock, par value $0.01 per share; shares authorized, and shares issued and outstanding, as adjusted) |
— | (5 | ) | |||||||||||||
| Common stock, $0.01 par value per share (10,000,000 shares authorized, 2,565,322 shares issued and outstanding and 5,224,050 shares issued and outstanding subject to mandatory redemption)(6) |
103 | (3 | ) | |||||||||||||
| Additional paid in capital |
1,970 | (1 | )(2)(3)(4) | |||||||||||||
| (5 | )(7) | |||||||||||||||
| Treasury stock, at cost: no shares issued or outstanding |
— | |||||||||||||||
| Retained earnings (deficit) |
(133,285 | ) | (3 | )(5)(7) | ||||||||||||
| Accumulated other comprehensive income |
554 | |||||||||||||||
| Partners’ equity (deficit) |
1,583 | (3 | ) | |||||||||||||
| Total shareholders’ deficit and partners’ capital attributable to Manning & Napier, Inc. |
(129,075 | ) | ||||||||||||||
| Non-controlling interest |
38 | (4 | ) | |||||||||||||
| Total shareholders’ deficit and partners’ capital |
(129,037 | ) | ||||||||||||||
| Total liabilities and shareholders’ deficit and partners’ capital |
$ | 90,125 | $ | |||||||||||||
The accompanying notes are an integral part of this unaudited pro forma combined consolidated financial statement.
55
Table of Contents
| (1) | Represents the net effect of an increase in cash and cash equivalents due to the net proceeds received by us from the sale of shares of our Class A common stock in this offering, which we expect will be $ million (reflecting a reduction of $ relating to the costs of this offering). |
| (2) | Reflects adjustments to give effect to the tax receivable agreement (as described in “Our Structure and Reorganization—Offering Transactions—Tax Receivable Agreement”) based on the following assumptions: |
| • | we will record an increase of $ million in deferred tax assets for estimated income tax effects of the increase in the tax basis of the purchased interests, based on an effective income tax rate of % (which includes a provision for U.S. federal, state and local income taxes); |
| • | we will record $ million, representing 85% of the estimated realizable tax benefit resulting from (i) the tax basis in the intangible assets of Manning & Napier Group on the date of this offering, (ii) the increase in the tax basis of the purchased interests as noted above and (iii) certain other tax benefits related to entering into the tax receivable agreement, including tax benefits attributable to payments under the tax receivable agreement as an increase to the liability due to existing owners under the tax receivable agreement; and |
| • | we will record an increase to additional paid-in capital of $ million, which is an amount equal to the difference between the increase in deferred tax assets and the increase in amounts payable under the tax receivable agreement. |
| (3) | Represents an adjustment to stockholders’ equity reflecting (i) any remaining retained earnings to be distributed by the corporate members of M&N Group Holdings, (ii) the termination of the mandatory redemption provision upon the death of William Manning, (iii) the elimination of partners’ equity of $ million upon consolidation and (iv) the elimination of retained earnings of $ million upon consolidation, of which $ million will remain in restricted surplus due to Exeter Trust Company’s regulatory surplus requirements. |
| (4) | As described in “Our Structure and Reorganization,” we will be the sole managing member of Manning & Napier Group. We will have a less than % economic interest in Manning & Napier Group, but will control the management of Manning & Napier Group. As a result, we will consolidate the financial results of Manning & Napier Group and will record a non-controlling interest with a corresponding decrease in additional paid-in capital to allocate a portion of our equity to the non-controlling interest on our balance sheet. The historical non-controlling interest recorded for Exeter Trust Company will no longer exist. |
| (5) | In connection with this offering, Class B units in M&N Group Holdings will be issued to William Manning, our Chairman and controlling stockholder. Subject to certain restrictions set forth in the exchange agreement and described elsewhere in this prospectus, Mr. Manning will have the right to exchange such Class B units for either the market value in cash or, at our election, shares of our Class A common stock on a one-for-one basis. See “Our Structure and Reorganization—Offering Transactions—Exchange Agreement.” |
| (6) | Number of shares authorized, issued and outstanding represents the capitalization of each of MNA, AAC, MNAO and MNBD, singly and not in the aggregate, both prior to and subsequent to the reorganization transactions and this offering. The “Actual” number represents the aggregate capital of MNA, AAC, MNAO and MNBD. After giving effect to the reorganization transactions and this offering, we will not own any of the issued and outstanding common stock of these entities, and the only assets of these entities will be % of the Class A units of M&N Group Holdings. Prior to the reorganization transactions and this offering, we had a mandatory redemption obligation upon the death of William Manning to pay a formula-driven amount to his estate. Pursuant to such mandatory redemption obligation, 5,224,050 shares of common stock of each of the entities were subject to mandatory redemption. Such obligation will terminate immediately prior to the consummation of this offering. See “Our Structure and Reorganization.” |
| (7) | In connection with this offering, certain shareholders will have their vesting schedules adjusted and in some cases unvested stock will now be vested. This results in the additional non-cash compensation expense associated with the new vesting requirements. |
56
Table of Contents
SELECTED HISTORICAL COMBINED CONSOLIDATED FINANCIAL AND OTHER DATA
The following tables set forth selected historical combined consolidated financial and other data of the Manning & Napier Companies as of the dates and for the periods indicated. The selected combined consolidated statements of income data for the years ended December 31, 2008, 2009 and 2010, and the combined consolidated statements of financial condition data as of December 31, 2009 and 2010 have been derived from the Manning & Napier Companies’ audited combined consolidated financial statements included elsewhere in this prospectus. The selected combined consolidated statements of income data for the year ended December 31, 2007 and the combined consolidated statements of financial condition data as of December 31, 2007 and 2008 have been derived from the Manning & Napier Companies’ audited combined consolidated financial statements not included elsewhere in this prospectus. The selected combined consolidated statements of income data for the year ended December 31, 2006 and the combined consolidated statements of financial condition data as of December 31, 2006 have been derived from the Manning & Napier Companies’ unaudited combined consolidated financial statements not included in this prospectus.
The selected combined consolidated statements of income data for the three months ended March 31, 2010 and 2011 and the selected combined consolidated statements of financial condition as of March 31, 2011 have been derived from the Manning & Napier Companies unaudited combined consolidated financial statements included elsewhere in this prospectus. The selected combined consolidated statements of financial condition as of March 31, 2010 have been derived from the Manning & Napier Companies unaudited combined consolidated financial statements not included elsewhere in this prospectus. These unaudited combined consolidated financial statements have been prepared on substantially the same basis as our audited combined consolidated financial statements and include all adjustments that we consider necessary for a fair statement of our combined consolidated statements of income and financial condition for the periods and as of the date presented therein. Our results for the three months ended March 31, 2011 are not necessarily indicative of our results for a full fiscal year.
You should read the following selected historical combined consolidated financial data together with “Our Structure and Reorganization,” “Management’s Discussion and Analysis of Financial Condition and Results of Operations” and the historical combined consolidated financial statements and related notes included elsewhere in this prospectus.
57
Table of Contents
| Year Ended December 31, | Three Months Ended March 31, |
|||||||||||||||||||||||||||
| 2006 | 2007 | 2008 | 2009 | 2010 | 2010 | 2011 | ||||||||||||||||||||||
| (unaudited) | (unaudited) | |||||||||||||||||||||||||||
| (in millions) | ||||||||||||||||||||||||||||
| Statements of income data: |
||||||||||||||||||||||||||||
| Operating revenues |
||||||||||||||||||||||||||||
| Investment management services revenue |
$ | 95.9 | $ | 133.3 | $ | 145.6 | $ | 162.7 | $ | 255.5 | $ | 57.2 | $ | 78.0 | ||||||||||||||
| Total operating revenues |
95.9 | 133.3 | 145.6 | 162.7 | 255.5 | 57.2 | 78.0 | |||||||||||||||||||||
| Operating expenses |
||||||||||||||||||||||||||||
| Compensation and related costs |
37.9 | 46.8 | 46.3 | 55.6 | 78.4 | 16.8 | 22.9 | |||||||||||||||||||||
| Sub-transfer agent and shareholder service costs |
5.6 | 9.9 | 13.1 | 19.9 | 36.8 | 8.5 | 11.7 | |||||||||||||||||||||
| Other operating costs |
13.2 | 17.3 | 20.7 | 22.3 | 25.3 | 5.8 | 6.2 | |||||||||||||||||||||
| Total operating expenses |
56.7 | 74.0 | 80.1 | 97.8 | 140.5 | 31.1 | 40.8 | |||||||||||||||||||||
| Total operating income |
39.2 | 59.3 | 65.5 | 64.9 | 115.0 | 26.1 | 37.2 | |||||||||||||||||||||
| Non-operating income (loss) |
||||||||||||||||||||||||||||
| Interest expense on shares subject to mandatory redemption (1) |
(14.5 | ) | (25.0 | ) | (6.7 | ) | (10.0 | ) | (61.2 | ) | (16.2 | ) | (13.3 | ) | ||||||||||||||
| Interest expense |
— | — | (0.1 | ) | — | (0.1 | ) | — | — | |||||||||||||||||||
| Interest and dividend income |
1.1 | 1.2 | 0.6 | 0.1 | 0.1 | — | — | |||||||||||||||||||||
| Net capital gains (losses) on investments |
(0.1 | ) | — | 0.1 | (0.2 | ) | — | — | — | |||||||||||||||||||
| Total non-operating income (loss) |
(13.5 | ) | (23.8 | ) | (6.1 | ) | (10.1 | ) | (61.2 | ) | (16.2 | ) | (13.3 | ) | ||||||||||||||
| Income before provision for income taxes |
25.7 | 35.5 | 59.4 | 54.8 | 53.8 | 9.9 | 23.9 | |||||||||||||||||||||
| Provision for income taxes |
0.5 | 0.6 | 0.4 | 0.4 | 0.7 | 0.2 | 0.2 | |||||||||||||||||||||
| Net income |
$ | 25.2 | $ | 34.9 | $ | 59.0 | $ | 54.4 | $ | 53.1 | $ | 9.7 | $ | 23.7 | ||||||||||||||
| (1) | Within interest expense, we have recognized expenses related to a mandatory redemption obligation upon the death of William Manning to pay a formula-driven amount to his estate. Our liability related to this mandatory redemption obligation was calculated each fiscal quarter, and the change in the liability was reflected as non-cash interest expense. Such mandatory redemption obligation will terminate immediately prior to the consummation of this offering and we will no longer reflect non-cash interest expense or the liability related to such obligation. |
| As of December 31, | As of March 31, |
|||||||||||||||||||||||||||
| 2006 | 2007 | 2008 | 2009 | 2010 | 2010 | 2011 | ||||||||||||||||||||||
| (unaudited) | (unaudited) | |||||||||||||||||||||||||||
| (in millions) | ||||||||||||||||||||||||||||
| Statements of financial condition data: |
||||||||||||||||||||||||||||
| Total assets |
$ | 44.5 | $ | 49.3 | $ | 41.1 | $ | 53.4 | $ | 68.3 | $ | 63.2 | $ | 90.1 | ||||||||||||||
| Shares liability subject to mandatory redemption (1) |
67.5 | 92.4 | 99.1 | 109.1 | 170.3 | 125.3 | 183.6 | |||||||||||||||||||||
| Total liabilities |
96.7 | 120.3 | 120.8 | 136.7 | 212.1 | 150.2 | 219.2 | |||||||||||||||||||||
| (1) | Prior to this offering, we had a mandatory redemption obligation upon the death of William Manning to pay a formula-driven amount to his estate. Our liability related to this mandatory redemption obligation was calculated each fiscal quarter, and the change in the liability was reflected as non-cash interest expense. Such mandatory redemption obligation will terminate immediately prior to the consummation of this offering and we will no longer reflect non-cash interest expense or the liability related to such obligation. |
| Year Ended December 31, | Three Months Ended March 31, |
|||||||||||||||||||||||||||
| 2006 | 2007 | 2008 | 2009 | 2010 | 2010 | 2011 | ||||||||||||||||||||||
| (in millions, except per share data) | ||||||||||||||||||||||||||||
| Selected unaudited operating data: |
||||||||||||||||||||||||||||
| Assets under management (1) |
$ | 14,674.1 | $ | 18,795.7 | $ | 16,231.4 | $ | 28,271.3 | $ | 38,841.7 | $ | 31,192.8 | $ | 42,564.1 | ||||||||||||||
| EBITDA (2) |
39.7 | 60.1 | 66.7 | 65.8 | 116.4 | 26.4 | 37.5 | |||||||||||||||||||||
| Economic income (2) |
40.2 | 60.5 | 66.1 | 64.8 | 115.0 | 26.1 | 37.2 | |||||||||||||||||||||
| (1) | Reflects the amount of money we managed for our clients as of the last day of the period. |
| (2) | Our management uses non-GAAP financial measures to evaluate the profitability and efficiency of our business model. See page 59 of this prospectus for a reconciliation of these non-GAAP financial measures. Our non-GAAP financial measures may differ from similar measures used by other companies, even if similar terms are used to identify such measures. |
58
Table of Contents
Our management uses EBITDA and economic income as financial measures to evaluate the profitability and efficiency of our business model. EBITDA and economic income are not presented in accordance with GAAP. EBITDA includes adjustments for provision for income taxes, interest income and expense and depreciation and amortization. Economic income excludes from income before provision for income taxes the non-cash interest expense associated with the liability for shares subject to mandatory redemption.
| Year Ended December 31, | Three Months Ended March 31, |
|||||||||||||||||||||||||||
| 2006 | 2007 | 2008 | 2009 | 2010 | 2010 | 2011 | ||||||||||||||||||||||
| (unaudited) | (unaudited) | |||||||||||||||||||||||||||
| (dollar amounts in millions) | ||||||||||||||||||||||||||||
| Reconciliation of non-GAAP financial measures: |
||||||||||||||||||||||||||||
| Net income |
25.2 | 34.9 | 59.0 | 54.4 | 53.1 | 9.7 | 23.7 | |||||||||||||||||||||
| Provision for income taxes |
0.5 | 0.6 | 0.4 | 0.4 | 0.7 | 0.2 | 0.2 | |||||||||||||||||||||
| Income before provision for income taxes |
$ | 25.7 | $ | 35.5 | $ | 59.4 | $ | 54.8 | $ | 53.8 | $ | 9.9 | $ | 23.9 | ||||||||||||||
| Interest expense on shares subject to mandatory redemption (1) |
14.5 | 25.0 | 6.7 | 10.0 | 61.2 | 16.2 | 13.3 | |||||||||||||||||||||
| Economic income |
40.2 | 60.5 | 66.1 | 64.8 | 115.0 | 26.1 | 37.2 | |||||||||||||||||||||
| Interest expense |
— | — | 0.1 | — | 0.1 | — | — | |||||||||||||||||||||
| Interest income |
(1.1 | ) | (1.2 | ) | (0.6 | ) | (0.1 | ) | (0.1 | ) | — | — | ||||||||||||||||
| Depreciation and amortization |
0.6 | 0.8 | 1.1 | 1.1 | 1.4 | 0.3 | 0.3 | |||||||||||||||||||||
| EBITDA |
39.7 | 60.1 | 66.7 | 65.8 | 116.4 | 26.4 | 37.5 | |||||||||||||||||||||
| Revenue |
95.9 | 133.3 | 145.6 | 162.7 | 255.5 | 57.2 | 78.0 | |||||||||||||||||||||
| Net income margin percentage |
26.3 | % | 26.2 | % | 40.5 | % | 33.4 | % | 20.8 | % | 17.0 | % | 30.4 | % | ||||||||||||||
| Economic income margin percentage |
41.9 | % | 45.4 | % | 45.4 | % | 39.8 | % | 45.0 | % | 45.6 | % | 47.7 | % | ||||||||||||||
| EBITDA margin percentage |
41.4 | % | 45.1 | % | 45.8 | % | 40.4 | % | 45.6 | % | 46.2 | % | 48.1 | % | ||||||||||||||
| (1) | Within interest expense, we have recognized expenses related to a mandatory redemption obligation upon the death of William Manning to pay a formula-driven amount to his estate. Our liability related to this mandatory redemption obligation was calculated each fiscal quarter, and the change in the liability was reflected as non-cash interest expense. Such mandatory redemption obligation will terminate immediately prior to the consummation of this offering and we will no longer reflect non-cash interest expense or the liability related to such obligation. |
59
Table of Contents
MANAGEMENT’S DISCUSSION AND ANALYSIS OF
FINANCIAL CONDITION AND RESULTS OF OPERATIONS
The following discussion and analysis of our financial condition and results of operations should be read together with “Selected Historical Combined Consolidated Financial and Other Data” and the historical combined consolidated financial statements and related notes included elsewhere in this prospectus. This discussion contains forward-looking statements that involve risks and uncertainties. See the section entitled “Forward Looking Statements.” Our actual results and the timing of selected events could differ materially from those discussed in these forward-looking statements as a result of certain factors, including those discussed in “Risk Factors” and elsewhere in this prospectus.
Overview
Business
We are an independent investment management firm that provides a broad range of investment solutions through separately managed accounts, mutual funds and collective investment trust funds. Founded in 1970, we offer equity and fixed income portfolios as well as a range of blended asset portfolios, such as life cycle portfolios, that use a mix of stocks and bonds. We serve a diversified client base of high net worth individuals and institutions, including 401(k) plans, pension plans, Taft-Hartley plans, and endowments and foundations. Our operations are based principally in the United States, with our headquarters located in Fairport, New York.
Our Distribution Channels
We derive substantially all of our revenues from investment management fees earned from providing advisory services to separately managed accounts and mutual funds and collective investment trusts—including those offered by the Manning & Napier Fund, Inc., or the Fund, and Exeter Trust Company—which are distributed through four primary channels:
| • | Direct Channel. Our Direct Channel revenue is derived from direct relationships between high net worth individuals or institutional clients and our representatives. |
| • | Platform/Sub-Advisor Channel. Our Platform/Sub-Advisor Channel revenue is derived from investment programs or platforms, such as mutual fund wrap programs, for which we serve as an advisor or sub-advisor. |
| • | Intermediary Channel. Our Intermediary Channel revenue is derived from third-party intermediaries or financial advisors, such as those affiliated with wirehouses or independent broker dealers, that have the primary relationships with clients. |
| • | Other Retail Channel. Our Other Retail Channel revenue is derived from the Fund complex without involvement from our representatives or support teams. |
60
Table of Contents
Our AUM was $42.6 billion as of March 31, 2011. The composition of our AUM as of December 31, 2010, by channel and portfolios, is set forth in the table below.
| As of December 31, 2010 | ||||||||||||||||
| Blended Asset |
Equity | Fixed Income | Total | |||||||||||||
| Total AUM | (dollar amounts in millions) | |||||||||||||||
| Direct Channel |
$ | 11,489.0 | $ | 8,878.0 | $ | 1,068.2 | $ | 21,435.2 | ||||||||
| Platform/Sub-advisor Channel |
874.6 | 8,263.8 | 22.1 | 9,160.5 | ||||||||||||
| Intermediary Channel |
4,187.0 | 1,536.0 | 214.0 | 5,937.0 | ||||||||||||
| Other Retail Channel |
739.4 | 1,569.6 | — | 2,309.0 | ||||||||||||
| Total |
$ | 17,290.0 | $ | 20,247.4 | $ | 1,304.3 | $ | 38,841.7 | ||||||||
| Percentage of total AUM |
||||||||||||||||
| Direct Channel |
30 | % | 23 | % | 3 | % | 56 | % | ||||||||
| Platform/Sub-advisor Channel |
2 | % | 21 | % | 0 | % | 23 | % | ||||||||
| Intermediary Channel |
11 | % | 4 | % | 0 | % | 15 | % | ||||||||
| Other Retail Channel |
2 | % | 4 | % | 0 | % | 6 | % | ||||||||
| Total |
45 | % | 52 | % | 3 | % | 100 | % | ||||||||
| Percentage of portfolio by channel |
||||||||||||||||
| Direct Channel |
66 | % | 44 | % | 82 | % | 56 | % | ||||||||
| Platform/Sub-advisor Channel |
5 | % | 41 | % | 2 | % | 23 | % | ||||||||
| Intermediary Channel |
24 | % | 8 | % | 16 | % | 15 | % | ||||||||
| Other Retail Channel |
5 | % | 7 | % | 0 | % | 6 | % | ||||||||
| Total |
100 | % | 100 | % | 100 | % | 100 | % | ||||||||
| Percentage of channel by portfolio |
||||||||||||||||
| Direct Channel |
54 | % | 41 | % | 5 | % | 100 | % | ||||||||
| Platform/Sub-advisor Channel |
10 | % | 90 | % | 0 | % | 100 | % | ||||||||
| Intermediary Channel |
71 | % | 26 | % | 3 | % | 100 | % | ||||||||
| Other Retail Channel |
32 | % | 68 | % | 0 | % | 100 | % | ||||||||
Direct Channel. Our Direct Channel contributed 59% of our total new business production for the year ended December 31, 2010 and 56% of our total AUM as of December 31, 2010. This channel has historically been the largest driver of new business growth and we anticipate it will continue to be going forward, given our focus on forming strong, consultative relationships with our clients.
During 2010, 77% of the channel’s new business represented separate accounts while 23% represented mutual funds and collective investment trusts. As of December 31, 2010, blended asset portfolios represented 54% of the channel’s total AUM, while equity and fixed portfolios represented 41% and 5%, respectively. We anticipate blended asset portfolios will continue to constitute a meaningful portion of the Direct Channel’s new asset flows and total AUM going forward given our relationships with high net worth individuals and middle market institutions. However, relationships with larger institutions have resulted in strong growth in equity portfolios as a percentage of total AUM, which will likely continue given the breadth of our offerings, including domestic, international and global equity portfolios.
Platform/Sub-Advisor Channel. Our Platform/Sub-Advisor Channel contributed 15% of our total new business production for the year ended December 31, 2010 and represented 23% of total AUM as of December 31, 2010. To facilitate our expanding relationships in our Platform/Sub-Advisor Channel, over the last three years we have more than doubled the number of our dealer relationships in this channel from 122 to 254. This increase has expanded the number of financial intermediaries offering our mutual funds and collective
61
Table of Contents
investment trusts to clients and will afford us the opportunity for continued growth in the Platform/Sub-Advisor Channel as we penetrate these third-party advisory platform relationships in the future. These relationships are an important component in expanding both our 401(k) life cycle business as well as our institutional mutual fund business.
As of December 31, 2010 our mutual funds and collective investment trusts constituted 71% of Platform/Sub-Advisor Channel AUM, of which more than 85% comprised equity and international equity mutual fund portfolios; our separately managed accounts constituted the remaining 29% of Platform/Sub-Advisor Channel AUM, of which less than 1% comprised active asset allocation blended asset portfolios.
Intermediary Channel. Our Intermediary Channel contributed 11% of our total new business production for the year ended December 31, 2010, and represented 15% of our total AUM as of December 31, 2010. Mutual funds and collective investment trusts represent 32% of our total AUM in this channel, with separate accounts representing the remaining 68% of channel AUM. We anticipate greater new asset flows in our mutual funds going forward given our focus on wirehouse advisors and retirement plan advisors.
As of December 31, 2010, 71% of AUM in the Intermediary Channel was represented by blended asset portfolios, with 26% in equity portfolios and 3% in fixed income portfolios. We expect this channel to continue to be focused on blended portfolios given our emphasis on advisors that work with retirement plans. Specifically, we anticipate greater use of our life cycle mutual funds and collective investment trusts by advisors that are attracted to the technology solutions we have developed to assist advisors in performing one-on-one participant education sessions. However, our allocation to equity portfolios within this channel may also increase due to interest from wirehouse advisors.
Other Retail Channel. Our Other Retail Channel represented 6% of our total AUM as of December 31, 2010. As this channel represents mutual fund business that is not sourced or serviced by our representatives, it is the smallest channel in terms of total AUM. New asset flows in the Other Retail Channel represented 13% of overall flows during the calendar year ending December 31, 2010, driven by our strong track records and various industry accolades across our mutual fund offerings. As of December 31, 2010, 68% of the channel’s AUM represented equity portfolios, with the remaining 32% representing blended asset portfolios.
Results of Operations
Below is a discussion of our consolidated results of operations for the three months ended March 31, 2010 and 2011 and the years ended December 31, 2008, 2009 and 2010.
Key Components of Results of Operations
Overview. Changes to our operating results over time are largely driven by net new client asset flows and changes to the market value of our AUM.
An important factor influencing inflows and outflows of our AUM is the investment performance of our various investment approaches. Our variety of stock selection strategies, absolute pricing discipline, and active asset allocation management approach generally has led us to the following characteristics over the course of a typical market cycle, which includes a bull market (a period of rising stock prices coming out of a bear market), a speculative bull market (a period of overheating in the market as a whole or segments of the market) and a bear market (a period of price correction):
| Market Phase |
Absolute Return Characteristics |
Relative Return Characteristics | ||
| Bull Market |
Positive Absolute Returns | Competitive Relative Returns | ||
| Speculative Bull Market |
Positive Absolute Returns | Lagging Relative Returns | ||
| Bear Market |
Negative Absolute Returns | Strong Relative Returns | ||
62
Table of Contents
Coming out of a speculative bull market, we have traditionally been conservatively positioned so as to provide meaningful protection of principal for our clients. Our ability to provide such protection during significant bear markets such as 1987 and 2000 to 2002 has helped us build strong long-term relationships with clients and intermediaries that have seen the track record of our investment process over multiple market cycles.
Other components of our operating results include:
| • | asset-based fee rates and changes in those rates; |
| • | the composition of our AUM among various portfolios, vehicles and client types; and |
| • | the rate of increase in our variable and fixed costs, which is affected by the rate of revenue increases, compensation and year-to-year changes in incentive bonuses, changes to base compensation, vendor-related costs and investment spending on new products, consultative staffing and proprietary and third-party technology development. |
Assets Under Management. The following tables present the components of our AUM for our separately managed accounts and our mutual funds and collective investment trusts for the periods indicated. The first table reflects the shift in the periods indicated from AUM comprised primarily of our separately managed accounts to a more balanced AUM comprised of both our separately managed accounts and our mutual funds/collective investment trusts. The second table, together with the first table, reflects the shift in the periods indicated that has occurred due to the strong growth of our mutual funds/collective investment trusts. Except for the year ended December 31, 2008, when the S&P 500 Index declined by 37.0%, in each other period set forth below our AUM has registered year-over-year growth in excess of 27%.
| Separately managed accounts |
Mutual funds and collective investment trusts |
Total | Separately managed accounts |
Mutual funds and collective investment trusts |
Total | |||||||||||||||||||
| (dollar amounts in millions) | ||||||||||||||||||||||||
| Assets under management |
||||||||||||||||||||||||
| As of December 31, 2006 |
$ | 12,273.2 | $ | 2,400.9 | $ | 14,674.1 | 83.6 | % | 16.4 | % | 100.0 | % | ||||||||||||
| Net new client flows |
1,468.6 | 1,326.7 | 2,795.3 | |||||||||||||||||||||
| Market appreciation |
1,095.9 | 230.4 | 1,326.3 | |||||||||||||||||||||
| As of December 31, 2007 |
14,837.7 | 3,958.0 | 18,795.7 | 78.9 | % | 21.1 | % | 100.0 | % | |||||||||||||||
| Net new client flows |
900.0 | 2,199.7 | 3,099.7 | |||||||||||||||||||||
| Market depreciation |
(4,018.9 | ) | (1,645.1 | ) | (5,664.0 | ) | ||||||||||||||||||
| As of December 31, 2008 |
11,718.8 | 4,512.6 | 16,231.4 | 72.2 | % | 27.8 | % | 100.0 | % | |||||||||||||||
| Net new client flows |
2,158.6 | 4,540.3 | 6,698.9 | |||||||||||||||||||||
| Market appreciation |
3,356.8 | 1,984.2 | 5,341.0 | |||||||||||||||||||||
| As of December 31, 2009 |
17,234.2 | 11,037.1 | 28,271.3 | 61.0 | % | 39.0 | % | 100.0 | % | |||||||||||||||
| Net new client flows |
3,028.4 | 3,435.6 | 6,464.0 | |||||||||||||||||||||
| Market appreciation |
2,672.5 | 1,433.9 | 4,106.4 | |||||||||||||||||||||
| As of December 31, 2010 |
22,935.1 | 15,906.6 | 38,841.7 | 59.0 | % | 41.0 | % | 100.0 | % | |||||||||||||||
| Net new client flows |
463.6 | 1,572.4 | 2,036.0 | |||||||||||||||||||||
| Market appreciation |
985.4 | 701.0 | 1,686.4 | |||||||||||||||||||||
| As of March 31, 2011 |
$ | 24,384.1 | $ | 18,180.0 | $ | 42,564.1 | 57.3 | % | 42.7 | % | 100.0 | % | ||||||||||||
63
Table of Contents
| Separately
managed accounts |
Mutual funds and
collective investment trusts |
Total | ||||||||||
| Annual growth rates |
||||||||||||
| December 31, 2007 vs. December 31, 2006 |
20.9 | % | 64.9 | % | 28.1 | % | ||||||
| December 31, 2008 vs. December 31, 2007 |
(21.0 | %) | 14.0 | % | (13.6 | %) | ||||||
| December 31, 2009 vs. December 31, 2008 |
47.1 | % | 144.6 | % | 74.2 | % | ||||||
| December 31, 2010 vs. December 31, 2009 |
33.1 | % | 44.1 | % | 37.4 | % | ||||||
| Other growth rates |
||||||||||||
| March 31, 2011 vs. December 31, 2010 |
6.3 | % | 14.3 | % | 9.6 | % | ||||||
| Compound annual growth rate - December 31, 2006 through December 31, 2010 |
16.9 | % | 60.4 | % | 27.6 | % | ||||||
Revenue. Our revenues primarily consist of investment management fees earned from managing our clients’ AUM. We earn our investment management fees as a percentage of our clients’ AUM either as of a specified date or on a daily basis. Our investment management fees fluctuate based on the average fee rate for our investment management products, which are affected by the composition of our AUM among various portfolios and investment vehicles. We currently do not have revenues from performance fee based products.
MNA, our affiliate, serves as the investment advisor to the Fund and Exeter Trust Company. The Fund is currently a family of 27 open-end mutual funds that offer no-load share classes designed to meet the needs of a range of institutional and other investors. Exeter Trust Company is an affiliated New Hampshire-chartered trust company that sponsors a family of collective investment trusts for qualified retirement plans, including 401(k) plans. These mutual funds and collective investment trusts comprised $18.2 billion, or 43%, of our AUM as of March 31, 2011, and investment management fees from these mutual funds and collective investment trusts were $39.1 million, or 50%, of our revenues as of March 31, 2011.
MNA also serves as the investment advisor to all of our separately managed accounts, managing $24.4 billion, or 57%, of our AUM as of March 31, 2011, including assets managed as a sub-advisor to pooled investment vehicles and assets in client accounts invested in the Fund. Investment management fees from separately managed accounts represented $35.4 million, or 45%, of our revenues for the three months ended March 31, 2011.
Operating Expenses. Our largest operating expenses are employee compensation and sub-transfer agent/shareholder service fees, discussed further below, with a significant portion of these expenses varying in a direct relationship to our AUM and revenues. We review our operating expenses in relation to the investment market environment and changes in our revenues. However, we are generally willing to make expenditures as necessary even in the face of declining rates of growth in revenues in order to support our investment products, our client service levels, strategic initiatives and our long-term value.
| • | Compensation and related costs. Employee compensation and related costs represent our largest expense, including employee salaries and benefits, incentive compensation to investment and sales professionals and stock-based compensation. These costs are affected by changes in the employee headcount and mix of existing job descriptions, competitive factors and new product and service initiatives requiring the addition of new skill sets and/or expanded or upgraded staffing. In connection with the reorganization transactions, certain of the Manning & Napier Companies will amend and restate their respective shareholders’ agreement, pursuant to which, among other things, the vesting terms related to the current ownership interests of our employees, including our named executive officers other than William Manning, will be amended. In addition, additional ownership interests will be granted to William Manning in connection with the reorganization transactions. As a result, we will recognize non-cash compensation expenses through 2014. |
64
Table of Contents
| • | Sub-transfer agent/shareholder service fees. Sub-transfer agent/shareholder service fees represent amounts paid to various platforms that distribute our mutual fund and collective investment trust products. These expenses increase as the AUM in our mutual fund and collective investment trust products increase. |
| • | Other operating expenses. Other operating expenses include costs for custodial services, professional fees, including accounting and legal fees, occupancy and facility costs, as well as other costs related to travel and entertainment expenses, insurance, market data service expenses and all other miscellaneous costs associated with managing the day-to-day operations of our business. Following this offering, we expect to incur additional expenses as a result of becoming a public company, including expenses related to additional staffing, director fees, director and officer insurance, Sarbanes-Oxley compliance and other SEC reporting and compliance requirements, professional fees and other expenses. These expenses will increase our operating expenses and reduce net income. |
Non-Operating Income (Loss). Non-operating income (loss) includes interest expense, interest and dividend income, and realized gains (losses) on sales of marketable securities. Within interest expense, we have recognized expenses related to the agreement with William Manning, our Chairman and controlling stockholder. Prior to this offering, we had a mandatory redemption obligation upon the death of William Manning to pay a formula-derived amount to his estate. Our liability related to this mandatory redemption obligation was calculated each fiscal quarter, and the change in the liability was reflected as non-cash interest expense. Such mandatory redemption obligation will terminate immediately prior to the consummation of this offering and we will no longer reflect non-cash interest expense or the liability related to such agreement.
Provision for Income Taxes. Historically, we have not had a significant provision for income taxes due to the fact that the combined entity is generally made up of S-corporations and limited liability companies. However, following this offering, we anticipate an increase in the provision for income taxes due to the future requirement to include provisions for federal and state income taxes as a result of Manning & Napier’s C-corporation status, offset by the benefits of the tax receivable agreement. See “Unaudited Pro Forma Combined Consolidated Financial Information.”
Critical Accounting Policies and Estimates
The combined consolidated financial statements are prepared in accordance with GAAP and related rules and regulations of the SEC. The preparation of combined consolidated financial statements in conformity with GAAP requires management to make estimates or assumptions that affect the reported amounts of assets and liabilities at the date of the financial statements and the reported amounts of revenues and expenses during the periods presented. Accordingly, actual results could differ from these estimates or assumptions and may have a material effect on the combined consolidated financial statements.
Accounting policies are an integral part of our financial statements. A thorough understanding of these accounting policies is essential when reviewing our reported results of operations and our financial condition. Our management has identified the following significant accounting policies that are critical to understanding our business and prospects for future performance, as these policies affect the reported amounts of revenue and other significant areas that involve management’s judgment and estimates:
| • | Shares subject to mandatory redemption; and |
| • | Revenue recognition. |
These policies and our procedures related to these policies are described in detail below. In additional, please refer to the notes to our combined consolidated financial statements included elsewhere in this prospectus for further discussion of our accounting policies.
65
Table of Contents
Shares Subject to Mandatory Redemption
Prior to this offering, we entered into an agreement with William Manning, pursuant to which we had a mandatory redemption obligation upon his death to pay his pro rata share of net revenue (as defined in such agreement) for the four quarters immediately preceding Mr. Manning’s death. In accordance with the requirements of accounting for certain financial instruments with characteristics of both liabilities and equity, we have recognized a liability for shares subject to mandatory redemption in our financial statements included elsewhere in this prospectus. This will change as we transition from a private company to a public company.
Revenue Recognition
The majority of our revenues are based on fees charged to manage customers’ portfolios. Investment management fees are generally computed as a percentage of AUM and recognized as earned. Fees for providing investment advisory services are computed and billed in accordance with the provisions of the applicable investment management agreements. For our separately managed accounts, clients generally pay investment management fees in advance for a semi-annual bill cycle. In these cases, we defer the revenue and recognize it over a six month period. In some cases, clients will pay investment management fees quarterly in arrears. For these cases, we estimate revenues based on the prior bill cycle and record an adjustment when the actual bill is calculated at the end of the quarter. Revenue is also earned for providing custodial services, sub-advisor services to mutual funds and collective investment trusts and other services.
For mutual funds and collective investment trust vehicles, our fees are calculated and earned daily based on AUM.
All other revenue earned by us is recognized on a GAAP accounting basis as earned per the terms of the specific contract.
Use of Non-GAAP Financial Measures
To provide investors with greater insight, promote transparency and allow for a more comprehensive understanding of the information used by management in its financial and operational decision-making, we supplement our combined consolidated financial statements presented on a GAAP basis with a non-GAAP financial measure of earnings. Our management uses EBITDA and economic income and also will use Adjusted EBITDA and economic net income as financial measures to evaluate the profitability and efficiency of our business model. Adjusted EBITDA, EBITDA, economic income and economic net income are not presented in accordance with GAAP. Economic income excludes from income before provision for income taxes the non-cash interest expense associated with the liability for shares subject to mandatory redemption and the reorganization-related share-based compensation, which results in non-cash compensation expense reported over the vesting period. Economic net income assumes that all of our economic income would be subject to federal, state and local income tax. We believe these non-GAAP financial measures are useful since management does not consider these non-cash expenses when evaluating financial results. Our non-GAAP financial measures may differ from similar measures used by other companies, even if similar terms are used to identify such measures.
We use non-GAAP financial measures to assess the strength of the underlying operations of our business. We believe these adjustments, and the non-GAAP financial measures derived from them, provide information to better analyze our operations between periods and over time. We believe non-GAAP financial measures within the combined consolidated statements of income data included elsewhere in this prospectus specific to the accounting for certain financial instruments with characteristics of both liabilities and equity are useful because the resulting expenses will not be recognized upon completion of this offering. Investors should consider non-GAAP financial measures in addition to, and not as a substitute for, financial measures prepared in accordance with GAAP.
66
Table of Contents
Three Months Ended March 31, 2011 Compared to Three Months Ended March 31, 2010
Assets Under Management
The following table reflects changes in our AUM for the three months ended March 31, 2011 and 2010:
| Three Months Ended March 31, | Increase (Decrease) | |||||||||||||||
| 2011 | 2010 | $ | % | |||||||||||||
| (unaudited) | ||||||||||||||||
| (dollar amounts in millions) | ||||||||||||||||
| Separately managed accounts |
||||||||||||||||
| Beginning assets under management |
$ | 22,935.1 | $ | 17,234.2 | $ | 5,700.9 | 33 | % | ||||||||
| Net new client flows |
463.6 | 479.1 | (15.5 | ) | (3 | %) | ||||||||||
| Market appreciation |
985.4 | 628.7 | 356.7 | 57 | % | |||||||||||
| Ending assets under management |
$ | 24,384.1 | $ | 18,342.0 | $ | 6,042.1 | 33 | % | ||||||||
| Mutual funds and collective investment trusts |
||||||||||||||||
| Beginning assets under management |
$ | 15,906.6 | $ | 11,037.1 | $ | 4,869.5 | 44 | % | ||||||||
| Net new client flows |
1,572.4 | 1,438.5 | 133.9 | 9 | % | |||||||||||
| Market appreciation |
701.0 | 375.2 | 325.8 | 87 | % | |||||||||||
| Ending assets under management |
$ | 18,180.0 | $ | 12,850.8 | $ | 5,329.2 | 41 | % | ||||||||
| Total assets under management |
||||||||||||||||
| Beginning assets under management |
$ | 38,841.7 | $ | 28,271.3 | $ | 10,570.4 | 37 | % | ||||||||
| Net new client flows |
2,036.0 | 1,917.6 | 118.4 | 6 | % | |||||||||||
| Market appreciation |
1,686.4 | 1,003.9 | 682.5 | 68 | % | |||||||||||
| Ending assets under management |
$ | 42,564.1 | $ | 31,192.8 | $ | 11,371.3 | 36 | % | ||||||||
Our total AUM increased by $11.4 billion, or 36%, to $42.6 billion as of March 31, 2011 from $31.2 billion as of March 31, 2010. As of March 31, 2011, the composition of our AUM was 43% in mutual funds and collective investment trusts and 57% in separate accounts as compared to 41% in mutual funds and collective investment trusts and 59% in separate accounts as of March 31, 2010. Separate account and mutual funds and collective investment trusts AUM increased by 33% and 41%, respectively, as of March 31, 2011 compared to March 31, 2010. Of the $3.7 billion increase in AUM from December 31, 2010 to March 31, 2011, 55% was driven by net new client flows of $2.0 billion, primarily due to inflows from new and existing financial intermediary relationships. Of the $2.0 billion net new client flows, $1.6 billion, or 77%, was derived from mutual fund and collective investment trusts and 23% was derived from separately managed accounts; 45% of the increase in our total AUM for the three months ended March 31, 2011 came from investment gains.
Our market appreciation during the three months ended March 31, 2011 constituted a 4.3% rate of increase in our total AUM. The investment gain was 4.3% in separately managed accounts and 4.4% in mutual funds and collective investment trusts, reflecting primarily a difference in the mix of portfolios in the two investment vehicles.
The rates of increase in AUM during the three months ended March 31, 2011 were most rapid, in excess of 12%, for our equity portfolios. The blended asset portfolios also experienced strong growth of 7%. Equity portfolios contributed 70% of our total increase in AUM as of March 31, 2011 compared to March 31, 2010, while blended asset portfolios contributed 30% of our total increase in AUM as of March 31, 2011 compared to March 31, 2010.
67
Table of Contents
The following table sets forth our results of operations for the three months ended March 31, 2011 and 2010:
| Three Months Ended March 31, | Increase (Decrease) | |||||||||||||||
| 2011 | 2010 | $ | % | |||||||||||||
| (unaudited) | ||||||||||||||||
| (dollar amounts in thousands) | ||||||||||||||||
| Statements of income data: |
||||||||||||||||
| Operating revenues |
||||||||||||||||
| Investment management services revenue |
$ | 78,040 | $ | 57,210 | $ | 20,830 | 36 | % | ||||||||
| Operating expenses |
||||||||||||||||
| Compensation and related costs |
22,894 | 16,775 | 6,119 | 36 | % | |||||||||||
| Sub-transfer agent and shareholder service costs |
11,695 | 8,498 | 3,197 | 38 | % | |||||||||||
| Other operating costs |
6,225 | 5,789 | 436 | 8 | % | |||||||||||
| Total operating expenses |
40,814 | 31,062 | 9,752 | 31 | % | |||||||||||
| Total operating income |
37,226 | 26,148 | 11,078 | 42 | % | |||||||||||
| Non-operating income (loss) |
||||||||||||||||
| Interest expense on shares subject to mandatory redemption |
(13,288 | ) | (16,219 | ) | 2,931 | (18 | %) | |||||||||
| Interest expense |
(9 | ) | (4 | ) | (5 | ) | 125 | % | ||||||||
| Interest and dividend income |
14 | 11 | 3 | 27 | % | |||||||||||
| Net capital gains (losses) on investments |
3 | 3 | — | 0 | % | |||||||||||
| Total non-operating income (loss) |
(13,280 | ) | (16,209 | ) | 2,929 | (18 | %) | |||||||||
| Income before provision for income taxes |
23,946 | 9,939 | 14,007 | 141 | % | |||||||||||
| Provision for income taxes |
286 | 211 | 75 | 36 | % | |||||||||||
| Net income |
$ | 23,660 | $ | 9,728 | $ | 13,932 | 143 | % | ||||||||
Revenues
Our investment management services revenue increased by $20.8 million, or 36%, to $78.0 million for the three months ended March 31, 2011 from $57.2 million for the three months ended March 31, 2010. This increase was driven primarily by an $11.7 billion, or 40%, increase in our average AUM to $40.9 billion for the three months ended March 31, 2011 from $29.2 billion for the three months ended March 31, 2010.
Operating Expenses
Our operating expenses increased by $9.7 million, or 31%, to $40.8 million for the three months ended March 31, 2011 from $31.1 million for the three months ended March 31, 2010. This increase was driven primarily by increases in compensation and sub-transfer agent and shareholder service fees.
Compensation and related costs increased by $6.1 million, or 36%, to $22.9 million for the three months ended March 31, 2011 from $16.8 million for the three months ended March 31, 2010. This increase was driven in large part by higher incentive compensation due to analyst bonuses and sales representative commissions, as well as increases in overall firm-wide headcount of 11%, to 414 as of March 31, 2011 from 374 as of March 31, 2010.
Sub-transfer agent and shareholder service fees increased by $3.2 million, or 38%, to $11.7 million for the three months ended March 31, 2011 from $8.5 million for the three months ended March 31, 2010. The increase was generally attributable to a 46% increase in mutual funds and collective investment trusts average AUM for the three months ended March 31, 2011 compared to March 31, 2010.
68
Table of Contents
Non-Operating Income (Loss)
Non-operating income (loss) decreased by $2.9 million, or 18%, to $13.3 million for the three months ended March 31, 2011 from $16.2 million for the three months ended March 31, 2010. The decrease was primarily due to the decrease in non-cash interest expense on the shares subject to mandatory redemption. We have recognized interest expense resulting from the period-to-period change in the amount of the liability for shares subject to mandatory redemption.
Provision for Income Taxes
Provision for income taxes increased by $0.1 million, or 36%, to $0.3 million for the three months ended March 31, 2011 from $0.2 million for the three months ended March 31, 2010. The increase was primarily due to a 42% increase in operating income for the three months ended March 31, 2011 compared to the three months ended March 31, 2010.
Year Ended December 31, 2010 Compared to Year Ended December 31, 2009
Assets Under Management
The following table reflects changes in our AUM for the years ended December 31, 2010 and 2009:
| Year Ended December 31, | Increase (Decrease) | |||||||||||||||
| 2010 | 2009 | $ | % | |||||||||||||
| (dollar amounts in millions) | ||||||||||||||||
| Separately managed accounts |
||||||||||||||||
| Beginning assets under management |
$ | 17,234.2 | $ | 11,718.8 | $ | 5,515.4 | 47 | % | ||||||||
| Net new client flows |
3,028.4 | 2,158.6 | 869.8 | 40 | % | |||||||||||
| Market appreciation |
2,672.5 | 3,356.8 | (684.3 | ) | (20 | %) | ||||||||||
| Ending assets under management |
$ | 22,935.1 | $ | 17,234.2 | $ | 5,700.9 | 33 | % | ||||||||
| Mutual funds and collective investment trusts |
||||||||||||||||
| Beginning assets under management |
$ | 11,037.1 | $ | 4,512.6 | $ | 6,524.5 | 145 | % | ||||||||
| Net new client flows |
3,435.6 | 4,540.3 | (1,104.7 | ) | (24 | %) | ||||||||||
| Market appreciation |
1,433.9 | 1,984.2 | (550.3 | ) | (28 | %) | ||||||||||
| Ending assets under management |
$ | 15,906.6 | $ | 11,037.1 | $ | 4,869.5 | 44 | % | ||||||||
| Total assets under management |
||||||||||||||||
| Beginning assets under management |
$ | 28,271.3 | $ | 16,231.4 | $ | 12,039.9 | 74 | % | ||||||||
| Net new client flows |
6,464.0 | 6,698.9 | (234.9 | ) | (4 | %) | ||||||||||
| Market appreciation |
4,106.4 | 5,341.0 | (1,234.6 | ) | (23 | %) | ||||||||||
| Ending assets under management |
$ | 38,841.7 | $ | 28,271.3 | $ | 10,570.4 | 37 | % | ||||||||
Our total AUM increased by $10.6 billion, or 37%, to $38.8 billion as of December 31, 2010 from $28.3 billion as of December 31, 2009. As of December 31, 2010, the composition of our AUM was 41% in mutual funds and collective investment trusts and 59% in separate accounts as compared to 39% in mutual funds and collective investment trusts and 61% in separate accounts as of December 31, 2009. Of the total $10.6 billion increase in AUM, 61% was driven by net new client flows of $6.5 billion, primarily due to inflows from new and existing financial intermediary relationships. Of the $6.5 billion net new client flows, $3.4 billion, or 53%, was derived from mutual funds and collective investment trusts and 47% from separately managed accounts; 39% of the increase in our total AUM in 2010 came from investment gains.
Our market appreciation during the year ended December 31, 2010 constituted a 14.5% rate of increase in our total AUM compared to the year ended December 31, 2009. The investment gain was 15.5% in separately
69
Table of Contents
managed accounts and 13.0% in mutual funds and collective investment trusts, reflecting primarily a difference in the mix of portfolios in the two investment vehicles.
The rates of increase in AUM during the year ended December 31, 2010 were most rapid, in excess of 50%, for our equity portfolios. The blended asset portfolios also experienced strong growth of 24%. Equity portfolios contributed 68% of our total increase in AUM as of December 31, 2010 compared to December 31, 2009, while blended asset portfolios contributed 32% of our total increase in AUM as of December 31, 2010 compared to December 31, 2009.
The following table sets forth our results of operations for the years ended December 31, 2010 and 2009:
| Year Ended December 31, | Increase (Decrease) | |||||||||||||||
| 2010 | 2009 | Amount | % | |||||||||||||
| (dollar amounts in thousands) | ||||||||||||||||
| Statements of income data: |
||||||||||||||||
| Operating revenues |
||||||||||||||||
| Investment management services revenue |
$ | 255,472 | $ | 162,660 | $ | 92,812 | 57 | % | ||||||||
| Operating expenses |
||||||||||||||||
| Compensation and related costs |
78,416 | 55,643 | 22,773 | 41 | % | |||||||||||
| Sub-transfer agent and shareholder service costs |
36,830 | 19,853 | 16,977 | 86 | % | |||||||||||
| Other operating costs |
25,284 | 22,252 | 3,032 | 14 | % | |||||||||||
| Total operating expenses |
140,530 | 97,748 | 42,782 | 44 | % | |||||||||||
| Total operating income |
114,942 | 64,912 | 50,030 | 77 | % | |||||||||||
| Non-operating income (loss) |
||||||||||||||||
| Interest expense on shares subject to mandatory redemption |
(61,243 | ) | (9,991 | ) | (51,252 | ) | 513 | % | ||||||||
| Interest expense |
(16 | ) | (125 | ) | 109 | (87 | %) | |||||||||
| Interest and dividend income |
126 | 140 | (14 | ) | (10 | %) | ||||||||||
| Net capital gains (losses) on investments |
1 | (151 | ) | 152 | (101 | %) | ||||||||||
| Total non-operating income (loss) |
(61,132 | ) | (10,127 | ) | (51,005 | ) | 504 | % | ||||||||
| Income before provision for income taxes |
53,810 | 54,785 | (975 | ) | (2 | %) | ||||||||||
| Provision for income taxes |
712 | 360 | 352 | 98 | % | |||||||||||
| Net income |
$ | 53,098 | $ | 54,425 | $ | (1,327 | ) | (2 | %) | |||||||
Revenues
Our investment management services revenue increased by $92.8 million, or 57%, to $255.5 million as of December 31, 2010 from $162.7 million as of December 31, 2009. This increase was attributable to an $11.7 billion, or 57%, increase in our average AUM to $32.3 billion for the year ended December 31, 2010 from $20.6 billion for the year ended December 31, 2009.
Operating Expenses
Total operating expenses increased by $42.8 million, or 44%, to $140.5 million for the year ended December 31, 2010 from $97.7 million for the year ended December 31, 2009. This increase was driven primarily by increases in compensation and sub-transfer agent and shareholder service fees.
Compensation and related costs increased by $22.8 million, or 41%, to $78.4 million for the year ended December 31, 2010 from $55.6 million for the year ended December 31, 2009. This increase was driven in large
70
Table of Contents
part by higher incentive compensation due to analyst bonuses and sales representative commissions, as well as increases in overall firm-wide headcount of 7.2%, to 404 as of December 31, 2010 from 377 as of December 31, 2009.
Sub-transfer agent and shareholder service fees increased by $16.9 million, or 86%, to $36.8 million for the year ended December 31, 2010 from $19.9 million for the year ended December 31, 2009. The increase was generally attributable to an 88% increase in mutual funds and collective investment trusts average AUM for the year ended December 31, 2010 compared to December 31, 2009.
Non-Operating Income (Loss)
Non-operating income (loss) increased by $51.0 million, or 504%, to $61.1 million for the year ended December 31, 2010 from $10.1 million for the year ended December 31, 2009. The increase was primarily due to the increase in non-cash interest expense on the shares subject to mandatory redemption. We have recognized interest expense resulting from the period-to-period change in the amount of the liability for shares subject to mandatory redemption.
Provision for Income Taxes
Provision for income taxes increased by $0.4 million, or 98%, to $0.7 million for the year ended December 31, 2010 from $0.3 million for the year ended December 31, 2009. The increase was primarily due to a 77% increase in operating income for the year ended December 31, 2010 compared to the year ended December 31, 2009.
Year Ended December 31, 2009 Compared to Year Ended December 31, 2008
Assets Under Management
The following table reflects changes in our AUM for the years ending December 31, 2009 and 2008:
| Year Ended December 31, | Increase (Decrease) | |||||||||||||||
| 2009 | 2008 | $ | % | |||||||||||||
| (dollar amounts in millions) | ||||||||||||||||
| Separately managed accounts |
||||||||||||||||
| Beginning assets under management |
$ | 11,718.8 | $ | 14,837.7 | $ | (3,118.9 | ) | (21 | %) | |||||||
| Net new client flows |
2,158.6 | 900.0 | 1,258.6 | 140 | % | |||||||||||
| Market appreciation (depreciation) |
3,356.8 | (4,018.9 | ) | 7,375.7 | (184 | %) | ||||||||||
| Ending assets under management |
$ | 17,234.2 | $ | 11,718.8 | $ | 5,515.4 | 47 | % | ||||||||
| Mutual funds and collective investment trusts |
||||||||||||||||
| Beginning assets under management |
$ | 4,512.6 | $ | 3,958.0 | $ | 554.6 | 14 | % | ||||||||
| Net new client flows |
4,540.3 | 2,199.7 | 2,340.6 | 106 | % | |||||||||||
| Market appreciation (depreciation) |
1,984.2 | (1,645.1 | ) | 3,629.3 | (221 | %) | ||||||||||
| Ending assets under management |
$ | 11,037.1 | $ | 4,512.6 | $ | 6,524.5 | 145 | % | ||||||||
| Total assets under management |
||||||||||||||||
| Beginning assets under management |
$ | 16,231.4 | $ | 18,795.7 | $ | (2,564.3 | ) | (14 | %) | |||||||
| Net new client flows |
6,698.9 | 3,099.7 | 3,599.2 | 116 | % | |||||||||||
| Market appreciation (depreciation) |
5,341.0 | (5,664.0 | ) | 11,005.0 | (194 | %) | ||||||||||
| Ending assets under management |
$ | 28,271.3 | $ | 16,231.4 | $ | 12,039.9 | 74 | % | ||||||||
71
Table of Contents
Our total AUM increased by $12.1 billion, or 74%, to $28.3 billion as of December 31, 2009 from $16.2 billion as of December 31, 2008. As of December 31, 2009, the composition of our AUM was 39% in mutual funds and collective investment trusts and 61% in separate accounts as compared to 28% in mutual funds and collective investment trusts and 72% in separate accounts as of December 31, 2008. Of the total $12.1 billion increase in AUM, 56% of such increase was driven by net new client flows of $6.7 billion, primarily due to inflows from new and existing financial intermediary relationships. Of the $6.7 billion net new client flows, $4.5 billion, or 68%, was derived from mutual fund and collective investment trusts and 32% from separately managed accounts; 44% of the increase in our total AUM in 2009 came from investment gains.
Our market appreciation during the year ended December 31, 2009 constituted a 32.9% rate of increase in our total AUM compared to the year ended December 31, 2008. The investment gain was 28.6% in separately managed accounts and 44.0% in mutual funds and collective investment trusts, reflecting primarily a difference in the mix of portfolios in the two investment vehicles.
The rates of increase in AUM during the year ended December 31, 2009 were most rapid, in excess of 100%, for our equity portfolios. The blended asset portfolios also experienced strong growth of 38%. Equity portfolios contributed 68% of the our total increase in AUM as of December 31, 2009 compared to December 31, 2008, while blended asset portfolios contributed 32% of our total increase in AUM as of December 31, 2009 compared to December 31, 2008.
The following table sets forth our results of operations for the year ended December 31, 2009 and 2008:
| Year Ended December 31, | Increase (Decrease) | |||||||||||||||
| 2009 | 2008 | Amount | % | |||||||||||||
| (dollar amounts in thousands) | ||||||||||||||||
| Statements of income data: |
||||||||||||||||
| Operating revenues |
||||||||||||||||
| Investment management services revenue |
$ | 162,660 | $ | 145,622 | $ | 17,038 | 12 | % | ||||||||
| Operating expenses |
||||||||||||||||
| Compensation and related costs |
55,643 | 46,295 | 9,348 | 20 | % | |||||||||||
| Sub-transfer agent and shareholder service costs |
19,853 | 13,114 | 6,739 | 51 | % | |||||||||||
| Other operating costs |
22,252 | 20,690 | 1,562 | 8 | % | |||||||||||
| Total operating expenses |
97,748 | 80,099 | 17,649 | 22 | % | |||||||||||
| Total operating income |
64,912 | 65,523 | (611 | ) | (1 | )% | ||||||||||
| Non-operating income (loss) |
||||||||||||||||
| Interest expense on shares subject to mandatory redemption |
(9,991 | ) | (6,707 | ) | (3,284 | ) | 49 | % | ||||||||
| Interest expense |
(125 | ) | (174 | ) | 49 | (28 | %) | |||||||||
| Interest and dividend income |
140 | 602 | (462 | ) | (77 | %) | ||||||||||
| Net capital gains (losses) on investments |
(151 | ) | 122 | (273 | ) | (224 | %) | |||||||||
| Total non-operating income (loss) |
(10,127 | ) | (6,157 | ) | (3,970 | ) | 64 | % | ||||||||
| Income before provision for income taxes |
54,785 | 59,366 | (4,581 | ) | (8 | %) | ||||||||||
| Provision for income taxes |
360 | 374 | (14 | ) | (4 | %) | ||||||||||
| Net income |
$ | 54,425 | $ | 58,992 | $ | (4,567 | ) | (8 | %) | |||||||
Revenues
Our investment management services revenue increased by $17.0 million, or 12%, to $162.7 million as of December 31, 2009 from $145.6 million as of December 31, 2008. This increase was driven primarily from a $2.3 billion, or 13%, increase in our average AUM to $20.6 billion for the year ended December 31, 2009 from $18.2 billion for the year ended December 31, 2008.
72
Table of Contents
Operating Expenses
Our operating expenses increased by $17.6 million, or 22%, to $97.7 million for the year ending December 31, 2009 from $80.1 million for the year ended December 31, 2008. This increase was driven primarily by increases in compensation and sub-transfer agent and shareholder service fees.
Compensation and related costs increased by $9.3 million, or 20%, to $55.6 million for the year ended December 31, 2009 from $46.3 million for the year ended December 31, 2008. This increase was driven in large part by higher incentive compensation due to analyst bonuses and sales representative commissions, as well as increases in overall firm-wide headcount of 7%, to 377 as of December 31, 2009 from 353 as of December 31, 2008.
Sub-transfer agent and shareholder service fees increased by $6.8 million, or 51%, to $19.9 million for the year ended December 31, 2009 from $13.1 million for the year ended December 31, 2008. The increase was generally attributable to a 59% increase in mutual funds and collective investment trusts average AUM for the year ended December 31, 2009 compared to the year ended December 31, 2008.
Non-Operating Income (Loss)
Non-operating income (loss) increased by $4.0 million, or 64%, to $10.1 million for the year ended December 31, 2009 from $6.2 million for the year ended December 31, 2008. The increase was primarily due to the increase in non-cash interest expense on the shares subject to mandatory redemption. We have recognized interest expense resulting from the period-to-period change in the amount of the liability for shares subject to mandatory redemption.
Provision for Income Taxes
Provision for income taxes remained stable at $0.4 million for the year ended December 31, 2009 from the year ended December 31, 2008.
73
Table of Contents
Quarterly Results
The following tables set forth selected unaudited combined consolidated quarterly results of operations data and selected consolidated operating data for the eight quarters ended March 31, 2011. This unaudited information has been prepared on substantially the same basis as our audited combined consolidated financial statements and includes all adjustments consisting only of normal recurring adjustments, necessary to a fair statement of the consolidated results of operations and selected combined consolidated operating data for the periods presented therein. The unaudited combined consolidated quarterly data should be read together with the combined consolidated financial statements and related notes included elsewhere in this prospectus. The results for any quarter are not necessarily indicative of results for any future period and you should not rely on them as such. Changes to our operating results from one period to another are primarily caused by changes in the value of our AUM, which increase or decrease with the net inflows or outflows of cash into our various investment strategies and with the investment performance of these strategies.
| Three Months Ended | ||||||||||||||||||||||||||||||||
| March 31, 2011 |
December 31, 2010 |
September 30, 2010 |
June 30, 2010 |
March 31, 2010 |
December 31, 2009 |
September 30, 2009 |
June 30, 2009 |
|||||||||||||||||||||||||
| (unaudited) (in thousands) |
||||||||||||||||||||||||||||||||
| Statements of income data: |
||||||||||||||||||||||||||||||||
| Investment management services revenue |
$ | 78,040 | $ | 73,474 | $ | 63,242 | $ | 61,546 | $ | 57,210 | $ | 53,299 | $ | 42,890 | $ | 34,654 | ||||||||||||||||
| Operating expenses |
||||||||||||||||||||||||||||||||
| Compensation and related costs |
22,894 | 23,703 | 19,572 | 18,367 | 16,775 | 16,784 | 13,805 | 12,938 | ||||||||||||||||||||||||
| Sub-transfer agent and shareholder service costs |
11,695 | 10,537 | 9,212 | 8,583 | 8,498 | 7,412 | 5,406 | 3,875 | ||||||||||||||||||||||||
| Other operating costs |
6,225 | 7,229 | 6,125 | 6,140 | 5,789 | 6,291 | 5,467 | 5,511 | ||||||||||||||||||||||||
| Total operating expenses |
40,814 | 41,469 | 34,909 | 33,090 | 31,062 | 30,487 | 24,678 | 22,324 | ||||||||||||||||||||||||
| Total operating income |
37,226 | 32,005 | 28,333 | 28,456 | 26,148 | 22,812 | 18,212 | 12,330 | ||||||||||||||||||||||||
| Non-operating income (loss) |
||||||||||||||||||||||||||||||||
| Interest (expense) income on shares subject to mandatory redemption |
(13,288 | ) | (13,590 | ) | (13,534 | ) | (17,900 | ) | (16,219 | ) | (12,390 | ) | (2,926 | ) | 1,631 | |||||||||||||||||
| Interest expense |
(9 | ) | (7 | ) | (2 | ) | (3 | ) | (4 | ) | (28 | ) | (13 | ) | (80 | ) | ||||||||||||||||
| Interest and dividend income |
14 | 95 | 17 | 3 | 11 | 26 | 110 | 3 | ||||||||||||||||||||||||
| Net capital gains (losses) on investments |
3 | 1 | — | (3 | ) | 3 | (119 | ) | — | 63 | ||||||||||||||||||||||
| Income before provision for income taxes |
23,946 | 18,504 | 14,814 | 10,553 | 9,939 | 10,301 | 15,383 | 13,947 | ||||||||||||||||||||||||
| Provision for income taxes |
286 | 64 | 229 | 208 | 211 | 104 | 112 | 68 | ||||||||||||||||||||||||
| Net income |
$ | 23,660 | $ | 18,440 | $ | 14,585 | $ | 10,345 | $ | 9,728 | $ | 10,197 | $ | 15,271 | $ | 13,879 | ||||||||||||||||
| Other operating data: |
||||||||||||||||||||||||||||||||
| EBITDA |
$ | 37,493 | $ | 32,362 | $ | 28,651 | $ | 28,764 | $ | 26,464 | $ | 22,991 | $ | 18,438 | $ | 12,609 | ||||||||||||||||
| Economic income |
37,234 | 32,094 | 28,348 | 28,453 | 26,158 | 22,691 | 18,309 | 12,316 | ||||||||||||||||||||||||
Our management uses EBITDA and economic income as financial measures to evaluate the profitability and efficiency of our business model. We believe these non-GAAP financial measures are useful since management does not consider these non-cash expenses when evaluating financial results.
74
Table of Contents
The following table reconciles our adjusted margins with GAAP margins for the periods presented:
| Three Months Ended | ||||||||||||||||||||||||||||||||
| March 31, 2011 |
December 31, 2010 |
September 30, 2010 |
June 30, 2010 |
March 31, 2010 |
December 31, 2009 |
September 30, 2009 |
June 30, 2009 |
|||||||||||||||||||||||||
| (unaudited) (dollar amounts in thousands) |
||||||||||||||||||||||||||||||||
| Net income |
$ | 23,660 | $ | 18,440 | $ | 14,585 | $ | 10,345 | $ | 9,728 | $ | 10,197 | $ | 15,271 | $ | 13,879 | ||||||||||||||||
| Provision for income taxes |
286 | 64 | 229 | 208 | 211 | 104 | 112 | 68 | ||||||||||||||||||||||||
| Income before provision for income taxes |
23,946 | 18,504 | 14,814 | 10,553 | 9,939 | 10,301 | 15,383 | 13,947 | ||||||||||||||||||||||||
| Interest expense (income) on shares subject to mandatory redemption |
13,288 | 13,590 | 13,534 | 17,900 | 16,219 | 12,390 | 2,926 | (1,631 | ) | |||||||||||||||||||||||
| Economic income |
37,234 | 32,094 | 28,348 | 28,453 | 26,158 | 22,691 | 18,309 | 12,316 | ||||||||||||||||||||||||
| Interest expense |
9 | 7 | 2 | 3 | 4 | 28 | 13 | 80 | ||||||||||||||||||||||||
| Interest income |
(14 | ) | (95 | ) | (17 | ) | (3 | ) | (11 | ) | (26 | ) | (110 | ) | (3 | ) | ||||||||||||||||
| Depreciation and amortization |
264 | 356 | 318 | 311 | 313 | 298 | 226 | 216 | ||||||||||||||||||||||||
| EBITDA |
37,493 | 32,362 | 28,651 | 28,764 | 26,464 | 22,991 | 18,438 | 12,609 | ||||||||||||||||||||||||
| Revenue |
$ | 78,040 | $ | 73,474 | $ | 63,242 | $ | 61,546 | $ | 57,210 | $ | 53,299 | $ | 42,890 | $ | 34,654 | ||||||||||||||||
| Net income margin percentage |
30.3 | % | 25.1 | % | 23.1 | % | 16.8 | % | 17.0 | % | 19.0 | % | 35.6 | % | 40.1 | % | ||||||||||||||||
| Economic income margin percentage |
47.7 | % | 43.7 | % | 44.8 | % | 46.2 | % | 45.7 | % | 42.6 | % | 42.7 | % | 35.5 | % | ||||||||||||||||
| EBITDA margin percentage |
48.0 | % | 44.0 | % | 45.3 | % | 46.7 | % | 46.3 | % | 43.1 | % | 43.0 | % | 36.4 | % | ||||||||||||||||
Liquidity and Capital Resources
Historically, our cash and liquidity needs have been met primarily through cash generated by our operations. We expect that our cash and liquidity needs in the 12 months following the consummation of this offering will be met primarily through cash generated by our operations and a portion of the net proceeds that we receive from this offering. The following table set forth certain key financial data relating to our liquidity and capital resources as of March 31, 2011 and 2010 and December 31, 2010, 2009 and 2008:
| As of March 31, | As of December 31, | |||||||||||||||||||
| 2011 | 2010 | 2010 | 2009 | 2008 | ||||||||||||||||
| (unaudited) | ||||||||||||||||||||
| (in thousands) | ||||||||||||||||||||
| Cash and cash equivalents |
$ | 47,759 | $ | 34,993 | $ | 27,543 | $ | 24,802 | $ | 23,309 | ||||||||||
| Accounts receivable |
$ | 31,851 | $ | 20,798 | $ | 30,799 | $ | 21,374 | $ | 11,463 | ||||||||||
Historically, the Manning & Napier Companies have distributed substantially all of their profits to their equityholders. In connection with the reorganization, Manning & Napier Group will distribute to its pre-offering members all of the retained profits as of the date of the consummation of this offering.
75
Table of Contents
Simultaneously with this offering, we will enter into a tax receivable agreement with the holders of Class A units of Manning & Napier Group, under which we will be required to pay to the holders of such Class A units 85% of the applicable cash savings, if any, in U.S. federal, state, local and foreign income tax that we actually realize, or are deemed to realize in certain circumstances, in periods after this offering as a result of any step-up in tax basis in Manning & Napier Group’s assets resulting from (i) our purchases or exchanges of such Class A units for cash or shares of our Class A common stock (including the purchases or exchanges of Class A units in connection with the reorganization transactions) and (ii) payments under the tax receivable agreement, including any tax benefits related to imputed interest deemed to be paid by us as a result of such agreement. See “Our Structure and Reorganization—Offering Transactions—Tax Receivable Agreement.”
The impact the tax receivable agreement will have on our consolidated financial statements will be the establishment of a liability, which will be increased upon the exchanges of Class A units of Manning & Napier Group for shares of our Class A common stock representing 85% of the estimated future tax benefits, if any, relating to the increase in tax basis associated with the Class A units we receive as a result of exchanges by unitholders of Manning & Napier Group. The amount and timing of any payments will vary based on a number of factors, including the timing of future exchanges, the number of units exchanged, the price of our Class A common stock at the time of any exchange, the extent to which such exchanges are taxable, the availability of amortization or depreciation deductions with respect to the intangible assets and the amount and timing of our income; depending upon the outcome of these factors, we may be obligated to make substantial payments pursuant to the tax receivable agreement. In light of the numerous factors affecting our obligation to make such payments, however, the timing and amount of any such actual payments are not certain at this time. See “Unaudited Pro Forma Combined Consolidated Financial Information.”
Cash Flows
The following table sets forth our cash flows for the three months ended March 31, 2011 and 2010 and the years ended December 31, 2010, 2009 and 2008. Operating activities consist of net income subject to adjustments for changes in operating assets and liabilities, change in shares liability subject to mandatory redemption, depreciation, and equity-based compensation expense. Investing activities consist primarily of acquiring and selling property and equipment and the purchase and sale of available-for-sale securities. Financing activities consist primarily of distributions, contributions, and payments on notes payable.
| Three Months Ended March 31, |
Year Ended December 31, | |||||||||||||||||||
| 2011 | 2010 | 2010 | 2009 | 2008 | ||||||||||||||||
| (unaudited) | ||||||||||||||||||||
| (in thousands) | ||||||||||||||||||||
| Net cash provided by operating activities |
$ | 30,411 | $ | 24,411 | $ | 119,972 | $ | 62,779 | $ | 63,684 | ||||||||||
| Net cash used in investing activities |
(528 | ) | (419 | ) | (2,489 | ) | (975 | ) | (3,027 | ) | ||||||||||
| Net cash used in financing activities |
(9,667 | ) | (13,801 | ) | (114,742 | ) | (60,311 | ) | (69,028 | ) | ||||||||||
| Net change in cash flows (1) |
$ | 20,216 | $ | 10,191 | $ | 2,741 | $ | 1,493 | $ | (8,371 | ) | |||||||||
| (1) | The 2008 net cash outflow was primarily due to cash distributions exceeding the net cash provided by operating activities and a decrease in cash provided by deferred revenues. Financing activities in 2008 included $71.5 million of S-corporation distributions being paid out during the year, compared to $63.7 million of net cash provided by operating activities. The reason for this discrepancy is that approximately $16.1 million of 2007 earnings were distributed in January 2008. By contrast, only $9.0 million of 2008 earnings were distributed in January 2009. The decrease in cash provided by deferred revenues resulted from the decrease in separately managed account market values from which deferred revenues were earned, caused by the economic downturn at the end of 2008 compared to the end of 2007. |
76
Table of Contents
Three Months Ended March 31, 2011 Compared to Three Months Ended March 31, 2010
Operating Activities
Operating activities provided $30.4 million and $24.4 million of net cash for the three months ended March 31, 2011 and 2010, respectively. This increase in net cash flows from operating activities was driven primarily by an increase in net income of $13.9 million for the three months ended March 31, 2011 compared to the three months ended March 31, 2010, offset by changes in accrued expenses and other liabilities of $4.9 million and reductions in non-cash interest expense related to the change in mandatory redemption liability of $2.9 million for the three months ended March 31, 2011 compared to the three months ended March 31, 2010. In addition, there was an increase in our average AUM to $40.9 billion for the three months ended March 31, 2011 from $29.2 billion for the three months ended March 31, 2010, which had a corresponding positive impact on our investment management fee revenue.
Investing Activities
Investing activities used $0.5 million and $0.4 million of net cash for the three months ended March 31, 2011 and 2010, respectively. This increase in net cash used in investing activities was primarily due to the increase in the purchase of investment securities of $0.4 million for the three months ended March 31, 2011 compared to the three months ended March 31, 2010, offset by a decrease in fixed assets purchases of $0.2 million for the three months ended March 31, 2011 compared to March 31, 2010.
Financing Activities
Financing activities used $9.7 million and $13.8 million of net cash for the three months ended March 31, 2011 and 2010, respectively. This decrease in net cash used in financing activities was primarily the result of a decrease in distributions of $4.1 million for the three months ended March 31, 2011 compared to the three months ended March 31, 2010.
Year Ended December 31, 2010 Compared to Year Ended December 31, 2009
Operating Activities
Operating activities provided $120.0 million and $62.8 million of net cash for the years ended December 31, 2010 and 2009, respectively. This increase in net cash flows from operating activities was driven primarily by an increase in the non-cash interest expense associated with the mandatory redemption liability of $51.3 million for the year ended December 31, 2010 compared to the year ended December 31, 2009, offset by a decrease in net income of $1.3 million for the year ended December 31, 2010 compared to the year ended December 31, 2009. In addition, an increase in accrued expenses and other liabilities of $7.4 million further contributed to the increase in net cash flows from operating activities for the year ended December 31, 2010 compared to the year ended December 31, 2009. Our average AUM increased to $32.3 billion for year ended December 31, 2010 from $20.6 billion for the year ended December 31, 2009, which had a corresponding positive impact on our investment management fee revenue.
Investing Activities
Investing activities used $2.5 million and $1.0 million of net cash for the years ended December 31, 2010 and 2009, respectively. This increase in net cash used in investing activities was primarily due to the increase in the purchase of investment securities of $1.4 million for the year ended December 31, 2010 compared to the year ended December 31, 2009, offset by an increase in proceeds from the maturity of investments of $0.5 million for the year ended December 31, 2010 compared to the year ended December 31, 2009.
77
Table of Contents
Financing Activities
Financing activities used $114.7 million and $60.3 million of net cash for the years ended December 31, 2010 and 2009, respectively. This increase in net cash used in financing activities was primarily the result of an increase in distributions of $55.6 million for the year ended December 31, 2010 compared to the year ended December 31, 2009.
Year Ended December 31, 2009 Compared to Year Ended December 31, 2008
Operating Activities
Operating activities provided $62.8 million and $63.7 million of net cash for the years ended December 31, 2009 and 2008, respectively. This decrease in net cash flows from operating activities was driven primarily by changes in accounts receivable of $11.2 million for the year ended December 31, 2009, offset by changes in accrued expenses and other liabilities of $7.5 million for the year ended December 31, 2009 compared to the year ended December 31, 2008. In addition, there was an increase in our average AUM from $18.2 billion for the year ended December 31, 2008 to $20.6 billion for year ended December 31, 2009, which had a corresponding positive impact on our investment management fee revenue.
Investing Activities
Investing activities used $1.0 million and $3.0 million of net cash for the years ended December 31, 2009 and 2008, respectively. This decrease in net cash used in investing activities was primarily due to the decrease in the purchase of investment securities of $1.5 million for the year ended December 31, 2009 compared to the year ended December 31, 2008 and the decrease in the purchase of fixed assets of $1.1 million for the year ended December 31, 2009 compared to the year ended December 31, 2008.
Financing Activities
Financing activities used $60.3 million and $69.0 million of net cash for the years ended December 31, 2009 and 2008, respectively. This decrease in net cash used in financing activities was primarily the result of a decrease in distributions of $7.4 million for the year ended December 31, 2009 compared to the year ended December 31, 2008.
Certain Contractual Obligations
The following table sets forth our contractual obligations as of March 31, 2011:
| Payment Due By Period | ||||||||||||||||||||
| Contractual Obligations |
Less than 1 year |
1-3 years | 3-5 years | More than 5 years |
Total | |||||||||||||||
| (in thousands) | ||||||||||||||||||||
| Shares liability subject to mandatory redemption (1) |
$ | — | $ | — | $ | — | $ | 183,607 | $ | 183,607 | ||||||||||
| Operating lease obligations |
2,656 | 5,020 | 3,713 | — | 11,389 | |||||||||||||||
| Capital lease obligations |
84 | 107 | 7 | — | 198 | |||||||||||||||
| Total |
$ | 2,740 | $ | 5,127 | $ | 3,720 | $ | 183,607 | $ | 195,194 | ||||||||||
| (1) | Prior to this offering, we had a mandatory redemption obligation upon the death of William Manning, to pay a formula-driven amount to his estate. Our liability related to this mandatory redemption obligation was calculated each fiscal quarter. In accordance with the requirements of accounting for certain financial |
78
Table of Contents
| instruments with characteristics of both liabilities and equity, we have recognized a liability for shares subject to mandatory redemption in our financial statements included elsewhere in this prospectus. Such mandatory redemption obligation will terminate immediately prior to the consummation of this offering and we will no longer reflect any liability or non-cash interest expense related to such obligation. |
Simultaneously with this offering, we will enter into a tax receivable agreement with the holders of Class A units of Manning & Napier Group, under which we will be required to pay to the holders of such Class A units 85% of the applicable cash savings, if any, in U.S. federal, state, local and foreign income tax that we actually realize, or are deemed to realize in certain circumstances, in periods after this offering as a result of any step-up in tax basis in Manning & Napier Group’s assets resulting from (i) our purchases or exchanges of such Class A units for cash or shares of our Class A common stock (including the exchanges of Class A units in connection with the reorganization transactions) and (ii) payments under the tax receivable agreement, including any tax benefits related to imputed interest deemed to be paid by us as a result of such agreement. See “Our Structure and Reorganization—Offering Transactions—Tax Receivable Agreement.”
The impact the tax receivable agreement will have on our consolidated financial statements will be the establishment of a liability, which will be increased upon the exchanges of Class A units of Manning & Napier Group for shares of our Class A common stock representing 85% of the estimated future tax benefits, if any, relating to the increase in tax basis associated with the Class A units we receive as a result of exchanges by unitholders of Manning & Napier Group. The amount and timing of any payments will vary based on a number of factors, including the timing of future exchanges, the number of units exchanged, the price of our Class A common stock at the time of any exchange, the extent to which such exchanges are taxable, the availability of amortization or depreciation deductions with respect to the intangible assets and the amount and timing of our income; depending upon the outcome of these factors, we may be obligated to make substantial payments pursuant to the tax receivable agreement. In light of the numerous factors affecting our obligation to make such payments, however, the timing and amount of any such actual payments are not certain at this time.
Off Balance Sheet Arrangements
We did not have any off-balance sheet arrangements as of March 31, 2011.
Quantitative and Qualitative Disclosures About Market Risk
Market Risk
Our exposure to market risk is directly related to the role of our operating company as an investment adviser for the mutual funds and separate accounts it manages. Substantially all of our revenues are derived from investment management agreements with these funds and accounts. Under these agreements, the investment management fees we receive are based on the value of our AUM and our fee rates. Accordingly, our revenues and net income may decline as a result of our AUM decreasing due to depreciation of our investment portfolios. In addition, such a decline could cause our clients to withdraw their funds in favor of investments offering higher returns or lower risk, which would cause our revenues to decline further.
The value of our AUM was $42.6 billion as of March 31, 2011. Assuming a 10% increase or decrease in the value of our AUM and the change being proportionally distributed over all our products, the value would increase or decrease by $4.3 billion, which would cause an annualized increase or decrease in revenues of approximately $31.3 million at our current weighted average fee rate of 0.73%
We have not adopted a corporate-level risk management policy regarding client assets, nor have we attempted to hedge at the corporate level the market risks that would affect the value of our overall AUM and related revenues. Some of these risks (e.g., sector risks and currency risks) are inherent in certain strategies, and clients may invest in particular strategies to gain exposure to these risks.
79
Table of Contents
We also are subject to market risk from a decline in the prices of marketable securities that we own. These securities consist primarily of short-term investments, equity securities and investment in mutual funds, including the Fund for which MNA provides sub-advisor services. The value of these marketable securities was $5.1 million as of March 31, 2011. Management regularly monitors the value of these investments; however, given their nature and relative size, we have not adopted a specific risk management policy to manage the associated market risk. Assuming a 10% increase or decrease in the values of these marketable securities, the fair value would increase or decrease by $0.5 million at March 31, 2011. Due to the nature of our business, we believe that we do not face any material risk from inflation.
Exchange Rate Risk
A substantial portion of the accounts that we advise, or sub-advise, hold investments that are denominated in currencies other than the U.S. dollar. Movements in the rate of exchange between the U.S. dollar and the underlying foreign currency affect the values of assets held in accounts we manage, thereby affecting the amount of revenues we earn. The value of the assets we manage was $42.6 billion as of March 31, 2011. As of March 31, 2011, approximately 27% of our AUM across our investment strategies was invested in securities denominated in currencies other than the U.S. dollar. To the extent our AUM are denominated in currencies other than the U.S. dollar, the value of those AUM would decrease, with an increase in the value of the U.S. dollar, or increase, with a decrease in the value of the U.S. dollar.
We monitor our exposure to exchange rate risk and make decisions on how to manage such risk accordingly; however, we have not adopted a corporate-level risk management policy to manage exchange rate risk. Assuming that 27% of our AUM is invested in securities denominated in currencies other than the U.S. dollar and excluding the impact of any hedging arrangements, a 10% increase or decrease in the value of the U.S. dollar would decrease or increase the fair value of our AUM by $1.1 billion, which would cause an annualized increase or decrease in revenues of approximately $8.4 million at our current weighted average fee rate of 0.73%.
Interest Rate Risk
We typically invest our excess cash balances in money market mutual funds that invest primarily in U.S. Treasury or agency-backed money market instruments. These funds attempt to maintain a stable net asset value but interest rate changes may affect the fair value of such investments and, if significant, could result in a loss of investment principal. Interest rate changes affect the income we earn from our excess cash balances.
Recently Issued Accounting Pronouncements
In June 2011, the Financial Accounting Standards Board (“FASB”) issued Accounting Standards Update (“ASU”) 2011-05, Presentation of Comprehensive Income (Topic 220). This standard eliminates the current option to report other comprehensive income and its components in the statement of changes in equity. These amendments are effective for annual periods beginning after December 15, 2011. We do not expect the amendments to have a material impact on its combined consolidated financial statements and related disclosures.
In May 2011, the FASB issued ASU 2011-04, Fair Value Measurement (Topic 820): Amendments to Achieve Common Fair Value Measurement and Disclosure Requirements in GAAP and International Financial Reporting Standards, or IFRS. The amendments in this update change the wording used to describe the requirements in GAAP for measuring fair value and for disclosing information about fair value measurements. These amendments are effective for annual periods beginning after December 15, 2011. We do not expect the amendments to have a material impact on the financial statements and related disclosures.
In February 2010, the FASB issued ASU 2010-10, Consolidation (Topic 810): Amendments for Certain Investment Funds. The amendments to the consolidation requirements of Topic 810 are deferred for a reporting
80
Table of Contents
entity’s interest in an entity (1) that has all the attributes of an investment company or (2) for which it is industry practice to apply measurement principles for financial reporting purposes that are consistent with those followed by investment companies. ASU 2010-10 became effective for us on January 1, 2010 and there was no impact on our combined consolidated financial statements.
In January 2010, the FASB issued ASU 2010-06, Fair Value Measurements and Disclosures (Topic 820): Improving Disclosures above Fair Value Measurements, which requires entities to make new disclosures about recurring or nonrecurring fair-value measurements and provides clarification of existing disclosure requirements. This amendment requires separate disclosures about purchases, sales, issuances, and settlements relating to Level 3 measurements. This amendment is effective for fiscal years beginning after December 15, 2010. The adoption did not have a material impact on our combined consolidated financial statements.
81
Table of Contents
Overview
We are an independent investment management firm that provides a broad range of investment solutions through separately managed accounts, mutual funds and collective investment trust funds. Founded in 1970, we offer equity and fixed income portfolios as well as a range of blended asset portfolios, such as life cycle funds, that use a mix of stocks and bonds. We serve a diversified client base of high net worth individuals and institutions, including 401(k) plans, pension plans, Taft-Hartley plans, endowments and foundations. Since 1999, we have achieved strong relative growth in discretionary AUM. From December 31, 1999 through March 31, 2011, our AUM has increased from $6.9 billion to $42.6 billion, representing a compound annual growth rate of 17.5% during a period that included two significant bear markets. Our growth in AUM resulted in an increase in our revenues from $50.2 million for the year ended December 31, 1999 to $255.5 million for the year ended December 31, 2010. Our revenues for the three months ended March 31, 2011 were $78.0 million, an increase from $57.2 million for the three months ending March 31, 2010. We believe this growth is the result of our consultative, total-solutions approach to working with clients and our investment process that has yielded strong investment results well in excess of primary market indices.
Note: Reflects our AUM over the periods indicated compared to the performance of the market, represented by the benchmarked return of the S&P 500 relative to its level at the end of 1999. Data as of December 31 of each respective year, unless otherwise indicated.
Since our inception, we have taken the view that an active approach to portfolio management is the best way to manage risk for clients as market conditions change. Across our variety of equity, fixed income and blended asset portfolios, the goal of our investment process is to provide competitive absolute returns over full market cycles. We employ a disciplined process that seeks to avoid areas of speculation and invest in what we view as under-valued market segments, under the principle that today’s market prices drive future potential investment return. Our active, unconstrained approach provides us with a dedicated mechanism to maintain pricing discipline in our investment decisions.
Initially, this approach helped us build a strong client base of high net worth individuals, small business owners and middle market institutions, and we maintain these relationships in many targeted geographic regions. This foundation allowed us to expand our business to serve the needs of larger institutions, investment consultants and other intermediaries, which has been a strong driver of recent growth.
We have focused on developing an internal organization of specialists to provide additional consultative services beyond investment management, which we believe helps us build close relationships with our clients through multiple service touch points and a solutions-oriented approach. We have designed solutions that are specific to our clients’ needs, including: 401(k) menu design, investment option and manager selection; family wealth management and trust services; and group health and ancillary benefits advisory services. Taken together with strong investment performance across portfolios, our consultative, total-solutions approach has allowed us
82
Table of Contents
to achieve a significantly lower-than-industry average annual separate account cancellation rate through difficult market environments. According to Cerulli Associates, the average annual industry redemption rate, or cancellation rate, for separate accounts was 23.3% for the period 2002 through 2010 and 24.9% over the last five years ending December 31, 2010, as compared to our average annual cancellation rates of 3.9% and 3.6%, respectively, during such periods. In 2009 and 2010, following the global credit crisis and severe global market downturn that began in 2008, our annual separate account cancellation rates were 6.6% and 3.1%, respectively, much lower than the industry averages of 27.0% and 20.8% based on data from Cerulli Associates. We have experienced net positive cash flows in both our separate accounts and our mutual funds for each of the last four years and thus far in 2011.
Our highly articulated investment processes and pricing disciplines have been central to our success and we believe are distinctive within the industry. Our research process is analyst- and team-driven. Our investment process follows a set of disciplines that emphasize fit with our time-tested security selection strategies, absolute pricing discipline, active asset allocation management and incentive compensation that emphasizes absolute dollar returns instead of returns relative to benchmarks. Our mutual funds have earned a number of industry accolades, including a finalist ranking for Morningstar’s international manager of the decade and multiple Lipper awards. As of March 31, 2011, 15 of the 17 funds eligible for Morningstar ratings, representing 87% of our total mutual fund AUM, are rated four or five stars by Morningstar. From January 1, 2000 through March 31, 2011, a period of time that included two significant bear markets, many of our mutual funds and similarly managed separate account portfolios experienced strong cumulative returns well in excess of the returns earned by broad equity market indexes.
Note: Represents cumulative returns for the mutual funds set forth above from January 1, 2000 to March 31, 2011. Percentages in parentheses represent mutual fund equity range.
We have separate account portfolios that mirror the mutual funds illustrated above, each of which has earned similar cumulative investment returns to those we have earned for our mutual funds. The above listed blended asset and equity mutual funds and their similarly managed separate account portfolios represent approximately 77% of our total AUM.
83
Table of Contents
We offer our investment management capabilities primarily through direct sales to high net worth individuals and institutions, as well as through third-party intermediaries, including wirehouse brokers, independent financial advisors, and institutional investment consultants. Our AUM as of March 31, 2011 by investment vehicle, portfolios and distribution channel were as follows:
As of March 31, 2011, we had 414 employees, including William Manning, our Chairman and controlling stockholder, and the 47 other employee-owners, most of whom are based in Fairport, New York. Immediately following the completion of this offering, these employee-owners will collectively own approximately % of our operating subsidiary, Manning & Napier Group, through which we conduct all of our business. Our culture of employee ownership strongly aligns our interests with those of our clients’ by delivering strong investment performance and solutions.
Industry Trends
We believe the key market trends described below will continue to drive the growth of our business and increase the value of our service offerings.
Increased Focus on Management of Employee Benefit Plans
Rapidly rising healthcare costs are eroding the ability of many employees to fund adequate retirement savings. Healthcare costs have risen steadily over the past decade and are projected to continue to increase in the future. For example, Hewitt Associates estimates healthcare costs are likely to rise 9% in 2011. According to Towers Watson’s 2010 Health Care Cost Survey, employers pay 28% more for healthcare now than they did five years ago, $7,896 in 2010 versus $6,169 in 2005, and employees pay 40% more, $2,292 in 2010 versus $1,642 in 2005, over the same period. Underscoring the affordability issue, increasing costs hit a milestone in 2010 when the average annual amount spent per employee on healthcare crossed the $10,000 mark when combining the amounts spent by both employers and employees.
Employers are increasingly concerned with the financial hurdles their employees face and are seeking to increase the value of the benefits they provide to employees while also seeking to improve their own bottom line. According to the Deloitte 2010 Annual 401(k) Benchmarking Survey, only 15% of plan sponsors surveyed believe most employees will be prepared for retirement. The 17th Annual Top Five Total Rewards Priorities Survey conducted by Deloitte Consulting, LLP and the International Society of Certified Employee Benefit Specialists indicates that the cost of providing healthcare to employees remains the top challenge in 2011 for employers. According to Deloitte Consulting LLP, approximately 75% of employers surveyed indicate they plan to make or have already made changes to the design of their health and welfare plans to address these concerns.
At the same time, employees increasingly want assistance investing their 401(k) assets and making other adjustments to their retirement plans to help them retire with sufficient income. Studies have indicated that many 401(k) plan participants historically earned below market returns. According to Dalbar, the average equity mutual fund investor earned a return of only 3.17% from 1990 through 2009, while the S&P 500 Index returned more than 8% over that same period. The Employee Benefit Research Institute indicates in their 2011 Retirement Confidence Survey that 87% of workers are not very confident in their ability to live comfortably throughout their retirement years.
84
Table of Contents
We believe employers will be increasingly interested in working with providers that can take a holistic view of benefit plan design and can help solve problems with both retirement benefit plans and health benefit plans. Accordingly, plan design and effective participant communication strategies, including technology-based solutions that can drive down costs and one-on-one employee communication solutions that can increase participation and planning, will be key to solving these concerns for employers.
Growth of Defined Contribution Plans and Enhanced Role for Life Cycle Funds
We believe the large and growing retirement savings industry increasingly requires investment advice and retirement help for employees. According to Cerulli Associates, total defined contribution assets were approximately $4.3 trillion in 2009 and are estimated to grow to more than $5.7 trillion by 2015 in the United States. In particular, 401(k) assets represent the majority of defined contribution assets and are projected to reach nearly $3.8 trillion by 2014, from $2.3 trillion in 2008. The Society of Professional Asset Managers & Record Keepers estimates in their 2010 Marketplace Update that 15,000 to 18,000 new plans are projected for 2010. The study also highlights a high degree of movement between providers, with over 35,000 plans worth more than $190 billion changing providers in 2009.
As a result of the Pension Protection Act of 2006 and subsequent U.S. Department of Labor guidelines, plan sponsors are now actively seeking automatic retirement savings solutions for their employees. Under the Pension Protection Act of 2006, employers who automatically enroll their employees in what are known as Qualified Default Investment Alternatives, or QDIAs, are safeguarded from fiduciary and legal risk if they adhere to certain regulatory guidelines. The U.S. Department of Labor defines three qualified default investment options as QDIAs: professionally managed accounts, balanced funds and life cycle funds. According to a survey by Aon Hewitt, the percentage of employees that automatically enroll new participants has increased from 17% in 2006 to 57% in 2010. Similarly, automatic contribution escalation, where employees’ contribution rates are automatically increased over time unless the employee affirmatively elects otherwise, increased from 9% in 2005 to 44% in 2009.
Demand by U.S. investors for life cycle funds has been driven by investors’ desire to diversify their investments across various asset classes as well as to automatically shift to less risky asset classes as these investors near or enter retirement. Cerulli Associates estimates assets in life cycle funds will increase by 40% per year from 2009 through 2015. As part of the Pension Protection Act of 2006, target-date funds have become a default option of 401(k) plans that have an automatic enrollment feature subject to safe harbor protections for plan sponsors. A study by Hewitt Associates and Financial Engines found that participants that receive help in the form of professionally-managed target-date funds, managed accounts or online advice achieve better returns than participants that do not receive help.
We expect auto-enrollment will be a driver of even greater participant balances in the future, and life cycle portfolios, and target date funds in particular, will continue to see increased demand as more plan sponsors use such funds as the default option within their plan. We believe life cycle and target date fund providers with a documented track record of proven results will garner increasing assets in this space, especially when bundled with broad employee education services.
Focus on Intergenerational Planning
A 2011 U.S. Trust survey of Americans with at least $3 million in investments highlights a gap between the importance such investors place on providing family financial security and the actual estate planning such families are doing. Nearly 40% of such individuals acknowledge they do not have a comprehensive estate plan and only 3% of business owners have a business succession plan as part of their overall estate plan. Intergenerational planning is also a concern, with only 34% of individuals surveyed feeling that their children
85
Table of Contents
will be able to manage any inheritance left behind. More than 27% of such individuals have never discussed intergenerational wealth transfer with their financial advisor. We anticipate significant opportunities for investment managers that can position themselves as trusted advisors to high net worth investors.
Heightened Interest in Risk Management
Following the credit crisis and global bear market in 2008 and early 2009, investors and financial advisors have become increasingly interested in absolute return strategies, or strategies that seek positive returns over full market cycles. A 2010 survey of financial advisors and brokers by Putnam Investments states that 59% of advisors were likely to recommend absolute return strategies to their clients. The study states that advisors generally see the benefits of absolute return strategies as minimizing portfolio volatility and serving as an asset class diversification strategy. We believe our active and unconstrained investment approach within our blended asset class portfolios is well suited to meet the demand for absolute return strategies using traditional asset classes and is likely to be less expensive than alternative investment-based strategies with similar absolute return goals. Industry consultant Casey, Quirk & Associates predicts that over the next 10 years, managers will increasingly be paid for investment solutions as opposed to investment products, and Pensions & Investments notes that top money management firms are starting to strengthen their solutions units in an effort to provide highly customized investment solutions for their clients, with a goal of forming strategic partnerships, and, as a result, stronger relationships with clients.
Demand for Non-U.S. Investments
With more than 50% of the global market capitalization represented by non-U.S. companies, U.S. investors are increasingly looking to diversify their assets through non-U.S. investments. We believe U.S. investors are under-allocated in global equities relative to global benchmarks, particularly in the defined contribution channel, with only 7% of defined contribution assets invested in non-U.S. equities. In response to increased demand, Cerulli Associates indicates that 65% of managers are allocating over 30% of new products to international strategies and 47% are allocating over 70% of new products to international strategies. According to the Investment Company Institute, flows to foreign stock funds increased more than 210% in 2010 relative to 2009. We believe investors will strive to select managers with experience and proven results to meet their more diversified and global investing requirements as well as those with the flexibility to allocate assets to and within foreign markets, among both developed and emerging countries.
Our Competitive Strengths
We believe our success as an investment manager is based on the competitive strengths described below.
Team-Based Investment Approach
We rely on a team-based investment approach and a robust investment process that has resulted in consistent returns over time that are well in excess of market benchmarks. Our investment team consists of 39 “bottom-up” equity research analysts with global industry responsibilities and 27 “top-down” economists, statistical analysts and fixed income analysts. Investment decisions are overseen by our Senior Research Group, which is a team of ten senior analysts who manage our portfolios. We believe this team approach, rather than relying on traditional individual portfolio managers, has provided and will continue to provide consistency to our investment process and results over the long-term.
Track Record of Consistent Investment Excellence through Multiple Market Cycles
We have a track record of superior long-term investment returns across our key portfolios relative to our competitors and the relevant benchmarks. Our Long-Term Growth portfolio, which is our longest-standing portfolio, represents approximately 17% of our total AUM as of March 31, 2011. This portfolio consists of a mix
86
Table of Contents
of stocks and bonds and has outperformed the S&P 500 Index by 245 percentage points after fees over the period from January 1, 1973 to March 31, 2011. Our Core Non-U.S. Equity portfolio, which represents 31% of our total AUM as of March 31, 2011, has outperformed the MSCI All Country World ex U.S. Index by 162 percentage points since its inception on October 1, 1996 through March 31, 2011. Fifteen of our 17 mutual funds, representing more than $15 billion in AUM, have a Morningstar rating of four or five stars as of March 31, 2011. We have a five star rating for 11 of our mutual funds, representing more than $10 billion of our AUM. At the end of 2009, we were a finalist for Morningstar’s Fund Manager of the Decade in the “foreign” category and for Morningstar’s International-Stock Manager of the Year. Lipper Fund Awards 2010 named Manning & Napier’s World Opportunities Series as the “Best International Multi-Cap Core Fund over 10 years” and their 2011 Fund Awards named our International Series as the “Best International Multi-Cap Core Fund” over three years. Our track record of consistent outperformance is instrumental in attracting and retaining clients as well as in maintaining good relationships with consultants who recommend our services.
High Client Retention through a Solutions-Oriented Approach
Our average annual separate account cancellation rate was 3.6% over the last five years ending December 31, 2010, as compared to an industry rate of 25% according to Cerulli Associates. For many of our clients, we provide an array of services to help them identify their funding and investment requirements and then design solutions that are specific to the client’s needs in areas such as 401(k) menu design, investment option and manager selection, participant education, asset-liability modeling, wealth modeling, family wealth management and trust services, and group health and ancillary benefits advisory services. We believe our long history of providing consultative services to complement our investment process has allowed us to form stronger relationships with our clients and has helped to reduce turnover during challenging market environments.
Strong Record of Net New Business Generation
In the period from December 31, 1999 through March 31, 2011, our AUM grew from $6.9 billion to $42.6 billion, representing a compound annual growth rate of 17.5%. We have experienced positive net cash flows every quarter since the last stock market peak in the fourth quarter of 2007. The financial crisis beginning in 2008 was a period of severe market losses, yet our contraction in AUM during the 2008-2009 market downturn was relatively mild primarily due to continued strong new business flows driven by our absolute return orientation and our low client cancellation rate. In addition, our life cycle funds have had positive net flows every quarter since the beginning of 2007. Our strong organic growth has allowed us to maintain positive revenue momentum during periods of sustained market declines and establish a solid base to build on during periods of economic expansion.
Culture of Product Innovation
We have a company-wide culture of product innovation that is designed to anticipate the needs of the clients we serve. For example, we developed our first life cycle mutual fund in 1993, when there were only seven life cycle funds listed on Morningstar. As of March 31, 2011, the number of life cycle funds listed on Morningstar had grown to more than 1,700. More recently, we launched technology driven products and services to assist both employers and employees with their health and wealth planning. Over the next few months, we also expect to launch an emerging markets equity mutual fund. Given our culture of innovation, we believe we are well-positioned to take advantage of new opportunities in the marketplace.
Diversified Client Base through Multiple Channels
We distribute our products and services through direct sales as well as by leveraged distribution through financial intermediaries, platforms and investment consultants. Our direct marketing efforts are largely focused on high net worth clients and middle market institutions in targeted geographic regions. In addition, we have
87
Table of Contents
strong relationships with many pension and industry consulting firms, which has provided us access to a broad range of institutional clients. In the institutional space, we focus on plans and intermediaries that are seeking a long-term partner for investment management services. Smaller retail investors generally access our investment products through mutual fund platforms. Overall, our client base is well-diversified across both individual and institutional client types, with our largest direct client relationship representing only 1.3% of our total AUM as of March 31, 2011. As of March 31, 2011, our largest third-party relationship accounted for approximately 5% of our total AUM. This broad distribution has made our business less susceptible to losses from any one client or channel and has contributed to the stability of our earnings.
Experienced Management Team and Investment Professionals
In 2003, William Manning turned over management responsibilities to our current executive management team. This team has, on average, 22 years of experience with our company and an average of 28 years of experience in the asset management industry. Patrick Cunningham has been with us since 1992 and was named our chief executive officer in June 2010, and the majority of the members of our Senior Research Group started their investment careers with us. Management’s long-term focus on developing our business in a financially disciplined manner has resulted in our company achieving strong financial results in recent periods, particularly over the past ten years as we have expanded the portfolios we offer and the distribution channels through which we sell products. These long-standing tenures illustrate the continuity and commitment of our team that we believe will be important to our success in the future.
Our Strategy
Our approach for continued success is focused on the strategies described below.
Expand our Direct Channel
We believe our high-touch direct distribution channel has allowed us to build strong relationships with our clients over time. Historically, our Direct Channel has been concentrated around New York, Pennsylvania and Ohio. While we have sales representatives as far west as Chicago and as far south as Florida, we plan to expand our Direct Channel presence geographically, filling in new regions along the east coast and expanding farther west. Our Direct Channel will remain focused on the tenets that have resulted in our past success, which includes identifying geographic regions within which our representatives form key relationships with centers of influence, business owners and other referral networks to build a client base of high net worth individuals and middle market institutions. Our model requires our sales representatives to maintain responsibility for servicing new business they bring to our firm and compensates representatives for both new business generation and strong service records, which has been a contributing factor to our strong client retention over time.
Broaden our Intermediary Channel
We are focused on the attractive 401(k) marketplace, which historically has been characterized by positive cash flows and low cancellation rates. In addition to building relationships directly with plan sponsors, our wholesale staff seeks what we refer to as Ultimate Defined Contribution Advisors, or advisors that work primarily with defined contribution plans. According to Brightwork Partners, LLC, 59% of all 401(k) plans between $10 million and $299 million work with a third-party advisor, which makes this an important area of focus for our wholesale staff. We expect significant future growth opportunities within this channel as we begin to target wirehouse advisors, retirement plan advisors and other intermediaries that work with small- to- mid-sized 401(k) plans.
88
Table of Contents
Focus on the Convergence of Health and Wealth Benefits
We have extensive experience working with employers to design retirement plan menus and provide high quality life cycle portfolios to improve participant retirement outcomes. Our strong relationships with employers have led us to better understand the full scope of benefit plan issues that employers are facing in the current environment. Specifically, we see a convergence of health and wealth in terms of both providing benefit plans to employees, and employers’ need for help in taking a holistic approach to benefit planning to both lower the costs of providing healthcare benefits and to help educate employees about the benefits of saving for retirement. We are focused on providing consultative services to employers to address these key concerns through unique plan design alternatives and technology-based tools to help employers and advisors effectively reach large numbers of employees with tailored retirement and health plan guidance. We expect to continue to develop and potentially acquire products and services to help employers best address these key issues regarding retirement and health benefit plans.
Develop New Products in Response to Market Opportunities
Our on-going development of products and consultative services in response to current and prospective client needs historically has been a source of significant growth. We remain committed to understanding the key areas of concern for various client types and developing solutions to meet these needs. For example, we recently launched a global inflation-focused equity portfolio to respond to investor concerns of inflation in light of rising commodity prices and generally easy monetary policies in many developed markets. Furthermore, in response to demand for and market opportunities within non-U.S. equity markets, we are launching portfolios that focus exclusively on emerging market equities and, separately, developed market equities. To address continued growth in life cycle investment portfolios, we plan to introduce a family of ETF-based, target date active asset allocation funds that combine lower management costs with an active management approach to meet key needs of 401(k) plan sponsors. Continued product and service development will likely require building additional resources and areas of expertise, and we are continuing to add resources where solving key problems can strengthen our relationships with clients.
Products and Services
We manage a variety of equity, fixed income and blended asset portfolios, using primarily traditional asset classes such as stocks and bonds. The majority of our portfolios are actively managed and based on fundamental, company-specific research, though we do manage a small number of quantitatively driven or active, top-down products. Our goal is to help our clients meet their investment objectives by providing competitive positive returns over full stock market cycles, including both bull and bear market environments. Four key elements of our investment process keep us focused on that goal:
| • | Variety of Security Selection Strategies. Our approach to security selection is active, and we perform fundamental analysis on a company-by-company basis to determine appropriate investments for our clients’ portfolios. We employ three distinct security selection strategies within our active, fundamental-based portfolios—one each for growth, cyclical and mature companies. Every stock in these portfolios must be approved by our Senior Research Group as a fit to one of these strategies. Having three distinct selection strategies that have been refined over four decades allows us to invest in a disciplined manner across a variety of market and economic environments. |
| • | Absolute Pricing Discipline. The primary focus of our investment process is an absolute, rather than relative, pricing discipline. With respect to stocks, a key aspect of our investment process is to identify what we view to be the “fair market value” before we purchase a stock for our clients’ portfolios. The fair market value is determined through a variety of valuation techniques relevant to the nature of the investment and ultimately represents a price at which we believe we could sell the stock in question to a rational investor who could then earn a reasonable return going forward. Our |
89
Table of Contents
| emphasis on price also means we are likely to be buying more aggressively into market declines, and selling out of such investments in market rallies. We believe this focus on price has provided strong capital preservation in many bear markets during our history and reduces the risk of permanent, down-side price fluctuation from our buy price. |
| • | Active Asset Allocation Management Approach. A portfolio’s overall exposure to market sectors, countries, and broad asset classes is driven by our bottom-up security selection. The flexibility to invest across sectors, countries and asset classes based on individual company opportunities allows us to focus on companies we view as having greater upside potential than downside risk, and allows us to have a broad enough opportunity set to freely navigate away from areas of excess or speculation without limiting the number of investment opportunities. While this approach may often result in our portfolios having meaningfully different allocations and exposures when compared to market benchmarks, we believe this type of differentiation is necessary to manage risk in many environments. |
| • | Analyst Compensation Structure. Each security in our clients’ fundamental-based equity and blended asset portfolios is recommended by one of our research analysts and reviewed and approved by our Senior Research Group before being purchased for clients. Each analyst recommending a stock subjects a portion of his or her total compensation to the returns generated by that recommendation. We have aligned the incentives of our analysts with the goals of our clients by structuring our analyst compensation system such that returns that are both negative and below benchmarks produce a negative bonus the analyst has to offset before earning a positive bonus. The analysts earn their largest bonus, which could be multiples of their salary and the largest part of their total compensation, when their stock recommendations earn returns that are both positive and above benchmarks for our clients. This compensation system has kept our analysts focused on earning positive absolute returns through their stock recommendations, which has ultimately enhanced our long-term track record, particularly in speculation-driven bear markets such as those in 1987 and 2000 to 2002. |
Our fundamental-based portfolios are all managed by our Senior Research Group, which consists of ten of our senior analysts with an average tenure of over 17 years with our firm. Each analyst is the Managing Director of one of our bottom-up global sector groups or one of our top-down investment groups. In total, we have 78 full-time employees in our research department, including 62 equity analysts/economists and seven fixed income analysts/economists.
Our fundamental investment process is based on disciplined strategies that have been applied consistently throughout the firm’s history. We examine fundamental risk and reward characteristics of each investment, not based on broad, backward-looking assumptions, but instead based on prevailing valuations and conditions. We then weigh a given investment against the risk/reward characteristics of alternatives and within the context of a client’s investment objectives. Allocations to asset classes or market sectors are a function of both top-down and bottom-up analysis. The top-down, or macro, view considers prevailing economic and market conditions as well as historical relationships. The bottom-up view builds positions security-by-security, according to individual strategy fits and valuations. In this way, allocation changes become a function of fundamentals rather than timing. This total return management style recognizes an active asset allocation approach as a key tool for managing risk.
90
Table of Contents
In our blended asset portfolios, the allocation of assets between stocks and bonds is driven primarily by company-specific analysis of equity opportunities. When our analysts are able to find a greater number of equity opportunities that meet the standards for our pricing disciplines, equity exposure increases in our blended asset class accounts. Likewise, equity exposure in these portfolios decreases when our analysts find fewer individual equity opportunities, which is typically the case when markets become expensive.
| Key Portfolios |
AUM as of March 31, 2011 (in thousands) |
Inception Date | Cumulative Excess Return Over Relevant Benchmark Since Inception | |||||||
| Long-Term Growth |
$7,322,955 | 1/1/1973 | 890% | |||||||
| 40%-70% Equity Exposure |
||||||||||
| Growth with Reduced Volatility |
$2,684,026 | 1/1/1973 | 446% | |||||||
| 20%-60% Equity Exposure |
||||||||||
| Unrestricted Fixed Income |
$460,930 | 1/1/1984 | 28% | |||||||
| Equity-Oriented |
$1,073,495 | 1/1/1993 | 224% | |||||||
| Core Equity (Unrestricted) |
||||||||||
| 90%-100% Equity Exposure |
$2,319,463 | 1/1/1995 | 254% | |||||||
| Core Non U.S. Equity |
$13,276,270 | 10/1/1996 | 162% | |||||||
| Core U.S. Equity |
$6,092,226 | 7/1/2000 | 71% | |||||||
Sales and Distribution
We distribute our products and services through direct sales to prospective high net worth individuals and middle market institutional clients, as well as through dedicated efforts to sell to financial intermediaries and investment consultants. In identifying prospective new business, we are focused on individuals and institutions that have long-term objectives and needs, and that are looking for a partner in addressing these needs. We believe our problem-solving approach fosters strong relationships, and our focus on communicating our investment process helps to manage long-term expectations and minimize turnover.
We currently have 38 sales and distribution investment professionals, with an average of approximately 17 years of industry experience. Our sales staff includes 21 direct sales representatives, 12 internal and external wholesale professionals, and four consultant relations specialists, each of whom report to our Managing Director of Sales, who has been with MNA since 1993. Sales representatives have different areas of focus in terms of client type, product and vehicle, but are highly knowledgeable about the markets, our investment process and our product and service offerings, so as to lessen the need for our research department personnel to assist in bringing new relationships on board. Our sales representatives are responsible for generating new business as well as maintaining existing business. Referrals are a strong source of new business in both our direct and intermediary marketing efforts. To assist in the service responsibilities of the field representatives, we have more than 45 internal service professionals that are responsible for responding to client requests and questions.
Direct sales representatives market to individuals and institutions in defined territories within the U.S. Marketing to high net worth individuals in a defined geographic territory allows our sales representatives opportunities to gain exposure to middle market institutions. It is not uncommon for us to first form relationships with high net worth individuals that own businesses, sit on boards of endowments or foundations, or are generally well-connected in their communities and to leverage those relationships to obtain institutional business. These clients also often utilize the consultative services of our Client Analytics Group, which generally includes a variety of planning services.
91
Table of Contents
Our wholesale staff works with more than 150 financial intermediaries, including wirehouse brokers, independent financial advisors, retirement plan advisors, and unaffiliated registered investment advisors across the U.S. Intermediary distribution includes separate account sales to advisors that work with high net worth individuals, though we expect future growth to be driven by mutual fund sales to defined contribution plans or through approval of our fund strategies on various broker or advisor platform programs. We have four investment professionals dedicated to building relationships with investment consultants and their research teams. The primary responsibilities of these individuals are to educate consultants on our investment products and process and to ensure our products are among those considered for active searches conducted by consultants.
Given our long track record of managing life cycle portfolios and current growth trends within this marketplace, we have a large base of resources dedicated to defined contribution sales, in particular 401(k) distribution. Our sales and service efforts are focused on all the major constituents that influence a plan, from plan sponsors to participants to third-party intermediaries. We have resources dedicated to group participant education meetings and we are introducing web-based software that will allow us to provide one-on-one financial guidance sessions to plan participants. We have resources dedicated to expanding our life cycle funds’ availability and visibility on recordkeeping platforms.
To maintain a focus on problem solving and to diversify our product set beyond investment products, the field representatives utilize the services of our Client Analytics Group. This group consists of 19 internal consultants whose primary responsibilities include working with prospective and current clients to solve investment and planning-related problems. The group is well-credentialed and includes several chartered financial analysts, certified financial planners, an accredited investment fiduciary and professionals with law and masters degrees.
Competition
In order to grow our business, we must be able to compete effectively for our clients’ investment management business. Historically, we have competed to attract assets to our management principally on the basis of:
| • | a broad portfolio and service offering that provides solutions for our clients; |
| • | the disciplined and repeatable nature of our investment process; |
| • | the tenure and continuity of our management and investment professionals; and |
| • | our track record of investment excellence. |
Our ability to continue to compete effectively will also depend upon our ability to retain our current investment professionals and employees and to attract highly qualified new investment professionals and employees. We compete in all aspects of our business with a large number of investment management firms, commercial banks, broker-dealers, insurance companies and other financial institutions. For additional information concerning the competitive risks that we face, see “Risk Factors—Risks Related to our Industry—The investment management industry is intensely competitive.”
Employees
As of March 31, 2011, we had 414 employees, including William Manning and the 47 other employee-owners, most of whom as based in Fairport, New York. None of our employees are subject to a collective bargaining agreement. We believe that relations with our employees are good. We strive to attract and retain the best talent in the industry.
92
Table of Contents
Properties
Our corporate headquarters is located in Fairport, New York, and we have regional offices in St. Petersburg, Florida and Dublin, Ohio. We also lease office space in Northfield, Illinois, Wexford, Pennsylvania, Richmond, Virginia and Portsmouth, New Hampshire. MNIS leases office space in Amherst, New York and Tampa, Florida. Manning & Napier Benefits LLC, a subsidiary of MNIS, leases office space in Ellicottville, New York. We do not own any facilities. The table below lists our current leased facilities.
| Location |
Lease Expiration | Approximate Square Footage | ||||
| Fairport, New York |
June 30, 2015 | 96,070 | ||||
| St. Petersburg, Florida |
October 31, 2016 | 6,877 | ||||
| Dublin, Ohio |
September 30, 2015 | 8,309 | ||||
| Northfield, Illinois |
June 30, 2012 | 765 | ||||
| Wexford, Pennsylvania |
October 31, 2011 | 170 | ||||
| Richmond, Virginia |
November 30, 2011 | 150 | ||||
| Portsmouth, New Hampshire |
March 31, 2012 | 600 | ||||
| Amherst, New York |
July 31, 2013 | 4,123 | ||||
| Tampa, Florida |
October 31, 2012 | 3,431 | ||||
| Ellicottville, New York |
March 31, 2012 | 564 | ||||
We believe our properties are in good operating condition and adequately serve our current business operations. We also anticipate suitable additional or alternative space will be available at commercially reasonable terms for future expansion to the extent necessary.
Legal Proceedings
As an investment adviser to a variety of investment products, we are subject to routine reviews and inspections by the SEC and FINRA. From time to time we may also be involved in various legal proceedings arising in the ordinary course of our business. We do not believe that the outcome of any of these reviews, inspections or other legal proceedings will have a material impact on our combined consolidated financial statements; however, litigation is subject to many uncertainties, and the outcome of individual litigated matters is not predictable with assurance. Currently, there are no legal proceedings pending or to our knowledge threatened against us.
93
Table of Contents
REGULATORY ENVIRONMENT AND COMPLIANCE
Our business is subject to extensive regulation in the United States at the federal level and, to a lesser extent, the state level, as well as by self-regulatory organizations, and outside the United States. Under these laws and regulations, agencies that regulate investment advisers have broad administrative powers, including the power to limit, restrict or prohibit an investment adviser from carrying on its business in the event that it fails to comply with such laws and regulations. Possible sanctions that may be imposed include the suspension of individual employees, limitations on engaging in certain lines of business for specified periods of time, revocation of investment adviser and other registrations, censures and fines.
SEC Regulation
MNA, AAC and Exeter Advisors, Inc., a subsidiary of AAC, are registered with the SEC as investment advisers under the Advisers Act, and the Fund and several of the third-party investment companies we sub-advise are registered under the 1940 Act. The Advisers Act and the 1940 Act, together with the SEC’s regulations and interpretations thereunder, impose substantive and material restrictions and requirements on the operations of advisers and mutual funds. The SEC is authorized to institute proceedings and impose sanctions for violations of the Advisers Act and the 1940 Act, ranging from fines and censures to termination of an adviser’s registration.
As an investment adviser, we have a fiduciary duty to our clients. The SEC has interpreted these duties to impose standards, requirements and limitations on, among other things:
| • | trading for proprietary, personal and client accounts; |
| • | allocations of investment opportunities among clients; |
| • | use of soft dollars; |
| • | execution of transactions; and |
| • | recommendations to clients. |
We manage accounts for all of our clients on a discretionary basis, with authority to buy and sell securities for each portfolio, select broker-dealers to execute trades and negotiate brokerage commission rates. In connection with these transactions, we receive soft dollar credits from broker-dealers that have the effect of reducing certain of our expenses. All of our soft dollar arrangements are intended to be within the safe harbor provided by Section 28(e) of the Exchange Act. If our ability to use soft dollars were reduced or eliminated as a result of the implementation of statutory amendments or new regulations, our operating expenses would increase.
As a registered adviser, we are subject to many additional requirements that cover, among other things:
| • | disclosure of information about our business to clients; |
| • | maintenance of formal policies and procedures; |
| • | maintenance of extensive books and records; |
| • | restrictions on the types of fees we may charge; |
| • | custody of client assets; |
| • | client privacy; |
| • | advertising; and |
| • | solicitation of clients. |
94
Table of Contents
The SEC has authority to inspect any investment adviser and typically inspects a registered adviser periodically to determine whether the adviser is conducting its activities (i) in accordance with applicable laws, (ii) consistent with disclosures made to clients and (iii) with adequate policies, procedures and systems to ensure compliance.
For the year ended December 31, 2010, 39% of our revenues were derived from our advisory services to investment companies registered under the 1940 Act, including 39% derived from our advisory services to the Fund. The 1940 Act imposes significant requirements and limitations on a registered fund, including with respect to its capital structure, investments and transactions. While we exercise broad discretion over the day-to-day management of the business and affairs of the Fund and the investment portfolios of the Fund and the funds we sub-advise, our own operations are subject to oversight and management by each fund’s board of directors. Under the 1940 Act, a majority of the directors must not be “interested persons” with respect to us (sometimes referred to as the “independent director” requirement). The responsibilities of the board include, among other things, approving our investment management agreement with the fund; approving other service providers; determining the method of valuing assets; and monitoring transactions involving affiliates. Our investment management agreements with these funds may be terminated by the funds on not more than 60 days’ notice, and are subject to annual renewal by the fund’s board after the initial term of one to two years.
The 1940 Act also imposes on the investment adviser to a mutual fund a fiduciary duty with respect to the receipt of the adviser’s investment management fees. That fiduciary duty may be enforced by the SEC, administrative action or litigation by investors in the fund pursuant to a private right of action.
Under the Advisers Act, our investment management agreements may not be assigned without the client’s consent. Under the 1940 Act, investment management agreements with registered funds (such as the mutual funds we manage) terminate automatically upon assignment. The term “assignment” is broadly defined and includes direct assignments as well as assignments that may be deemed to occur upon the transfer, directly or indirectly, of a controlling interest in us.
MNBD, our SEC-registered broker-dealer subsidiary, is subject to the SEC’s Uniform Net Capital Rule, which requires that at least a minimum part of a registered broker-dealer’s assets be kept in relatively liquid form. As of June 30, 2011, MNBD was in compliance with its net capital requirements.
ERISA-Related Regulation
We are a fiduciary under ERISA with respect to assets that we manage for benefit plan clients subject to ERISA. ERISA, regulations promulgated thereunder and applicable provisions of the Code impose certain duties on persons who are fiduciaries under ERISA, prohibit certain transactions involving ERISA plan clients and provide monetary penalties for violations of these prohibitions.
The fiduciary duties under ERISA may be enforced by the U.S. Department of Labor by administrative action or litigation and by our benefit plan clients pursuant to a private right of action. In addition, the IRS may assess excise taxes against us if we engage in prohibited transactions on behalf of or with our benefit plan clients.
New Hampshire Banking Department
Exeter Trust Company is a state-chartered non-depository trust company subject to the laws of the State of New Hampshire and the regulations promulgated thereunder by the New Hampshire Bank Commissioner.
Insurance-Related Regulation
Manning & Napier Benefits, LLC is a registered insurance broker with the New York State Insurance Department and, as such, is subject to various insurance and health-related rules and regulations.
95
Table of Contents
Non-U.S. Regulation
In addition to the extensive regulation our investment management industry is subject to in the United States, we are also subject to regulation internationally by various Canadian regulatory authorities in the Canadian provinces where we operate pursuant to exemptions from registration. We are authorized to act as a non-resident sub-advisory investment manager to collective investment vehicles in Ireland and Hong Kong. Our business is also subject to the rules and regulations of the more than 32 countries in which we currently buy and sell current portfolio investments.
Compliance
Our legal and compliance functions are integrated into one team of 11 professionals as of March 31, 2011. This group is responsible for all legal and regulatory compliance matters. Senior management is involved at various levels in all of these functions.
For information about our regulatory environment, see “Risk Factors—Risks Related to Our Industry—The regulatory environment in which we operate is subject to continual change and regulatory developments designed to increase oversight may adversely affect our business.”
96
Table of Contents
Set forth below is a list of the names, ages and positions of our executive officers and directors.
| Name |
Age | Position(s) | ||||
| William Manning |
74 | Chairman | ||||
| Patrick Cunningham |
55 | Chief Executive Officer and Director | ||||
| Jeffrey S. Coons |
48 | President | ||||
| Beth H. Galusha |
50 | Interim Chief Financial Officer | ||||
| Charles H. Stamey |
56 | Executive Vice President | ||||
| Richard B. Yates |
46 | Chief Legal Officer and Secretary | ||||
| B. Reuben Auspitz |
64 | Vice-Chairman | ||||
Biographies of Directors and Executive Officers
William Manning is our co-founder and has served as the Chairman of our board of directors since our organization. In addition, since 2003 Mr. Manning has served as Director of Investment Process at Manning & Napier Advisors, Inc., our affiliate, and, prior to that, was also the President of Manning & Napier Advisors, Inc. In addition, Mr. Manning has previously held officer and director positions with the Fund. Mr. Manning earned a Bachelor’s degree from Dartmouth College in 1956.
Mr. Manning’s qualifications to serve on our board of directors include his operating and leadership experience as an officer and director of Manning & Napier Advisors, Inc. since it was founded including in his role as the primary architect of its research and investment process.
Patrick Cunningham has served as our Chief Executive Officer and as a member of our board of directors since our organization. Mr. Cunningham joined Manning & Napier Advisors, Inc. in 1992, serves as a member of its board of directors and was appointed as its Chief Executive Officer in June 2010. In addition, Mr. Cunningham has served as a member of its executive management team since 1999, and was its co-chair from 2003 through 2010. Mr. Cunningham earned a Bachelor’s degree from Massachusetts Institute of Technology in 1977.
Mr. Cunningham’s qualifications to serve on our board of directors include his extensive experience in business development in the asset management industry.
Jeffrey S. Coons has served as our President since our organization. Dr. Coons has served as the President of Manning & Napier Advisors, Inc. since June 2010, as the Co-Director of Research since 2002 and as a member of its executive management team since 1999. In addition, Dr. Coons is a member of Manning & Napier Advisors, Inc.’s Senior Research Group. Dr. Coons earned a Bachelor’s degree from the University of Rochester in 1985, at which time he joined Manning & Napier Advisors, Inc., and a Ph.D from Temple University in 1990.
Beth H. Galusha has served as our Interim Chief Financial Officer since our organization. Ms. Galusha served as the Chief Financial Officer of MNA from 1994 until the end of August 2010, and has been acting as Manning & Napier Advisors, Inc.’s Interim Chief Financial Officer since that date until a permanent replacement is found. Ms. Galusha is the Treasurer of MNA, and has executive officer and director positions at certain other of our affiliates. Ms. Galusha earned a Bachelor’s degree from the University of Akron in 1983.
Charles H. Stamey has served as our Managing Director of Sales and Distribution since our organization. In addition, Mr. Stamey has served as the Managing Director of Sales and Distribution at Manning & Napier Advisors, Inc. since June 2010 and as a member of its executive management team since 1999. Prior to June 2010, Mr. Stamey served as the Managing Director of Client Relations of Manning & Napier Advisors, Inc. Mr. Stamey received his Bachelor’s degree from Mount Vernon University in 1982 and an M.B.A. from The Ohio State University in 1985.
97
Table of Contents
Richard B. Yates has served as our Chief Legal Officer and Secretary since our organization. In addition, Mr. Yates is the Chief Legal Officer of each of Manning & Napier Advisors, Inc. and the Fund and has executive officer and director positions at certain other of our affiliates. Mr. Yates earned a Bachelor’s degree from the University of Rochester in 1987 and a Juris Doctor from Brooklyn Law School in 1992.
B. Reuben Auspitz has served as the Vice-Chairman of our board of directors since our organization. In addition, Mr. Auspitz has been employed by Manning & Napier Advisors, Inc. since 1983 and serves as its Chief Compliance Officer, Executive Vice President and Vice-Chairman. Mr. Auspitz has served on Manning & Napier Advisors, Inc.’s executive management team since 1992 and was its co-chair from 2003 through 2010. Mr. Auspitz is also the Chairman and President of the Fund and has executive officer and director positions at certain other of our affiliates. Mr. Auspitz earned a Bachelor’s degree from Brandeis University in 1969, a Master’s degree from Princeton University in 1972 and was a Watson Foundation Fellow.
Mr. Auspitz’s qualifications to serve on our board of directors include his extensive experience in the investment management, research process and product development in the mutual fund business.
Board of Directors and Committees
Composition of Board of Directors
Our amended and restated certificate of incorporation and bylaws will provide that the authorized number of directors shall be fixed from time to time by a resolution of the majority of our board of directors. Our board of directors is presently comprised of the following three members: Messrs. Manning, Auspitz and Cunningham.
Because William Manning will hold a majority of the combined voting power of our capital stock through his ownership of 100% of our outstanding Class B common stock, we will be considered a “controlled company” for the purposes of the listing requirements. As such, we are permitted to, and may, opt out of the listing requirements that would otherwise require our board of directors to be comprised of a majority of independent directors and require our compensation committee and nominating and corporate governance committee to be comprised entirely of independent directors. Although we currently do not intend to opt out of any of these listing requirements, we may do so in the future. Accordingly, you may not have the same protections afforded to stockholders of companies that are subject to all of the corporate governance requirements. Our board of directors has determined that upon the consummation of this offering, will be independent.
Board Committees
Prior to the consummation of this offering, we will establish an audit committee, a compensation committee and a nominating and corporate governance committee, each of which will have the composition and responsibilities described below.
Audit Committee. Our audit committee will oversee a broad range of issues surrounding our accounting and financial reporting processes and audits of our financial statements, including the following:
| • | monitor the integrity of our financial statements, our compliance with legal and regulatory requirements, our independent registered public accounting firm’s qualifications and independence, and the performance of our internal audit function and independent registered public accounting firm; |
| • | assume direct responsibility for the appointment, compensation, retention and oversight of the work of any independent registered public accounting firm engaged for the purpose of performing any audit, review or attest services and for dealing directly with any such accounting firm; |
98
Table of Contents
| • | provide a medium for consideration of matters relating to any audit issues; and |
| • | prepare the audit committee report that the rules require be included in our filings with the SEC. |
Upon the consummation of this offering, the members of our audit committee will be , and , and will serve as chairman of the audit committee. will qualify as an “audit committee financial expert” as such term is defined in Item 407(d)(5) of Regulation S-K and will be “independent” as such term is defined in Rule 10A-3(b)(1) under the Securities Exchange Act of 1934, as amended, and the rules of the national exchange on which we list.
Our board of directors will adopt a written charter for the audit committee, which will be available on our website upon consummation of this offering.
Compensation Committee. Our compensation committee will review and recommend policy relating to compensation and benefits of our officers, directors and employees, including reviewing and approving corporate goals and objectives relevant to the compensation of our chief executive officer and other senior officers, evaluating the performance of these persons in light of those goals and objectives and setting compensation of these persons based on such evaluations. The compensation committee will review and evaluate, at least annually, the performance of the compensation committee and its members, including compliance of the compensation committee with its charter. Upon the consummation of this offering, the members of our compensation committee will be , and , and will serve as its chairman.
Our board of directors will adopt a written charter for the compensation committee, which will be available on our website upon consummation of this offering.
Nominating and Corporate Governance Committee. The nominating and corporate governance committee will oversee and assist our board of directors in identifying, reviewing and recommending nominees for election as directors; evaluating our board of directors and our management; developing, reviewing and recommending corporate governance guidelines and a corporate code of business conduct and ethics; and generally advise our board of directors on corporate governance and related matters. Upon the consummation of this offering, the members of our nominating and corporate governance committee will be , and , and will serve as its chairman.
Our board of directors will adopt a written charter for the nominating and corporate governance committee, which will be available on our website upon consummation of this offering.
Compensation Committee Interlocks and Insider Participation
Upon the effectiveness of the registration statement of which this prospectus forms a part, our board of directors will form a compensation committee as described above. Following this offering, the compensation committee of our board of directors will have responsibility for establishing and administering compensation programs and practices with respect to our executive officers, including the named executive officers. None of our executive officers serves as a member of the board of directors or compensation committee, or other committee serving an equivalent function, of any entity that has one or more of its executive officers serving as a member of our board of directors or our compensation committee.
Indemnification
We maintain directors’ and officers’ liability insurance. Our amended and restated certificate of incorporation and amended and restated bylaws include provisions limiting the liability of directors and officers and indemnifying them under certain circumstances. We expect to enter into indemnification agreements with our directors to provide our directors and certain of their affiliated parties with additional indemnification and related rights. See “Description of Capital Stock—Limitation on liability of directors and indemnification” for further information.
99
Table of Contents
Code of Ethics
Upon the consummation of this offering, our board of directors will adopt a Code of Ethics that contains the ethical principles by which our chief executive officer and chief financial officer, among others, are expected to conduct themselves when carrying out their duties and responsibilities. Upon the consummation of this offering, a copy of our Code of Ethics may be found on our website at www.manning-napier.com. We will provide a copy of our Code of Ethics to any person, without charge, upon request, by writing to the Chief Legal Officer, Manning & Napier, Inc., 290 Woodcliff Drive, Fairport, New York 14450 (telephone number (585) 325-6880). We intend to satisfy the disclosure requirement under Item 5.05 of Form 8-K regarding an amendment to, or waiver from, a provision of our Code of Ethics by posting such information on our operating company’s website at www.manning-napier.com.
100
Table of Contents
Compensation Discussion and Analysis
This section summarizes the principles underlying our compensation policies relating to our named executive officers—William Manning, Patrick Cunningham, Jeffrey S. Coons, Charles H. Stamey and Beth H. Galusha. It generally describes the manner and context in which compensation is earned by, and awarded and paid to, our named executive officers and provides perspective on the tables and narratives that follow in this section. During 2010 and through the consummation of this offering, we were a group of privately held, affiliated companies. We expect that some of our policies and practices with respect to compensation will change when we are a public company. This section also highlights those expected changes.
Compensation Philosophy and Objectives
We believe that to create long-term value for our stockholders we need a strong and seasoned management team that is focused on our business objectives of achieving profitable and sustainable financial results, expanding our investment capabilities through disciplined growth, continuing to diversify sources of revenue and delivering superior client service. Our named executive officers have strategic importance in supporting our business model of generating superior investment performance in high value-added investment strategies. We depend on our management team to execute on the strategic direction of the firm, recruit and manage our investment professionals, determine which investment strategies and products we launch, manage our distribution channels and provide the operational infrastructure that allows our investment professionals to focus on achieving attractive investment returns for our clients.
Our compensation program for our named executive officers is designed to meet the following objectives:
| • | support our business strategy; |
| • | attract, motivate and retain top-tier professionals within the investment management industry, by rewarding past performance and encouraging future contributions to achieve our strategic goals and enhance stockholder value; |
| • | link total compensation to individual, team and company performance on both a short-term and a long-term basis; |
| • | align our named executive officers’ interests with those of our stockholders; and |
| • | be flexible enough so we can respond to changing economic conditions. |
Our compensation and equity participation programs provide opportunities, predominantly contingent upon performance, which we believe have assisted our ability to attract and retain highly qualified professionals. We use, and expect to continue to use, cash compensation programs and equity participation in a combination that has been successful for us in the past and that we believe will continue to be successful for us as a public company. In addition to cash compensation, we have historically recognized those employees whose contributions created long-term and sustainable value and whose performance created wealth, or enabled the creation of wealth, for the owners of our business by the grant or sale, from time to time, of shares in MNA, our SEC registered investment adviser, and other of our affiliates, which allows the employee to share in the future profits and growth of our business through the payments of distributions to such employees. Other than Mr. Manning, who received all of his equity interests as a founder of our company or pursuant to the purchase of the equity interests of our other founder in 1995, our named executive officers received their equity interests at various times from 1995 through 2002. Since then, all issuances of equity to our employees have been to employees other than our named executive officers, as we have determined that the ownership of each of the named executive officers is at a level meaningful to meet our compensation objectives at this time.
101
Table of Contents
In connection with our transition to a public company, we intend for overall compensation levels to remain commensurate with amounts paid to our named executive officers and other key employees in the past, including, subject to the discretion of our compensation committee, by recommencing the issuance of equity in our company to our named executive officers, in addition to our regular cash compensation programs in circumstances we believe to be appropriate. We believe that the grant or sale of equity that is in addition to, rather than in lieu of, regular compensation to an employee in recognition of value produced provides incentives and alignment of interests that result in even greater value, benefiting not only the recipient of the award but all other stockholders. Our use of performance awards reflects that belief. As a public company, we intend to focus our programs on rewarding the type of performance that increases long-term shareholder value, including growing revenues, retaining clients, developing new client relationships, developing new products, improving operational efficiency and managing risks. As we develop as a public company, we intend to periodically evaluate the success of our compensation and equity participation programs in achieving these objectives and we expect that some of our policies and practices may change in order to enable us to better achieve these objectives.
Determination of Compensation and Role of Directors and Executive Officers in Compensation Decisions
Our executive compensation and equity participation programs were developed and implemented while we were a group of privately-held, affiliated companies, consisting of the Manning & Napier Companies. Historically, base salaries, annual bonuses and incentive compensation of our named executive officers and other professionals were reviewed by our management team and adjusted as deemed necessary after taking into account individual responsibilities, performance and expectations. We have not historically managed our firm to cause our aggregate compensation to be a particular percentage of revenues or another fixed measure, although we have sometimes used such measures as the basis for accruals of amounts pending subjective decision-making. Similarly, we have not historically identified a specific peer group of companies for comparative purposes and have not engaged in formal competitive benchmarking of compensation against specific peer companies. As a public company, we expect that our management team and our compensation committee will take into account appropriate metrics, which may include measures of our compensation expense as a percentage of revenues or other metrics, as well as comparisons with peer benchmarks.
We believe that the use of relatively few, straightforward compensation components, without rigid annual incentive formulas or entitlements, promotes the effectiveness and transparency of our executive compensation program. We have not adopted any policies with respect to cash versus non-cash compensation (or among different forms of non-cash compensation), although we have determined that it is important to encourage or provide for a meaningful amount of equity ownership by our named executive officers and other professionals to help align their interests with those of stockholders, one of our compensation objectives. The allocation between cash and non-cash compensation has been based on a number of factors, including each named executive officer’s performance objectives and our retention objectives and may vary from year to year. We may decide in future years to pay some or all of short-term and long-term incentives in equity depending upon the facts and circumstances existing at that time. We have not adopted any policies with respect to current compensation versus long-term compensation, but feel that both elements are necessary for achieving our compensation objectives. As a public company, we expect that long-term compensation will be provided with equity in the form of profit participation units in Manning & Napier Group, although our 2011 Plan gives us the flexibility to grant other types of equity-based compensation at the Manning & Napier Group level or the Manning & Napier level. Base salary provides financial stability for certain of our named executive officers, although we expect base salaries to be a minority of total income over time. Annual cash bonuses provide a reward for short-term company and individual performance. Long-term equity compensation rewards achievement of strategic long-term objectives and contributes toward overall stockholder value.
In connection with this offering, our Board of Directors will form a compensation committee comprised solely of independent directors to assist our Board of Directors in the discharge of its responsibilities relating to the compensation of our named executive officers. For a discussion of the compensation committee’s role and responsibility, see “Management—Board Committees—Compensation Committee” included elsewhere in this
102
Table of Contents
prospectus. We also expect that, in the future, our chief executive officer will have discretion to determine the compensation of the named executive officers (other than himself), which he will determine in consultation with our compensation committee. Our compensation committee has overall responsibility for overseeing our executive compensation policies, and has ultimate responsibility for setting the compensation of our Chairman, William Manning, and our chief executive officer, Patrick Cunningham. Our compensation committee is expected to assume overall responsibility for overseeing our compensation plans and programs, reviewing our achievements as a company and the achievements of our executive officers and providing input and guidance to our chief executive officer in the determination of the specific type and level of compensation of our other named executive officers.
We have not historically engaged a compensation consultant to assist in the annual review of our compensation practices or the development of compensation or equity participation programs for our named executive officers.
Principal Components of Compensation
We have established compensation practices that directly link compensation with our performance, as described below. These practices apply to all of our professionals, including our named executive officers. Ultimately, ownership in our company has historically been the primary tool that we use to attract and retain professionals, including the named executive officers. As of March 31, 2011, on a pro forma basis to take into account the reorganization transactions and the consummation of this offering, our employees indirectly held approximately % of the ownership interests in Manning & Napier Group, the substantial majority of which is held by Mr. Manning.
In 2010, we provided the following elements of compensation to our named executive officers, the relative value of each of these components for individual employees varying based on job role and responsibility:
| • | Base Salary. Base salaries are intended to provide Mr. Coons and Ms. Galusha with a degree of financial certainty and stability that does not depend on our performance. We consider it a baseline compensation level that delivers some current cash income to these executives. Consistent with industry practice, the base salary for Mr. Coons generally accounts for a relatively small portion of his overall compensation, as he receives the majority of his compensation in the form of an annual bonus. Messrs. Cunningham and Stamey do not receive a base salary as their compensation structure has historically been derived from their original positions with our company as sales representatives where they received 100% commission-based bonus compensation based on individual sales production and no base salary. When Messrs. Cunningham and Stamey shifted from their respective sales representative roles into management we retained their original compensation structure but expanded it to include all our revenues instead of solely their individual sales production. See “—Annual Bonus.” Mr. Manning receives a base salary for services provided as a named executive officer based on historical amounts paid to him, and such base salary is not currently based on any formula or production levels. The base salaries paid to Mr. Manning, Mr. Coons and Ms. Galusha for 2010 are set forth below in the summary compensation table. See “—Summary Compensation Table.” |
| • | Annual Bonus. Cash incentive compensation is a key part of the overall annual compensation for Messrs. Cunningham, Stamey and Coons. Annual cash incentive compensation is based on a number of variables that are linked to company-wide performance for that year and over the longer term. We have historically used predetermined incentive formulas to evaluate performance, with those formulas evaluated on a periodic basis relative to the firm’s goals and needs. We believe this has provided us both discipline and the flexibility we need to support our success and to respond to changing market conditions. Messrs. Cunningham and Stamey received bonus compensation for overall management of our sales distribution channels measured by revenues. Mr. Coons, in his role as co-director of the Research Department, received a bonus for overall management of our |
103
Table of Contents
| research team measured by firmwide net equity investment gains reflected in the client investment portfolios. We have historically not paid annual bonuses to Mr. Manning and Ms. Galusha, as distributions to them from their ownership in the Manning & Napier Companies was at a level where additional bonus compensation was not judged to be in our best interests. See “—Equity Based Compensation.” The annual cash incentive compensation awarded to our named executive officers for the fiscal year ended December 31, 2010 is set forth below under “—Summary Compensation Table.” We expect to establish a compensation plan prior to the completion of this offering that provides for the payment of cash incentive compensation to our employees, including our named executive officers. These cash bonuses may be awarded with reference to performance benchmarks in a manner similar to that which would be required under Section 162(m) of the Code as deductible compensation expenses for a public company. |
| • | Equity Based Compensation. Of our current employees, all of our named executive officers and other of our employees have ownership interests in certain of the Manning & Napier Companies. These ownership interests were offered to the named executive officers and other employees as part of our regular compensation program. Since 2002, all issuances of equity to our employees have been to employees other than our named executive officers. |
In connection with the reorganization transactions, each of the Manning & Napier Companies will amend and restate its shareholders’ agreement, pursuant to which, among other things, the vesting terms related to the current ownership interests of our employees, including our named executive officers, other than William Manning, will be amended. As a result, we will recognize non-cash compensation expenses, through 2014.
Following this offering, as conditions allow, we intend to award equity-based incentives under the 2011 Plan as an incentive to align employee and management interests with that of the stockholders in our company and otherwise recruit and retain qualified employees. Subject to the discretion of the compensation committee, we intend to recommence the issuance of equity in our company to our named executive officers.
Accordingly, we intend to adopt the 2011 Plan, which permits the grant or issuance of a variety of equity awards of both Manning & Napier and of Manning & Napier Group. The 2011 Plan provides us the option and flexibility to grant other types of awards at either the Manning & Napier or Manning & Napier Group level. See “—2011 Equity Compensation Plan.”
In determining the number of equity awards to be granted to the named executive officers, we have taken, and in the future intend to take, into account the following factors:
| • | the value of such awards; |
| • | the named executive officer’s level of current and potential job responsibility; and |
| • | our desire to retain the named executive officer over the long term. |
Other than the issuance to Mr. Manning of units in M&N Group Holdings as part of the reorganization, we do not intend to grant additional options or other equity awards to our named executive officers prior to completion of the offering.
The grant or sale of equity to our named executive officers and other employees allows them to share in the future profits and growth of our business through the payments of distributions to such equity holders. Historically, the substantial majority of the cash that Mr. Manning and certain other executives and key employees received from us consisted of pro rata cash distributions in respect of such ownership interests at the same time as cash distributions made to all other holders of
104
Table of Contents
ownership interests. The amounts of these cash distributions are footnoted in the Summary Compensation Table below because they arise out of the named executive officers’ ownership interest and are not considered compensatory distributions. All of our named executive officers currently own equity in Manning & Napier Advisors, Inc. and other of the Manning & Napier Companies, which provide them with cash distributions (or allocations) of profits on his or her shares and interests and the opportunity to benefit from the appreciation of (or suffer the depreciation of) the value of those shares and interests from and after the date of grant. In the three years ended December 31, 2010, distributions in respect of equity owned by each of the named executive officers constituted from 33% to 98% of the total income they received from us. These percentages could change from year to year depending on various factors, including changes in compensation and our profitability.
| • | Retirement Benefits. We believe that providing a cost-effective retirement benefit for our employees, including our named executive officers, is an important recruitment and retention tool. Accordingly, we maintain a contributory defined contribution retirement plan for all employees, and match up to 50% of each employee’s contributions up to 4% of eligible compensation (other than catch-up contributions by employees age 50 and older) up to a current limit of $16,500. |
| • | Other Benefits and Perquisites. Our named executive officers participate in the employee health and welfare benefit programs we maintain, including medical, group life and long-term disability insurance, and health-care flexible spending, on the same basis as all employees, subject to satisfying any eligibility requirements and applicable law. We also generally provide other perquisites such as partial reimbursement for health club fees up to $300 per annum. Currently we do not have plans to change the levels of perquisites received, but continue to monitor them and may make adjustments in this form of compensation from time to time. Our named executive officers enjoy those benefits on the same terms as all of our employees. As part of our ongoing review of executive compensation, we intend to periodically review the perquisites and other personal benefits provided to our named executive officers and other key employees. The perquisites provided to our named executive officers in the fiscal year ended December 31, 2010 are described below under “—Summary Compensation Table.” Furthermore, we offer each of our employees, including each of the named executive officers, our investment management services, if they place their funds in a separately-managed account with us, at a discounted advisory fee typically associated with these services. This benefit is provided at no incremental cost to us. |
Following this offering, we will operate as a corporation. In connection with the reorganization transactions, the shares and limited liability company interests currently held by Mr. Manning and the other named executive officers in the privately held, affiliated companies will continue to be held by them and will entitle them to continue to receive distributions from our subsidiaries indirectly after the consummation of this offering.
Stock Ownership Guidelines
Our named executive officers are not subject to mandated equity ownership or retention guidelines. However, it is our belief that the equity component of our executive compensation program ensures that our named executive officers are also owners and those components work to align the named executive officers’ goals with the best interests of our stockholders. We expect to continue to periodically review best practices and evaluate our position with respect to stock ownership guidelines.
105
Table of Contents
Tax Considerations
Our compensation committee is expected to consider the anticipated tax and accounting treatment of various payments and benefits to us and, when relevant, to our executives, although these considerations are not dispositive. Section 162(m) of the Code generally disallows a tax deduction to a publicly-traded corporation that pays compensation in excess of $1 million to any of its named executive officers (other than the chief financial officer) in any taxable year, unless the compensation plan and awards meet certain requirements. As a group of affiliated private companies, Section 162(m) does not currently apply to our compensation. To the extent Section 162(m) is applicable to us, we will endeavor to structure compensation to qualify as performance-based under Section 162(m) where it is reasonable to do so while meeting our compensation objectives. Notwithstanding the foregoing, we reserve the right to pay amounts that are not deductible under Section 162(m) during any period when Section 162(m) is applicable to us.
Risk Considerations in our Compensation Program
We have identified two primary risks relating to compensation: the risk that compensation will not be sufficient to retain talent, and the risk that compensation may provide unintended incentives. To combat the risk that our compensation might not be sufficient, we strive to use a compensation structure, and set compensation levels, for all employees in a way that we believe contributes to low rates of employee attrition. We also make equity awards subject to multi-year vesting schedules to provide a long-term component to our compensation program and impose on all our employees ongoing restrictions on their disposition of their holdings of our stock acquired through equity awards. We believe that both the structure and levels of compensation have aided us in retaining key personnel as evidenced by the long-term tenure of our management and the fact that only one of 57 employee shareholders has left the firm for any other reason than retirement since the program began on December 31, 1992. To address the risk that our compensation programs might provide unintended incentives, we deliberately keep our compensation programs simple and we tie the long-term component of compensation to our firm-wide results. We have not seen any employee behaviors motivated by our compensation policies and practices that create increased risks for our stockholders or our clients.
Our compensation committee, which will be comprised entirely of independent directors upon the consummation of this offering, will review our compensation plans and policies periodically to ensure proper alignment with overall company goals and objectives. Our compensation committee is also expected to review the risks arising from our compensation policies and practices and assesses whether any such risks are reasonably likely to have an adverse effect on us. Our management team has previously concluded that our compensation programs do not encourage excessive or unnecessary risk taking.
Based on the foregoing, we do not believe that our compensation policies and practices motivate imprudent risk taking. Consequently, we are satisfied that any potential risks arising from our employee compensation policies and practices are not reasonably likely to have an adverse effect on the company. In the future, when we are a public company, the compensation committee will monitor the effects of its compensation decisions to determine whether risks are being appropriately managed.
106
Table of Contents
Summary Compensation Table
The following table shows the annual compensation of our principal executive officer, principal financial officer and the three most highly compensated executive officers other than our principal executive officer and principal financial officer who were serving as executive officers on December 31, 2010.
| Name and Principal Position |
Year | Salary | Bonus | All Other Compensation (1) |
Total | |||||||||||||||
| William Manning |
2010 | $ | 1,400,000 | — | $ | 54,921 | (2) | $ | 1,454,921 | |||||||||||
| Chairman and Director of Investment Process |
||||||||||||||||||||
| Patrick Cunningham |
2010 | (3 | ) | $ | 3,729,438 | — | $ | 3,729,438 | ||||||||||||
| Chief Executive Officer |
||||||||||||||||||||
| Jeffrey S. Coons |
2010 | $ | 150,000 | $ | 643,302 | — | $ | 793,302 | ||||||||||||
| President and Co-Director of Research |
||||||||||||||||||||
| Charles H. Stamey |
2010 | (3 | ) | $ | 3,729,439 | — | $ | 3,729,439 | ||||||||||||
| Managing Director of Sales and Distribution |
||||||||||||||||||||
| Beth H. Galusha |
2010 | $ | 98,500 | — | — | $ | 98,500 | |||||||||||||
| Interim Chief Financial Officer and |
||||||||||||||||||||
| (1) | Each of the named executive officers beneficially own shares or other interests in Manning & Napier Advisors, Inc. and other of the Manning & Napier Companies, and receive pro rata cash distributions based on the net income of those companies in respect of their shares or other interests at the same time cash distributions are made on all shares or other interests in those companies. For the fiscal year ended December 31, 2010, distributions received by the named executive officers were: William Manning–$79,023,416; Patrick Cunningham–$2,241,152; Jeffrey S. Coons–$2,241,152; Charles H. Stamey–$2,241,152; and Beth H. Galusha–$560,876. |
| (2) | Represents the aggregate dollar amount of all miscellaneous compensation received by William Manning. Under SEC rules, we are required to identify by type all perquisites and other personal benefits for a named executive officer if the total value for the individual equals or exceeds $10,000. We paid and Mr. Manning received an equal miscellaneous compensation adjustment for health insurance premiums in the amount of $31,081and tax compliance services in the amount of $23,840 paid by us on Mr. Manning’s behalf. |
| (3) | Mr. Cunningham and Mr. Stamey do not receive a base salary as their compensation is based solely on a bonus structure. See “—Compensation Discussion and Analysis—Principal Components of Compensation—Base Salary” and “—Compensation Discussion and Analysis—Principal Components of Compensation—Annual Bonus.” |
| (4) | Ms. Galusha served as our chief financial officer until August 31, 2010 and has been acting as interim chief financial officer since that date until a permanent replacement is found. |
Employment Agreements
MNA is currently party to employment agreements with each of Messrs. Coons, Cunningham and Stamey, which provide for at-will employment for each of them. While these agreements do not provide compensation terms or duration of employment, such agreements include restrictive covenants concerning competition with us and solicitation of our employees and clients. Pursuant to such agreements, for a two-year period following termination of employment, (i) the former employee may not, without the written consent of MNA, do business with a person or entity known to such employee to be, or known to have been, a client of MNA at the time of such employee’s employment, (ii) the former employee may not compete with MNA in the territories covered by such person and (iii) the former employee shall notify MNA of all business activities to
107
Table of Contents
enable MNA to evaluate compliance with (i) and (ii). In addition, for a five-year period following termination of employment, the former employee may not, without the written consent of MNA, employ or contract any person who then is or has been an employee of or consultant to MNA within two years prior such date of termination. In addition to these employment agreements, each of Messrs. Coons, Cunningham and Stamey and Ms. Galusha are subject to similar non-compete and non-solicitation covenants as part of the shareholder agreements with the Manning and Napier Companies.
Outstanding Equity Awards at Fiscal Year End 2010
The following table sets forth information relating to shares and other equity interests issued to the named executive officers subject to vesting provisions.
| Stock Awards | ||||||||||||||||
| Name |
Number of Shares or Units of Stock That Have Not Vested |
Market Value of Shares or Units of Stock That Have Not Vested (1) |
Equity Incentive Plan Awards: Number of Unearned Shares, Units or Other Rights That Have Not Vested |
Equity Incentive Plan Awards: Market or Payout Value of Unearned Shares, Units or Other Rights That Have Not Vested |
||||||||||||
| William Manning |
— | — | — | — | ||||||||||||
| Patrick Cunningham |
— | — | — | — | ||||||||||||
| Jeffrey S. Coons |
70,395 | $ | 8,296,051 | — | — | |||||||||||
| Charles H. Stamey |
37,050 | $ | 4,366,343 | — | — | |||||||||||
| Beth H. Galusha |
11,115 | $ | 1,309,903 | — | — | |||||||||||
| (1) | Based on the fair value of our shares on December 31, 2010. |
Option Exercises and Stock Vested Table
The following table sets forth information concerning shares and other equity interests acquired upon the vesting of such shares or equity interests by the named executive officers in 2010.
| Stock Awards | ||||||||
| Name |
Number of Shares Acquired on Vesting | Value Realized on Vesting (1) | ||||||
| William Manning |
— | — | ||||||
| Patrick Cunningham |
14,820 | $ | 400,288 | |||||
| Jeffrey S. Coons |
11,115 | $ | 300,216 | |||||
| Charles H. Stamey |
14,820 | $ | 400,288 | |||||
| Beth H. Galusha |
1,853 | $ | 50,036 | |||||
| (1) | Reflects the fair value of our shares on January 1, 2010, the date such shares vested. |
Potential Payments Upon Termination or Change in Control
Prior to this offering, equity granted to our named executive officers and other of our employees was subject to accelerated vesting upon a change of control of our company. Such equity will no longer be subject to such acceleration following the reorganization transactions. Equity granted under our 2011 Plan is not expected to be subject to accelerated vesting upon termination of employment. All such equity that may be held by the named executive officers would be subject to accelerated vesting upon a change in control, as defined in the 2011 Plan. See “—Equity Compensation Plan.”
108
Table of Contents
Director Compensation
Upon completion of this offering, we do not expect to pay our directors who are also our employees any compensation for their services as directors. We anticipate that our non-employee directors will initially be compensated with an annual retainer of $ and an equity grant on terms to be determined. We also anticipate that each non-employee chairman of a committee of our board of directors will be compensated with an additional annual retainer of $ . In addition, all directors will be reimbursed for reasonable out-of-pocket expenses incurred by them in connection with attending board of directors, committee and stockholder meetings, including those for travel, meals and lodging. We reserve the right to change the manner and amount of compensation to our non-employee directors at any time.
2011 Equity Compensation Plan
Our board of directors expects to adopt, and our stockholders expect to approve, the 2011 Plan in connection with this offering.
The purposes of the 2011 Plan are to align the long-term financial interests of employees, directors, consultants and advisors of the company with those of our stockholders, to attract and retain those individuals by providing compensation opportunities that are consistent with our compensation philosophy, and to provide incentives to those individuals who contribute significantly to our long-term performance and growth. To accomplish these purposes, the 2011 Plan will provide for the grant of units of Manning & Napier Group. The 2011 Plan will also provide for the grant of stock options (both stock options intended to be incentive stock options under Section 422 of the Code and non-qualified stock options), stock appreciation rights (“SARs”), restricted stock awards, restricted stock units, performance-based stock awards and other stock-based awards (collectively, stock awards) based on our Class A common stock. In addition, the 2011 Plan will provide for the grant of performance-based cash awards. Incentive stock options may be granted only to employees; all other awards may be granted to employees, including officers, members, limited partners or partners who are engaged in the business of one or more of our subsidiaries, non-employee directors and consultants.
It is initially anticipated that awards under the 2011 Plan granted to our employees will be in the form of units of Manning & Napier Group that will not vest until a specified period of time has elapsed, or other vesting conditions have been satisfied as determined by the compensation committee, and which may be forfeited if the vesting conditions are not met. During the period that any vesting restrictions apply, unless otherwise provided by the compensation committee, the recipient of the award will be eligible to participate in distributions of income from Manning & Napier Group. In addition, before the vesting conditions have been satisfied, the transferability of such units is generally prohibited and such units will not be eligible to be exchanged for cash or shares of our Class A common stock pursuant to the exchange agreement.
Awards under the 2011 Plan will be structured to comply with Section 409A of the Code.
Shares Subject to the 2011 Plan
A total of equity interests will be reserved and available for issuance under the 2011 Plan. The equity interests may be issued in the form of our Class A common stock or units of Manning & Napier Group.
If an equity award granted under the 2011 Plan expires or otherwise terminates without being exercised in full, or is settled in cash, the equity interests not acquired pursuant to the award will again become available for subsequent issuance under the 2011 Plan. In addition, the following types of equity under the 2011 Plan may become available for the grant of new equity awards under the 2011 Plan: (i) equity that is forfeited to or repurchased by us prior to becoming fully vested; (ii) equity withheld to satisfy income or employment withholding taxes; (iii) equity used to pay the exercise price of an option in a net exercise arrangement; and (iv) equity tendered to us to pay the exercise price of an option.
109
Table of Contents
The aggregate number of equity interests that may be granted to any single individual during a calendar year in the form of options, SARs, restricted stock, restricted stock units, performance-based stock awards and/or other stock-based awards may not exceed . The 2011 Plan will also limit grants measured in cash to $ in any calendar year.
Administration of the 2011 Plan
The 2011 Plan will be administered by our compensation committee. Subject to the terms of the 2011 Plan, the compensation committee will determine which employees, directors, consultants and advisors will receive grants under the 2011 Plan, the dates of grant, the numbers and types of stock awards to be granted, the exercise or purchase price of each award, and the terms and conditions of the stock awards, including the period of their exercisability and vesting and the fair market value applicable to a stock award. In addition, the compensation committee will interpret the 2011 Plan and may adopt any administrative rules, regulations, procedures and guidelines governing the 2011 Plan or any awards granted under the 2011 Plan as it deems to be appropriate.
The compensation committee may cancel, with the consent of the affected participants, any or all of the outstanding stock options or SARs in exchange for (i) new stock options or SARs covering the same or a different number of shares of our Class A common stock, but with an exercise price or base amount per share not less than the fair market value per share of our Class A common stock on the new grant date; or (ii) cash or shares of our Class A common stock, whether vested or unvested, equal in value to the value of the cancelled stock options or SARs.
Types of Equity-Based Awards
The types of awards that may be made under the 2011 Plan are described below. These awards may be made singly or in combination, as part of compensation awards or ownership awards, or both. All of the awards described below are subject to the conditions, limitations, restrictions, vesting and forfeiture provisions determined by the compensation committee, in its sole discretion subject to certain limitations provided in the 2011 Plan. Each award granted under the 2011 Plan will be evidenced by an award agreement, which will govern that award’s terms and conditions.
Non-qualified Stock Options. A non-qualified stock option is an option that does not meet the qualifications of an incentive stock option as described below. An award of a non-qualified stock option grants a participant the right to purchase a certain number of shares of our Class A common stock during a specified term in the future, after a vesting period, at an exercise price equal to at least 100% of the fair market value of our Class A common stock on the grant date. The term of a non-qualified stock option may not exceed ten years from the date of grant. The exercise price may be paid using (i) cash, check, bank draft or money order; (ii) a broker-assisted cashless exercise; (iii) shares of our Class A common stock previously owned by the participant; (iv) a net exercise of the stock option; and (v) other legal consideration approved by the compensation committee. Except as provided in the award agreement or as otherwise determined by the compensation committee, an option may only be exercised while the participant is employed by, or providing services to, us or our subsidiaries, or during an applicable period after termination of employment or service.
Incentive Stock Options. An incentive stock option is a stock option that meets the requirements of Section 422 of the Code. Incentive stock options may be granted only to our employees and must have an exercise price of no less than 100% of fair market value on the grant date, a term of no more than ten years, and be granted from a plan that has been approved by our stockholders. The aggregate fair market value, determined at the time of grant, of our Class A common stock with respect to incentive stock options that are exercisable for the first time by a participant during any calendar year under all of our stock plans may not exceed $100,000. No incentive stock option may be granted to any person who, at the time of the grant, owns or is deemed to own stock possessing more than 10% of our total combined voting power or that of any of our affiliates unless (i) the
110
Table of Contents
option exercise price is at least 110% of the fair market value of the stock subject to the option on the date of grant; and (ii) the term of the incentive stock option does not exceed five years from the date of grant.
Stock Appreciation Rights. A SAR entitles the participant to receive an amount equal to the difference between the fair market value of our Class A common stock on the exercise date and the exercise price of the SAR (which may not be less than 100% of the fair market value of a share of our Class A common stock on the grant date), multiplied by the number of shares subject to the SAR. The term of a SAR may not exceed ten years from the date of grant. Payment to a participant upon the exercise of a SAR may be either in cash or shares of our Class A common stock as determined by the compensation committee. Except as provided in the award agreement or as otherwise determined by the compensation committee, a SAR may only be exercised while the participant is employed by, or providing services to, us or our subsidiaries or during an applicable period after termination of employment or service.
Restricted Stock. A restricted stock award is an award of outstanding shares of our Class A common stock that does not vest until a specified period of time has elapsed, or other vesting conditions have been satisfied as determined by the compensation committee, and which may be forfeited if the conditions to vesting are not met. During the period that any restrictions apply, the transferability of stock awards is generally prohibited. Participants generally have all of the rights of a stockholder as to those shares, including the right to receive dividend payments on the shares subject to their award during the vesting period (unless the awards are subject to performance-vesting criteria) and the right to vote those shares. Dividends will be subject to the same restrictions as the underlying restricted stock unless otherwise provided by the compensation committee. All unvested restricted stock awards are forfeited if the participant’s employment or service is terminated for any reason, unless the compensation committee determines otherwise.
Restricted Stock Units. A restricted stock unit is a phantom unit that represents shares of our Class A common stock. Restricted stock units become payable on terms and conditions determined by the compensation committee and will be settled either in cash or shares of our Class A common stock as determined by the compensation committee. All unvested restricted stock units are forfeited if the participant’s employment or service is terminated for any reason, unless the compensation committee determines otherwise.
Performance Awards. The 2011 Plan permits the grant of performance-based stock and cash awards that may qualify as performance-based compensation that is not subject to the $1 million limitation on the income tax deductibility of compensation paid per covered executive officer imposed by Section 162(m) of the Code to the extent Section 162(m) is applicable to us. To assure that the compensation attributable to performance-based stock or cash awards will so qualify, our compensation committee can (but will not be required to) structure these awards so that stock or cash will be issued or paid pursuant to the award only upon the achievement of certain pre-established performance goals during a designated performance period.
The performance goals, to the extent designed to meet the requirements of Section 162(m) of the Code, will be based on one or more of the following criteria: enterprise value or value creation targets; revenue; after-tax or pre-tax profits (including net operating profit after taxes) or net income (including that attributable to continuing and/or other operations); operational cash flow or earnings before income tax or other exclusions (including free cash flow, cash flow per share or earnings before interest, taxes, depreciation and amortization); reduction of, or limiting the level of or increase in, all or a portion of our indebtedness, or of our affiliates; earnings per share or earnings per share from continuing operations; return on capital employed (including return on invested capital or return on committed capital) or return on assets; after-tax or pre-tax return on stockholder equity; market share; the fair market value of the shares of our Class A common stock; the growth in the value of an investment in our Class A common stock assuming the reinvestment of dividends; reduction of, or limiting the level of or increase in, all or a portion of controllable expenses or costs or other expenses or costs (including selling, general and administrative expenses or costs as a percentage of revenues); or economic value-added targets based on a cash flow return on investment formula.
111
Table of Contents
Dividend Equivalents. Dividend equivalents entitle the participant to receive amounts equal to ordinary dividends that are paid on the shares underlying a grant while the grant is outstanding and may be awarded in connection with grants other than stock options or SARs. The compensation committee will determine whether dividend equivalents will be paid currently or credited to a bookkeeping account as a dollar amount or in the form of restricted stock units. Dividend equivalents may be paid in cash, in shares of our Class A common stock or in a combination of the two. The compensation committee will determine whether dividend equivalents will be conditioned upon the exercise, vesting or payment of the grant to which they relate and the other terms and conditions of the grant.
Units of Manning & Napier Group, LLC. Under the 2011 Plan, the compensation committee may also grant equity-based incentives related to units of Manning & Napier Group to encourage ownership in our operating partnership. The compensation committee may grant the same types of awards available under the 2011 Plan related to our Class A common stock as awards related to the units of Manning & Napier Group, including options to purchase units. Any award granted covering units will reduce the overall limit with respect to the number of shares of Class A common stock that may be granted under the 2011 Plan on a one-for-one basis.
Other Equity-Based Awards. Under the 2011 Plan, the compensation committee may grant other types of awards that are based on, or measured by reference to, shares of our Class A common stock or units of Manning & Napier Group. The compensation committee will determine the terms and conditions of such awards. Other stock-based awards may be settled in either cash or equity, as determined by the compensation committee.
Adjustments
In connection with stock splits, stock dividends, recapitalizations and certain other events affecting our Class A common stock, the compensation committee will make adjustments as it deems appropriate in (i) the maximum number of shares of our Class A common stock reserved for issuance as grants; (ii) the maximum number of shares by which the share reserve may increase automatically each year; (iii) the maximum number of shares of our Class A common stock that any individual participating in the 2011 Plan may be granted in any calendar year; (iv) the number and kind of shares covered by outstanding grants; (v) the kind of shares that may be issued under the 2011 Plan; and (vi) the exercise price of all outstanding stock awards, if applicable.
Change of Control
If we experience a change of control, unless our compensation committee determines otherwise, all outstanding options and SARs will automatically accelerate and become fully exercisable, the restrictions and conditions on all outstanding stock awards will immediately lapse and all participants holding stock awards will receive a payment in settlement of their grants in an amount determined by the compensation committee. The compensation committee may also provide that (i) participants will be required to surrender their outstanding stock options and SARs in exchange for a payment, in cash or shares of our Class A common stock, equal to the difference between the exercise price and the fair market value of the underlying shares of Class A common stock; (ii) after the participants have the opportunity to exercise their stock options and SARs, any unexercised stock options and SARs will be terminated on the date determined by our compensation committee; or (iii) all outstanding stock options and SARs not exercised will be assumed or replaced with comparable options or SARs by the surviving corporation (or a parent or subsidiary of the surviving corporation) and other outstanding stock awards will be converted to similar grants of the surviving corporation (or a parent or subsidiary of the surviving corporation) as determined by the compensation committee.
In general terms, a change of control under the 2011 Plan occurs:
| • | if a person, entity or affiliated group (with certain exceptions) acquires more than % of our then outstanding voting securities; |
112
Table of Contents
| • | if we merge into another entity, unless the holders of our voting shares immediately prior to the merger have at least 50% of the combined voting power of the securities in the merged entity or its parent; |
| • | if we sell or dispose of all or substantially all of our assets; |
| • | if we are liquidated or dissolved; or |
| • | if a majority of the members of our board of directors is replaced during any 12-month or shorter period by directors whose appointment or election is not endorsed by a majority of the incumbent directors. |
Section 162(m) Stockholder Approval Requirements
In compliance with the transition rules under Section 162(m) of the Code, and after our initial public offering, to the extent Section 162(m) is applicable to us, our stockholders will approve the 2011 Plan no later than the first occurrence of: (i) the expiration of the 2011 Plan; (ii) a material modification of the 2011 Plan (in accordance with Section 162(m) of the Code); (iii) the issuance of all of our Class A common stock authorized for issuance under the 2011 Plan; or (iv) our first stockholders’ meeting (during which our directors are elected) that occurs after the end of the third calendar year following the year in which our initial public offering occurred.
Amendment; Termination
Our board of directors or our compensation committee may amend or terminate the 2011 Plan at any time. Our stockholders must approve any amendment if their approval is required in order to comply with the Code, applicable laws, or applicable stock exchange requirements. Unless terminated sooner by our board of directors or extended with stockholder approval, the 2011 Plan will terminate on the day immediately preceding the tenth anniversary of the date on which the board of directors approved the 2011 Plan, but any outstanding award will remain in effect until the underlying shares are delivered or the award lapses.
113
Table of Contents
CERTAIN RELATIONSHIPS AND RELATED PARTY TRANSACTIONS
Promissory Notes
William Manning issued to MNA (i) that certain promissory note due December 19, 2008 in the principal amount of $10 million, or the 2008 note, and (ii) that certain promissory note due June 17, 2009 in the principal amount of $8 million, or the 2009 note. William Manning repaid the 2008 note in full, including all interest accrued thereon, with payments to MNA on November 7, 2008 and December 19, 2008. William Manning repaid the 2009 note in full, including all interest accrued thereon, with payments to MNA on April 16, 2009 and June 17, 2009.
Aircraft
From time to time, MNA reimburses William Manning for business travel in connection with the use of a private plane owned by William Manning. Neither MNA nor any of the other Manning & Napier Companies owns any direct or indirect interest in such private plane, and no such entity has provided any financing to William Manning for such plane. In the event William Manning, or other executives, use such plane in connection with the business of our company, MNA reimburses William Manning based upon the amount of flight time per trip, which is a fraction of the total cost of the ownership and maintenance of such plane. Reimbursements with respect to each particular use of the plane over the last three years have ranged from $60,220 to $90,497, and in the aggregate has equaled $227,225.
Reorganization Transactions
Prior to the consummation of this offering, we entered into a series of transactions to reorganize our capital structure. We will also enter into agreements with certain related persons in connection with the reorganization transactions. See “Our Structure and Reorganization.”
Policies and Procedures Regarding Transactions with Related Persons
Upon the consummation of this offering, our board of directors will have adopted written policies and procedures for transactions with related persons. As a general matter, the policy will require our audit committee to review and approve or disapprove the entry by us into certain transactions with related persons. The policy will contain transactions which are pre-approved transactions. The policy will only apply to transactions, arrangements and relationships where the aggregate amount involved could reasonably be expected to exceed $120,000 in any calendar year and in which a related person has a direct or indirect interest. A related person is: (i) any of our directors, nominees for director or executive officers, (ii) any immediate family member of any of our directors, nominees for director or executive officers and (iii) any person, and his or her immediate family members, or entity, including affiliates, that was a beneficial owner of 5% or more of any of our outstanding equity securities at the time the transaction occurred or existed.
The policy will provide that if advance approval of a transaction subject to the policy is not obtained, it must be promptly submitted to the audit committee for possible ratification, approval, amendment, termination or rescission. In reviewing any transaction, the audit committee will take into account, among other factors the audit committee deems appropriate, recommendations from senior management, whether the transaction is on terms no less favorable than terms generally available to a third party in similar circumstances and the extent of the related person’s interest in the transaction. Any related person transaction must be conducted at arm’s length. Any member of the audit committee who is a related person with respect to a transaction under review may not participate in the deliberations or vote on the approval or ratification of the transaction. However, such a director may be counted in determining the presence of a quorum at a meeting of the audit committee that considers the transaction.
114
Table of Contents
PRINCIPAL AND SELLING STOCKHOLDERS
The following table sets forth information regarding the beneficial ownership of our capital stock as of , 2011 with respect to:
| • | each person known to us to own beneficially more than 5% of any class of our outstanding shares; |
| • | each person that will be a selling stockholder in this offering; |
| • | each of our named executive officers; |
| • | each of our directors; and |
| • | all of our directors and executive officers as a group. |
The number of shares of our Class A common stock and Class B common stock outstanding and percentage of beneficial ownership before this offering set forth below is based on the number of shares of common stock outstanding immediately prior to the consummation of this offering after giving effect to the reorganization transactions described in “Our Structure and Reorganization.”
Pursuant to the terms of an exchange agreement between M&N Group Holdings and Manning & Napier, prior to this offering M&N Group Holdings exchanged of its Class A units of Manning & Napier Group for shares of our Class A common stock. M&N Group Holdings is selling such shares of our Class A common stock on account for William Manning and certain other persons (all of whom are our employees, including our named executive officers) in this offering. See “Our Structure and Reorganization—Offering Transactions—Exchange Agreement” and “Principal and Selling Stockholders.”
In accordance with the rules and regulations of the SEC, beneficial ownership includes voting or investment power with respect to securities and includes the shares issuable pursuant to stock options that are exercisable within 60 days of , 2011. Shares issuable pursuant to stock options are deemed outstanding for computing the percentage of the person holding such options but are not outstanding for computing the percentage of any other person. To our knowledge, except as indicated in the footnotes to this table and pursuant to applicable community property laws, the persons named in the table have sole voting and investment power with respect to all shares of Class A common stock and Class B common stock. For more information regarding our principal stockholders and the relationship they have with us, see “Certain Relationships and Related Party Transactions.” Unless otherwise indicated, the address for each stockholder listed below is c/o Manning & Napier, Inc., 290 Woodcliff Drive, Fairport, New York 14450.
115
Table of Contents
| Class A common stock (1) | Class B common stock (1) | |||||||||||||||||||||||||||||||||||
| Prior to this Offering | Shares Offered Pursuant to this Offering |
After this Offering | Prior to this Offering | After this Offering | ||||||||||||||||||||||||||||||||
| Beneficial Owner |
Number of Shares Beneficially Owned |
Percent of Shares Beneficially Owned |
Number of Shares Beneficially Owned |
Percent of Shares Beneficially Owned |
Number of Shares Beneficially Owned |
Percent of Shares Beneficially Owned |
Number of Shares Beneficially Owned |
Percent of Shares Beneficially Owned |
||||||||||||||||||||||||||||
| William Manning |
||||||||||||||||||||||||||||||||||||
| B. Reuben Auspitz |
||||||||||||||||||||||||||||||||||||
| Patrick Cunningham |
||||||||||||||||||||||||||||||||||||
| Jeffrey S. Coons |
||||||||||||||||||||||||||||||||||||
| Charles H. Stamey |
||||||||||||||||||||||||||||||||||||
| Beth H. Galusha |
||||||||||||||||||||||||||||||||||||
| M&N Group Holdings, LLC (2) |
||||||||||||||||||||||||||||||||||||
| All executive officers and directors as a group ( people) |
||||||||||||||||||||||||||||||||||||
| (1) | Each share of our Class A common stock is entitled to one vote per share. The holder of our Class B common stock will control a majority of the vote on all matters submitted to a vote of stockholders. |
| (2) | The beneficial ownership of the individuals, except our named executive officers, on whose behalf M&N Group Holdings is selling shares of our Class A common stock in this offering is set forth below. Such persons do not own any shares of our Class B common stock. |
| Class A common stock | |||||||||||||||||||||||||
| Prior to this Offering | Shares Offered Pursuant to this Offering |
After this Offering | |||||||||||||||||||||||
| Beneficial Owner |
Number of Shares Beneficially Owned |
Percent of Shares Beneficially Owned |
Number of Shares Beneficially Owned |
Percent of Shares Beneficially Owned | |||||||||||||||||||||
116
Table of Contents
General
The following summary describes the material terms of our capital stock. However, you should refer to the actual terms of the capital stock contained in our amended and restated certificate of incorporation, amended and restated bylaws and applicable law. We intend to amend and restate our certificate of incorporation and bylaws prior to consummation of this offering. A copy of our amended and restated certificate of incorporation and amended and restated bylaws will be filed as exhibits to the Registration Statement of which this prospectus is a part.
Our authorized capital stock consists of shares of Class A common stock, par value $0.01 per share and shares of Class B common stock, par value $0.01 per share. Upon the consummation of this offering, shares of Class A common stock and shares of Class B common stock will be outstanding. All of our issued and outstanding shares of capital stock are, and the shares of capital stock to be issued in this offering will be, validly issued, fully paid and nonassessable.
Class A Common Stock
The holders of our Class A common stock are entitled to one vote for each share held of record on all matters submitted to a vote of stockholders.
The holders of our Class A common stock are entitled to receive dividends, if declared by our board of directors, out of funds legally available therefor, subject to any statutory or contractual restrictions on the payment of dividends.
The holders of our Class A common stock do not have preemptive, subscription, redemption or conversion rights.
Pursuant to the terms of an exchange agreement between M&N Group Holdings and Manning & Napier, prior to this offering M&N Group Holdings exchanged of its Class A units of Manning & Napier Group for shares of our Class A common stock. M&N Group Holdings is selling such shares of our Class A common stock on account for William Manning and certain other persons (all of whom are our employees, including our named executive officers) in this offering. See “Our Structure and Reorganization—Offering Transactions—Exchange Agreement” and “Principal and Selling Stockholders.”
Class B Common Stock
The holder of our Class B common stock will control a majority of the vote on all matters submitted to a vote of stockholders.
The holder of our Class B common stock will not have any right to receive dividends, other than dividends consisting of shares of our Class B common stock or in rights, options, warrants or other securities convertible or exercisable into or exchangeable for shares of Class B common stock paid proportionally with respect to each outstanding share of our Class B common stock, or to receive a distribution upon the dissolution, liquidation or sale of all or substantially all of our assets.
We will cancel in whole the outstanding shares of our Class B common stock, at par value, upon the earlier to occur of: (i) the death of William Manning, the holder of our Class B common stock, (ii) the date that the aggregate direct and indirect ownership of William Manning of Class A units and Class B units of Manning & Napier Group constitutes less than 25% of the total number of Class A units and Class B units of Manning & Napier Group and (iii) the sixth anniversary of the original date of issuance of the Class B common stock.
The holder of our Class B common stock does not have preemptive, subscription or conversion rights.
117
Table of Contents
Voting
Generally, all matters to be voted on by stockholders must be approved by a majority of the votes entitled to be cast by all shares of Class A common stock and Class B common stock, voting together as a single class. However, amendments to our amended and restated certificate of incorporation, including in connection with a merger, that would alter or change the powers, preferences or special rights of the Class A common stock or Class B common stock so as to affect them adversely also must be approved by a majority of the votes entitled to be cast by the holders of the shares affected by the amendment, voting as a separate class. With certain exceptions, any amendment to our amended and restated certificate of incorporation to increase or decrease the authorized shares of any class of common stock must be approved by a majority of the votes entitled to be cast by the holders of the shares affected by the amendment, voting as a separate class.
Anti-Takeover Effects of Provisions of Delaware Law
We are subject to Section 203 of the Delaware General Corporation Law. In general, Section 203 prohibits a publicly held Delaware corporation from engaging in a business combination with an interested stockholder for a period of three years following the date the person became an interested stockholder, unless the business combination or the transaction in which the person became an interested stockholder is approved in a prescribed manner. Generally, a business combination includes a merger, asset or stock sale, or other transaction resulting in a financial benefit to the interested stockholder. An interested stockholder is a person who, together with affiliates and associates, owns or, in the case of affiliates or associates of the corporation, within three years prior to the determination of interested stockholder status, owned 15% or more of a corporation’s voting stock. The existence of this provision could have anti-takeover effects with respect to transactions not approved in advance by our board of directors, such as discouraging takeover attempts that might result in a premium over the market price of our common stock.
Stockholders will not be entitled to cumulative voting in the election of directors. The authorization of undesignated preferred stock will make it possible for our board of directors to issue preferred stock with voting or other rights or preferences that could impede the success of any attempt to effect a change of control of our company. The foregoing provisions of our amended and restated certificate of incorporation and the Delaware General Corporation Law may have the effect of deterring or discouraging hostile takeovers or delaying changes in control of our company.
Charter and Bylaws Anti-Takeover Provisions
Our amended and restated certificate of incorporation and bylaws require that any action required or permitted to be taken by our stockholders must be effected at a duly called annual or special meeting of stockholders and may not be effected by a consent in writing.
Our amended and restated bylaws establish an advance notice procedure for stockholders to bring matters before special stockholder meetings, including proposed nominations of persons for election to our board of directors. These procedures specify the information stockholders must include in their notice and the timeframe in which they must give us notice. At a special stockholder meeting, stockholders may only consider nominations or proposals specified in the notice of meeting. A special stockholder meeting for any purpose may only be called by our board of directors, our Chairman or our chief executive officer, and will be called by our chief executive officer at the request of the holders of a majority of our outstanding shares of capital stock.
The foregoing provisions of our amended and restated certificate of incorporation, our amended and restated bylaws and the Delaware General Corporation Law may have the effect of deterring or discouraging hostile takeovers or delaying changes in control of the company.
118
Table of Contents
Limitation on Liability and Indemnification of Directors and Officers
Our amended and restated certificate of incorporation and bylaws will limit our directors’ and officers’ liability to the fullest extent permitted under Delaware corporate law. Specifically, our directors and officers will not be liable to us or our stockholders for monetary damages for any breach of fiduciary duty by a director or officer, except for liability:
| • | for any breach of the director’s or officer’s duty of loyalty to us or our stockholders; |
| • | for acts or omissions not in good faith or which involve intentional misconduct or a knowing violation of law; |
| • | under Section 174 of the Delaware General Corporation Law; or |
| • | for any transaction from which a director or officer derives an improper personal benefit. |
If the Delaware General Corporation Law is amended to authorize corporate action further eliminating or limiting the personal liability of directors or officers, then the liability of a director or officer of the Company shall be eliminated or limited to the fullest extent permitted by the Delaware General Corporation Law, as so amended.
The provision regarding indemnification of our directors and officers in our amended and restated certificate of incorporation will generally not limit liability under state or federal securities laws.
Delaware law and our amended and restated certificate of incorporation and bylaws provide that we will, in certain situations, indemnify any person made or threatened to be made a party to a proceeding by reason of that person’s former or present official capacity with our company against judgments, penalties, fines, settlements and reasonable expenses including reasonable attorney’s fees. Any person is also entitled, subject to certain limitations, to payment or reimbursement of reasonable expenses in advance of the final disposition of the proceeding.
The limitation of liability and indemnification provisions in our amended and restated certificate of incorporation may discourage stockholders from bringing a lawsuit against directors for breach of their fiduciary duty. These provisions may also have the effect of reducing the likelihood of derivative litigation against directors and officers, even though such an action, if successful, might otherwise benefit us and our stockholders. In addition, your investment may be adversely affected to the extent that, in a class action or direct suit, we pay the costs of settlement and damage awards against directors and officers pursuant to these indemnification provisions.
Transfer Agent and Registrar
The transfer agent and registrar for our Class A common stock is .
Listing
We will apply to list our Class A common stock on the under the symbol “MN.”
119
Table of Contents
SHARES ELIGIBLE FOR FUTURE SALE
Prior to this offering, there has been no market for our Class A common stock. Future sales of substantial amounts of our Class A common stock in the public market, or the perception that such sales may occur, could adversely affect the prevailing market price of our Class A common stock.
Upon the consummation of this offering, we will have outstanding an aggregate of shares of our Class A common stock. Of the outstanding shares, the shares of Class A common stock sold in this offering, including any shares sold in this offering in connection with the exercise by the underwriters of their overallotment option, will be freely tradable without restriction or further registration under the Securities Act, except that any shares purchased in this offering by our “affiliates,” as that term is defined under Rule 144 of the Securities Act, may be sold only in compliance with the limitations described below. The remaining outstanding shares of Class A common stock that are not sold in this offering, or shares, will be deemed “restricted securities” as that term is defined under Rule 144. Restricted securities may be sold in the public market only if registered or if they qualify for an exemption from registration under the Securities Act, such as under Rule 144 under the Securities Act, which are summarized below.
In addition, pursuant to the terms of an exchange agreement that we will enter into with M&N Group Holdings, the direct holder of units of Manning & Napier Group, subject to certain restrictions set forth therein and as described elsewhere in this prospectus, such units will be exchangeable for an aggregate of up to shares of our Class A common stock, subject to customary adjustments. In addition, the holders of any units of Manning & Napier Group issued subsequent to this offering will also become parties to the exchange agreement and such units, pursuant to the terms of the exchange agreement, will also be exchangeable for shares of our Class A common stock.
Rule 144
In general, under Rule 144 under the Securities Act of 1933, as in effect on the date of this prospectus, a person who is not one of our affiliates at any time during the three months preceding a sale, and who has beneficially owned shares of our Class A common stock for at least six months would be entitled to sell an unlimited number of shares of our Class A common stock provided current public information about us is available and, after one year, an unlimited number of shares of our Class A common stock without restriction. Our affiliates who have beneficially owned shares of our Class A common stock for at least six months are entitled to sell within any three-month period a number of shares that does not exceed the greater of:
| • | 1% of the number of shares of our Class A common stock then outstanding, which will equal approximately shares immediately after this offering, based on the number of shares of our Class A common stock outstanding upon completion of this offering; or |
| • | the average weekly trading volume of our Class A common stock during the four calendar weeks preceding the filing of a notice on Form 144 with respect to the sale. |
Sales under Rule 144 by our affiliates are also subject to manner of sale provisions and notice requirements and to the availability of current public information about us.
Lock-up Agreements
In connection with this offering, we, our directors, our executive officers and all our stockholders, have agreed, subject to certain exceptions, with the underwriters not to dispose of or hedge any shares of our Class A common stock or securities convertible into or exchangeable for shares of Class A common stock, excluding the shares of Class A common stock offered hereby by the selling stockholder, during the period from the date of this prospectus continuing through the date 180 days after the date of this prospectus, except with the prior written consent of Merrill Lynch, Pierce, Fenner & Smith Incorporated.
120
Table of Contents
Equity Awards
Subsequent to the completion of this offering, we intend to file a registration statement under the Securities Act covering shares of our Class A common stock issuable upon exchange of units of Manning & Napier Group reserved for issuance under the 2011 Plan. Shares of our Class A common stock registered under this registration statement will be available for sale in the open market, subject to vesting restrictions with us or the contractual restrictions described under “Management—2011 Equity Compensation Plan.”
Registration Rights Agreement
In connection with this offering, we will enter into a registration rights agreement with the holders of the units of Manning & Napier Group pursuant to which the shares of our Class A common stock issued upon exchange or conversion of their units, if any, will be eligible for resale, subject to the resale timing and manner limitations described under “Our Structure and Reorganization—Offering Transactions—Registration Rights Agreement.”
121
Table of Contents
MATERIAL U.S. FEDERAL TAX CONSIDERATIONS FOR U.S. AND NON-U.S. HOLDERS OF OUR
CLASS A COMMON STOCK
The following was written to support the promotion or marketing of the transaction or matters addressed herein. The following was not intended or written to be used, and it cannot be used by any taxpayer, for the purpose of avoiding penalties that may be imposed on the taxpayer under U.S. federal tax law.
You should consult a tax adviser regarding the United States federal tax consequences of acquiring, holding and disposing of Class A common stock in your particular circumstances, as well as any tax consequences that may arise under the laws of any state, local or foreign taxing jurisdiction.
The following discussion is a summary of the material U.S. federal income tax considerations generally applicable to beneficial owners of our Class A common stock, or “Holders”, that acquire shares of our Class A common stock pursuant to this offering and that hold such shares as capital assets. This summary is based upon the Code, existing and proposed U.S. Treasury regulations, IRS rulings and pronouncements and judicial decisions now in effect, all of which are subject to differing interpretations or change, possibly on a retroactive basis. This summary does not consider specific facts and circumstances that may be relevant to a particular Holder’s tax position and does not consider any state, local or non-U.S. tax consequences of an investment in our Class A common stock. It also does not apply to Holders subject to special tax treatment under the U.S. federal income tax laws, including partnerships or other pass-through entities, banks, insurance companies, dealers in securities, persons who hold Class A common stock as part of a “straddle,” “hedge” or “conversion transaction” or other risk-reduction or integrated transaction, controlled foreign corporations, passive foreign investment companies, companies that accumulate earnings to avoid U.S. federal income tax, tax-exempt organizations, former U.S. citizens or residents (expatriates) and persons who hold or receive Class A common stock as compensation.
For purposes of this summary, the term “U.S. Holder” means a Holder of our Class A common stock that, for U.S. federal income tax purposes, is (i) an individual who is a citizen or resident of the U.S., (ii) a corporation or other entity taxable as a corporation created in or organized under the laws of the U.S., any state thereof or in the District of Columbia, (iii) an estate the income of which is subject to U.S. federal income taxation regardless of its source or (iv) a trust (x) if a court within the U.S. is able to exercise primary supervision over the administration of such trust and one or more “U.S. persons,” as defined in section 7701(a)(30) of the Code, have the authority to control all substantial decisions of such trust or (y) that has a valid election in effect under applicable U.S. Treasury regulations to be treated as a U.S. person.
If a partnership holds shares of our Class A common stock, the U.S. federal income tax treatment of a partner in that partnership generally will depend upon the status of the partner and the activities of the partnership. Partners of partnerships that hold shares of our Class A common stock should consult their tax advisors.
This summary is included herein as general information only. Accordingly, each prospective Holder is urged to consult its own tax advisor with respect to the U.S. federal, state, local and non-U.S. income and other tax consequences of holding and disposing of our Class A common stock.
U.S. Holders
The following discussion summarizes the material U.S. federal income tax consequences of the ownership and disposition of our Class A common stock applicable to U.S. Holders, subject to the limitations described above.
Dividends
Distributions of cash or property that we pay in respect of our Class A common stock will constitute dividends for U.S. federal income tax purposes to the extent paid from our current or accumulated earnings and
122
Table of Contents
profits, as determined under U.S. federal income tax principles. Dividends paid by us will be includible in gross income by a U.S. Holder upon receipt. Any such dividend may be eligible for the dividends received deduction if received by an otherwise qualifying corporate U.S. Holder that meets the holding period and other requirements for the dividends received deduction. Dividends paid by us to certain non-corporate U.S. Holders (including individuals), with respect to taxable years beginning on or before December 31, 2012, are currently eligible for U.S. federal income taxation at the rates generally applicable to long-term capital gains for individuals (currently at a maximum tax rate of 15%), provided that the U.S. Holder receiving the dividend satisfies applicable holding period and other requirements.
If the amount of a distribution exceeds our current and accumulated earnings and profits, such excess first will be treated as a tax-free return of capital to the extent of the U.S. Holder’s adjusted tax basis in our Class A common stock, and thereafter will be treated as capital gain.
Dispositions
Upon a sale, exchange or other taxable disposition of shares of our Class A common stock, a U.S. Holder generally will recognize capital gain or loss equal to the difference between the amount realized on the sale, exchange or other taxable disposition and the U.S. Holder’s adjusted tax basis in the shares of our Class A common stock. Such capital gain or loss will be long-term capital gain or loss if the U.S. Holder has held the shares of the common stock for more than one year at the time of disposition. Long-term capital gains of certain non-corporate U.S. Holders, including individuals, are currently subject to U.S. federal income taxation at a maximum rate of 15%. The deductibility of capital losses is subject to limitations under the Code.
Information Reporting and Backup Withholding Requirements
In general, dividends on shares of our Class A common stock and payments of the proceeds of a sale, exchange or other disposition of shares of our Class A common stock paid to a U.S. Holder are subject to information reporting and may be subject to backup withholding at a current maximum rate of 28% unless the U.S. Holder (i) is a corporation or other exempt recipient or (ii) provides an accurate taxpayer identification number and certifies that it is not subject to backup withholding. Backup withholding is not an additional tax. Any amounts withheld under the backup withholding rules from a payment to a U.S. Holder will be refunded or credited against the U.S. Holder’s U.S. federal income tax liability, if any, provided that the required information is furnished to the IRS.
Non-U.S. Holders
This section summarizes the material U.S. federal income and estate tax consequences of the ownership and disposition of our Class A common stock by Non-U.S. Holders. It applies only if a Non-U.S. Holder acquires shares of our Class A common stock in this offering and only to those shares of our Class A common stock held as a capital asset for U.S. federal income tax purposes. A Non-U.S. Holder is a Holder who is not a U.S. Holder.
Dividends
Except as described below, if you are a Non-U.S. Holder of Class A common stock, dividends paid to you are subject to withholding of U.S. federal income tax at a 30% rate, or at a lower rate if you are eligible for the benefits of an income tax treaty that provides for a lower rate. Even if you are eligible for a lower treaty rate, we will generally be required to withhold at a 30% rate (rather than the lower treaty rate) on dividend payments to you, unless you have furnished to us a valid IRS Form W-8BEN or an acceptable substitute form upon which you certify, under penalties of perjury, your status as a non-U.S. person and your entitlement to the lower treaty rate with respect to such payments, or in the case of payments made outside the U.S. to an offshore account
123
Table of Contents
(generally, an account maintained by you at an office or branch of a bank or other financial institution at any location outside the U.S.), other documentary evidence establishing your entitlement to the lower treaty rate in accordance with U.S. Treasury regulations.
If you are eligible for a reduced rate of U.S. withholding tax under a tax treaty, you may obtain a refund of any amounts withheld in excess of that rate by filing a refund claim with the IRS.
If dividends paid to you are “effectively connected” with your conduct of a trade or business within the U.S., and, if required by a tax treaty, the dividends are attributable to a permanent establishment that you maintain in the U.S., we generally are not required to withhold tax from the dividends, provided that you have furnished to us a valid IRS Form W-8ECI or an acceptable substitute form upon which you represent, under penalties of perjury, that you are a non-U.S. person, and the dividends are effectively connected with your conduct of a trade or business within the U.S. and are includible in your gross income.
“Effectively connected” dividends are subject to U.S. federal income tax on a net income basis at rates applicable to U.S. citizens, resident aliens and U.S. corporations.
If you are a corporate Non-U.S. Holder, “effectively connected” dividends that you receive may, under certain circumstances, be subject to an additional “branch profits tax” at a 30% rate, or at a lower rate if you are eligible for the benefits of an income tax treaty that provides for a lower rate.
Gain on Disposition of Common Stock
If you are a Non-U.S. Holder, you generally will not be subject to U.S. federal income tax on gain that you recognize on a disposition of Class A common stock unless (i) the gain is “effectively connected” with your conduct of a trade or business in the U.S. and, if required by an applicable income tax treaty as a condition for subjecting you to U.S. taxation on a net income basis, the gain is attributable to a permanent establishment that you maintain in the U.S., (ii) you are an individual who holds the Class A common stock as a capital asset and you are present in the U.S. for 183 or more days in the taxable year of the sale and certain other conditions exist, or (iii) we are or have been a U.S. real property holding corporation for federal income tax purposes and you held, directly or indirectly, at any time during the five-year period ending on the date of disposition, more than 5% of the Class A common stock and you are not eligible for any treaty exemption.
If you are a Non-U.S. Holder described in (i), above, you will be subject to U.S. federal income tax on a net income basis on the gain derived from the disposition at rates applicable to U.S. citizens, resident aliens and U.S. corporations. If you are a corporate Non-U.S. Holder described in (i), above, you may also, under certain circumstances, be subject to an additional “branch profits tax” at a 30% rate, or at a lower rate if you are eligible for the benefits of an income tax treaty that provides for a lower rate. If you are an individual Non-U.S. Holder described in (ii), above, you may be subject to a flat 30% tax, or a lower rate if you are eligible for the benefits of an income tax treaty that provides for a lower rate, on the gain derived from the sale, which may be offset by U.S. source capital losses, even though you are not considered a resident of the U.S.
We have not been, are not and do not anticipate becoming a U.S. real property holding corporation for U.S. federal income tax purposes.
Federal Estate Taxes
Class A common stock held by a Non-U.S. Holder at the time of death will be included in the holder’s gross estate for U.S. federal estate tax purposes, unless an applicable estate tax treaty provides otherwise.
124
Table of Contents
Backup Withholding and Information Reporting
In general, except as described below, backup withholding and information reporting will not apply to a distribution of dividends on the Class A common stock or to proceeds from the disposition of the Class A common stock, in each case, if a Non-U.S. Holder certifies under penalties of perjury that they are a non-U.S. person, and neither we nor our paying agent or other payor have actual knowledge or reason to know to the contrary. In general, if the Class A common stock is not held through a qualified intermediary, the amount of dividends, the name and address of the beneficial owner and the amount, if any, of tax withheld may be reported to the U.S. IRS.
Any amounts withheld under the backup withholding rules will generally be allowed as a credit against your U.S. federal income tax liability or refunded, provided the required information is timely furnished to the U.S. IRS.
Recently Enacted Legislation
Under recently enacted legislation, a 30% withholding tax would be imposed on certain payments that are made after December 31, 2012 to certain foreign financial institutions, investment funds and other non-U.S. persons that fail to comply with information reporting requirements in respect of their direct and indirect U.S. owners and/or U.S. accountholders. Such payments would include U.S.-source dividends and the gross proceeds from the sale or other disposition of stock that can produce U.S.-source dividends.
125
Table of Contents
Merrill Lynch, Pierce, Fenner & Smith Incorporated is acting as the representative of each of the underwriters named below. Subject to the terms and conditions set forth in an underwriting agreement among us, the selling stockholder and the underwriters, we and the selling stockholder have agreed to sell to the underwriters, and each of the underwriters has agreed, severally and not jointly, to purchase from us and the selling stockholder, the number of shares of Class A common stock set forth opposite its name below.
| Underwriter | Number of Shares |
|||||
| Merrill Lynch, Pierce, Fenner & Smith Incorporated |
||||||
|
Total |
||||||
Subject to the terms and conditions set forth in the underwriting agreement, the underwriters have agreed, severally and not jointly, to purchase all of the shares sold under the underwriting agreement if any of these shares are purchased. If an underwriter defaults, the underwriting agreement provides that the purchase commitments of the nondefaulting underwriters may be increased or the underwriting agreement may be terminated.
We and the selling stockholder have agreed to indemnify the underwriters against certain liabilities, including liabilities under the Securities Act, or to contribute to payments the underwriters may be required to make in respect of those liabilities.
The underwriters are offering the shares, subject to prior sale, when, as and if issued to and accepted by them, subject to approval of legal matters by their counsel, including the validity of the shares, and other conditions contained in the underwriting agreement, such as the receipt by the underwriters of officer’s certificates and legal opinions. The underwriters reserve the right to withdraw, cancel or modify offers to the public and to reject orders in whole or in part.
Commissions and Discounts
The representative has advised us and the selling stockholder that the underwriters propose initially to offer the shares to the public at the public offering price set forth on the cover page of this prospectus and to dealers at that price less a concession not in excess of $ per share. After the initial offering, the public offering price, concession or any other term of the offering may be changed.
The following table shows the public offering price, underwriting discount and proceeds before expenses to us and the selling stockholder. The information assumes either no exercise or full exercise by the underwriters of their overallotment option.
| Per Share |
Without Option |
With Option | ||||
| Public offering price |
$ | $ | $ | |||
| Underwriting discount |
$ | $ | $ | |||
| Proceeds, before expenses, to Manning & Napier, Inc. |
$ | $ | $ | |||
| Proceeds, before expenses, to the selling stockholder |
$ | $ | $ |
The expenses of the offering, not including the underwriting discount, are estimated at $ and are payable by us.
126
Table of Contents
Overallotment Option
We have granted an option to the underwriters, exercisable for 30 days after the date of this prospectus, to purchase up to additional shares at the public offering price, less the underwriting discount. The underwriters may exercise this option solely to cover any overallotments. If the underwriters exercise this option, each will be obligated, subject to conditions contained in the underwriting agreement, to purchase a number of additional shares proportionate to that underwriter’s initial amount reflected in the above table.
No Sales of Similar Securities
We and the selling stockholder, our executive officers and directors and our other existing security holders have agreed, subject to certain exceptions, not to sell or transfer any Class A common stock or securities convertible into, exchangeable for, exercisable for, or repayable with Class A common stock, for 180 days after the date of this prospectus without first obtaining the written consent of Merrill Lynch, Pierce, Fenner & Smith Incorporated. Specifically, we and these other persons have agreed, with certain limited exceptions, not to directly or indirectly:
| • | offer, pledge, sell or contract to sell any Class A common stock; |
| • | sell any option or contract to purchase any Class A common stock; |
| • | purchase any option or contract to sell any Class A common stock; |
| • | grant any option, right or warrant for the sale of any Class A common stock; |
| • | lend or otherwise dispose of or transfer any Class A common stock; |
| • | request or demand that we file a registration statement related to the Class A common stock; or |
| • | enter into any swap or other agreement that transfers, in whole or in part, the economic consequence of ownership of any Class A common stock whether any such swap or transaction is to be settled by delivery of shares or other securities, in cash or otherwise. |
This lock-up provision applies to Class A common stock and to securities convertible into or exchangeable or exercisable for or repayable with Class A common stock, and excludes Class A common stock offered hereby by the selling stockholder. It also applies to Class A common stock owned now or acquired later by the person executing the agreement or for which the person executing the agreement later acquires the power of disposition. In the event that either (x) during the last 17 days of the lock-up period referred to above, we issue an earnings release or material news or a material event relating to us occurs or (y) prior to the expiration of the lock-up period, we announce that we will release earnings results or become aware that material news or a material event will occur during the 16-day period beginning on the last day of the lock-up period, the restrictions described above shall continue to apply until the expiration of the 18-day period beginning on the issuance of the earnings release or the occurrence of the material news or material event.
127
Table of Contents
Listing
We expect the shares of our Class A common stock to be approved for listing on the under the symbol “MN.”
Before this offering, there has been no public market for our Class A common stock. The initial public offering price will be determined through negotiations among us, the selling stockholder and the representative. In addition to prevailing market conditions, the factors to be considered in determining the initial public offering price are:
| • | the valuation multiples of publicly traded companies that the representative believes to be comparable to us; |
| • | our financial information; |
| • | the history of, and the prospects for, our company and the industry in which we compete; |
| • | an assessment of our management, its past and present operations, and the prospects for, and timing of, our future revenues; |
| • | the present state of our development; and |
| • | the above factors in relation to market values and various valuation measures of other companies engaged in activities similar to ours. |
An active trading market for the shares may not develop. It is also possible that after the offering the shares will not trade in the public market at or above the initial public offering price.
The underwriters do not expect to sell more than 5% of the shares in the aggregate to accounts over which they exercise discretionary authority.
Price Stabilization, Short Positions and Penalty Bids
Until the distribution of the shares is completed, SEC rules may limit underwriters and selling group members from bidding for and purchasing our Class A common stock. However, the representative may engage in transactions that stabilize the price of the Class A common stock, such as bids or purchases to peg, fix or maintain that price.
In connection with the offering, the underwriters may purchase and sell our Class A common stock in the open market. These transactions may include short sales, purchases on the open market to cover positions created by short sales and stabilizing transactions. Short sales involve the sale by the underwriters of a greater number of shares than they are required to purchase in the offering. “Covered” short sales are sales made in an amount not greater than the underwriters’ overallotment option described above. The underwriters may close out any covered short position by either exercising their overallotment option or purchasing shares in the open market. In determining the source of shares to close out the covered short position, the underwriters will consider, among other things, the price of shares available for purchase in the open market as compared to the price at which they may purchase shares through the overallotment option. “Naked” short sales are sales in excess of the overallotment option. The underwriters must close out any naked short position by purchasing shares in the open market. A naked short position is more likely to be created if the underwriters are concerned that there may be downward pressure on the price of our Class A common stock in the open market after pricing that could adversely affect investors who purchase in the offering. Stabilizing transactions consist of various bids for or purchases of shares of Class A common stock made by the underwriters in the open market prior to the completion of the offering.
128
Table of Contents
The underwriters may also impose a penalty bid. This occurs when a particular underwriter repays to the underwriters a portion of the underwriting discount received by it because the representative has repurchased shares sold by or for the account of such underwriter in stabilizing or short covering transactions.
Similar to other purchase transactions, the underwriters’ purchases to cover the syndicate short sales may have the effect of raising or maintaining the market price of our Class A common stock or preventing or retarding a decline in the market price of our Class A common stock. As a result, the price of our Class A common stock may be higher than the price that might otherwise exist in the open market. The underwriters may conduct these transactions on the , in the over-the-counter market or otherwise.
Neither we nor any of the underwriters make any representation or prediction as to the direction or magnitude of any effect that the transactions described above may have on the price of our Class A common stock. In addition, neither we nor any of the underwriters make any representation that the representative will engage in these transactions or that these transactions, once commenced, will not be discontinued without notice.
Electronic Offer, Sale and Distribution of Shares
In connection with the offering, certain of the underwriters or securities dealers may distribute prospectuses by electronic means, such as e-mail. In addition, Merrill Lynch, Pierce, Fenner & Smith Incorporated may facilitate Internet distribution for this offering to certain of its Internet subscription customers. Merrill Lynch, Pierce, Fenner & Smith Incorporated may allocate a limited number of shares for sale to its online brokerage customers. An electronic prospectus is available on the Internet web site maintained by Merrill Lynch, Pierce, Fenner & Smith Incorporated. Other than the prospectus in electronic format, the information on the Merrill Lynch, Pierce, Fenner & Smith Incorporated web site is not part of this prospectus.
Other Relationships
Some of the underwriters and their affiliates have engaged in, and may in the future engage in, investment banking and other commercial dealings in the ordinary course of business with us or our affiliates. They have received, or may in the future receive, customary fees and commissions for these transactions.
In addition, in the ordinary course of their business activities, the underwriters and their affiliates may make or hold a broad array of investments and actively trade debt and equity securities (or related derivative securities) and financial instruments (including bank loans) for their own account and for the accounts of their customers. Such investments and securities activities may involve securities and/or instruments of ours or our affiliates. The underwriters and their affiliates may also make investment recommendations and/or publish or express independent research views in respect of such securities or financial instruments and may hold, or recommend to clients that they acquire, long and/or short positions in such securities and instruments.
Notice to Prospective Investors in the European Economic Area
In relation to each Member State of the European Economic Area which has implemented the Prospectus Directive (each, a “Relevant Member State”), with effect from and including the date on which the Prospectus Directive is implemented in that Relevant Member State, or the Relevant Implementation Date, no offer of shares may be made to the public in that Relevant Member State other than:
| • | to any legal entity which is a qualified investor as defined in the Prospectus Directive; |
| • | to fewer than 100 or, if the Relevant Member State has implemented the relevant provision of the 2010 PD Amending Directive, 150, natural or legal persons (other than qualified investors as defined in the Prospectus Directive), as permitted under the Prospectus Directive, subject to obtaining the prior consent of the representative; or |
129
Table of Contents
| • | in any other circumstances falling within Article 3(2) of the Prospectus Directive, |
provided that no such offer of shares shall require the Company or the representative to publish a prospectus pursuant to Article 3 of the Prospectus Directive or supplement a prospectus pursuant to Article 16 of the Prospectus Directive.
Each person in a Relevant Member State (other than a Relevant Member State where there is a Permitted Public Offer) who initially acquires any shares or to whom any offer is made will be deemed to have represented, acknowledged and agreed that (A) it is a “qualified investor” within the meaning of the law in that Relevant Member State implementing Article 2(1)(e) of the Prospectus Directive, and (B) in the case of any shares acquired by it as a financial intermediary, as that term is used in Article 3(2) of the Prospectus Directive, the shares acquired by it in the offering have not been acquired on behalf of, nor have they been acquired with a view to their offer or resale to, persons in any Relevant Member State other than “qualified investors” as defined in the Prospectus Directive, or in circumstances in which the prior consent of the Subscribers has been given to the offer or resale. In the case of any shares being offered to a financial intermediary as that term is used in Article 3(2) of the Prospectus Directive, each such financial intermediary will be deemed to have represented, acknowledged and agreed that the shares acquired by it in the offer have not been acquired on a non-discretionary basis on behalf of, nor have they been acquired with a view to their offer or resale to, persons in circumstances which may give rise to an offer of any shares to the public other than their offer or resale in a Relevant Member State to qualified investors as so defined or in circumstances in which the prior consent of the representative has been obtained to each such proposed offer or resale.
The Company, the representative and its affiliates will rely upon the truth and accuracy of the foregoing representation, acknowledgement and agreement.
This prospectus has been prepared on the basis that any offer of shares in any Relevant Member State will be made pursuant to an exemption under the Prospectus Directive from the requirement to publish a prospectus for offers of shares. Accordingly any person making or intending to make an offer in that Relevant Member State of shares which are the subject of the offering contemplated in this prospectus may only do so in circumstances in which no obligation arises for the Company or any of the underwriters to publish a prospectus pursuant to Article 3 of the Prospectus Directive in relation to such offer. Neither the Company nor the underwriters have authorized, nor do they authorize, the making of any offer of shares in circumstances in which an obligation arises for the Company or the underwriters to publish a prospectus for such offer.
For the purpose of the above provisions, the expression “an offer to the public” in relation to any shares in any Relevant Member State means the communication in any form and by any means of sufficient information on the terms of the offer and the shares to be offered so as to enable an investor to decide to purchase or subscribe the shares, as the same may be varied in the Relevant Member State by any measure implementing the Prospectus Directive in the Relevant Member State and the expression “Prospectus Directive” means Directive 2003/71/EC (including the 2010 PD Amending Directive, to the extent implemented in the Relevant Member States) and includes any relevant implementing measure in the Relevant Member State and the expression “2010 PD Amending Directive” means Directive 2010/73/EU.
Notice to Prospective Investors in the United Kingdom
In addition, in the United Kingdom, this document is being distributed only to, and is directed only at, and any offer subsequently made may only be directed at persons who are “qualified investors” (as defined in the Prospectus Directive) (i) who have professional experience in matters relating to investments falling within Article 19 (5) of the Financial Services and Markets Act 2000 (Financial Promotion) Order 2005, as amended (the “Order”) and/or (ii) who are high net worth companies (or persons to whom it may otherwise be lawfully communicated) falling within Article 49(2)(a) to (d) of the Order (all such persons together being referred to as
130
Table of Contents
“relevant persons”). This document must not be acted on or relied on in the United Kingdom by persons who are not relevant persons. In the United Kingdom, any investment or investment activity to which this document relates is only available to, and will be engaged in with, relevant persons.
Notice to Prospective Investors in Switzerland
The shares may not be publicly offered in Switzerland and will not be listed on the SIX Swiss Exchange, or SIX, or on any other stock exchange or regulated trading facility in Switzerland. This document has been prepared without regard to the disclosure standards for issuance prospectuses under art. 652a or art. 1156 of the Swiss Code of Obligations or the disclosure standards for listing prospectuses under art. 27 ff. of the SIX Listing Rules or the listing rules of any other stock exchange or regulated trading facility in Switzerland. Neither this document nor any other offering or marketing material relating to the shares or the offering may be publicly distributed or otherwise made publicly available in Switzerland.
Neither this document nor any other offering or marketing material relating to the offering, the Company, the shares have been or will be filed with or approved by any Swiss regulatory authority. In particular, this document will not be filed with, and the offer of shares will not be supervised by, the Swiss Financial Market Supervisory Authority FINMA (FINMA), and the offer of shares has not been and will not be authorized under the Swiss Federal Act on Collective Investment Schemes, or CISA. The investor protection afforded to acquirers of interests in collective investment schemes under the CISA does not extend to acquirers of shares.
Notice to Prospective Investors in the Dubai International Financial Centre
This prospectus relates to an Exempt Offer in accordance with the Offered Securities Rules of the Dubai Financial Services Authority, or DFSA. This prospectus is intended for distribution only to persons of a type specified in the Offered Securities Rules of the DFSA. It must not be delivered to, or relied on by, any other person. The DFSA has no responsibility for reviewing or verifying any documents in connection with Exempt Offers. The DFSA has not approved this prospectus nor taken steps to verify the information set forth herein and has no responsibility for the prospectus. The shares to which this prospectus relates may be illiquid and/or subject to restrictions on their resale. Prospective purchasers of the shares offered should conduct their own due diligence on the shares. If you do not understand the contents of this prospectus you should consult an authorized financial advisor.
131
Table of Contents
The validity of the Class A common stock offered hereby will be passed upon for us and the selling stockholder by Herrick, Feinstein LLP, New York, New York. Certain legal matters with respect to this offering will be passed upon for the underwriters by Cleary Gottlieb Steen & Hamilton LLP, New York, New York.
The (i) financial statements of Manning & Napier Companies as of December 31, 2009 and 2010 and for each of the three years in the period ended December 31, 2010 and (ii) Statement of Financial Condition of Manning & Napier, Inc. included in this prospectus, have been so included in reliance on the reports of PricewaterhouseCoopers LLP, an independent registered public accounting firm, given on the authority of said firm as experts in auditing and accounting.
WHERE YOU CAN FIND ADDITIONAL INFORMATION
We have filed with the SEC under the Securities Act, a registration statement on Form S-1 relating to the Class A common stock to be sold in this offering. The registration statement, including the attached exhibits and schedules, contains additional relevant information about us and our capital stock. This prospectus does not contain all of the information set forth in the registration statement and the exhibits and schedules thereto. For further information about us and our Class A common stock, you should refer to the registration statement, including the exhibits and schedules thereto. Statements contained in this prospectus as to the contents of any contract or other document referred to are not necessarily complete and in each instance, if such contract or document is filed as an exhibit, reference is made to the copy of such contract or other document filed as an exhibit to the registration statement, each statement being qualified in all respects by such reference. You may inspect a copy of the registration statement and the exhibits and schedules thereto without charge at the Public Reference Room of the SEC at 100 F Street, N.E., Washington, D.C. 20549. You may obtain copies of all or any part of the registration statement from such office at prescribed rates. You may also obtain information on the operation of the Public Reference Room by calling the SEC at 1-800-SEC-0330. In addition, the SEC maintains an Internet website, which is located at http://www.sec.gov, that contains reports, proxy and information statements and other information regarding issuers that file electronically with the SEC. You may access the registration statement, of which this prospectus is a part, at the SEC’s Internet website.
As a result of this offering, we will be subject to the information and periodic reporting requirements of the Exchange Act applicable to a company with securities registered pursuant to Section 12 of the Exchange Act. In accordance therewith, we will file periodic reports, proxy statements and other information with the SEC. All documents filed with the SEC are available for inspection and copying at the public reference room and website of the SEC referred to above. Our operating company maintains a website at www.manning-napier.com. You may access our reports, proxy statements and other information free of charge at this website as soon as reasonably practicable after such material is electronically filed with, or furnished to, the SEC. The information on such website is not incorporated by reference and is not a part of this prospectus or the registration statement of which it forms a part.
132
Table of Contents
INDEX TO COMBINED CONSOLIDATED FINANCIAL STATEMENTS
| Manning & Napier, Inc. |
||||
| F-2 | ||||
| F-3 | ||||
| Notes to Statement of Financial Condition—As of June 28, 2011 |
F-4 | |||
| Manning & Napier Companies |
||||
| F-5 | ||||
| Combined Consolidated Statements of Financial Condition—As of December 31, 2009 and 2010 |
F-6 | |||
| Combined Consolidated Statements of Income—Years Ended December 31, 2008, 2009 and 2010 |
F-7 | |||
| F-8 | ||||
| Combined Consolidated Statements of Cash Flows—Years Ended December 31, 2008, 2009 and 2010 |
F-9 | |||
| F-10 | ||||
| F-22 | ||||
| F-23 | ||||
| F-24 | ||||
| F-25 | ||||
| Notes to Unaudited Combined Consolidated Financial Statements |
F-26 | |||
F-1
Table of Contents

Report of Independent Registered Public Accounting Firm
To the Board of Directors and Shareholders of Manning & Napier, Inc.:
In our opinion, the accompanying statement of financial condition presents fairly, in all material respects, the financial position of Manning & Napier, Inc. (the “Company”) at June 28, 2011 in conformity with accounting principles generally accepted in the United States of America. This financial statement is the responsibility of the Company’s management; our responsibility is to express an opinion on this financial statement based on our audit. We conducted our audit of this statement in accordance with the standards of the Public Company Accounting Oversight Board (United States). Those standards require that we plan and perform the audit to obtain reasonable assurance about whether the statement of financial condition is free of material misstatement. An audit includes examining, on a test basis, evidence supporting the amounts and disclosures in the statement of financial condition, assessing the accounting principles used and significant estimates made by management, and evaluating the overall financial statement presentation. We believe that our audit provides a reasonable basis for our opinion.
/s/ PRICEWATERHOUSECOOPERS LLP
Rochester, New York
June 30, 2011
F-2
Table of Contents
Manning & Napier, Inc.
Statement of Financial Condition
As of June 28, 2011
| At June 28, 2011 | ||||
| Assets |
||||
| Cash and cash equivalents |
$ | 100 | ||
| Total assets |
$ | 100 | ||
| Shareholders’ equity |
||||
| Common stock, $0.01 par value —1,000 shares authorized, 100 shares issued and outstanding |
$ | 1 | ||
| Additional paid in capital |
99 | |||
| Total shareholders’ equity |
$ | 100 | ||
The accompanying notes are an integral part of these financial statements.
F-3
Table of Contents
As of June 28, 2011
Note 1—Organization and Nature of the Business
Manning & Napier, Inc. (“the Company”) was formed in June 2011 in anticipation of completing an initial public offering. Upon completion of a reorganization anticipated to occur prior to consummation of that offering, the Company will serve as managing member of Manning & Napier Group, LLC, a holding company for the investment management businesses conducted by its operating subsidiaries. The Company is an independent investment management firm that provides a broad range of investment solutions through separately managed accounts, mutual funds and collective investment trust funds.
As managing member, the Company will operate and control all of the business and affairs of Manning & Napier Group, LLC and its subsidiaries and, as a result of this control, will consolidate the financial results of Manning & Napier Group, LLC with its own financial results.
Note 2—Summary of Significant Accounting Policies
Basis of Presentation
The accompanying statement of financial condition is prepared in accordance with accounting principles generally accepted in the United States of America (“U.S. GAAP”). The preparation of financial statements in conformity with U.S. GAAP requires management to make estimates or assumptions that affect the reported amounts and disclosures in the financial statements. Actual future results could differ from these estimates and assumptions
Cash
Cash consists of cash on deposit with a financial institution. At June 28, 2011 no funds were restricted.
Note 3—Subsequent Events
The Company evaluated subsequent events through the issuance date of its financial statements and determined that no subsequent events had occurred that would require additional disclosures.
F-4
Table of Contents
Report of Independent Registered Public Accounting Firm
To the Boards of Directors and Shareholders/Partners of Manning & Napier Companies:
In our opinion, the accompanying combined consolidated statements of financial condition and the related combined consolidated statements of income, of shareholders’ deficit and partners’ capital, and of cash flows present fairly, in all material respects, the financial condition of Manning & Napier Companies (the “Company”) at December 31, 2009 and 2010, and the combined consolidated results of their operations and their cash flows for each of the three years in the period ended December 31, 2010 in conformity with accounting principles generally accepted in the United States of America. These financial statements are the responsibility of the Company’s management. Our responsibility is to express an opinion on these financial statements based on our audits. We conducted our audits of these statements in accordance with the standards of the Public Company Accounting Oversight Board (United States). Those standards require that we plan and perform the audit to obtain reasonable assurance about whether the financial statements are free of material misstatement. An audit includes examining, on a test basis, evidence supporting the amounts and disclosures in the financial statements, assessing the accounting principles used and significant estimates made by management, and evaluating the overall financial statement presentation. We believe that our audits provide a reasonable basis for our opinion.
/s/ PRICEWATERHOUSECOOPERS LLP
Rochester, New York
June 30, 2011
F-5
Table of Contents
Manning & Napier Companies
Combined Consolidated Statements of Financial Condition
As of December 31, 2009 and 2010
| (dollars in thousands) | 2009 | 2010 | ||||||
| Assets |
||||||||
| Cash and cash equivalents |
$ | 24,802 | $ | 27,543 | ||||
| Accounts receivable |
12,397 | 18,851 | ||||||
| Accounts receivable—Manning & Napier Fund, Inc. |
8,977 | 11,948 | ||||||
| Marketable securities, at fair value |
2,720 | 4,381 | ||||||
| Property and equipment, net |
3,034 | 3,111 | ||||||
| Prepaid expenses and other assets |
1,438 | 2,508 | ||||||
| Total assets |
$ | 53,368 | $ | 68,342 | ||||
| Liabilities |
||||||||
| Accounts payable |
$ | 639 | $ | 1,153 | ||||
| Accrued expenses and other liabilities |
17,434 | 30,464 | ||||||
| Deferred revenue |
9,228 | 9,974 | ||||||
| Stock purchase note payable |
273 | 201 | ||||||
| Shares liability subject to mandatory redemption |
109,076 | 170,319 | ||||||
| Total liabilities |
136,650 | 212,111 | ||||||
| Commitments and contingencies |
||||||||
| Shareholders’ deficit and partners’ capital |
||||||||
| Common stock, $.01 par value—authorized, 10,000,000 shares with 2,482,425 and 2,533,110 shares outstanding and 5,224,050 shares outstanding subject to mandatory redemption, as of December 31, 2009 and December 31, 2010, respectively for the S-Corporations |
$ | 100 | $ | 101 | ||||
| Additional paid in capital |
1,626 | 1,628 | ||||||
| Treasury stock, at cost: 9,263 and 0 shares, as of December 31, 2009 and December 31, 2010, respectively |
(102 | ) | — | |||||
| Retained earnings (deficit) |
(85,888 | ) | (147,035 | ) | ||||
| Accumulated other comprehensive (loss) income |
(110 | ) | 193 | |||||
| Partners’ equity |
1,028 | 1,307 | ||||||
| Total shareholders’ deficit and partners’ capital attributable to Manning & Napier Companies |
(83,346 | ) | (143,806 | ) | ||||
| Non-controlling interest |
64 | 37 | ||||||
| Total shareholders’ deficit and partners’ capital |
(83,282 | ) | (143,769 | ) | ||||
| Total liabilities and shareholders’ deficit and partners’ capital |
$ | 53,368 | $ | 68,342 | ||||
The accompanying notes are an integral part of these combined consolidated financial statements.
F-6
Table of Contents
Manning & Napier Companies
Combined Consolidated Statements of Income
Years Ended December 31, 2008, 2009 and 2010
| (dollars in thousands) | 2008 | 2009 | 2010 | |||||||||
| Revenues |
||||||||||||
| Investment management services revenue |
$ | 145,622 | $ | 162,660 | $ | 255,472 | ||||||
| Expenses |
||||||||||||
| Compensation and related costs |
46,295 | 55,643 | 78,416 | |||||||||
| Sub-transfer agent and shareholder service costs |
13,114 | 19,853 | 36,830 | |||||||||
| Other operating costs |
20,690 | 22,252 | 25,284 | |||||||||
| Total operating expenses |
80,099 | 97,748 | 140,530 | |||||||||
| Operating income |
65,523 | 64,912 | 114,942 | |||||||||
| Non-operating income (loss) |
||||||||||||
| Interest expense on shares subject to mandatory redemption |
(6,707 | ) | (9,991 | ) | (61,243 | ) | ||||||
| Interest expense |
(174 | ) | (125 | ) | (16 | ) | ||||||
| Interest and dividend income |
602 | 140 | 126 | |||||||||
| Net capital gains (losses) on investments |
122 | (151 | ) | 1 | ||||||||
| Total non-operating loss |
(6,157 | ) | (10,127 | ) | (61,132 | ) | ||||||
| Income before provision for income taxes |
59,366 | 54,785 | 53,810 | |||||||||
| Provision for income taxes |
374 | 360 | 712 | |||||||||
| Net income |
$ | 58,992 | $ | 54,425 | $ | 53,098 | ||||||
| Pro forma consolidated income statement information—after reorganization and initial offering (unaudited) |
||||||||||||
| Income before tax |
$ | 53,810 | ||||||||||
| Pro forma provision for income taxes (40% assumed tax rate)(Note 1) |
21,524 | |||||||||||
| Pro forma net income |
$ | 32,286 | ||||||||||
The accompanying notes are an integral part of these combined consolidated financial statements.
F-7
Table of Contents
Manning & Napier Companies
Combined Consolidated Statements of Shareholders’ Deficit and Partners’ Capital
Years Ended December 31, 2008, 2009 and 2010
| (dollars in thousands) |
Common Stock |
Additional Paid-In Capital |
Treasury Stock |
Retained Earnings |
Accumulated Other Comprehensive Income (Loss) |
Partners’ Equity (Deficit) |
Total | |||||||||||||||||||||||||||||
| Shares | Amount | Shares | Amount | |||||||||||||||||||||||||||||||||
| Balance—January 1, 2008 |
2,454,428 | $ | 98 | $ | 1,617 | 123,755 | $ | (1,793 | ) | $ | (71,696 | ) | $ | (2 | ) | $ | 755 | $ | (71,021 | ) | ||||||||||||||||
| Net income |
62,991 | (3,999 | ) | 58,992 | ||||||||||||||||||||||||||||||||
| S-Corporation distributions |
(71,467 | ) | (71,467 | ) | ||||||||||||||||||||||||||||||||
| Net change in unrealized marketable securities gains or losses |
(889 | ) | (889 | ) | ||||||||||||||||||||||||||||||||
| Common stock and treasury stock transactions |
5 | (103,315 | ) | 1,073 | (836 | ) | 242 | |||||||||||||||||||||||||||||
| Equity-based compensation |
446 | 446 | ||||||||||||||||||||||||||||||||||
| Partner contributions |
4,017 | 4,017 | ||||||||||||||||||||||||||||||||||
| Balance—December 31, 2008 |
2,454,428 | $ | 98 | $ | 1,622 | 20,440 | $ | (274 | ) | $ | (81,008 | ) | $ | (891 | ) | $ | 773 | $ | (79,680 | ) | ||||||||||||||||
| Net income |
58,819 | (4,394 | ) | 54,425 | ||||||||||||||||||||||||||||||||
| S-Corporation distributions |
(64,019 | ) | (64,019 | ) | ||||||||||||||||||||||||||||||||
| Net change in unrealized marketable securities gains or losses |
781 | 781 | ||||||||||||||||||||||||||||||||||
| Common stock and treasury stock transactions |
37,260 | 2 | 4 | (27,850 | ) | 16 | 22 | |||||||||||||||||||||||||||||
| Equity-based compensation |
411 | 320 | 731 | |||||||||||||||||||||||||||||||||
| Partner contributions |
4,649 | 4,649 | ||||||||||||||||||||||||||||||||||
| Treasury stock purchase |
16,673 | (255 | ) | (255 | ) | |||||||||||||||||||||||||||||||
| Balance—December 31, 2009 |
2,491,688 | $ | 100 | $ | 1,626 | 9,263 | $ | (102 | ) | $ | (85,888 | ) | $ | (110 | ) | $ | 1,028 | $ | (83,346 | ) | ||||||||||||||||
| Net income |
57,957 | (4,859 | ) | 53,098 | ||||||||||||||||||||||||||||||||
| S-Corporation distributions |
(119,619 | ) | (119,619 | ) | ||||||||||||||||||||||||||||||||
| Net change in unrealized marketable securities gains or losses |
303 | 303 | ||||||||||||||||||||||||||||||||||
| Common stock and treasury stock transactions |
41,422 | 1 | 2 | (9,263 | ) | 5 | (70 | ) | (3 | ) | (65 | ) | ||||||||||||||||||||||||
| Equity-based compensation |
97 | 585 | 682 | |||||||||||||||||||||||||||||||||
| Partner contributions |
5,141 | 5,141 | ||||||||||||||||||||||||||||||||||
| Balance—December 31, 2010 |
2,533,110 | $ | 101 | $ | 1,628 | — | $ | — | $ | (147,035 | ) | $ | 193 | $ | 1,307 | $ | (143,806 | ) | ||||||||||||||||||
The accompanying notes are an integral part of these combined consolidated financial statements.
F-8
Table of Contents
Manning & Napier Companies
Combined Consolidated Statements of Cash Flows
Years Ended December 31, 2008, 2009 and 2010
| (dollars in thousands) | 2008 | 2009 | 2010 | |||||||||
| Cash flows from operating activities: |
||||||||||||
| Net income |
$ | 58,992 | $ | 54,425 | $ | 53,098 | ||||||
| Adjustments to reconcile net income to net cash provided by operating activities: |
||||||||||||
| Interest cost related to change in mandatory redemption liability |
6,707 | 9,991 | 61,243 | |||||||||
| Equity-based compensation |
446 | 731 | 682 | |||||||||
| Depreciation |
1,068 | 1,099 | 1,422 | |||||||||
| Gain (loss) on disposal of property and equipment |
(1 | ) | — | — | ||||||||
| Realized (gain) loss on sale of investments |
(122 | ) | 151 | (1 | ) | |||||||
| Accrued interest on debt securities |
21 | (1 | ) | — | ||||||||
| (Increase) decrease in operating assets and increase (decrease) in operating liabilities |
||||||||||||
| Accounts receivable |
995 | (4,786 | ) | (6,454 | ) | |||||||
| Accounts receivable—Manning & Napier Fund, Inc. |
292 | (5,125 | ) | (2,971 | ) | |||||||
| Prepaid and other assets |
(271 | ) | (70 | ) | (1,070 | ) | ||||||
| Accounts payable |
(354 | ) | (333 | ) | 252 | |||||||
| Accrued expenses and other liabilities |
(1,816 | ) | 5,642 | 13,025 | ||||||||
| Deferred revenue |
(2,273 | ) | 1,055 | 746 | ||||||||
| Net cash provided by operating activities |
63,684 | 62,779 | 119,972 | |||||||||
| Cash flows from investing activities: |
||||||||||||
| Purchase of property and equipment |
(2,105 | ) | (1,003 | ) | (1,137 | ) | ||||||
| Proceeds from sale or disposal of property and equipment |
26 | — | — | |||||||||
| Cash payments for options |
(392 | ) | (222 | ) | — | |||||||
| Cash received from option exercises |
674 | 305 | 48 | |||||||||
| Sale of investments |
350 | 576 | 120 | |||||||||
| Purchase of investments |
(2,085 | ) | (631 | ) | (2,025 | ) | ||||||
| Proceeds from maturity of investment |
505 | — | 505 | |||||||||
| Net cash used in investing activities |
(3,027 | ) | (975 | ) | (2,489 | ) | ||||||
| Cash flows from financing activities: |
||||||||||||
| S-Corporation distributions |
(71,467 | ) | (64,019 | ) | (119,619 | ) | ||||||
| Payments of stock purchase notes payable |
(1,488 | ) | (583 | ) | (120 | ) | ||||||
| Repayment of note payable |
(102 | ) | (124 | ) | (146 | ) | ||||||
| Issuance of promissory note receivable |
(10,000 | ) | (8,000 | ) | — | |||||||
| Proceeds from repayment of promissory note receivable |
10,000 | 8,000 | — | |||||||||
| Proceeds on issuance of stock |
12 | 21 | 2 | |||||||||
| Repurchase of treasury stock |
— | (255 | ) | — | ||||||||
| Capital contributions |
4,017 | 4,649 | 5,141 | |||||||||
| Net cash used in financing activities |
(69,028 | ) | (60,311 | ) | (114,742 | ) | ||||||
| Net (decrease) increase in cash and cash equivalents |
(8,371 | ) | 1,493 | 2,741 | ||||||||
| Cash and cash equivalents: |
||||||||||||
| Beginning of year |
31,680 | 23,309 | 24,802 | |||||||||
| End of year |
$ | 23,309 | $ | 24,802 | $ | 27,543 | ||||||
| Supplemental disclosures: |
||||||||||||
| Cash paid during the year for interest |
$ | 154 | $ | 115 | $ | 16 | ||||||
| Cash paid during the year for taxes |
$ | 311 | $ | 421 | $ | 661 | ||||||
| Non-cash transactions: |
||||||||||||
| Capital expenditures in accounts payable and accruals |
$ | 85 | $ | 115 | $ | 240 | ||||||
| Equipment acquired through capital lease obligations |
$ | — | $ | 135 | $ | 123 | ||||||
The accompanying notes are an integral part of these combined consolidated financial statements.
F-9
Table of Contents
NOTES TO COMBINED CONSOLIDATED FINANCIAL STATEMENTS
AS OF DECEMBER 31, 2009 AND 2010 AND FOR THE YEARS ENDED DECEMBER 31,
2008, 2009 AND 2010.
(Dollars in thousands unless stated otherwise, except per unit or per share amounts)
Note 1—Organization and Nature of the Business
Manning & Napier Companies, which includes Manning and Napier Advisors, Inc. (“MNA”) and the companies described below that are under common management and/or common ownership (collectively, “the Company”) is primarily a provider of investment management services. The following companies are included:
MNA was founded in 1970 in Rochester, New York and is registered as an investment adviser with the U.S. Securities and Exchange Commission (“SEC”) under the Investment Advisers Act of 1940, as amended. MNA is also registered with the Alberta Securities Commission in Canada. Headquartered in Fairport, New York with branch offices in St. Petersburg, Florida and Dublin, Ohio, MNA serves in a fully–discretionary fiduciary capacity and provides investment advisory services to separate accounts and commingled pooled investment vehicles. MNA managed over $40 billion in assets under management (“AUM”) as of December 31, 2010, for high net worth individuals and institutions, including 401(k) plans, pension plans, Taft-Hartley plans, and endowments and foundations.
Investment management operations are also conducted through Manning & Napier Advisory Advantage Corporation and its wholly-owned subsidiary, Exeter Advisors Inc. (collectively referred to as “AAC”), which began operations in 1990. AAC is an investment advisor registered with the SEC under the Investment Advisers Act of 1940, as amended. AAC markets MNA’s investment management services through independent financial professionals.
Manning & Napier Alternative Opportunities (“MNAO”) is a registered investment advisor that serves as a general partner to an investment limited partnership that is currently inactive.
Custody operations are conducted by Exeter Trust Company (“Exeter” or “ETC”), a 98% owned subsidiary of Manning & Napier Capital Company, LLC (“MNCC”). Exeter commenced operations in 1994 and is located in Portsmouth, New Hampshire. Exeter provides services to approximately 6,000 custodial accounts, including accounts managed by MNA and AAC.
Manning & Napier Investor Services, Inc. (“MNBD”) is a limited purpose broker/dealer registered with the SEC and regulated by the Financial Industry Regulatory Authority (“FINRA”). MNBD is the distributor for Manning & Napier Fund, Inc. (“Manning & Napier Fund” or the “Fund”), a series of diversified mutual funds managed by MNA and registered under the Investment Company Act of 1940, as amended.
The Company also includes several non-investment businesses that are technology related and are under common ownership and/or management. These companies include Perspective Partners, LLC (“PPI”), and Manning & Napier Information Services, including its wholly owned subsidiary Manning & Napier Benefits, LLC (collectively referred to as “MNIS”).
PPI, established in March 2000, designs software and provides services to the 401(k) industry. MNIS, established in January 1995, is a web-based company which designs and develops web-delivered software to assist the human resources function of employers in streamlining benefits administration for health and welfare plans including enrollment, employee education, benefits analysis, and benefits management.
MNA, AAC, MNBD and MNAO are herein collectively referred to as the S-Corps.
F-10
Table of Contents
Unaudited Pro Forma Income Information
The pro forma effective tax rate assumes that all of the Company’s results from operations would be subject to federal, state and local income tax. However, only a portion of the Company’s shares will be sold in the initial offering, therefore only a portion of the Company’s earnings will be taxed at Manning & Napier, Inc.’s “C-corporation” level. Accordingly, the Company anticipates that the actual effective tax rate will be lower than 40% and will be dependent upon the amount of shares tendered to the public in the initial offering.
Note 2—Summary of Significant Accounting Policies
Basis of Presentation
The accompanying combined consolidated financial statements were prepared in accordance with accounting principles generally accepted in the United States of America (“U.S. GAAP”) and related rules and regulations of the SEC. The preparation of financial statements in conformity with U.S. GAAP requires management to make estimates or assumptions that affect the reported amounts and disclosures in the combined consolidated financial statements. Actual results could differ from these estimates or assumptions.
Principles of Combination
The entities within these combined consolidated financial statements are all under common control and include MNA, AAC, MNCC, ETC, MNAO, MNBD, MNIS and PPI. All material intercompany balances have been eliminated in combination.
Operating Segments
The Company operates in one segment, the investment management industry. The Company primarily provides investment management services to separate accounts and managed commingled vehicles. Management assesses the financial performance of these vehicles on a combined basis.
Cash and Cash Equivalents
The Company defines cash and cash equivalents as money market funds and other highly liquid investments with original maturities of 90 days or less. Cash and cash equivalents are stated at cost, which approximates fair value. Cash and cash equivalents are subject to credit risk and are primarily maintained in a U.S. Treasury money market fund.
Marketable Securities
Investments in marketable securities are classified as available-for-sale. Marketable securities consist of short-term investments, equity securities and investment in mutual funds, including the Fund for which MNA provides sub-advisory services. Investments provide exposure to various risks, including price risk (the risk of a potential future decline in value of the investment), credit risk, and changes in interest rates. Investments are carried at fair value based on quoted market prices in active markets for identical or similar instruments. Fair value is defined as the price that the Company would have received in the sale of an asset or paid to transfer a liability in an orderly transaction between market participants at the measurement date. Unrealized gains (losses) on available-for-sale securities are recorded as a component of total comprehensive income (loss). Realized gains (losses) are computed on a specific identification basis and are recorded in net capital gains (losses) on investments in the combined consolidated statements of income.
Accounts Receivable
Accounts receivable includes investment management and custodial fees receivable from clients. The Company accounts receivable balances do not include any significant allowance for doubtful accounts nor has any significant bad debt expense attributable to accounts receivable been recorded for the years ended December 31, 2008, 2009 or 2010.
F-11
Table of Contents
Property and Equipment
Property and equipment are carried at cost less accumulated depreciation. Depreciation is computed on a straight-line basis over the applicable life of the asset class. Depreciation is calculated for computer software, office equipment, and furniture and fixtures using useful lives of 3, 5, and 7 years, respectively. Upon sale or other disposition of fixed assets, the cost and accumulated depreciation are removed and the resulting gain or loss is included in income.
Leases
Rent under non-cancelable operating leases with scheduled rent increases is accounted for on a straight-line basis over the lease term, beginning on the date of initial possession or the effective date of the lease agreement. Allowances and other lease incentives provided by the Company’s landlords are amortized on a straight-line basis as a reduction of rent expense. The difference between straight-line rent expense and rent paid and the unamortized deferred lease costs and build-out allowances are recorded as deferred rent liability in the combined consolidated statements of financial condition.
Share Repurchase Agreements and Treasury Stock
The Company has the option to repurchase shares from its minority shareholders in certain circumstances (Note 7). The repurchase price is based on defined criteria when the transaction is recorded. When treasury shares are reissued, any difference between the average acquisition cost of the shares and the proceeds from reissuance is credited or charged to shareholders’ equity.
Shares Subject to Mandatory Redemption
The Company has entered into an agreement that upon the death of the majority shareholder, the Company has a mandatory obligation to pay the majority shareholder’s pro rata share of net revenue (as defined in the agreement) for the four quarters immediately preceding the holder’s death. In accordance with the requirements of accounting for certain financial instruments with characteristics of both liabilities and equity, the Company has recognized a liability for shares subject to mandatory redemption in the combined consolidated statements of financial condition. The liability has been measured at the redemption amount (Note 9).
Revenue Recognition
The majority of revenues earned by the Company are based on fees charged to manage customers’ portfolios. Investment management fees are generally computed as a percentage of AUM and recognized as earned. Fees for providing investment advisory services are computed and billed in accordance with the provisions of the applicable investment management agreements. Revenues received in advance are deferred to the period earned, which is generally a semi-annual period but varies by client based upon the terms of the investment management agreement. Revenue is also recognized as earned for providing custodial services, sub-advisory services to the Fund and other services performed by the Company’s non-investment business.
Equity-Based Compensation
The Company recognizes compensation expense for all share-based payment awards made to employees. Equity-based compensation expense is measured at the grant date based on the fair value of the award and is recognized as expense on a straight-line basis over the requisite service period. Judgments and estimates are made regarding, among other things, the methodology to follow in valuing equity-based compensation awards and the related inputs required by those valuation methodologies.
F-12
Table of Contents
Income Taxes
The Company is comprised of entities that have elected to be treated as either an “S-Corporation”, a limited liability company (LLC), or a “C-Corporation”. As such, the entities functioning as S-corporations or LLCs are not liable for federal (and most state) income taxes on their earnings; as such earnings will be included in the personal income tax returns of each entity’s shareholders and unit holders. The entity functioning as a “C-Corporation” is liable for federal and state income taxes on its earnings.
Deferred taxes are provided on a liability method whereby deferred tax assets are recognized for deductible temporary differences and deferred tax liabilities are recognized for taxable temporary differences. Deferred tax assets are reduced by a valuation allowance when, in the opinion of management, it is more likely than not that some portion or all of the deferred tax assets will not be realized.
Comprehensive Income
Comprehensive income includes net income and other comprehensive income. Other comprehensive income consists of the change in unrealized (loss) gain on available-for-sale investments. The changes in the balances of components comprising other comprehensive income are presented in the following table:
| December 31, | ||||||||||||
| 2008 | 2009 | 2010 | ||||||||||
| Net income |
$ | 58,992 | $ | 54,425 | $ | 53,098 | ||||||
| Unrealized (loss) gain on marketable securities |
(889 | ) | 781 | 303 | ||||||||
| Comprehensive income |
$ | 58,103 | $ | 55,206 | $ | 53,401 | ||||||
Loss Contingencies
The Company accrues for estimated costs, including legal costs related to existing lawsuits, claims and proceedings when it is probable that a liability has been incurred and the costs can be reasonably estimated. Potential loss contingencies and related accruals are reviewed at least quarterly and are adjusted to reflect the impact and status of settlements, rulings, advice of counsel and other information pertinent to a particular matter. Significant differences could exist between the actual cost required to investigate, litigate and/or settle a claim or the ultimate outcome of a suit and management’s estimate. These differences could have a material impact on the Company’s combined consolidated financial statements. No loss accruals were recorded as of December 31, 2008, 2009 and 2010.
Recent Accounting Pronouncements
In June 2011, the Financial Accounting Standards Board (“FASB”) issued Accounting Standards Update (“ASU”) 2011-05, Presentation of Comprehensive Income (Topic 220). This standard eliminates the current option to report other comprehensive income and its components in the statement of changes in equity. These amendments are effective for annual periods beginning after December 15, 2011. The Company does not expect the amendments to have a material impact on its combined consolidated financial statements and related disclosures.
In May 2011, the FASB issued ASU 2011-04, Fair Value Measurement (Topic 820): Amendments to Achieve Common Fair Value Measurement and Disclosure Requirements in U.S. GAAP and International Financial Reporting Standards. The amendments in this update change the wording used to describe the requirements in U.S. GAAP for measuring fair value and for disclosing information about fair value measurements. These amendments are effective for annual periods beginning after December 15, 2011. The Company does not expect the amendments to have a material impact on its combined consolidated financial statements and related disclosures.
F-13
Table of Contents
In February 2010, the FASB issued ASU 2010-10, Consolidation (Topic 810): Amendments for Certain Investment Funds. The amendments to the consolidation requirements of Topic 810 are deferred for a reporting entity’s interest in an entity (1) that has all the attributes of an investment company or (2) for which it is industry practice to apply measurement principles for financial reporting purposes that are consistent with those followed by investment companies. ASU 2010-10 became effective for the Company on January 1, 2010 and there was no impact on its combined consolidated financial statements and related disclosures.
In January 2010, the FASB issued ASU 2010-06, Fair Value Measurements and Disclosures (Topic 820): Improving Disclosures above Fair Value Measurements, which requires entities to make new disclosures about recurring or nonrecurring fair-value measurements and provides clarification of existing disclosure requirements. This amendment requires separate disclosures about purchases, sales, issuances, and settlements relating to Level 3 measurements. This amendment is effective for fiscal years beginning after December 15, 2010. The adoption did not have a material impact on the Company’s combined consolidated financial statements and related disclosures.
Note 3—Investments in Marketable Securities
Investments in marketable securities are classified as available-for-sale. Marketable securities consist of short-term investments, equity securities and mutual funds, including the funds which are managed by the Company. Investments are carried at a fair value based on quoted market prices in active markets for identical instruments.
Unrealized gains (losses) on available-for-sale securities are recorded as a component of total comprehensive income (loss). Realized gains (losses) are computed on a specific identification basis and are recorded in net capital gains (losses) on investments in the combined consolidated statements of income.
Realized gains (losses) on the sale of securities and on expired options were $122, $(151) and $1 in 2008, 2009 and 2010, respectively. The following table represents the Company’s marketable securities holdings as of December 31, 2009 and 2010:
| Cost | Unrealized Gain/Loss |
Amortized Discount/ Accrued Int. |
Estimated Fair Value |
|||||||||||||
| At December 31, 2009 |
||||||||||||||||
| Short-term securities |
$ | 481 | $ | — | $ | — | $ | 481 | ||||||||
| Equity securities |
1,220 | (214 | ) | — | 1,006 | |||||||||||
| Managed mutual funds |
520 | 105 | — | 625 | ||||||||||||
| US Treasury note (0.375%, 9/30/2012) |
510 | (1 | ) | — | 509 | |||||||||||
| US Treasury note (1.75%, 1/31/2014) |
101 | (3 | ) | 1 | 99 | |||||||||||
| $ | 2,832 | $ | (113 | ) | $ | 1 | $ | 2,720 | ||||||||
| At December 31, 2010 |
||||||||||||||||
| Short-term securities |
$ | 654 | $ | — | $ | — | $ | 654 | ||||||||
| Equity securities |
2,310 | 127 | 7 | 2,444 | ||||||||||||
| Managed mutual funds |
607 | 69 | — | 676 | ||||||||||||
| US Treasury note (0.375%, 9/30/2012) |
504 | — | — | 504 | ||||||||||||
| US Treasury note (1.75%, 1/31/2014) |
101 | 1 | 1 | 103 | ||||||||||||
| $ | 4,176 | $ | 197 | $ | 8 | $ | 4,381 | |||||||||
F-14
Table of Contents
Note 4—Fair Value Measurements
In accordance with current accounting standards, fair value is defined as the price that the Company would receive upon selling an investment in an orderly transaction to an independent buyer in the principal or most advantageous market of the investment. A fair value hierarchy is provided that gives the highest priority to unadjusted quoted prices in active markets for identical assets and liabilities (Level 1) and the lowest priority to unobservable inputs (Level 3).
The following three-tier fair value hierarchy prioritizes the inputs used in measuring fair value:
Level 1—observable inputs such as quoted prices in active markets for identical securities;
Level 2—other significant observable inputs (including but not limited to quoted prices for similar securities, interest rates, prepayment speeds, credit risk, etc.); and
Level 3—significant unobservable inputs (including the Company’s own assumptions in determining the fair value of investments).
The following provides the hierarchy of inputs used to derive the fair value of the Company’s assets as of December 31, 2009 and 2010:
| Level 1 | Level 2 | Level 3 | Totals | |||||||||||||
| December 31, 2009 |
||||||||||||||||
| Cash and cash equivalents |
$ | 24,802 | $ | — | $ | — | $ | 24,802 | ||||||||
| Short-term securities |
481 | — | — | 481 | ||||||||||||
| Equity securities |
1,006 | — | — | 1,006 | ||||||||||||
| Managed mutual funds |
625 | — | — | 625 | ||||||||||||
| US Treasury note (0.375%, 9/30/2012) |
— | 509 | — | 509 | ||||||||||||
| US Treasury note (1.75%, 1/31/2014) |
— | 99 | — | 99 | ||||||||||||
| $ | 26,914 | $ | 608 | $ | — | $ | 27,522 | |||||||||
| December 31, 2010 |
||||||||||||||||
| Cash and cash equivalents |
$ | 27,543 | $ | — | $ | — | $ | 27,543 | ||||||||
| Short-term securities |
654 | — | — | 654 | ||||||||||||
| Equity securities |
2,444 | — | — | 2,444 | ||||||||||||
| Managed mutual funds |
676 | — | — | 676 | ||||||||||||
| US Treasury note (0.375%, 9/30/2012) |
— | 504 | — | 504 | ||||||||||||
| US Treasury note (1.75%, 1/31/2014) |
— | 103 | — | 103 | ||||||||||||
| $ | 31,317 | $ | 607 | $ | — | $ | 31,924 | |||||||||
There were no Level 3 securities held by the Company as of December 31, 2009 or 2010.
The Company’s policy is to recognize transfers in and transfers out of the valuation levels as of the beginning of the reporting period. There were no significant transfers between Level 1 and Level 2 during the years ended December 31, 2009 and 2010.
F-15
Table of Contents
Note 5—Property and Equipment
Property and equipment as of December 31, 2009 and 2010 consisted of the following:
| December 31, 2009 |
December 31, 2010 |
|||||||
| Furniture and fixtures |
$ | 1,224 | $ | 1,414 | ||||
| Office equipment |
2,819 | 3,185 | ||||||
| Computer software |
2,312 | 2,490 | ||||||
| Leasehold improvements |
804 | 1,116 | ||||||
| 7,159 | 8,205 | |||||||
| Less: Accumulated depreciation |
(4,125 | ) | (5,094 | ) | ||||
| $ | 3,034 | $ | 3,111 | |||||
Depreciation expense was $1.1 million, $1.1 million and $1.4 million for the years ended December 31, 2008, 2009 and 2010, respectively.
The Company has evaluated its long-lived assets for impairment under the current accounting standards and has concluded that no impairment loss has occurred as of December 31, 2008, 2009 and 2010.
Note 6—Accrued Expenses and Other Liabilities
Accrued expenses and other liabilities as of December 31, 2009 and 2010 consisted of the following:
| December 31, 2009 |
December 31, 2010 |
|||||||
| Accrued sales commissions |
$ | 2,399 | $ | 5,518 | ||||
| Accrued bonuses |
7,465 | 15,077 | ||||||
| Accrued sub-transfer agent fees |
4,619 | 5,916 | ||||||
| Other accruals and liabilities |
2,951 | 3,953 | ||||||
| $ | 17,434 | $ | 30,464 | |||||
Note 7—Share Repurchase Agreements
The Company has entered into share repurchase agreements with minority shareholders for a purchase price based on defined criteria to be paid over a three year period following the issue date. The following table reflects the share amounts for which there is a liability recorded in the combined consolidated financial statements as of December 31, 2009 or 2010:
| Date |
Shares | |||
| June 30, 2007 |
7,410 | |||
| January 1, 2009 |
7,410 | |||
| October 30, 2009 |
9,263 | |||
The Company has recognized the following liability in the financial statements related to the above transactions:
| December 31, 2009 |
December 31, 2010 |
|||||||
| Stock purchase notes payable (discounted at 3.25% |
$ | 273 | $ | 201 | ||||
F-16
Table of Contents
The liability for these agreements is measured at fair value, which is adjusted annually over the 3 year period to reflect current factors as it relates to the defined criteria. Where shares have been reissued, any fair value adjustment determined subsequent to re-issuance has been recorded as an adjustment within additional paid-in capital or retained earnings. The aggregate liability for these agreements is $290 and $211 as of December 31, 2009 and 2010, respectively. The Company made payments of $1.5 million, $794 and $125 during the years ended December 31, 2008, 2009 and 2010, respectively, on the stock purchase notes payable. As of December 31, 2009 and 2010, 9,263 and 0 shares, respectively, were held in the treasury.
Note 8—Lines of Credit
The Company had $0.5 million in lines of available and unused credit as of December 31, 2009 and December 31, 2010.
Note 9—Mandatory Redeemable Obligation
The Company has entered into an agreement that upon the death of the majority shareholder, the Company has a mandatory obligation to pay the majority shareholder within seven years his pro rata share of net revenue (as defined in the agreement) for the four quarters immediately preceding the holder’s death. The Company has recognized a liability for shares subject to mandatory redemption of $109.0 million and $170.3 million as of December 31, 2009 and 2010, respectively, which represents the amount that would have been paid if settlement had occurred on the respective reporting date. Changes in the liability associated with this obligation have been recorded as interest expense on shares subject to mandatory redemption in the combined consolidated statements of income.
As indicated in Note 14, the Company is a flow through entity for federal (and most state) taxes. Therefore, the interest expense resulting from the shares subject to mandatory redemption is treated as a permanent item.
Note 10—Commitments and Contingencies
The Company may enter into agreements that contain certain representations and warranties and which provide general indemnifications. The Company serves as a guarantor of such obligations. The Company’s maximum exposure under these arrangements is unknown, as this would involve future claims that may be made against the Company that have not yet occurred. The Company expects any risk of liability associated with such guarantees to be remote.
As an investment adviser to a variety of investment products, we are subject to routine reviews and inspections by the SEC and FINRA. From time to time we may also be subject to claims, be involved in various legal proceedings arising in the ordinary course of our business and other contingencies. We do not believe that the outcome of any of these reviews, inspections or other legal proceedings will have a material impact on our combined consolidated financial statements; however, litigation is subject to many uncertainties, and the outcome of individual litigated matters is difficult to predict. The Company will establish accruals for matters that are probable, can be reasonably estimated, and may take into account any related insurance recoveries to the extent of such recoveries. Currently, there are no legal proceedings pending or to the Company’s knowledge threatened against it. As of December 31, 2009 and 2010, the Company has not accrued for any such claims, legal proceedings, or other contingencies.
F-17
Table of Contents
Note 11—Lease Commitments
The Company leases its primary office facilities in Fairport, New York under an operating lease expiring July 31, 2015. The Company also rents additional office space in Buffalo, New York, St. Petersburg, Florida, and Dublin, Ohio. Total rental expense for all leases amounted to $2.5 million, $2.6 million and $2.6 million for the years ended December 31, 2008, 2009 and 2010, respectively. Minimum rent payments relating to the office leases for years subsequent to 2010, are as follows:
| Year Ending December 31, |
||||
| 2011 |
$ | 2,631 | ||
| 2012 |
2,549 | |||
| 2013 |
2,488 | |||
| 2014 |
2,500 | |||
| 2015 |
1,609 | |||
| Thereafter |
228 | |||
| $ | 12,005 | |||
Under the agreement for its primary office facilities, the Company is required to pay a minimum of $2.2 million annually for the use of the facility as defined in the agreement.
Note 12—Sub-Advisory Agreements
The Company derives significant revenue from its role as sub-advisor to the Manning & Napier Fund series of mutual funds and the Exeter Trust Company Collective Investment Trust (“CIT”) investment vehicles.
Investments in the Fund amounted to approximately $0.6 million and $0.7 million at December 31, 2009 and 2010, respectively.
Fees earned for advisory related services provided to the Fund and CIT investment vehicles were $39.3 million, $63.5 million and $120.0 million in 2008, 2009 and 2010, respectively, which represent greater than 10% of revenue in each year.
Note 13—Equity Based Compensation
The Company measures the cost of employee services received in exchange for an award of equity instruments based on the grant-date fair value of the award and such cost is recognized over the period during which an employee is required to provide services in exchange for the award.
The Company awards certain employees equity shares in the Company. The plan entitles the participants to all of the rights and obligations of shareholders, including the right to ordinary and liquidating distributions, upon the sale of the Company. Equity ownership vests per a schedule based on the shareholder’s age and time frame of being a shareholder. If a shareholder terminates employment prior to the sale of the Company, the Company has the option to repurchase shares from the shareholder at a pre-determined formula price based on defined criteria to be paid over the next three years. The number of shares authorized for issuance at December 31, 2008, 2009 and 2010 was 10 million shares.
The shares granted during 2008, 2009 and 2010 were valued using the fair value method of accounting, in accordance with U.S. GAAP. Accordingly, the shares granted were determined to have the following weighted average fair value per share:
| Year Ended December 31, | ||||||||||||
| 2008 | 2009 | 2010 | ||||||||||
| Grant-date fair value per award |
$ | 22.48 | $ | 24.63 | $ | 27.01 | ||||||
F-18
Table of Contents
The weighted-average fair value of the shares granted during 2008, 2009 and 2010 may not reflect actual transactions. Share-based compensation for the shares issued was estimated at the date of grant at the fair value per share less the cash consideration paid by the shareholders.
The estimated compensation cost associated with the shares is being amortized as compensation expense over the required service term of 3 years. The Company recorded compensation expense of $446, $731 and $682 during the year ended December 31, 2008, 2009 and 2010, respectively, relating to shares issued during 2007, 2008, 2009 and 2010. Total remaining compensation cost related to the issued shares yet to be recognized is $735, $715 and $356 at December 31, 2008, 2009 and 2010, respectively.
Shares are recognized on a pro-rata basis until the 3-year service requirement is met, allowing employees to begin fully participating in the benefits of share ownership. A summary of this share activity under the plan for the Company as of December 31, 2008, 2009 and 2010 and changes during the year then ended is presented below:
| 2008 | 2009 | 2010 | ||||||||||||||||||||||
| Recognized Shares |
Unrecognized Shares |
Recognized Shares |
Unrecognized Shares |
Recognized Shares |
Unrecognized Shares |
|||||||||||||||||||
| Outstanding at January 1 |
939,242 | 94,680 | 1,033,699 | 103,538 | 1,107,829 | 77,845 | ||||||||||||||||||
| Granted |
— | 103,315 | — | 65,110 | — | 50,685 | ||||||||||||||||||
| Repurchased |
— | — | (16,673 | ) | — | — | — | |||||||||||||||||
| Recognized |
94,457 | (94,457 | ) | 90,803 | (90,803 | ) | 73,037 | (73,037 | ) | |||||||||||||||
| Outstanding at December 31 |
1,033,699 | 103,538 | 1,107,829 | 77,845 | 1,180,866 | 55,493 | ||||||||||||||||||
There were no forfeitures in 2008, 2009 and 2010.
Note 14—Income Taxes
Components of the provision for income taxes consist of the following:
| December 31, | ||||||||||||
| 2008 | 2009 | 2010 | ||||||||||
| Current |
||||||||||||
| Federal |
$ | 127 | $ | 133 | $ | 163 | ||||||
| State and Local |
260 | 227 | 546 | |||||||||
| Current tax expense |
387 | 360 | 709 | |||||||||
| Deferred tax expense (benefit) |
(13 | ) | — | 3 | ||||||||
| Provision for income taxes |
$ | 374 | $ | 360 | $ | 712 | ||||||
| December 31, | ||||||||
| 2009 | 2010 | |||||||
| Deferred Current Tax Assets |
||||||||
| Unrealized loss |
$ | 2 | $ | — | ||||
| Accrued expenses |
16 | 13 | ||||||
| 18 | 13 | |||||||
| Deferred Current Tax Liabilities |
||||||||
| Unrealized gain |
— | — | ||||||
| — | — | |||||||
| Total Deferred Tax Assets and Liabilities, net |
$ | 18 | $ | 13 | ||||
F-19
Table of Contents
The total deferred current assets and liabilities are presented in the combined consolidated statements of financial condition as a component of prepaid expenses and other assets.
A reconciliation of the U.S. statutory income tax rate to the Company’s effective tax rate is as follows:
| 2008 | 2009 | 2010 | ||||||||||
| US Statutory Tax Rate |
35.0 | % | 35.0 | % | 35.0 | % | ||||||
| Increase due to state and local taxes |
0.4 | % | 0.4 | % | 1.0 | % | ||||||
| Rate benefit as a flow through entity |
(34.8 | %) | (34.7 | %) | (34.7 | %) | ||||||
| Effective Tax Rate |
0.6 | % | 0.7 | % | 1.3 | % | ||||||
The Company’s effective tax rate includes a benefit attributable to the fact that the Company operates as a series of flow-through entities which are generally not subject to federal (and most state) income tax. Accordingly, a portion of the Company’s earnings are not subject to corporate level taxes. This favorable impact is partially offset by state taxes at the entity level.
The Company has adopted the authoritative guidance for accounting for the uncertainty in income taxes on January 1, 2007, and the adoption did not have an impact on the Company’s combined consolidated statements of financial condition or combined consolidated statements of income. The Company did not have a material uncertain tax position as of December 31, 2008, 2009 and 2010, respectively. If warranted, the Company will record accrued interest and penalties for uncertain tax positions as a component of the provision for income taxes.
The Company does not expect that changes in the liability for unrecognized tax benefits during the 2011 fiscal year will have a significant impact on the Company’s financial position or results of operations.
The Company files income tax returns with Federal, state and local jurisdictions. U.S. Federal and state tax returns for 2007 through 2010 are currently open for examination.
Note 15—Regulatory Authorities
MNA, AAC and MNAO are investment advisors registered with the SEC under the Investment Advisers Act of 1940.
MNBD is a limited purpose broker-dealer registered with the SEC and FINRA. MNBD is subject to the requirements of Rule 15c3-1 (the “net capital rule”) under the Securities Exchange Act of 1934 which requires the maintenance of minimum net capital and requires that the ratio of aggregate indebtedness to net capital shall not exceed 15 to 1.
ETC, in accordance with New Hampshire state regulations, is required to maintain a restricted surplus fund equal to 100% of its common stock. No part of the restricted surplus balance can be used in the payment of dividends on the stock of ETC. Additionally, ETC has pledged a $0.5 million security for the benefit of the New Hampshire Banking Commissioner based on a 2006 notification from the State of New Hampshire Banking Department. As such, the Company has classified these amounts as restricted surplus and included them within retained earnings in the combined consolidated statements of shareholders’ deficit and partners’ capital.
Manning & Napier Benefits, LLC, (“MNB”) as a wholly-owned subsidiary of MNIS and a licensed broker of low cost group health and welfare insurance, is subject to certain regulations promulgated by regulatory authorities as follows: Health Insurance Portability and Accountability Act of 1996 (“HIPAA”) as it relates to information privacy and security under certain circumstances promulgated by the Department of Health and Human Services (“HHS”) and enforced by the Office of Civil Rights (“OCR”); HHS regulations related to the conduct of brokers to the extent MNB markets certain types of insurance to Medicare beneficiaries; applicable State Insurance Department regulations for each state where business is conducted; and State Attorney General enforcement of regulations applicable to privacy and security laws of each state where business is conducted.
F-20
Table of Contents
Note 16—Employee Benefit Plan
The Company offers two benefit plans across the combined companies. The Manning & Napier Advisors, Inc. 401(k) and Profit Sharing Plan (the “MNA Plan”) covers employees of MNA, AAC and ETC who meet the plan criteria. The Manning & Napier Information Services, Inc. 401(k) Plan (the “MNIS Plan”) covers employees of MNIS and PPI who meet the plan criteria.
With respect to the 401(k) portion of the MNA Plan and the MNIS Plan, participants may voluntarily contribute up to 50% of their regular salary subject to annual limitations determined by the IRS. The Company matches an amount equivalent to 50% of a participant’s contribution, not to exceed 2% of salaries paid. Matching contributions vest to the participants after three years of service. These contributions by the Company amounted to $444, $519 and $625 for the years ended December 31, 2008, 2009 and 2010, respectively.
With respect to the Profit Sharing portion of the MNA Plan, the Company may make annual profit sharing contributions, subject to certain limitations, which vest immediately to individuals who participate. These contributions by the Company amounted to $0.8 million, $0.9 million and $1.0 million for the years ended December 31, 2008, 2009 and 2010, respectively. The MNIS Plan does not participate in profit sharing.
Note 17—Related Party Transactions
MNA was issued two separate promissory notes from William Manning in the principal amount of $10.0 million and $8.0 million during 2008 and 2009, respectively. William Manning repaid the 2008 note in full, including all interest accrued thereon, with payments to MNA on November 7, 2008 and December 19, 2008. William Manning repaid the 2009 note in full, including all interest accrued thereon, with payments to MNA on April 16, 2009 and June 17, 2009.
Note 18—Quarterly Information (Unaudited)
The following table presents unaudited quarterly results of operations for 2009 and 2010. These quarterly results reflect all normal recurring adjustments that are, in the opinion of management, necessary for a fair statement of the results. Revenues and net income can vary significantly from quarter to quarter due to the nature of the Company’s business activities.
| March 31, 2009 |
June 30, 2009 |
September 30, 2009 |
December 31, 2009 |
|||||||||||||
| Total revenues |
$ | 31,818 | $ | 34,654 | $ | 42,890 | $ | 53,299 | ||||||||
| Operating income |
$ | 11,558 | $ | 12,330 | $ | 18,212 | $ | 22,812 | ||||||||
| Net income |
$ | 15,079 | $ | 13,879 | $ | 15,271 | $ | 10,197 | ||||||||
| March 31, 2010 |
June 30, 2010 |
September 30, 2010 |
December 31, 2010 |
|||||||||||||
| Total revenues |
$ | 57,210 | $ | 61,546 | $ | 63,242 | $ | 73,474 | ||||||||
| Operating income |
$ | 26,148 | $ | 28,456 | $ | 28,333 | $ | 32,005 | ||||||||
| Net income |
$ | 9,728 | $ | 10,345 | $ | 14,585 | $ | 18,440 | ||||||||
Note 19—Subsequent Events
The Company made distributions of $12.2 million, $35.8 million and $27.2 million to shareholders in January 2011, April 2011 and June 2011, respectively. Contributions made by partners of the Company subsequent to the reporting date through June 2011 were $2.5 million.
F-21
Table of Contents
Manning & Napier Companies
Combined Consolidated Statements of Financial Condition
As of December 31, 2010 and March 31, 2011 (Unaudited)
| (dollars in thousands) | December 31, 2010 |
March 31, 2011 |
||||||
| Assets |
||||||||
| Cash and cash equivalents |
$ | 27,543 | $ | 47,759 | ||||
| Accounts receivable |
18,851 | 18,474 | ||||||
| Accounts receivable—Manning & Napier Fund, Inc. |
11,948 | 13,377 | ||||||
| Marketable securities, at fair value |
4,381 | 5,103 | ||||||
| Property and equipment, net |
3,111 | 3,014 | ||||||
| Prepaid expenses and other assets |
2,508 | 2,398 | ||||||
| Total assets |
$ | 68,342 | $ | 90,125 | ||||
| Liabilities |
||||||||
| Accounts payable |
$ | 1,153 | $ | 773 | ||||
| Accrued expenses and other liabilities |
30,464 | 23,455 | ||||||
| Deferred revenue |
9,974 | 11,174 | ||||||
| Stock purchase note payable |
201 | 153 | ||||||
| Shares liability subject to mandatory redemption |
170,319 | 183,607 | ||||||
| Total liabilities |
212,111 | 219,162 | ||||||
| Commitments and contingencies |
||||||||
| Shareholders’ deficit and partners’ capital |
||||||||
| Common stock, $.01 par value—authorized, 10,000,000 shares with 2,533,110 and 2,565,322 shares outstanding and 5,224,050 shares subject to mandatory redemption, as of December 31, 2010 and March 31, 2011, respectively for the S-Corporations |
$ | 101 | $ | 103 | ||||
| Additional paid in capital |
1,628 | 1,970 | ||||||
| Treasury stock, at cost: no shares issued or outstanding as of December 31, 2010 and March 31, 2011, respectively |
— | — | ||||||
| Retained earnings (deficit) |
(147,035 | ) | (133,285 | ) | ||||
| Accumulated other comprehensive income |
193 | 554 | ||||||
| Partners’ equity |
1,307 | 1,583 | ||||||
| Total shareholders’ deficit and partners’ capital attributable to Manning & Napier Companies |
(143,806 | ) | (129,075 | ) | ||||
| Non-controlling interest |
37 | 38 | ||||||
| Total shareholders’ deficit and partners’ capital |
(143,769 | ) | (129,037 | ) | ||||
| Total liabilities and shareholders’ deficit and partners’ capital |
$ | 68,342 | $ | 90,125 | ||||
The accompanying notes are an integral part of these combined consolidated financial statements.
F-22
Table of Contents
Manning & Napier Companies
Combined Consolidated Statements of Income
Three Months Ended March 31, 2010 and 2011 (Unaudited)
| (dollars in thousands) | 2010 | 2011 | ||||||
| Revenues |
||||||||
| Investment management services revenue |
$ | 57,210 | $ | 78,040 | ||||
| Expenses |
||||||||
| Compensation and related costs |
16,775 | 22,894 | ||||||
| Sub-transfer agent and shareholder service costs |
8,498 | 11,695 | ||||||
| Other operating costs |
5,789 | 6,225 | ||||||
| Total operating expenses |
31,062 | 40,814 | ||||||
| Operating income |
26,148 | 37,226 | ||||||
| Non-operating income (loss): |
||||||||
| Interest expense on shares subject to mandatory redemption |
(16,219 | ) | (13,288 | ) | ||||
| Interest expense |
(4 | ) | (9 | ) | ||||
| Interest and dividend income |
11 | 14 | ||||||
| Net capital gains (losses) on investments |
3 | 3 | ||||||
| Total non-operating loss |
(16,209 | ) | (13,280 | ) | ||||
| Income before provision for income taxes |
9,939 | 23,946 | ||||||
| Provision for income taxes |
211 | 286 | ||||||
| Net income |
$ | 9,728 | $ | 23,660 | ||||
The accompanying notes are an integral part of these combined consolidated financial statements.
F-23
Table of Contents
Manning & Napier Companies
Combined Consolidated Statements of Shareholders’ Deficit and Partners’ Capital
Three Months Ended March 31, 2010 and 2011 (Unaudited)
| Common Stock | Additional Paid-In Capital |
Treasury Stock | Retained Earnings |
Other Comprehensive Income (Loss) |
Partners’ Equity (Deficit) |
Total | ||||||||||||||||||||||||||||||
| (dollars in thousands) | Shares | Amount | Shares | Amount | ||||||||||||||||||||||||||||||||
| Balance—December 31, 2009 |
2,491,688 | $ | 100 | $ | 1,626 | 9,263 | $ | (102 | ) | $ | (85,888 | ) | $ | (110 | ) | $ | 1,028 | $ | (83,346 | ) | ||||||||||||||||
| Net income |
10,687 | (959 | ) | 9,728 | ||||||||||||||||||||||||||||||||
| S-Corporation distributions |
(15,353 | ) | (15,353 | ) | ||||||||||||||||||||||||||||||||
| Net change in unrealized marketable securities gains or losses |
70 | 70 | ||||||||||||||||||||||||||||||||||
| Common stock and treasury stock transactions |
41,422 | 1 | 21 | 37,052 | 102 | (79 | ) | 45 | ||||||||||||||||||||||||||||
| Stock based compensation |
164 | 164 | ||||||||||||||||||||||||||||||||||
| Capital contributions |
1,590 | 1,590 | ||||||||||||||||||||||||||||||||||
| Balance—March 31, 2010 |
2,533,110 | $ | 101 | $ | 1,811 | 46,315 | $ | — | $ | (90,633 | ) | $ | (40 | ) | $ | 1,659 | $ | (87,102 | ) | |||||||||||||||||
| Balance—December 31, 2010 |
2,533,110 | $ | 101 | $ | 1,628 | — | $ | — | $ | (147,035 | ) | $ | 193 | $ | 1,307 | $ | (143,806 | ) | ||||||||||||||||||
| Net income |
25,033 | (1,373 | ) | 23,660 | ||||||||||||||||||||||||||||||||
| S-Corporation distributions |
(11,278 | ) | (11,278 | ) | ||||||||||||||||||||||||||||||||
| Net change in unrealized marketable securities gains or losses |
361 | 361 | ||||||||||||||||||||||||||||||||||
| Common stock and treasury stock transactions |
32,212 | 2 | 32 | (5 | ) | (1 | ) | 28 | ||||||||||||||||||||||||||||
| Stock based compensation |
310 | 310 | ||||||||||||||||||||||||||||||||||
| Partner contributions |
1,650 | 1,650 | ||||||||||||||||||||||||||||||||||
| Balance—March 31, 2011 |
2,565,322 | $ | 103 | $ | 1,970 | — | $ | — | $ | (133,285 | ) | $ | 554 | $ | 1,583 | $ | (129,075 | ) | ||||||||||||||||||
The accompanying notes are an integral part of these combined consolidated financial statements.
F-24
Table of Contents
Manning & Napier Companies
Combined Consolidated Statements of Cash Flows
Three Months Ended March 31, 2010 and 2011 (Unaudited)
| (dollars in thousands) | 2010 | 2011 | ||||||
| Cash flows from operating activities: |
||||||||
| Net income |
$ | 9,728 | $ | 23,660 | ||||
| Adjustments to reconcile net income to net cash provided by operating activities: |
||||||||
| Interest cost related to change in mandatory redemption liability |
16,219 | 13,288 | ||||||
| Equity-based compensation |
164 | 310 | ||||||
| Depreciation |
313 | 264 | ||||||
| Realized gain on sale of investments |
— | (3 | ) | |||||
| (Increase) decrease in operating assets and increase (decrease) in operating liabilities |
||||||||
| Accounts receivable |
2,040 | 377 | ||||||
| Accounts receivable—Manning & Napier Fund, Inc. |
(1,464 | ) | (1,429 | ) | ||||
| Prepaid and other assets |
4 | 110 | ||||||
| Accounts payable |
(505 | ) | (379 | ) | ||||
| Accrued expenses and other liabilities |
(2,099 | ) | (6,986 | ) | ||||
| Deferred revenue |
11 | 1,199 | ||||||
| Net cash provided by operating activities |
24,411 | 30,411 | ||||||
| Cash flows from investing activities: |
||||||||
| Purchase of property and equipment |
(393 | ) | (168 | ) | ||||
| Sale of investments |
— | 104 | ||||||
| Purchase of investments |
(26 | ) | (464 | ) | ||||
| Net cash used in investing activities |
(419 | ) | (528 | ) | ||||
| Cash flows from financing activities: |
||||||||
| S-Corporation distributions |
(15,353 | ) | (11,278 | ) | ||||
| Payments of stock purchase notes payable |
(49 | ) | (45 | ) | ||||
| Repayment of note payable |
(34 | ) | (22 | ) | ||||
| Proceeds from issuance of common and treasury stock |
45 | 28 | ||||||
| Capital contributions |
1,590 | 1,650 | ||||||
| Net cash used in financing activities |
(13,801 | ) | (9,667 | ) | ||||
| Net increase in cash and cash equivalents |
10,191 | 20,216 | ||||||
| Cash and cash equivalents: |
||||||||
| Beginning of period |
24,802 | 27,543 | ||||||
| End of period |
$ | 34,993 | $ | 47,759 | ||||
| Supplemental disclosures: |
||||||||
| Cash paid during the period for interest |
$ | 4 | $ | 8 | ||||
| Cash paid during the period for taxes |
$ | 115 | $ | 82 | ||||
| Non-cash transactions: |
||||||||
| Capital expenditures in accounts payable and accruals |
$ | — | $ | — | ||||
| Equipment acquired through capital lease obligations |
$ | 14 | $ | — | ||||
The accompanying notes are an integral part of these combined consolidated financial statements.
F-25
Table of Contents
NOTES TO UNAUDITED COMBINED CONSOLIDATED FINANCIAL STATEMENTS
AS OF DECEMBER 31, 2010 AND MARCH 31, 2011 AND FOR THE THREE MONTHS ENDED MARCH 31, 2010 AND MARCH 31, 2011 (UNAUDITED)
(Dollars in thousands unless stated otherwise, except per unit or per share amounts)
Note 1—Organization and Nature of the Business
Manning & Napier Companies, which includes Manning and Napier Advisors, Inc. (“MNA”) and the companies described below that are under common management and/or common ownership (collectively, “the Company”) is primarily a provider of investment management services. The following companies are included:
MNA was founded in 1970 in Rochester, New York and is registered as an investment adviser with the U.S. Securities and Exchange Commission (“SEC”) under the Investment Advisers Act of 1940, as amended. MNA is also registered with the Alberta Securities Commission in Canada. Headquartered in Fairport, New York with branch offices in St. Petersburg, Florida and Dublin, Ohio, MNA serves in a fully–discretionary fiduciary capacity and provides investment advisory services to separate accounts and commingled pooled investment vehicles. MNA managed over $40 billion in assets under management (“AUM”) as of March 31, 2011, for high net worth individuals and institutions, including 401(k) plans, pension plans, Taft-Hartley plans, and endowments and foundations.
Investment management operations are also conducted through Manning & Napier Advisory Advantage Corporation and its wholly-owned subsidiary, Exeter Advisors Inc., (collectively referred to as “AAC”) which began operations in 1990. AAC is an investment advisor registered with the SEC under the Investment Advisers Act of 1940, as amended. AAC markets MNA’s investment management services through independent financial professionals.
Manning & Napier Alternative Opportunities (“MNAO”) is a registered investment advisor that serves as a general partner to an investment limited partnership that is currently inactive.
Custody operations are conducted by Exeter Trust Company (“Exeter” or “ETC”) a 98% owned subsidiary of Manning & Napier Capital Company, LLC (“MNCC”). Exeter commenced operations in 1994 and is located in Portsmouth, New Hampshire. Exeter provides services to approximately 6,000 custodial accounts, including accounts managed by MNA and AAC.
Manning & Napier Investor Services, Inc. (“MNBD”) is a limited purpose broker/dealer registered with the SEC and regulated by the Financial Industry Regulatory Authority (“FINRA”). MNBD is the distributor for Manning & Napier Fund, Inc. (“Manning & Napier Fund” or the “Fund”), a series of diversified mutual funds managed by MNA and registered under the Investment Company Act of 1940, as amended.
The Company also includes several non-investment businesses that are technology related and are under common ownership and/or management. These companies include Perspective Partners, LLC (“PPI”), and Manning & Napier Information Services, including its wholly owned subsidiary Manning & Napier Benefits, LLC (collectively referred to as “MNIS”).
PPI, established in March 2000, designs software and provides services to the 401(k) industry. MNIS, established in January 1995, is a web-based company which designs and develops web-delivered software to assist the human resources function of employers in streamlining benefits administration for health and welfare plans including enrollment, employee education, benefits analysis, and benefits management.
MNA, AAC, MNBD and MNAO are herein collectively referred to as the S-Corps.
F-26
Table of Contents
Note 2—Summary of Significant Accounting Policies
Basis of Presentation
The accompanying unaudited combined consolidated financial statements were prepared in accordance with accounting principles generally accepted in the United States of America (“U.S. GAAP”) and related rules and regulations of the SEC. The preparation of financial statements in conformity with U.S. GAAP requires management to make estimates or assumptions that affect the reported amounts and disclosures in the combined consolidated financial statements. Actual results could differ from these estimates or assumptions.
The unaudited combined consolidated balance sheets as of December 31, 2010 and March 31, 2011, and the unaudited combined consolidated statements of income and cash flows for the three months ended March 31, 2010 and March 31, 2011 have been prepared by the Company on the same basis as the annual audited combined consolidated financial statements. In the opinion of management, all adjustments necessary for the fair presentation of the financial position, results of operation and cash flows, have been made.
The accompanying interim unaudited combined consolidated financial statements should be read in conjunction with the audited combined consolidated financial statements as of December 31, 2009 and December 31, 2010, and for each of the three years in the period ended December 31, 2010. Certain information and footnote disclosure normally included in financial statements prepared in accordance with U.S. GAAP have been or omitted. The results of operations for the three months ended March 31, 2010 and 2011 are not necessarily indicative of the operating results for the full fiscal year.
Principles of Combination
The entities within these combined consolidated financial statements are all under common control and include MNA, AAC, MNCC, ETC, MNAO, MNBD, MNIS and PPI. All material intercompany balances have been eliminated in combination.
Operating Segments
The Company operates in one segment, the investment management industry. The Company primarily provides investment management services to separate accounts and managed commingled vehicles. Management assesses the financial performance of these vehicles on a combined basis.
Marketable Securities
Investments in marketable securities are classified as available-for-sale. Marketable securities consist of short-term investments, equity securities and investment in mutual funds, including the Fund for which MNA provides sub-advisory services. Investments provide exposure to various risks, including price risk (the risk of a potential future decline in value of the investment), credit risk, and changes in interest rates. Investments are carried at fair value based on quoted market prices in active markets for identical or similar instruments. Fair value is defined as the price that The Company would have received in the sale of an asset or paid to transfer a liability in an orderly transaction between market participants at the measurement date. Unrealized gains (losses) on available-for-sale securities are recorded as a component of total comprehensive income (loss). Realized gains (losses) are computed on a specific identification basis and are recorded in net capital gains (losses) on investments in the combined consolidated statements of income.
Shares Subject to Mandatory Redemption
The Company has entered into an agreement that upon the death of the majority shareholder, the Company has a mandatory obligation to pay the majority shareholder’s pro rata share of net revenue (as defined in the agreement) for the four quarters immediately preceding the holder’s death. In accordance with the requirements of accounting for certain financial instruments with characteristics of both liabilities and equity, the Company has recognized a liability for shares subject to mandatory redemption in the combined consolidated statements of financial condition. The liability has been measured at the redemption amount (Note 6).
F-27
Table of Contents
Revenue Recognition
The majority of revenues earned by the Company are based on fees charged to manage customers’ portfolios. Investment management fees are generally computed as a percentage of AUM and recognized as earned. Fees for providing investment advisory services are computed and billed in accordance with the provisions of the applicable investment management agreements. Revenues received in advance are deferred to the period earned, which is generally a semi-annual period but varies by client based upon the terms of the investment management agreement. Revenue is also recognized as earned for providing custodial services, sub-advisory services to the Fund and other services performed by the Company’s non-investment business.
Equity-Based Compensation
The Company recognizes compensation expense for all share-based payment awards made to employees. Equity-based compensation expense is measured at the grant date based on the fair value of the award and is recognized as expense on a straight-line basis over the requisite service period, which is generally the vesting period. Judgments and estimates are made regarding, among other things, the appropriate valuation methodology to follow in valuing equity-based compensation awards and the related inputs required by those valuation methodologies.
Income Taxes
The Company is comprised of entities that have elected to be treated as either an “S-Corporation”, a limited liability company (LLC), or a “C-Corporation”. As such, the entities functioning as S-corporations or LLCs are not liable for federal (and most state) income taxes on their earnings; as such earnings will be included in the personal income tax returns of each entity’s shareholders and unit holders. The entity functioning as a “C-Corporation” is liable for federal and state income taxes on its earnings.
Deferred taxes are provided on a liability method whereby deferred tax assets are recognized for deductible temporary differences and deferred tax liabilities are recognized for taxable temporary differences. Deferred tax assets are reduced by a valuation allowance when, in the opinion of management, it is more likely than not that some portion or all of the deferred tax assets will not be realized.
Comprehensive Income
Comprehensive income includes net income and other comprehensive income. Other comprehensive income consists of the change in unrealized gains on available-for-sale investments. The changes in the balances of components comprising other comprehensive income are presented in the following table:
| March 31, | ||||||||
| 2010 | 2011 | |||||||
| Net income |
$ | 9,728 | $ | 23,660 | ||||
| Unrealized gain on marketable securities |
70 | 361 | ||||||
| Comprehensive income |
$ | 9,798 | $ | 24,021 | ||||
Recent Accounting Pronouncements
In June 2011, the Financial Accounting Standards Board (“FASB”) issued Accounting Standards Update (“ASU”) 2011-05, Presentation of Comprehensive Income (Topic 220). This standard eliminates the current option to report other comprehensive income and its components in the statement of changes in equity. These amendments are effective for annual periods beginning after December 15, 2011. The Company does not expect the amendments to have a material impact on its combined consolidated financial statements and related disclosures.
In May 2011, the FASB issued ASU 2011-04, Fair Value Measurement (Topic 820): Amendments to Achieve Common Fair Value Measurement and Disclosure Requirements in U.S. GAAP and International Financial Reporting Standards. The amendments in this update change the wording used to describe the requirements in U.S. GAAP for measuring fair value and for disclosing information about fair value
F-28
Table of Contents
measurements. These amendments are effective for annual periods beginning after December 15, 2011. The Company does not expect the amendments to have a material impact on its combined consolidated financial statements and related disclosures.
In February 2010, the FASB issued ASU 2010-10, Consolidation (Topic 810): Amendments for Certain Investment Funds. The amendments to the consolidation requirements of Topic 810 are deferred for a reporting entity’s interest in an entity (1) that has all the attributes of an investment company or (2) for which it is industry practice to apply measurement principles for financial reporting purposes that are consistent with those followed by investment companies. ASU 2010-10 became effective for the Company on January 1, 2010 and there was no impact on its combined consolidated financial statements and related disclosures.
In January 2010, the FASB issued ASU 2010-06, Fair Value Measurements and Disclosures (Topic 820): Improving Disclosures above Fair Value Measurements, which requires entities to make new disclosures about recurring or nonrecurring fair-value measurements and provides clarification of existing disclosure requirements. This amendment requires separate disclosures about purchases, sales, issuances, and settlements relating to Level 3 measurements. This amendment is effective for fiscal years beginning after December 15, 2010. The adoption did not have a material impact on the Company’s combined consolidated financial statements and related disclosures.
Note 3—Investments in Marketable Securities
Investments in marketable securities are classified as available-for-sale. Marketable securities consist of short-term investments, equity securities and mutual funds, including the funds which are managed by the Company. Investments are carried at a fair value based on quoted market prices in active markets for identical instruments.
Unrealized gains (losses) on available-for-sale securities are recorded as a component of total comprehensive income (loss). Realized gains (losses) are computed on a specific identification basis and are recorded in net capital gains (losses) on investments in the combined consolidated statements of income.
Realized gains (losses) on the sale of securities and on expired options were $1 and $0 as of December 31, 2010 and March 31, 2011, respectively. The following table represents the Company’s marketable securities holdings as of December 31, 2010 and March 31, 2011:
| Cost | Unrealized Gain/Loss |
Amortized Discount/ Accrued Int. |
Estimated Fair Value |
|||||||||||||
| December 31, 2010 |
||||||||||||||||
| Short-term securities |
$ | 654 | $ | — | $ | — | $ | 654 | ||||||||
| Equity securities |
2,310 | 127 | 7 | 2,444 | ||||||||||||
| Managed mutual funds |
607 | 69 | — | 676 | ||||||||||||
| US treasury note (0.375%, 9/30/2012) |
504 | — | — | 504 | ||||||||||||
| US treasury note (1.75%, 1/31/2014) |
101 | 1 | 1 | 103 | ||||||||||||
| $ | 4,176 | $ | 197 | $ | 8 | $ | 4,381 | |||||||||
| March 31, 2011 |
||||||||||||||||
| Short-term securities |
$ | 731 | $ | — | $ | — | $ | 731 | ||||||||
| Equity securities |
2,597 | 744 | — | 3,341 | ||||||||||||
| Managed mutual funds |
610 | (186 | ) | — | 424 | |||||||||||
| US treasury note (0.375%, 9/30/2012) |
504 | — | 1 | 505 | ||||||||||||
| US treasury note (1.75%, 1/31/2014) |
101 | 1 | — | 102 | ||||||||||||
| $ | 4,543 | $ | 559 | $ | 1 | $ | 5,103 | |||||||||
F-29
Table of Contents
Note 4—Fair Value Measurements
In accordance with current accounting standards, fair value is defined as the price that the Company would receive upon selling an investment in an orderly transaction to an independent buyer in the principal or most advantageous market of the investment. A fair value hierarchy is provided that gives the highest priority to unadjusted quoted prices in active markets for identical assets and liabilities (Level 1) and the lowest priority to unobservable inputs (Level 3).
The following three-tier fair value hierarchy prioritizes the inputs used in measuring fair value:
Level 1—observable inputs such as quoted prices in active markets for identical securities;
Level 2—other significant observable inputs (including but not limited to quoted prices for similar securities, interest rates, prepayment speeds, credit risk, etc.); and
Level 3—significant unobservable inputs (including the Company’s own assumptions in determining the fair value of investments).
The following provides the hierarchy of inputs used to derive the fair value of the Company’s assets as of December 31, 2010 and March 31, 2011:
| Level 1 | Level 2 | Level 3 | Totals | |||||||||||||
| December 31, 2010 |
||||||||||||||||
| Cash and cash equivalents |
$ | 27,543 | $ | — | $ | — | $ | 27,543 | ||||||||
| Short-term securities |
654 | — | — | 654 | ||||||||||||
| Equity securities |
2,444 | — | — | 2,444 | ||||||||||||
| Managed mutual funds |
676 | — | — | 676 | ||||||||||||
| US treasury note (0.375%, 9/30/2012) |
— | 504 | — | 504 | ||||||||||||
| US treasury note (1.75%, 1/31/2014) |
— | 103 | — | 103 | ||||||||||||
| $ | 31,317 | $ | 607 | $ | — | $ | 31,924 | |||||||||
| March 31, 2011 |
||||||||||||||||
| Cash and cash equivalents |
$ | 47,759 | $ | — | $ | — | $ | 47,759 | ||||||||
| Short-term securities |
731 | — | — | 731 | ||||||||||||
| Equity securities |
3,055 | — | — | 3,055 | ||||||||||||
| Managed mutual funds |
710 | — | — | 710 | ||||||||||||
| US treasury note (0.375%, 9/30/2012) |
— | 505 | — | 505 | ||||||||||||
| US treasury note (1.75%, 1/31/2014) |
— | 102 | — | 102 | ||||||||||||
| $ | 52,255 | $ | 607 | $ | — | $ | 52,862 | |||||||||
Note 5—Accrued Expenses and Other Liabilities
Accrued expenses and other liabilities as of December 31, 2010 and March 31, 2011 consisted of the following:
| December 31, 2010 |
March 31, 2011 |
|||||||
| Accrued sales commissions |
$ | 5,518 | $ | 5,188 | ||||
| Accrued bonuses |
15,078 | 7,398 | ||||||
| Accrued sub-transfer agent fees |
5,916 | 6,625 | ||||||
| Other accruals and liabilities |
3,952 | 4,244 | ||||||
| $ | 30,464 | $ | 23,455 | |||||
F-30
Table of Contents
Note 6—Mandatory Redeemable Obligation
The Company has entered into an agreement that upon the death of the majority shareholder, the Company has a mandatory obligation to pay the majority shareholder his pro rata share of net revenue (as defined in the agreement) for the four quarters immediately preceding the holder’s death. The Company has recognized a liability for shares subject to mandatory redemption of $170.3 million and $183.6 million as of December 31, 2010 and March 31, 2011, respectively, which represents the amount that would have been paid if settlement had occurred on the respective reporting date. Changes in the liability associated with this obligation have been recorded as interest expense on shares subject to mandatory redemption in the combined consolidated statements of income.
As indicated in Note 9, the Company is a flow through entity for federal (and most state) taxes. Therefore, the interest expense resulting from the shares subject to mandatory redemption is treated as a permanent item.
Note 7—Sub-Advisory Agreements
The Company derives significant revenue from its role as sub-advisor to the Manning & Napier Fund series of mutual funds and the Exeter Trust Company Collective Investment Trust (“CIT”) investment vehicles.
Investments in the Fund amounted to approximately $0.7 million at December 31, 2010 and March 31, 2011.
Fees earned for advisory related services provided to the Fund and CIT investment vehicles were $26.8 million and $39.1 million for the three months ended March 31, 2010 and 2011, respectively which represents greater than 10% of revenue in each period.
Note 8—Equity Based Compensation
The Company measures the cost of employee services received in exchange for an award of equity instruments based on the grant-date fair value of the award and such cost is recognized over the period during which an employee is required to provide services in exchange for the award.
The Company and certain affiliates award certain employees equity shares in the Company and those affiliates. The plan entitles the participants to all of the rights and obligations of shareholders, including the right to ordinary and liquidating distributions, upon the sale of the Company. Equity ownership vests per a schedule based on the shareholder’s age and time frame of being a shareholder; however, there is accelerated full vesting in the event of a change in control of the Company. If a shareholder terminates employment prior to the sale of the Company, the Company has the option to repurchase shares from the shareholder at a pre-determined formula price based on defined criteria to be paid over the next three years. The number of shares authorized for issuance at December 31, 2010 and March 31, 2011 was 10 million shares.
The shares granted during 2010 and 2011 were valued using the fair value method of accounting, in accordance with U.S. GAAP. Accordingly, the shares granted were determined to have the following weighted average fair value per share:
| Three Months Ended March 31, | ||||||||
| 2010 | 2011 | |||||||
| Grant-date fair value per award |
$ | 27.01 | $ | 117.85 | ||||
The weighted-average fair value of the shares granted during 2010 and 2011 may not reflect actual transactions. Share-based compensation for the shares issued was estimated at the date of grant at the fair value per share less the cash consideration paid by the shareholders.
F-31
Table of Contents
The estimated compensation cost associated with the shares is being amortized as compensation expense over the required service term of 3 years. The Company recorded compensation expense of $164 and $310 during the three months ended March 31, 2010 and 2011, respectively, relating to shares issued during 2008, 2009, 2010 and 2011. Total remaining compensation cost related to the issued shares yet to be recognized is $0.4 million and $2.8 million at December 31, 2010 and March 31, 2011, respectively.
Shares are recognized on a pro-rata basis until the 3-year service requirement is met, allowing employees to begin fully participating in the benefits of share ownership. A summary of this share activity under the plan for the Company and its affiliates as of March 31, 2010 and 2011 and changes during the period then ended is presented below:
| 2010 | 2011 | |||||||||||||||
| Recognized Shares |
Unrecognized Shares |
Recognized Shares |
Unrecognized Shares |
|||||||||||||
| Outstanding at January 1 |
1,033,699 | 103,538 | 1,107,829 | 77,845 | ||||||||||||
| Granted |
— | 50,685 | — | 32,212 | ||||||||||||
| Repurchased |
— | — | — | — | ||||||||||||
| Recognized |
18,259 | (18,259 | ) | 16,445 | (16,445 | ) | ||||||||||
| Outstanding at March 31 |
1,051,958 | 135,964 | 1,124,274 | 93,612 | ||||||||||||
There were no forfeitures for the periods reported.
Note 9—Income Taxes
The Company’s effective tax rate includes a benefit attributable to the fact that the Company operates as a series of flow-through entities which are generally not subject to federal (and most state) income tax. Accordingly, a portion of the Company’s earnings are not subject to corporate level taxes. This favorable impact is partially offset by state taxes at the entity level.
The Company has adopted the authoritative guidance for accounting for the uncertainty in income taxes on January 1, 2007, and the adoption did not have an impact on the Company’s combined consolidated statements of financial condition or combined consolidated statements of income. The Company does not have a material uncertain tax position as of December 31, 2010 and March 31, 2011, respectively. If warranted, the Company will record accrued interest and penalties for uncertain tax positions as a component of the provision for income taxes.
The Company does not expect that changes in the liability for unrecognized tax benefits during the 2011 fiscal year will have a significant impact on the Company’s financial position or results of operations.
The Company files income tax returns with Federal, state and local jurisdictions. U.S. Federal and state tax returns for 2007 through 2010 are currently open for examination.
Note 10—Employee Benefit Plan
The Company offers two benefit plans across the combined consolidated companies. The Manning & Napier Advisors, Inc. 401(k) and Profit Sharing Plan (the “MNA Plan”) covers employees of MNA, AAC and ETC who meet the plan criteria. The Manning & Napier Information Services, Inc. 401(k) Plan (the “MNIS Plan”) covers employees of MNIS and PPI who meet the plan criteria.
With respect to the 401(k) portion of the MNA Plan and the MNIS Plan, participants may voluntarily contribute up to 50% of their regular salary subject to annual limitations determined by the IRS. The Company matches an amount equivalent to 50% of a participant’s contribution, not to exceed 2% of salaries paid. Matching
F-32
Table of Contents
contributions vest to the participants after three years of service. These contributions by the Company amounted to $257 and $344 for the three months ended March 31, 2010 and 2011, respectively.
With respect to the Profit Sharing portion of the MNA Plan, the Company may make annual profit sharing contributions, subject to certain limitations, which vest immediately to individuals who participate. These contributions by the Company amounted to $254 and $485 for the three months ended March 31, 2010 and 2011, respectively. The MNIS Plan does not participate in profit sharing.
Note 11—Subsequent Events
The Company made distributions of $35.8 million and $27.2 million to shareholders in April 2011 and June 2011, respectively. Contributions made by partners of the Company subsequent to the reporting date through June 2011, were $0.8 million.
F-33
Table of Contents
Through and including , 2011 (the 25th day after the date of this prospectus), all dealers effecting transactions in the registered securities offered hereby, whether or not participating in this offering, may be required to deliver a prospectus. This delivery requirement is in addition to the obligation of dealers to deliver a prospectus when acting as an underwriter and with respect to an unsold allotment or subscription.
Shares
Class A Common Stock
PROSPECTUS
BofA Merrill Lynch
, 2011
Table of Contents
PART II
INFORMATION NOT REQUIRED IN PROSPECTUS
Item 13. Other Expenses of Issuance and Distribution
The following table sets forth the costs and expenses (other than underwriting discounts and commissions) expected to be incurred by Manning & Napier, Inc. in connection with this offering described in this registration statement. All amounts shown are estimates, except the SEC registration fee, the FINRA filing fee and the exchange listing fee.
| Item |
Amount to be Paid | |||
| SEC registration fee |
$ | 29,025 | ||
| FINRA filing fee |
25,500 | |||
| Exchange listing fee |
* | |||
| Legal fees and expenses |
* | |||
| Accounting fees and expenses |
* | |||
| Printing and engraving expenses |
* | |||
| Transfer agent and registrar fees |
* | |||
| Blue sky fees and expenses |
* | |||
| Miscellaneous |
* | |||
| Total |
$ | * | ||
| * | To be provided by amendment. |
Item 14. Indemnification of Directors and Officers
Our amended and restated certificate of incorporation will limit our directors’ and officers’ liability to the fullest extent permitted under Delaware corporate law. Specifically, our directors and officers will not be liable to us or our stockholders for monetary damages for any breach of fiduciary duty by a director or officer, except for liability:
| • | for any breach of the director’s or officer’s duty of loyalty to us or our stockholders; |
| • | for acts or omissions not in good faith or which involve intentional misconduct or a knowing violation of law; |
| • | under Section 174 of the Delaware General Corporation Law; or |
| • | for any transaction from which a director or officer derives an improper personal benefit. |
If the Delaware General Corporation Law is amended to authorize corporate action further eliminating or limiting the personal liability of directors or officers, then the liability of our directors and officers shall be eliminated or limited to the fullest extent permitted by the Delaware General Corporation Law, as so amended.
The provision regarding indemnification of our directors and officers in our amended and restated certificate of incorporation will generally not limit liability under state or federal securities laws.
Delaware law and our amended and restated certificate of incorporation provide that we will, in certain situations, indemnify any person made or threatened to be made a party to a proceeding by reason of that person’s former or present official capacity with our company against judgments, penalties, fines, settlements and reasonable expenses including reasonable attorney’s fees. Any person is also entitled, subject to certain
II-1
Table of Contents
limitations, to payment or reimbursement of reasonable expenses in advance of the final disposition of the proceeding. In addition, certain employment agreements to which we are a party provide for the indemnification of our employees who are party thereto.
We also maintain a directors’ and officers’ insurance policy pursuant to which our directors and officers are insured against liability for actions taken in their capacities as directors and officers.
Item 15. Recent Sales of Unregistered Securities
Except as set forth below, in the three years preceding the filing of this Registration Statement, the Registrant has not issued any securities that were not registered under the Securities Act.
Prior to the consummation of this offering, shares of Class A common stock will be issued to M&N Group Holdings, LLC in reliance upon an exemption from the registration provisions of the Securities Act set forth in Section 4(2) thereof for transactions not involving any public offering. No underwriters were involved in the foregoing sales of securities.
Item 16. Exhibits and Financial Statement Schedules.
| (a) | Exhibits |
| Exhibit No. |
Description | |
| 1.1 | Form of Underwriting Agreement* | |
| 3.1 | Form of Amended and Restated Certificate of Incorporation of Manning & Napier, Inc.* | |
| 3.2 | Form of Amended and Restated By-Laws of Manning & Napier, Inc.* | |
| 4.1 | Form of specimen certificate representing Manning & Napier, Inc.’s Class A common stock* | |
| 4.2 | Form of specimen certificate representing Manning & Napier, Inc.’s Class B common stock* | |
| 5.1 | Opinion of Herrick, Feinstein LLP* | |
| 10.1 | Form of Amended and Restated Limited Liability Company Agreement of Manning & Napier Group, LLC* | |
| 10.2 | Form of Exchange Agreement* | |
| 10.3 | Form of Tax Receivable Agreement* | |
| 10.4 | Form of Registration Rights Agreement* | |
| 10.5 | Form of Manning & Napier, Inc. 2011 Equity Compensation Plan* | |
| 21.1 | Subsidiaries of Manning & Napier, Inc.* | |
| 23.1 | Consent of PricewaterhouseCoopers LLP | |
| 23.2 | Consent of Herrick, Feinstein LLP (to be included in Exhibit 5.1)* | |
| 24.1 | Powers of Attorney (included on the signature page hereto) |
| * | To be filed by amendment |
| (b) | Financial Statement Schedules |
All schedules are omitted since the required information is not applicable, the information is presented in the Registrant’s consolidated financial statements and the related notes thereto or is not present in amounts sufficient to require submission of the schedules.
Item 17. Undertakings
(a) The undersigned registrant hereby undertakes to provide to the underwriters at the closing specified in the underwriting agreement certificates in such denominations and registered in such names as required by the underwriters to permit prompt delivery to each purchaser.
II-2
Table of Contents
(b) Insofar as indemnification for liabilities arising under the Securities Act of 1933 may be permitted to directors, officers and controlling persons of the registrant pursuant to our amended and restated certificate of incorporation or bylaws, or otherwise, the registrant has been advised that in the opinion of the Securities and Exchange Commission such indemnification is against public policy as expressed in the Securities Act and is, therefore, unenforceable. In the event that a claim for indemnification against such liabilities (other than the payment by the registrant of expenses incurred or paid by a director, officer or controlling person of the registrant in the successful defense of any action, suit or proceeding) is asserted by such director, officer or controlling person in connection with the securities being registered, the registrant will, unless in the opinion of its counsel the matter has been settled by controlling precedent, submit to a court of appropriate jurisdiction the question whether such indemnification by it is against public policy as expressed in the Securities Act and will be governed by the final adjudication of such issue.
(c) The undersigned registrant hereby undertakes that:
(1) For purposes of determining any liability under the Securities Act of 1933, the information omitted from the form of prospectus filed as part of this registration statement in reliance upon Rule 430A and contained in a form of prospectus filed by the registrant pursuant to Rule 424(b)(1) or (4) or 497(h) under the Securities Act shall be deemed to be part of this registration statement as of the time it was declared effective; and
(2) For the purpose of determining any liability under the Securities Act of 1933, each post-effective amendment that contains a form of prospectus shall be deemed to be a new registration statement relating to the securities offered therein, and the offering of such securities at that time shall be deemed to be the initial bona fide offering thereof.
II-3
Table of Contents
SIGNATURES
Pursuant to the requirements of the Securities Act of 1933, the Registrant has duly caused this registration statement to be filed on its behalf by the undersigned, thereunto duly authorized in the City of Fairport, State of New York on July 1, 2011.
| MANNING & NAPIER, INC. | ||
| By: | /s/ Patrick Cunningham | |
| Name: Patrick Cunningham | ||
| Title: Chief Executive Officer | ||
POWER OF ATTORNEY
Each of the undersigned directors and officers of Manning & Napier, Inc. hereby constitutes and appoints Patrick Cunningham, Beth H. Galusha and Richard B. Yates, and each of them, his true and lawful attorneys-in-fact and agents with full power of substitution and resubstitution, for him and his name, place and stead, in any and all capacities, to execute any and all amendments (including post-effective amendments) to this registration statement, to sign any registration statement filed pursuant to Rule 462(b) of the Securities Act of 1933, and to cause the same to be filed with all exhibits thereto, and all documents in connection therewith, with the Securities and Exchange Commission, granting unto said attorneys-in-fact and agents, and each of them, full power and authority to do and perform each and every act and thing requisite and desirable to be done in and about the premises as fully and to all intents and purposes as the undersigned might or could do in person, hereby ratifying and confirming all acts and things that said attorneys-in-fact and agents or any of them, or their or his substitute or substitutes may lawfully do or cause to be done by virtue hereof.
Pursuant to the requirements of the Securities Act of 1933, this Registration Statement on Form S-1 has been signed by the following persons in the capacities and on the dates indicated.
| Signature |
Title |
Date | ||
| /s/ Patrick Cunningham Patrick Cunningham |
Chief Executive Officer and Director (principal executive officer) |
July 1, 2011 | ||
| /s/ Beth H. Galusha Beth H. Galusha |
Interim Chief Financial Officer (principal financial officer and principal accounting officer) |
July 1, 2011 | ||
| /s/ William Manning William Manning |
Director |
June 30, 2011 | ||
| /s/ B. Reuben Auspitz B. Reuben Auspitz |
Director |
July 1, 2011 | ||