Attached files
| file | filename |
|---|---|
| EX-32 - EXHIBIT 32 - GERBER SCIENTIFIC INC | exhibit32.htm |
| EX-31.2 - EXHIBIT 31.2 - GERBER SCIENTIFIC INC | exhibit31_2.htm |
| EX-21.1 - EXHIBIT 21.1 - GERBER SCIENTIFIC INC | exhibit21_1.htm |
| EX-23.1 - EXHIBIT 23.1 - GERBER SCIENTIFIC INC | exhibit23_1.htm |
| EX-31.1 - EXHIBIT 31.1 - GERBER SCIENTIFIC INC | exhibit31_1.htm |
| EX-10.32 - EXHIBIT 10.32 - GERBER SCIENTIFIC INC | exhibit10_32.htm |
| EX-10.17 - EXHIBIT 10.17 - GERBER SCIENTIFIC INC | exhibit10_17.htm |
| EX-10.12 - EXHIBIT 10.12 - GERBER SCIENTIFIC INC | exhibit10_12.htm |
| EX-10.26 - EXHIBIT 10.26 - GERBER SCIENTIFIC INC | exhibit10_26.htm |
| EX-10.31 - EXHIBIT 10.31 - GERBER SCIENTIFIC INC | exhibit10_31.htm |
| EX-10.16 - EXHIBIT 10.16 - GERBER SCIENTIFIC INC | exhibit10_16.htm |
| EX-10.28 - EXHIBIT 10.28 - GERBER SCIENTIFIC INC | exhibit10_28.htm |
| EX-10.30 - EXHIBIT 10.30 - GERBER SCIENTIFIC INC | exhibit10_30.htm |
|
UNITED STATES
SECURITIES AND EXCHANGE COMMISSION
Washington, D.C. 20549
|
||||
|
FORM 10-K
|
||||
|
x ANNUAL REPORT PURSUANT TO SECTION 13 OR 15(d) OF THE SECURITIES EXCHANGE ACT OF 1934
For the fiscal year ended April 30, 2011
or
¨ TRANSITION REPORT PURSUANT TO SECTION 13 OR 15(d) OF THE SECURITIES EXCHANGE ACT OF 1934
For the transition period from ___________ to ___________
Commission file number: 001-05865
|
||||
|
Gerber Scientific, Inc.
(Exact name of registrant as specified in its charter)
|
||||
|
Connecticut
(State or other jurisdiction of incorporation or organization)
|
06-0640743
(I.R.S. Employer Identification No.)
|
|||
|
24 Industrial Park Road West, Tolland, Connecticut
(Address of principal executive offices)
|
06084
(Zip Code)
|
|||
|
Registrant's telephone number, including area code: (860) 870-2890
|
||||
|
Securities registered pursuant to Section 12(b) of the Act:
|
||||
|
Title of each class
|
Name of each exchange on which registered
|
|||
|
Common Stock, par value $0.01 per share
|
New York Stock Exchange
|
|||
|
Securities registered pursuant to Section 12(g) of the Act: None
|
||||
|
Indicate by check mark if the registrant is a well-known seasoned issuer, as defined in Rule 405 of the Securities Act. Yes ¨ No þ
|
||||
|
Indicate by check mark if the registrant is not required to file reports pursuant to Section 13 or Section 15(d) of the Act. Yes ¨ No þ
|
||||
|
Indicate by check mark whether the registrant (1) has filed all reports required to be filed by Section 13 or 15(d) of the Securities Exchange Act of 1934 during the preceding 12 months (or for such shorter period that the registrant was required to file such reports), and (2) has been subject to such filing requirements for the past 90 days. Yes þ No ¨
|
||||
|
Indicate by check mark whether the registrant has submitted electronically and posted on its corporate Website, if any, every Interactive Data File required to be submitted and posted pursuant to Rule 405 of Regulation S-T during the preceding 12 months (or for such shorter period that the registrant was required to submit and post such files). Yes ¨ No ¨
|
||||
|
Indicate by check mark if disclosure of delinquent filers pursuant to Item 405 of Regulation S-K is not contained herein, and will not be contained, to the best of registrant's knowledge, in definitive proxy or information statements incorporated by reference in Part III of this Form 10-K or any amendment to this Form 10-K. þ
|
||||
|
Indicate by check mark whether the registrant is a large accelerated filer, an accelerated filer, a non-accelerated filer, or a smaller reporting company. See the definitions of "large accelerated filer," "accelerated filer" and "smaller reporting company" in Rule 12b-2 of the Exchange Act.
Large accelerated filer ¨ Accelerated filer þ Non-accelerated filer ¨ Smaller reporting company ¨
|
||||
|
Indicate by check mark whether the registrant is a shell company (as defined in Rule 12-b2 of the Act.) Yes ¨ No þ
|
||||
|
The aggregate market value of Gerber Scientific, Inc. common stock held by non-affiliates as of October 31, 2010, which was the last business day of the registrant's most recently completed second fiscal quarter, based on the reported closing price of the common stock on the New York Stock Exchange on such date, was approximately $166,307,388.
|
||||
|
25,091,778 shares of common stock of the registrant were outstanding as of May 31, 2011, exclusive of treasury shares.
|
||||
|
DOCUMENTS INCORPORATED BY REFERENCE:
|
||||
|
None.
|
||||
|
GERBER SCIENTIFIC, INC.
Index to Annual Report
on Form 10-K
Fiscal Year Ended April 30, 2011
|
||
|
PAGE
|
||
2
CAUTIONARY NOTE CONCERNING FACTORS THAT MAY INFLUENCE FUTURE RESULTS
This Annual Report on Form 10-K contains statements which, to the extent they are not statements of historical or present fact, constitute forward-looking statements within the meaning of Section 27A of the Securities Act of 1933 and Section 21E of the Securities Exchange Act of 1934. These forward-looking statements are intended to provide management's current expectations or plans for the future operating and financial performance of Gerber Scientific, Inc., based on assumptions currently believed to be reasonable. Forward-looking statements in this Annual Report on Form 10-K can be identified by the use of words such as "believe," "expect," "intend," "foresee," "may," "plan," "anticipate" and other words of similar meaning in connection with a discussion of future operating or financial performance. All forward-looking statements involve risks and uncertainties that may cause actual results to differ materially from those expressed or implied in the forward-looking statements. Some of these risks and uncertainties that could cause actual results to differ from management’s expectations are set forth in Item 1A. "Risk Factors" of this Annual Report on Form 10-K. We cannot assure that the company’s results of operations, financial condition or cash flows will not be adversely affected by one or more of these factors. Gerber Scientific, Inc. does not undertake to update any forward-looking statement made in this report or that may from time to time be made by or on behalf of the company.
3
Unless indicated, or unless the context otherwise requires, references in this report to "Gerber" mean Gerber Scientific, Inc. and its consolidated subsidiaries.
Gerber’s fiscal year ends on April 30.
AGREEMENT FOR ACQUISITION OF GERBER BY VECTOR CAPITAL CORPORATION FUNDS
On June 13, 2011, Gerber Scientific, Inc. announced that it had entered into a definitive merger agreement under which Gerber will be acquired by funds affiliated with Vector Capital Corporation, or “Vector.” Under the terms of the merger agreement, Gerber’s shareholders will receive $11.00 in cash per share of common stock, or approximately $281.8 million in total. In addition to the cash payment, each Gerber shareholder will receive for each share owned by the shareholder a non-transferable right to receive contingent cash payments at a future time if recoveries are obtained in connection with certain claims for infringement of a Gerber patent covering computerized cut to print technology.
The merger agreement permits Gerber’s Board of Directors to solicit, receive, evaluate and enter into negotiations with respect to alternative acquisition proposals through July 25, 2011. The Board of Directors, with the assistance of its advisors, will actively solicit alternative proposals during this period. There can be no assurance that this process will result in an offer for Gerber that is superior to the offer under the existing merger agreement. If there is no superior offer, the merger transaction with the Vector funds is expected to close in the second half of calendar 2011, subject to customary approvals and closing conditions. Completion of the proposed transaction will require approval by the holders of a majority of Gerber’s outstanding shares of common stock. The proposed transaction is not subject to any financing condition.
For additional information about the proposed transaction, see Note 20 of the Notes to Consolidated Financial Statements in Item 15 of this Annual Report on Form 10-K.
OVERVIEW
Gerber Scientific, Inc., through its subsidiaries, develops, manufactures, distributes and services automated equipment and software in two industries worldwide. Of its total revenue of $462.5 million for fiscal 2011, Gerber generated $266.0 million in sales of printing equipment, software and related supplies to customers in the sign making and specialty graphics industry and $196.5 million in sales of sophisticated design and cutting equipment and software to customers in the apparel and industrial markets. Gerber operates manufacturing facilities in the United States, Canada, the United Kingdom, Denmark and China and maintains global sales, distribution and service operations in over 25 countries. To maximize its geographic sales coverage, Gerber markets its products through both a direct sales force and independent sales agents located throughout all of the company's domestic and international markets. Revenue from international sales, including United States export sales, represented approximately 74 percent of total revenue for fiscal 2011. As of April 30, 2011, Gerber had approximately 1,778 employees, of whom approximately two-thirds were based outside of the United States.
Gerber's sales strategy emphasizes new product development and expansion within existing geographic markets and into new geographic markets. Gerber's product development process focuses on platform development that enables the company to leverage its product innovations with product extensions and add-ons. Gerber's long-term growth strategy features geographic expansion in areas such as Asia, particularly in China.
As part of its business strategy, Gerber continually reviews and evaluates the risks and opportunities within its existing business segments. As a result of these reviews, Gerber may acquire “bolt-on” businesses to supplement growth and product development or divest businesses that no longer fit its core long-term growth strategy due to less attractive industry fundamentals or reduced long-term returns. In accordance with this strategy, Gerber acquired Yunique Solutions, Inc., a software development company for the apparel markets, in fiscal 2010, Virtek Vision International, Inc., a manufacturer of precision laser-based templating and inspection solutions for industrial material operations, and Gamma Computer Tech Co., Ltd., a China-based manufacturer of equipment for apparel and flexible materials markets, in fiscal 2009, and Data Technology, Inc, a manufacturer of automated cutting hardware for the packaging and graphics industries, in fiscal 2008. Gerber sold the net
4
assets of its Ophthalmic Lens Processing Gerber Coburn business in the third quarter of fiscal 2011 and ceased production of its ultraviolet flatbed printers, including the Gerber CAT UV and Solara ion, in the fourth quarter of fiscal 2011. In fiscal 2010, Gerber sold four non-core businesses, including its laser marking and engraving business unit, FOBA Technology + Services GmbH, or “FOBA,” which was previously reported within the Apparel and Industrial segment. In September 2009, Gerber sold ND Graphics, a Canadian business unit of Gerber Scientific Products. Gerber also closed the majority of its Spandex Poland operations during October 2009 and, in April 2010, sold certain assets of its Spandex New Zealand and Gerber Coburn Australia businesses and subsequently ceased substantially all the operating activities related to these businesses. These actions completed important steps in the transformation of Gerber and are expected to result in a leaner, more efficient and focused company and allow Gerber to invest its resources where it perceives the best growth opportunities, primarily within the Apparel and Industrial segment.
Gerber pursues a number of initiatives intended to improve its operating efficiency and gross profit margins. The focus of this effort is consolidating and improving supplier relationships, reducing inventory, seeking low-cost sourcing opportunities for key parts and components used in the company's products, and increasing the company's offerings of higher-margin value-added products.
Gerber Scientific, Inc. was incorporated in Connecticut in 1948. The mailing address of Gerber's principal executive offices which were relocated during fiscal 2011 is 24 Industrial Park Road West, Tolland, Connecticut 06084, and its main telephone number at that address is (860) 870-2890.
The table below summarizes information about Gerber’s operating segments:
|
For the fiscal year ended April 30, 2011
|
|||||||||
|
Operating Segment
|
Principal Business Unit
|
Revenue
(in millions)
|
Percent of
Revenue
|
||||||
|
Sign Making and Specialty Graphics
|
Gerber Scientific Products and Spandex
|
$
|
266.0
|
58
|
%
|
||||
|
Apparel and Industrial
|
Gerber Technology, Virtek and Gerber Innovations
|
196.5
|
42
|
%
|
|||||
|
$
|
462.5
|
100
|
%
|
||||||
For additional financial information about Gerber's operating segments and geographic data, refer to Note 17 of the Notes to Consolidated Financial Statements set forth in Part IV, Item 15, "Exhibits, Financial Statement Schedules," of this Annual Report on Form 10-K, which is incorporated herein by reference. Certain risks, affecting Gerber's business, including risks associated with Gerber's international operations, are described in Item 1A, "Risk Factors."
Following is a summary of Gerber's segments, principal products and services.
SIGN MAKING AND SPECIALTY GRAPHICS
The Sign Making and Specialty Graphics segment consists of Gerber Scientific Products, or "GSP," and Spandex. Through GSP and Spandex, Gerber designs, manufactures, services, markets, sells and distributes printing equipment, software and aftermarket supplies to sign making and specialty graphics shops and distributors. Customers include small to medium-sized shops with annual revenues ranging from $0.2 million to $1.0 million, as well as franchise organizations such as FedEx Kinko’s, FASTSIGNS and Signs Now, graphic arts professionals, distributors, major corporations and government agencies. GSP, headquartered in Connecticut, is a manufacturer of equipment and distributor of aftermarket materials. The majority of GSP’s sales are generated through its North American distributor network and Spandex. GSP has long-standing relationships with the majority of its distributors and historically has not had any material disruption in sales operations as the result of the termination of any significant distributors. Spandex, headquartered in Belgium, distributes GSP and other products primarily to the European and Australian sign making markets and other countries through a sub-distribution network. Spandex represents many of the industry’s leading brands and serves approximately 25,000 customers.
No customer of the Sign Making and Specialty Graphics segment individually exceeded ten percent of Gerber’s consolidated sales for fiscal 2011, 2010 or 2009.
5
Principal Products and Services Portfolio
Although market demand for inkjet printers is outpacing that of thermal printers, Gerber maintains a leadership position in the thermal print market. Due to its large installed base of easy-to-use thermal printers and the outdoor durability of the signs produced, Gerber believes that there is a continuing role for thermal imaging printers and a sustainable demand for aftermarket supplies. The GERBER EDGE® FX, a thermal imaging system, is an easy-to-use solution for sign makers, screen printers and other industrial professionals seeking to quickly produce highly-customized short-run graphics. The EDGE FX uses heat and pressure to infuse durable resin pigments to more than 30 different printing material substrates, produces graphics with high-quality images, and dries instantly, with no waste, odor, harmful emissions, or need for ventilation.
Other significant products of this segment include plotters, routers and software. GSP’s plotters are used to cut signs or graphic forms from vinyl substrates. Routers are used to make 3-D cuts in other signage materials, such as wood or plastic. GSP software is used to design signs and specialty graphics, as well as to manage printing and cutting processes. Although GSP offers several proprietary software programs depending on customer needs, OMEGA™ 4.0 is GSP's design and production software and represents the most significant software product within this segment.
During April 2011, Gerber ceased manufacturing its ultraviolet, or “UV,” inkjet equipment product line, marketed under the brands of Gerber CAT and the GERBER Solara ion™. The segment will continue offering aftermarket equipment and service to its end use customers, including the GerberCAT and Solara ion cationic inks.
Sales of inkjet products, thermal imaging systems and other significant products or software did not individually exceed ten percent of Gerber’s consolidated revenue for fiscal 2011, 2010 or 2009.
This segment offers a wide range of aftermarket supplies such as color foils (which is the "ink" used in thermal printers), adhesive-backed vinyls, banner materials and inks for inkjet printers. This segment also offers a variety of durable and flexible UV curable inks for inkjet products. Aftermarket supplies sold by this segment accounted for approximately 51 percent of Gerber’s consolidated revenue for fiscal 2011, 53 percent of consolidated revenue for fiscal 2010 and 51 percent of consolidated revenue for fiscal 2009.
Raw Materials
GSP obtains critical materials from four primary suppliers and original equipment manufacturers, or "OEMs." GSP purchases cast vinyl from a supplier with which GSP has a long-standing relationship. GSP purchases color foils from a leading European supplier for a wide range of industries. Thermal transfer UV print heads and cationic inks are supplied by Japanese manufacturers. GSP does not have written supply agreements with these suppliers as of April 30, 2011.
As a distributor, Spandex purchases critical products from various suppliers, including GSP and OEMs. In some cases, Spandex uses only one source of supply for certain products. Historically, Spandex has not experienced significant difficulties in obtaining timely deliveries of these products. Increased demand or lack of availability for these products in the future could result in shipment delays that might adversely affect Spandex's business.
Should it experience delays in obtaining raw materials or products from any suppliers to this segment, Gerber believes it could develop internal or external alternatives, although it may be difficult to replace the marketing advantages of using certain supplier brands. In the near term, Gerber does not foresee any potential lack in availability or sourcing of critical products that would have a material adverse effect on this segment. Gerber maintains contingent insurance coverage in the event specified suppliers are unable to perform their obligations due to certain insured events.
Competition
GSP faces competition in sign making markets for its products, particularly with respect to the sale of aftermarket supplies. GSP principally competes on the basis of the comprehensiveness of its product line, product quality and availability, service and pricing. GSP believes it has a competitive advantage by offering its customers comprehensive engineered solutions for signage needs and advises customers on how to maximize their return on investment through the purchase of GSP products.
As an international supplier, Spandex competes with both larger and smaller companies, depending on the country and market
6
segment. Although Spandex is one of the largest international suppliers in the durable outdoor graphics marketplace, it competes in some geographic markets with companies that are considerably larger than Spandex, including PaperlinX Ltd, Antalis International and Océ N.V. In addition, demand in recent years for digital wide format inkjet and aftermarket supplies has been increasing in the markets served by Spandex, which has led to increased competition from equipment suppliers and aftermarket distributors of these products. Spandex competes on the basis of its market and technical knowledge, supplier relationships and supply chain infrastructure, and a wide array of products and support services. Most of Spandex's customers are small sign shops that find Spandex's ability to meet most of their product needs appealing. Spandex relies heavily on its ability to provide competitive product offerings from both GSP and strategic OEM providers. Some of its suppliers use distribution networks and also employ direct sales forces, which can lead to competition with Spandex's product offerings.
APPAREL AND INDUSTRIAL
The Apparel and Industrial operating segment markets its products through the Gerber Technology, or "GT," Virtek and Gerber Innovations business units. This segment develops, manufactures, distributes and services sophisticated cutting equipment, laser projection systems and software for nearly 23,000 customers in apparel and industrial markets including aerospace and packaging, as of April 30, 2011.
GT’s comprehensive suite of products can be used by its customers as integrated solutions throughout the design and manufacturing process. These products include product life cycle management and product data management software, computer aided design, or “CAD,” and computer aided manufacturing, or “CAM,” equipment and software solutions, laser projection systems for composite assembly, prefabricated construction and quality control systems, and automated equipment for the die making, short run and sample making segments of the packaging industry.
GT’s products and software offerings are designed to enhance its customers' manufacturing processes and efficiencies from design through production by reducing turnaround times, material waste and labor costs. GT offers specialized solutions to manufacturers of sewn and flexible goods for a broad range of end markets, including apparel and retail (70 percent of fiscal 2011 segment revenue), industrial and aerospace composites (16 percent of fiscal 2011 segment revenue), transportation interiors (6 percent of fiscal 2011 segment revenue), packaging (5 percent of fiscal 2011 segment revenue), and upholstered furniture (3 percent of fiscal 2011 segment revenue). Headquartered in Connecticut, GT engineers, manufactures and distributes its products throughout the Americas, Europe and the Asia-Pacific region. No customer of the Apparel and Industrial segment individually accounted for more than ten percent of Gerber’s consolidated revenue for fiscal 2011, 2010 or 2009.
In some geographic markets, GT utilizes third-party sales agents and distributors. GT maintained regional offices, agents or distributors in 129 countries as of April 30, 2011. Gerber believes that its longstanding network provides a significant benefit in certain markets, as these networks are staffed with knowledgeable individuals who speak the local language and have a thorough understanding of the local market.
The migration of apparel manufacturing to lower labor cost areas has displaced some opportunities for GT equipment sales in North America and Europe. These markets, however, continue to represent a significant recurring revenue source for GT due to the large installed base of GT's products, which require service, software subscriptions and aftermarket supplies. Demand from North America and Europe continues for apparel lifecycle design and development software and GT's industrial software and hardware solutions, including its technical textile, composite material and leather cutting systems. GT believes that the migration of flexible materials manufacturing to lower labor cost areas and the emergence of new market and supply-chain trends within the apparel industry provide GT with continuing growth opportunities, particularly in Asia. To capitalize on these trends, GT has developed a sales and service network in Asia, which included 19 sales and service centers in China as of April 30, 2011. GT expects to derive much of its future revenue growth from sales to markets in Asia, particularly China, India and Vietnam. China is GT's fastest growing market and the world's largest apparel-producing nation. Sales within greater China accounted for $27.5 million of GT's fiscal 2011 revenue, $23.4 million of GT's fiscal 2010 revenue and $18.5 million of GT’s fiscal 2009 revenue. The improved revenue performance in fiscal 2011 was primarily attributable to the strengthening Chinese economy and to the success of GT’s recently launched new products. In May 2011, GT announced its plans to relocate the manufacture of its computer-automated material spreading equipment from Denmark to China to support Gerber's ongoing commitment to deliver in-country support to its customers in China and throughout Asia Pacific and to provide its customers around the world with the competitive advantage and leverage of Gerber's global supply chain. Products scheduled for manufacture in China include GERBERspreader™ models XLs50 and XLs125, spreading tables, material feeding systems and
7
other spreading-related options.
GT’s strategy is focused on growth and investing in the business. GT has targeted specific markets and products through bolt-on acquisitions that have included Gerber’s November 2009 acquisition of Yunique Solutions, Inc., or “Yunique,” its September 2008 acquisition of Gamma Computer Tech Co., Ltd., or "Gamma," its October 2008 acquisition of Virtek Vision International, Inc., or “Virtek,” and its May 2007 acquisition of Data Technologies. Yunique, located in New York, is a software development company serving apparel and flexible materials industries and is expected to enhance Gerber’s existing product lifecycle management and product data management software offerings. Gamma, located in China, is a manufacturer of equipment for the apparel and flexible materials markets. This acquisition has expanded Gerber’s position within China and facilitates lower cost manufacturing of selected products for the apparel production segment. Virtek, located in Canada, is a manufacturer of precision laser-based templating and inspection solutions for industrial materials. Virtek serves customers in the prefabricated construction, aerospace and transportation industries worldwide. Virtek extends GT's capabilities to provide an integrated solution in industrial applications such as aerospace, transportation and other composite parts manufacturing. Data Technologies has been integrated into Gerber Innovations, and designs, manufactures, sells and services automated equipment for the die making, short run and sample making segments of the packaging industry. Gerber Innovations primarily sells directly to end-use customers.
Principal Products and Services Portfolio
GT has a wide array of product and services offerings, which include the following:
|
·
|
conceptual design, advanced CAD pattern-making, and marking and nesting software for sewn products;
|
|
·
|
pattern design digitizers and large format plotters;
|
|
·
|
CAM material spreading and single- and multi-ply cutting systems;
|
|
·
|
product lifecycle management, or "PLM," and product data management, or "PDM," software;
|
|
·
|
precision laser-based templating and inspection solutions;
|
|
·
|
cutting systems designed to produce dies boards, and samples, as well as for short-run production;
|
|
·
|
aftermarket supplies, including spare parts and consumable materials; and
|
|
·
|
product installation, customer training, technical support and comprehensive maintenance and specialized support services.
|
No single product or software offering accounted for more than ten percent of Gerber’s consolidated revenue for fiscal 2011, 2010 or 2009. As a percentage of Gerber’s consolidated revenue, GT’s service revenue represented 11 percent for fiscal 2011, 12 percent for fiscal 2010 and 12 percent for fiscal 2009.
GT’s software product lines, which are enterprise-wide applications, allow for global management of production activities and facilitate communication of measurement specifications, construction details, costing and bill of material information among apparel and other flexible materials designers, raw materials suppliers, makers of the materials and retailers. PLM software assists in accelerating the speed of products from concept to market, which is critically important in the apparel industry due to shorter fashion cycles. YuniquePLM™ is designed to accelerate products to market with configurable workflow functionality. PLM software systems reduce lead times, increase the accuracy of prototyping and improve the quality of information flow along the production cycle chain. GT's webPDM™ software solution continues to be used by several customers that are able to migrate to YuniquePLM through Yunify™, a web services-based tool that assists webPDM users to transfer their historical data and images into YuniquePLM, which offers enhanced functionality, mobility, scalability and powerful business intelligence. Other software packages offered include conceptual design software, advanced CAD pattern-making software and marker making and nesting software. Virtek offers software for the prefabricated construction industry and the aerospace composite and other assembly industries to control their projectors and assist in the projection of images and design of the manufactured components.
GT's spreading and cutting equipment is designed to reduce labor costs of previously labor-intensive functions, while minimizing material waste and assembly error. GT's line of spreaders are marketed as GERBERspreaders™ and deliver tension-free spreading of materials at speeds of up to 100 meters per minute. The XLs line of GERBERspreaders is designed for apparel manufacturers in developing markets that require effective automation solutions at affordable prices. GT's cutting systems increase operating efficiencies in soft goods manufacturing by cutting parts with a high degree of accuracy from single and multiple layers of flexible materials, such as textiles, leathers, vinyls, plastics, fiberglass and advanced composites. GT's cutting
8
systems perform faster and more efficiently and with greater precision than the traditional methods of hand-cutting or die-cutting. The GT cutters are offered in single-, medium- and high-ply models and are marketed as GERBERcutter®. GT also offers a high-ply cutting system, the XLc7000, which is specifically designed for apparel manufacturers in developing markets that require effective automation solutions at affordable prices. The Z7 GERBERcutter, targeted at automotive, industrial and composite markets, combines precision with efficiency in cutting demanding materials to tight tolerances. GT also offers the Taurus™ and Taurus X Series automated leather cutting systems with hide scanning, flaw capture and multiple nesting package capabilities. These cutters appeal to industrial customers, particularly in the transportation sector.
Customers use GT's plotters to produce accurate design prints on industrial-width paper for placement on fabric or other materials to provide information relative to cutting and downstream operations. The most recent GT plotter launched, GERBERplotter XLp, was produced in China using the supply chain resources of the recently acquired Gamma operations.
The Virtek line of products for customers in both aerospace composite and prefabricated construction industries include LPS7 laser projectors optimized for laser templating applications. Also offered by Virtek are LaserQC products that quickly perform inspection for sheet metal, gasket manufacturing and other industries producing flat parts.
Gerber Innovations designs, manufactures, sells and services automated equipment for the die making, short run and sample making segments, primarily for the packaging industry. The Gerber M Series is a cutting system designed for wide-format graphics that provides manufacturers of graphics, signs and other rigid and flexible printed media with versatile tools to cut, rout and crease a wide variety of substrates. CAD and CAM cutting systems are sold to produce dies boards and samples and for short-run production for packaging companies in the corrugated and folding carton industries. Products consist of sample making and digital die cutting systems, die tool production systems and rotary and flat rule die processing systems, which incorporate knife, laser and waterjet cutting technologies.
GT’s products and software are serviced subsequent to the initial sale through annual maintenance software and service contracts and through replenishment of consumable materials such as cutting blades and surfaces as well as spare parts. In fiscal 2010, GT launched GERBERconnect™, which allows remote monitoring of its systems at customer locations. This offering allows Gerber to proactively contact customers to take preventative maintenance steps to ensure greater uptime and operating efficiency.
Raw Materials
GT purchases materials, such as computers, computer peripherals, electronic parts and equipment, and non-electronic materials, from numerous suppliers. Many of these materials are incorporated directly into GT's manufactured products, while others require additional processing. In some cases, GT uses only one supplier for certain materials. Historically, GT has not experienced significant difficulties in timely deliveries of these materials. Increased demand or future lack of materials availability could result in production delays that might adversely affect GT's business. GT's management believes that, if required, it could establish alternative suppliers for its material requirements. In the near term, GT's management does not foresee that a potential lack of materials, components or supplies availability from any particular source would have a material adverse effect on its overall business. Gerber maintains contingent insurance coverage in the event specified suppliers are unable to perform their obligations due to certain insured events.
Competition
GT is a leading provider in each of its geographic markets of computer-controlled material spreading and cutting systems, PLM and PDM solutions and pattern-making, grading and nesting software. GT faces intense competition in each of these product lines from companies based in Europe, including Lectra, Bullmer and Optitex. GT's product range and international distribution network enables GT to support key customer accounts that shift production and sourcing activities around the world. Virtek is a leading provider for laser and templating solutions. Virtek’s primary competitor is SL Laser in Europe.
9
GENERAL BUSINESS INFORMATION
BACKLOG
Gerber's backlog of firm orders by operating segments as of April 30, 2011 and 2010 is presented in the table below. The entire backlog as of April 30, 2011 is expected to be delivered in fiscal 2012.
|
April 30,
|
||||||||
|
In thousands
|
2011
|
2010
|
||||||
|
Sign Making and Specialty Graphics
|
$
|
633
|
$
|
767
|
||||
|
Apparel and Industrial
|
27,170
|
25,886
|
||||||
|
$
|
27,803
|
$
|
26,653
|
|||||
INTELLECTUAL PROPERTY RIGHTS
Gerber's success depends, in part, on its intellectual property rights relating to its products, production processes and other operations. Gerber relies on a combination of trade secret, nondisclosure and other contractual arrangements, and patent, trademark and copyright laws, to protect its proprietary rights. Intellectual property rights may be challenged by third parties and may not exclude competitors from using the same or similar technologies, brands or works.
Gerber owns and has applications pending for a number of patents in the United States and other countries covering many of its products and systems. Gerber's existing patents expire at various dates through 2028.
The U.S. Patent and Trademark Office granted Gerber federal registrations for many of its trademarks. Federal registration of trademarks is effective for as long as Gerber continues to use the trademarks and renew their registrations. Gerber does not generally register any of its copyrights with the U.S. Copyright Office, but relies on the protection afforded to such copyrights by the U.S. Copyright Act. That law provides protection to authors of original works, whether published or unpublished, and whether registered or unregistered. Gerber enters into confidentiality agreements with its employees and some third parties and limits access to and distribution of its proprietary information.
SEASONALITY
Sign Making and Specialty Graphics sales are affected by seasonality in the sign industry, especially during the fall and spring periods in North America and Europe, when demand customarily peaks. Sales by GT are not significantly impacted by seasonality trends. Gerber typically realizes the largest portion of its annual revenue during the fourth fiscal quarter.
RESEARCH AND DEVELOPMENT
Developing new and innovative products and broadening the application of established products are important to Gerber's operating results. Research and development expenses were $16.0 million for fiscal 2011, $14.9 million for fiscal 2010 and $17.3 million for fiscal 2009. Gerber develops and designs new products to assist its customers in reducing costs and improving efficiencies to enhance and maintain their end market positions. The lower expenses in fiscal 2010 reflected the impact of workforce reductions, although the decreased expenses were partially offset by incremental development costs incurred by acquired companies.
FINANCING ACTIVITIES
Gerber has agreements with a major financial services institution, or "lessor," to assist Gerber's customers, or "lessees," in obtaining lease financing to purchase Gerber's equipment. Equipment is typically leased for periods of two to six years. The equipment sold collateralizes the lease receivables. In the event of default by the lessee, Gerber has a liability to the financial services institution under recourse provisions once the institution repossesses the equipment from the lessee and returns it to Gerber. In most cases, Gerber then can resell the equipment, the proceeds of which are expected to cover a majority of the liability to the financial services institution. As of April 30, 2011, the amount of lease receivables financed under these agreements between the external financial services institution and the lessees was $1.2 million. Gerber's net exposure related to recourse provisions under these agreements was approximately $0.7 million.
10
GOVERNMENT REGULATION
None of Gerber's principal businesses are directly subject to government regulation that is material to that business.
WEBSITES AND ADDITIONAL INFORMATION
Gerber maintains a website at www.gerberscientific.com. Gerber provides access on its website, free of charge, to its Annual Reports on Form 10-K, Quarterly Reports on Form 10-Q, Current Reports on Form 8-K and any amendments to these reports filed with, or furnished to, the SEC, in accordance with Sections 13(a) or 15(d) of the Securities Exchange Act of 1934, as soon as reasonably practicable after the reports are electronically filed with or furnished to the SEC. The contents of Gerber's website are not a part of this Annual Report on Form 10-K. In addition, the SEC maintains a website, www.sec.gov, which contains reports, proxy and information statements, and other information filed by Gerber electronically. The public may read and copy any materials that Gerber files with the SEC at the SEC's Public Reference Room at 100 F Street, NE, Washington, D.C. 20549. The public may obtain information on the operation of the Public Reference Room by calling the SEC at 1-800-SEC-0330.
In addition to the other information set forth in this Annual Report on Form 10-K, you should carefully consider the following factors, which could materially affect our business, financial condition or future results. The risks described below are not the only risks facing our company. Additional risks and uncertainties not currently known to us or that we currently deem to be immaterial also may materially adversely affect our business, financial condition or results of operations.
Company-Wide Risks
There are risks and uncertainties associated with Gerber’s proposed merger with an affiliate of Vector.
On June 10, 2011, Gerber entered into a merger agreement providing for the acquisition of Gerber Scientific, Inc. by Vector Knife Holdings (Cayman), Ltd. (“Parent”), a controlled affiliate of Vector Capital Corporation. Pursuant to the merger agreement, Knife Merger Sub, Inc., a wholly owned subsidiary of Parent will merge with and into Gerber Scientific, Inc., with Gerber Scientific, Inc. surviving the merger as a wholly owned subsidiary of Parent. There are a number of risks and uncertainties relating to the merger. For example, the merger may not be consummated or may not be consummated in the timeframe or manner currently anticipated, as a result of several factors, including, among other things, the failure of one or more of the merger agreement’s closing conditions, Parent’s failure to obtain sufficient financing to complete the merger, or litigation relating to the merger. In addition, there can be no assurance that approval of Gerber’s shareholders or relevant regulators will be obtained, that the other conditions to closing of the merger will be satisfied or waived or that other events will not intervene to delay or result in the termination of the merger. If the merger is not completed, the price of Gerber’s common stock may change to the extent that the current market price of Gerber’s common stock reflects an assumption that the merger will be consummated. Pending the closing of the merger, the merger agreement also restricts Gerber from engaging in certain actions without Parent’s consent, which could prevent Gerber from pursuing opportunities that may arise prior to the closing of the Merger. Any delay in closing or a failure to close could have a negative impact on Gerber’s business and stock price as well as Gerber’s relationships with customers, vendors or employees, as well as a negative impact on Gerber’s ability to pursue alternative strategic transactions and/or Gerber’s ability to implement alternative business plans. In addition, if the merger agreement is terminated under certain circumstances, Gerber is required to pay a termination fee of up to $7.89 million (or $5.35 million, in the event Gerber terminates the merger agreement to enter into a definitive agreement concerning a superior proposal with an excluded party) and reimburse Parent for certain expenses up to $1.69 million if Gerber is obligated to pay the higher termination fee.
Gerber’s business could be adversely impacted as a result of uncertainty related to the merger.
The proposed merger with a controlled affiliate of Vector could cause disruptions to Gerber’s business or business relationships, which could have an adverse impact on Gerber’s financial condition, results of operations and cash flows. For example:
11
|
·
|
the attention of Gerber’s management may be directed to transaction-related considerations (including the solicitation of alternative acquisition proposals as permitted under the “go-shop” clause of the merger agreement) and may be diverted from the day-to-day operations of Gerber’s business;
|
|
·
|
Gerber’s employees may experience uncertainty about their future roles with Gerber, which might adversely affect Gerber’s ability to retain and hire key personnel and other employees; and
|
|
·
|
vendors or other parties with which Gerber maintains business relationships may experience uncertainty about Gerber’s future and seek alternative relationships with third parties or seek to alter their business relationships with Gerber.
|
In addition, Gerber has incurred, and will continue to incur, significant costs, expenses and fees for professional services and other transaction costs in connection with the merger, and many of these fees and costs are payable by Gerber regardless of whether or not the merger is consummated.
If Gerber is unable to continue to develop and commercialize new technologies and products, it may experience a decrease in demand for its products or its products could become obsolete.
Gerber believes that its ability to develop or acquire new technologies is crucial to the company's success. Gerber may not be successful in enhancing existing products or developing or acquiring new products and technologies that will achieve desired or expected levels of market acceptance. New products may require incremental start-up costs associated with new product launches. In addition, new products must respond to technological changes and evolving industry standards. Gerber's operating results could be adversely affected if it is unable, for technological or other reasons, to develop and introduce new products in a timely manner in response to changing market conditions or customer requirements, or if it introduces products late to the market, thereby resulting in missed opportunities in dynamic, fast-moving markets or resulting in a failure to achieve market acceptance.
Any failure by Gerber to manage adequately its future new product introductions could adversely affect Gerber's sales of existing products. As new or enhanced products are introduced, Gerber must successfully manage the transition from older products to minimize disruption in customers' ordering patterns, avoid excessive levels of older product inventories and ensure that sufficient supplies of new products can be delivered to meet customers' demands.
Gerber's businesses could suffer as a result of manufacturers' or suppliers' inability or unwillingness to supply Gerber with systems, parts or aftermarket supplies on time and to specifications.
Gerber relies upon domestic and international manufacturers and suppliers for certain hardware and aftermarket supplies, which are manufactured to Gerber's specifications. The inability or unwillingness of a manufacturer or supplier to ship such products in a timely manner or to meet quality standards could cause Gerber to miss customers' delivery date requirements for those products, which could result in the cancellation of orders, refusal to accept deliveries, lost customers, product returns or voluntary reductions in purchase prices. Any one of those consequences could have an adverse effect on Gerber's operating results and financial condition.
Gerber continually engages in the development of new and enhanced products in an effort to develop incremental sales and improve gross margins. The industries in which Gerber operates are highly competitive and subject to significant and rapid technological change. In some periods, Gerber's revenue growth depends on outsourcing arrangements with OEMs to augment its product lines. If OEMs are not able to supply products reliably, in a timely manner, or at a competitive cost, Gerber's business may suffer.
Gerber may not benefit from its acquisition strategy.
As part of Gerber's business strategy, management regularly evaluates opportunities to supplement its internal growth by pursuing targeted acquisitions of other businesses. Gerber may not be successful in identifying and consummating acquisitions or in integrating newly acquired businesses into Gerber's operations. The evaluation of business acquisition opportunities and the integration of acquired businesses pose a number of significant risks, including the following:
12
|
·
|
the pursuit of ultimately unconsummated acquisitions and the integration of acquired businesses could significantly strain management, financial and other resources and divert limited resources from regular operations;
|
|
·
|
Gerber may not be able to achieve the synergies and cost savings anticipated to result from any acquisition;
|
|
·
|
Gerber's operating and financial systems and controls and information services may not be compatible with those of acquired companies or adequate to support integration efforts, and any steps taken to improve these systems and controls may not be sufficient;
|
|
·
|
acquisitions could increase Gerber's need for qualified personnel, who may not be available; and
|
|
·
|
acquired businesses may have unexpected liabilities and contingencies, which could be significant.
|
Gerber's ability to engage in acquisitions will depend in part on its ability to raise capital, and Gerber may not be able to obtain acquisition financing on satisfactory terms, if at all. Gerber's acquisition strategy also may be constrained by the limited availability of candidates that satisfy Gerber's acquisition criteria.
Gerber is subject to currency risks, geopolitical risks and other risks of conducting international operations.
Gerber's international sales, including United States export sales, represented approximately 74 percent of the company’s consolidated revenue for fiscal 2011. Gerber expects that revenue from international markets will continue to represent a significant portion of total revenue and therefore the company will continue to face risks associated with international operations.
Gerber's export sales are normally transacted in United States dollars, although in some markets, principally Western Europe, sales prices are denominated in local currencies. An increase in the value of the United States dollar relative to foreign currencies could make Gerber's products more expensive and, therefore, potentially less competitive in foreign markets. For international sales and expenditures denominated in foreign currencies, Gerber is subject to risks associated with currency fluctuations.
Some of the additional risks associated with Gerber's international operations include:
|
·
|
general geopolitical risks, such as political and economic instability and changes in diplomatic and trade relationships;
|
|
·
|
imposition of or increases in currency exchange controls;
|
|
·
|
potential inflation in the applicable foreign economies;
|
|
·
|
imposition of or increases in import duties and other tariffs on products; and
|
|
·
|
imposition of or increases in foreign taxation of earnings and withholding on payments received from subsidiaries.
|
The potential impact of the foregoing risks could be heightened by Gerber's strategy in recent years to expand its international market share and decrease costs by strengthening Gerber's international distribution network, sourcing materials locally and pursuing opportunities to locate its production facilities closer to end-use customers in international markets.
Gerber’s debt and interest payment obligations may limit its ability to compete and expose it to interest rate risk to the extent of its variable-rate debt.
As of April 30, 2011, Gerber had a total of $21.1 million of indebtedness outstanding under its $75 million senior secured revolving credit facility. This indebtedness and Gerber’s future indebtedness may have important consequences. For example, it may:
|
·
|
make it more difficult for Gerber to satisfy its financial obligations;
|
|
·
|
require Gerber to dedicate a substantial portion of its cash flow from operations to payments on its indebtedness;
|
|
·
|
limit Gerber’s ability to react to changes to the economy or in its business or industry; and
|
|
·
|
place Gerber at a competitive disadvantage relative to companies that have less indebtedness.
|
13
Because borrowings under Gerber’s revolving credit facility accrue interest at variable rates, Gerber’s interest expense could increase if interest rates increase and it is not able to manage its related exposure through derivative financial instruments.
Gerber may be unable to comply with the financial covenants in its credit agreement unless it continues to generate sufficient operating cash flows.
Gerber’s ability to comply with the financial covenants under the credit agreement for its $75 million senior secured revolving credit facility depends primarily on its ability to generate sufficient operating cash flows. Under its credit agreement, Gerber is subject to a maximum funded debt to consolidated EBITDA ratio, a minimum interest coverage ratio, a maximum capital expenditures covenant and a minimum asset coverage covenant, all as defined for purposes of the credit agreement. Industry conditions and financial, business and other factors, including those Gerber identifies as risk factors in this report, will affect its ability to generate the cash flows it needs to comply with those financial covenants. Gerber’s failure to comply with the covenants could result in a default and acceleration of repayment of the indebtedness under its revolving credit facility. The credit agreement contains subjective acceleration clauses under which, upon the occurrence of a change in Gerber's financial condition, business or operations considered by the lenders to be materially adverse to Gerber, the lenders may cause amounts due under the agreement to become immediately due and payable. If the maturity of Gerber’s indebtedness were accelerated, it may not have sufficient funds to pay such indebtedness. In such an event, Gerber’s lenders would be entitled to proceed against the collateral securing the indebtedness, which includes substantially all of Gerber’s assets, to the extent permitted by the credit agreement and applicable law.
Covenants under Gerber’s credit agreement may restrict its future operations.
Gerber’s senior secured revolving credit facility agreement imposes operating and financial restrictions that limit Gerber’s discretion on some business matters, which could make it more difficult for Gerber to expand, finance its operations, pursue its acquisition strategy, and engage in other business activities that may be in its interest. These restrictions, which include compliance with financial covenants as discussed above, limit the ability of Gerber and its subsidiaries to:
|
·
|
incur additional indebtedness, create liens and make investments;
|
|
·
|
pay dividends on or redeem or repurchase capital stock, and issue or sell stock of subsidiaries; and
|
|
·
|
engage in sale-leaseback transactions, sell assets and engage in mergers, sales, acquisitions and consolidations.
|
Gerber may incur indebtedness in addition to the foregoing indebtedness. Any additional indebtedness it may incur in the future could subject Gerber to similar or even more restrictive conditions.
If Gerber is unable to raise additional capital, its ability to expand its business and to meet its obligations may be limited.
The development and expansion of Gerber’s business will require substantial investment. If Gerber chooses to accelerate the expansion of its business or undertake significant acquisitions of other businesses, Gerber may require additional capital. If Gerber cannot obtain additional equity or debt financing for such purposes on acceptable terms, the company could be at a competitive disadvantage relative to competitors with significant capital or the ability to raise significant capital for expansion. The terms of any financing Gerber does obtain will be restricted by the terms of its existing debt agreement and may be burdensome to the company.
Credit market risk could adversely affect Gerber's investments, Gerber's ability to raise additional capital and the ability of its customers and suppliers to obtain financing needed to transact business with Gerber.
Distress in credit and financial markets has reduced liquidity and credit availability and increased volatility in prices of securities. Credit market risk could also adversely impact the performance of investments in Gerber's pension plans, resulting in unrealized temporary losses, realized losses, other-than-temporary impairment charges or a decline in the funded status of the pension plan. Investments subject to credit market risk as of April 30, 2011 include investments held on behalf of Gerber's nonqualified supplemental pension plan in a rabbi trust and within the Gerber Scientific, Inc. and Participating Subsidiaries Pension Plan.
Credit market risk could negatively impact Gerber's lenders' ability and willingness to fund the committed amount under its revolving credit facility. In addition, Gerber’s ability to access the debt and equity markets may be restricted at a time when it would like, or need, to access such markets, which could have an adverse effect on Gerber’s flexibility to react to changing economic and business conditions. The disruptions in the financial markets have had, and may continue to have, an adverse
14
effect on the market value of Gerber’s common stock, which could make it more difficult or costly for the company to raise capital through an offering of its equity securities.
Credit market risk could negatively impact customers' ability to obtain external financing to purchase Gerber's products and suppliers' ability to deliver goods to Gerber in accordance with their commitments.
Unforeseen environmental costs may adversely affect Gerber's future earnings.
Gerber operates and competes on a global basis and must conform to applicable environmental, health and safety, or "EH&S," laws and regulations wherever the company operates, and in some cases, wherever its products are sold. If Gerber fails to comply with any present or future EH&S laws or regulations, it could incur liabilities, including monetary, civil and criminal penalties and liabilities resulting from the suspension of sales of noncompliant products.
EH&S laws and regulations, which generally affect Gerber's manufacturing and warehousing operations, regulate the storage, use, discharge and disposal of chemicals employed in manufacturing products. New and emerging EH&S legislation is aimed at regulating the chemical composition of finished products and establishing requirements for the end-of-life collection, recovery, reuse, recycling, treatment and environmentally sound disposal of the products themselves. Such legislation has recently gone into effect within the European Union and similar legislation for China. As these new EH&S laws and regulations emerge across the global community, it can be difficult to assess how they will be interpreted, implemented and enforced by regulators within the various countries and jurisdictions, and to predict the potential costs of noncompliance.
Uncertainty continues to exist with respect to some effective European Union legislation. One European Union directive restricts the use of certain hazardous substances in some electrical and electronic equipment, while another directive mandates requirements in the collection, reuse, recycling, treatment and environmentally sound disposal of certain electrical and electronic equipment at the end of its useful life. If alleged to be in noncompliance with this or other European Union directives affecting finished products, Gerber could be required to pay significant legal fees in defense of its positions and, if unsuccessful, could be required to suspend sales of noncompliant products within the relevant European Union member states. The suspension of product sales could cause the breach of contractual obligations and result in Gerber being directly or indirectly liable for costs, penalties or third-party claims. A sustained finding of noncompliance could additionally require Gerber to incur significant expenses associated with the redesign or reengineering of products or manufacturing processes, or incur expenses associated with the possible recall of any noncompliant product or the management of historical waste products.
Gerber may not effectively protect its intellectual property.
Gerber's operational and legal controls to help to secure its intellectual property may not prove to be effective in all circumstances. Gerber may not be able to protect key intellectual property, particularly in some international markets in which it operates. Because certain of Gerber's manufacturing operations are located outside of the United States, some of Gerber's patented products may be reverse-engineered and rebuilt by a local competitor. In some countries, such as China, Gerber's intellectual property rights may not be legally protected.
Gerber's businesses are subject to fluctuations in operating results due to general economic conditions, specific economic conditions in the industries in which Gerber operates and other external forces.
Gerber's businesses and operations are subject to the following factors, among others:
|
·
|
changes in general economic conditions and specific conditions in industries in which Gerber's businesses operate that can result in the deferral or reduction of purchases by end-use customers;
|
|
·
|
changes in the level of global corporate spending on technologies due to such economic conditions;
|
|
·
|
the effects of terrorist activity and international conflicts, which could lead to business interruptions;
|
|
·
|
the size and timing of significant orders, which can be non-recurring;
|
|
·
|
product configuration and mix;
|
|
·
|
market acceptance of new products and product enhancements;
|
|
·
|
announcements, introductions and transitions of new products by Gerber or Gerber's competitors;
|
|
·
|
deferrals of customer orders in anticipation of new products or product enhancements introduced by Gerber or Gerber's competitors;
|
15
|
·
|
changes in pricing in response to competitive pricing actions;
|
|
·
|
supply constraints;
|
|
·
|
the level of expenditures on research and development and sales and marketing programs;
|
|
·
|
Gerber's ability to achieve targeted cost reductions;
|
|
·
|
rising interest rates; and
|
|
·
|
costs associated with excess capacity or idle facilities.
|
From time to time, markets for one or more of Gerber's main products may be affected by falling prices, unstable exchange rates, weaker global demand and shifting production bases. During those periods, Gerber's ability to achieve and sustain profitability may depend to a significant degree on its ability to reduce costs (including the costs of sourced materials), manage the supply chain, increase productivity levels, reposition the company within higher value-added market segments, and establish a production presence in geographic areas outside the United States. Gerber's actions in this regard may be inadequate to offset the adverse effects of the foregoing market conditions.
Fluctuations in costs of purchased finished goods, components and aftermarket supplies could negatively affect Gerber's operating results.
Gerber depends on finished equipment, component parts and other materials from suppliers to manufacture and distribute the systems sold by the company. Gerber also relies on suppliers to furnish its business units with aftermarket supplies. Fluctuations in the prices of all such goods, whether caused by market demand, shortages, currency exchange rates, or other factors, could adversely affect the cost basis for the production, delivery or maintenance of Gerber's products and adversely affect its results of operations, financial condition and cash flows.
Any inability of Gerber's principal business units to compete effectively would harm Gerber's operating performance and prospects.
Competition has intensified in recent years within each market segment in which Gerber operates. If Gerber's business units are unable to continue to implement their strategies to lower costs, enhance the rate of product development, stimulate revenue growth, expand the geographic reach of their operations and leverage their brand names and distribution networks, Gerber may experience a decline in operating results and a deterioration in its financial condition and cash flows.
Any significant impairment of Gerber's goodwill would lead to a decrease in Gerber's assets and reduction in Gerber's net operating performance.
Approximately 19 percent of Gerber's total assets consisted of goodwill as of April 30, 2011. If Gerber makes changes in its business strategy or if market or other conditions adversely affect its business operations, Gerber may be required to record an impairment charge, which would lead to decreased assets and reduced net operating performance. During fiscal 2011, Gerber recorded two goodwill impairment charges as a result of a decrease in fair value of both its Ophthalmic Lens Processing reporting unit and its Gerber Scientific Products reporting unit, which resulted in a combined expense of $22.8 million. Gerber tests goodwill for impairment annually or whenever events or changes in circumstances indicate impairment may have occurred. If the testing performed indicates that impairment has occurred, Gerber would record an impairment charge for the difference between the carrying value of goodwill and the implied fair value of goodwill in the period the determination is made. The testing of goodwill for impairment requires Gerber to make various assumptions, including significant estimates about its future performance and cash flows. These estimates can be affected by numerous factors, including changes in economic, industry or market conditions, changes in underlying business operations and their future operating performance, existing or new product market acceptance, changes in competition or changes in technologies. Changes in key assumptions about Gerber's business or actual performance compared with those assumptions and Gerber's future prospects or other assumptions could affect the fair value of one or more reporting units, which may result in an impairment charge.
Any significant impairment of Gerber's ability to realize its U.S. deferred tax assets would result in a decrease in Gerber's assets and reduction in Gerber's net income.
As of April 30, 2011, Gerber had net deferred tax assets of approximately $48.6 million, of which approximately $42.0 million relate to the United States. These assets consist of tax credit carryforwards and other book-tax differences which are expected
16
to provide tax benefit to Gerber in the future. As of April 30, 2011, Gerber expected that the recorded net deferred tax assets are fully recoverable. If Gerber’s future U.S. taxable income were to decline due to changes in business strategy, or if market or other conditions adversely affect its business operations, Gerber may be required to record a valuation allowance, which would lead to decreased assets and reduced net income. Gerber continually monitors the ability to realize all deferred tax assets and will continue to do so in future periods. If Gerber were to determine that impairment of the ability to realize any deferred tax assets has occurred, Gerber would record a valuation allowance for the carrying value of those deferred tax assets in the period the determination is made. The testing of Gerber’s ability to realize deferred tax assets requires Gerber to make various assumptions, including significant estimates about its future performance and cash flows. These estimates can be affected by numerous factors, including changes in economic, industry or market conditions, future legislative and regulatory changes, changes in underlying business operations and their future operating performance, existing or new product market acceptance, changes in competition or changes in technologies. Changes in key assumptions about Gerber's business or actual performance compared with those assumptions and Gerber's future prospects or other assumptions could affect the fair value of one or more reporting units, which may result in recording a valuation allowance.
Risks Relating to Gerber's Sign Making and Specialty Graphics Segment
GSP has a significant customer base utilizing products that are no longer manufactured at GSP. GSP must continue to support its customer base or risk increased warranty and service costs.
Gerber’s ability to service its Solara ion and Gerber CAT UV inkjet printers and effectively minimize related warranty and service costs is subject to several market, product and customer risk factors. These factors include how customers care for and maintain the machine and its operating environment, the life of the machine’s print heads and the effectiveness of cationic ink in inkjet applications. Such factors could potentially lead to additional warranty and service costs.
If aftermarket suppliers decide to sell to its customers directly, Gerber's operating results would be adversely affected.
Most aftermarket products are supplied by large industry suppliers on an OEM basis. Although Gerber believes there are alternative sources of supply, GSP and Spandex would compete with its current suppliers if current suppliers decided to sell directly to Gerber's customers, which could adversely affect this segment's operations.
The non-renewal of annual distribution agreements or competition by any of GSP's key United States distributors with GSP could adversely affect GSP's operating results.
GSP derives a significant percentage of its revenue from its principal United States distributors. GSP's results could be negatively affected by the non-renewal of some of its distribution agreements with these distributors and by any action by the distributors to compete directly.
If Gerber does not identify, distribute and adequately service the products sought by its end-use customers and distributors, its market position and operating results may suffer.
The Sign Making and Specialty Graphics segment must respond to the evolving product needs of its end-use customers. A failure to meet customer requirements could negatively affect this segment's market position and operating results. This segment must also ensure that the products are operating correctly and that sales personnel and technicians are properly trained regarding the capabilities and calibration of new products. The increased pace of technological advances and the proliferation of new products due to low industry barriers to entry has caused end-use customers to become increasingly dependent on Gerber's business units to maintain their expertise and perform these functions. This segment’s revenue could suffer if it does not manage relationships with equipment and aftermarket suppliers in a manner that ensures that its end-use customers are satisfied with the services the segment’s businesses provide.
Risks Relating to Gerber's Apparel and Industrial Segment
The demand for GT's products can exhibit significant short-term fluctuations due to the sensitivity of its markets to general economic conditions.
Demand for products in apparel, textile, furniture and transportation industries, particularly in the United States, Europe, China
17
and Japan, is significantly influenced by external economic factors, conditions and levels of capital investment. In addition, the retail apparel industry is highly focused on inventory management. As a result, GT's business sales volumes can be impacted by significant swings in demand within short time periods.
GT may face increased competition from manufacturers of low-end products, which could lead to loss of market share and increased pricing pressure.
A failure by GT to respond effectively to increased competition in the sales of low-end products, which may require GT to reduce its production costs, could result in a loss of market share, increased pressure on prices and a reduction in profit margins. The demand for low-end products, particularly CAD systems, has been increasing in growth markets such as China, India and Eastern Europe. Although many of these products have been acquired from local distributors, which minimize shipping costs, import duties and import licensing costs, there is risk that these products could be acquired from regional distributors. Further, the introduction by competitors of spreaders and plotters in some developing countries could also result in more intense competition in markets that are expected to provide significant growth opportunities for GT.
None.
As of April 30, 2011, Gerber maintained facilities at the following locations:
|
Type of Facility
|
Location
|
Square Feet
|
|
|
Corporate headquarters / manufacturing / office (L) (1,2)
|
Tolland, Connecticut
|
237,400
|
|
|
Manufacturing / office (O) (1,4)
|
South Windsor, Connecticut
|
194,000
|
|
|
Manufacturing / office (L) (3)
|
South Windsor, Connecticut
|
60,000
|
|
|
Manufacturing / warehouse / office (L) (1,2)
|
Manchester, Connecticut
|
93,500
|
|
|
Manufacturing / office (O) (1)
|
Lancaster, England
|
125,000
|
|
|
Manufacturing / office (L) (2)
|
Ikast, Denmark
|
39,000
|
|
|
Manufacturing / office (O) (1)
|
Achern, Germany
|
56,000
|
|
|
Warehouse / sales and service office (L) (1,3)
|
Bristol, England
|
110,000
|
|
|
Manufacturing / warehouses / sales and service offices (L) (1,2,3)
|
Various
|
500,000
|
|
|
(O)
|
Company-owned
|
||
|
(L)
|
Leased
|
||
|
(1)
|
Sign Making and Specialty Graphics
|
||
|
(2)
|
Apparel and Industrial
|
||
|
(3)
|
As of April 30, 2011, Gerber sublet 60,000 square feet in South Windsor, Connecticut, 48,000 square feet in Bristol, England and 35,145 square feet in Toronto, Canada to independent third parties pursuant to subleases expiring over various periods.
|
||
|
(4)
|
Classified as held for sale as of April 30, 2011. The facility was sold in May 2011.
|
||
Management believes that Gerber's facilities, which are utilized primarily on a single-shift basis with overtime, are adequate to meet Gerber's current requirements. In general, Gerber uses short-term leases to rent warehouse, sales and service office space. Corporate headquarters are rented under longer-term leases. Facility lease costs totaled $8.1 million in fiscal 2011. Gerber owns most machinery and equipment used in its operations and leases the remainder. In fiscal 2011, machinery and equipment lease payments totaled $3.9 million. For additional information about Gerber's leases, see Note 18 of the Notes to Consolidated Financial Statements in Item 15 of this Annual Report on Form 10-K.
18
Gerber is subject to governmental audits and proceedings and various claims and litigation relating to matters incidental to its business. While the outcome of current pending matters cannot be predicted definitively, management has reviewed such matters and claims and consulted with Gerber's internal and external counsel and, after considering any applicable insurance coverage, does not believe that the ultimate resolution of any current pending claims or litigation will have a material adverse impact on Gerber's consolidated financial position, results of operations, cash flows, liquidity or competitive position.
Gerber is presently prosecuting an action for infringement of U.S. Patent 5,537,135 (a computerized “print to cut” technology patent) in Hartford, Connecticut Federal District Court against Roland DG Corporation, Hamamatsu, Japan and Roland DGA Corporation, Los Angeles, California, the distribution and sales arm of Roland DG Corporation. Geber is seeking damages and an injunction against Roland's sale of infringing products. The law suit is currently scheduled for trial in June 2012. There can be no assurance that this action or future actions relating to the patent will result in damage awards or licenses.
The following table presents, as of May 31, 2011, certain information below about each of Gerber Scientific, Inc.'s executive officers and certain key employees over the past five years, including positions held with other companies and with subsidiaries of Gerber Scientific, Inc. All officers are appointed by, and serve at the discretion of, the Board of Directors.
|
Name
|
Age
|
Position and Date of Initial Appointment
|
Principal Business Experience Since April 2006
|
|
Marc T. Giles
|
55
|
President and Chief Executive Officer (November 29, 2001); President, Gerber Technology (May 1, 2011)
|
---
|
|
Michael R. Elia
|
52
|
Executive Vice President, Chief Financial Officer (April 15, 2008) and Chief Accounting Officer (January 29, 2010)
|
Chief Financial Officer, Risk Management Solutions, Inc. (January 2008 – April 2008), a specialty service provider for the insured and alternative risk marketplace; Senior Vice President and Chief Financial Officer of FastenTech, Inc. (January 2004 - December 2007), a global metal products manufacturer
|
|
James S. Arthurs
|
67
|
Senior Vice President (September 30, 2002); Chairman, Gerber Scientific Asia-Pacific (January 1, 2011)
|
President Asia-Pacific, Gerber Scientific, Inc. (February 1, 2005 – December 31, 2010)
|
|
Patricia L. Burmahl
|
49
|
Senior Vice President, Global Human Resources (May 3, 2010)
|
Vice President, Worldwide Development HR, Pfizer Inc. (March 2007 – September 2008), a research-based pharmaceutical company; Vice President, Worldwide Research HR, Pfizer Inc. (January 2004 – February 2007)
|
|
Thomas P. Finn
|
51
|
President, Asia Pacific (January 1, 2011); Senior Vice President, Operations (February 15, 2010)
|
Executive VP, Operations Restructuring, Medis Technologies, Inc (January 2009 – May 2009), a fuel cell technology company; Independent Consultant, (January 2007 – January 2010); VP Supply Chain and Chief Supply Chain Officer – Asia Pacific & China, Lucent Technologies, Inc. (March 2000 – December 2006), a manufacturer of telecommunications equipment
|
|
William V. Grickis, Jr.
|
60
|
Senior Vice President and General Counsel (October 1, 2003); Secretary (November 20, 2003)
|
---
|
|
Rodney W. Larson
|
53
|
Senior Vice President (May 1, 2007); President, Spandex (July 1, 2007)
|
President, Gerber Coburn (March 2006 – July 2007); Independent Consultant (2005 – April 2007)
|
19
Market Information
Gerber's common stock is listed on the New York Stock Exchange, or "NYSE," under the symbol "GRB." The following table provides information about the range of reported sale prices of Gerber's common stock on the NYSE for each fiscal quarter during the last two fiscal years, as reported by the NYSE.
|
High
|
Low
|
Close
|
||||||||||
|
Fiscal 2011
|
||||||||||||
|
First Quarter
|
$
|
7.68
|
$
|
5.00
|
$
|
5.74
|
||||||
|
Second Quarter
|
$
|
7.09
|
$
|
4.64
|
$
|
6.69
|
||||||
|
Third Quarter
|
$
|
9.25
|
$
|
6.40
|
$
|
7.63
|
||||||
|
Fourth Quarter
|
$
|
9.90
|
$
|
7.48
|
$
|
9.56
|
||||||
|
Fiscal 2010
|
||||||||||||
|
First Quarter
|
$
|
3.94
|
$
|
2.16
|
$
|
3.13
|
||||||
|
Second Quarter
|
$
|
6.90
|
$
|
3.03
|
$
|
4.62
|
||||||
|
Third Quarter
|
$
|
5.44
|
$
|
4.28
|
$
|
4.90
|
||||||
|
Fourth Quarter
|
$
|
8.03
|
$
|
4.91
|
$
|
7.20
|
||||||
Record Holders
As of May 31, 2011, Gerber had approximately 613 holders of record of its common stock.
Dividend Policy
Gerber does not expect to pay cash dividends on its common stock for the foreseeable future. Any future determination to pay cash dividends will be at the discretion of the Board of Directors and will depend upon Gerber's financial condition, operating results, cash flows, capital requirements and other factors that the Board of Directors may deem relevant. Under the terms of its current credit facility, Gerber is restricted from making cash dividend payments in excess of 25 percent of the preceding year's net income.
Repurchases of Common Stock
The following table provides information about Gerber's purchases of its common stock during the fiscal quarter ended April 30, 2011:
|
Period
|
(a)
Total
Number
of Shares
(or Units)
Purchased
|
(b)
Average
Price
Paid per
Share
(or Unit)
|
(c)
Total Number of
Shares (or Units)
Purchased as Part
of Publicly
Announced Plans
or Programs
|
(d)
Maximum
Number (or
Approximate
Dollar Value)
of Shares (or Units)
that May Yet Be
Purchased Under the
Plans or Programs
|
||||||
|
February 1, 2011 – February 28, 2011 (1)
|
3,269
|
$
|
7.65
|
Not applicable
|
Not applicable
|
|||||
|
March 1, 2011 – March 31, 2011 (1)
|
30,449
|
$
|
8.18
|
Not applicable
|
Not applicable
|
|||||
|
April 1, 2011 – April 30, 2011 (1)
|
22,837
|
$
|
9.56
|
Not applicable
|
Not applicable
|
|||||
|
56,555
|
$
|
8.71
|
Not applicable
|
Not applicable
|
||||||
(1) Represents shares withheld by, or delivered to, Gerber pursuant to provisions in agreements with recipients of restricted stock granted under Gerber's 2006 stock incentive plan allowing Gerber to withhold, or the recipient to deliver to Gerber, the number of shares having the fair value equal to tax withholding due.
20
Stock Repurchase Plan
Pursuant to a November 1998 Board of Directors' resolution, Gerber is authorized to purchase up to 3.0 million shares of its outstanding common stock over an indeterminate period of time, if management determines that market conditions so warrant. Gerber purchased 1.0 million shares in fiscal 2000 and as of April 30, 2011, could purchase up to an additional 2.0 million shares pursuant to the 1998 resolution.
Performance Graph
The following performance graph shall not be deemed to be incorporated by reference by means of any general statement incorporating by reference this Annual Report on Form 10-K into any filing under the Securities Act of 1933 or the Securities Exchange Act of 1934, except to the extent that Gerber specifically incorporates such information by reference, and shall not be otherwise deemed filed under such Acts.
The following graph compares the cumulative return on Gerber's common stock over the past five fiscal years with the cumulative total return on shares of companies comprising the Standard & Poor’s SmallCap 600 Index and the Dow Jones US Electronic Equipment Index. Cumulative total return is measured assuming an initial investment of $100 on April 30, 2006, including reinvestment of dividends. Due to the diversity of businesses that Gerber conducts, it is difficult to identify a comparable peer group or one industry or line-of-business index for comparison purposes. Thus, Gerber has chosen to compare its performance to the Standard & Poor’s SmallCap 600 Index (which includes Gerber as a constituent) and to the Dow Jones US Electronic Equipment Index.
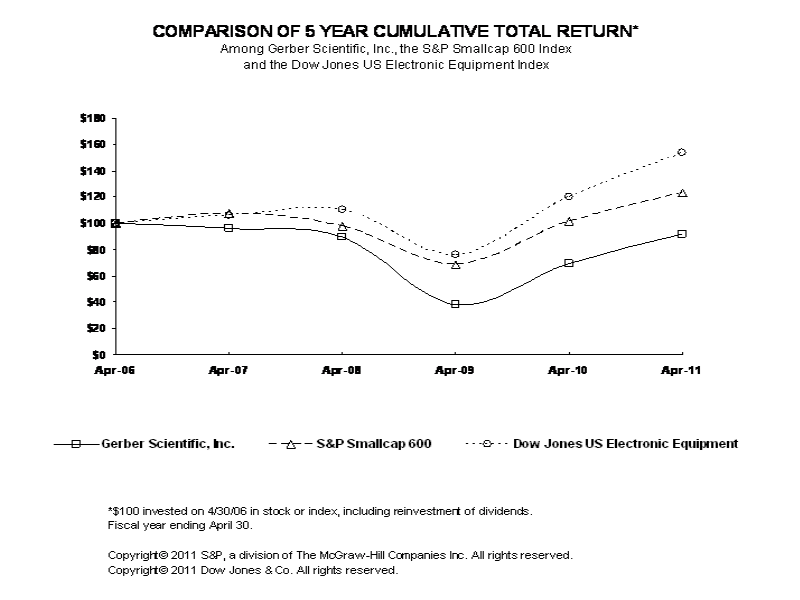
|
Apr-06
|
Apr-07
|
Apr-08
|
Apr-09
|
Apr-10
|
Apr-11
|
|||||||||||||||||||
|
Gerber Scientific, Inc.
|
100.00 | 96.53 | 89.39 | 38.09 | 69.43 | 92.19 | ||||||||||||||||||
|
S&P Small Cap 600
|
100.00 | 107.65 | 97.91 | 68.49 | 101.22 | 122.90 | ||||||||||||||||||
|
Dow Jones US Electronic Equipment
|
100.00 | 106.12 | 110.74 | 76.11 | 120.14 | 153.65 | ||||||||||||||||||
Chief Executive Officer and Chief Financial Officer Certifications
Gerber has filed with the SEC (as Exhibits to this Annual Report on Form 10-K) the certifications of Gerber's Chief Executive Officer and Chief Financial Officer required under Section 302 of the Sarbanes-Oxley Act of 2002 and SEC Rules 13a-14(a) and
21
15d-14(a) under the Securities Exchange Act of 1934 regarding Gerber's financial statements, internal control over financial reporting, disclosure controls and procedures and other matters. In addition, following the fiscal 2010 annual meeting of shareholders, Gerber submitted to the NYSE in a timely manner the annual certification of the Chief Executive Officer required under Section 303A.12 (a) of the NYSE Listed Company Manual that he was not aware of any violation by Gerber of the NYSE Corporate Governance Listing Standards.
|
For the Fiscal Years Ended April 30,
|
||||||||||||||||||||
|
In thousands, except per share amounts
|
2011
|
2010
|
2009
|
2008
|
2007
|
|||||||||||||||
|
Revenue
|
$
|
462,521
|
$
|
412,267
|
$
|
445,385
|
$
|
528,210
|
$
|
465,060
|
||||||||||
|
(Loss) Income from continuing operations
|
$
|
(6,667
|
)
|
$
|
(922
|
)
|
$
|
1,443
|
$
|
10,390
|
$
|
9,215
|
||||||||
|
Per common share:
|
||||||||||||||||||||
|
Basic
|
$
|
(0.27
|
)
|
$
|
(0.04
|
)
|
$
|
0.06
|
$
|
0.44
|
$
|
0.40
|
||||||||
|
Diluted
|
$
|
(0.27
|
)
|
$
|
(0.04
|
)
|
$
|
0.06
|
$
|
0.44
|
$
|
0.39
|
||||||||
|
Net (loss) income
|
$
|
(23,616
|
)
|
$
|
(1,458
|
)
|
$
|
2,236
|
$
|
14,504
|
$
|
13,508
|
||||||||
|
Per common share:
|
||||||||||||||||||||
|
Basic
|
$
|
(0.94
|
)
|
$
|
(0.06
|
)
|
$
|
0.09
|
$
|
0.62
|
$
|
0.59
|
||||||||
|
Diluted
|
$
|
(0.94
|
)
|
$
|
(0.06
|
)
|
$
|
0.09
|
$
|
0.61
|
$
|
0.58
|
||||||||
|
Total assets
|
$
|
332,764
|
$
|
351,877
|
$
|
359,217
|
$
|
378,539
|
$
|
335,962
|
||||||||||
|
Long-term debt (includes current maturities)
|
$
|
21,110
|
$
|
45,000
|
$
|
73,500
|
$
|
42,000
|
$
|
31,836
|
||||||||||
|
Shareholders' equity
|
$
|
148,221
|
$
|
158,206
|
$
|
148,302
|
$
|
169,563
|
$
|
144,481
|
||||||||||
The fiscal 2011 net loss included restructuring and other expenses of $8.6 million primarily associated with Gerber’s decision to discontinue production of Sign Making and Specialty Graphics UV flatbed printers and to relocate the Apparel and Industrial segment manufacturing plant from Denmark to China. The fiscal 2011 net loss also included goodwill impairment charges of $16.9 million associated with the Gerber Coburn reporting unit that was included in discontinued operations in the company’s consolidated financial statements and $5.9 million associated with the GSP reporting unit.
During fiscal 2010, Gerber acquired Yunique in November 2009. During fiscal 2009, Gerber acquired Gamma in September 2008 and Virtek in October 2008. During fiscal 2008, Gerber adopted an accounting standard interpretation related to accounting for uncertainty in income taxes and recorded a $2.4 million decrease to shareholders' equity and acquired Data Technology, Inc. in May 2007.
CAUTIONARY NOTE CONCERNING FACTORS THAT MAY INFLUENCE FUTURE RESULTS
This management's discussion and analysis contains statements which, to the extent they are not statements of historical or present fact, constitute forward-looking statements within the meaning of Section 27A of the Securities Act of 1933 and Section 21E of the Securities Exchange Act of 1934. These forward-looking statements are intended to provide management's current expectations or plans for the future operating and financial performance of Gerber, based on assumptions currently believed to be reasonable. Forward-looking statements can be identified by the use of words such as "believe," "expect," "intend," "foresee," "may," "plan," "anticipate" and other words of similar meaning in connection with a discussion of future operating or financial performance. These forward-looking statements include, among others, statements relating to:
|
·
|
expected financial condition, future earnings, levels of growth, or other measures of financial performance, or the future size of market segments or geographic markets;
|
|
·
|
economic conditions;
|
|
·
|
planned cost reductions;
|
|
·
|
future cash flows and uses of cash and debt reduction strategies;
|
|
·
|
prospective product developments and business growth opportunities, as well as competitor product developments;
|
|
·
|
demand for products and services;
|
|
·
|
methods of and costs associated with potential geographic expansion;
|
22
|
·
|
regulatory and market developments and the impact of such developments on future operating results;
|
|
·
|
potential impacts from credit market risk;
|
|
·
|
future effective income tax rates;
|
|
·
|
the outcome of contingencies;
|
|
·
|
the availability and cost of raw materials; and
|
|
·
|
pension plan assumptions and future contributions.
|
All forward-looking statements involve risks and uncertainties that may cause actual results to differ materially from those expressed or implied in the forward-looking statements. Some of these risks and uncertainties are set forth in Item 1A, "Risk Factors" of this Annual Report on Form 10-K. Gerber’s results of operations, financial condition or cash flows may be adversely affected by one or more of these factors. Gerber does not undertake to update any forward-looking statement made in this report or that may from time to time be made by or on behalf of Gerber.
AGREEMENT FOR ACQUISITION OF GERBER BY VECTOR CAPITAL CORPORATION FUNDS
On June 13, 2011, Gerber Scientific, Inc. announced that it had entered into a definitive merger agreement under which Gerber will be acquired by funds affiliated with Vector Capital Corporation, or “Vector.” Under the terms of the merger agreement, Gerber’s shareholders will receive $11.00 in cash per share of common stock, or approximately $281.8 million in total. In addition to the cash payment, each Gerber shareholder will receive for each share owned by the shareholder, a non-transferable right to receive contingent cash payments at a future time if recoveries are obtained in connection with certain claims for infringement of a Gerber patent covering computerized cut to print technology.
The merger agreement permits Gerber’s Board of Directors to solicit, receive, evaluate and enter into negotiations with respect to alternative acquisition proposals through July 25, 2011. The Board of Directors, with the assistance of its advisors, will actively solicit alternative proposals during this period. There can be no assurance that this process will result in an offer for Gerber that is superior to the offer under the existing merger agreement. If there is no superior offer, the merger transaction with the Vector funds is expected to close in the second half of calendar 2011, subject to customary approvals and closing conditions. Completion of the proposed transaction will require approval by the holders of a majority of Gerber’s outstanding shares of common stock. The proposed transaction is not subject to any financing condition.
For additional information about the proposed transaction, see Note 20 of the Notes to Consolidated Financial Statements in Item 15 of this Annual Report on Form 10-K.
OVERVIEW AND OUTLOOK
Gerber develops and manufactures, distributes and services integrated automation equipment and software, as well as related aftermarket supplies and spare parts for the sign making and specialty graphics industry and apparel and industrial markets through its global operations. Gerber’s strategic focus is to optimize its business portfolio and invest in key growth areas, reduce structural and supply chain expenses, and develop new products.
Gerber’s revenue is derived from the following operating segments, with business unit names indicated parenthetically:
|
For the Fiscal Years Ended April 30,
|
||||||||||||
|
In thousands
|
2011
|
2010
|
2009
|
|||||||||
|
Sign Making and Specialty Graphics (Gerber Scientific Products and Spandex)
|
$
|
265,985
|
$
|
248,013
|
$
|
272,964
|
||||||
|
Apparel and Industrial (Gerber Technology, Virtek and Gerber Innovations)
|
196,546
|
165,226
|
172,421
|
|||||||||
|
Intersegment revenue elimination
|
(10
|
)
|
(972
|
)
|
---
|
|||||||
|
Consolidated revenue
|
$
|
462,521
|
$
|
412,267
|
$
|
445,385
|
||||||
During fiscal 2011, Gerber pursued strategic initiatives to improve profitability and to achieve a ten percent operating margin by fiscal 2013. Such actions included the divestiture of the Gerber Coburn business, or the “Gerber Coburn Unit,” the consolidation of both Gerber’s corporate headquarters and an Apparel and Industrial manufacturing facility into an existing Connecticut facility, ceasing manufacturing of Gerber Scientific Products, or “GSP,” inkjet equipment, implementing plans to relocate the manufacturing of computer-automated material spreading equipment from Denmark to China, and continuing a
23
reduction in force across the global workforce. Gerber also implemented several cost savings measures aimed at reducing overall product costs. Gerber’s sales strategy remains focused on new product development and geographic market expansion, while its product development process focuses on platform development that enables the company to leverage its product innovations with product extensions and add-ons. Gerber's long-term growth strategy includes geographic expansion within Asian markets, particularly within China.
To reduce overall expenses, Gerber implemented various cost reduction initiatives during fiscal 2011 to improve operating profitability. Gerber realized approximately $10.7 million in cost reductions for fiscal 2011 and anticipates incremental cost reductions of $11.6 million in fiscal 2012. An overall global workforce reduction of approximately 15 percent was initiated in fiscal 2009 and further reductions of approximately 4 percent were initiated late in fiscal 2011. The cost of these actions is reflected in Restructuring and other expenses in the company’s consolidated financial statements. One of these initiatives was directed at improving the utilization of the company’s facilities. During fiscal 2011, Gerber amended its master operating lease with its landlord to exchange the facility owned in Tolland, Connecticut for a leased facility in South Windsor, Connecticut. After the exchange, Gerber owns the South Windsor facility and leases the Tolland facility for the same terms and conditions that previously applied to the South Windsor facility. This transaction allowed Gerber to pursue the sale of the facility in South Windsor, Connecticut, which was sold in May 2011. Gerber also subleased one of its properties in Connecticut to Coburn Technologies, Inc. after its sale of that unit in fiscal 2011.
The following table presents the components of operating (loss) income as a percentage of consolidated revenue.
|
For the Fiscal Years Ended April 30,
|
|||||||||||||||
|
2011
|
2010
|
2009
|
|||||||||||||
|
Gross profit margin
|
30.9 | % | 29.2 | % | 28.7 | % | |||||||||
|
Selling, general and administrative ("SG&A") expenses
|
(25.2 | ) | (24.3 | ) | (24.4 | ) | |||||||||
|
Research and development
|
(3.5 | ) | (3.6 | ) | (3.9 | ) | |||||||||
|
Restructuring and other expenses
|
(1.9 | ) | (0.8 | ) | (0.3 | ) | |||||||||
|
Goodwill impairment
|
(1.3 | ) | --- | --- | |||||||||||
|
Operating (loss) income
|
(1.0 | ) | % | 0.5 | % | 0.1 | % | ||||||||
Core operating results in fiscal 2011 included the expenses associated with several transformation initiatives. Gross profit was negatively impacted by GSP expenses of $2.9 million that included incremental inventory impairments, reserves for customer concessions and unfavorable supplier commitments related to the discontinuance of manufacturing inkjet printers. A goodwill impairment of $5.9 million was related to the decision to discontinue manufacturing inkjet printers and the anticipated future impact on discounted cash flows for the GSP business. Fiscal 2011 restructuring and other expenses of $8.6 million included $5.0 million of severance charges related to a general reduction in force, the Denmark plant closure and the decision to discontinue manufacturing inkjet printers and other non-severance related expenses of $3.6 million. Excluding these transformation expenses, gross profit improved as a result of the impact of higher revenue volume and the benefits from cost savings initiatives. SG&A expenses increased as a percentage of revenue in fiscal 2011 over the fiscal 2010 and fiscal 2009 periods in part because incentive compensation expense of $4.5 million in fiscal 2011 was not incurred in either fiscal 2010 or fiscal 2009 and the benefit from temporary cost reduction plans, such as workforce furloughs and salary reductions, from the earlier fiscal years did not recur for the majority of fiscal 2011. As of April 30, 2011, all temporary cost reductions had been restored.
As compared with fiscal 2011 and fiscal 2010, fiscal 2009 income from continuing operations included a tax benefit of $3.2 million from the merger of two French subsidiaries and was adversely impacted by $2.3 million of pre-tax impairment charges related to an investment deemed other-than-temporarily impaired.
With proceeds from asset sales and cash flows from operations, Gerber repaid $23.9 million of its revolving credit facility during fiscal 2011 and $28.5 million during fiscal 2010. On March 1, 2011, Gerber executed an amended and restated credit agreement for its revolving credit facility which, among other changes, increased the borrowing capacity under the facility to $75 million from $60 million and extended the maturity date to March 1, 2016 from January 31, 2012. Gerber paid approximately $0.9 million in costs associated with this amendment, which are deferred over the remaining credit facility life.
Gerber plans to continue to execute its strategy to streamline its global operations and permanently reduce its cost structure in fiscal 2012. One of the more significant actions under this strategy will be the relocation of the manufacturing process for
24
Apparel and Industrial segment’s computer-automated material spreading systems from Denmark to China, using outsourced labor. The majority of costs associated with this relocation were accrued in fiscal 2011. As Gerber continues to analyze other strategies to streamline business processes and lower overhead costs, Gerber may incur severance and other expenses in fiscal 2012.
RESULTS OF OPERATIONS
In the following comparisons of Gerber’s operating results, reference to “fiscal 2011” means the fiscal year ended April 30, 2011, reference to “fiscal 2010” means the fiscal year ended April 30, 2010, and reference to “fiscal 2009” means the fiscal year ended April 30, 2009. Unless otherwise noted, all changes identified for the current fiscal year results represent comparisons with results for the prior corresponding fiscal years.
|
For the Fiscal Years Ended April 30,
|
||||||||||||
|
In thousands
|
2011
|
2010
|
2009
|
|||||||||
|
Revenue
|
$
|
462,521
|
$
|
412,267
|
$
|
445,385
|
||||||
|
Cost of sales
|
319,758
|
291,966
|
317,704
|
|||||||||
|
Gross profit
|
142,763
|
120,301
|
127,681
|
|||||||||
|
Selling, general and administrative expenses
|
116,680
|
100,146
|
108,867
|
|||||||||
|
Research and development
|
16,005
|
14,930
|
17,326
|
|||||||||
|
Restructuring and other expenses
|
8,607
|
3,227
|
1,020
|
|||||||||
|
Goodwill impairment
|
5,928
|
---
|
---
|
|||||||||
|
Operating (loss) income
|
$
|
(4,457
|
)
|
$
|
1,998
|
$
|
468
|
|||||
As part of Gerber's strategic planning process, management continually reviews its operating segments and selected markets in terms of their potential long-term returns. Management periodically reviews and negotiates potential business acquisitions and divestitures, some of which may be material. Decisions regarding "bolt-on" acquisitions generally focus on candidates that will contribute to the growth of Gerber's core businesses, increase earnings per share, and generate positive cash flow in the first year of acquisition. Gerber may also consider business divestitures if management determines that the applicable business no longer meets Gerber's long-term strategic objectives or that the divestiture could result in increased cash flows. Although Gerber seeks to maximize the proceeds from business divestitures, Gerber may conclude that it is in the best interest of its long-term strategy to divest a business at a price that is below the net carrying value of its assets and incur a loss from the divestiture. Decisions to divest a business at a price below the net carrying value of its assets would involve using the proceeds from the divested business to execute strategies that offer potentially higher returns to shareholders.
In fiscal 2010, Gerber completed an acquisition of Yunique Solutions, Inc., or “Yunique,” a software development company serving apparel and flexible materials industries. This acquisition is expected to enhance Gerber’s existing product lifecycle management and product data management software offerings. In fiscal 2009, Gerber acquired Virtek Vision International, Inc., or “Virtek,” a manufacturer of precision laser-based templating and inspection solutions. In fiscal 2009, Gerber also acquired Gamma Computer Tech Co., Ltd., or “Gamma,” in China to expand Gerber’s manufacturing operations in China. Together, these three acquisitions generated revenue of $25.0 million in fiscal 2011 and $19.1 million in fiscal 2010. Virtek and Gamma together generated revenue of $11.5 million in fiscal 2009.
In fiscal 2011, consistent with its divestiture strategy, Gerber sold its ophthalmic lens processing net assets for a gross sales price of $21.0 million, less a working capital adjustment of approximately $0.4 million. For additional information about the terms of this divestiture, see Note 19 to the consolidated financial statements appearing elsewhere in this report. In approving the divestiture, Gerber’s Board of Directors and management reviewed Gerber’s portfolio of businesses against a set of strategic criteria and concluded that Gerber was not in a position to maximize the potential of the ophthalmic lens processing business. The net sales proceeds of approximately $18.9 million were used to reduce Gerber’s outstanding debt. During fiscal 2010, Gerber completed four non-core asset sales. Gerber sold its laser marking and engraving business unit, FOBA Technology + Services GmbH, or “FOBA,” in September 2009. FOBA was previously reported within the Apparel and Industrial segment. Also in September 2009, Gerber sold ND Graphics, a Canadian business unit of Gerber Scientific Products. Gerber closed the majority of its Spandex Poland operations during October 2009. In April 2010, certain assets of Spandex New Zealand and Gerber Coburn Australia were sold. Subsequent to these asset sales, the divisions were substantially closed. This management’s discussion and analysis includes the results of these businesses as discontinued operations for all periods presented. Certain overhead costs that were previously allocated to Gerber Coburn and not eliminated as a result of the sale are reported as
25
unallocated for segment reporting, and are included in the measurement of operating income (loss).
Revenue – Fiscal 2011 revenue increased $50.3 million, or 12.2 percent. Volume improvements contributed to $51.6 million for fiscal 2011. The volume improvement in fiscal 2011 reflected the positive impact of economic recovery in Gerber’s markets and the benefit of revenue from new products. Additionally, incremental revenue from the Yunique acquisition was $1.4 million for fiscal 2011. Foreign currency translation negatively impacted fiscal 2011 revenue by approximately $2.7 million as a result of the United States dollar strengthening against several other currencies in which Gerber transacts business. In fiscal 2010, revenue decreased $33.1 million, or 7.4 percent. Lower sales volume negatively impacted revenue by approximately $46.3 million in fiscal 2010. The lower sales volume was primarily attributable to adverse economic conditions impacting each region where Gerber sells its products. Partially offsetting lower sales volume, fiscal 2010 revenue results reflected incremental revenue of $6.8 million from fiscal 2009 acquisitions completed in mid-fiscal 2009 and pricing benefits of $0.8 million. Foreign currency translation favorably impacted fiscal 2010 revenue by approximately $5.6 million as a result of the United States dollar weakening against several other currencies in which Gerber transacts business.
International markets are significant to Gerber’s revenue base, as Gerber generated approximately 74 percent of fiscal 2011 revenue from sales to non-U.S. markets. Gerber analyzes its results of operations on a constant currency basis, excluding the impact of foreign currency translation. The impact of foreign currency translation on the operating performance quantified within this management’s discussion and analysis was estimated by comparing average foreign exchange rates for fiscal 2011 with fiscal 2010 and for fiscal 2010 with fiscal 2009.
The following table provides revenue by source for fiscal 2011, 2010 and 2009:
|
For the Fiscal Years Ended April 30,
|
||||||||||||||||||
|
In thousands
|
2011
|
2010
|
2009
|
|||||||||||||||
|
Equipment and software revenue
|
$
|
135,105
|
29.2
|
%
|
$
|
104,011
|
25.2
|
%
|
$
|
125,153
|
28.1
|
%
|
||||||
|
Aftermarket supplies revenue
|
269,047
|
58.2
|
%
|
249,975
|
60.7
|
%
|
257,513
|
57.8
|
%
|
|||||||||
|
Service revenue
|
58,369
|
12.6
|
%
|
58,281
|
14.1
|
%
|
62,719
|
14.1
|
%
|
|||||||||
|
Revenue
|
$
|
462,521
|
100.0
|
%
|
$
|
412,267
|
100.0
|
%
|
$
|
445,385
|
100.0
|
%
|
||||||
The revenue growth in fiscal 2011 reflected improved economic conditions and higher key new products revenue. Adverse economic conditions in fiscal 2010 and fiscal 2009 softened demand and restricted availability of credit, making it difficult for some customers to obtain financing for potential equipment purchases.
Gerber continues to focus on new equipment and software product development. Revenue from all key new products was $25.9 million in fiscal 2011, $15.4 million in fiscal 2010 and $31.4 million in fiscal 2009. A significant contributor to the fiscal 2011 key new product revenue was the GERBERcutter® Z7, launched in fiscal 2009, which had significant orders from one customer of approximately $3.6 million. Another strong contributor to key new products revenue in fiscal 2011 was the GERBERplotter XLp that was launched in fiscal 2011 and contributed revenue of $2.5 million. New equipment revenue included $4.8 million in fiscal 2011, $3.8 million in fiscal 2010 and $16.3 million in fiscal 2009 from GSP inkjet equipment sales. Future periods will not reflect revenue from this product line, however, as Gerber determined in April 2011 that the flatbed printer market could not support its long-term growth and earnings objectives, and thus discontinued the manufacturing of this product line. Gerber believes that revenue from key new product launches in fiscal 2010 was depressed as a result of the weak global economy and adverse credit market conditions that reduced credit availability for potential customers.
Aftermarket supplies and service revenues were not as severely impacted by the economic downturn in fiscal 2010 and fiscal 2009, as these revenue streams both provide a source of repeat business after the initial equipment sale. Typically, aftermarket supplies sales of replacement parts and consumables remain relatively stable due to the large base of installed equipment in use, even during periods of economic volatility. Revenue growth in aftermarkets in fiscal 2011 primarily represented improved demand from Spandex’s international end-use customers. The equipment installed base and related service contracts from prior fiscal years partially mitigated the full impact of adverse economic conditions in fiscal 2010 and fiscal 2009 on service revenue.
Because of its international operations, Gerber's operating results are affected by global and industrial factors. Global geographic sales expansion and industry diversification, both of which are key Gerber operating strategies, help to limit the adverse impact of any one industry or the economy of any single country on Gerber's consolidated revenue and operating results. In fiscal 2012, Gerber expects to continue to focus on both its domestic and international operations by promoting new
26
product launches worldwide and by conducting business in targeted markets, particularly in the Rest of World region.
Revenue by geographic region and as a percentage of consolidated revenue in fiscal 2011, 2010 and 2009 was as follows:
|
For the Fiscal Years Ended April 30,
|
||||||||||||||||||
|
In thousands
|
2011
|
2010
|
2009
|
|||||||||||||||
|
North America
|
$
|
124,161
|
26.8
|
%
|
$
|
109,048
|
26.5
|
%
|
$
|
140,720
|
31.6
|
%
|
||||||
|
Europe
|
227,822
|
49.3
|
%
|
210,743
|
51.1
|
%
|
233,874
|
52.5
|
%
|
|||||||||
|
Rest of World
|
110,538
|
23.9
|
%
|
92,476
|
22.4
|
%
|
70,791
|
15.9
|
%
|
|||||||||
|
Revenue
|
$
|
462,521
|
100.0
|
%
|
$
|
412,267
|
100.0
|
%
|
$
|
445,385
|
100.0
|
%
|
||||||
The improved economic conditions and revenue from key new products, particularly within the Apparel and Industrial segment, benefited all geographic regions in fiscal 2011. Strong equipment and aftermarket revenue from the Spandex business unit contributed to an increase in European revenue in fiscal 2011. Fiscal 2009 North American revenue benefited from the initial launch of the Solara ion in that fiscal year. The growth in Rest of World revenue included higher sales in China, as Gerber reported revenue from greater China of $28.1 million, $23.4 million and $18.5 million for fiscal 2011, 2010 and 2009, respectively. China is one of Gerber’s growth markets and Gerber continues to invest in its infrastructure in China to support anticipated growth.
Reported backlog is primarily comprised of service contracts that benefit future periods and firm equipment orders. The backlog improvements shown in the following table, which provides backlog by segment, primarily reflected an increase in equipment backlog from new orders.
|
In thousands
|
April 30,
2011
|
April 30,
2010
|
||||||
|
Backlog
|
||||||||
|
Sign Making and Specialty Graphics
|
$
|
633
|
$
|
767
|
||||
|
Apparel and Industrial
|
27,170
|
25,886
|
||||||
|
$
|
27,803
|
$
|
26,653
|
|||||
Gross Profit – Gross profit and gross profit margin for the past three fiscal years is shown in the following table:
|
For the Fiscal Years Ended April 30,
|
||||||||||
|
In thousands
|
2011
|
2010
|
2009
|
|||||||
|
Gross profit
|
$
|
142,763
|
$
|
120,301
|
$
|
127,681
|
||||
|
Gross profit margin
|
30.9
|
%
|
29.2
|
%
|
28.7
|
%
|
||||
In fiscal 2012, Gerber expects improved profitability from its fiscal 2011 cost savings actions that included lower facility costs, savings from workforce reductions and the re-design of existing products with a lower cost structure. Fiscal 2011 gross profit increased 18.7 percent directly as a result of both a 12.2 percent increase in revenue, which resulted in favorable absorption of overhead costs, and cost savings of approximately $8.4 million, the effects of which were partially offset by consulting fees of $0.8 million. Fiscal 2011 gross profit was positively impacted by foreign currency translation of approximately $0.1 million. Partially offsetting these favorable impacts, fiscal 2011 gross profit was negatively impacted by $2.9 million of costs associated with the decision to cease manufacturing of GSP’s inkjet equipment and by Gerber’s restoration during fiscal 2011 of temporary cost control measures, including workforce furloughs and temporary wage reductions that were maintained in fiscal 2009 and fiscal 2010.
Depressed revenue volumes in fiscal 2010 and fiscal 2009 resulted in unfavorable absorption of fixed manufacturing costs, which negatively impacted gross profit for both years. Fiscal 2010 gross profit benefited from approximately $2.2 million of favorable foreign currency translation. In fiscal 2010 and fiscal 2009, to address the impact of lower revenue on gross profit, Gerber implemented cost savings actions that included temporary salary reductions and work furloughs. Actions were also taken to reduce the overall workforce size in fiscal 2009. Fiscal 2009 gross profit included severance costs of $0.8 million related to these actions.
27
Gerber's gross profit margin increased 1.7 percentage points in fiscal 2011 over fiscal 2010 and 0.5 percentage points in fiscal 2010 over fiscal 2009. The fiscal 2011 improvement was attributable to the cost savings actions to lower product cost and to favorable manufacturing overhead cost absorption, and was partially offset by the costs described above associated with the decision to cease manufacturing GSP’s inkjet equipment. Gerber anticipates that the full year benefits of lower product costs described above will favorably impact gross profit margin in fiscal 2012. The improvement in fiscal 2010 was driven by actions to lower Gerber’s cost structure that resulted in lower labor expenses. Fiscal 2009 cost of sales included incremental costs associated with the Virtek and Gamma acquisitions of $0.9 million and severance of $0.8 million, which negatively impacted fiscal 2009 gross profit margin in total by 0.4 percentage points.
Selling, General and Administrative Expenses
|
For the Fiscal Years Ended April 30,
|
|||||||||||||||||||
|
In thousands
|
2011
|
2010
|
Change
|
2010
|
2009
|
Change
|
|||||||||||||
|
Selling, general and administrative expenses
|
$
|
116,680
|
$
|
100,146
|
16.5
|
%
|
$
|
100,146
|
$
|
108,867
|
(8.0
|
%
|
)
|
||||||
Fiscal 2011 SG&A expenses increased by $16.5 million. This increase primarily reflected three significant drivers that included the restoration of prior year temporary cost control measures of approximately $5.3 million, $4.5 million related to incentive compensation expense that did not occur in fiscal 2010 and higher commissions expenses of $3.8 million associated with the increase in revenue and a higher geographic mix of sales by third-party distributors. Higher self-insurance costs of $1.3 million and marketing costs of $1.0 million also contributed to the increase. The self-insurance costs were higher in fiscal 2011 due to unfavorable claims experience. The temporary cost reduction measures were progressively restored throughout fiscal 2011 and were completely restored as of April 30, 2011. The impact of workforce reductions in fiscal 2011 is expected to benefit fiscal 2012 SG&A expenses. Among cost reduction measures implemented in fiscal 2011, Gerber better utilized its facility capacity in a Tolland, Connecticut facility by relocating its corporate headquarters to Tolland, Connecticut from South Windsor, Connecticut and partially vacating the South Windsor leased facility in fiscal 2011. The South Windsor facility was purchased from its landlord in exchange for the owned Tolland facility. At the effective date in fiscal 2011 of the non-cash building exchange, the South Windsor facility was owned and the Tolland facility was rented. The South Windsor facility was marketed for sale and subsequently sold in May 2011 for a gross sales price of $7.0 million. At the sale date in May 2011, the Tolland facility is leased under a capital lease and therefore overall rent expense is expected to decrease in fiscal 2012, although the positive impact of this transaction will be offset in part by depreciation expense of the capital lease asset and interest expense associated with the capital lease obligation. Partially offsetting these higher costs, defined benefit plan expenses decreased $1.1 million and foreign currency translation lowered costs approximately $0.6 million from fiscal 2010.
The significant decline in SG&A expenses in fiscal 2010 was attributable to proactive implementation of cost savings measures. Gerber’s U.S. employee base received approximately 90 percent of full salary during most of fiscal 2010 and four months of fiscal 2009. In fiscal 2010, the U.S. employee base had both two weeks of unpaid furlough and additional required vacation usage periods. The U.S. pension plan was frozen as of April 30, 2009, which resulted in lower pension expenses, and the U.S. 401(k) plan employer matching contributions were suspended during fiscal 2009 and not restored until March 2011. Fiscal 2010 results also included a $0.5 million noncash benefit from a favorable tax accrual adjustment. Partially offsetting these lower costs, fiscal 2010 SG&A included incremental expenses from acquired companies of $2.7 million. In fiscal 2009, the U.S. employee base had both one week of unpaid furlough and additional required vacation usage periods.
Pension plan expenses in the United States were $1.0 million in fiscal 2011, $2.1 million in fiscal 2010 and $4.4 million in fiscal 2009. The decrease was primarily as a result of frozen benefits as of April 30, 2009. Fiscal 2009 pension expenses also included a $0.5 million curtailment loss recognized as a result of the pension plan freeze. Pension plan expenses are expected to further decrease in fiscal 2012 by approximately $0.5 million.
Gerber plans to continue to closely manage expenses in fiscal 2012 and will seek to limit increases in SG&A to investments in strategic growth areas.
28
Research and Development
|
For the Fiscal Years Ended April 30,
|
|||||||||||||||||||
|
In thousands
|
2011
|
2010
|
Change
|
2010
|
2009
|
Change
|
|||||||||||||
|
Research and development ("R&D")
|
$
|
16,005
|
$
|
14,930
|
7.2
|
%
|
$
|
14,930
|
$
|
17,326
|
(13.8
|
%
|
)
|
||||||
Gerber is committed to new product development and believes that such efforts are important to its prospects for profitable growth. R&D as a percentage of revenue remained steady at approximately 3.5 percent in the past three fiscal years. Fiscal 2011 costs include professional services related to a software project in development of approximately $0.8 million. The remaining expenses were substantially consistent with those in fiscal 2010. The lower expenses in fiscal 2010 compared to fiscal 2009 reflected the effect of workforce reductions. Fiscal 2012 research and development projects are expected to be limited to strategic new products and sustaining engineering of existing products.
Restructuring and Other Expenses
A summary of restructuring and other expenses incurred over the past three fiscal years are shown below by type of cost and by segment.
|
For the Fiscal Years Ended April 30,
|
||||||||||||
|
In thousands
|
2011
|
2010
|
2009
|
|||||||||
|
Sign Making and Specialty Graphics
|
||||||||||||
|
Severance
|
$
|
1,540
|
$
|
231
|
$
|
690
|
||||||
|
Reversal of leased facility restructuring reserve upon plans to utilize facility
|
---
|
---
|
(852
|
)
|
||||||||
|
Total
|
1,540
|
231
|
(162
|
)
|
||||||||
|
Apparel and Industrial
|
||||||||||||
|
Severance
|
3,422
|
639
|
1,026
|
|||||||||
|
Factory-related consulting and move costs
|
537
|
---
|
---
|
|||||||||
|
Total
|
3,959
|
639
|
1,026
|
|||||||||
|
Corporate Unallocated Company-wide Expenses
|
||||||||||||
|
Severance
|
---
|
855
|
41
|
|||||||||
|
Strategic expenses
|
1,067
|
572
|
---
|
|||||||||
|
Non-cash asset impairment charges
|
2,041
|
371
|
115
|
|||||||||
|
Acquisition fees
|
---
|
559
|
---
|
|||||||||
|
Total
|
3,108
|
2,357
|
156
|
|||||||||
|
Consolidated Restructuring and other expenses
|
$
|
8,607
|
$
|
3,227
|
$
|
1,020
|
||||||
In fiscal 2011, the Sign Making and Specialty Graphics segment severance of $1.5 million primarily related to the impact of discontinuing the manufacturing of the GSP inkjet product line and a general reduction in force. The discontinuation of the inkjet product line is expected to result in annual savings of approximately $3.3 million in fiscal 2012. The general reduction in force primarily impacted international finance personnel and manufacturing employees. The Apparel and Industrial segment severance and factory-related consulting and move costs related to the relocation of a Gerber Innovations Massachusetts production facility into an existing Connecticut facility and severance costs associated with plans to relocate the production of computer-automated spreading machine equipment from Denmark to China. The Gerber Innovations facility consolidation plan is expected to result in annual savings of approximately $0.9 million as a result of lower annual rent and other building costs, and the related severance was paid in full as of April 30, 2011. Severance of $1.5 million was associated with the decision to relocate the Denmark production facility to China, which is expected to generate the savings of approximately $2.0 million annually beginning in fiscal 2013. Severance was also incurred within the Apparel and Industrial segment for a general workforce reduction that particularly impacted international finance staff, sales personnel and manufacturing employees. The Corporate expenses included patent impairment charges incurred primarily as a result of management’s decision to abandon several patents and reduce the net book value to zero, after evaluating the expected future benefits of the patents compared with the ongoing patent maintenance fees and fixed asset impairments associated with the GSP discontinuation of its manufactured
29
inkjet product line. The strategic expenses primarily included consulting fees for business process improvement initiatives and compensation costs associated with the decision to discontinue the manufacturing of the inkjet equipment. Gerber believes it has neared the end of its transformation and does not anticipate significant new actions in fiscal 2012. Gerber expects restructuring and other expenses related to the Denmark production move to continue in fiscal 2012 for costs that must be expensed as incurred, such as retention bonuses.
In fiscal 2010, the Sign Making and Specialty Graphics severance related to a general workforce reduction. The Apparel and Industrial severance was primarily associated with the termination of certain employees that became redundant upon the acquisition of Yunique. The Corporate expenses included severance of $0.9 million as a result of business process improvement initiatives that included the outsourcing of certain functions as well as overall headcount reductions. The consulting expenses primarily included fees for strategic development initiatives. Expenses associated with the discontinuance of certain patents of $0.4 million and acquisition fees related to the Yunique acquisition were also included in Restructuring and other expenses in the company’s consolidated financial statements.
In fiscal 2009, Gerber reduced its global workforce and incurred severance expenses of $1.8 million. In fiscal 2009, Gerber completed a facility rationalization plan for its Connecticut locations and determined that it would reoccupy a previously vacated leased facility. This determination resulted in the reversal of a previously established leased facility restructuring reserve and generated a $0.9 million benefit. Cost savings from the fiscal 2009 actions were approximately $16.8 million.
Goodwill Impairment
Gerber reviews its goodwill assets for impairment annually during its fourth fiscal quarter, or sooner if events or changes in business circumstances indicate that the carrying amount of the assets may not be fully recoverable. The identification and measurement of goodwill impairment involves an estimation of the fair value of the reporting units, using assumptions that could affect whether an impairment charge is recognized and the amount of any such charge. Significant assumptions include inputs into discounted cash flow analysis that are used for measuring fair value such as future sales, new product launches and expense levels.
During fiscal 2011, Gerber concluded that there was evidence that the fair value of the Sign Making and Specialty Graphics GSP reporting unit had decreased below the reporting unit’s book value as a result of the decision to cease manufacturing GSP inkjet printers. The results of the first step of the goodwill impairment test for the fourth quarter of fiscal 2011 indicated potential impairment, as the fair value of the reporting unit was less than the book value. The primary measure of fair value was a discounted cash flow analysis. The second step of the impairment test was performed to determine the potential impairment loss. The second step of the goodwill impairment test required Gerber to calculate the implied fair value of goodwill by allocating the fair value of the reporting unit to all assets and liabilities of that reporting unit, including unrecognized intangible assets, as if the reporting unit had been acquired in a business combination. As a result of that test, there was no excess fair value to allocate to goodwill. Therefore, Gerber recorded a $5.9 million goodwill impairment charge during the fourth quarter of fiscal 2011. The goodwill impairment tests of the remaining reporting units did not indicate potential impairment.
Other Expense, net
|
For the Fiscal Years Ended April 30,
|
||||||||||||
|
In thousands
|
2011
|
2010
|
2009
|
|||||||||
|
Other expense, net
|
$
|
(155
|
)
|
$
|
(719
|
)
|
$
|
(2,596
|
)
|
|||
In fiscal 2011, 2010 and 2009, other expense, net primarily included bank fees, interest income and foreign currency transaction gains and losses for all periods presented.
Other expense, net in fiscal 2011 included $0.8 million of income from the transition services agreement with Coburn Technologies. This income will not recur in fiscal 2012. Other expense, net in fiscal 2011 included higher foreign currency transaction losses of $0.2 million as compared with fiscal 2010.
Other expense, net in fiscal 2009 included a $2.3 million non-cash charge related to the recording of an other-than-temporary impairment of an available-for-sale investment. Although Gerber anticipates that this investment will recover its value over time, the duration of the loss and the inability to predict when the United States stock markets would recover resulted in Gerber
30
determining that this investment was other-than-temporarily impaired during fiscal 2009. Also included in fiscal 2009 results was a $0.7 million loss from a derivative transaction.
Interest Expense
|
For the Fiscal Years Ended April 30,
|
||||||||||||
|
In thousands
|
2011
|
2010
|
2009
|
|||||||||
|
Interest expense
|
$
|
1,798
|
$
|
2,857
|
$
|
2,097
|
||||||
|
Weighted-average credit facility interest rates
|
6.1
|
%
|
7.2
|
%
|
5.7
|
%
|
||||||
Interest expense includes interest costs incurred related to Gerber's borrowings, the amortization of debt issuance costs and early debt extinguishment charges. Weighted-average credit facility interest rates include the amortization of debt issuance costs and interest expenses allocated to discontinued operations, and exclude early debt extinguishment charges. Weighted-average credit facility interest rates are calculated using average monthly debt. Gerber's credit facility interest rates are based on market rates plus an applicable margin. To lock in fixed interest rates, Gerber entered into two interest rate swap agreements in fiscal 2009, each with two-year terms, to fix the interest rates on a total of $45.0 million of its variable-interest rate debt. The interest rate swap for $20.0 million of debt expired in May 2010 and the interest rate swap for $25.0 million of debt expired in November 2010.
On March 1, 2011, Gerber amended and restated its credit agreement for its revolving credit facility. This amendment is not expected to significantly impact interest expense, though the new interest rate options are slightly lower than the previous interest pricing options. Gerber had previously amended its credit facility in December 2010 to permit the sale of Gerber Coburn net assets, among other items. The two amendments resulted in a $0.2 million loss for the write-off of certain deferred financing costs. In fiscal 2010, Gerber incurred a $0.4 million early debt extinguishment charge in connection with a November 2009 amendment and the early repayment of $6.0 million in principal of outstanding variable rate demand industrial development bonds. In fiscal 2009, Gerber incurred a $0.3 million loss for the write-off of certain deferred financing costs in connection with a March 2009 credit facility amendment.
In February 2011, Gerber exchanged an owned facility in Tolland, Connecticut for a leased facility in South Windsor, Connecticut. After the exchange, Gerber incurred a financing obligation with resulting interest expense. Interest expense from this obligation was $0.2 million in fiscal 2011. In May 2011, the South Windsor facility was sold and the financing obligation was extinguished. The Tolland facility that remains under lease was evaluated at the sale date of the South Windsor facility and resulted in a capital lease obligation initially of $10.3 million. The amortization of this lease obligation will result in future interest expense of approximately $0.3 million in fiscal 2012.
Interest expense in fiscal 2011 decreased $1.1 million. The decrease was net of the write-off of deferred financing fees of $0.2 million and interest expense from the financing obligation of $0.2 million referenced above, and benefited from lower debt levels, the expiration of unfavorable interest rate swaps and the lower interest rates associated with the March 2011 credit facility amendment. Interest expense in fiscal 2010 increased $0.8 million. Interest rates charged on credit facility borrowings were increased 1.0 percentage point as a result of the March 2009 amendment. The higher rates were charged for twelve full months of fiscal 2010 and only for two months of fiscal 2009, which resulted in an increase in the weighted-average credit facility interest rates in fiscal 2010. In fiscal 2010, Gerber repaid $28.5 million of its outstanding debt, and the resulting lower debt levels partially offset the increased interest from higher weighted-average credit facility interest rates.
Gerber allocated interest expense to discontinued operations, as proceeds from the sales of Gerber Coburn’s net assets, FOBA and ND Graphics were required to reduce the outstanding credit facility obligation. Gerber allocated $0.8 million of interest expense to discontinued operations for fiscal 2011, $1.6 million for fiscal 2010 and $1.6 million for fiscal 2009.
31
Income Tax Expense (Benefit)
|
For the Fiscal Years Ended April 30,
|
||||||||||
|
2011
|
2010
|
2009
|
||||||||
|
Effective tax rate
|
(4.0
|
%)
|
41.6
|
%
|
134.2
|
%
|
||||
Gerber’s fiscal 2011 effective tax rate differed from the statutory rate of 35.0 percent primarily as a result of international tax on repatriation of foreign earnings and the nondeductible write-off of goodwill. This was partially offset by a benefit from international tax rate differences.
Gerber’s fiscal 2010 effective tax rate differed from the statutory rate of 35.0 percent as a result of the favorable settlement of a foreign tax audit, benefits from the utilization of certain foreign net operating losses which had been previously reserved, international tax rate differences and changes in earnings mix.
During fiscal 2009, Gerber merged its two French subsidiaries in order to avoid redundant administrative costs and simplify the capital structure of the entities. The total of net operating loss carryforwards available with respect to these subsidiaries immediately prior to the merger was $10.3 million. As a result, it is more likely than not that the tax benefits from the loss carryforwards of the merged entity will be realized, and accordingly Gerber reversed a $3.2 million valuation reserve against the loss carryforwards. Gerber's effective tax rate would have been 57.4 percent for fiscal 2009, excluding the non-recurring tax benefit from the merger of the French subsidiaries, as compared with the statutory rate of 35.0 percent. The remaining 22.4 percentage point difference from the statutory rate of 35.0 percent primarily reflected adjustments to tax contingencies and the effects of international rate differences.
As of April 30, 2011, Gerber had net deferred tax assets of approximately $48.6 million, of which approximately $42.0 million related to the United States. In each tax jurisdiction, deferred tax assets are assessed for realizability based on all evidence available, including historical earnings, projected earnings and tax planning strategies. A component of these assessments includes the examination of historical cumulative trailing three year pretax book income (loss) on a quarterly basis. If there is historical cumulative three-year pretax book income, Gerber considers this to be strong positive evidence indicating an ability to utilize the deferred tax assets in the future. Absent the existence of any negative evidence outweighing the positive evidence of cumulative three-year pretax book income, Gerber does not record a valuation allowance for the deferred tax assets. If there is historical cumulative three-year pretax book losses, Gerber then examines those historical three-year pretax losses to determine whether any unusual or abnormal events occurred in that period which would cause the results not to be an indicator of future performance. Gerber then normalizes historical three-year pretax results by excluding abnormal items that are not expected to recur in future periods. If, after excluding these non-recurring items, there is “normalized” historical three-year pretax book income, Gerber considers this strong positive evidence that the deferred tax assets will be realized in the future. Gerber then considers and assesses any additional positive or negative evidence relating to the potential realization of the deferred tax assets. After reviewing and weighing all of the positive and negative evidence, if the positive evidence outweighs the negative evidence, then no valuation allowance is recorded. If the negative evidence outweighs the positive evidence, then a valuation allowance is recorded for all, or a portion of, the deferred tax assets. Given its recent losses within the United States, Gerber is closely monitoring the realizability of the U.S. deferred tax assets. As of April 30, 2011, Gerber expected that the recorded U.S. net deferred tax assets are fully recoverable. As of the same date, the assessment of the realizability of deferred tax assets in Belgium resulted in a valuation allowance of $0.6 million being recorded. In each tax jurisdiction, if future reassessment of the realizability results in management’s determination that it is more likely than not that these assets would not be realized, a valuation reserve would be recorded.
Discontinued Operations
On December 31, 2010, Gerber completed the sale of substantially all of the assets, properties, rights and interests primarily or solely related to the Gerber Coburn Unit, which operated the company’s ophthalmic lens processing business. The Gerber Coburn Unit was engaged in the business of designing, manufacturing, marketing and providing computer-integrated lens processing systems to retail outlets, eye-care professionals and independent lens production laboratories and supplying spare parts and consumables and servicing such systems.
Discontinued operations for fiscal 2011 included a $0.5 million gain on the sale of Gerber Coburn’s net assets and a $17.2 million loss on discontinued operations of the Gerber Coburn business. The loss on discontinued operations included a $16.9
32
million non-cash goodwill impairment charge. During the second quarter of fiscal 2011, which ended October 31, 2010, Gerber concluded that there was evidence that the fair value of the Ophthalmic Lens Processing reporting unit had decreased below the reporting unit’s book value as a result of the potential sales process for the Ophthalmic Lens Processing segment assets and therefore performed an interim goodwill impairment test. The results of the first step of the goodwill impairment test as of October 31, 2010 indicated potential impairment, as the fair value of the reporting unit was less than the book value. The primary measure of fair value was the purchase price offered in a letter of intent for sale of the assets that was being considered by Gerber. The second step of the impairment test was performed to determine the potential impairment loss. The second step of the goodwill impairment test required Gerber to calculate the implied fair value of goodwill by allocating the fair value of the reporting unit to all assets and liabilities of that reporting unit, including unrecognized intangible assets, as if the reporting unit had been acquired in a business combination. As a result of that test, there was no excess fair value to allocate to goodwill. Therefore, Gerber recorded a $16.9 million goodwill impairment charge during the fiscal quarter ended October 31, 2010.
The fiscal 2011 loss on sale of Gerber Coburn’s net assets included the establishment of a $2.0 million restructuring accrual for future contractual lease payments, less expected sublease income, under an operating lease associated with a facility that is being subleased by Coburn Technologies, Inc.
The remaining discontinued operations activity in fiscal 2011 primarily related to changes in estimated expenses incurred in fiscal 2010 associated with the discontinued operations of FOBA, ND Graphics, Gerber Coburn Australia and Spandex New Zealand.
In fiscal 2010, Gerber sold FOBA to ALLTEC Angewandte Laserlicht Technologie GmbH, the laser business unit of Videojet Technologies Inc, for a net sales price of approximately $8.8 million. FOBA, acquired in October 2008 as part of the acquisition of Virtek, was sold because it was not considered a core strategic focus for Gerber. Also in fiscal 2010, Gerber sold substantially all of the assets and liabilities of ND Graphics, a Canadian business unit of Gerber Scientific Products within the Sign Making and Specialty Graphics segment, to a group of investors led by the President of ND Graphics for a net sales price of approximately $5.3 million. Gerber also closed the majority of its Spandex Poland, Spandex New Zealand and Gerber Coburn Australia operations during fiscal 2010. The results of the Spandex Poland and Spandex New Zealand business were previously reported within the Sign Making and Specialty Graphics segment and the results of the Gerber Coburn Australia operations were previously reported within the Ophthalmic Lens Processing segment.
SEGMENT REVIEW
Gerber is a leading worldwide provider of equipment, software and related services in the sign making, specialty graphics, packaging, apparel and industrial markets. Subsequent to the sale of Gerber Coburn’s net assets, Gerber’s operations are classified into two reportable operating segments: Sign Making and Specialty Graphics and Apparel and Industrial. The Sign Making and Specialty Graphics reportable operating segment is comprised of the Gerber Scientific Products and Spandex business units. In fiscal 2011, management realigned the Gerber Innovations, or “GI,” business under the Apparel and Industrial segment and reclassified all historical segment reporting of GI from the Gerber Scientific Products business unit of the Sign Making and Specialty Graphics segment to the Apparel and Industrial segment. The management realignment of the GI business was executed for expected synergies from the integration of GI manufacturing into a Connecticut manufacturing facility, which is primarily used for Apparel and Industrial segment production needs, as well as for other benefits to the GI business from the Apparel and Industrial segment service organization. Historical financial information in this report has been reclassified to move the results of the GI business from the Sign Making and Specialty Graphics segment to the Apparel and Industrial segment.
Sign Making and Specialty Graphics
Gerber services, markets, sells and distributes printing equipment, software and aftermarket supplies to sign making and specialty graphics shops and distributors. Gerber manufactures and designs thermal printers, and through April 30, 2011, inkjet printers. Future periods will not have equipment revenue from GSP’s inkjet product line as Gerber determined in April 2011 that the flatbed printer market could not support its long-term growth and earnings objectives, and thus discontinued the manufacturing of this equipment. While market demand for inkjet printers is outpacing that of thermal printers, Gerber maintains a leadership position in the thermal imaging products line and believes that there is a continuing role for thermal imaging printers due to the large base of thermal printers still in use today. Spandex's sales consist of sales of GSP and third-party equipment and aftermarket supplies, including inks and vinyls. Aftermarket supplies represent the majority of Spandex’s
33
revenue and these sales typically provide a steady stream of revenue, although volumes fluctuate based on external demand for signage and seasonality.
|
For the Fiscal Years Ended April 30,
|
||||||||||||||||||||||||||||||||||||
|
2011
|
2010
|
2009
|
||||||||||||||||||||||||||||||||||
|
In thousands
|
GSP
|
Spandex
|
Total
|
GSP
|
Spandex
|
Total
|
GSP
|
Spandex
|
Total
|
|||||||||||||||||||||||||||
|
Revenue
|
$
|
37,922
|
$
|
228,063
|
$
|
265,985
|
$
|
36,032
|
$
|
211,981
|
$
|
248,013
|
$
|
48,004
|
$
|
224,960
|
$
|
272,964
|
||||||||||||||||||
|
Operating (loss) income
|
$
|
(13,520
|
)
|
$
|
18,998
|
$
|
5,478
|
$
|
(5,486
|
)
|
$
|
12,461
|
$
|
6,975
|
$
|
(1,060
|
)
|
$
|
10,459
|
$
|
9,399
|
|||||||||||||||
Fiscal 2011 segment revenue increased $18.0 million, or 7.2 percent, and included the unfavorable impact of foreign currency translation on Spandex’s revenue of approximately $2.2 million compared with fiscal 2010. The increase in revenue reflected improved economic conditions resulting in higher aftermarket sales and also improved equipment sales, particularly at Spandex. Gerber believes that the Spandex growth was also fueled by marketing efforts highlighting Spandex’s comprehensive portfolio of products and adding new OEM products to its hardware portfolio. Fiscal 2011 segment revenue included $4.8 million from sales of GSP manufactured U.V. inkjet printers, which will not continue in fiscal 2012 as a result of Gerber’s decision to discontinue this product line. Fiscal 2011 revenue was adversely impacted at GSP by approximately $1.0 million from customer discounts and concessions related to the fourth quarter decision to discontinue manufacturing the inkjet product line.
Fiscal 2010 segment revenue decreased $25.0 million, or 9.1 percent, and included the favorable impact of foreign currency translation on Spandex’s revenue of approximately $3.6 million compared with fiscal 2009. Gerber believes that the weak global economy, which caused uncertainty and reduced end-market product demand for its customers, combined with reduced credit availability to finance purchases, adversely affected demand for the segment's products and caused the majority of the remaining revenue decline. Fiscal 2009 equipment revenue benefited from the initial launch of the Solara ion in that fiscal year. GSP did not record any patent licensing revenue in fiscal 2010, while it recorded $0.5 million of such revenue in fiscal 2009. Licensing revenue is not a predictable, recurring revenue source.
The decision to stop manufacturing the GSP inkjet product line resulted in related expenses in fiscal 2011 that included severance costs of $1.1 million, inventory impairment charges of $0.8 million, customer concessions and discounts of $1.0 million, and unfavorable purchase obligation commitments of $1.2 million. The GSP goodwill was determined to be impaired and resulted in a full impairment charge of its goodwill of $5.9 million. These charges, combined with the cessation of temporary cost control measures in fiscal 2011, resulted in the operating loss reported by GSP in fiscal 2011. Spandex reported $6.5 million higher operating profit in fiscal 2011 driven by the gross profit impact of higher revenue volume, the benefit of cost savings actions and the positive impact of foreign currency translation of approximately $0.8 million. Operating profit for Spandex included severance costs of approximately $0.5 million.
For fiscal 2010, Spandex reported improved operating income, despite lower revenue in fiscal 2010. This improvement occurred despite a $1.6 million reduction in vendor rebates in fiscal 2010 from fiscal 2009 as a result of lower volume purchases, and was driven by the positive impact of cost savings measures that included a reduced workforce. GSP’s operating loss in fiscal 2010 reflected unfavorable absorption of fixed manufacturing costs on a lower revenue base and also included incremental warranty costs associated with the Solara ion. GSP’s operating loss in fiscal 2010 was partially mitigated by cost savings actions. GSP’s operating loss in fiscal 2009 was partially mitigated by a $0.9 million non-cash benefit attributable to management’s decision to utilize a leased facility that was previously vacated.
34
Apparel and Industrial
The Apparel and Industrial segment is focused on growth primarily through continued penetration of Asian markets and expansion through new product offerings and bolt-on acquisitions. In fiscal 2010, Gerber acquired Yunique, a software company located in New York which has enhanced Gerber’s existing product lifecycle management and product data management software offerings. In fiscal 2009, Gerber acquired Gamma, a China-based manufacturer of equipment for apparel and flexible materials companies, and Virtek, a manufacturer of precision laser-based templating and inspection solutions used in composites material manufacturing. Virtek, headquartered in Canada, primarily serves global customers in the prefabricated construction and transportation industries.
|
For the Fiscal Years Ended April 30,
|
||||||||||||
|
In thousands
|
2011
|
2010
|
2009
|
|||||||||
|
Segment revenue
|
$
|
196,546
|
$
|
165,226
|
$
|
172,421
|
||||||
|
Segment operating income
|
$
|
17,936
|
$
|
18,289
|
$
|
15,334
|
||||||
Fiscal 2011 segment revenue increased $31.3 million, or 19.0 percent, and included the negative impact of approximately $0.5 million from foreign currency translation compared with fiscal 2010. The increase in fiscal 2011 reflected improved economic conditions, higher revenue from Asian markets and increased sales of recently launched key new products that included the GERBERplotter XLp and the Z7 GERBERcutter, which is a high performance multi-ply cutting system. The fiscal 2011 results reflected orders of approximately $3.6 million received from one customer. Larger orders for equipment may be periodic or non-recurring. Fiscal 2011 also included incremental revenue from the November 2009 acquisition of Yunique of $1.4 million. Within greater China, a key growth market, revenue was $27.5 million in fiscal 2011, $23.4 million in fiscal 2010 and $18.5 million in fiscal 2009. The improvement in fiscal 2011 demonstrates the economic improvements in that region, coupled with the success of recently launched new products by GT.
In May 2011, GT announced its plans to relocate the manufacture of its computer-automated material spreading equipment from Ikast, Denmark to Shanghai, China. The move supports Gerber's ongoing commitment to deliver in-country support to its customers in China and throughout Asia Pacific and provide its customers around the world with the competitive advantage and leverage of Gerber's global supply chain. Products slated for the move include GERBERspreader™ models XLs50 and XLs125, spreading tables, material feeding systems and other spreading-related options.
Fiscal 2010 segment revenue decreased $7.2 million, or 4.2 percent, and reflected the positive impact of approximately $2.0 million from foreign currency translation compared with fiscal 2009. Gerber believes that the decline in revenue was primarily attributable to the weak global economy, which created uncertainty, reduced end-market product demand for customers and reduced credit availability to finance purchases. Partially offsetting these macroeconomic impacts, fiscal 2010 revenue included incremental revenue of $6.8 million from the acquisitions of Yunique, Virtek and Gamma. Gerber believes the new product launch of the Z7 GERBERcutter in fiscal 2009 was negatively impacted by global economic factors.
Fiscal 2011 segment operating income decreased only $0.4 million, despite the restoration of certain temporary cost cutting measures implemented in fiscal 2009 and fiscal 2010. Improved revenue volume drove an increase in gross profits. The increase was partially offset by higher commissions and travel-related expenses, as well as unfavorable workers’ compensation self-insurance expense of $0.3 million. Restructuring and other expenses of $4.0 million were incurred in fiscal 2011 primarily as a result of the relocation of the Gerber Innovations plant from Massachusetts to an existing Connecticut facility and planned efforts to relocate Denmark manufacturing operations to China. The relocation of Gerber Innovations is expected to save Gerber approximately $0.9 million on an annualized basis and was completed during fiscal 2011. The relocation of the Denmark facility is expected to save Gerber approximately $2.0 million on an annualized basis and will be completed during fiscal 2012. In fiscal 2012, Gerber expects to incur costs associated with the facility move.
Fiscal 2010 segment operating income increased $3.0 million and primarily reflected the positive impact of permanent and temporary cost reduction strategies and a full year of profit contribution from the Virtek acquisition as well as a $0.5 million noncash benefit from a favorable sales tax accrual adjustment. Segment operating income in fiscal 2010 was negatively impacted by lower software and equipment gross profit contribution and unfavorable absorption of fixed manufacturing costs as a result of the lower factory volume. Workforce reduction actions, discretionary spending controls and lower sales and marketing expenses mitigated the full impact of lower revenue on operating income for fiscal 2010. Fiscal 2010 results included severance costs of $0.4 million related to the termination of employees that became redundant with the Yunique acquisition. Fiscal 2009
35
results included severance costs of $1.0 million related to fiscal 2009 workforce reductions and the related annual cost savings of the reduced workforce were not fully realized until fiscal 2010.
Unallocated Expenses
|
For the Fiscal Years Ended April 30,
|
||||||||||||
|
In thousands
|
2011
|
2010
|
2009
|
|||||||||
|
Unallocated expenses
|
$
|
2,577
|
$
|
3,142
|
$
|
2,884
|
||||||
Unallocated expenses represent shared overhead costs that were previously allocated to the Ophthalmic Lens Processing segment and remained with Gerber following the sale of Gerber Coburn’s assets. Gerber is implementing cost control measures to mitigate these costs in fiscal 2012 and any remaining costs that are not mitigated will be absorbed by the remaining business units beginning May 1, 2011.
Corporate Expenses
|
For the Fiscal Years Ended April 30,
|
||||||||||||
|
In thousands
|
2011
|
2010
|
2009
|
|||||||||
|
Corporate operating expenses
|
$
|
8,873
|
$
|
9,315
|
$
|
10,901
|
||||||
|
Unallocated company-wide expenses
|
16,421
|
10,809
|
10,480
|
|||||||||
|
Operating expenses
|
$
|
25,294
|
$
|
20,124
|
$
|
21,381
|
||||||
Corporate operating expenses include expenses of the corporate general management, legal, finance and internal audit staffs and public company compliance costs. Corporate unallocated company-wide expenses include company-wide stock-based compensation costs, strategic expenses, incentive compensation costs, insurance costs, pension expense for the U.S. frozen defined benefit plans, and asset impairment charges.
An overall corporate workforce reduction was initiated in fiscal 2009 and led to the decrease in corporate operating expenses in fiscal 2011. Partially offsetting this decrease, temporary cost savings measures from fiscal 2010 were restored in fiscal 2011, resulting in higher wages in fiscal 2011. As of April 30, 2011, all temporary cost reductions had been restored. Unallocated company-wide expenses included bonus expense of $4.3 million, fixed asset impairment charges of $1.2 million primarily associated with the decision to cease manufacturing of GSP’s inkjet manufacturing business, and patent impairment charges of $0.8 million. The effect of these factors was partially offset by lower pension expense of $1.1 million and lower severance costs of $0.9 million. The patent impairment charges resulted from Gerber’s decision to abandon several patents in fiscal 2011 after an evaluation of the expected future benefits of the patents as compared with anticipated ongoing patent maintenance fees. Gerber does not anticipate significant patent impairment charges in fiscal 2012 from abandonment. Pension costs in fiscal 2012 are expected to be approximately $0.5 million less than fiscal 2011 expenses.
In fiscal 2009 and fiscal 2010, Gerber implemented certain workforce reductions that included the elimination of certain positions in the corporate finance, internal audit and new product development staff. The benefits from these cost savings were reflected in the reduction of corporate operating expenses in fiscal 2010, as well as in lower audit and financial consulting fees. The increase in unallocated company-wide expenses in fiscal 2010 was related to severance of $0.9 million, acquisition fees of $0.6 million related to Yunique, strategic expenses of $0.6 million and higher company-wide stock-based compensation of $0.5 million. These increases were primarily offset by $2.3 million of lower pension costs than in fiscal 2009 as a result of the pension plan freeze in fiscal 2009. Fiscal 2009 pension expenses included a $0.5 million curtailment loss that was associated with the pension plan benefits freeze implemented as of April 30, 2009.
FINANCIAL CONDITION
LIQUIDITY AND CAPITAL RESOURCES
Gerber's primary sources of liquidity are internally generated cash flows from operations and available borrowings under the company's senior secured revolving credit facility, which was amended and restated on March 1, 2011. These sources of liquidity are subject to all of the risks of Gerber's business, including those described in Item 1A, "Risk Factors," in this Annual
36
Report on Form 10-K. These sources of liquidity could be adversely affected by, among other factors, a decrease in demand for Gerber's products, charges that may be required because of changes in market conditions or other costs of doing business, delayed product introductions or adverse changes to availability of funds.
Adverse conditions in the credit and financial markets have reduced liquidity and credit availability and increased volatility in prices of securities across most markets. Gerber performed an assessment of this difficult financial environment and challenging global credit market situation. As a result of the impact of credit markets on revenue, Gerber has taken measures to control costs in order to partially offset the potential impact of further revenue declines on its results of operations and cash flows from operations. Gerber amended and restated its credit agreement with its lenders on March 1, 2011 which, among other changes, increased Gerber’s borrowing capacity from $60.0 million to $75.0 million and extended the maturity of the facility from January 31, 2012 to March 1, 2016. After assessing the consequences of this difficult financial environment, though the duration and extent of future market turmoil cannot be predicted, Gerber does not currently expect that the credit market conditions will have a significant negative impact on its liquidity, financial position or operations in fiscal 2012.
As of April 30, 2011, cash balances were $10.9 million, net debt was $10.2 million and $45.2 million was available for borrowing based on borrowings outstanding April 30, 2011 under the revolving credit facility and facility financial covenants. Gerber believes that cash on hand, cash flows from operations and borrowings expected to be available under the revolving credit facility will enable Gerber to meet its ongoing cash requirements for at least the next 12 months. After this period, Gerber may require additional capital for investment in its business. The amount and timing of any additional investment will depend on the anticipated demand for Gerber's products, the availability of funds and other factors, including potential limitations under the merger agreement for the acquisition of Gerber discussed elsewhere in this report. In May 2011, Gerber sold its South Windsor, Connecticut facility for a net sales price of approximately $6.6 million. This cash was utilized to reduce its outstanding debt. During the fiscal quarter ended July 31, 2009, Gerber filed a shelf registration statement for $35.0 million of debt securities, common stock, preferred stock, depositary shares, warrants, rights and units that Gerber may offer and sell during the three-year effective period of the shelf registration. No securities had been sold pursuant to the shelf registration as of April 30, 2011.
The actual amount and timing of Gerber's future capital requirements may differ materially from the company's estimates depending on the demand for its products, new market developments or business expansion requirements, including potential business acquisitions. If the company's plans or assumptions change or prove to be inaccurate, the foregoing sources of funds may prove to be insufficient, which may require Gerber to seek additional capital. Additional sources of such capital may include equity and debt financing, subject to limitations imposed under the merger agreement for the acquisition of Gerber discussed elsewhere in this report. If Gerber believes it can obtain additional financing on acceptable terms, it may seek such financing at any time, to the extent that market conditions and other factors permit it to do so. Any inability of Gerber to generate the sufficient funds that it may require or to obtain such funds under reasonable terms could limit its ability to increase revenue or operate profitability.
The following table provides information about Gerber's capitalization as of the dates indicated:
|
April 30,
|
||||||||
|
In thousands except ratio amounts
|
2011
|
2010
|
||||||
|
Cash and cash equivalents
|
$ | 10,916 | $ | 11,305 | ||||
|
Working capital
|
$ | 68,041 | $ | 76,549 | ||||
|
Total debt
|
$ | 21,110 | $ | 45,000 | ||||
|
Net debt (total debt less cash and cash equivalents)
|
$ | 10,194 | $ | 33,695 | ||||
|
Shareholders' equity
|
$ | 148,221 | $ | 158,206 | ||||
|
Total capital (net debt plus shareholders' equity)
|
$ | 158,415 | $ | 191,901 | ||||
|
Current ratio
|
1.69:1
|
1.85:1
|
||||||
|
Net debt-to-total capital ratio
|
6.4 | % | 17.6 | % | ||||
37
Cash Flows
The following table provides information about Gerber's cash flows for the fiscal years indicated:
|
For the Fiscal Years Ended April 30,
|
||||||||||||
|
In thousands
|
2011
|
2010
|
2009
|
|||||||||
|
Net cash provided by operating activities
|
$
|
14,696
|
$
|
25,096
|
$
|
9,774
|
||||||
|
Net cash provided by (used for) investing activities
|
$
|
13,648
|
$
|
4,535
|
$
|
(40,418
|
)
|
|||||
|
Net cash (used for) provided by financing activities
|
$
|
(26,876
|
)
|
$
|
(28,972
|
)
|
$
|
30,139
|
||||
Cash Provided by Operating Activities – Cash provided by operating activities in fiscal 2011 reflected improved economic conditions and the impact of increased revenue volume and the related collections. Working capital requirements remained approximately flat in fiscal 2011, with requirements for accounts payable, other liabilities and inventories being offset by an increase in incentive compensation of $4.5 million and severance accruals of $4.1 million outstanding at April 30, 2011. These accruals will be paid in fiscal 2012, except for certain severance obligations which extend into fiscal 2013 related to the Denmark restructuring action. Contributions to Gerber’s United States pension plans in fiscal 2011 were $1.0 million. Contributions to Gerber’s United States pension plans in fiscal 2012 are expected to be approximately $4.8 million.
Cash provided by operating activities in fiscal 2010 reflected operating earnings and working capital improvements. Gerber realized a significant amount of cash from its accounts receivable in fiscal 2010 as a result of strong cash collections. Gerber also reduced its inventories from April 30, 2009 levels, which favorably impacted cash required for inventory purchases. Contributions to Gerber’s nonqualified pension plan in fiscal 2010 were $0.6 million. There were no contributions required for Gerber’s qualified pension plan in fiscal 2010.
Cash provided by operating activities in fiscal 2009 reflected operating earnings and working capital improvements. As in fiscal 2010, Gerber realized a significant amount of cash from its accounts receivable in fiscal 2009 as a result of strong cash collections. Gerber also reduced its inventories from April 30, 2008 levels. Cash was utilized to pay vendors and fiscal 2008 bonuses, as well as pension plan contributions of $6.4 million.
Cash Provided by (Used for) Investing Activities – Cash provided by investing activities in fiscal 2011 was primarily from the sale of Gerber Coburn. Offsetting these proceeds, Gerber used cash for investing activities of $5.4 million for capital expenditures. Capital expenditures included investments in capitalized software costs. Fiscal 2012 capital expenditures are expected to be approximately $10.0 million to $11.0 million and include anticipated capitalized software development costs.
Cash provided by investing activities in fiscal 2010 was primarily from the sale of FOBA and ND Graphics. Offsetting these proceeds, Gerber used cash for investing activities of $4.5 million for capital expenditures and $3.5 million for business acquisitions. Capital expenditures included investments in capitalized software costs. The business acquisition payments included Gerber’s initial payment of $2.0 million for the purchase of Yunique and payments to the former owners of Data Technology and Gamma in accordance with the terms of the purchase agreements for those acquisitions.
Cash used for investing activities in fiscal 2009 included $34.3 million in the aggregate for the acquisitions of Virtek and Gamma and $8.2 million for capital expenditures. Capital expenditures included investments in information technology for customer relationship management software, machinery, equipment and tooling for new products and capitalized software costs.
Cash (Used for) Provided by Financing Activities – Cash used for financing activities in fiscal 2011 was primarily for repayments of debt and payments of credit facility amendment financing fees. The significant debt repayment was facilitated with cash from operating activities and from the sale of Gerber Coburn assets. Other financing activities included financed payments for software maintenance and service of Gerber’s enterprise resource planning system and payments towards the financing obligation related to the non-cash exchange of the Tolland, Connecticut facility for the South Windsor, Connecticut facility. In fiscal 2012, after the sale of the South Windsor, Connecticut facility, Gerber will incur financing payments for capital lease principal payments associated with the Tolland, Connecticut facility.
Cash used for financing activities in fiscal 2010 was for repayments of debt and payments of credit facility amendment financing fees. Other financing activities included financed payments for software maintenance and service of Gerber’s enterprise resource planning system.
38
Cash provided by financing activities in fiscal 2009 was primarily from borrowings under the revolving credit facility to finance acquisitions and other operating activities, and was partially offset by $1.2 million of financing costs incurred to amend the credit facility during fiscal 2009.
Financial Condition – As of April 30, 2011, the United States dollar had weakened from April 30, 2010 against the euro, the pound sterling and the Canadian and Australian dollars, resulting in higher translated euro, pound sterling, Canadian and Australian dollar-denominated assets and liabilities compared with April 30, 2010. The most significant portion of Gerber's international assets and liabilities is denominated in the euro. Gerber’s consolidated balance sheet as of April 30, 2010 included assets and liabilities related to the Gerber Coburn business unit that was disposed of in fiscal 2011.
Net accounts receivable decreased to $78.3 million as of April 30, 2011 from $80.9 million as of April 30, 2010. The decrease was primarily attributable to the sale of Gerber Coburn and was partially offset by foreign currency translation. Days sales outstanding improved to 56 days as of April 30, 2011 from 60 days as of April 30, 2010.
Inventories decreased to $55.3 million as of April 30, 2011 from $59.8 million as of April 30, 2010. The reduction primarily reflected the sale of Gerber Coburn and was partially offset by foreign currency translation. Lower of cost or market reserves of $0.8 million were established for inventories related to the GSP inkjet product line, given the fiscal 2011 decision to cease production. Inventory turnover increased to 6.4 times annually as of April 30, 2011 from 5.5 times annually as of April 30, 2010.
Assets held for sale of $6.7 million as of April 30, 2011 included the property in South Windsor, Connecticut that was sold in May 2011.
Net property, plant and equipment decreased to $30.7 million as of April 30, 2011 from $32.2 million as of April 30, 2010, which reflected depreciation expense of $6.1 million and the sale of Gerber Coburn, and was partially offset by capital expenditures of $5.4 million and the impact of foreign currency translations.
Goodwill decreased to $64.6 million as of April 30, 2011 from $83.7 million as of April 30, 2010, as a result of goodwill impairment of both the Ophthalmic Lens Processing reporting unit and the Gerber Scientific Products reporting unit during fiscal 2011, and was partially offset by the impact of foreign currency translation.
Accounts payable and other current liabilities increased to $85.3 million as of April 30, 2011 from $77.3 million as of April 30, 2010, primarily as a result of incentive compensation accruals of $4.5 million, severance accruals of $4.1 million and the impact of foreign currency translation, and were partially offset by a reduction of certain liabilities related to the Gerber Coburn disposition.
The accrued pension benefit liability decreased to $35.6 million as of April 30, 2011 from $36.9 million as of April 30, 2010, which primarily reflected the impact of the valuation at April 30, 2011. The valuation resulted in better than estimated asset returns, offset by a discount rate of 5.4 percent used to value the liabilities as of April 30, 2011 compared to 5.8 percent as of April 30, 2010.
Other long-term liabilities increased to $14.9 million as of April 30, 2011 from $8.9 million as of April 30, 2010, which primarily reflected the financing obligation of $6.4 million as of April 30, 2011 related to the non-cash building exchange of the Tolland, Connecticut facility for the South Windsor, Connecticut facility. This obligation will be extinguished in May 2011 in connection with the sale of the South Windsor, Connecticut facility and a capital lease obligation will be established for the Tolland, Connecticut facility. The estimated payment of the Yunique earn-out of approximately $0.9 million for the first year was classified as long-term as of April 30, 2010 and short-term as of April 30, 2011.
Long-term Debt – On March 1, 2011, Gerber amended and restated the credit agreement for its revolving credit facility, or the “credit agreement,” with several financial institutions specified in the credit agreement and RBS Citizens, N.A., in its capacity as administrative agent for the lenders. Among other changes, the amendment extended the maturity of the facility to March 1, 2016 from January 31, 2012, modified certain financial covenants as described below and increased the maximum borrowing capacity to $75.0 million from $60.0 million. The credit agreement is Gerber’s primary source of debt.
Outstanding borrowings under the credit agreement accrue interest at an annual rate equal to, at Gerber's option, the defined
39
Applicable Base Rate, or "ABR," the London Interbank Offered Rate, or "LIBOR," or the Euro Interbank Offered Rate, or “EURIBOR,” plus a variable margin. An annual commitment fee is payable quarterly based upon the unused amount of the credit agreement at a specified margin.
The margins and commitment fees are based on Gerber's ratio of Total Funded Debt to Consolidated EBITDA (as defined for purposes of the credit agreement), as shown in the table below:
|
Total Funded Debt to Consolidated EBITDA Ratio
|
ABR Margin
(basis points)
|
LIBOR and
EURIBOR Margin
(basis points)
|
Commitment Fee (basis points)
|
|||||||||
|
2.50x and greater
|
200.0 | 300.0 | 50.0 | |||||||||
|
1.75x to less than 2.50x
|
162.5 | 262.5 | 37.5 | |||||||||
|
1.00x to less than 1.75x
|
125.0 | 225.0 | 25.0 | |||||||||
|
Less than 1.00x
|
87.5 | 187.5 | 25.0 | |||||||||
Gerber incurred fees and related costs in connection with this amendment and restatement of approximately $0.9 million, which will be amortized over the remaining term of the agreement. As a result of the amendment, Gerber incurred $0.1 million of interest expense associated with the write-off of a portion of previously capitalized deferred financing fees. Gerber had previously amended its credit agreement in November 2009 and incurred $0.2 million of interest expense associated with the write-off of a portion of previously capitalized deferred financing fees.
The credit agreement contains customary representations and warranties, affirmative and negative covenants, financial covenants and events of default. Gerber's performance under the credit agreement is collateralized by first-priority liens on selected assets and the pledge of capital stock of certain of Gerber’s subsidiaries. The financial covenants in the credit agreement require Gerber to maintain a maximum ratio of Total Funded Debt to Consolidated EBITDA of 3.25:1, a minimum ratio of Consolidated EBIT to Consolidated Interest Expense of 3.00:1, and a maximum capital expenditures covenant (all as defined for purposes of the credit agreement). A minimum asset coverage ratio covenant is required quarterly, and only if the ratio of Total Funded Debt to Consolidated EBITDA is greater than 2.25:1.
The amendment and restatement modified the definitions of Consolidated EBIT and Consolidated EBITDA for purposes of the foregoing financial covenants, providing Gerber with enhanced operating flexibility under the Credit Agreement. These modifications allow the add-back of certain losses and expenses, non-cash charges, non-recurring fees and expenses associated with the credit agreement amendments to the calculations of Consolidated EBIT and Consolidated EBITDA and require the deduction of certain non-cash gains.
Gerber's future compliance with the financial covenants under the credit agreement will depend primarily on its success in generating sufficient operating cash flows, which could be adversely affected by various economic, financial and industrial factors. Noncompliance with the covenants would constitute an event of default under the credit facility, potentially allowing the lenders to accelerate repayment of any outstanding borrowings. In the event of failure by Gerber to continue to be in compliance with any covenants, Gerber would seek to negotiate amendments to the applicable covenants or obtain compliance waivers from its lenders. Gerber was in compliance with its financial covenants as of April 30, 2011 as illustrated in the table below:
|
Description
|
Covenant
|
Actual as of April 30, 2011
|
|
Total Funded Debt to Consolidated EBITDA
|
Maximum 3.25:1
|
1.27:1
|
|
Consolidated EBIT to Consolidated Interest Expense
|
Minimum 3.00:1
|
16.10:1
|
OFF-BALANCE SHEET ARRANGEMENTS
Gerber's participation in financing arrangements to assist customers in obtaining leases with third parties constitute Gerber’s only off-balance sheet arrangements as defined in Item 303(a)(4) of the SEC's Regulation S-K. Gerber has an agreement with a major financial services institution, or "lessor," to assist Gerber's customers, or "lessees," in obtaining lease financing to purchase Gerber's equipment. Equipment is typically leased for periods of two to six years. The equipment sold collateralizes the lease receivables. In the event of default by the lessee, Gerber has a liability to the financial services institution under
40
recourse provisions once the institution repossesses the equipment from the lessee and returns it to Gerber. In most cases, Gerber then can resell the equipment, the proceeds of which are expected to substantially cover a majority of the liability to the financial services institution. As of April 30, 2011, the amount of lease receivables financed under the agreement between the external financial services institution and the lessees was $1.2 million. Gerber's net exposure related to recourse provisions under these agreements was approximately $0.7 million. As of April 30, 2011 the undiscounted accruals for expected losses under recourse provisions was not significant and as of April 30, 2010, the undiscounted accruals for the expected losses under recourse provisions was $0.4 million.
CONTRACTUAL CASH OBLIGATIONS AND COMMERCIAL COMMITMENTS
As of April 30, 2011, Gerber had the following contractual cash obligations and commercial commitments:
|
Payments Due by Period
|
||||||||||||||||||||
|
In thousands
|
Total
|
Less Than 1 Year
|
1-3 Years
|
3-5 Years
|
More than 5 Years
|
|||||||||||||||
|
Long-term debt obligations
|
$
|
21,110
|
*
|
$
|
---
|
$
|
---
|
$
|
21,110
|
*
|
$
|
---
|
||||||||
|
Lease obligations
|
50,302
|
11,634
|
18,066
|
11,077
|
9,525
|
|||||||||||||||
|
Inventory and other purchase obligations
|
23,424
|
22,808
|
616
|
---
|
---
|
|||||||||||||||
|
Qualified and non-qualified pension funding
|
10,316
|
4,860
|
1,252
|
1,299
|
2,905
|
|||||||||||||||
|
Total
|
$
|
105,152
|
$
|
39,302
|
$
|
19,934
|
$
|
33,486
|
$
|
12,430
|
||||||||||
* Principal only, excludes interest payments. The effective interest rate as of April 30, 2011 was approximately 2.6 percent and outstanding borrowings were $21.1 million.
The contractual cash obligations and commercial commitments table includes approximately $4.2 million of expected contributions in fiscal 2012 for the qualified pension plan. Although Gerber anticipates making contributions subsequent to fiscal 2012, the amounts of any such contributions have been excluded from the table, since the timing of such contributions is based on pension plan assumptions that may materially differ from actual plan activities. Amounts included in the table for pension contributions in excess of one year relate to the funding of benefit payments under Gerber's non-qualified pension plan and a small international pension plan.
The above table does not reflect potential earn-outs related to the acquisition of Yunique in fiscal 2011.
The above table does not reflect unrecognized tax benefits of $3.5 million, the timing of which is uncertain. Refer to Note 8 of the Notes to Consolidated Financial Statements in Item 15 of this Annual Report on Form 10-K for more information about such tax benefits.
CRITICAL ACCOUNTING ESTIMATES
Gerber's significant accounting policies are described in Note 1 of the Notes to Consolidated Financial Statements included in Item 15 of this Annual Report on Form 10-K. Some of those accounting policies require management to make estimates and assumptions that affect amounts reported and the most significant of these are described below. Actual results could differ from management's estimates.
Inventories – Inventories are stated at the lower of cost or market value, with cost being determined using the first-in, first-out, or "FIFO," cost method. Inventory at the Apparel and Industrial segment's foreign non-manufacturing companies is valued on a weighted-average basis, which approximates FIFO.
Gerber reviews the market value of inventory on an ongoing basis and records inventory write-downs as necessary to reflect estimated obsolescence, excess quantities and market value. The amount of these write-downs equals the difference between the cost of the inventory and the estimated market value based on assumptions about future demand and market conditions.
Excess and obsolete inventory is generally identified by comparing expected inventory usage to actual on-hand quantities and inventory write-downs are recorded when on-hand inventory is in excess of pre-defined usage estimates. Usage estimates are primarily determined by projecting historical (actual) inventory usage levels for future periods. Application of this methodology can have the effect of increasing inventory write-downs during periods of declining demand. Inventories included an $8.9 million reduction as of April 30, 2011 for the estimated lower of cost-or-market adjustment against Gerber's standard costs.
41
Goodwill – Gerber reviews the value of goodwill for impairment annually during its fourth fiscal quarter, or when events or changes in business circumstances indicate that the carrying amount of the assets may not be fully recoverable. If the fair value of these assets is less than the carrying value, Gerber may need to record an impairment charge. As of May 1, 2010, Gerber had four reporting units with goodwill, as follows: Gerber Scientific Products; Spandex; Gerber Technology; and Gerber Coburn. Gerber recorded a $16.9 million goodwill impairment charge related to Gerber Coburn reporting unit and a $5.9 million goodwill impairment charge related to the GSP reporting unit of the Sign Making and Specialty Graphics segment during fiscal 2011. No goodwill impairment was recorded during fiscal 2010 or fiscal 2009. The identification and measurement of goodwill impairment involves subjective estimation of the fair value of reporting units, using substantial estimates and assumptions that could affect whether an impairment charge is recognized and the amount thereof.
During the fiscal quarter ended October 31, 2010, prior to the sale of the Gerber Coburn Unit, Gerber concluded that there was evidence that the fair value of the Gerber Coburn reporting unit had decreased below the reporting unit’s book value as a result of the potential sales process for the Ophthalmic Lens Processing segment assets and therefore performed an interim goodwill impairment test. The results of the first step of the goodwill impairment test as of October 31, 2010 indicated potential impairment, as the fair value of the reporting unit was less than the book value. The primary measure of fair value was the purchase price proposed in a letter of intent for sale of the assets that was being considered by Gerber. The second step of the impairment test was performed to determine the potential impairment loss. The second step of the goodwill impairment test requires Gerber to calculate the implied fair value of goodwill by allocating the fair value of the reporting unit to all assets and liabilities of that reporting unit, including unrecognized intangible assets, as if the reporting unit had been acquired in a business combination. As a result of that test, there was no excess fair value to allocate to goodwill. Therefore, Gerber recorded a $16.9 million goodwill impairment charge during the fiscal quarter ended October 31, 2010, which is recorded in discontinued operations in the accompanying Consolidated Statements of Operations.
During the fourth quarter of fiscal 2011, as a result of the decision to discontinue manufacturing the inkjet printers, Gerber concluded that there was evidence that the fair value of the GSP reporting unit had decreased below the reporting unit’s book value. The results of the first step of the goodwill impairment test as of April 30, 2011 indicated potential impairment as the fair value of the reporting unit was less than the book value. The primary measure of fair value was calculated using a discounted cash flow model. The second step of the impairment test was performed to determine the potential impairment loss. The second step of the goodwill impairment test requires Gerber to calculate the implied fair value of goodwill by allocating the fair value of the reporting unit to all assets and liabilities of that reporting unit, including unrecognized intangible assets, as if the reporting unit had been acquired in a business combination. As a result of that test, there was no excess fair value to allocate to goodwill. Therefore, Gerber recorded a $5.9 million goodwill impairment charge during the fiscal quarter ended April 30, 2011.
As of April 30, 2011, Gerber had $64.6 million of goodwill assets on its consolidated balance sheet that management believes are realizable based on the estimated cash flows of the associated businesses. Of this amount, $22.5 million was attributable to the Spandex reporting unit and $42.1 million was attributable to the Gerber Technology reporting unit. To assess goodwill for impairment, internal valuation analyses are performed. Estimates of fair value are primarily determined using discounted cash flow analysis, which uses estimates and assumptions, including projected cash flows, and estimated discount rate assumptions and perpetual growth rates. A 10 percent decrease in the fair value of Gerber's reporting units that hold goodwill at the fourth quarter of fiscal 2011 evaluation date would not have resulted in any goodwill impairments. However, it is possible that the estimates and assumptions used in assessing that value, such as future sales and expense levels, may need to be revaluated in the case of further market deterioration, which could result in future impairment of those assets. As of April 30, 2011, Gerber does not believe that its goodwill is at risk of failing a step one goodwill impairment test.
Pension plans – Effective on April 30, 2009, Gerber froze future benefit accruals under the Gerber Scientific, Inc. and Participating Subsidiaries Pension Plan, or “Pension Plan,” and the Gerber Scientific, Inc. and Participating Subsidiaries Supplemental Pension Benefit Plan, or “SERP.” All benefits already accrued under the Pension Plan and the SERP remained intact, and service credits for retirement eligibility continue in accordance with the terms of each plan.
The amounts recognized in Gerber's consolidated financial statements for the qualified and nonqualified defined benefit pension plans are determined from actuarial valuations. These valuations use assumptions relating to, among other variables, the expected return on plan assets, discount rates at which liabilities could be settled and amortization methodologies for unrecognized actuarial losses. These assumptions are updated at the measurement date and are disclosed in Note 13 of the Notes to Consolidated Financial Statements included in Item 15 of this Annual Report on Form 10-K. Actual results that differ from the assumptions are accumulated and generally amortized over future periods and, therefore, affect expense recognized in
42
future periods.
The expected return on plan assets assumption is developed by considering current and expected target asset allocation, historical experience of returns by asset class type, a risk premium, an inflation estimate (weighted towards future expectations), expectations for real returns, and adjustments for anticipated or historical economic changes using a long-term investment horizon. The effects of asset diversification and periodic fund rebalancing are also considered. The long-term rate of return assumption used for determining net periodic pension expense for fiscal 2011 was 8.25 percent and will be 8.25 percent for fiscal 2012. With all other assumptions remaining constant, an increase or decrease of 0.25 percentage points in the expected long-term rate of return of the plan assets would increase or decrease fiscal 2012 consolidated income from continuing operations before income taxes by approximately $0.2 million.
As of April 30, 2010 and 2011, and for the fiscal years ended April 30, 2011 and ending April 30, 2012, the discount rate utilized for determining future pension obligations of the pension plans was or will be based on Gerber's estimated future cash payments compared to expected yields of high-quality, long-term corporate bonds from a benchmark yield curve. The discount rate used for determining net periodic pension expense was 5.80 percent for fiscal 2011 and will be 5.40 percent for fiscal 2012. With all other assumptions remaining constant, a 0.25 percentage point increase or decrease in the discount rate for the plans would not significantly increase or decrease fiscal 2012 consolidated income from continuing operations before income taxes.
The assumed rate of increase in compensation levels is no longer relevant to benefit obligations as of April 30, 2009 and thereafter as a result of the effect of the pension plan benefits freeze on April 30, 2009.
Pension expense for fiscal 2012 is expected to be approximately $0.5 million. In subsequent fiscal years, future actual pension expense will depend on future investment performance, contributions, changes in future discount rates and various other factors related to the population of participants in Gerber's pension plans.
Income taxes – Generally accepted accounting principles in the United States of America require that deferred tax assets and liabilities be recognized using enacted tax rates for the effect of temporary differences between the book and tax basis of recorded assets and liabilities. Such principles also require that deferred tax assets be reduced by a valuation allowance if it is more likely than not that some or all of the deferred tax asset will not be realized.
In assessing the need for a valuation allowance, Gerber examines historical cumulative trailing three-year pretax book income (loss) quarterly. If there is historical cumulative three-year pretax book income, Gerber considers this to be strong positive evidence indicating an ability to utilize the deferred tax assets in the future. Absent the existence of any negative evidence outweighing the positive evidence of cumulative three-year pretax book income, Gerber does not record a valuation allowance for the deferred tax assets. If there are historical cumulative three-year pretax book losses, Gerber then examines those historical three-year pretax losses to determine whether any unusual or abnormal events occurred in this time period that would cause the results not to be an indicator of future performance. As such, Gerber then normalizes historical three-year pretax results by excluding abnormal items that are not expected to recur in future periods. If, after excluding these non-recurring items, there is “normalized” historical three-year pretax book income, Gerber considers this strong positive evidence that the deferred tax assets will be realized in the future. Gerber then considers and assesses any additional positive or negative evidence relating to the potential realization of the deferred tax assets. After reviewing and weighing all of the positive and negative evidence, if the positive evidence outweighs the negative evidence, then no valuation allowance is recorded. If the negative evidence outweighs the positive evidence, then a valuation allowance is recorded for all, or a portion of, the deferred tax assets.
The realization of these deferred tax assets can be impacted by changes in tax law, statutory tax rates and future taxable income levels. In the event Gerber were to determine that it would be more likely than not that some deferred tax assets would not be realized, an adjustment to the deferred tax assets in the form of a valuation allowance would be recorded as a reduction to income in the period such determination was made. Similarly, if Gerber were to determine that it would be able to realize certain deferred tax assets in the future, which had previously been reduced by a valuation allowance, an adjustment to the valuation allowance would be recorded as an increase to income in the period such determination was made.
Tax positions shall initially be recognized in the financial statements when it is more likely than not the position will be sustained upon examination by the tax authorities. Such tax positions shall initially and subsequently be measured as the largest amount of tax benefit that is greater than 50 percent likely of being realized upon ultimate settlement assuming the tax authority has full knowledge of the position and all relevant facts.
43
Gerber operates within multiple taxing jurisdictions and is subject to audit in these jurisdictions. The Internal Revenue Service and other tax authorities routinely review Gerber's tax returns. These audits can involve complex issues, which may require an extended period of time to resolve. The impact of these examinations on Gerber's liability for income taxes cannot be presently determined. In management's opinion, adequate provision has been made for potential adjustments arising from these examinations based on Gerber's estimated range of exposure.
Gerber has not recognized United States tax expense on the unremitted earnings and other basis differences with respect to certain of its foreign subsidiaries because it is not anticipated that such earnings will be remitted to the United States. These undistributed earnings and basis differences were approximately $129.3 million as of April 30, 2011. Gerber plans to reinvest these earnings permanently outside of the United States or repatriate the earnings only when it is advantageous to do so.
NEW ACCOUNTING PRONOUNCEMENTS
In June 2011, the Financial Accounting Standards Board issued Accounting Standards Update 2011-05, Comprehensive Income, or ASU 2011-05. ASU 2011-05 requires that all nonowner changes in stockholders’ equity be presented either in a single continuous statement of comprehensive income or in two separate but consecutive statements. In the two-statement approach, the first statement should present total net income and its components followed consecutively by a second statement that should present total other comprehensive income, the components of other comprehensive income, and the total of comprehensive income. The adoption of ASU 2011-05 is effective for fiscal years beginning after December 15, 2011 and is therefore effective for Gerber in fiscal 2013 beginning May 1, 2012. Gerber is currently evaluating the impact of ASU 2011-05 on its financial statement presentation of comprehensive income.
Gerber is exposed to financial market risks, including changes in foreign currency exchange rates and interest rates. From time to time Gerber uses derivative instruments, pursuant to established guidelines and policies, to manage some of these risks. Derivative instruments utilized in Gerber’s hedging activities are viewed as risk management tools and are not used for trading or speculative purposes.
Credit Market Risk Exposures – Financial instruments that potentially subject Gerber to concentrations of credit risk consist principally of cash and cash equivalents, trade accounts receivable and investments. Gerber places its cash and cash equivalents in instruments held at high-quality financial institutions. Concentrations of credit risk with respect to trade accounts receivable are limited by the large number of customers comprising Gerber’s customer base and their dispersion across many different industries and geographies. Gerber evaluates customer creditworthiness prior to extending credit and, in some instances, requires letters of credit to support customer obligations. The Company's investments are held in a mutual fund that is traded on the open market.
Foreign Currency Exposures – Gerber is subject to translation and transaction risks related to changes in foreign currency exchange rates. Since Gerber reports revenue and expenses in the U.S. dollar, changes in exchange rates may positively or negatively affect consolidated revenue and expenses from foreign operations. The primary foreign currencies that impacted Gerber’s results in fiscal 2011 were the euro, the pound sterling and the Canadian and Australian dollars.
The functional currency of Gerber’s foreign operations is generally their respective local currency. Assets and liabilities are translated at the exchange rates in effect at the balance sheet date, and revenues and expenses are translated at the average exchange rates during the period presented. The resulting translation adjustments are recorded as a component of accumulated other comprehensive income (loss) in the shareholders’ equity section of Gerber’s consolidated balance sheets. Gerber’s foreign subsidiaries generally collect revenue and pay expenses in their functional currency, mitigating transaction risk. However, certain subsidiaries may enter into transactions in currencies other than their functional currency. Assets and liabilities denominated in currencies other than the functional currency are susceptible to movements in foreign currency until final settlement. Currency translation gains or losses primarily arising from transactions in currencies other than functional currencies are included in the same account on the statement of operations as the original transaction.
Gerber identifies and manages its foreign currency exposures at the corporate level and uses specific planning strategies by region and operating unit, which may include the use of foreign currency forward contracts, borrowing under its credit facility in a foreign currency, and intercompany loan planning strategies. There were no foreign currency forward contracts in effect as of
44
April 30, 2011.
For the fiscal year ended April 30, 2011, Gerber designated a portion of its foreign currency denominated debt as a hedge of the net investment of a significant foreign subsidiary to reduce the volatility in shareholders’ equity caused by changes in foreign currency exchange rates in the functional currency of the subsidiary with respect to the U.S. dollar. The notional amount of foreign currency denominated debt was $3.1 million as of April 30, 2011. The weighted-average maturity of the debt as of April 30, 2011 was 4.8 years, as the borrowing could be extended through the maturity of the revolving credit facility.
Interest Rate Exposures – Gerber is subject to market risk from exposure to changes in interest rates because it finances its operations through variable interest rate debt. As of April 30, 2011, obligations under Gerber’s credit facility bore interest at floating rates. Interest on obligations under the revolving credit facility is charged, at the option of Gerber, at applicable LIBOR or EURIBOR, plus a variable rate margin, which varies based upon certain financial measurements, or at the lender’s prime rate. A 10 percent change in the interest rate applicable to Gerber’s $21.1 million of variable-rate credit facility debt would increase annual interest expense approximately $0.1 million.
Gerber has historically used interest rate swaps for risk management purposes to manage exposures to changes in interest rates. Gerber settled its interest rate swaps during fiscal 2011 and as of April 30, 2011 does not have any outstanding.
The information required by Item 8 of Form 10-K is contained under Item 15, "Exhibits, Financial Statement Schedules," and is incorporated by reference to this Item 8.
None.
Evaluation of Disclosure Controls and Procedures
Disclosure controls and procedures refer to controls and other procedures of an issuer that are designed to ensure that information required to be disclosed by the issuer in the reports that it files or submits under the Securities Exchange Act of 1934 is recorded, processed, summarized and reported within the time periods specified in the SEC's rules and forms. Disclosure controls and procedures include, without limitation, controls and procedures designed to ensure that information required to be disclosed by an issuer in the reports that it files or submits under the Securities Exchange Act of 1934 is accumulated and communicated to the issuer's management, including its principal executive and principal financial officers, or persons performing similar functions, as appropriate to allow timely decisions regarding required disclosure.
Gerber's management, including its Chief Executive Officer and its Chief Financial Officer, conducted an evaluation of the effectiveness of Gerber's disclosure controls and procedures as of April 30, 2011. Based upon that evaluation, Gerber's Chief Executive Officer and Chief Financial Officer concluded that the disclosure controls and procedures were effective as of April 30, 2011.
Changes in Internal Control over Financial Reporting
There were no changes in Gerber's internal control over financial reporting that occurred during the fourth quarter of fiscal 2011 that have materially affected, or are reasonably likely to materially affect, Gerber's internal control over financial reporting.
None.
45
See "Executive Officers of the Registrant" in Part I of this Annual Report on Form 10-K for information about Gerber’s executive officers, which is incorporated by reference in this Item 10.
Directors
See “Board of Directors – Director Qualifications” for a discussion of the director qualifications set forth below as part of each director’s business history presented below as of May 31, 2011 which the Board considered in determining that each such person should serve as a director.
Donald P. Aiken, age 67, has served as a Director since 1997 and has served as Chairman of the Board of Gerber since February 1, 2004. Mr. Aiken is retired. From August 2003 through December 2005, Mr. Aiken served as a director of ABB Lummus Global, a subsidiary of ABB Ltd., a provider of engineering, procurement and construction-related services for customers in the oil and gas, petrochemical and refining, and power industries. Mr. Aiken also served as a consultant to ABB, Inc., a provider of power and automation technologies for utility and other industrial customers, from February 2004 through December 2005. He served as President and Chief Executive Officer of ABB, Inc. from February 2001 to January 2004. Mr. Aiken served on the board of directors of Xerium Technologies, Inc., a manufacturer and supplier of products used in the production of paper, until December 2008.
Director qualifications:
|
·
|
Leadership and management experience — former senior executive experience at public companies
|
|
·
|
International experience — former executive positions with global profit and loss responsibility at multinational companies
|
|
·
|
Technology experience — former vice president, research and development for major multinational automation company
|
|
·
|
Finance and financial reporting experience — executive, board and audit committee experience at public companies
|
Marc T. Giles, age 55, has served as Director, President and Chief Executive Officer of Gerber since November 2001. Mr. Giles began his career with Gerber in November 2000 as a Senior Vice President of Gerber and President of Gerber Technology, Inc. Before joining Gerber, Mr. Giles spent 12 years with FMC Corp., a producer of machinery and chemicals for industry and agriculture, where he served in a number of senior positions in sales and marketing management, strategy development, mergers and acquisitions, and general management. Mr. Giles serves as a director on the boards of Lydall Inc., a provider of specialty engineered products for the thermal/acoustical and filtration/separation markets, and the Connecticut Business & Industry Association.
Director qualifications:
|
·
|
Leadership and management experience — Gerber CEO since 2001; member of public company boards
|
|
·
|
International experience — senior executive positions at large public multinational company
|
|
·
|
Finance and financial reporting experience — Gerber CEO since 2001; member of public company boards
|
|
·
|
Strategic planning, risk management, compliance and corporate governance experience — Gerber CEO since 2001; former director of business development for large multinational company; member of public company governance committee
|
Randall D. Ledford, Ph.D., age 61, has served as a Director since 2003. Dr. Ledford has served since 1997 as Senior Vice President and Chief Technology Officer of Emerson Electric Company and as President of Emerson Venture Capital. Emerson Electric is engaged principally in the worldwide design, manufacture and sale of a broad range of electrical, electromechanical and electronic products and systems. Dr. Ledford serves on Gerber’s Audit and Finance Committee and its Nominating and Corporate Governance Committee.
46
Director qualifications:
|
·
|
Leadership and management experience — former division president of large public company; president of large public company
|
|
·
|
International experience — founded and currently manages international R&D offices; former division president of public company serving in its European and Asian regional headquarters
|
|
·
|
Technology experience — currently CTO of large multinational public company
|
|
·
|
Finance and financial reporting experience — former senior finance positions in public companies
|
|
·
|
Strategic planning, risk management, compliance and corporate governance experience — CTO of large public company
|
John R. Lord, age 67, has served as a Director since 2003. Mr. Lord served as the non-executive chairman of Carrier Corporation from January 2000 until April 2006. Mr. Lord was President and Chief Executive Officer of Carrier Corporation from April 1995 until his retirement in January 2000. Carrier Corporation, a division of United Technologies Corp., is the world’s largest manufacturer of air conditioning, heating and refrigeration equipment. Mr. Lord currently serves as a director of Amphenol Corporation, a manufacturer of electronic interconnect components. Mr. Lord serves as Chair of Gerber’s Management Development and Compensation Committee and on its Audit and Finance Committee.
Director qualifications:
|
·
|
Leadership and management experience — former senior executive positions at large public companies
|
|
·
|
International experience — former division president of large multinational public company
|
|
·
|
Finance and financial reporting experience — audit committee member of public companies
|
|
·
|
Strategic planning, risk management, compliance and corporate governance experience — audit committee member of public company; former division president of large multinational public company
|
James A. Mitarotonda, age 57, has served as a Director since 2010. Mr. Mitarotonda has served since 1991 as Chairman of the Board, President and Chief Executive Officer of Barington Capital Group, L.P., an investment firm, which he co-founded in November 1991. Mr. Mitarotonda is also Chairman of the Board, President and Chief Executive Officer of Barington Companies Investors, LLC, the general partner of Barington Companies Equity Partners, L.P., a small and mid-capitalization value fund. In addition, he is the Chairman of the Board, President and Chief Executive Officer of Barington Offshore Advisors II, LLC, the investment advisor of Barington Companies Offshore Fund, Ltd., a small and mid-capitalization value fund. Mr. Mitarotonda has served as a director of A. Schulman, Inc., an international supplier of plastic compounds and resins, since October 2005, a director of Griffon Corporation, a diversified manufacturing company, since November 2007, and a director of Ameron International Corporation, a manufacturer of products and materials for the chemical, industrial, energy, transportation and infrastructure markets, since March 2011. He has also served as a director of The Pep Boys - Manny, Moe & Jack, an automotive aftermarket service and retail chain, since August 2006 and as the Chairman of the Board from July 2008 until July 2009. Mr. Mitarotonda served as the President and Chief Executive Officer of Dynabazaar, Inc. (now known as Sielox, Inc.) from January 2004 until December 2004 and from May 2006 until April 2007. Within the last five years, Mr. Mitarotonda also served as a director of Sielox, Inc. (formerly Dynabazaar, Inc.), L Q Corporation, Inc. and Register.com, Inc. Mr. Mitarotonda serves on Gerber’s Audit and Finance Committee and Management Development and Compensation Committee.
Director qualifications:
|
·
|
Leadership and management experience — senior executive positions with investment and investment banking firms; member of public company boards
|
|
·
|
International experience — director of international supplier of plastic compounds and resins
|
|
·
|
Technology experience — former director of provider of global domain name registration and complementary website design and management services; provider of investment banking services to technology companies
|
|
·
|
Finance and financial reporting experience — senior executive positions with investment and investment banking firms; member of public company boards
|
|
·
|
Strategic planning, risk management, compliance and corporate governance experience — member of public company boards
|
Javier Perez, age 54, has served as a Director since 2009. Mr. Perez has served as visiting Senior Lecturer at the S.C. Johnson Graduate School of Management, Cornell University, since June 2010. Mr. Perez has served as a Senior Portfolio Advisor to Barington Capital Group, L.P., an investment firm, since May 2009. He has also served as the President of Maxwell Edison Inc., a consulting firm which he founded, since July 2008. From July 2005 to January 2008, Mr. Perez was Senior Vice President
47
Strategic Planning and Development, and a member of the Executive Committee, at The Estee Lauder Companies, a manufacturer of beauty products. From July 2003 to June 2005, Mr. Perez was Vice President Business Development, Business Information Group at The McGraw-Hill Companies, a publisher of financial, business and educational information. From 1988 to March 2003, Mr. Perez held various international consulting positions at McKinsey & Company, a management consultancy firm, and was elected partner in 1994. From 1985 to 1987, Mr. Perez was Operations Manager at Wilke International, Inc., an investment fund manager. From 1981 to 1985, Mr. Perez served as an investment analyst and project manager at the Chevron Corporation, an integrated energy company. Mr. Perez serves as Chair of Gerber’s Audit and Finance Committee.
Director qualifications:
|
·
|
Leadership and management experience — former partner of international management consulting firm; former senior executive experience at public companies
|
|
·
|
International experience — former partner of international consulting firm, including foreign assignments
|
|
·
|
Finance and financial reporting experience — M&A experience with international consulting firm and other public companies
|
|
·
|
Strategic planning, risk management, compliance and corporate governance experience — former senior executive experience in strategic planning positions
|
Carole F. St. Mark, age 68, has served as a Director since 1997. Ms. St. Mark is the founder and President of Growth Management LLC, a business development and strategic management company. Before her association with Growth Management LLC, Ms. St. Mark was employed by Pitney Bowes, Inc., a provider of office equipment and services, from 1980 to 1997, during which period she served in several senior positions, including President and Chief Executive Officer of Pitney Bowes Business Services. Ms. St. Mark serves as Chair of Gerber’s Nominating and Corporate Governance Committee and on its Management Development and Compensation Committee.
Director qualifications:
|
·
|
Leadership and management experience — former senior executive positions at large multinational companies; member of public company boards
|
|
·
|
International experience — former senior executive positions with multinational public companies; member of foreign public company boards
|
|
·
|
Finance and financial reporting experience — former chair of audit committee of public company
|
|
·
|
Strategic planning, risk management, compliance and corporate governance experience — former senior executive strategic planning positions; chair of and member of public company governance committees
|
W. Jerry Vereen, age 70, has served as a Director since 1994. Mr. Vereen has served since 1976 as President of Riverside Manufacturing Company and its subsidiaries and also serves as that company’s Chairman and Chief Executive Officer. Riverside Manufacturing Company is primarily engaged in manufacturing and selling uniforms and business apparel to businesses and government agencies worldwide. He is a past chairman and current director of the American Apparel and Footwear Association, and past chairman and current member of the board of directors of the International Apparel Federation, which is headquartered in Zeist, The Netherlands. Mr. Vereen is also a director of the North American Association of Uniform Manufacturers and Distributors. Mr. Vereen serves on Gerber’s Audit and Finance Committee, Nominating and Corporate Governance Committee and Management Development and Compensation Committee.
Director qualifications:
|
·
|
Leadership and management experience — chairman, president and CEO of private multinational apparel business
|
|
·
|
International experience — member of foreign private company boards
|
|
·
|
Finance and financial reporting experience — member or former member of public company audit committees
|
|
·
|
Strategic planning, risk management, compliance and corporate governance experience — member of public company governance committee
|
Director Qualifications
We believe our Directors should possess the highest personal and professional ethics, display mature judgment, be free of conflicts of interest that might impede the proper performance of their responsibilities, be able to work effectively and
48
collegially with other Board members, and be committed to building long-term shareholder value. We seek Board members that represent a diversity of professional viewpoints, background and experience in areas that are relevant to our activities.
We identify and describe below the core experience, qualifications, attributes or skills our Directors collectively bring to the Board that are relevant to our business structure.
|
·
|
Leadership and management experience. We seek Directors with significant leadership and management experience, including, specifically, prior experience in senior executive roles, since these individuals generally possess extraordinary leadership qualities and the ability to identify and develop those qualities in others. They demonstrate a practical understanding of organizations, processes, strategy, risk management and the methods to promote change and growth.
|
|
·
|
International experience. Because significant company revenues and profits are derived from activities conducted in foreign countries, we seek Directors who currently manage or have previously managed or been involved in international business operations, especially in Asia.
|
|
·
|
Technology experience. We seek Directors with technology backgrounds, because our company’s ability to compete effectively in the highly dynamic markets that it serves requires that it constantly develop and offer innovative new products.
|
|
·
|
Finance and financial reporting experience. We seek Directors with experience and expertise in understanding capital markets and the complexities associated with overseeing a multinational business operating in two discrete market segments. In addition, we require that all Directors be financially literate and, specifically, that at least one Director at all times qualify as an audit committee financial expert.
|
|
·
|
Strategic planning, risk management, compliance and corporate governance experience. We seek Directors who have strategic planning and risk management experience, either directly or in consulting roles, as well as compliance oversight and a commitment to best governance practices.
|
Audit and Finance Committee
The Audit and Finance Committee, which held five meetings during fiscal 2011, currently consists of Mr. Perez, who serves as Chair, Dr. Ledford, Mr. Lord, Mr. Mitarotonda and Mr. Vereen. The Board has determined that each member of this committee satisfies the independence and other audit committee eligibility requirements of the NYSE and the SEC. The Board also has determined that Mr. Mitarotonda is an “audit committee financial expert” as such term is defined in the SEC’s rules, and is “independent” of management within the meaning of the NYSE standards for audit committee members. This committee is responsible, among its other duties, for engaging, overseeing, evaluating and replacing Gerber’s independent registered public accounting firm, pre-approving all audit and non-audit services by the independent registered public accounting firm, reviewing the scope of the audit plan and the results of the audit with management and the independent registered public accounting firm, reviewing the internal audit function, reviewing the adequacy of Gerber’s system of internal accounting controls and disclosure controls and procedures, reviewing the financial statements and other financial information included in Gerber’s annual and quarterly reports filed with the SEC, and exercising oversight with respect to Gerber’s policies and procedures regarding adherence with legal requirements and risk management processes.
Financial Code of Ethics and Code of Business Conduct and Ethics
Gerber has adopted a Financial Code of Ethics applicable to its Chief Executive Officer and other senior financial officers, who include Gerber’s principal financial officer, principal accounting officer or controller, and persons performing similar functions. The Financial Code of Ethics, which constitutes a “code of ethics” as defined by Item 406 of the SEC’s Regulation S-K, is posted on Gerber’s website at www.gerberscientific.com. In addition, Gerber has adopted a Code of Business Conduct and Ethics applicable to all Directors, officers and employees. The Code of Business Conduct and Ethics sets forth Gerber’s policies and expectations with respect to the conduct and ethical standards expected of covered individuals, and is also posted on Gerber’s website at www.gerberscientific.com. Copies of these documents may be obtained by any shareholder without charge by writing to Gerber Scientific, Inc., 24 Industrial Park Road West, Tolland, Connecticut 06084, Attention: Corporate Secretary. To the extent required by SEC and NYSE rules, Gerber intends to disclose any amendments to the Financial Code of Ethics and any waiver of a provision of the Financial Code of Ethics for the benefit of its principal executive officer, principal financial officer, principal accounting officer or controller, or persons performing similar functions, on Gerber’s website within any period that may be required under SEC or NYSE rules from time to time.
49
Section 16(a) Beneficial Ownership Reporting Compliance
Section 16(a) of the Securities Exchange Act of 1934 requires Gerber’s Directors, officers and persons who beneficially own more than 10% of the common stock to file with the SEC and the NYSE initial reports of ownership and reports of changes in ownership of common stock and other equity securities of Gerber. The reporting persons are required by rules of the SEC to furnish Gerber with copies of all Section 16(a) reports they file. Based solely upon a review of Section 16(a) reports furnished to Gerber for fiscal 2011, or written representations that no other reports were required, Gerber believes that Gerber’s Section 16(a) reporting persons complied with all filing requirements for fiscal 2011.
Management Development and Compensation Committee
Gerber currently has a standing Management Development and Compensation Committee. The Management Development and Compensation Committee, which held six meetings during fiscal 2011, currently consists of Mr. Lord, who serves as the Chair, Mr. Mitarotonda, Ms. St. Mark and Mr. Vereen. The Board has determined that each member of this committee satisfies the NYSE’s director independence standards.
The two primary purposes of the Management Development and Compensation Committee are to evaluate and develop executive talent for Gerber and to conduct reviews of Gerber’s executive compensation strategies and oversee Gerber’s overall compensation programs.
The functions and responsibilities of the Management Development and Compensation Committee are set forth in the Committee’s charter. Under its charter, the Committee’s responsibilities include, among other things:
|
|
•
|
establishing a total compensation philosophy and policies that fairly reward Gerber’s executive officers for performance benefiting shareholders and that effectively attract and retain the executive resources necessary to manage Gerber;
|
|
|
•
|
assessing the competitiveness of each element of compensation paid to Gerber’s executive officers;
|
|
|
•
|
reviewing and approving the goals and objectives relevant to compensation of the CEO, evaluating the performance of the CEO based on those goals and objectives, and approving the CEO’s compensation based on this evaluation;
|
|
|
•
|
reviewing the CEO’s evaluation of the performance of Gerber’s other executive officers based on the objectives established and approved by the Committee, and reviewing and approving the compensation of the other executive officers, taking into consideration, among other things, the recommendations of the CEO;
|
|
|
•
|
administering Gerber’s equity compensation plans, including approving equity incentive guidelines and the award of specific grants to Gerber’s executive officers and other employees; and
|
|
|
•
|
reviewing succession plans relating to Gerber’s executive officers, including candidate readiness, management development initiatives and the need for external talent acquisition.
|
Under its charter, the Committee has the right to delegate some or all aspects of its authority and responsibilities to subcommittees of the Committee. During fiscal 2011, the Committee delegated oversight of Gerber’s pension, 401(k) and nonqualified supplemental employee retirement plans to the Investment Committee and the Benefits Committee, which are composed of officers of the company. The Committee did not otherwise delegate any of its responsibilities, including its responsibilities in approving equity grants to Gerber employees.
As discussed in the “Compensation Discussion and Analysis” below, the CEO, Mr. Giles, annually reports to the Committee his review and evaluation of each of Gerber’s other executive officers, including the named executive officers set forth in the “Summary Compensation Table” below. Mr. Giles also recommends to the Committee the base salaries or base salary increases for each such executive, as well as the size of annual equity grants, if any, to be awarded to each officer. In addition, although the Committee as a whole reviews and approves the performance targets to be used each year for purposes of Gerber’s annual incentive compensation plan, Mr. Giles and Gerber’s Senior Vice President, Global Human Resources collectively recommend to the Committee the threshold level of performance that must be reached prior to any payments under the plan, as well as the maximum amounts that can be earned pursuant to the plan. With respect to all of these recommendations, however, the Committee has the final review and approval. Gerber’s Senior Vice President, Global Human Resources serves as management’s liaison to the Committee and works with the Committee Chair to prepare the agendas for regularly scheduled and special meetings.
50
Under the Committee’s charter, the Committee has the sole authority to retain, amend the engagement of and terminate any compensation consultant used to assist in the evaluation of the form, amount and other terms of CEO or executive officer compensation. As discussed in the “Compensation Discussion and Analysis” below, the Committee retained Meridian Compensation Consultants LLP in fiscal 2010 to conduct a new peer group study to determine how the executive compensation for Gerber’s named executive officers compared with the compensation paid to named executive officers of comparable companies. The study was completed in April 2010. The Committee requested Meridian to review the compensation paid by Gerber as compared to the market.
Director Compensation
Gerber currently has seven non-employee Directors and one director, Mr. Giles, who is an employee.
Cash Fees
Directors who are not employees of Gerber receive an annual fee of $40,000 for their service on the Board. The Chair of the Audit and Finance Committee receives an additional annual fee of $5,000. In addition to their annual fees, non-employee Directors receive fees of $1,500 for each Board meeting attended, $1,500 for each committee meeting attended or, for any Director who serves as Chair of a committee, $3,000 for each committee meeting attended. Meeting attendance fees are paid whether attendance is in person or by conference telephone. Although the Chairman of the Board attends the committee meetings, he does not receive fees for his attendance. All fees for Board and committee service are paid in cash. Mr. Giles receives no fees for his service on the Board. All Directors are entitled to reimbursement for their reasonable out-of-pocket travel expenditures incurred in attending Board committee meetings.
Equity Grants
Gerber credits non-employee Directors annually with 5,000 shares of Gerber’s common stock. One quarter of these shares, or 1,250 shares, is credited to a Director’s account on the last business day of each calendar quarter. Delivery of the shares is deferred until the Director ceases to serve as a Director. All such shares are issued under the Gerber Scientific, Inc. 2006 Omnibus Incentive Plan and are fully vested upon grant.
Chairman’s Fee
Mr. Aiken serves as Chairman of the Board. In addition to receiving the compensation for service as a Director described above, Mr. Aiken receives a fee of $12,500 per month for his services as Chairman.
Deferrals
Under the Agreement for Deferment of Director Fees, each non-employee Director may elect to defer all or part of the Director’s annual cash fees and Board and committee meeting cash attendance fees until a future date selected by the Director. The Directors may elect to have amounts deferred held in shares of Gerber common stock or in cash, on which interest accrues at market rates. A total of 100,000 shares of Gerber common stock may be issued pursuant to the Agreement for Deferment of Director Fees to be credited to a Director’s account established in accordance with the Agreement.
51
The following table shows the compensation paid to or earned by the non-employee Directors for fiscal 2011.
Fiscal 2011 Director Compensation Table
|
Name (1)
|
Fees Earned or
Paid in Cash ($)
|
Stock Awards ($)(2)
|
Option Awards ($)(3)
|
Total ($)
|
||||||||||||
|
Donald P. Aiken
|
224,500 | 35,938 | — | 260,438 | ||||||||||||
|
Chairman
|
||||||||||||||||
|
W. Jerry Vereen
|
100,000 | 35,938 | — | 135,938 | ||||||||||||
|
Member of Audit and Finance Committee, Nominating and Corporate Governance Committee, and Management Development and Compensation Committee
|
||||||||||||||||
|
Carole F. St. Mark
|
107,500 | 35,938 | — | 143,438 | ||||||||||||
|
Chair of Nominating and Corporate Governance Committee and Member of Management Development and Compensation Committee
|
||||||||||||||||
|
John R. Lord
|
95,500 | 35,938 | — | 131,438 | ||||||||||||
|
Chair of Management Development and Compensation Committee and Member of Audit and Finance Committee
|
||||||||||||||||
|
Randall D. Ledford
|
91,000 | 35,938 | — | 126,938 | ||||||||||||
|
Member of Nominating and Corporate Governance Committee and Audit and Finance Committee
|
||||||||||||||||
|
Javier Perez
|
85,167 | 35,938 | — | 121,105 | ||||||||||||
|
Chair of Audit and Finance Committee
|
||||||||||||||||
|
James A. Mitarotonda
|
64,833 | 31,481 | — | 96,314 | ||||||||||||
|
Member of Management Development and Compensation Committee and Audit and Finance Committee
|
||||||||||||||||
|
(1)
|
Mr. Giles is the only Director who is an employee of Gerber. Mr. Giles does not receive any compensation for his service on the Board.
|
|
(2)
|
Amounts represent the aggregate grant date fair value of equity awards for each non-employee Director in fiscal 2011 as computed in accordance with Financial Accounting Standards Board Accounting Standards Codification 718. For the assumptions relating to this valuation, see Note 11 to Gerber’s 2011 audited consolidated financial statements included in Item 15, “Exhibits, Financial Statement Schedules.”
|
|
(3)
|
As described in the narrative preceding the table, all grants of common stock to the non-employee Directors are fully vested upon grant. Under the 1992 Non-Employee Director Stock Option Plan, which expired in August 2002, the following Directors continue to hold unexercised stock options, all of which were fully vested as of April 30, 2011:
|
|
Director
|
Options (#)
|
|||
|
Donald P. Aiken
|
3,000 | |||
|
W. Jerry Vereen
|
3,000 | |||
|
Carole F. St. Mark
|
3,000 | |||
52
EXECUTIVE COMPENSATION
Compensation Discussion and Analysis
This Compensation Discussion and Analysis outlines Gerber’s executive compensation objectives, philosophy and processes. It explains how the Management Development and Compensation Committee make executive compensation decisions, the data used in its deliberations and the reasoning behind the decisions that are made.
Executive Compensation Objectives
The primary objective of the Gerber executive compensation program is to attract, retain and motivate high-quality talent. We expect our executives to effectively manage Gerber’s resources, maintain its fiscal integrity and enhance its long-term growth potential. We reward them for attaining specific short-term performance goals and provide equity to reward long-term business performance. Each of the five executive officers listed in the “Summary Compensation Table” following this Compensation Discussion and Analysis, who are referred to as the “named executive officers,” receives a total compensation package that is primarily performance-based.
We structure executive compensation to:
|
|
•
|
match incentive-based pay to Gerber’s annual goals and business strategies;
|
|
|
•
|
support our management development program by paying our executives competitively and fairly; and
|
|
|
•
|
align executive and shareholder interests through equity compensation.
|
“Total Compensation” Philosophy
In determining any element of a named executive officer’s compensation, the Committee considers the total compensation package. The total package includes salary, annual incentive compensation and long-term equity. The Committee also considers retention-focused compensation, such as Gerber’s benefits program, and any compensation payable upon the executive’s termination. The elements of Gerber’s executive compensation are discussed under “Elements of Our Executive Compensation Program” below. In general, the Committee considers the following factors when setting the compensation of the named executive officers:
|
|
•
|
each executive’s performance;
|
|
|
•
|
each executive’s current total compensation level relative to that paid by peer companies;
|
|
|
•
|
Gerber’s ability to afford the total compensation package;
|
|
|
•
|
the desire to link pay and performance; and
|
|
|
•
|
the relative pay among our executives.
|
Background of Current Executive Compensation Program
During fiscal 2008, the Committee engaged compensation consultant Hewitt Associates to conduct a new peer group study to determine how our executive compensation compared with the executive compensation paid by comparable companies. At the Committee’s request, Hewitt reviewed proxy data for 21 U.S.-based peer companies. The Committee chose these data sources because they represent mid-sized, technology-based manufacturing companies or divisions of larger manufacturing companies with business units comparable to those of Gerber. We viewed these companies and business units as our competitors for talent. In light of some significant differences in scale among the companies, however, Hewitt adjusted all of the data to be comparable based on Gerber’s annual revenue.
53
The following 21 companies were included in the peer group for Marc T. Giles, our CEO, and our other corporate executives, including our named executive officers:
|
3D Systems Corporation
|
ESCO Technologies, Inc.
|
Newport Corporation
|
|
Applied Materials, Inc.
|
Esterline Technologies Co.
|
Parametric Technology Corporation
|
|
Brooks Automation, Inc.
|
Excel Technology, Inc.
|
Rofin-Sinar Technologies, Inc.
|
|
Cadence Design Systems, Inc.
|
GSI Group, Inc.
|
Roper Industries, Inc.
|
|
Coherent, Inc.
|
KLA-Tencor Corporation
|
Stratasys, Inc.
|
|
Cymer, Inc.
|
Mentor Graphics Corporation
|
Tektronix, Inc.
|
|
Electroglas, Inc.
|
MKS Instruments, Inc.
|
Veeco Instruments, Inc.
|
The study was completed in the summer of 2007. The study’s primary findings concerning Gerber’s executive compensation indicated that:
|
|
•
|
base salaries were marginally below the 50th percentile;
|
|
|
•
|
short-term incentive compensation was significantly below the 50th percentile;
|
|
|
•
|
long-term incentives were significantly below the 50th percentile; and
|
|
|
•
|
equity compensation practices had shifted toward a more even balance of restricted stock and stock option grants.
|
Although the Committee requested Hewitt to review the compensation paid by Gerber as compared to the market, we do not seek to pay our executive officers, including the named executive officers, at a specific percentile of the market, whether by element or in total. Instead, the Committee used the information to understand what constitutes the median in executive compensation, by element as well as total compensation, among the companies with which we compete for our executives, and to obtain a general understanding of current compensation practices. The Hewitt data showed that our short-term and long-term incentives were not in line with those of our peer companies. The Committee concluded that our short-term incentives could be closer to the median of our peers if Gerber’s performance improved against the applicable performance targets, but that a more comprehensive plan was needed to improve our long-term incentives as compared to the market. A three-year plan, tied to Gerber’s performance, was introduced to improve long-term incentive compensation. Other factors, as described below under “Other Considerations in Setting of Executive Compensation,” affect amounts actually paid to our named executive officers and other executives.
Upon reviewing the results of the study conducted in 2007, the Committee, the Vice President, Global Human Resources, and the CEO, with regard to executives who report directly to the CEO, agreed that base pay did not need to be addressed systematically, although action with respect to individual executives might be appropriate over time. They further agreed that the annual incentive structure and target payouts were appropriate and that a combination of realistic objectives and strong performance would bring payouts into an appropriate range. Moreover, the survey showed that the relative pay among senior officers, including our CEO and other named executive officers, was relatively balanced as compared to that of our peers. Within these positions, experience and size of the business are factors to be considered. The Committee asked the Vice President, Global Human Resources to propose a new equity program structure, with the Committee’s consultant providing guidance and oversight and the Committee retaining final authority for both Hewitt’s consulting services and the design of the program.
As a result of this request by the Committee, the Vice President, Global Human Resources proposed, the Committee’s consultant endorsed and the Committee approved a plan to double the executive long-term incentives over a three-year period. The initial grants under this program were made in December 2007. The major change from previous practice was to shift equity grants made to members of the senior management team (consisting of executives who report directly to the CEO), including each of the named executive officers, from all stock options to a mix of stock options and restricted stock.
The shift toward restricted stock was consistent with the Hewitt study results. The Committee also felt that restricted stock provided greater perceived value to recipients compared to the number of stock options that could be awarded for the same total charge to earnings. Moreover, the Committee considered that restricted stock has downside risk of loss of value similar to the downside risk faced by shareholders, and that the shift provides for greater alignment between the interests of management and shareholders. The Committee decided, however, to maintain a significant stock option component, because this form of equity-based compensation requires an increase in the stock price to produce value for the executive, thereby creating a stronger pay for performance link.
54
The implementation of this three-year plan was at the Committee’s discretion and was dependent on Gerber’s satisfaction of business objectives identified in Gerber’s three-year business plan reviewed by the Board of Directors. In light of the company’s business performance in fiscal 2009 and fiscal 2010 and the price performance of our common stock, this plan was not fully implemented. Information about equity grants made to the named executive officers is provided under “Long-Term Equity Incentive Compensation” below.
Fiscal 2010 Review of Executive Compensation Program and Peer Group
During fiscal 2010, the Committee engaged compensation consultant Meridian Compensation Partners, LLC (which was founded in 2010 as a spinoff of Hewitt Associates) to conduct a new peer group study to determine how the executive compensation for Gerber’s named executive officers compared with the compensation paid to named executive officers of comparable companies. At the Committee’s request, Meridian reviewed proxy data for 21 U.S.-based peer companies. Peer companies were selected from the list of companies used for the fiscal year 2008 pay study and a list of additional companies provided by Gerber. Companies were selected primarily based on their similarity to Gerber as measured by annual revenue. The following 21 companies were included in the peer group for purposes of evaluating the compensation for Marc T. Giles, our CEO, our other named executive officers and other members of our senior management team:
|
Cadence Design Systems Inc
|
Franklins Electric Co., Inc.
|
MKS Instruments
|
|
CIRCOR International, Inc.
|
Ladish Co, Inc.
|
MTS Systems Corp.
|
|
Coherent Inc.
|
Lawson Products
|
Newport Corp.
|
|
Dionex Corp.
|
Lindsay Corp.
|
Parametric Technology Corporation
|
|
Ducommun Inc.
|
LSB Industries, Inc.
|
Rofin-Sinar Technologies, Inc.
|
|
EMS Technologies, Inc.
|
Mentor Graphics Corp
|
Twin Disc Inc.
|
|
ESCO Technologies, Inc.
|
Middleby Corp.
|
Veeco Instruments Inc.
|
The study was completed in April 2010. The study’s primary findings show that Gerber is making progress toward the goals set forth as a result of the fiscal year 2008 study, and more specifically that:
|
|
•
|
base salaries were marginally below the 50th percentile, primarily as a result of the base salary reductions taken by the senior executive team effective in fiscal 2009;
|
|
|
•
|
total target cash compensation was marginally below the 50% percentile, primarily as a result of the base salary reductions taken by the senior executive team effective in fiscal 2009 in response to adverse economic conditions affecting the company; and
|
|
|
•
|
long-term incentives were marginally above the 50th percentile.
|
The Committee requested Meridian to review the compensation paid by Gerber as compared to the market. As discussed above, however, we do not seek to pay our executive officers at a specific percentile of the market, whether by element or in total.
Other Considerations in Setting of Executive Compensation
In addition to the peer group information described above, the Committee considers the following when setting executive compensation:
|
|
•
|
individual performance, which the Committee measures in consultation with Mr. Giles (except when assessing Mr. Giles’s own performance);
|
|
|
•
|
scope of management responsibilities;
|
|
|
•
|
relative pay among executive officers, taking into account the complexity and importance of their responsibilities;
|
|
|
•
|
the executive’s ability to demonstrate and build teamwork;
|
|
|
•
|
the executive’s effort to build Gerber for the long-term, as well as achieve short-term results;
|
|
|
•
|
the executive’s leadership and growth potential; and
|
|
|
•
|
the affordability of the compensation package to Gerber.
|
We discuss below the material considerations affecting the fiscal 2011 compensation paid to our named executive officers.
55
Elements of Our Executive Compensation Program
For fiscal 2011, Gerber’s executive compensation program for the named executive officers consisted of the five basic components listed below:
|
|
•
|
base salary;
|
|
|
•
|
a performance-based annual cash incentive tied to company performance metrics;
|
|
|
•
|
grants of long-term equity compensation, in the form of non-qualified stock options that vest over a three-year period with the exception of a grant to Mr. Hancock, which was in the form of restricted stock;
|
|
|
•
|
a defined benefit retirement pension plan and a 401(k) plan available to all of our employees, including the named executive officers, on an equal basis, as well as a supplemental employment retirement plan, or “SERP,” for our more highly paid employees (including the named executive officers); and
|
|
|
•
|
competitive severance and change in control agreements for the named executive officers and some other senior executives.
|
Base Salary
Generally, base salary increases reflect an individual executive’s performance for the prior fiscal year and are intended to keep the executive’s base salary competitive for retention purposes. In considering base salary increases for fiscal 2011, the Committee reviewed in September 2010 the factors set forth above under “Other Considerations in Setting of Executive Compensation” for each named executive officer.
In December 2008, the named executive officers (except Mr. Finn, who joined Gerber in February 2010) proposed to the Committee a temporary reduction in base salary from the fiscal 2009 rate as part of an initiative to reduce costs in response to adverse economic conditions. Mr. Giles proposed a 15% reduction in his base salary, while each of the other named executive officers proposed a 10% reduction in base salary, all of which were implemented. The reductions were in effect throughout fiscal 2009 and fiscal 2010, and base salaries for the named executive officers were restored to their previous levels in the fourth quarter of fiscal 2011. The Committee did not approve any base salary increases for the named executive officers for fiscal 2011 beyond the pay restoration.
2011 Annual Incentive Compensation Plan
Annual incentive compensation is a primary component of our performance-driven compensation program. We find it particularly productive to match incentive-based pay to Gerber’s annual strategic goals. This allows us to adapt our executive compensation to evolving business plans. In recent years, we have identified improved earnings, cash flow and revenue as key strategic goals tied to incentive compensation. For fiscal 2011, the Committee determined to place a greater focus on performance measures which the Committee believes closely relate to enhancements in shareholder value. The annual bonus of each named executive officer was subject to a maximum amount based on achievement of an “Adjusted EBITDA” target, and was subject to downward adjustment based on achievement measured against a combination of (a) an “Adjusted EBITDAB” target and (b) a “Net Debt” target. Adjusted EBITDA, Adjusted EBITDAB and Net Debt are not financial measures prepared in accordance with GAAP. As defined by Gerber, “Adjusted EBITDA” is Gerber’s net income calculated on a GAAP basis as adjusted to exclude interest expense, taxes, depreciation, amortization, and extraordinary nonrecurring items as described in the Financial Accounting Standards Board Accounting Standards Codification 225 and/or in management’s discussion and analysis of financial condition and results of operations appearing in Gerber’s annual report to shareholders. As defined by Gerber, “Adjusted EBITDAB” is Adjusted EBITDA as defined above as adjusted to exclude the amount of bonuses awarded under the annual incentive compensation plan. As defined by Gerber, “Net Debt” is the amount of debt outstanding under Gerber’s credit facility, less cash. The weighting of these measures in connection with any downward adjustment will be 87.5% for Adjusted EBITDAB and 12.5% for Net Debt. The Committee believes that the combination of these measures is a key driver of share price and that achievement against these measures leads to increased shareholder value. Accordingly, the Committee determined to focus Gerber’s named executive officers on achievement of these measures. For fiscal 2011, the bonus payouts for some of the named executive officers were based 100% on Gerber consolidated performance and for others were based 25% on business unit Adjusted EBITDA (subject to downward adjustment based on achievement of Adjusted EBITDAB at the business unit level) and 75% on Gerber’s performance at the corporate level (with the respective performance measures weighted in the manner described above).
56
In approving the targets for each performance metric for fiscal 2011, the Committee reviewed Gerber’s budget for the fiscal year, which is set by our senior management and approved by the Board of Directors. The Committee then set the targets as a percentage of Gerber’s budget with respect to each performance metric. The performance targets were the same for all managers in the bonus program, regardless of their rank.
As demonstrated by Gerber’s results over the last several years, the targets approved by the Committee are generally difficult to meet, although some business units historically have demonstrated stronger performance than others. Over the past three fiscal years, our average annual incentive compensation payouts for the plan, including payouts to the named executive officers as a whole, have been significantly less than the targets for bonus payouts.
Each year, the Committee also approves the target payout for each participant in the incentive compensation plan. This target is expressed as a percentage of base salary, measured as of the end of the fiscal year. In setting the target payout for each named executive officer, the Committee primarily considered the peer group information from 2007. Possible payouts for each named executive officer ranged from zero to two times the target payout. In fiscal 2011, the target payout for each named executive officer was as follows:
|
|
•
|
Mr. Giles, 75% (with a minimum of 0% and a maximum of 150%) of base salary;
|
|
|
•
|
Mr. Elia, 60% (with a minimum of 0% and a maximum of 120%) of base salary;
|
|
|
•
|
Mr. Larson, 50% (with a minimum of 0% and a maximum of 100%) of base salary;
|
|
|
•
|
Mr. Finn, 50% (with a minimum of 0% and a maximum of 100%) of base salary; and
|
|
|
•
|
Mr. Hancock, 50% (with a minimum of 0% and a maximum of 100%) of base salary.
|
The chart set forth below shows, for each named executive officer: (1) his target payout (expressed as a percentage of base salary); (2) the cumulative performance results for fiscal 2011; (3) the percentage of the executive’s bonus earned; (4) the executive’s end-of-year base salary; and (5) the actual bonus payout. The formula for determining these amounts is as follows:
Target % x Bonus % = % Earned
% Earned x Base $ = $ Earned
|
Name
|
Target %
|
Bonus %
|
% Earned
|
Base $
|
$ Earned
|
|||||||||||||||
|
Mr. Giles
|
75 | 86.0 | 64.50 | 600,000 | 387,000 | |||||||||||||||
|
Mr. Elia
|
60 | 86.0 | 51.60 | 350,000 | 180,600 | |||||||||||||||
|
Mr. Larson
|
50 | 98.6 | 49.30 | 255,000 | 125,715 | |||||||||||||||
|
Mr. Finn
|
50 | 86.0 | 43.00 | 340,000 | 146,200 | |||||||||||||||
|
Mr. Hancock
|
50 | 75.9 | 37.95 | 285,000 | 108,158 | |||||||||||||||
Long-Term Equity Incentive Compensation
Types and Amounts of Equity Grants
Gerber’s long-term equity incentive compensation for each of the named executive officers takes the form of stock option awards, restricted stock grants or a combination of both. We view stock options as inherently performance-based, as our named executive officers are rewarded only if our stock price increases. As discussed above, we have added restricted stock grants to the equity mix because we believe those awards provide greater perceived value to recipients compared to the number of stock options that could be awarded for the same total charge to earnings, and because the awards include downside risk, although to a lesser extent than stock options. For fiscal 2011, a decision was made to use only stock option awards for our named executive officers (with the exception of Mr. Hancock, who received a restricted stock grant) to drive greater focus on increasing shareholder value.
For fiscal 2011, grant sizes were determined primarily by the Committee’s review of the named executive officer’s individual performance over the prior fiscal year, which, for each named executive officer other than Mr. Giles, included Mr. Giles’s review of the executive’s performance and recommendation as to the size of the award. In addition, we considered each officer’s career potential at Gerber, the level of responsibility of each officer and our general competitive review.
57
For additional information on the equity grants made to our named executive officers during fiscal 2011, see the “Fiscal 2011 Grants of Plan-Based Awards Table” following this Compensation Discussion and Analysis.
Timing of Equity Grants
Our equity plan provides that stock options must be granted with exercise prices at not less than the fair market value of Gerber’s common stock on the effective date of grant. The effective date of any equity grant is typically the date the grant is approved by the Committee. However, if the equity grant is approved by the Committee during a period after quarterly results are known to the Committee, but not to the public, the effective date of the equity grant generally will be the first date of the next open trading period under our insider trading guidelines. Gerber has generally followed this practice, and the Committee has now made it official policy, to seek to ensure that the price of our common stock on the effective date of grant reflects all information, which in turn ensures fair treatment of all current and potential shareholders. The Committee has adopted a practice of granting all regular annual equity awards on the date of the annual meeting of shareholders to avoid effective dates being different from grant dates for such awards. Gerber could, however, grants options or other equity awards to executive officers and other employees at other times, including while material developments have not been disclosed, if the Committee were to determine that doing so would be in the best interest of shareholders. The Committee could, for example, grant awards in advance of announcing an acquisition or other corporate transaction, as a retention tool or to provide an incentive to accomplish the ownership transition in the event of a transaction that would result in a change in control of Gerber.
Pension Plan and SERP
Through fiscal 2009, the company maintained a tax-qualified, noncontributory defined benefit plan for our U.S. employees who were hired prior to May 1, 2004, which, of the named executive officers, include Messrs. Giles and Hancock. (Employees hired on or after May 1, 2004 are eligible to participate in Gerber’s 401(k) plan, but not in the defined benefit plan.) We also maintain a supplemental executive retirement plan, or “SERP,” which provides retirement benefits in excess of the limitations set forth in the qualified plan to each of the senior executives participating in the qualified pension plan. Although we initially implemented the pension plan and SERP for competitive reasons, and to be a more attractive employer for retirement benefit purposes, Gerber discontinued the defined benefit pension plan for new employees due to cost considerations and a growing preference among new employees for defined contribution programs.
Effective April 30, 2009, Gerber also froze both the tax-qualified, noncontributory defined benefit plan and the SERP for all participating employees due to cost and cash flow considerations as well as internal equity, since only two-thirds of our U.S. employees were covered by these pension plans. All participants, including the named executive officers, will keep all of the benefits they have already earned, but will not accrue new benefits. While it would be possible to allow participants to begin accruing additional benefits in the future, we do not currently expect to do so. In addition, effective January 1, 2009, Gerber temporarily suspended matching contributions to participant accounts in Gerber’s 401(k) plan, and this suspension continued until the fourth quarter of fiscal 2011.
For more information about our defined benefit plan and SERP, see the Pension Benefits table and accompanying narrative following this Compensation Discussion and Analysis.
Severance Arrangements
Each of our named executive officers is entitled to receive defined payments and benefits upon certain terminations pursuant to our Severance Policy for Senior Officers, as amended effective September 2006. In addition, pursuant to each officer’s change in control agreement with Gerber, each named executive officer is entitled to receive certain payments and benefits under a “double trigger” arrangement requiring a termination event occurring within a specified period following a change in control of Gerber. We provide these payments to be competitive with our peer companies, as well as to recruit and retain our executives. The benefits also help align executive and shareholder interests, if we consider a change in control to be in the interest of shareholders. With respect to payments and benefits payable to the named executive officers upon a termination following a change in control, the Committee believes that a “double trigger” is more appropriate than a “single trigger” arrangement providing for a payout solely upon a change in control, since the purpose of such a benefit is to provide employment protection to these officers, a concern that is not necessarily present upon a change in control alone. Moreover, a change in control agreement is designed to facilitate management continuity during an ownership transition, as a new owner of Gerber may want to retain the management team. The Committee believes that a “single trigger” agreement could make this objective more
58
difficult to achieve.
In fiscal 2008, the Committee approved some amendments to the change in control agreements. As a result of the amendments, some of the benefits previously offered to our named executive officers upon termination following a change in control, including tax gross-up payments, were eliminated. The Committee made these changes to better align Gerber’s change in control agreements with those of our peer companies.
For a more detailed discussion of these severance and change in control arrangements, as well as acceleration of some equity grant arrangements upon termination as provided pursuant to our equity plans, including estimates of the amounts payable to each named executive officer, see the description of “Potential Payments Upon Termination and Change in Control” following this Compensation Discussion and Analysis.
Personal Benefits
Some of Gerber’s named executive officers receive a limited number of personal benefits. In the case of Mr. Elia, these benefits include reimbursement of certain actual expenses for housing, airfare and car rental, and a related tax gross-up. It was agreed that these benefits would be provided in lieu of relocating Mr. Elia from his current residence and for other related reasons, partly in view of the potential costs to the company of relocating Mr. Elia, particularly during an economic recession. Although Gerber generally does not provide tax gross-ups to its executive officers, it was determined that exceptions to this policy may be appropriate on a case-by-case basis in limited circumstances related to reimbursement of expenses incurred in connection with, or in lieu of, relocation. In the case of Mr. Finn, personal benefits include reimbursement of certain actual expenses for housing, airfare and mileage, and a related tax gross-up for his first year of employment only. These benefits were provided in lieu of a relocation of Mr. Finn from his current residence. Personal benefits make up a small portion of the total compensation of our named executive officers, and we believe the retention value of these benefits and related cost savings exceed the cost of such benefits to Gerber.
Tax and Accounting Considerations
Section 162(m) of the Internal Revenue Code generally disallows a tax deduction to public companies for compensation over $1,000,000 paid in any fiscal year to the company’s chief executive officer and its other three most highly compensated executive officers (other than its principal financial officer) as of the end of the fiscal year. The statute, however, exempts qualifying performance-based compensation from the deduction limit if certain requirements are met. The Committee designs the annual incentive compensation portion of our named executive officers’ compensation packages to allow full deductibility pursuant to Section 162(m). The Committee intends to continue to design compensation programs that strongly consider tax consequences, including protecting full deductibility under Section 162(m).
Management Development and Compensation Committee Report
The Management Development and Compensation Committee has reviewed and discussed the Compensation Discussion and Analysis with management and, based on this review and discussion, has recommended to the Board of Directors that the Compensation Discussion and Analysis be included in Gerber’s Annual Report on Form 10-K for fiscal 2011.
Respectfully submitted,
Management Development and Compensation Committee
John R. Lord (Chair)
James A. Mitarotonda
Carole F. St. Mark
W. Jerry Vereen
59
Compensation and Equity Award Tables
The following summary compensation table presents information about compensation that was earned by or paid to Gerber’s chief executive officer, chief financial officer and each of Gerber’s other three most highly compensated executive officers serving with us at April 30, 2011, which was the end of our most recently completed fiscal year. We refer to these five executive officers in this Annual Report on Form 10-K as the “named executive officers.”
Summary Compensation Table
|
Name and Principal
Position
|
Fiscal Year
|
Salary ($)(1)
|
Bonus ($)
|
Stock
Awards ($)(2)
|
Option
Awards ($)(3)
|
Non-Equity
Incentive Plan
Compensation
($)(4)
|
Change in
Pension
Value and
Nonqualified
Deferred
Compensation
Earnings
($)(5)
|
All Other
Compensation ($)
|
Total ($)
|
||||||||||||||||||||||||
|
Marc T. Giles
|
2009
|
544,038 | — | 269,700 | 572,700 | — | 37,600 | — | 1,424,038 | ||||||||||||||||||||||||
|
President and Chief
|
2010
|
490,385 | — | 900,003 | — | — | 125,000 | — | 1,515,388 | ||||||||||||||||||||||||
|
Executive Officer
|
2011
|
516,923 | — | — | 578,125 | 387,000 | 81,800 | 1,662 | (6) | 1,565,510 | |||||||||||||||||||||||
|
Michael R. Elia
|
2009
|
330,481 | — | 134,850 | 186,750 | — | — | 113,072 | (7) | 765,153 | |||||||||||||||||||||||
|
Executive Vice President
|
2010
|
302,885 | — | 362,838 | — | — | — | 105,623 | (7) | 771,346 | |||||||||||||||||||||||
|
and Chief Financial Officer
|
2011
|
317,692 | — | — | 433,596 | 180,600 | — | 97,798 | (7) | 1,029,686 | |||||||||||||||||||||||
|
Rodney Larson
|
2009
|
235,010 | — | 84,506 | 117,030 | — | — | 297,005 | (8) | 733,551 | |||||||||||||||||||||||
|
Senior Vice President,
|
2010
|
220,673 | — | 260,336 | — | — | — | 242,880 | (8) | 723,889 | |||||||||||||||||||||||
|
Gerber Scientific, Inc. and President, Spandex
|
2011
|
231,461 | — | — | 313,153 | 125,715 | — | 297,965 | (8) | 968,294 | |||||||||||||||||||||||
|
Thomas P. Finn
|
2009
|
— | — | — | — | — | — | — | — | ||||||||||||||||||||||||
|
President Asia Pacific and
|
2010
|
58,846 | 100,000 | (9) | 171,600 | 356,000 | — | — | 15,081 | (10) | 701,527 | ||||||||||||||||||||||
|
Senior Vice President, Global Operations
|
2011
|
340,000 | — | — | 278,355 | 146,200 | — | 85,463 | (10) | 850,018 | |||||||||||||||||||||||
|
John Hancock
|
2009
|
258,850 | — | 331,731 | — | — | 41,100 | 781 | (11) | 632,462 | |||||||||||||||||||||||
|
Senior Vice President,
|
2010
|
246,635 | — | 238,122 | — | — | 88,900 | — | 573,657 | ||||||||||||||||||||||||
|
Gerber Scientific, Inc. and President, Gerber Technology
|
2011
|
258,692 | — | 231,412 | — | 108,158 | 45,000 | 789 | (11) | 644,051 | |||||||||||||||||||||||
|
(1)
|
Salary includes compensation used for medical insurance premiums and employee contributions to Gerber’s 401(k) savings and medical plans, which is not taxable income.
|
|
(2)
|
Dollar amounts represent the fair value of the stock award at the grant date during fiscal 2011, fiscal 2010 and fiscal 2009, respectively, as required by accounting principles generally accepted in the United States, disregarding any estimate of forfeitures relating to service-based vesting conditions. See Note 11 to Gerber’s 2011 audited financial statements included in Item 15, “Exhibits, Financial Statement Schedules.”
|
|
(3)
|
Dollar amounts represent the fair value of option awards at the grant date during fiscal 2011, fiscal 2010 and fiscal 2009, respectively, as required by accounting principles generally accepted in the United States, disregarding any estimate of forfeitures related to service-based vesting conditions. The weighted-average assumptions used in valuing the amounts set forth above are as follows:
|
60
|
|
For the Fiscal Years Ended April 30,
|
|||||||||||
|
|
2011
|
2010
|
2009
|
|||||||||
|
Expected option term
|
6.0 years
|
5.7 years
|
5.5 years
|
|||||||||
|
Expected volatility
|
70 | % | 70 | % | 46 | % | ||||||
|
Risk-free interest rate
|
1.4 | % | 2.3 | % | 3.0 | % | ||||||
|
(4
|
)
|
Amounts represent the potential amounts to be earned under the fiscal 2011 annual incentive compensation plan. For a discussion of the performance metrics applicable to these awards, see “2011 Annual Incentive Compensation Plan” under “Compensation Discussion and Analysis – Elements of Our Executive Compensation Program” above and for the actual amounts earned by each named executive officer, see the chart in the same section.
|
||
| (5 |
)
|
Amounts represent solely the change in pension value and include both Gerber’s qualified pension plan and its nonqualified supplemental employee retirement plan.
|
||
| (6 | ) |
“All Other Compensation” for Mr. Giles for fiscal 2011 represents Gerber’s matching contribution to the company’s 401(k) plan.
|
||
|
(7
|
)
|
“All Other Compensation” for Mr. Elia represents the following: for fiscal 2009, Gerber’s matching contribution to the company’s 401(k) plan in the amount of $3,806, reimbursement of actual expenses for airfare of $16,575, forhousing of $33,550, and for car rental of $10,310, and a related tax gross-up of $48,831; for fiscal 2010, reimbursement of actual expenses for airfare of $15,799, for housing of $33,700, and for car rental of $8,921, and a related tax gross-up of $47,203; and for fiscal 2011, Gerber’s matching contribution to the company’s 401(k) plan in the amount of $969, reimbursement of actual expenses for airfare of $14,890, for housing of $26,856, and for car rental of $11,810, and a related tax gross-up of $43,273. The reimbursements for airfare, car rental and housing and the related tax gross-ups were provided in lieu of relocating Mr. Elia from his current residence.
|
||
|
(8
|
)
|
“All Other Compensation” for Mr. Larson represents the following: for fiscal 2009, the company’s matching contribution to the company’s 401(k) plan of $1,009, an expatriate living allowance of $52,218, family tuition fees for the school year of $124,999, a car lease in the amount of $15,842, foreign tax payments on his behalf calculated and paid during fiscal 2009 for current assignment in Belgium of $96,498, tax equalization of $3,939 and tax preparation service payments of $2,500; for fiscal 2010, an expatriate living allowance of $88,279, family tuition fees for the school year of $95,375, a car allowance in the amount of $10,449, home leave of $8,977, tax payments on his behalf calculated and paid during fiscal 2010 for current assignment in Belgium of $37,800, and tax preparation service payments of $2,000; and for fiscal 2011, the company’s matching contribution to the company’s 401(k) plan of $706, expatriate allowance of $91,879, family tuition fees for the school year of $74,517, a car allowance in the amount of $14,579, home leave of $5,917, tax payments on his behalf calculated and paid during fiscal 2011 for current assignment of $77,867, tax preparation fees of $2,500, and moving expense of $30,000.
|
||
| (9 | ) |
Amount represents a signing bonus paid to Mr. Finn upon commencement of employment on February 15, 2010.
|
||
|
(10
|
)
|
“All Other Compensation” for Mr. Finn represents the following: for fiscal 2010, reimbursement of actual expenses for airfare of $1,012, for housing of $7,365, and for mileage of $302, and a related tax gross-up of $6,402; and for fiscal 2011, Gerber’s matching contribution to the company’s 401(k) plan in the amount of $942, reimbursement of actual expenses for airfare of $4,371, for housing of $31,707, and for mileage of $449, and a related tax gross-up of $27,396 (the reimbursements for airfare, housing and mileage and the related tax gross-ups were provided in lieu of relocating Mr. Finn from his current residence during his first year of employment), and, for current assignment in China, for housing of $4,869, for home leave of $3,729 and for home maintenance of $2,000, and for miscellaneous relocation allowance of $10,000.
|
||
| (11 | ) |
“All Other Compensation” for Mr. Hancock represents Gerber’s matching contribution to the company’s 401(k) plan.
|
61
The following table presents information with respect to the grants of plan-based awards by Gerber to the named executive officers during fiscal 2011.
Fiscal 2011 Grants of Plan-Based Awards Table
|
All Other
|
All Other
|
Exercise
|
||||||||||||||||||||||||||||||
|
Stock
|
Option
|
Or
|
Grant Date
|
|||||||||||||||||||||||||||||
|
Awards:
|
Awards:
|
Base
|
Fair Value
|
|||||||||||||||||||||||||||||
|
Estimated Possible Payouts Under
|
No. of
|
No. of
|
Price
|
of
|
||||||||||||||||||||||||||||
|
Non-Equity Incentive Plan
|
Shares of
|
Securities
|
of
|
Stock and
|
||||||||||||||||||||||||||||
|
Awards(1)
|
Stock or
|
Underlying
|
Option
|
Option
|
||||||||||||||||||||||||||||
|
Grant
|
Threshold
|
Target
|
Maximum
|
Units
|
Options
|
Awards
|
Awards
|
|||||||||||||||||||||||||
|
Name
|
Date
|
($)
|
($)
|
($)
|
(#)(2) | (#)(3) |
($/Sh)
|
($)
|
||||||||||||||||||||||||
|
Marc T. Giles
|
(1 | ) | — | 450,000 | 900,000 | — | — | — | — | |||||||||||||||||||||||
|
9/23/10
|
— | — | — | — | 156,250 | 5.93 | 578,125 | |||||||||||||||||||||||||
|
Michael R. Elia
|
(1 | ) | — | 210,000 | 420,000 | — | — | — | — | |||||||||||||||||||||||
|
9/23/10
|
— | — | — | — | 117,188 | 5.93 | 433,956 | |||||||||||||||||||||||||
|
Rodney Larson
|
(1 | ) | — | 127,500 | 255,000 | — | — | — | — | |||||||||||||||||||||||
|
9/23/10
|
— | — | — | — | 84,636 | 5.93 | 313,153 | |||||||||||||||||||||||||
|
Thomas P. Finn
|
(1 | ) | — | 170,000 | 340,000 | — | — | — | — | |||||||||||||||||||||||
|
9/23/10
|
— | — | — | — | 26,042 | 5.93 | 96,355 | |||||||||||||||||||||||||
|
3/07/11
|
— | — | — | — | 35,000 | 8.20 | 182,000 | |||||||||||||||||||||||||
|
John Hancock
|
(1 | ) | — | 142,500 | 285,000 | — | — | — | — | |||||||||||||||||||||||
|
9/23/10
|
— | — | — | 39,024 | — | — | 231,412 | |||||||||||||||||||||||||
|
(1)
|
Amounts represent the potential amounts to be earned under the fiscal 2011 annual incentive compensation plan. For a discussion of the performance metrics applicable to these awards, see “2011 Annual Incentive Compensation Plan” under “Compensation Discussion and Analysis — Elements of Our Executive Compensation Program” above. For the actual amounts earned by each named executive officer, see the “Non-Equity Incentive Plan Compensation” column of the “Summary Compensation Table” above.
|
|
(2)
|
Represents awards of restricted stock under the 2006 Omnibus Incentive Plan. The award vested in full on April 30, 2011.
|
|
(3)
|
Represents awards of stock options under the 2006 Omnibus Incentive Plan. Stock option awards vest ratably over three-years on each anniversary of the grant date.
|
62
The following table presents information with respect to the outstanding equity awards at the 2011 fiscal year-end for the named executive officers.
Fiscal 2011 Outstanding Equity Awards at Fiscal Year-End Table
|
Option Awards
|
Stock Awards
|
||||||||||||||||||||||||
|
Market
|
|||||||||||||||||||||||||
|
Number of
|
Number of
|
Number of
|
Value of
|
||||||||||||||||||||||
|
Securities
|
Securities
|
Shares or
|
Shares or
|
||||||||||||||||||||||
|
Underlying
|
Underlying
|
Units of
|
Units of
|
||||||||||||||||||||||
|
Unexercised
|
Unexercised
|
Option
|
Option
|
Stock That
|
Stock That
|
||||||||||||||||||||
|
Grant
|
Options (#)
|
Options (#)
|
Exercise
|
Expiration
|
Have Not
|
Have Not
|
|||||||||||||||||||
|
Name
|
Date
|
Exercisable
|
Unexercisable
|
Price ($)
|
Date
|
Vested (#)
|
Vested ($)(1)
|
||||||||||||||||||
|
Marc T. Giles
|
12/5/2006 (2)
|
50,000 | — | 13.97 |
12/5/2016
|
— | — | ||||||||||||||||||
|
12/22/2006(3)
|
41,515 | — | 12.69 |
12/6/2011
|
— | — | |||||||||||||||||||
|
3/16/2007(4)
|
33,300 | — | 9.89 |
6/18/2012
|
— | — | |||||||||||||||||||
|
12/1/2007(2)
|
115,000 | — | 9.50 |
12/1/2017
|
7,500 | 71,700 | |||||||||||||||||||
|
9/25/2008(2)
|
92,000 | 46,000 | 8.99 |
9/25/2018
|
15,000 | 143,400 | |||||||||||||||||||
|
9/17/2009(2)
|
— | — | — | — | 108,696 | 1,039,134 | |||||||||||||||||||
|
9/23/2010(2)
|
— | 156,250 | 5.93 |
9/23/2020
|
— | — | |||||||||||||||||||
|
Total
|
331,815 | 202,250 | 131,196 | 1,254,234 | |||||||||||||||||||||
|
Michael R. Elia
|
4/15/2008(5)
|
100,000 | — | 8.87 |
4/15/2018
|
— | — | ||||||||||||||||||
|
9/25/2008(2)
|
30,000 | 15,000 | 8.99 |
9/25/2018
|
7,500 | 71,700 | |||||||||||||||||||
|
9/17/2009(2)
|
— | — | — | — | 43,821 | 418,929 | |||||||||||||||||||
|
9/23/2010(2)
|
— | 117,188 | 5.93 |
9/23/2020
|
— | — | |||||||||||||||||||
|
Total
|
130,000 | 132,188 | 51,321 | 490,629 | |||||||||||||||||||||
|
Rodney Larson
|
6/19/2007(2)
|
5,000 | — | 11.99 |
6/19/2017
|
750 | 7,170 | ||||||||||||||||||
|
12/1/2007(2)
|
25,000 | — | 9.50 |
12/1/2017
|
2,250 | 21,510 | |||||||||||||||||||
|
9/25/2008(2)
|
18,800 | 9,400 | 8.99 |
9/25/2018
|
4,700 | 44,932 | |||||||||||||||||||
|
9/17/2009(2)
|
— | — | — | — | 31,441 | 300,576 | |||||||||||||||||||
|
9/23/2010(2)
|
— | 84,636 | 5.93 |
9/23/2020
|
— | — | |||||||||||||||||||
|
Total
|
48,800 | 94,036 | 39,141 | 374,188 | |||||||||||||||||||||
|
Thomas P. Finn
|
2/15/2010(2)
|
33,334 | 66,666 | 5.72 |
2/15/2020
|
22,500 | 215,100 | ||||||||||||||||||
|
9/23/2010(2)
|
— | 26,042 | 5.93 |
9/23/2020
|
— | — | |||||||||||||||||||
|
3/7/2011(2)
|
— | 35,000 | 8.20 |
3/7/2021
|
— | — | |||||||||||||||||||
|
Total
|
33,334 | 127,708 | 22,500 | 215,100 | |||||||||||||||||||||
|
John Hancock
|
12/7/2001(2)
|
20,000 | — | 9.34 |
12/7/2011
|
— | — | ||||||||||||||||||
|
12/6/2005(2)
|
20,000 | — | 9.45 |
12/6/2015
|
— | — | |||||||||||||||||||
|
12/5/2006(2)
|
20,000 | — | 13.97 |
12/5/2016
|
— | — | |||||||||||||||||||
|
12/1/2007(2)
|
20,000 | — | 9.50 |
12/1/2017
|
— | — | |||||||||||||||||||
|
Total
|
80,000 | — | — | — | |||||||||||||||||||||
|
(1)
|
Valuation is based on the $9.56 closing price of Gerber’s common stock on April 30, 2011 as reported on the NYSE.
|
|
|
(2)
|
Stock options granted on these dates generally vest ratably over a three-year period, beginning on the first anniversary of the grant date. Restricted stock granted on these dates vests ratably over a four-year period, beginning on the first anniversary of the grant date.
|
|
|
(3)
|
This stock option represents a reload stock option granted to Mr. Giles on December 22, 2006 upon his exercise of the original option. This option vested in full on December 22, 2009.
|
|
|
(4)
|
This stock option represents a reload stock option granted to Mr. Giles on March 16, 2007 upon his exercise of the original option. This option vested in full on March 16, 2010.
|
|
|
(5)
|
Mr. Elia’s April 25, 2008 stock option and restricted stock grants vested on April 15, 2010.
|
|
63
The following table presents information with respect to the options exercised and stock awards vested during the 2011 fiscal year for the named executive officers.
Fiscal 2011 Option Exercises and Stock Vested Table
|
|
Option Awards
|
Stock Awards
|
||||||||||||||
|
Name
|
Number of
Shares
Acquired on
Exercise (#)
|
Value
Realized on
Exercise ($)(1)
|
Number of
Shares
Acquired on
Vesting (#)
|
Value Realized
on Vesting ($)(2)
|
||||||||||||
|
Marc T. Giles
|
— | — | 55,232 | 350,848 | ||||||||||||
|
Michael R. Elia
|
— | — | 18,357 | 109,611 | ||||||||||||
|
Rodney Larson
|
— | — | 15,831 | 97,967 | ||||||||||||
|
Thomas P. Finn
|
— | — | 7,500 | 57,375 | ||||||||||||
|
John Hancock
|
40,525 | 127,601 | 105,469 | 893,367 | ||||||||||||
|
(1)
|
Value realized is calculated by multiplying the number of shares acquired upon exercise by the difference between the fair market value of Gerber’s common stock on the date of exercise minus the exercise price of the stock option.
|
|
(2)
|
Value realized is calculated by multiplying the number of shares by the closing price of Gerber’s common stock on the NYSE on the vesting date.
|
Pension Benefits Table
Gerber maintains a tax-qualified, noncontributory pension plan for all U.S. employees who were hired before May 1, 2004. In addition, to provide additional retirement benefits to some of our more highly paid executives in excess of the compensation limitations and maximum benefit accruals for tax-qualified plans imposed by the Internal Revenue Code, we maintain a nonqualified supplemental employment retirement plan. Benefits under the SERP are also provided by Gerber on a noncontributory basis. Employees hired on or after May 1, 2004 are not eligible to participate in the pension plan or the SERP and are entitled to participate only in the company’s 401(k) plan. Of our named executive officers, Messrs. Giles and Hancock participate in both the qualified plan and the SERP. Messrs. Elia, Larson and Finn, who were hired after May 1, 2004, are not eligible to participate in the qualified plan or the SERP.
For each eligible named executive officer, benefits pursuant to the tax-qualified pension plan are generally based on the executive’s credited years of service and his “final average compensation.” “Final average compensation” is equal to the average of the executive’s base salary for the five consecutive calendar years during the last ten calendar years prior to termination or retirement, whichever occurs first, but not less than the benefit accrued as of April 30, 2004 and not greater than benefits accrued as of May 1, 2009, in which such average was the highest. The maximum annual compensation that can be taken into account for plan purposes, as well as the maximum annual benefit that can be accrued under the plan, is limited by Internal Revenue Service regulations. Benefits are then reduced by an offset for social security benefits. Thus, the formula for calculating the normal retirement pension benefit pursuant to the pension plan is as follows:
final average compensation × years of service × 1.5%
This result is then reduced by the named executive officer’s expected social security benefit, as follows:
social security benefit × years of service × 1.67%
Pension plan benefits are vested after five years of continued service with the company. Each of the named executive officers participating in the pension plan has five years or more of continued service with the company and thus is fully vested under the plan. In addition, pension plan benefits are actuarially reduced for participants who retire on or after age 55 (which constitutes early retirement). Messrs. Giles and Hancock are the only named executive officer eligible for early retirement pursuant to the pension plan. Upon early retirement, the plan provides that a participant would be entitled to the participant’s accrued benefit under the plan, reduced by 7% for each year (pro rated for months) by which the commencement of benefit payments precedes his normal retirement date. The plan further provides, however, that no actuarial reduction is to be made to the accrued benefits upon early retirement if the employee’s age and years of service total 85. No named executive officer meets this threshold, and
64
thus no such officer may retire early pursuant to the pension plan without a reduction in benefits.
Pursuant to the SERP, each named executive officer who participates is entitled to receive benefits equal to the benefits that would have been accrued under the tax-qualified pension plan if the maximum limitations on compensation that could be considered, and the annual benefit that could be accrued, under that plan did not apply, reduced by the amount of benefit actually accrued under the tax-qualified pension plan. Benefits under the SERP will be paid to each participating officer at the time the officer elects, and in the same form and manner as elected by the officer.
Upon retirement at normal retirement age of 65, or upon disability prior to age 65 (in which case there would be no adjustment for early retirement), each named executive officer generally will be entitled to receive his accrued pension benefits in either (1) monthly payments for the life of the officer, or (2) a lump sum payment (provided that the officer’s vested benefit is at least $5,000 and less than $15,000), as elected by the named executive officer. The plan allows terminating participants to elect to receive their pension as a single payment instead of as an annuity if the lump sum does not exceed $5,000. The pension plan is currently funded between 60% and 80%. As long as this funding level remains in effect, the plan cannot pay more than 50% of the benefit as a lump sum, if the benefit is over $5,000. Terminating participants will have the option to start receiving the rest of their benefits as a monthly annuity, or receiving the entire benefit as a lump sum at a later date. Beneficiaries may also elect guarantee payments beyond their death for ten years or for the life of their spouse. Such an election results in an actuarially reduced monthly payment. If the benefits payable to a named executive officer do not exceed $5,000, the officer is required to receive such amount in a lump sum payment.
In the event of the named executive officer’s death prior to normal retirement age, if and only if the officer is married at such time, the officer’s spouse is generally entitled to receive a reduced pre-retirement survivor annuity in the amounts set forth in the pension plan.
Gerber froze its tax-qualified, noncontributory pension plan and SERP effective April 30, 2009. As a result, no additional benefit will accrue to any participant, including the participating named executive officers, in either the qualified plan or the SERP. All participants, including the participating named executive officers, will remain eligible to retire early without a reduction in benefit when each participant’s combined age and years of service totals 85.
The table below illustrates the estimated present value of the accumulated benefit under these retirement plans. The value of each plan is designated separately. The calculation assumes that the named executive officer retires at age 65 (including Mr. Hancock, although he is eligible for early retirement), which is the normal retirement age as defined under the pension plan and SERP, and uses compensation levels as of April 30, 2011.
|
|
Fiscal 2011 Pension Benefits Table
|
||||||||||||
|
Name
|
Plan Name
|
Number
of Years
Credited
Service(1)
|
Present Value
of Accumulated
Benefit(2)
|
Payments
During
Last
Fiscal Year
|
|||||||||
|
Marc T. Giles
|
Gerber Scientific, Inc. and
|
10.4 | |||||||||||
|
Participating Subsidiaries Pension Plan
|
$ | 156,800 | — | ||||||||||
|
Gerber Scientific, Inc. SERP
|
$ | 354,600 | — | ||||||||||
|
John Hancock
|
Gerber Scientific, Inc. and
|
13.2 | |||||||||||
|
Participating Subsidiaries Pension Plan
|
$ | 315,100 | — | ||||||||||
|
Gerber Scientific, Inc. SERP
|
$ | 128,000 | — | ||||||||||
|
(1)
|
Number of years of credited service is computed as of April 30, 2011. The number of years of credited service for each named executive officer is equal to his actual years of service with Gerber as of April 30, 2011. Gerber does not have a policy of granting extra years of credited service to its named executive officers or other participating employees generally.
|
|
(2)
|
Amounts represent the present value of the accumulated benefit under the qualified plan or SERP, as applicable, as of April 30, 2011. The assumptions used in calculating these amounts are included in Note 13 to Gerber’s fiscal 2011 audited consolidated financial statements included in Item 15, “Exhibits, Financial Statement Schedules.”
|
65
Potential Payments Upon Termination and Change in Control
Each of Messrs. Giles, Elia, Larson, Finn, and Hancock is entitled to receive termination benefits that are not available to our employees generally. These benefits are provided pursuant to (1) our Severance Policy for Senior Officers, as amended by Gerber effective in September 2006, and (2) change in control agreements, as amended by Gerber in August 2007. In addition, our equity plans provide for accelerated or continued vesting of unvested equity awards upon various termination events.
Messrs. Giles, Elia, Larson, Finn, and Hancock
Severance Policy for Senior Executives
Pursuant to the severance policy, upon termination of the named executive officer for any reason other than death, disability or retirement or by Gerber for “cause” (as defined under “Change in Control Agreements” immediately below), each such officer is entitled to the following:
|
|
•
|
continuation of base salary, as in effect as of the termination date, for (1) 16 months, in the case of Mr. Giles, or (2) 12 months, in the case of Messrs. Elia, Larson, Finn, and Hancock, payable in accordance with Gerber’s normal payroll practices;
|
|
|
•
|
the pro rata portion (through the date of termination) of the target annual incentive compensation that the officer would have earned if the officer had continued his employment with Gerber through the end of the fiscal year in which the termination occurred, payable at the time such compensation is normally paid and only if the performance goals relating to the compensation are achieved; and
|
|
|
•
|
continuation of company-paid health (medical and dental) insurance coverage for (1) 16 months, in the case of Mr. Giles, or (2) 12 months, in the case of Messrs. Elia, Larson, Finn, and Hancock, and continued life insurance benefits for a period of 30 days following termination.
|
Notwithstanding the above, if the officer is entitled to payments or benefits pursuant to his change in control agreement, as discussed immediately below, the officer will not be entitled to any payments or benefits pursuant to the severance policy, with the result that the officer may not receive benefits pursuant to both the severance policy and the change in control agreement. In addition, the severance policy provides that if the officer obtains full-time employment with a company that is not a competitor of Gerber, the officer will receive, in lieu of the above benefits, a lump sum payment equal to 50% of the remaining amount of base salary that would have been payable to the officer pursuant to the severance policy. In the event of the officer’s death after termination due to the circumstances described above, the severance policy requires that Gerber pay to the officer’s estate or beneficiary the severance benefits described above, so long as the estate or beneficiary satisfies the conditions that would have been applicable to the officer, as described immediately below.
To receive the foregoing termination benefits, the named executive officer must release Gerber from any and all claims. In addition, Gerber’s obligation to make the above payments, or make available the above benefits, will cease in the event the officer:
|
|
•
|
competes with the business of Gerber;
|
|
|
•
|
discloses confidential information or data relating to Gerber;
|
|
|
•
|
appropriates any such confidential information or data for his own benefit;
|
|
|
•
|
solicits or hires any person who is, or has been in the prior six months, employed by Gerber to leave Gerber;
|
|
|
•
|
solicits or diverts the business of any customer or client, or any prospective customer or client, of Gerber;
|
|
|
•
|
engages in any action that is determined by the Management Development and Compensation Committee to be detrimental to Gerber and its shareholders; or
|
|
|
•
|
is engaged in full-time employment, except as described above regarding employment with a company that is not a competitor of Gerber.
|
Change in Control Agreements
Pursuant to change in control agreements entered into with each of Messrs. Giles, and Larson in August 2007, Mr. Elia in April 2008, and Mr. Finn in February, 2010, each officer is entitled to the following upon termination of employment with Gerber occurring within two years of a “change in control,” unless such termination is a result of death, disability, retirement,
66
termination by the executive for other than “good reason” or by Gerber for “cause” (each term as generally defined below):
|
|
•
|
a lump sum severance payment equal to (1) three times the sum of his base salary and annual incentive bonus payment in effect as of the termination date, in the case of Mr. Giles, or (2) 2.5 times the sum of his base salary and annual incentive bonus payment in effect as of the termination date, in the case of each of Messrs. Elia, Larson, Finn and Hancock;
|
|
|
•
|
a lump sum cash payment equal to (1) 36 monthly payments, in the case of Mr. Giles, or (2) 30 monthly payments, in the case of each of Messrs. Elia, Larson, Finn, and Hancock, that would have been paid by Gerber for the cost of all life insurance, health (medical and dental), accidental death and dismemberment, and disability plans in which the executive was entitled to participate immediately prior to the date of termination; and
|
|
|
•
|
acceleration and full vesting of all unvested stock awards.
|
Mr. Hancock is not included in the table reported below for change in control benefits as his change in control agreement terminated on April 30, 2011, when his employment terminated.
For purposes of the above severance payment, “annual incentive bonus payment in effect as of the termination date” means the target amount of the annual incentive bonus payment for the year in which the notice of termination is given.
Upon the executive’s termination for death, disability, retirement, for other than good reason or by Gerber for cause, the executive is not entitled to any termination or severance benefits under the change in control agreement. The executive will be entitled, however, to any applicable acceleration of outstanding equity awards, as described immediately below under “Equity Plans.”
In exchange for the above payments or benefits, pursuant to the change in control agreements, each officer has agreed that in the event of a “potential change in control” (as generally defined below), the officer will not voluntarily terminate his employment with Gerber until the earlier to occur of (1) six months after the occurrence of the potential change in control, or (2) a change in control of Gerber.
In addition, as a condition of receipt of the above termination benefits, the executive must sign a general release in favor of Gerber which releases Gerber from all future claims, as well as certifies the executive’s agreement to be bound by the confidentiality and non-compete provisions required by the agreement for a period of one year following termination. Severance payments and other benefits under the change in control agreements will not be deferred or withheld on the basis of an asserted violation of the confidentiality provision.
Gerber has agreed to require any successor to its business expressly to assume the company’s obligations under the severance agreements. If any such successor to Gerber does not agree to assume the severance obligations and related payments, the executive is entitled to compensation from Gerber in the same amount and on the same terms as he would be entitled under the severance agreements in the event of termination without cause or termination for good reason following a change in control.
Pursuant to the severance agreements, the following terms have the meanings indicated below:
“Good reason” is generally defined to mean any of the following events:
|
|
•
|
a material diminution in the nature and scope of the executive’s authority, duties or responsibilities from those applicable immediately prior to the change in control;
|
|
|
•
|
a reduction in the executive’s base salary from that provided immediately prior to the change in control;
|
|
|
•
|
a diminution in the executive’s eligibility to participate in compensation plans and employee benefits and perquisites which provided opportunities to receive overall compensation and benefits and perquisites from the greater of:
|
|
|
•
|
the opportunities provided by Gerber for executives with comparable duties; or
|
|
|
•
|
the opportunities under any such plans and perquisites under which the executive was participating immediately prior to the change in control;
|
|
|
•
|
a change in the location of the executive’s principal place of employment by more than 50 miles from the location applicable immediately prior to the change in control;
|
|
|
•
|
a significant increase in the executive’s frequency or duration of business travel; or
|
|
|
•
|
a reasonable determination by the Board that, as a result of the change in control and change in circumstances thereafter significantly affecting the executive’s position, the executive is unable to exercise the authority, powers,
|
67
|
|
functions or duties applicable to his position immediately prior to the change in control.
|
“Change in control” is generally defined to mean any of the following events:
|
|
•
|
Gerber merges or consolidates with another entity resulting in less than 50% ownership, or Gerber sells or otherwise disposes of all or substantially all of its assets;
|
|
|
•
|
the shareholders of Gerber adopt a plan of liquidation of the company;
|
|
|
•
|
any person generally becomes the beneficial owner of 30% or more of Gerber’s voting securities; or
|
|
|
•
|
as a result of any tender or exchange offer, merger or disposition of all or substantially all of Gerber’s assets, the Directors of Gerber as of the date of the severance agreements cease to constitute a majority of the Board (with an exception for Directors whose appointment or nomination for election was subsequently approved by three-fourths of the Directors serving on the Board as of the date of the severance agreements).
|
“Potential change in control” is generally defined to mean any of the following events:
|
|
•
|
the entry by Gerber into an agreement, the consummation of which would result in the occurrence of a change in control;
|
|
|
•
|
the public announcement by any person of an intention to take actions which, if consummated, would constitute a change in control; or
|
|
|
•
|
the adoption by the Board of a resolution to the effect that, for purposes of the severance agreements, a change in control has occurred.
|
“Cause” is generally defined to mean the willful and continued failure by the executive to substantially perform his duties with Gerber, or the willful engagement by the executive in conduct that is demonstrably and materially injurious to Gerber, monetarily or otherwise.
Equity Plans
Each of Messrs. Giles, Elia, Larson, and Finn holds outstanding unvested stock options or restricted stock awards that are subject to acceleration upon the termination events described immediately below. These outstanding awards were issued pursuant to our 2006 Omnibus Incentive Plan.
Under these plans, outstanding unvested stock options and shares of restricted stock held by the executives will accelerate and vest in full upon the executive’s termination due to death or disability, or upon a change in control of Gerber.
Estimated Payments
The table below sets forth the estimated payments to each of Messrs. Giles, Elia, Larson and Finn upon the termination events described immediately above. The estimated payments are based on the assumption that the termination event occurred on April 30, 2011, the last day of our most recently completed fiscal year, and the stock price of our common stock was $9.56, which was the closing price of our common stock as reported on the NYSE on April 30, 2011. The estimates below are based on these assumptions, as required by SEC rules, while the actual amounts to be paid to each officer will be determinable only upon the occurrence of the actual termination event. In addition, the amounts set forth in the table below do not include any other payments that are available to our employees generally on a non-discriminatory basis or otherwise due and owing to the executive through the date of termination. For Mr. Hancock, the table sets forth the actual payments to which he is entitled as a result of his termination on April 30, 2011.
|
Named Executive Officer
|
Severance Policy
($)(1)
|
Change in Control Agreements($)(2)
|
||||||
|
Marc T. Giles
|
812,849 | 5,037,441 | ||||||
|
Michael R. Elia
|
364,432 | 2,365,891 | ||||||
|
Rodney Larson
|
324,997 | 1,748,931 | ||||||
|
Thomas P. Finn
|
405,512 | 1,989,956 | ||||||
|
John Hancock
|
294,048 | — | ||||||
68
|
(1)
|
Amounts calculated based on each executive’s base salary as of April 30, 2011, or $800,000 ($600,000 times 1.33 years) for Mr. Giles, $350,000 for Mr. Elia, $255,000 for Mr. Larson, $340,000 for Mr. Finn and $285,000 for Mr. Hancock. Amounts include continuation of health (medical and dental) and life insurance benefits for the periods described under “Severance Policy for Senior Executives” above as follows: $12,849 for Mr. Giles; $14,432 for Mr. Elia; $21,390 for Mr. Larson; $21,415 for Mr. Finn and $9,048 for Mr. Hancock. Amounts also include $48,607 for Mr. Larson, which includes approximate value of repatriation costs from his international assignment and tax preparation fees for the year of return and $43,907 for Mr. Finn, which includes approximate value of repatriation costs from his international assignment and tax preparation fees for the year of return. Amounts do not include any pro rata bonus payments. Each executive’s fiscal 2011 bonus is set forth in the fiscal 2011 “Non-Equity Incentive Compensation Plan” column of the “Summary Compensation Table” above.
|
|
(2)
|
Represents amounts to be provided pursuant to each executive’s change in control agreement and, in the case of Messrs. Larson and Finn, each executive's expatriate assignment letter agreement. Amounts include the following: (a) a lump sum severance payment, calculated based on each executive’s base salary plus annual incentive bonus payment in effect as of April 30, 2011, or $3,150,000 ($1,050,000 times three-years) for Mr. Giles, $1,400,000 ($560,000 times 2.5 years) for Mr. Elia, $956,250 ($382,500 times 2.5 years) for Mr. Larson, and $1,275,000 ($510,000 times 2.5 years) for Mr. Finn; (b) a lump sum payment equal to $39,800 for Mr. Giles, $41,320 for Mr. Elia, $57,299 for Mr. Larson, and $58,629 for Mr. Finn, reflecting the amount Gerber would have paid for the cost of all life insurance, health (medical and dental), accidental death and dismemberment and disability plans in which the executive was entitled to participate as of April 30, 2011; (c) $48,607 for Mr. Larson, which includes approximate value of repatriation costs from his international assignment and tax preparation fees for the year of return and $43,097 for Mr. Finn, which includes approximate value of repatriation costs from his international assignment and tax preparation fees for the year of return; and (d) the acceleration of all unvested stock option and restricted stock awards held by each officer as of April 30, 2011, as follows: $1,847,641 for Mr. Giles; $924,571 for Mr. Elia; $686,775 for Mr. Larson; and $613,230 for Mr. Finn. For stock option awards, amounts calculated are based on the difference between the option’s exercise price and the fair market value of our common stock on April 30, 2011, or $9.56 per share, multiplied by the number of shares. For restricted stock awards, the amount calculated is based on the number of shares multiplied by the fair market value of our common stock on April 30, 2011. For purposes of these equity acceleration estimates, we have not included outstanding unvested out-of-the-money stock option awards pursuant to which the exercise price of the option exceeded the fair market value of our common stock on April 30, 2011. For additional information about these awards, see the “Fiscal 2011 Outstanding Equity Awards at Fiscal Year-End Table” above.
|
Compensation Committee Interlocks and Insider Participation
Throughout fiscal 2011, John R. Lord served as Chair and James Mitarotonda, Carole F. St. Mark and W. Jerry Vereen served as members of the Management Development and Compensation Committee. No member of the Committee during fiscal 2011 is or was an officer or other employee of Gerber or any of its subsidiaries. No executive officer of Gerber or any of its subsidiaries served as a member of the compensation committee, or committee performing similar functions, or board of directors of any other entity which had an executive officer serving as a member of Gerber’s Board or Management Development and Compensation Committee during fiscal 2011.
Security Ownership
The following tables present information regarding beneficial ownership of Gerber’s common stock as of May 31, 2011. This information has been presented in accordance with the rules of the SEC and is not necessarily indicative of beneficial ownership for any other purpose. Under SEC rules, beneficial ownership of a class of capital stock as of any date includes any shares of that class as to which a person, directly or indirectly, has or shares voting power or investment power as of that date and also any shares as to which a person has the right to acquire sole or shared voting or investment power as of or within 60 days after that date through the exercise of any stock option, warrant or other right, without regard to whether such right expires before the end of such 60-day period or continues thereafter. If two or more persons share voting power or investment power with respect to specific securities, all of such persons may be deemed to be the beneficial owners of such securities. Information with respect to persons other than the holders listed in the tables below that share beneficial ownership with respect to the securities
69
shown is set forth following the applicable table.
There were 25,091,778 shares of common stock outstanding as of May 31, 2011.
Principal Shareholders
The following table presents, as of May 31, 2011, information based upon Gerber’s records and filings with the SEC regarding each person, other than a Director, Director nominee or executive officer of Gerber, known to Gerber to be the beneficial owner of more than 5% of the common stock:
|
Name and Address of Beneficial Owner
|
Amount and Nature of
Beneficial Ownership
|
Percent of
Class (%)
|
||||||
|
BlackRock, Inc.
|
2,116,759 | 8.4 | ||||||
|
40 East 52(nd) Street
|
||||||||
|
New York, New York 10022
|
||||||||
|
Mario J. Gabelli and affiliates
|
2,088,133 | 8.3 | ||||||
|
One Corporate Center
|
||||||||
|
Rye, New York 10580
|
||||||||
|
Dimensional Fund Advisors LP
|
1,930,544 | 7.7 | ||||||
|
Palisades West, Bldg One
|
||||||||
|
6300 Bee Cave Road
|
||||||||
|
Austin, Texas 78746
|
||||||||
|
Zesiger Capital Group LLC
|
1,865,175 | 7.4 | ||||||
|
460 Park Ave. 22(nd) Floor,
|
||||||||
|
New York, New York 10022
|
||||||||
|
Royce & Associates, LLC
|
1,783,900 | 7.1 | ||||||
|
745 Fifth Avenue
|
||||||||
|
New York, New York 10151
|
||||||||
|
Barington Companies Equity Partners, L.P. and affiliates
|
1,336,094 | 5.3 | ||||||
|
888 Seventh Avenue, 17(th) Floor
|
||||||||
|
New York, New York 10019
|
||||||||
|
RGM Capital, LLC
|
1,289,799 | 5.1 | ||||||
|
6621 Willow Park Drive, Suite One
|
||||||||
|
Naples, Florida 34109
|
||||||||
The percentage of beneficial ownership as to any person as of a particular date is calculated by dividing the number of shares beneficially owned by such person, which includes the number of shares as to which such person has the right to acquire voting or investment power as of or within 60 days after that date, by the sum of the number of shares outstanding as of that date plus the number of shares as to which such person has the right to acquire voting or investment power as of or within 60 days after that date. Consequently, the denominator for calculating beneficial ownership percentages may be different for each beneficial owner.
The information concerning BlackRock is based upon a Schedule 13G filed with the SEC on February 4, 2011. BlackRock reports that it has sole voting and dispositive power with respect to all of the reported shares.
The information concerning Mario J. Gabelli and affiliates is based upon a Schedule 13D/A filed with the SEC on July 9, 2010. In addition to Mr. Gabelli, each of the following entities that Mr. Gabelli controls or for which he acts as chief investment officer is a reporting person on the Schedule 13D/A: GGCP, Inc.; GAMCO Investors, Inc.; Gabelli Funds, LLC; GAMCO Asset Management, Inc.; and Teton Advisors, Inc.. According to the Schedule 13D/A, as of June 30, 2010, Gabelli Funds, LLC had beneficial ownership of 567,700 of the reported shares, GAMCO Investors, Inc. had beneficial ownership of 1,318,663 of the reported shares and Teton Advisers, Inc. had beneficial ownership of 219,770 of the reported shares. Mr. Gabelli is deemed
70
to have beneficial ownership of the shares owned beneficially by each of the foregoing entities. GAMCO Investors, Inc. and GGCP, Inc. are deemed to have beneficial ownership of the shares owned beneficially by each of the foregoing reporting persons other than Mr. Gabelli. Each of the reporting persons discloses that it has sole voting and investment power with respect to the securities it beneficially owns, except that: (1) GAMCO Investors, Inc. does not have voting power over 13,000 of the reported shares; (2) in some circumstances, the proxy voting committee of each fund for which Gabelli Funds, LLC provides managed account services may take and exercise in its sole discretion the entire voting power with respect to the shares held by such fund; and (3) the power of Mr. Gabelli, GAMCO Investors, Inc. and GGCP, Inc. to vote and invest the shares is indirect with respect to shares beneficially owned by the other reporting persons.
The information concerning Dimensional Fund Advisors LP is based upon an amendment to Schedule 13G filed with the SEC on February 11, 2011. Dimensional Fund Advisors LP reports that it is an investment adviser registered under the Investment Advisers Act of 1940, furnishes investment advice to four investment companies registered under the Investment Company Act of 1940 and serves as investment manager to certain other commingled group trusts and separate accounts, or the “Funds.” Dimensional Fund Advisors LP reports that, in its role as investment adviser or manager, neither Dimensional Fund Advisors LP nor any of its subsidiaries possesses investment or voting power over the reported shares held by the Funds, but that all of the shares shown are owned by the Funds. Dimensional Fund Advisors LP and its subsidiaries disclaim beneficial ownership of such shares.
The information concerning Zesiger Capital Group LLC is based upon an amendment to Schedule 13G filed with the SEC on February 11, 2011. Zesiger Capital Group LLC reports that it has sole voting power with respect to 1,461,000 of the reported shares and sole investment power with respect to all of the reported shares. Zesiger Capital Group LLC disclaims beneficial ownership of such shares on the basis that such shares are held in discretionary accounts that it manages.
The information concerning Royce & Associates, LLC is based upon an amendment to Schedule 13G filed with the SEC on January 13, 2011. Royce & Associates, LLC reports that it has sole voting and investment power with respect to all of the reported shares.
The information concerning Barington Companies Equity Partners, L.P., or “Barington,” and others is based upon a Schedule 13D/A filed with the SEC on June 9, 2010. Of the shares of common stock shown, Barington beneficially owns 845,981 shares, which we refer to as the “Barington shares.” The reporting persons disclose that the Barington shares also may be deemed to be owned beneficially by the general partner of Barington, Barington Companies Investors, LLC, or “Investors”; the majority member of Investors, Barington Capital Group, L.P., or “Group”; the general partner of Group, LNA Capital Corp., or “LNA”; and James A. Mitarotonda, the sole stockholder and director of LNA. Barington, Investors, Group, LNA and Mr. Mitarotonda report that, by virtue of their respective positions, each of them may be deemed to have sole voting and investment power over the Barington shares, regardless of the fact that multiple persons within the same chain of ownership report sole voting and investment power with respect to such shares. Mr. Mitarotonda disclaims beneficial ownership of the Barington shares except to the extent of his pecuniary interest therein. Of the shares of common stock shown, ICS Opportunities, Ltd., or “ICS,” beneficially owns 490,113 shares, which we refer to as the “ICS shares.” The reporting persons disclose that the ICS shares also may be deemed to be owned beneficially by the investment manager to ICS, Millennium International Management LP, or “International LP”; the general partner of International LP, Millennium International Management GP LLC, or “International GP”; the general partner of the 100% shareholder of ICS, Millennium Management LLC, or “Management LLC”; and the managing member of International GP and of Management LLC, Israel A. Englander. ICS reports that it holds shared power to vote and to dispose of the ICS shares. International LP, International GP, Management LLC and Mr. Englander report that they may be deemed to hold shared voting and investment power over the ICS shares. Mr. Englander disclaims beneficial ownership of the ICS shares except to the extent of his pecuniary interest therein.
The information concerning RGM Capital is based upon a Schedule 13G filed with the SEC on February 14, 2011. RGM reports that Robert G. Moses is the managing member of RGM Capital, LLC, a Delaware limited liability company that serves as the general partner of and exercises investment discretion over the accounts of, a number of investment vehicles. None of those investment vehicles has beneficial ownership of more than 5% of Gerber’s common stock.
Investment in Gerber Scientific, Inc. by Directors and Executive Officers
The following table presents, as of May 31, 2011, information regarding the beneficial ownership of Gerber’s common stock by the following persons:
71
|
|
•
|
each Director;
|
|
|
•
|
each nominee to the Board;
|
|
|
•
|
Gerber’s “named executive officers”; and
|
|
|
•
|
all of Gerber’s Directors and executive officers as a group.
|
|
Name of Beneficial Owner
|
Amount and Nature of
Beneficial Ownership
|
Percent of
Class (%)
|
||||||
|
Donald P. Aiken
|
68,859 | * | ||||||
|
Michael R. Elia
|
202,144 | * | ||||||
|
Thomas P. Finn
|
60,063 | * | ||||||
|
Marc T. Giles
|
389,667 | * | ||||||
|
John Hancock
|
--- | --- | ||||||
|
Rodney Larson
|
107,457 | * | ||||||
|
Randall D. Ledford
|
32,914 | * | ||||||
|
John R. Lord
|
47,914 | * | ||||||
|
James A. Mitarotonda
|
850,148 | 3.4 | ||||||
|
Javier Perez
|
23,917 | * | ||||||
|
Carole F. St. Mark
|
54,687 | * | ||||||
|
W. Jerry Vereen
|
58,428 | * | ||||||
|
All Directors and executive officers as a group (15 persons)
|
2,193,427 | 8.5 | ||||||
|
*
|
Less than one percent.
|
The percentage of beneficial ownership as to any person as of a particular date is calculated by dividing the number of shares beneficially owned by such person, which includes the number of shares as to which such person has the right to acquire voting or investment power as of or within 60 days after that date, by the sum of the number of shares outstanding as of that date plus the number of shares as to which such person has the right to acquire voting or investment power as of or within 60 days after that date. Consequently, the denominator for calculating beneficial ownership percentages may be different for each beneficial owner.
The shares shown as beneficially owned by Mr. Aiken include 3,000 shares that Mr. Aiken has the right to purchase as of or within 60 days after May 31, 2011 pursuant to the exercise of stock options and 58,859 shares deliverable to Mr. Aiken pursuant to the Gerber Scientific, Inc. Agreement for Deferment of Director Fees, which we refer to as the “Agreement for Deferment of Director Fees,” or deliverable to Mr. Aiken after he ceases to serve as a Director.
The shares shown as beneficially owned by Mr. Elia include 130,000 shares that Mr. Elia has the right to purchase as of or within 60 days after May 31, 2011 pursuant to the exercise of stock options.
The shares shown as beneficially owned by Mr. Giles include 165,907 shares that Mr. Giles has the right to purchase as of or within 60 days after May 31, 2011 pursuant to the exercise of stock options, but excluding 165,908 shares subject to stock options transferred by Mr. Giles pursuant to his divorce decree, and 65,598 shares of restricted stock that Mr. Giles will be required to transfer pursuant to his divorce decree, but with respect to which he retains voting power.
The shares shown as beneficially owned by Mr. Larson include 48,800 shares that Mr. Larson has the right to purchase as of or within 60 days after May 31, 2011 pursuant to the exercise of stock options.
The shares shown as beneficially owned by Dr. Ledford are deliverable to Dr. Ledford after he ceases to serve as a Director.
The shares shown as beneficially owned by Mr. Lord include 32,914 shares deliverable to Mr. Lord after he ceases to serve as a Director.
The shares shown as beneficially owned by Mr. Mitarotonda include 4,167 shares deliverable to Mr. Mitarotonda after he ceases to serve as a Director and 845,981 shares held by Barington Companies Equity Partners, L.P. over which Mr. Mitarotonda may
72
be deemed to have voting and investment power. Mr. Mitarotonda is the sole stockholder and director of LNA Capital Corp., which is the general partner of Barington Capital Group L.P., the majority member of Barington Companies Investors, LLC. Barington Companies Investors, LLC is the general partner of Barington Companies Equity Partners, L.P. Mr. Mitarotonda disclaims beneficial ownership of the Barington shares except to the extent of his pecuniary interest therein.
The shares shown as beneficially owned by Mr. Perez include 7,917 shares deliverable to Mr. Perez after he ceases to serve as a Director.
The shares shown as beneficially owned by Ms. St. Mark include 3,000 shares that Ms. St. Mark has the right to purchase as of or within 60 days after May 31, 2011 pursuant to the exercise of stock options and 47,687 shares deliverable to Ms. St. Mark pursuant to the Agreement for Deferment of Director Fees or deliverable to her after she ceases to serve as a Director.
The shares shown as beneficially owned by Mr. Vereen include 3,000 shares that Mr. Vereen has the right to purchase as of or within 60 days after May 31, 2011 pursuant to the exercise of stock options, 1,000 shares held of record by a trust for which Mr. Vereen serves as trustee, and 42,428 shares deliverable to Mr. Vereen after he ceases to serve as a Director.
The shares shown as beneficially owned by all Directors and executive officers as a group include a total of 581,573 shares that all Directors and executive officers as a group have the right to purchase as of or within 60 days after May 31, 2011 pursuant to the exercise of stock options and a total of 226,886 shares deliverable to Directors when the Directors cease to serve on the Board.
Equity Compensation Plan Information
The table below provides information relating to Gerber’s equity compensation plans as of April 30, 2011. As of that date, the Gerber Scientific, Inc. 2006 Omnibus Incentive Plan and the Agreement for Deferment of Director Fees were the two equity compensation plans that were in effect pursuant to which Gerber may make future awards. In addition, options to purchase common stock outstanding as of that date under the Gerber Scientific, Inc. 1992 Employee Stock Plan, the Gerber Scientific, Inc. 1992 Non-Employee Director Stock Option Plan and the Gerber Scientific, Inc. 2003 Employee Stock Option Plan. All of the foregoing plans were approved by Gerber’s shareholders.
|
Plan Category
|
Number of Securities
to be Issued Upon the
Exercise of Outstanding
Options, Warrants and
Rights (#)
|
Weighted-Average
Exercise Price of
Outstanding Options,
Warrants and Rights ($)
|
Number of Securities
Remaining Available
for Future Issuance
Under Equity
Compensation Plans
(Excluding Securities
Reflected in
Column(a)) (#)
|
|||||||||
|
(a)
|
(b)
|
(c)
|
||||||||||
|
Equity compensation plans approved by security holders
|
2,187,000 | (1) | 8.28 | 990,426 | (2) | |||||||
|
Equity compensation plans not approved by security holders
|
— | — | — | |||||||||
|
Total
|
2,187,000 | 8.28 | 990,426 | |||||||||
|
(1)
|
Excludes 741,000 shares of restricted stock and restricted stock units outstanding under the Gerber Scientific, Inc. 2006 Omnibus Incentive Plan as of April 30, 2011.
|
|
(2)
|
Represents 990,426 shares of common stock remaining available for issuance pursuant to future awards under the Gerber Scientific, Inc. 2006 Omnibus Incentive Plan. Up to 990,426 of the shares of common stock remaining available for issuance pursuant to future awards under this plan may be issued pursuant to awards other than upon the exercise of an option, warrant or right.
|
73
Director Independence
The Board of Directors affirmatively determined that all of the Directors who served on the Board of Directors for any time during fiscal 2011, other than Marc T. Giles, were “independent” of Gerber within the meaning of rules of the NYSE, on which Gerber’s common stock is listed during the period of their service. The directors who served during fiscal 2011 are the directors identified under Item 10, “Directors, Executive Officers and Corporate Governance,” and Edward G. Jepsen, who, as discussed below, resigned from the Board effective as of December 31, 2010. For a Director to be “independent” under the NYSE rules, the Board must affirmatively determine that the Director has no material relationship with Gerber, either directly or as a partner, shareholder or officer of an organization that has a relationship with Gerber.
Each of the Audit and Finance Committee, the Management Development and Compensation Committee and the Nominating and Corporate Governance Committee is composed solely of Directors meeting the independence requirements of the NYSE rules. For additional information about the composition of these committees, see Item 10, “Directors, Executive Officers and Corporate Governance.”
Transactions with Related Persons
The Board of Directors has vested in the Audit and Finance Committee the responsibility for reviewing and approving Gerber’s transactions in which a Director, nominee for Director, executive officer, greater than 5% shareholder, or an immediate family member of any of the foregoing persons has a direct or indirect material interest, as well as any other material related-party transactions. Transactions involving executive compensation are subject to oversight and approval by the Management Development and Compensation Committee. The Nominating and Corporate Governance Committee is charged with considering questions of possible conflicts of interest of Board members and Gerber’s executive officers.
In reviewing a related-party transaction, the Audit and Finance Committee will, after reviewing all material information regarding the transaction, take into account, among other factors it deems appropriate, whether the transaction is on terms no less favorable than terms generally available to an unaffiliated third party under the same or similar circumstances and the extent of the related person’s interest in the transaction.
On December 31, 2010, a wholly-owned subsidiary of Gerber, which we refer to as the “seller,” sold to Coburn Technologies, Inc., an entity controlled and managed by Edward G. Jepsen, substantially of the seller’s assets, properties, rights and interests primarily or solely related to Gerber Coburn, the seller’s ophthalmic lens unit, for a cash purchase price of $21 million, subject to a post-closing adjustment related to the working capital of the Gerber Coburn unit as of December 31, 2010. Coburn Technologies also assumed specified liabilities of the Gerber Coburn unit. Mr. Jepsen, the chief executive officer and controlling shareholder of Coburn Technologies and a party to the purchase agreement, was formerly a Director of Gerber and most recently a member and chair of Gerber’s Audit and Finance Committee and a member of its Management Development and Compensation Committee. Upon the execution of the purchase agreement, and effective as of December 2, 2010, Mr. Jepsen resigned from the Board of Directors and all committees of the Board of Directors on which he was then serving. Alex F. Incera, a former executive officer of Gerber and President of Gerber Coburn unit advised Gerber that he was a shareholder of Coburn Technologies and will continue to serve in executive capacities with the Gerber Coburn unit following the sale. The purchase price and other terms of the purchase agreement were negotiated on an arms-length basis and determined as part of a six-month competitive bidding sales process for the Gerber Coburn unit that involved discussions by Gerber and its financial advisor with a number of potential strategic and financial buyers. The purchase price was determined through negotiations using standard valuation methodologies for the sale of a business such as the Gerber Coburn unit, including the discounted cash flows valuation methodology.
On December 31, 2010, the seller entered into a transition services agreement with Coburn Technologies pursuant to which the seller will provide Coburn Technologies with post-closing administrative and operating support services for specified fees, except for certain services that will be provided free of charge to Coburn Technologies for 90 days after the closing date. The estimated fair value of the transition services that the seller will provide to Coburn Technologies free of charge is $0.6 million. In addition, on December 31, 2010, Coburn Technologies subleased from the seller a manufacturing and office facility in South Windsor, Connecticut. The sublease has a five-year initial term, with two optional, one-year extensions. Quarterly rental
74
payments of $56,250 will be adjusted based on annual CPI increases (but not decreases) beginning on January 1, 2012, but such increases may not exceed four percent in any year.
The foregoing transactions were approved by both the Audit and Finance Committee and by a transaction committee of the Board of Directors consisting solely of disinterested directors.
The following table sets forth the aggregate fees for services rendered to Gerber by PricewaterhouseCoopers LLP, or “PwC,” Gerber’s independent registered public accounting firm for the 2011 and 2010 fiscal years:
|
2011
|
2010
|
|||||||
|
Audit services
|
$ | 1,666,105 | $ | 1,634,005 | ||||
|
Audit-related services
|
--- | 30,000 | ||||||
|
Tax Fees
|
246,191 | 189,575 | ||||||
|
All Other Fees
|
6,700 | 6,060 | ||||||
|
Total
|
$ | 1,918,996 | $ | 1,859,640 | ||||
The Audit and Finance Committee of the Board of Directors has considered whether the services provided by PwC, other than audit services, were compatible with maintaining PwC’s independence.
Audit Fees. The audit fees shown above were incurred principally for services rendered in connection with the audit of Gerber’s consolidated financial statements and internal control over financial reporting and associated filings with the SEC and other U.S. and foreign regulatory agencies.
Audit-Related Fees. Audit-related fees include fees incurred for assurance and related services that are traditionally performed by independent registered public accounting firms. The audit-related fees shown above for fiscal 2010 were incurred in connection with the filing of a registration statement on Form S-3 with the SEC and certain asset disposition procedures.
Tax Fees. Tax fees include services performed by the tax departments of PwC, except those services related to audits. The tax service fees shown above were incurred in connection with assistance in the preparation of certain of Gerber’s international subsidiary tax returns and corporate tax planning and advisory services.
All Other Fees. All other fees shown above primarily represent licensing fees for the use of proprietary software of PwC.
Pre-Approval Policy
The Audit and Finance Committee pre-approves all audit and permissible non-audit services provided by Gerber’s independent registered public accounting firm. Non-audit services include audit-related, tax and other services.
The Audit and Finance Committee has established a policy that provides for the general pre-approval of specific types of services. Pre-approval under this policy is generally provided for up to one year, is detailed as to the particular services or categories of services that are pre-approved, and specifies fee limits for each service or category of service. The independent registered public accounting firm and management are required to report periodically to the Audit and Finance Committee regarding the services provided by, and fees payable to, the independent registered public accounting firm in accordance with this pre-approval.
During the year, circumstances may arise when it may become necessary to engage the independent registered public accounting firm for additional services not contemplated in the general pre-approval. In those instances, the pre-approval policy requires specific pre-approval of the additional services before such firm is engaged to perform the services. In accordance with the policy, the Audit and Finance Committee has delegated to its Chair the authority to address any requests for pre-approval of services between Committee meetings. The Chair must report any pre-approval decisions to the Audit and Finance Committee at its next scheduled meeting.
75
(a) The following documents are filed as part of this annual report:
|
Page
|
||||
|
1.
|
Financial Statements:
|
|||
|
2.
|
Financial Statement Schedules
|
|||
|
All financial statement schedules are omitted because they are not applicable or the required information is shown in the consolidated financial statements or notes thereto.
|
||||
|
3.
|
Exhibits
Gerber Scientific, Inc. herewith files or incorporates herein the following exhibits:
|
|||
|
Exhibit
Number
|
Exhibit Description
|
|||
|
2.1
|
Asset Purchase Agreement, dated as of December 2, 2010, among Gerber Scientific International, Inc., Coburn Technologies, Inc. and Edward G. Jepsen (incorporated herein by reference to Exhibit 2.1 to Gerber’s Scientific, Inc.’s Current Report on Form 8-K filed on December 2, 2010).
|
|||
|
2.2
|
Agreement and Plan of Merger, dated as of June 10, 2011, among Gerber Scientific, Inc., Vector Knife Holdings (Cayman), Ltd. and Knife Merger Sub, Inc. (incorporated herein by reference to Exhibit 2.1 to Gerber Scientific, Inc.’s Current Report on Form 8-K filed on June 13, 2011).
|
|||
|
3.1
|
Amended and Restated Certificate of Incorporation of Gerber Scientific, Inc. (incorporated herein by reference to Exhibit 3.1 to Gerber's Quarterly Report on Form 10-Q for the fiscal quarter ended October 31, 2004).
|
|||
|
3.2
|
Amended and Restated By-laws of Gerber Scientific, Inc. (incorporated herein by reference to Exhibit 3.2 to Gerber’s Annual Report on Form 10-K for the fiscal year ended April 30, 2010).
|
|||
|
4.1
|
Form of common stock certificate of Gerber Scientific, Inc. (incorporated herein by reference to Exhibit 4.1 to Gerber's Annual Report on Form 10-K for the fiscal year ended April 30, 2007).
|
|||
|
10.1
|
Gerber Scientific, Inc. Non-Employee Director's Stock Grant Plan, as amended and restated as of August 25, 2010 (incorporated herein by reference to Exhibit 10.1 to Gerber's Quarterly Report on Form 10-Q for the fiscal quarter ended October 31, 2010).
|
|||
|
10.2
|
Gerber Scientific, Inc. 1992 Non-Employee Director Stock Option Plan, as amended and restated (incorporated herein by reference to Exhibit 10.2 to Gerber's Annual Report on Form 10-K for the fiscal year ended April 30, 1999).
|
|||
|
10.3
|
Gerber Scientific, Inc. Agreement for Deferment of Director Fees, as amended (incorporated herein by reference to Exhibit 10.1 to Gerber's Current Report on Form 8-K filed on December 2, 2005).
|
|||
|
10.4
|
Gerber Scientific, Inc. 2006 Omnibus Incentive Plan, as amended (incorporated herein by reference to Exhibit 10.1 to Gerber's Form 8-K filed on September 23, 2009).
|
|||
76
|
10.5
|
Form of Indemnification Agreement for Directors (incorporated herein by reference to Exhibit 10.1 to Gerber’s Quarterly Report on Form 10-Q for the fiscal quarter ended July 31, 2009).
|
|
10.6
|
Letter Agreement, dated as of December 7, 2001, between Gerber Scientific, Inc. and Marc T. Giles (incorporated herein by reference to Exhibit 10.6 to Gerber's Quarterly Report on Form 10-Q for the fiscal quarter ended January 31, 2002).
|
|
10.7
|
Letter Agreement, dated as of March 14, 2008, between Gerber Scientific, Inc. and Michael R. Elia (incorporated herein by reference to Exhibit 10.6 to Gerber's Annual Report on Form 10-K for the fiscal year ended April 30, 2008).
|
|
10.8
|
Form of Restricted Stock Agreement under the Gerber Scientific, Inc. 2006 Omnibus Incentive Plan (incorporated herein by reference to Exhibit 99.1 to Gerber's Current Report on Form 8-K filed on November 9, 2006).
|
|
10.9
|
Form of Nonqualified Stock Option Agreement under the Gerber Scientific, Inc. 2006 Omnibus Incentive Plan (incorporated herein by reference to Exhibit 99.2 to Gerber's Current Report on Form 8-K filed on November 9, 2006).
|
|
10.10
|
Form of Restricted Stock Unit Agreement under the Gerber Scientific, Inc. 2006 Omnibus Incentive Plan (incorporated herein by reference to Exhibit 10.2 to Gerber's Quarterly Report on Form 10-Q for the fiscal quarter ended October 31, 2010).
|
|
10.11
|
Letter Agreement, dated as of September 30, 2002, between Gerber Scientific, Inc. and James S. Arthurs (incorporated herein by reference to Exhibit 10.15 of Gerber's Annual Report on Form 10-K for the fiscal year ended April 30, 2003).
|
|
10.13
|
Severance Policy for Senior Officers of Gerber Scientific, Inc. as Amended and Restated Effective September 21, 2006 (incorporated herein by reference to Exhibit 10.12 to Gerber's Annual Report on Form 10-K for the fiscal year ended April 30, 2007).
|
|
10.14
|
Agreement and Lease between Spandex PLC and IM Properties Finance Limited for the sale and leaseback of property in Bristol, United Kingdom (incorporated herein by reference to Exhibit 10.3 to Gerber's Quarterly Report on Form 10-Q for the fiscal quarter ended January 31, 2001).
|
|
10.15
|
Lease Agreement between GERB (CT) QRS 14-73, Inc. and Gerber Scientific, Inc., Gerber Technology, Inc., Gerber Scientific Products, Inc., and Gerber Coburn Optical, Inc. (incorporated herein by reference to Exhibit 10.1 to Gerber's Quarterly Report on Form 10-Q for the fiscal quarter ended July 31, 2001).
|
|
10.18
|
First Amendment to the Gerber Scientific, Inc. and Participating Subsidiaries Supplemental Pension Benefit Plan, as amended and restated effective January 1, 2005 (incorporated herein by reference to Exhibit 10.28 to Gerber’s Annual Report on Form 10-K for the fiscal year ended April 30, 2009).
|
|
10.19
|
Gerber Scientific, Inc. 1992 Employee Stock Plan, as amended and restated (incorporated herein by reference to Exhibit A to Gerber's Proxy Statement on Schedule 14A filed on August 28, 1995).
|
|
10.20
|
Gerber Scientific, Inc. 2003 Employee Stock Option Plan, as amended and restated (incorporated herein by reference to Exhibit 10.17 to Gerber's Annual Report on Form 10-K for the fiscal year ended April 30, 2007).
|
77
|
10.21
|
Description of Arrangements Relating to Travel Compensation for Michael R. Elia and Thomas P. Finn (incorporated herein by reference to Exhibit 10.20 to Gerber’s Annual Report on Form 10-K for the fiscal year ended April 30, 2010).
|
|
10.22
|
Letter Agreement, dated as of September 22, 2003, between Gerber Scientific, Inc. and William V. Grickis, Jr. (incorporated herein by reference to Exhibit 10.3 to Gerber's Quarterly Report on Form 10-Q for the fiscal quarter ended October 31, 2003).
|
|
10.23
|
Letter Agreement, dated as of December 18, 2003, between Gerber Scientific, Inc. and Donald P. Aiken (incorporated herein by reference to Exhibit 10.33 to Gerber's Annual Report on Form 10-K for the fiscal year ended April 30, 2004).
|
|
10.24
|
Form of Nonqualified Stock Option Agreement pursuant to the Gerber Scientific, Inc. 2003 Employee Stock Option Plan (incorporated herein by reference to Exhibit 10.1 to Gerber's Quarterly Report on Form 10-Q for the fiscal quarter ended October 31, 2004).
|
|
10.25
|
Change in Control Agreement, dated October 1, 2005, between Gerber Scientific, Inc. and William V. Grickis, Jr. (incorporated herein by reference to Exhibit 10.3 to Gerber's Quarterly Report on Form 10-Q for the fiscal quarter ended October 31, 2004).
|
|
10.27
|
Amended and Restated Credit and Guaranty Agreement, dated as of March 1, 2011, among Gerber, certain subsidiaries of Gerber, Bank of America, N.A. and HSBC Bank USA, National Association as lenders, Sovereign Bank as lender and documentation agent, and RBS Citizens, N.A. as lender, lead arranger, bookrunner and administrative agent (incorporated herein by reference to Exhibit 10.2 to Gerber’s Quarterly Report on Form 10-Q for the fiscal quarter ended January 31, 2011).
|
|
10.29
|
Letter agreement, dated as of January 22, 2010, between Gerber Scientific, Inc. and Thomas P. Finn (incorporated herein by reference to Exhibit 10.31 to Gerber’s Annual Report on Form 10-K for the fiscal year ended April 30, 2010).
|
|
(b)
|
See Item 15(a) 3. above.
|
|
(c)
|
See Item 15(a) 2. above.
|
78
Management of Gerber Scientific, Inc. (the "Company") is responsible for establishing and maintaining adequate internal control over financial reporting as defined in Exchange Act Rule 13a-15(f). The Company's internal control over financial reporting is a process designed to provide reasonable assurance regarding the reliability of financial reporting and the preparation of financial statements for external purposes in accordance with generally accepted accounting principles in the United States of America. Internal control over financial reporting includes those policies and procedures that (1) pertain to the maintenance of records that, in reasonable detail, accurately and fairly reflect the transactions and dispositions of the assets of the Company; (2) provide reasonable assurance that transactions are recorded as necessary to permit preparation of financial statements in accordance with generally accepted accounting principles in the United States of America and that receipts and expenditures of the Company are being made only in accordance with authorizations of management and directors of the Company; and (3) provide reasonable assurance regarding prevention or timely detection of unauthorized acquisition, use, or disposition of the Company's assets that could have a material effect on the consolidated financial statements.
Because of its inherent limitations, internal control over financial reporting may not prevent or detect misstatements. Also, projections of any evaluation of effectiveness to future periods are subject to the risk that controls may become inadequate because of changes in conditions, or that the degree of compliance with the policies and procedures may deteriorate.
Under the supervision and with the participation of management, including the Company's Chief Executive Officer and Chief Financial Officer, the Company conducted an assessment of the effectiveness of its internal control over financial reporting as of April 30, 2011. In making this assessment, the Company used the criteria established in "Internal Control - Integrated Framework" issued by the Committee of Sponsoring Organizations of the Treadway Commission ("COSO"). Based on this assessment, management concluded that the Company maintained effective internal control over financial reporting as of April 30, 2011 based on the specified criteria.
The effectiveness of the Company's internal control over financial reporting as of April 30, 2011 has been audited by PricewaterhouseCoopers LLP, an independent registered public accounting firm, which has audited the Company's consolidated financial statements included in this Annual Report on Form 10-K, as stated in their attestation report, which is included herein.
/s/ Marc T. Giles /s/ Michael R. Elia
Marc T. Giles Michael R. Elia
President, Chief Executive Officer Executive Vice President, Chief Financial Officer
and Chief Accounting Officer
Dated: June 29, 2011
79
To the Board of Directors and Shareholders of Gerber Scientific, Inc.:
In our opinion, the accompanying consolidated balance sheets and the related consolidated statements of operations, cash flows and changes in shareholders' equity present fairly, in all material respects, the financial position of Gerber Scientific, Inc. and its subsidiaries at April 30, 2011 and April 30, 2010, and the results of their operations and their cash flows for each of the three years in the period ended April 30, 2011 in conformity with accounting principles generally accepted in the United States of America. Also in our opinion, the Company maintained, in all material respects, effective internal control over financial reporting as of April 30, 2011, based on criteria established in Internal Control - Integrated Framework issued by the Committee of Sponsoring Organizations of the Treadway Commission (COSO). The Company's management is responsible for these financial statements and for maintaining effective internal control over financial reporting and for its assessment of the effectiveness of internal control over financial reporting, included in the accompanying Management's Report on Internal Control over Financial Reporting. Our responsibility is to express opinions on these financial statements and on the Company's internal control over financial reporting based on our integrated audits. We conducted our audits in accordance with the standards of the Public Company Accounting Oversight Board (United States). Those standards require that we plan and perform the audits to obtain reasonable assurance about whether the financial statements are free of material misstatement and whether effective internal control over financial reporting was maintained in all material respects. Our audits of the financial statements included examining, on a test basis, evidence supporting the amounts and disclosures in the financial statements, assessing the accounting principles used and significant estimates made by management, and evaluating the overall financial statement presentation. Our audit of internal control over financial reporting included obtaining an understanding of internal control over financial reporting, assessing the risk that a material weakness exists, and testing and evaluating the design and operating effectiveness of internal control based on the assessed risk. Our audits also included performing such other procedures as we considered necessary in the circumstances. We believe that our audits provide a reasonable basis for our opinions.
A company’s internal control over financial reporting is a process designed to provide reasonable assurance regarding the reliability of financial reporting and the preparation of financial statements for external purposes in accordance with generally accepted accounting principles. A company’s internal control over financial reporting includes those policies and procedures that (i) pertain to the maintenance of records that, in reasonable detail, accurately and fairly reflect the transactions and dispositions of the assets of the company; (ii) provide reasonable assurance that transactions are recorded as necessary to permit preparation of financial statements in accordance with generally accepted accounting principles, and that receipts and expenditures of the company are being made only in accordance with authorizations of management and directors of the company; and (iii) provide reasonable assurance regarding prevention or timely detection of unauthorized acquisition, use, or disposition of the company’s assets that could have a material effect on the financial statements.
Because of its inherent limitations, internal control over financial reporting may not prevent or detect misstatements. Also, projections of any evaluation of effectiveness to future periods are subject to the risk that controls may become inadequate because of changes in conditions, or that the degree of compliance with the policies or procedures may deteriorate.
/s/ PricewaterhouseCoopers LLP
Hartford, Connecticut
June 29, 2011
80
Gerber Scientific, Inc.
|
For the Fiscal Years Ended April 30,
|
||||||||||||
|
In thousands of dollars, except per share data
|
2011
|
2010
|
2009
|
|||||||||
|
Revenue:
|
||||||||||||
|
Product sales
|
$
|
404,152
|
$
|
353,986
|
$
|
382,666
|
||||||
|
Service sales
|
58,369
|
58,281
|
62,719
|
|||||||||
|
462,521
|
412,267
|
445,385
|
||||||||||
|
Cost of Sales:
|
||||||||||||
|
Cost of products sold
|
281,664
|
256,950
|
279,162
|
|||||||||
|
Cost of services sold
|
38,094
|
35,016
|
38,542
|
|||||||||
|
319,758
|
291,966
|
317,704
|
||||||||||
|
Gross profit
|
142,763
|
120,301
|
127,681
|
|||||||||
|
Selling, general and administrative expenses
|
116,680
|
100,146
|
108,867
|
|||||||||
|
Research and development
|
16,005
|
14,930
|
17,326
|
|||||||||
|
Restructuring and other expenses
|
8,607
|
3,227
|
1,020
|
|||||||||
|
Goodwill impairment
|
5,928
|
---
|
---
|
|||||||||
|
Operating (loss) income
|
(4,457
|
)
|
1,998
|
468
|
||||||||
|
Other expense, net
|
(155
|
)
|
(719
|
)
|
(2,596
|
)
|
||||||
|
Interest expense
|
(1,798
|
)
|
(2,857
|
)
|
(2,097
|
)
|
||||||
|
Loss from continuing operations before income taxes
|
(6,410
|
)
|
(1,578
|
)
|
(4,225
|
)
|
||||||
|
Income tax expense (benefit)
|
257
|
(656
|
)
|
(5,668
|
)
|
|||||||
|
(Loss) Income from continuing operations, net of taxes
|
(6,667
|
)
|
(922
|
)
|
1,443
|
|||||||
|
(Loss) Income from discontinued operations, net of taxes of $276, $32, and $1,731, respectively
|
(16,949
|
)
|
(536
|
)
|
793
|
|||||||
|
Net (loss) income
|
$
|
(23,616
|
)
|
$
|
(1,458
|
)
|
$
|
2,236
|
||||
|
Basic (Loss) Earnings Per Share of Common Stock:
|
||||||||||||
|
Continuing operations
|
$
|
(0.27
|
)
|
$
|
(0.04
|
)
|
$
|
0.06
|
||||
|
Discontinued operations
|
(0.67
|
)
|
(0.02
|
)
|
0.03
|
|||||||
|
Basic (loss) earnings per common share
|
$
|
(0.94
|
)
|
$
|
(0.06
|
)
|
$
|
0.09
|
||||
|
Diluted (Loss) Earnings Per Share of Common Stock:
|
||||||||||||
|
Continuing operations
|
$
|
(0.27
|
)
|
$
|
(0.04
|
)
|
$
|
0.06
|
||||
|
Discontinued operations
|
(0.67
|
)
|
(0.02
|
)
|
0.03
|
|||||||
|
Diluted (loss) earnings per common share
|
$
|
(0.94
|
)
|
$
|
(0.06
|
)
|
$
|
0.09
|
||||
The accompanying notes are an integral part of these consolidated financial statements.
81
Gerber Scientific, Inc.
|
April 30,
|
||||||||
|
In thousands of dollars and shares
|
2011
|
2010
|
||||||
|
Assets:
|
||||||||
|
Current Assets:
|
||||||||
|
Cash and cash equivalents
|
$
|
10,916
|
$
|
11,305
|
||||
|
Accounts receivable (net of allowance for doubtful accounts of $6,701 and $7,756)
|
78,264
|
80,925
|
||||||
|
Inventories
|
55,294
|
59,823
|
||||||
|
Deferred tax assets, net
|
11,381
|
10,029
|
||||||
|
Asset held for sale
|
6,651
|
---
|
||||||
|
Prepaid expenses and other current assets
|
4,603
|
4,732
|
||||||
|
Total Current Assets
|
167,109
|
166,814
|
||||||
|
Property, plant and equipment, net
|
30,716
|
32,223
|
||||||
|
Goodwill
|
64,583
|
83,654
|
||||||
|
Deferred tax assets, net
|
52,108
|
48,362
|
||||||
|
Other assets
|
18,248
|
20,824
|
||||||
|
Total Assets
|
$
|
332,764
|
$
|
351,877
|
||||
|
Liabilities and Shareholders' Equity:
|
||||||||
|
Current Liabilities:
|
||||||||
|
Accounts payable
|
$
|
32,977
|
$
|
39,185
|
||||
|
Accrued compensation and benefits
|
26,006
|
15,997
|
||||||
|
Other liabilities
|
26,338
|
22,080
|
||||||
|
Deferred revenue
|
13,747
|
13,003
|
||||||
|
Total Current Liabilities
|
99,068
|
90,265
|
||||||
|
Long-term debt
|
21,110
|
45,000
|
||||||
|
Accrued pension benefit liability
|
35,593
|
36,932
|
||||||
|
Deferred tax liabilities, net
|
13,889
|
12,600
|
||||||
|
Other long-term liabilities
|
14,883
|
8,874
|
||||||
|
Commitments and contingencies (Note 18)
|
||||||||
|
Shareholders' Equity:
|
||||||||
|
Preferred stock, $0.01 par value; authorized 10,000 shares; no shares issued
|
---
|
---
|
||||||
|
Common stock, $0.01 par value; authorized 100,000 shares; issued 25,600 and 25,650 shares
|
256
|
257
|
||||||
|
Paid-in capital
|
85,396
|
81,981
|
||||||
|
Retained earnings
|
72,588
|
96,204
|
||||||
|
Treasury stock, 490 and 528 shares, at cost
|
(10,084
|
)
|
(10,855
|
)
|
||||
|
Accumulated other comprehensive income (loss)
|
65
|
(9,381
|
)
|
|||||
|
Total Shareholders' Equity
|
148,221
|
158,206
|
||||||
|
Total Liabilities and Shareholders' Equity
|
$
|
332,764
|
$
|
351,877
|
||||
The accompanying notes are an integral part of these consolidated financial statements.
82
Gerber Scientific, Inc.
|
For the Fiscal Years Ended April 30,
|
||||||||||||
|
In thousands of dollars
|
2011
|
2010
|
2009
|
|||||||||
|
Cash flows from operating activities:
|
||||||||||||
|
Net (loss) income
|
$
|
(23,616
|
)
|
$
|
(1,458
|
)
|
$
|
2,236
|
||||
|
Adjustments to reconcile net (loss) income to cash provided by operating activities:
|
||||||||||||
|
Depreciation and amortization
|
7,673
|
9,452
|
9,991
|
|||||||||
|
Deferred income taxes
|
(4,947
|
)
|
(3,210
|
)
|
(5,953
|
)
|
||||||
|
Goodwill impairment charges
|
22,816
|
---
|
---
|
|||||||||
|
Other-than-temporary impairment charge
|
---
|
---
|
2,290
|
|||||||||
|
Stock-based compensation
|
4,052
|
3,787
|
3,241
|
|||||||||
|
Loss (Gain) on sale of assets
|
344
|
2,464
|
(622
|
)
|
||||||||
|
Other noncash items
|
4,291
|
2,177
|
2,220
|
|||||||||
|
Changes in operating accounts, excluding effects of acquisitions and dispositions:
|
||||||||||||
|
Accounts receivable
|
484
|
5,126
|
25,795
|
|||||||||
|
Inventories
|
(2,645
|
)
|
5,996
|
5,820
|
||||||||
|
Prepaid expenses and other assets
|
225
|
71
|
79
|
|||||||||
|
Accounts payable and other accrued liabilities
|
(2,474
|
)
|
706
|
(27,424
|
)
|
|||||||
|
Accrued compensation and benefits
|
8,493
|
(15
|
)
|
(7,899
|
)
|
|||||||
|
Net cash provided by operating activities
|
14,696
|
25,096
|
9,774
|
|||||||||
|
Cash flows from investing activities:
|
||||||||||||
|
Capital expenditures
|
(5,384
|
)
|
(4,489
|
)
|
(8,187
|
)
|
||||||
|
Proceeds from sale of available for sale investments
|
1,157
|
464
|
705
|
|||||||||
|
Purchases of available for sale investments
|
(722
|
)
|
(308
|
)
|
(457
|
)
|
||||||
|
Proceeds from sale of net assets
|
18,928
|
13,709
|
2,622
|
|||||||||
|
Business acquisitions
|
---
|
(3,473
|
)
|
(34,273
|
)
|
|||||||
|
Investments in intangible assets
|
(331
|
)
|
(1,368
|
)
|
(828
|
)
|
||||||
|
Net cash provided by (used for) investing activities
|
13,648
|
4,535
|
(40,418
|
)
|
||||||||
|
Cash flows from financing activities:
|
||||||||||||
|
Debt repayments
|
(133,573
|
)
|
(117,176
|
)
|
(80,271
|
)
|
||||||
|
Debt proceeds
|
109,025
|
89,525
|
110,686
|
|||||||||
|
Debt issuance costs
|
(989
|
)
|
(494
|
)
|
(1,174
|
)
|
||||||
|
Common stock activities
|
(357
|
)
|
(486
|
)
|
898
|
|||||||
|
Other financing activities
|
(982
|
)
|
(341
|
)
|
---
|
|||||||
|
Net cash (used for) provided by financing activities
|
(26,876
|
)
|
(28,972
|
)
|
30,139
|
|||||||
|
Effect of exchange rate changes on cash
|
(1,857
|
)
|
333
|
(3,074
|
)
|
|||||||
|
(Decrease) Increase in cash and cash equivalents
|
(389
|
)
|
992
|
(3,579
|
)
|
|||||||
|
Cash and cash equivalents at beginning of year
|
11,305
|
10,313
|
13,892
|
|||||||||
|
Cash and cash equivalents at end of year
|
$
|
10,916
|
$
|
11,305
|
$
|
10,313
|
||||||
|
Supplemental Schedule of Cash Flow Information
|
||||||||||||
|
Cash paid during the year for:
|
||||||||||||
|
Interest
|
$
|
1,961
|
$
|
3,475
|
$
|
2,856
|
||||||
|
Income taxes, net of refunds
|
$
|
4,551
|
$
|
4,517
|
$
|
4,456
|
||||||
The accompanying notes are an integral part of these consolidated financial statements.
83
Gerber Scientific, Inc.
|
In thousands of dollars and shares
|
Issued
Common
Stock
Shares
|
Common
Stock
|
Paid-in
Capital
|
Retained
Earnings
|
Treasury
Stock
|
Accum.
Other Comp.
Income (Loss)
|
Total
|
|||||||||||||||||||||
|
Balance as of April 30, 2008
|
24,300
|
$
|
243
|
$
|
75,472
|
$
|
95,426
|
$
|
(12,148
|
)
|
$
|
10,570
|
$
|
169,563
|
||||||||||||||
|
Net income
|
--
|
--
|
--
|
2,236
|
--
|
--
|
2,236
|
|||||||||||||||||||||
|
Currency translation adjustments
|
--
|
--
|
--
|
--
|
--
|
(25,709
|
)
|
(25,709
|
)
|
|||||||||||||||||||
|
Unrealized gain on securities, net of reclassification adjustment of $2,423 and tax of $341
|
--
|
--
|
--
|
--
|
--
|
574
|
574
|
|||||||||||||||||||||
|
Change in pension plans, net of tax of $1,172
|
--
|
--
|
--
|
--
|
--
|
(1,973
|
)
|
(1,973
|
)
|
|||||||||||||||||||
|
Change in derivative instruments, net of tax of $440
|
--
|
--
|
--
|
--
|
--
|
(741
|
)
|
(741
|
)
|
|||||||||||||||||||
|
Comprehensive loss
|
(25,613
|
)
|
||||||||||||||||||||||||||
|
Stock issued to Directors
|
--
|
--
|
(407
|
)
|
--
|
617
|
--
|
210
|
||||||||||||||||||||
|
Stock issued under employee plans, net
|
131
|
1
|
900
|
--
|
--
|
--
|
901
|
|||||||||||||||||||||
|
Stock based compensation expense
|
--
|
--
|
2,032
|
--
|
--
|
--
|
2,032
|
|||||||||||||||||||||
|
Restricted stock grants and cancellations, net of amortization
|
743
|
8
|
1,201
|
--
|
--
|
--
|
1,209
|
|||||||||||||||||||||
|
Balance as of April 30, 2009
|
25,174
|
$
|
252
|
$
|
79,198
|
$
|
97,662
|
$
|
(11,531
|
)
|
$
|
(17,279
|
)
|
$
|
148,302
|
|||||||||||||
|
Net loss
|
--
|
--
|
--
|
(1,458
|
)
|
--
|
--
|
(1,458
|
)
|
|||||||||||||||||||
|
Currency translation adjustments
|
--
|
--
|
--
|
--
|
--
|
10,453
|
10,453
|
|||||||||||||||||||||
|
Unrealized gain on securities, net of reclassification adjustment of $64 and tax of $350
|
--
|
--
|
--
|
--
|
--
|
590
|
590
|
|||||||||||||||||||||
|
Change in pension plans, net of tax of $(2,128)
|
--
|
--
|
--
|
--
|
--
|
(3,585
|
)
|
(3,585
|
)
|
|||||||||||||||||||
|
Change in derivative instruments, net of tax of $262
|
--
|
--
|
--
|
--
|
--
|
440
|
440
|
|||||||||||||||||||||
|
Comprehensive income
|
6,440
|
|||||||||||||||||||||||||||
|
Stock issued to Directors
|
--
|
--
|
(512
|
)
|
--
|
676
|
--
|
164
|
||||||||||||||||||||
|
Shares withheld for employee taxes, net
|
(74
|
)
|
(1
|
)
|
(485
|
)
|
--
|
--
|
--
|
(486
|
)
|
|||||||||||||||||
|
Stock based compensation expense
|
--
|
--
|
1,557
|
--
|
--
|
--
|
1,557
|
|||||||||||||||||||||
|
Restricted stock grants and cancellations, net of amortization
|
550
|
6
|
2,223
|
--
|
--
|
--
|
2,229
|
|||||||||||||||||||||
|
Balance as of April 30, 2010
|
25,650
|
$
|
257
|
$
|
81,981
|
$
|
96,204
|
$
|
(10,855
|
)
|
$
|
(9,381
|
)
|
$
|
158,206
|
|||||||||||||
|
Net loss
|
--
|
--
|
--
|
(23,616
|
)
|
--
|
--
|
(23,616
|
)
|
|||||||||||||||||||
|
Currency translation adjustments
|
--
|
--
|
--
|
--
|
--
|
8,238
|
8,238
|
|||||||||||||||||||||
|
Unrealized gain on securities, net reclassification adjustment of $161 and tax of $77
|
--
|
--
|
--
|
--
|
--
|
130
|
130
|
|||||||||||||||||||||
|
Change in pension plans, net of tax of $493
|
--
|
--
|
--
|
--
|
--
|
831
|
831
|
|||||||||||||||||||||
|
Change in derivative instruments, net of tax of $178
|
--
|
--
|
--
|
--
|
--
|
301
|
301
|
|||||||||||||||||||||
|
Currency translation impact of debt designated as hedge, net of tax of $(32)
|
--
|
--
|
--
|
--
|
--
|
(54
|
)
|
(54
|
)
|
|||||||||||||||||||
|
Comprehensive loss
|
(14,170
|
)
|
||||||||||||||||||||||||||
|
Stock issued to Directors
|
--
|
--
|
(503
|
)
|
--
|
771
|
--
|
268
|
||||||||||||||||||||
|
Shares withheld for employee taxes, net
|
(18
|
)
|
--
|
(357
|
)
|
--
|
--
|
--
|
(357
|
)
|
||||||||||||||||||
|
Stock based compensation expense
|
--
|
--
|
1,296
|
--
|
--
|
--
|
1,296
|
|||||||||||||||||||||
|
Restricted stock grants and cancellations, net of amortization
|
(32
|
)
|
(1
|
)
|
2,979
|
--
|
--
|
--
|
2,978
|
|||||||||||||||||||
|
Balance as of April 30, 2011
|
25,600
|
$
|
256
|
$
|
85,396
|
$
|
72,588
|
$
|
(10,084
|
)
|
$
|
65
|
$
|
148,221
|
||||||||||||||
The accompanying notes are an integral part of these consolidated financial statements.
84
Gerber Scientific, Inc.
Note 1. Summary of Significant Accounting Policies
The preparation of the consolidated financial statements of Gerber Scientific, Inc. (“Gerber” and together with Gerber’s consolidated subsidiaries, the "Company") in conformity with accounting principles generally accepted in the United States of America requires management to make estimates and assumptions that affect the amounts reported in the consolidated financial statements and the related disclosures. Actual results could differ from those estimates.
Principles of consolidation – The consolidated financial statements include the accounts of Gerber and its subsidiaries. All significant intercompany accounts and transactions have been eliminated.
On December 31, 2010, the Company completed the sale of substantially all of the assets, properties, rights and interests primarily or solely related to the Ophthalmic Lens Processing segment, Gerber Coburn (the “Gerber Coburn Unit”). The loss on sale and results of operations for the Gerber Coburn Unit have been reported as discontinued operations for the fiscal years ended April 30, 2011, 2010 and 2009, respectively, within the accompanying Consolidated Statements of Operations. The April 30, 2010 comparative Consolidated Balance Sheet and the Consolidated Statements of Cash Flows for the fiscal years ended April 30, 2010 and 2009, and related disclosures do not reflect assets held for sale, as the criteria for assets held for sale were not met until fiscal 2011. The Company completed the sale of 100 percent of the capital stock of its wholly-owned subsidiary, FOBA Technology + Services GmbH (“FOBA”), on September 1, 2009. FOBA was acquired as part of the acquisition of Virtek Vision International, Inc. referred to below in this Note 1. The results of FOBA’s operations were previously reported within the Apparel and Industrial segment. The Company completed the sale of substantially all of the assets and liabilities of ND Graphics, a Canadian business unit of Gerber Scientific Products within the Sign Making and Specialty Graphics segment, to a group of investors led by the President of ND Graphics on September 30, 2009. The Company closed the majority of its Spandex Poland, Spandex New Zealand and Gerber Coburn Australia operations during the fiscal year ended April 30, 2010. The results of operations for these businesses have been reported as discontinued operations for the fiscal years ended April 30, 2011, 2010 and 2009 within the consolidated financial statements. See Note 19.
The results of operations and cash flows for Yunique Solutions, Inc. (“Yunique,”) are included from the date of acquisition on November 25, 2009 through April 30, 2010 and April 30, 2011 in the accompanying Consolidated Statements of Operations, Consolidated Statements of Cash Flows and Consolidated Statements of Changes in Shareholders' Equity. The results of operations and cash flows for two companies that were acquired during the fiscal year ended April 30, 2009, Virtek Vision International, Inc. ("Virtek") and Gamma Computer Tech Company, Ltd. ("Gamma"), are included from the dates of acquisition through April 30, 2009, April 30, 2010 and April 30, 2011 in the accompanying Consolidated Statements of Operations, Consolidated Statements of Cash Flows and Consolidated Statements of Changes in Shareholders' Equity. See Note 5.
Cash and cash equivalents – Cash and cash equivalents include cash on hand, demand deposits and short-term cash investments that are highly liquid in nature and have original maturities of three months or less.
Concentrations of credit risk – Financial instruments that potentially subject the Company to concentrations of credit risk consist principally of cash and cash equivalents, trade accounts receivable and investments. The Company places its cash and cash equivalents in instruments held at high-quality financial institutions. Concentrations of credit risk with respect to trade accounts receivable are limited by the large number of customers comprising the Company's customer base and their dispersion across many different industries and geographies. Approximately 74 percent of the Company's revenue in the fiscal year ended April 30, 2011 was generated by the Company's international operations, including United States export sales. The Company evaluates customer creditworthiness prior to extending credit and, in some instances, requires letters of credit to support customer obligations. No individual customer accounted for more than 10 percent of consolidated revenue in any of the fiscal years ended April 30, 2011, 2010 or 2009. The Company's investments are held in a mutual fund that is traded on the open market.
Inventories – Inventories are stated at the lower of cost or market value, cost being determined primarily using the first-in, first-out (FIFO) cost method. Inventories held at the Company's Apparel and Industrial segment’s international non-manufacturing companies are valued on a weighted-average basis.
Property, plant and equipment – Property, plant and equipment are stated at cost. Major improvements and betterments to
85
existing plant and equipment are capitalized. Expenditures for maintenance and repairs are charged to expense as incurred. The cost and related accumulated depreciation of assets sold or otherwise disposed of are removed from the accounts and any gain or loss is included in the Consolidated Statements of Operations.
Depreciation expense is recorded on a straight-line basis over the assets' useful lives. Estimated useful lives are up to 50 years for buildings and 3 to 10 years for machinery, tools and other equipment. Leasehold improvements are amortized over the remaining minimum lease term or estimated useful life of the asset, whichever is shorter.
Direct development costs associated with internal-use software are capitalized within property, plant and equipment as construction in progress until ready for use and then transferred to machinery, tools and other equipment and amortized over the estimated useful life of the resulting software. Such software is typically amortized on a straight-line basis over a period that does not exceed 7 years for the Company's enterprise resource planning system and 3 years for all other software, beginning when the asset is substantially ready for use, as this is considered to approximate the usage pattern of the software. As of April 30, 2011, the Company had no costs capitalized associated with direct development costs for internal-use software in construction in progress. As of April 30, 2010, the Company had capitalized $0.4 million in construction in progress. The Company has recognized $0.6 million in amortization expense related to capitalized direct development costs in the fiscal year ended April 30, 2011, $0.4 million in the fiscal year ended April 30, 2010 and none in the fiscal year ended April 30, 2009.
Costs incurred for the development of software that will be sold, leased or otherwise marketed are capitalized from the point at which technological feasibility has been established. These costs are included within property, plant and equipment as construction in progress until the product is available for general release, at which point the asset is transferred to machinery, tools and other equipment and amortized over the estimated useful life of the resulting software. The Company amortizes capitalized software using the ratio of the product's gross revenue to the current and forecast gross revenue. Costs capitalized include direct labor and related overhead costs as well as external costs. Costs incurred prior to the establishment of technological feasibility and after general release are expensed as incurred. As of April 30, 2011 and 2010, the Company had capitalized $4.9 million and $3.2 million, respectively, in construction in progress. The Company has not yet recognized any amortization expense related to these capitalized costs and expects to begin amortizing these projects as they are finalized in the fiscal year ending April 30, 2012.
Goodwill and other intangible assets – The Company reviews the value of goodwill for impairment annually during its fourth fiscal quarter, or sooner if a triggering event has occurred that indicates that the carrying amount of the assets may not be fully recoverable. The identification and measurement of goodwill impairment involves subjective estimation of the fair value of reporting units, using substantial estimates and assumptions that could affect whether an impairment charge is recognized and the amount thereof. To assess goodwill for impairment, internal valuation analyses are performed. Estimates of fair value are primarily determined using discounted cash flow analysis, which uses estimates and assumptions, including projected cash flows of future sales, new product launches and expense levels, discount rate assumptions and perpetual growth rates. Third-party evidence of fair value is also factored in when available.
Intangible assets that have finite useful lives are amortized on a straight-line basis over their estimated useful lives. In addition, these assets are reviewed for potential impairment whenever a triggering event has occurred that indicates the carrying values may not be fully recoverable.
Valuation of long-lived assets – The Company evaluates the recoverability of long-lived assets, or asset groups, whenever events or changes in circumstances indicate that carrying amounts may not be fully recoverable. Should such evaluations indicate that the related future undiscounted cash flows are not sufficient to recover the carrying values of the assets, such carrying values would be reduced to fair value and this adjusted value would become the assets' new cost basis.
Income taxes – The Company recognizes deferred tax assets and liabilities using enacted tax rates for the effect of temporary differences between the book and tax basis of recorded assets and liabilities. Deferred tax assets are required to be reduced by a valuation allowance if it is more likely than not that some portion or all of the deferred tax asset will not be realized. Tax positions are recognized in the financial statements when it is more likely than not the position will be sustained upon examination by the tax authorities. Such tax positions are initially and subsequently measured as the largest amount of tax benefit that is greater than 50 percent likely of being realized upon ultimate settlement assuming the tax authority has full knowledge of the position and all relevant facts.
Warranty – A limited standard warranty is provided on certain of the Company's products for periods ranging from 90 days to
86
one year and allowances for estimated warranty costs are recorded during the period of sale. The determination of such allowances requires management to make estimates of expected costs to repair and replace products under warranty. If actual return rates or repair and replacement costs differ significantly from management's estimates, adjustments to recognize additional expense may be required. Extended warranties are recorded as deferred revenue and recognized over the extended warranty contract period on a straight-line basis and the related costs are expensed as incurred.
Pension obligations – The overfunded or underfunded status of pension plans is recognized on the balance sheet. Actuarial losses, net of tax effects, are recognized in Accumulated Other Comprehensive Income (Loss) in Shareholders' Equity until they are amortized as a component of net periodic benefit cost.
Revenue recognition – product sales. Product sales consist primarily of equipment, including installation, training and extended warranty, as well as aftermarket supplies and software sales. Equipment sales are to the sign making and specialty graphics and apparel and industrial industries. Aftermarket supplies include spare parts and consumable materials needed by customers to maintain and use the Company's equipment. Software product sales consist of software products and licenses. The Company also licenses certain intellectual property and recognizes revenue when the earnings process is complete, which is typically upon inception of the license term, as the Company has no further involvement or performance obligations under the license.
The Company recognizes revenue on product sales when it is realized or realizable and earned, which occurs when the following criteria are met:
|
·
|
persuasive evidence of an arrangement exists;
|
|
·
|
delivery has occurred or services have been rendered;
|
|
·
|
the price is fixed or determinable; and
|
|
·
|
collectability is reasonably assured.
|
The Company recognizes revenue on product sales at the time of shipment, which is when title and the risks and rewards of ownership of the product transfer to the Company's customers and all of the above revenue recognition criteria are considered to have been met. If any of these criteria are not met at shipment, which is infrequent, revenue recognition is deferred until such time as all required conditions of revenue recognition above have been completed.
Certain equipment sales may provide a payment plan that allows for the final payment to be due upon installation of the equipment. The Company recognizes revenue when it meets the criteria outlined above, including that collectability is reasonably assured. These conditions are met at the time of shipment. Additionally, in very limited circumstances, certain equipment sales may provide for customer acceptance provisions that include incremental measures or product performance criteria. These provisions are evaluated on a case by case basis. To the extent these provisions are deemed to be substantive, the Company defers revenue until acceptance has occurred and all other criteria outlined above are met. Instances of equipment returns are infrequent and can be reasonably and reliably estimated.
The Company's software products are "off-the-shelf" and do not require modification or customization by the Company. Software license revenue is recognized upon shipment using the same revenue recognition criteria above, but collectability must be probable rather than reasonably assured on software and software-related deliverables in order to recognize revenue.
Revenue on extended warranty contracts is recognized on a straight-line basis over the contractual period.
Service sales – Service sales are derived primarily from separately priced maintenance contracts on the Company's equipment sales, software subscriptions and labor and parts sold through the service channel. Revenue on these items is recognized when the price is fixed or determinable, persuasive evidence of an arrangement exists, the service is performed and collectability of the resulting receivable is reasonably assured. Service revenue is recognized on a straight-line basis over the contractual period or when services are performed.
Sales with multiple elements – The Company's equipment and software is sometimes sold with a combination of other elements that include installation, training, and service agreements. The installation and training elements are routine in nature and the average length of time between shipment of the equipment and completion of the installation and/or training typically is within two months, depending on the equipment type. Service agreement terms typically range from six months to sixty
87
months. Instances of equipment returns because the Company could not complete installation and training are infrequent and the contracts do not specify a refund amount if the equipment is not successfully installed.
In October 2009, the Financial Accounting Standards Board (“FASB”) issued Accounting Standards Update (“ASU”) 2009-13, Multiple-Deliverable Revenue Arrangements (“ASU 2009-13”). ASU 2009-13 amends the accounting and reporting guidance for arrangements including multiple revenue-generating activities. ASU 2009-13 amends the criteria for separating deliverables and measuring and allocating arrangement consideration to one or more units of accounting. The amendment also establishes a selling price hierarchy for determining the selling price of a deliverable. Significantly enhanced disclosures will also be required to provide information about the Company’s multiple-deliverable revenue arrangements, including information about the nature and terms, significant deliverables, and performance within arrangements. ASU 2009-13 also requires information to be provided about significant judgments made, changes to those judgments and how the application of the relative selling-price method affects the timing or amount of revenue recognition.
In October 2009, the FASB issued ASU 2009-14, Certain Revenue Arrangements That Include Software Elements (“ASU 2009-14”). ASU 2009-14 changes the accounting model for revenue arrangements that include both tangible products and software elements that are “essential to the functionality,” and removes these products from current software revenue guidance. The new guidance will include factors to help companies determine what software elements are considered “essential to the functionality.” ASU 2009-14 subjects software-enabled products to other revenue guidance and disclosure requirements, such as guidance relating to revenue arrangements with multiple-deliverables.
The Company adopted these provisions during its fourth quarter ended April 30, 2011 as of May 1, 2010 using the prospective adoption methodology. The adoption of this guidance did not have a material impact on the Company’s consolidated financial statements as similar amounts of revenue are being recognized and deferred, consistent with historical accounting methodologies. More specifically, equipment fair value determined using the best estimate of selling price at the time of shipment approximates the amount of consideration that was allocated to equipment using the historical residual method. As a result, in terms of the timing and pattern of revenue recognition, the new accounting guidance for revenue recognition is not expected to have a significant effect on revenues in periods after the initial adoption.
In situations where there are multiple elements, the Company determines the selling price for each element in the arrangement using a hierarchy based first on vendor-specified objective evidence (“VSOE”), second on third-party evidence and if the Company is unable to establish VSOE or third-party evidence, the selling price of each element is determined using the Company’s best estimate of selling price. The Company allocates the arrangement consideration across the multiple elements using the relative selling price method.
The Company recognizes revenue for equipment using the relative selling price established based on the Company’s best estimate of selling price at the time of shipment. The best estimate of selling price is determined by equipment only sales and other product sales comparisons. Revenue is recognized upon shipment for equipment. Revenue associated with each of the potentially undelivered elements (installation, training and/or service) is calculated at relative selling price based on VSOE, deferred and recorded when the services are performed. VSOE is determined using the following inputs and key assumptions:
|
·
|
Installation. Key inputs include installation-only orders, as well as the average time to complete installation for all equipment sales.
|
|
·
|
Training. Fair value is determined using the sales price for training-only orders.
|
|
·
|
Service. Service contact revenue is recorded at fair value, based on separately priced contracts and stand-alone service orders.
|
Arrangements for software and software-related elements of an arrangement are accounted for in accordance with the above guidance related to multiple element arrangements. If VSOE of fair value does not exist for the undelivered elements, revenue is deferred until evidence exists, all elements are delivered, or VSOE exists for all undelivered elements and revenue is recognized using the residual method whereby the difference between the total arrangement fee and the amount deferred is recognized as revenue related to the delivered elements.
Return policy – The Company has no obligation to accept the return of products sold other than for repair or replacement of defective products, which must be authorized in advance.
Distribution – The Company's Apparel and Industrial segment's sales are primarily made through its domestic and international in-house direct distribution and service network. Independent agents and third-party distributors are used in certain foreign
88
countries. The Sign Making and Specialty Graphics segment's sales are made through both third-party distributors and the Company's wholly-owned subsidiary, Spandex. The Company's sales of third-party purchased products are recorded on a gross revenue basis, as the Company is the primary obligor in these transactions, bears general inventory and credit risks and sets the pricing terms with its customers.
The Company's sales to distributors are not contingent on resale by the distributor to the end-user customer and the Company has no obligation to repurchase distributor inventory.
Discounts – Sales discounts are negotiated with customers prior to billing and sales invoices are prepared net of negotiated sales discounts at the time of billing. These discounts are reflected as a reduction in revenue.
Rebates – In the Sign Making and Specialty Graphics segment, the Company offers volume rebates entitling customers to receive refunds or reductions of prior purchase prices in certain instances. When rebates are offered, a liability is recorded based on estimated amounts of customer purchases at the later of the date that the revenue was recognized or the incentive was offered. The reduction in, or refund of, the selling price from a sales incentive is classified as a reduction of product sales.
Recourse obligations – The Company, in connection with certain product sales, may provide assistance to its customers in obtaining lease financing from the third-party financial services institution. These sales have been determined to be direct sales to the third-party financial services institution. These arrangements may contain recourse provisions, under which the Company is liable to the third-party financial services institution in the event of default by the lessee. These leases typically have terms ranging from two to six years. The Company records an estimated recourse liability based upon its historical experience and current economic factors.
Shipping and handling fees and costs – The Company includes shipping and handling fees billed to customers in product sales. Shipping and handling costs associated with inbound and outbound freight are included in cost of products sold.
Sales, use and value-added taxes – The Company records sales, use and value-added taxes on a net basis.
Research and development – Research and development costs are charged to expense as incurred, except for development costs that are capitalized for software projects that have demonstrated technological feasibility. Research and development costs that are expensed are primarily comprised of development personnel salaries, prototype material costs and testing and trials of new products.
Earnings per share – Basic earnings per common share are equal to net income divided by the weighted-average number of common shares outstanding during the period. Diluted earnings per common share are equal to net income divided by the weighted-average number of common shares outstanding during the period, including the effect of stock-based compensation awards, if such effect is dilutive.
Stock options and share grants – The Company measures stock-based compensation cost at the grant date of the award, based on the calculated fair value of the award, and expenses the fair value using the straight-line method over the employee's requisite service period (generally the vesting period of the equity grant).
In each of the fiscal years ended April 30, 2011, 2010 and 2009, the Company did not recognize windfall tax benefits from direct awards in the amount of $0.2 million, because the benefit did not reduce income taxes payable in the current year utilizing the with-and-without approach to intra-period tax allocation. When and if the Company is able to realize a benefit, an adjustment will be made to paid-in capital.
Foreign currency translation – Assets and liabilities of foreign subsidiaries are translated to the reporting currency of the Company, which is the United States dollar, at exchange rates prevailing at the balance sheet date. Translation adjustments and gains and losses on intercompany foreign currency balances of a long-term investment nature, as designated by management, are deferred and accumulated as a separate component of Shareholders' Equity. Revenue and expenses are translated at average exchange rates prevailing during the year. Transaction gains and losses are included in the Consolidated Statement of Operations. Foreign currency transaction gains (losses) included in Other expense, net were $(0.2) million for the fiscal year ended April 30, 2011, not significant for the fiscal year ended April 30, 2010 and $0.3 million for the fiscal year ended April 30, 2009.
89
Hedging activity – The Company uses derivative instruments, including interest rate swaps and forward contracts, to manage certain interest rate and foreign currency exposures. Derivative instruments are viewed as risk management tools and are not used for trading or speculative purposes. Derivatives used for hedging purposes may be designated and effective as a hedge of the identified risk exposure at the inception of the contract.
All derivative instruments are recorded on the balance sheet at fair value. Derivatives used to hedge forecasted cash flows associated with foreign currency commitments or forecasted interest payments may be accounted for as cash flow hedges, as deemed appropriate. Gains and losses on derivatives designated as cash flow hedges are recorded in other comprehensive income and reclassified to earnings in a manner that matches the timing of the earnings impact of the hedged transactions. The ineffective portion of all hedges, if any, is recognized currently in earnings.
Investments – The Company's investments are comprised of mutual funds held in a rabbi trust that are directed by the Company to be used to fund benefit payments under the Company's nonqualified supplemental pension plan. The mutual fund portfolio primarily consists of common stocks, fixed income securities and money market instruments. These investments are held in the custody of a major financial services institution. Realized gains and losses are reclassified from Accumulated other comprehensive income (loss) into the Consolidated Statements of Operations using the specific identification cost method. As of April 30, 2011 and 2010, the Company's investments were classified as available for sale. These investments are recorded in the Consolidated Balance Sheets at fair value and are included in Other assets. Unrealized holding gains and losses are recorded within Accumulated other comprehensive income (loss) within Shareholders' Equity, net of tax. Losses resulting from other-than-temporary impairments are recorded within Other expense, net on the Consolidated Statements of Operations. The Company monitors its investment portfolio for impairment on an ongoing basis. The fair value of investments is determined using quoted market prices for those securities. See Notes 7 and 16.
Asset retirement obligations – Asset retirement obligations are recognized for legal obligations associated with the retirement of tangible long-lived assets that have contingent timing or settlement based upon a future event. The fair value of a liability for a conditional asset retirement obligation is recognized in the period in which it occurred if a reasonable estimate of fair value can be made. The Company has determined that conditional legal obligations exist for certain of its worldwide owned and leased facilities related primarily to leasehold improvements. The liability for asset retirement obligations was $0.7 million as of April 30, 2011 and 2010. The Company settled $0.1 million of obligations during the fiscal year ended April 30, 2011 associated with lease terminations, which was offset by $0.1 million of accretion.
Deferred financing costs – The Company amortizes capitalized financing costs over the life of the associated debt using the effective interest method. The unamortized amounts are included in Other assets on the Consolidated Balance Sheets.
Legal fees – Legal costs expected to be incurred that are associated with a loss contingency are expensed as incurred.
Reclassifications - Certain reclassifications have been made to conform to the presentation for the fiscal year ended April 30, 2011. During the fiscal year ended April 30, 2011, management realigned the Gerber Innovations (“GI”) business under the Apparel and Industrial segment and reclassified all segment reporting of GI from the Gerber Scientific Products (“GSP”) business unit of the Sign Making and Specialty Graphics segment to the Apparel and Industrial segment (see Note 17). Additionally, United States defined benefit pension expenses were reclassified from Cost of products sold, Cost of services sold, and Research and development to Selling, general and administrative expenses and professional fees related to business process improvement initiatives and strategic transactional fees were reclassified from Selling, general and administrative expenses to Restructuring and other expenses.
New accounting pronouncements - In June 2011, the FASB issued Accounting Standards Update 2011-05, Comprehensive Income (“ASU 2011-05”). ASU 2011-05 requires that all nonowner changes in stockholders’ equity be presented either in a single continuous statement of comprehensive income or in two separate but consecutive statements. In the two-statement approach, the first statement should present total net income and its components followed consecutively by a second statement that should present total other comprehensive income, the components of other comprehensive income, and the total of comprehensive income. The adoption of ASU 2011-05 is effective for fiscal years beginning after December 15, 2011 and is therefore effective for the Company in fiscal 2013 beginning May 1, 2012. The Company is currently evaluating the impact of ASU 2011-05 on its financial statement presentation of comprehensive income.
90
Note 2. Accounts Receivable
The Company sells products and services to customers in a variety of industries and geographic areas and continually monitors customer creditworthiness and payments from its customers. The Company requires, in some instances, bank letters of credit to support customer obligations. Allowances for doubtful accounts are maintained for estimated losses resulting from the customers' inability to make required payments. When evaluating the adequacy of its allowance for doubtful accounts, the Company considers various factors, including accounts receivable agings, customer credit worthiness, existing economic conditions and historical bad debt experience.
The allowance for doubtful accounts rollforward for the three fiscal years in the period ended April 30, 2011 was as follows:
|
In thousands
|
Balance at Beginning
of Fiscal Year
|
Charges to Costs
and Expenses1
|
Deductions2
|
Impact of Business Dispositions
|
Balance at End
of Fiscal Year
|
|||||||||||||||
|
Fiscal 2011
|
$
|
7,756
|
$
|
2,611
|
$
|
(2,579
|
)
|
$
|
(1,087
|
)
|
$
|
6,701
|
||||||||
|
Fiscal 2010
|
$
|
6,741
|
$
|
4,305
|
$
|
(3,233
|
)
|
$
|
(57
|
)
|
$
|
7,756
|
||||||||
|
Fiscal 2009
|
$
|
6,384
|
$
|
2,733
|
$
|
(2,376
|
)
|
$
|
---
|
$
|
6,741
|
|||||||||
1 Includes bad debt expense and foreign currency translation adjustments.
|
|
2 Deductions include accounts receivable written off and recoveries.
|
Note 3. Inventories
Inventories were as follows:
|
April 30,
|
||||||||
|
In thousands
|
2011
|
2010
|
||||||
|
Raw materials and purchased parts
|
$
|
42,752
|
$
|
49,400
|
||||
|
Work in process
|
1,550
|
1,774
|
||||||
|
Finished goods
|
10,992
|
8,649
|
||||||
|
Total inventories
|
$
|
55,294
|
$
|
59,823
|
||||
Note 4. Property, Plant and Equipment
The components of property, plant and equipment were as follows:
|
April 30,
|
||||||||
|
In thousands
|
2011
|
2010
|
||||||
|
Land
|
$
|
1,110
|
$
|
1,036
|
||||
|
Buildings
|
34,532
|
33,128
|
||||||
|
Machinery, tools and equipment
|
67,791
|
84,908
|
||||||
|
103,433
|
119,072
|
|||||||
|
Accumulated depreciation
|
(78,526
|
)
|
(90,454
|
)
|
||||
|
24,907
|
28,618
|
|||||||
|
Construction in progress
|
5,809
|
3,605
|
||||||
|
Total property, plant and equipment, net
|
$
|
30,716
|
$
|
32,223
|
||||
Construction in progress included capitalized interest of $0.2 million for the fiscal year ended April 30, 2011 and $0.1 million for the fiscal year ended April 30, 2010. Depreciation expense was $6.1 million, $7.9 million and $9.0 million for the fiscal years ended April 30, 2011, 2010 and 2009, respectively.
91
Note 5. Business Acquisitions
Acquisition During the Fiscal Year Ended April 30, 2010 – On November 25, 2009, the Company acquired for cash 100 percent of the stock of Yunique, a software development company for apparel and flexible materials markets, located in New York. The acquisition of this business is expected to enhance the Apparel and Industrial segment’s product lifecycle management software product offerings. Under the terms of the stock purchase agreement, the Company paid $2.0 million to the former owners of Yunique and is liable for future contingent payments based upon Yunique’s annual revenue for the three full fiscal years following the acquisition date. The contingent payments could range from $3.3 million to $4.0 million and were estimated at approximately $3.8 million on an undiscounted basis using probability-based forecasted revenue as of the acquisition date. The contingent future payments were recorded at estimated fair value and are classified in Other liabilities and Other long-term liabilities on the accompanying Consolidated Balance Sheet. The Company funded the initial payment for this acquisition with borrowings under its credit facility. As of April 30, 2011, the expected (undiscounted) range of contingent payments is $3.3 million to $3.5 million. The Company incurred and expensed $0.6 million in acquisition costs associated with Yunique during the fiscal year ended April 30, 2010. These costs were recognized within Restructuring and other expenses on the accompanying Consolidated Statements of Operations.
The assets and liabilities of Yunique were recorded at fair value under the purchase method of accounting. The Company determined the fair value of acquired intangible assets through the use of valuation models. The acquired amortizable intangible assets included $1.8 million attributable to customer relationships with an estimated useful life of ten years, $0.9 million attributable to developed technology assets with an estimated useful life of five years, and a trade name valued at $0.1 million with an estimated useful life of ten years. The unallocated purchase price of $3.7 million was recorded as goodwill, none of which is anticipated to be tax deductible. The recorded goodwill is primarily attributable to expected synergies between the Company and Yunique.
The following table summarizes the assets acquired and liabilities assumed:
|
In thousands
|
November 25, 2009
|
|||
|
Assets acquired:
|
||||
|
Accounts receivable
|
$ | 194 | ||
|
Prepaid expenses and other current assets
|
12 | |||
|
Goodwill
|
3,653 | |||
|
Other assets
|
2,796 | |||
|
Total assets acquired
|
$ | 6,655 | ||
|
Liabilities assumed:
|
||||
|
Accounts payable
|
33 | |||
|
Other liabilities
|
158 | |||
|
Deferred revenue
|
257 | |||
|
Other long-term liabilities
|
1,021 | |||
|
Total liabilities assumed
|
$ | 1,469 | ||
|
Net assets acquired
|
$ | 5,186 | ||
|
Consideration:
|
||||
|
Cash payment
|
$ | 2,012 | ||
|
Estimated fair value of contingent consideration
|
3,174 | |||
|
Total consideration
|
$ | 5,186 | ||
For comparative purposes, the Company believes that its results of operations for the fiscal years ended April 30, 2010 and April 30, 2009 would not have been materially different had the acquisition of Yunique occurred at May 1, 2009 or May 1, 2008.
Acquisitions During the Fiscal Year Ended April 30, 2009 - The Company completed acquisitions of two companies during the fiscal year ended April 30, 2009. The Company acquired for cash the capital stock of Gamma in September 2008 and the capital stock of Virtek in October 2008. The acquisitions were funded through borrowings under the Company's revolving credit facility.
Gamma, a manufacturer of equipment for the Apparel and Industrial segment, was acquired to expand the Company's position within China. Under the terms of the stock purchase agreement, the Company paid $5.5 million to the stockholders of Gamma,
92
which included the settlement of amounts held in escrow in the fiscal year ended April 30, 2010. The assets and liabilities of Gamma were recorded at fair value on the date of acquisition under the purchase method of accounting. The Company determined the fair value of acquired intangible assets of $1.4 million through the use of valuation models. The unallocated purchase price of $4.7 million was recorded as goodwill.
Virtek is a manufacturer of precision laser-based templating and inspection solutions for industrial material. Virtek serves customers in the prefabricated construction and transportation industries worldwide, and its operations are located primarily in Canada. The Company intends to utilize its global reach, service and customer relationships to increase sales of Virtek’s products, as well as to provide products and services to customers in the Apparel and Industrial segment. Prior to the acquisition, the common stock of Virtek was publicly listed on the Toronto Stock Exchange. The Company purchased all of the outstanding common stock of Virtek for an aggregate purchase price of approximately $29.0 million.
The assets and liabilities of Virtek were recorded at fair value under the purchase method of accounting. The Company determined the fair value of acquired intangible assets through the use of valuation models. The acquired amortizable intangible assets included $3.0 million of developed technology with an estimated useful life of 10 years and trade names valued at $0.1 million with an estimated useful life of 3 years. The unallocated purchase price of $16.0 million was recorded as goodwill, none of which is anticipated to be tax deductible.
The table below summarizes the assets acquired and liabilities assumed. The acquisition included assets and liabilities of FOBA, which was subsequently sold. See Note 19. The amount reported for Goodwill included capitalized transaction costs of approximately $3.4 million.
|
In thousands
|
October 21, 2008
|
|||
|
Assets acquired:
|
||||
|
Cash and cash equivalents
|
$ | 4,128 | ||
|
Accounts receivable
|
6,940 | |||
|
Inventories
|
8,756 | |||
|
Prepaid and other assets
|
615 | |||
|
Property, plant and equipment
|
1,831 | |||
|
Goodwill
|
15,968 | |||
|
Deferred tax assets
|
3,030 | |||
|
Other assets
|
3,135 | |||
|
Total assets acquired
|
$ | 44,403 | ||
|
Liabilities assumed:
|
||||
|
Accounts payable
|
$ | 2,499 | ||
|
Accrued compensation and benefits
|
2,893 | |||
|
Other liabilities
|
5,599 | |||
|
Deferred revenue
|
959 | |||
|
Total liabilities assumed
|
$ | 11,950 | ||
|
Net assets acquired
|
$ | 32,453 | ||
As a result of the Virtek acquisition, the Company planned to consolidate Virtek production facilities for certain product lines within its United States and Canadian locations. Included in this plan were workforce reductions and plans to exit certain leased facilities that were executed in the fiscal years ended April 30, 2009 and 2010. The Company's purchase price allocation of accrued compensation and benefits and other liabilities included $1.6 million of estimated costs for workforce reductions and lease termination costs as of the acquisition date.
For comparative purposes, the Company believes that its results of operations for the fiscal year ended April 30, 2009 would not have been materially different had the acquisition of Virtek occurred at May 1, 2008.
93
Note 6. Goodwill and Intangible Assets
The table below presents the gross carrying amount and accumulated amortization of the Company's acquired intangible assets other than goodwill included in Other assets on the Company's Consolidated Balance Sheets:
|
April 30, 2011
|
April 30, 2010
|
|||||||||||||||
|
In thousands
|
Gross
Carrying
Amount
|
Accumulated
Amortization
|
Gross
Carrying
Amount
|
Accumulated
Amortization
|
||||||||||||
|
Amortized intangible assets:
|
||||||||||||||||
|
Patents
|
$
|
2,995
|
$
|
1,699
|
$
|
7,732
|
$
|
3,641
|
||||||||
|
Other
|
8,729
|
1,671
|
8,346
|
1,136
|
||||||||||||
|
Total amortized intangible assets
|
$
|
11,724
|
$
|
3,370
|
$
|
16,078
|
$
|
4,777
|
||||||||
Intangible asset amortization expense was $1.6 million, $1.5 million and $1.0 million for the fiscal years ended April 30, 2011, 2010 and 2009, respectively. It is estimated that such expense will be $1.4 million for the fiscal year ending April 30, 2012, $1.2 million for the fiscal year ending April 30, 2013, $1.1 million for the fiscal year ending April 30, 2014, $1.0 million for the fiscal year ending April 30, 2015 and $0.9 million for the fiscal year ending April 30, 2016 based on the amortized intangible assets as of April 30, 2011.
The Company settled $1.5 million in contingent obligation commitments during the fiscal year ended April 30, 2010 related to past acquisitions with the former owners of Data Technology and Gamma. In connection with the sale of certain businesses, the Company recorded a charge of $2.7 million for the write-off of goodwill as part of the Loss from discontinued operations in the accompanying Consolidated Statements of Operations (see Note 19).
The GSP reporting unit’s goodwill asset was $7.0 million as of April 30, 2010. In connection with the GI business unit transfer to the Apparel and Industrial reporting unit from the GSP reporting unit, $1.1 million of goodwill was transferred to the Apparel and Industrial reporting unit. The Company conducted a goodwill impairment test on the remaining GSP business during the fiscal quarter ended July 31, 2010 and the remaining goodwill was not impaired. During the fiscal quarter ended April 30, 2011, as a result of the decision to discontinue manufacturing the inkjet printers, the Company concluded that there was evidence that the fair value of the GSP had decreased below the reporting unit’s book value. The results of the first step of the goodwill impairment test as of April 30, 2011 indicated potential impairment, as the fair value of the reporting unit was less than the book value. The primary measure of fair value was calculated using a discounted cash flow model. The second step of the impairment test was performed to determine the potential impairment loss. The second step of the goodwill impairment test requires the Company to calculate the implied fair value of goodwill by allocating the fair value of the reporting unit to all assets and liabilities of that reporting unit, including unrecognized intangible assets, as if the reporting unit had been acquired in a business combination. As a result of that test, there was no excess fair value to allocate to goodwill. Therefore the Company recorded a $5.9 million goodwill impairment charge during the fiscal quarter ended April 30, 2011.
During the fiscal quarter ended October 31, 2010, prior to the sale of the Gerber Coburn Unit, the Company concluded that there was evidence that the fair value of the Ophthalmic Lens Processing reporting unit had decreased below the reporting unit’s book value as a result of the potential sales process for the Ophthalmic Lens Processing segment assets and therefore performed an interim goodwill impairment test. The results of the first step of the goodwill impairment test as of October 31, 2010 indicated potential impairment, as the fair value of the reporting unit was less than the book value. The primary measure of fair value was the purchase price proposed in a letter of intent for sale of the assets that was being considered by the Company. The second step of the impairment test was performed to determine the potential impairment loss. The second step of the goodwill impairment test requires the Company to calculate the implied fair value of goodwill by allocating the fair value of the reporting unit to all assets and liabilities of that reporting unit, including unrecognized intangible assets, as if the reporting unit had been acquired in a business combination. As a result of that test, there was no excess fair value to allocate to goodwill. Therefore, the Company recorded a $16.9 million goodwill impairment charge during the fiscal quarter ended October 31, 2010, which is recorded in discontinued operations in the accompanying Consolidated Statements of Operations.
94
Balances and changes in the carrying amount of goodwill for the fiscal years ended April 30, 2011 and 2010 were:
|
In thousands
|
Sign Making
& Specialty
Graphics
|
Apparel &
Industrial
|
Ophthalmic
Lens
Processing1
|
Total
|
||||||||||||
|
Balance as of April 30, 2009
|
||||||||||||||||
|
Gross goodwill
|
$
|
118,690
|
$
|
34,207
|
$
|
38,696
|
$
|
191,593
|
||||||||
|
Accumulated impairment losses
|
(92,953
|
)
|
---
|
(21,700
|
)
|
(114,653
|
)
|
|||||||||
|
Net balance as of April 30, 2009
|
25,737
|
34,207
|
16,996
|
76,940
|
||||||||||||
|
Goodwill acquired during the year from acquisitions
|
1,086
|
4,021
|
---
|
5,107
|
||||||||||||
|
Goodwill related to the sale of a business
|
(1,009
|
)
|
(1,581
|
)
|
(108
|
)
|
(2,698
|
)
|
||||||||
|
Effects of currency translation
|
1,541
|
2,764
|
---
|
4,305
|
||||||||||||
|
Net balance as of April 30, 2010
|
27,355
|
39,411
|
16,888
|
83,654
|
||||||||||||
|
Effect of Gerber Innovations segment change
|
(1,112
|
)
|
1,112
|
---
|
---
|
|||||||||||
|
Goodwill impairment
|
(5,928
|
)
|
---
|
(16,888
|
)
|
(22,816
|
)
|
|||||||||
|
Effects of currency translation
|
2,186
|
1,559
|
---
|
3,745
|
||||||||||||
|
Net balance as of April 30, 2011
|
$
|
22,501
|
$
|
42,082
|
$
|
---
|
$
|
64,583
|
||||||||
|
Net balance as of April 30, 2011 was comprised of:
|
||||||||||||||||
|
Gross goodwill
|
$
|
121,382
|
$
|
42,082
|
$
|
38,588
|
$
|
202,052
|
||||||||
|
Accumulated impairment losses
|
(98,881
|
)
|
---
|
(38,588
|
)
|
(137,469
|
)
|
|||||||||
|
Net balance as of April 30, 2011
|
$
|
22,501
|
$
|
42,082
|
$
|
---
|
$
|
64,583
|
||||||||
1 The Gerber Coburn Unit of the Ophthalmic Lens Processing segment is classified as discontinued operations within the accompanying Consolidated Statements of Operations.
Note 7. Investments
Investments are primarily comprised of a mutual fund held in a rabbi trust that is used to fund benefit payments under the nonqualified supplemental pension plan. Investments in available-for-sale securities included in Other assets for the fiscal years ended April 30, 2011 and 2010 were:
|
For the Fiscal Years Ended April 30,
|
||||||||||||||||||||||||
|
2011
|
2010
|
|||||||||||||||||||||||
|
In thousands
|
Cost
|
Unrealized
Gains
|
Estimated
Fair Value
|
Cost
|
Unrealized
Gains
|
Estimated
Fair Value
|
||||||||||||||||||
|
Mutual fund
|
$
|
2,387
|
$
|
1,307
|
$
|
3,694
|
$
|
2,707
|
$
|
1,099
|
$
|
3,806
|
||||||||||||
Gross realized gains of $0.2 million were included in Other expense, net for the fiscal year ended April 30, 2011. Gross realized gains of $0.1 million were included in Other expense, net for the fiscal year ended April 30, 2010. Gross realized losses of $0.1 million were included in Other expense, net for the fiscal year ended April 30, 2009. Additionally, an other-than-temporary impairment charge of $2.3 million was recognized in the fiscal year ended April 30, 2009 and included within Other expense, net on the accompanying Consolidated Statements of Operations.
95
Note 8. Income Taxes
Components of the provision for income taxes attributable to continuing operations were:
|
For the Fiscal Years Ended April 30,
|
|||||||||||||
|
In thousands
|
2011
|
2010
|
2009
|
||||||||||
|
Current:
|
|||||||||||||
|
Federal
|
$
|
(24
|
)
|
$
|
(83
|
)
|
$
|
(270
|
)
|
||||
|
State and local
|
111
|
85
|
95
|
||||||||||
|
Foreign
|
4,749
|
3,485
|
1,444
|
||||||||||
|
Total current
|
4,836
|
3,487
|
1,269
|
||||||||||
|
Deferred:
|
|||||||||||||
|
Federal
|
(5,153
|
)
|
(5,463
|
)
|
(4,330
|
)
|
|||||||
|
State and local
|
(88
|
)
|
(195
|
)
|
(106
|
)
|
|||||||
|
Foreign
|
662
|
1,515
|
(2,501
|
)
|
|||||||||
|
Total deferred
|
(4,579
|
)
|
(4,143
|
)
|
(6,937
|
)
|
|||||||
|
Income tax expense (benefit)
|
$
|
257
|
$
|
(656
|
)
|
$
|
(5,668
|
)
|
|||||
The following reconciles the statutory United States federal income tax rate to the consolidated effective income tax rate:
|
For the Fiscal Years Ended April 30,
|
||||||||||||
|
2011
|
2010
|
2009
|
||||||||||
|
Statutory U.S. federal income tax rate
|
35.0
|
%
|
35.0
|
%
|
35.0
|
%
|
||||||
|
State income taxes, net of US federal tax benefit
|
0.2
|
8.7
|
(1.5
|
)
|
||||||||
|
Reversal of valuation allowance in France
|
---
|
---
|
76.8
|
|||||||||
|
Foreign tax differences and other valuation allowance adjustments
|
27.8
|
60.2
|
2.8
|
|||||||||
|
Impact of repatriation of foreign earnings
|
(52.6
|
)
|
30.6
|
(5.6
|
)
|
|||||||
|
Belgian notional interest deduction
|
2.7
|
16.8
|
8.0
|
|||||||||
|
Research and development and other tax credits
|
9.3
|
15.7
|
8.4
|
|||||||||
|
Prior years’ adjustments
|
7.9
|
(89.4
|
)
|
13.7
|
||||||||
|
Nondeductible cost of acquisitions
|
---
|
(12.4
|
)
|
---
|
||||||||
|
Nondeductible goodwill impairment
|
(31.4
|
)
|
---
|
---
|
||||||||
|
Equity based compensation adjustments
|
---
|
(10.2
|
)
|
(4.3
|
)
|
|||||||
|
Other foreign taxes
|
(2.7
|
)
|
(8.4
|
)
|
(1.8
|
)
|
||||||
|
Other, net
|
(0.2
|
)
|
(5.0
|
)
|
2.7
|
|||||||
|
Effective income tax rate
|
(4.0
|
)%
|
41.6
|
%
|
134.2
|
%
|
||||||
A valuation allowance is established if, based upon all available evidence, it is "more likely than not" that all or a portion of deferred tax assets may not be realized. A review of all available evidence includes, but is not limited to, Company performance, the market environment in which the Company operates, the length of carryback and carryforward periods, and objectively verifiable evidence concerning future profitability.
96
Deferred tax assets and liabilities as of April 30, 2011 and 2010 were:
|
April 30, 2011
|
April 30, 2010
|
||||||||||||||
|
In thousands
|
Deferred
Tax Assets
|
Deferred Tax
Liabilities
|
Deferred
Tax Assets
|
Deferred Tax
Liabilities
|
|||||||||||
|
Depreciation
|
$
|
1,647
|
$
|
1,348
|
$
|
1,022
|
$
|
1,599
|
|||||||
|
Patents
|
---
|
417
|
---
|
1,471
|
|||||||||||
|
Employee benefit plans
|
14,150
|
643
|
14,765
|
565
|
|||||||||||
|
Inventory
|
5,610
|
200
|
6,254
|
145
|
|||||||||||
|
Asset valuations
|
13,379
|
8,855
|
13,921
|
7,733
|
|||||||||||
|
Provisions for estimated expenses
|
6,192
|
18
|
4,435
|
---
|
|||||||||||
|
Net operating losses
|
17,791
|
---
|
19,075
|
---
|
|||||||||||
|
Credit carryforwards
|
13,718
|
---
|
10,491
|
270
|
|||||||||||
|
Other
|
4,635
|
658
|
4,455
|
1,134
|
|||||||||||
|
77,122
|
12,139
|
74,418
|
12,917
|
||||||||||||
|
Valuation allowance
|
(16,369
|
)
|
---
|
(17,118
|
)
|
---
|
|||||||||
|
$
|
60,753
|
$
|
12,139
|
$
|
57,300
|
$
|
12,917
|
||||||||
United States income and foreign withholding taxes have not been provided on $129.3 million of excess of financial reporting over investment tax basis differences for foreign subsidiaries, including unremitted foreign earnings, because the differences are considered to be reinvested indefinitely outside the United States. The basis differences could become taxable upon the sale or liquidation of these foreign subsidiaries or upon dividend repatriation. The Company's intent is for such earnings to be reinvested by the subsidiaries or to be repatriated only when reinvestment or repatriation would be tax effective through the utilization of foreign tax credits. Determination of the related amount of the unrecognized deferred income tax liability is not practicable.
The sources of income (loss) from continuing operations before income taxes were:
|
For the Fiscal Years Ended April 30,
|
|||||||||||
|
In thousands
|
2011
|
2010
|
2009
|
||||||||
|
United States
|
$
|
(29,427
|
)
|
$
|
(18,067
|
)
|
$
|
(15,481
|
)
|
||
|
Foreign
|
23,017
|
16,489
|
11,256
|
||||||||
|
Loss from continuing operations before income taxes
|
$
|
(6,410
|
)
|
$
|
(1,578
|
)
|
$
|
(4,225
|
)
|
||
As of April 30, 2011, the Company has approximately $226.7 million of tax net operating loss carryforwards, primarily state and foreign, of which $198.7 million expire as follows: $5.3 million from the fiscal years ended or ending April 30, 2011 through April 30, 2015, $191.8 million during the fiscal years ending April 30, 2016 through 2021, and $1.6 million from the fiscal years ending April 30, 2022 through April 30, 2031. In addition, the Company has approximately $17.1 million of federal tax credit carryforwards, of which $15.4 million expire beginning in the fiscal year ending April 30, 2014.
As of April 30, 2011 and 2010, the Company had valuation allowances of $16.4 million and $17.1 million, respectively, related primarily to foreign and state loss carryforwards that do not meet the standard of being more likely than not to be realized. The net decrease in the valuation allowance of $0.7 million for the fiscal year ended April 30, 2011 relates principally to the generation of earnings in many locations. The Company expects future operations will generate sufficient earnings to enable it to realize its remaining deferred tax assets.
97
A rollforward of the valuation allowance on deferred tax assets for each of the three fiscal years in the three-year period ended April 30, 2011 was as follows:
|
In thousands
|
Balance at
Beginning of
Fiscal Year
|
Charges to
Income
Tax Expense
|
Acquired Valuation
Allowances
|
Deductions
|
1
|
Balance at
End of
Fiscal Year
|
||||||||||||||
|
Fiscal 2011
|
$
|
17,118
|
$
|
997
|
$
|
---
|
$
|
(1,746
|
)
|
$
|
16,369
|
|||||||||
|
Fiscal 2010
|
$
|
14,182
|
$
|
3,573
|
$
|
---
|
$
|
(637
|
)
|
$
|
17,118
|
|||||||||
|
Fiscal 2009
|
$
|
15,182
|
$
|
1,142
|
$
|
1,176
|
$
|
(3,318
|
)
|
$
|
14,182
|
|||||||||
1 Included in the amount for the fiscal year ended April 30, 2009 is $3.2 million associated with the reversal of the valuation allowance in France.
Charges to income tax expense relate primarily to net operating losses in state and foreign jurisdictions, the effect of which has been included in the effective tax rate reconciliation in the adjustment for state income taxes and within foreign tax rate differences.
The Company recognizes interest accrued related to unrecognized tax benefits and penalties within income tax expense. During the fiscal year ended April 30, 2011, the Company recorded no interest and penalties charges in the accompanying Consolidated Statement of Operations. For the fiscal years ended April 30, 2010 and 2009, the Company recorded interest and penalties charges of approximately $0.1 million in each respective period. The Company had no accrued interest and penalties as of April 30, 2011, and, as of April 30, 2010 total accrued interest, which related to uncertain tax positions, was $0.1 million. As of April 30, 2011, the Company had gross tax-effected unrecognized tax benefits of $5.0 million, of which $3.5 million, if recognized, would impact the effective tax rate. A reconciliation of the beginning and ending amount of unrecognized tax benefits is as follows for the fiscal years ended April 30, 2011, 2010 and 2009:
|
In thousands
|
2011
|
2010
|
2009
|
|||||||
|
Beginning balance
|
$
|
3,596
|
$
|
3,422
|
$
|
4,064
|
||||
|
Additions for tax positions related to the current year
|
426
|
786
|
140
|
|||||||
|
Additions for tax positions of prior years
|
189
|
98
|
37
|
|||||||
|
Reductions for tax positions of prior years
|
(195
|
)
|
(652
|
)
|
(196
|
)
|
||||
|
Reductions for lapse of applicable statutes of limitation
|
(497
|
)
|
(58
|
)
|
(623
|
)
|
||||
|
Ending balance
|
$
|
3,519
|
$
|
3,596
|
$
|
3,422
|
||||
The Company conducts business globally and, as a result, Gerber or one or more of its subsidiaries file income tax returns in the United States federal jurisdiction and various state and foreign jurisdictions. In the normal course of business, the Company is subject to examination by taxing authorities throughout the world, including such major jurisdictions as Australia, Austria, Belgium, Canada, China, France, Germany, Hong Kong, Italy, the Netherlands, Singapore, Spain, Switzerland, the United Kingdom and the United States. With few exceptions, the Company is no longer subject to United States federal, state and local, or non-United States income tax examinations for years before 2004.
It is reasonably possible that a reduction in the range of $2.0 million to $3.0 million of unrecognized tax benefits may occur within 12 months as a result of the filing of amended tax returns and expirations of statutes of limitation.
Note 9. Borrowings
The Company's outstanding debt is composed of the following:
|
April 30, 2011
|
April 30,
|
|||||||||||
|
In thousands
|
Effective rates
|
2011
|
2010
|
|||||||||
|
Short-term lines of credit
|
4.3
|
%
|
$
|
643
|
$
|
1,146
|
||||||
|
Revolving credit facility
|
2.6
|
%
|
21,110
|
45,000
|
||||||||
|
21,753
|
46,146
|
|||||||||||
|
Less portion due within one year
|
(643
|
)
|
(1,146
|
)
|
||||||||
|
Total long-term debt
|
$
|
21,110
|
$
|
45,000
|
||||||||
98
All of the Company's outstanding debt accrued interest at variable interest rates as of April 30, 2011. As the underlying interest rates are believed to represent market rates, the carrying amounts are considered to approximate fair value. The Company has used interest rate swaps to manage certain market rate exposures. See Note 10.
Credit Facility – The Company entered into a credit agreement on January 31, 2008 (the "Credit Agreement"), which was amended and restated on March 1, 2011. The March 1, 2011 amendment extended the maturity of the facility to March 1, 2016 from January 31, 2012, modified certain financial covenants as described below, and increased the maximum borrowing capacity to $75.0 million under revolving credit loans from $60.0 million. In addition, the Company may elect, subject to compliance with specified conditions, to solicit the lenders under the Credit Agreement to increase by up to $25.0 million the total principal amount of borrowings available under the credit facility. The Credit Agreement is among the Company and certain of its subsidiaries and Bank of America, N.A. and HSBC Bank USA, National Association, as lenders, Sovereign Bank as lender and documentation agent, and RBS Citizens, N.A., as lender, lead arranger, bookrunner and administrative agent. The credit facility is collateralized by first-priority liens on selected assets of the Company and the pledge of capital stock of certain of the Company’s subsidiaries and is guaranteed by certain subsidiaries of the Company.
Outstanding borrowings under the Credit Agreement accrue interest at an annual rate equal to the defined Applicable Base Rate ("ABR"), the London Interbank Offered Rate ("LIBOR"), or the Euro Interbank Offered Rate (“EURIBOR,”) plus a variable margin, which varies based upon certain financial measurements. An annual commitment fee is payable quarterly based upon the unused amount of the Credit Agreement at a specified margin.
The specified margins and commitment fees are based on the Company's ratio of Total Funded Debt to Consolidated EBITDA (as defined for purposes of the Credit Agreement), as shown in the table below:
|
Total Funded Debt to Consolidated EBITDA Ratio
|
ABR Margin
(basis points)
|
LIBOR and EURIBOR Margin
(basis points)
|
Commitment Fee (basis points)
|
|
2.50x and greater
|
200.0
|
300.0
|
50.0
|
|
1.75x to less than 2.50x
|
162.5
|
262.5
|
37.5
|
|
1.00x to less than 1.75x
|
125.0
|
225.0
|
25.0
|
|
Less than 1.00x
|
87.5
|
187.5
|
25.0
|
The Credit Agreement contains customary representations and warranties, affirmative and negative covenants, financial covenants and events of default. The financial covenants in the Credit Agreement require the Company to maintain a maximum ratio of Total Funded Debt to Consolidated EBITDA not to exceed 3.25:1, a minimum ratio of Consolidated EBIT to Consolidated Interest Expense of 3.00:1, a maximum capital expenditures covenant and minimum asset coverage ratio covenant of 1:1 (all as defined for purposes of the Credit Agreement). Under the maximum capital expenditures covenant, which is measured on an annual basis, capital expenditures may not exceed $10.0 million for the fiscal year ended April 30, 2011, $15.0 million for the fiscal year ending April 30, 2012, and $10.0 million annually thereafter. The Asset Coverage Ratio covenant requires testing on a quarterly basis if the ratio of Total Funded Debt to Consolidated EBITDA is greater than 2.25:1, otherwise this covenant is not applicable.
The definition of EBITDA in the Credit Agreement excludes, among other items, certain gains and expenses, including other-than-temporary impairment asset charges, non-cash stock compensation, non-recurring fees and expenses associated with the Credit Agreement amendments, certain non-recurring charges and non-cash purchase accounting adjustments that amortize into EBITDA, and includes, among other items, pro forma EBITDA from acquired companies.
The Company incurred fees and related costs in connection with the March 2011 amendment of approximately $0.9 million, which are amortized over the remaining term of the Credit Agreement. As a result of the March 2011 amendment, the Company incurred $0.1 million of interest expense associated with the write-off of a portion of previously capitalized deferred financing fees.
The Company's future compliance with the financial covenants under the credit facility will depend primarily on its success in generating sufficient operating cash flows. Future compliance with the financial covenants may be adversely affected by various economic, financial and industrial factors. Noncompliance with the covenants would constitute an event of default under the credit facility, potentially allowing the lenders to accelerate repayment of any outstanding borrowings. In the event of failure by
99
the Company to continue to be in compliance with any covenants, the Company would seek to negotiate amendments to the applicable covenants or obtain compliance waivers from its lenders. The Company was in compliance with its financial covenants as of April 30, 2011. As of April 30, 2011, $45.2 million was available for borrowings under the revolving credit facility, based on borrowings outstanding as of April 30, 2011 and facility financial covenants.
The Credit Agreement also contains subjective acceleration clauses under which, upon the occurrence of a change in the Company's financial condition, business or operations considered by the lenders to be materially adverse to the Company, the lenders may cause amounts due under the agreement to become immediately due and payable. Additionally, the Credit Agreement contains certain cross-default provisions, which provide that default by the Company under other lending arrangements could cause the Company to be in default under the Credit Agreement.
Under the terms of its credit facility, the Company is restricted from making cash dividend payments in excess of 25 percent of the preceding year's net income.
Weighted-average interest rates under the Company's primary credit facility, inclusive of deferred debt issue costs amortized and interest allocated to discontinued operations, were 6.1 percent in the fiscal year ended April 30, 2011, 7.2 percent in the fiscal year ended April 30, 2010 and 5.7 percent in the fiscal year ended April 30, 2009.
Short-term Lines of Credit – The Company had short-term bank lines of credit available with several international banks of approximately $2.2 million as of April 30, 2011 and $1.2 million as of April 30, 2010.
Note 10. Derivative Instruments
The Company used derivative instruments, including interest rate swaps and foreign currency contracts, during the fiscal years ended April 30, 2011, 2010 and 2009. Derivative instruments are viewed as risk management tools and are not used for trading or speculative purposes.
The Company holds debt that is indexed at variable market interest rates and operates internationally. Therefore, the Company is exposed to fluctuations in interest rates and foreign exchange rates in the normal course of business. These fluctuations can increase the costs of financing, investing and operating the business. By nature, all financial instruments involve market and credit risks. The Company enters into derivative and other financial instruments with major investment grade financial institutions and has procedures to monitor the credit risk of those counterparties. The Company limits its counterparty exposure and concentration of risk by diversifying counterparties. While there can be no assurance in this regard, the Company does not anticipate any non-performance by any of these counterparties. The Company also may employ derivative instruments to hedge the volatility in shareholders’ equity resulting from changes in currency exchange rates of significant foreign subsidiaries of the Company with respect to the U.S. dollar. These instruments, designated as net investment hedges, expose the Company to liquidity risk as the derivatives have an immediate cash flow impact upon maturity which is not offset by cash flow from the translation of the underlying hedged equity. The Company monitors this cash loss potential on an ongoing basis, and expects that cash repatriation from international subsidiaries will be sufficient to settle the debt upon maturity.
All derivative instruments are recorded on the balance sheet at fair value. Derivatives used to hedge forecasted cash flows associated with foreign currency commitments or forecasted interest payments may be accounted for as cash flow hedges, as deemed appropriate. Gains and losses on derivatives designated as cash flow hedges are recorded in other comprehensive income and reclassified to earnings in a manner that matches the timing of the earnings impact of the hedged transactions. The ineffective portion of all hedges, if any, is recognized currently in earnings.
Interest Rate Swaps – The Company is subject to market risk exposure from changes to interest rates due to the variable nature of the credit facility market interest rates. The Company manages these exposures by periodically assessing the market environment and swapping variable interest payments for fixed interest payments at an acceptable level for a portion of its debt. These derivative instruments are accounted for as cash flow hedges. The fair value of interest rate swaps is classified as an other asset or other liability at fair value on the Consolidated Balance Sheets. To the extent that these derivatives are effective in offsetting the variability of the hedged cash flows, and otherwise meet the hedge accounting criteria, changes in the derivatives' fair value are not included in current earnings but are included in Accumulated other comprehensive income (loss) in Shareholders' Equity. These changes in fair value will subsequently be reclassified in current earnings as a component of Interest expense when the interest payments are incurred. If a previously designated hedging transaction ceases to be effective
100
as a hedge, any ineffectiveness measured in the hedging relationship would be recorded in earnings in the period in which it occurs. Cash flows associated with the interest rate swaps are recorded within cash flows from operating activities in the Consolidated Statements of Cash Flows.
The Company maintained two interest rate swap arrangements effective during the fiscal year ended April 30, 2011, under which it hedged its variable LIBOR-based interest payments on $20.0 million and $25.0 million principal amount of its debt, respectively, which qualified for hedge accounting as cash flow hedges. The interest rate swap agreement on $20.0 million principal amount of debt matured in May 2010 and the interest rate swap agreement on $25.0 million principal amount of debt matured in November 2010. As of April 30, 2011, there were no outstanding interest rate swap arrangements.
Foreign Currency Contracts – The Company is subject to foreign currency risk exposure from changes in foreign currency rates on cash payments from its foreign subsidiaries to the United States parent company. The Company manages these exposures by periodically assessing the market environment and entering into foreign currency derivative contracts. These derivative instruments are accounted for as cash flow hedges. The fair value of the foreign currency cash flow hedges is classified as an other asset or other liability at fair value on the Consolidated Balance Sheets. To the extent these derivatives are effective in offsetting the variability of the hedged cash flows, and otherwise meet the hedge accounting criteria, changes in the derivatives' fair value are not included in current earnings but are included in Accumulated other comprehensive income (loss) in Shareholders' Equity. These changes in fair value will subsequently be reclassified in current earnings as a component of Other expense, net when the foreign currency transactions are settled. If a previously designated hedging transaction ceases to be effective as a hedge, any ineffectiveness measured in the hedging relationship would be recorded in earnings in the period in which it occurs. Cash flows associated with the foreign currency contracts are recorded within cash flows from operating activities in the Consolidated Statements of Cash Flows.
The Company entered into three foreign currency contracts designated as cash flow hedges effective during the fiscal year ended April 30, 2011, under which it hedged forecasted euro cash payments from its foreign subsidiaries to the United States parent company of approximately $16.9 million. As of April 30, 2011 and 2010 there were no outstanding foreign currency forward contracts.
During the fiscal year ended April 30, 2010, the Company managed certain foreign currency transaction risk through the use of derivatives to hedge forecasted foreign currency intercompany cash flows and did not use hedge accounting for these transactions. A gain of $0.1 million was recorded upon settlement of the forward contracts within Other expense, net on the accompanying Consolidated Statements of Operations for the fiscal year ended April 30, 2010. During the fiscal year ended April 30, 2009, the Company managed certain foreign currency transaction risk to acceptable limits through the use of derivatives to hedge forecasted foreign currency cash flows associated with the Virtek acquisition. As hedge accounting related to contemplated business combinations is not permissible, the hedges were utilized as economic hedges. A loss of $0.7 million was recorded upon the settlement of the derivative within Other expense, net on the accompanying Consolidated Statements of Operations for the fiscal year ended April 30, 2009.
Long-Term Investments in Foreign Subsidiaries (Net Investment) – For the fiscal year ended April 30, 2011, the Company designated a portion of its foreign currency denominated debt as a hedge of the net investment of a significant foreign subsidiary to reduce the volatility in shareholder’s equity caused by changes in foreign currency exchange rates in the functional currency of the subsidiary with respect to the U.S. dollar. The notional amount of foreign currency denominated debt was $3.1 million as of April 30, 2011. The weighted-average maturity of the debt as of April 30, 2011 was 4.8 years, as the borrowing could be extended through the maturity of the revolving credit facility.
101
The following table summarizes the fair value of these derivative instruments as of April 30, 2011 and 2010:
|
Liabilities
|
|||||||||
|
In thousands
|
Balance Sheet Location
|
2011
|
2010
|
||||||
|
Derivatives designated as hedging instruments:
|
|||||||||
|
Interest rate swap arrangements
|
Other liabilities
|
$ | --- | $ | 479 | ||||
|
Debt designated as hedging instrument:
|
|||||||||
|
Long-term debt
|
Long-term debt
|
$ | 3,110 | $ | --- | ||||
During the fiscal years ended April 30, 2011 and 2010, there was no impact to the fair value of the Company’s derivative liabilities due to the Company’s credit risk.
The following table summarizes the pre-tax impact on Accumulated other comprehensive loss in Shareholders' Equity on the accompanying Consolidated Balance Sheets from interest rate swap arrangements and foreign currency contracts that qualified as cash flow hedges for the fiscal years ended April 30, 2011 and 2010:
|
In thousands
|
2011
|
2010
|
||||||
|
Loss recognized in Accumulated other comprehensive income (loss) before tax effect
|
$ | 1,161 | $ | 407 | ||||
|
Loss reclassified from Accumulated other comprehensive income (loss) to Interest expense (effective portion)
|
$ | 496 | $ | 1,109 | ||||
|
Loss reclassified from Accumulated other comprehensive income (loss) to Other expense (effective portion)
|
$ | 1,929 | $ | --- | ||||
Note 11. Preferred Stock, Common Stock, Stock Plans and Restricted Stock
Preferred Stock – The Company's Certificate of Incorporation authorizes 10.0 million shares of preferred stock, issuable in one or more series. The Board of Directors is authorized to fix and determine the terms, limitations and relative rights and preferences of the preferred stock, including voting rights, if any, and the amount of liquidation preference over the common stock, and to establish series of preferred stock and fix and determine the various terms among the series. As of April 30, 2011, no preferred stock had been issued.
Common Stock – The Company's Certificate of Incorporation authorizes 100.0 million shares of common stock. There were
25.1 million shares outstanding as of April 30, 2011 and 2010.
Stock Repurchase Plan – The Company is authorized to purchase up to 3.0 million shares of its outstanding common stock over an indeterminate period of time as, in the opinion of management, market conditions warrant. Under this authorization, the Company purchased 1.0 million shares in the fiscal year ended April 30, 2000. The reacquired shares have been retired and under Connecticut law constitute authorized but unissued shares. As of April 30, 2011, the Company could purchase up to an additional 2.0 million shares.
Stock Plans – The Company has stock-based compensation plans under which incentive and non-qualified stock options and restricted stock may be granted to employees from common stock. Directors may receive share grants from treasury stock. Options issued by the Company under its stock plans have a term of ten years and typically vest ratably over a period of three-years. Restricted stock grants are expensed over the vesting period of the award. Under all stock plans, the exercise price of the stock option is set on the grant date and may not be less than the fair market value per share on that date.
As of April 30, 2011, the Company had five stock incentive plans, the 2006 Omnibus Incentive Plan (the "Omnibus Plan"), the 2003 Employee Stock Option Plan (the "2003 Plan"), the 1992 Employee Stock Plan (the "1992 Employee Plan"), the 1992 Non-Employee Director Stock Option Plan (the "1992 Non-Employee Director Plan") and the Non-Employee Director's Stock Grant Plan (the "Non-Employee Director Stock Grant Plan"), under which employees and Directors have been granted stock options and other awards relating to common stock of the Company.
102
The Omnibus Plan permits the grant of nonqualified stock options, incentive stock options, stock appreciation rights, restricted stock, restricted stock units, performance shares, performance units, cash-based awards and other stock-based awards to Directors, officers and key employees. As of April 30, 2011, only nonqualified stock options, restricted stock and restricted stock units had been granted under this plan. Stock options awarded to key employees under this plan have a ten-year term and are exercisable at the common stock market price on the date of grant. Options vest in accordance with the terms of an employee's grant agreement, generally over three-years. Shares of common stock authorized under the Omnibus Plan total 4.3 million, of which 1.0 million shares were available for issuance in connection with future awards as of April 30, 2011. Exercised options are issued from authorized but unissued common shares. In the event of a "change in control" of the Company, as defined in the Omnibus Plan, all unvested outstanding stock options granted vest and become immediately exercisable.
The 2003 Plan, the 1992 Employee Plan and the 1992 Non-Employee Director Plan have all expired and all outstanding options issued under these plans are vested as of April 30, 2011. Vested options under these plans are exercisable for a ten-year term from the grant date and are exercisable at the common stock market price on the date of grant. These options remain exercisable in accordance with the terms of the respective plans. Exercised options are issued from authorized but unissued common shares.
The Non-Employee Director Stock Grant Plan provides an annual grant of 5,000 shares of the Company's common stock to non-employee members of the Board of Directors. Grants under this plan are issued from treasury shares.
The fair value of each option grant was estimated on the grant date using the Black-Scholes option-pricing model, with the following weighted-average key assumptions for the fiscal years ended April 30, 2011, 2010 and 2009. A dividend yield was not assumed for the grants in those fiscal years. Estimates of fair value are not intended to predict actual future events or the value ultimately realized by employees who receive equity awards.
|
For the Fiscal Years Ended April 30,
|
|||||
|
2011
|
2010
|
2009
|
|||
|
Expected option term1
|
6.0 years
|
5.7 years
|
5.5 years
|
||
|
Expected volatility2
|
70.0%
|
70.0%
|
46.3%
|
||
|
Risk-free interest rate3
|
1.4%
|
2.3%
|
3.0%
|
||
|
1
|
The expected option term is determined by analyzing the Company's historical experience.
|
||||
|
2
|
The stock volatility for each grant is measured using the weighted-average of historical daily price changes of the Company's common stock over the most recent period equal to the expected option life of the grant.
|
||||
|
3
|
The risk-free interest rate is based on the 5-year U.S. Treasury note yield in effect at the time of grant.
|
||||
Weighted-average fair values at date of grant for options granted during the fiscal years ended April 30, 2011, 2010 and 2009 were $3.81, $3.56 and $4.15, respectively. The total intrinsic value of options exercised during the fiscal years ended April 30, 2011 and 2009 was $0.3 million and $0.6 million, respectively. The total intrinsic value of options exercised during the fiscal year ended April 30, 2010 was not significant. The fair value of options vested during the fiscal years ended April 30, 2011, 2010 and 2009 was $1.0 million, $2.3 million and $1.6 million, respectively. The Company has option grants for approximately 0.8 million shares expected to vest over the next year (weighted-average contractual remaining term). The weighted-average exercise price per share of those options expected to vest is $6.42 per share, with $2.4 million intrinsic value as of April 30, 2011.
The Company recognized stock option compensation expense primarily within Selling, general and administrative expenses of $1.3 million, $1.6 million and $2.0 million for the fiscal years ended April 30, 2011, 2010 and 2009, respectively.
103
A summary of stock option activity under the stock option plans for the fiscal year ended April 30, 2011 is set forth below:
|
Shares
(in thousands)
|
Weighted-
average
Exercise
Price
|
Weighted-
average
Remaining
Contractual
Term
|
Aggregate
Intrinsic
Value
(in millions)
|
||||||||||||
|
Outstanding as of April 30, 2010
|
2,028
|
$
|
9.41
|
5.0 years
|
$
|
0.8
|
|||||||||
|
Options granted
|
709
|
$
|
6.13
|
||||||||||||
|
Options exercised
|
(129
|
)
|
$
|
5.59
|
0.3
|
||||||||||
|
Options cancelled
|
(421
|
)
|
$
|
10.91
|
|||||||||||
|
Outstanding as of April 30, 2011
|
2,187
|
$
|
8.28
|
6.3 years
|
$
|
3.9
|
|||||||||
|
Options exercisable as of April 30, 2011
|
1,330
|
$
|
9.49
|
4.4 years
|
$
|
1.2
|
|||||||||
The majority of the current outstanding restricted stock grants vest one-fourth each year for the four-year period following the date of grant. During the restriction period, restricted stock awards entitle the holder to all rights of a holder of common shares, including dividend and voting rights. Unvested shares are restricted as to disposition and are subject to forfeiture under certain circumstances. The amount of compensation expense recognized for restricted stock awards, net of cancellations, was $2.8 million for the fiscal year ended April 30, 2011, $2.2 million for the fiscal year ended April 30, 2010 and $1.2 million for the fiscal year ended April 30, 2009.
Restricted stock award activity was as follows:
|
For the Fiscal Years Ended April 30,
|
||||||||||||
|
2011
|
2010
|
2009
|
||||||||||
|
Restricted stock awarded (shares in thousands)
|
95
|
662
|
767
|
|||||||||
|
Weighted-average fair value on date of grant per share
|
$
|
6.16
|
$
|
6.18
|
$
|
4.52
|
||||||
The following table summarizes the activity for the Company's nonvested shares of restricted stock during the fiscal year ended April 30, 2011:
|
In thousands except per share amounts
|
Shares
|
Weighted-average
Fair Value
|
||||||
|
Nonvested as of April 30, 2010
|
1,252
|
$
|
5.78
|
|||||
|
Granted
|
95
|
6.16
|
||||||
|
Vested
|
(480
|
)
|
6.38
|
|||||
|
Forfeited
|
(126
|
)
|
4.07
|
|||||
|
Nonvested as of April 30, 2011
|
741
|
$
|
5.97
|
|||||
As of April 30, 2011, there was $4.8 million of unrecognized compensation cost related to nonvested stock-based compensation arrangements granted under the Company's stock plans. That cost is expected to be recognized over a weighted-average period of 2.4 years.
104
Note 12. Accumulated Other Comprehensive Income (Loss)
The following table discloses the balance by classification within accumulated other comprehensive income (loss):
|
In thousands
|
Foreign Currency Translation Adjustment
|
Unrealized Gain (Loss) on Available for Sale Securities
|
Net Gain (Loss) on Derivative Instruments
|
Minimum Pension Liability Adjustment
|
Translation Impact on Debt Designated as Hedge of Investment in Subsidiary
|
Accumulated Other Comprehensive Income (Loss)
|
||||||||||||||||||
|
Balance as of April 30, 2008
|
$ | 26,121 | $ | (474 | ) | $ | --- | $ | (15,077 | ) | $ | --- | $ | 10,570 | ||||||||||
|
Fiscal 2009 activity
|
(25,709 | ) | 574 | (741 | ) | (1,973 | ) | --- | (27,849 | ) | ||||||||||||||
|
Balance as of April 30, 2009
|
412 | 100 | (741 | ) | (17,050 | ) | --- | (17,279 | ) | |||||||||||||||
|
Fiscal 2010 activity
|
10,453 | 590 | 440 | (3,585 | ) | --- | 7,898 | |||||||||||||||||
|
Balance as of April 30, 2010
|
10,865 | 690 | (301 | ) | (20,635 | ) | --- | (9,381 | ) | |||||||||||||||
|
Fiscal 2011 activity
|
8,238 | 130 | 301 | 831 | (54 | ) | 9,446 | |||||||||||||||||
|
Balance as of April 30, 2011
|
$ | 19,103 | $ | 820 | $ | --- | $ | (19,804 | ) | $ | (54 | ) | $ | 65 | ||||||||||
Note 13. Employee Benefit Plans
Pension Plans – The Company has a noncontributory qualified defined benefit pension plan, the Gerber Scientific, Inc. and Participating Subsidiaries Pension Plan (the "Qualified Plan"), covering employees in the United States. The Company also maintains a nonqualified defined benefit pension plan, the Gerber Scientific, Inc. Participating Subsidiaries Supplemental Pension Benefit Plan (the “Nonqualified Plan”) for certain employees in the United States. The Nonqualified Plan provides for pension benefits earned under the Company's primary pension plan benefit formula, payment of which is limited by income tax regulations. Benefit accruals under these plans were frozen as of April 30, 2009 and employees hired on or after May 1, 2004 are not eligible to participate in the Qualified Plan or the Nonqualified Plan.
Effective May 1, 2004, Qualified Plan benefits are based on an employee's months of service and average annual compensation during the employee's ten consecutive highest-paid years in the last ten calendar years of service, but no less than the benefit accrued as of April 30, 2004. Through April 30, 2004, Qualified Plan benefits were based on an employee's months of service and average annual compensation during the employee's five consecutive highest-paid years in the last ten calendar years of service. Compensation for this purpose includes salary and other compensation paid by the Company and reportable on Form W-2 and certain pre-tax elective contributions, but excludes fringe benefits (cash and noncash), including compensation related to stock option plans and certain other benefits and payments. Effective as of April 30, 2009, participants in the plans will not receive credit either for eligible earnings paid after that date or for any months of service worked after that date. Service credits for retirement eligibility continue in accordance with the terms of each plan. The Company issued restricted stock with an aggregate fair value of $0.9 million to most active employees in the Qualified Plan during the fiscal year ended April 30, 2009 as a result of the plan amendment in that fiscal year.
Pension arrangements for employees of foreign subsidiaries are provided generally through currently funded defined contribution plans and local insurance contracts. The Company maintains one international closed defined benefit plan in the United Kingdom with an unfunded status of approximately $0.1 million as of April 30, 2011.
The Company uses an April 30 measurement date for its pension plans.
105
The following table summarizes the obligations and funded status of the pension plans and the related amounts recognized in the Consolidated Balance Sheets as of April 30, 2011 and 2010:
|
Qualified Plan
|
Nonqualified Plan
|
|||||||||||||||
|
In thousands
|
2011
|
2010
|
2011
|
2010
|
||||||||||||
|
Change in benefit obligation:
|
||||||||||||||||
|
Benefit obligation at beginning of fiscal year
|
$
|
109,098
|
$
|
89,612
|
$
|
7,490
|
$
|
6,608
|
||||||||
|
Interest cost
|
6,191
|
6,335
|
419
|
459
|
||||||||||||
|
Actuarial loss
|
5,005
|
17,396
|
372
|
974
|
||||||||||||
|
Benefits paid
|
(4,476
|
)
|
(4,245
|
)
|
(541
|
)
|
(551
|
)
|
||||||||
|
Benefit obligation at end of fiscal year
|
$
|
115,818
|
$
|
109,098
|
$
|
7,740
|
$
|
7,490
|
||||||||
|
Change in plan assets:
|
||||||||||||||||
|
Fair value of plan assets at beginning of year
|
$
|
79,100
|
$
|
66,034
|
$
|
---
|
$
|
---
|
||||||||
|
Actual return on plan assets
|
12,277
|
17,311
|
---
|
---
|
||||||||||||
|
Employer contributions
|
501
|
---
|
541
|
551
|
||||||||||||
|
Benefits paid
|
(4,476
|
)
|
(4,245
|
)
|
(541
|
)
|
(551
|
)
|
||||||||
|
Fair value of plan assets at end of fiscal year
|
$
|
87,402
|
$
|
79,100
|
$
|
---
|
$
|
---
|
||||||||
|
Funded status
|
$
|
(28,416
|
)
|
$
|
(29,998
|
)
|
$
|
(7,740
|
)
|
$
|
(7,490
|
)
|
||||
|
Amounts recognized in balance sheets, before taxes:
|
||||||||||||||||
|
Other accrued liabilities
|
$
|
---
|
$
|
---
|
$
|
(563
|
)
|
$
|
(556
|
)
|
||||||
|
Accrued pension benefit liability
|
(28,416
|
)
|
(29,998
|
)
|
(7,177
|
)
|
(6,934
|
)
|
||||||||
|
Net amount recognized
|
$
|
(28,416
|
)
|
$
|
(29,998
|
)
|
$
|
(7,740
|
)
|
$
|
(7,490
|
)
|
||||
|
Amounts recognized in Accumulated Other Comprehensive Income (Loss), before taxes, consist of:
|
||||||||||||||||
|
Net actuarial loss
|
$
|
29,748
|
$
|
31,417
|
$
|
1,814
|
$
|
1,467
|
||||||||
Information for pension plans with accumulated benefit obligations in excess of plan assets was as follows as of April 30, 2011 and 2010:
|
Qualified Plan
|
Nonqualified Plan
|
|||||||||||||||
|
In thousands
|
2011
|
2010
|
2011
|
2010
|
||||||||||||
|
Projected benefit obligation and accumulated benefit obligation
|
$
|
115,818
|
$
|
109,098
|
$
|
7,740
|
$
|
7,490
|
||||||||
|
Fair value of plan assets
|
$
|
87,402
|
$
|
79,100
|
$
|
---
|
$
|
---
|
||||||||
The components of the net periodic benefit cost were as follows:
|
Qualified Plan
|
Nonqualified Plan
|
|||||||||||||||||||||||
|
For the Fiscal Years Ended April 30,
|
For the Fiscal Years Ended April 30,
|
|||||||||||||||||||||||
|
In thousands
|
2011
|
2010
|
2009
|
2011
|
2010
|
2009
|
||||||||||||||||||
|
Service cost
|
$
|
---
|
$
|
---
|
$
|
2,289
|
$
|
---
|
$
|
---
|
$
|
98
|
||||||||||||
|
Interest cost
|
6,191
|
6,335
|
6,622
|
419
|
459
|
458
|
||||||||||||||||||
|
Expected return on plan assets
|
(6,336
|
)
|
(5,264
|
)
|
(6,838
|
)
|
---
|
---
|
---
|
|||||||||||||||
|
Amortization of:
Prior service cost (credit)
|
---
|
---
|
296
|
---
|
---
|
(3
|
)
|
|||||||||||||||||
|
Actuarial loss
|
733
|
611
|
970
|
25
|
---
|
42
|
||||||||||||||||||
|
Curtailment loss (gain)
|
---
|
---
|
507
|
---
|
---
|
(32
|
)
|
|||||||||||||||||
|
Net periodic benefit cost
|
$
|
588
|
$
|
1,682
|
$
|
3,846
|
$
|
444
|
$
|
459
|
$
|
563
|
||||||||||||
106
Other changes in plan assets and benefit obligations recognized in other comprehensive income, pre-tax, were as follows for the fiscal years ended April 30, 2011 and 2010:
|
Qualified Plan
|
Nonqualified Plan
|
|||||||||||||||
|
In thousands
|
2011
|
2010
|
2011
|
2010
|
||||||||||||
|
Current year actuarial loss (gain)
|
$
|
(937
|
)
|
$
|
5,349
|
$
|
372
|
$
|
974
|
|||||||
|
Amortization of net actuarial loss
|
(733
|
)
|
(611
|
)
|
(25
|
)
|
---
|
|||||||||
|
Total recognized in other comprehensive income (loss)
|
$
|
(1,670
|
)
|
$
|
4,738
|
$
|
347
|
$
|
974
|
|||||||
The total amount recognized in net periodic benefit cost and other comprehensive income (loss) for the fiscal year ended April 30, 2011 was $1.1 million of income for the Qualified Plan and $0.8 million of loss for the Nonqualified Plan.
The estimated amount that will be amortized from Accumulated other comprehensive income (loss) into net periodic benefit cost in the fiscal year ending April 30, 2012 is as follows:
|
In thousands
|
Qualified Plan
|
Nonqualified Plan
|
||||||
|
Net actuarial loss
|
$
|
660
|
$
|
44
|
||||
The major assumptions used in determining the benefit obligation and net cost are presented in the following tables as weighted average rates. The rate of compensation increase is no longer relevant to benefit obligations or net cost as of April 30, 2009 and thereafter with the effect of the pension plan benefits freeze.
|
Qualified Plan
|
Nonqualified Plan
|
|||||||||||||||
|
Benefit Obligation Assumptions
|
2011
|
2010
|
2011
|
2010
|
||||||||||||
|
Discount rate
|
5.40
|
%
|
5.80
|
%
|
5.40
|
%
|
5.80
|
%
|
||||||||
|
Qualified Plan
|
Nonqualified Plan
|
|||||||||||||||||||||||
|
For the fiscal years ended April 30,
|
For the fiscal years ended April 30,
|
|||||||||||||||||||||||
|
Net Cost Assumptions
|
2011
|
2010
|
2009
|
2011
|
2010
|
2009
|
||||||||||||||||||
|
Discount rate
|
5.80
|
%
|
7.25
|
%
|
6.50
|
%
|
5.80
|
%
|
7.25
|
%
|
6.50
|
%
|
||||||||||||
|
Expected return on plan assets
|
8.25
|
%
|
8.25
|
%
|
8.25
|
%
|
---
|
---
|
---
|
|||||||||||||||
|
Rate of compensation increase
|
N/A
|
N/A
|
4.00
|
%
|
N/A
|
N/A
|
4.00
|
%
|
||||||||||||||||
The expected return on assets assumption was developed considering several factors. Such factors include current and expected target asset allocation, the Company's historical experience of returns by asset class type, a risk premium, an inflation estimate (weighted towards future expectations) and adjustments for anticipated or historical economic changes using a long-term investment horizon of expected future performance. The effects of asset diversification and periodic fund rebalancing were also considered.
107
The fair values of pension plan assets as of April 30, 2011, by asset category were as follows:
|
April 30, 2011
|
||||||||||||||||
|
In thousands
|
Total
|
Quoted
prices in
active
markets
(Level 1)
|
Significant
other
observable
inputs
(Level 2)
|
Significant
unobservable
inputs
(Level 3)
|
||||||||||||
|
Money market funds
|
$
|
651
|
$
|
651
|
$
|
---
|
$
|
---
|
||||||||
|
Equity securities
|
||||||||||||||||
|
U.S. equity securities
|
34,371
|
34,371
|
---
|
---
|
||||||||||||
|
Foreign equity securities
|
19,016
|
19,016
|
---
|
---
|
||||||||||||
|
Fixed income securities
|
||||||||||||||||
|
Government securities
|
10,249
|
10,249
|
---
|
---
|
||||||||||||
|
U.S. corporate bonds
|
13,327
|
13,327
|
---
|
---
|
||||||||||||
|
Foreign bonds
|
6,655
|
6,655
|
---
|
---
|
||||||||||||
|
Real estate mutual fund
|
3,133
|
3,133
|
---
|
---
|
||||||||||||
|
Total
|
$
|
87,402
|
$
|
87,402
|
$
|
---
|
$
|
---
|
||||||||
The fair values of pension plan assets as of April 30, 2010, by asset category were as follows:
|
April 30, 2010
|
||||||||||||||||
|
In thousands
|
Total
|
Quoted
prices in
active
markets
(Level 1)
|
Significant
other
observable
inputs
(Level 2)
|
Significant
unobservable
inputs
(Level 3)
|
||||||||||||
|
Cash and cash equivalents
|
$
|
27
|
$
|
27
|
$
|
---
|
$
|
---
|
||||||||
|
Money market funds
|
964
|
964
|
---
|
---
|
||||||||||||
|
Equity securities
|
||||||||||||||||
|
U.S. equity securities
|
30,778
|
30,778
|
---
|
---
|
||||||||||||
|
Foreign equity securities
|
10,324
|
10,324
|
---
|
---
|
||||||||||||
|
Global equity securities
|
2,105
|
2,105
|
---
|
---
|
||||||||||||
|
Fixed income securities
|
||||||||||||||||
|
Government securities
|
12,100
|
12,100
|
---
|
---
|
||||||||||||
|
U.S. corporate bonds
|
16,512
|
16,512
|
---
|
---
|
||||||||||||
|
Foreign corporate bonds
|
541
|
541
|
---
|
---
|
||||||||||||
|
Real estate mutual fund
|
5,749
|
5,749
|
---
|
---
|
||||||||||||
|
Total
|
$
|
79,100
|
$
|
79,100
|
$
|
---
|
$
|
---
|
||||||||
As of April 30, 2011, the Company was primarily invested in mutual funds with underlying investments in the categories listed above. The overall strategy of the Qualified Plan is to have a diverse portfolio that reasonably spans established risk and return levels, preserves liquidity and is designed to achieve an acceptable rate of return based on the investments' risk profiles. The strategy allows for a moderate risk approach in order to achieve greater long-term asset growth. The Qualified Plan's asset allocation is designed to provide diversification among various asset classes. The Company's target allocation is 50 percent to 70 percent in equity securities and 30 percent to 50 percent in fixed income securities.
108
The Company's weighted-average asset allocations as of April 30, 2011 and 2010 by major asset category, for the Qualified Plan were as follows:
|
2011
|
2010
|
|||||||
|
Equity securities
|
60
|
%
|
55
|
%
|
||||
|
Fixed income securities
|
35
|
%
|
37
|
%
|
||||
|
Real estate
|
4
|
%
|
7
|
%
|
||||
|
Other (primarily money market funds)
|
1
|
%
|
1
|
%
|
||||
|
100
|
%
|
100
|
%
|
|||||
The Company expects to contribute $4.2 million to the Qualified Plan and $0.6 million to the Nonqualified Plan in the fiscal year ending April 30, 2012.
The following benefit payments, which reflect expected future service, are expected to be paid for the Qualified Plan and the Nonqualified Plan:
|
In thousands
|
Qualified Plan
|
Nonqualified Plan
|
||||||
|
Fiscal Year 2012
|
$
|
5,032
|
$
|
563
|
||||
|
Fiscal Year 2013
|
$
|
5,372
|
$
|
569
|
||||
|
Fiscal Year 2014
|
$
|
5,573
|
$
|
577
|
||||
|
Fiscal Year 2015
|
$
|
5,823
|
$
|
597
|
||||
|
Fiscal Year 2016
|
$
|
6,123
|
$
|
596
|
||||
|
Fiscal Years 2017-2021
|
$
|
34,107
|
$
|
2,963
|
||||
401(k) Plan – Under the Gerber Scientific, Inc. and Participating Subsidiaries 401(k) Maximum Advantage Program and Trust, employees in the United States may contribute a portion of their compensation to a tax-deferred 401(k) plan. The Company typically contributes an amount equal to a specified percentage of each employee's contribution up to an annual maximum Company contribution per participant. The Company temporarily suspended the elective Company matching contributions during a portion of the fiscal years ended April 30, 2011 and 2009 and during all of the fiscal year ended April 30, 2010. The Company's expense for matching contributions was $0.1 million and $0.9 million for the fiscal years ended April 30, 2011 and 2009, respectively.
Note 14. Restructuring and Other Expenses
In the fiscal year ended April 30, 2011 the Company recorded restructuring and other expenses of $8.6 million. The restructuring charges consisted of three distinct actions involving (1) the relocation of Apparel and Industrial product line from Massachusetts to Connecticut, (2) the discontinuation of the production of Sign Making and Specialty Graphics UV flatbed printers and (3) plans for moving the Apparel and Industrial Denmark manufacturing plant to China. The other expenses included severance costs associated with a general reduction in force, asset impairment charges and strategic expenses.
In the fiscal year ended April 30, 2010, the Company recorded restructuring and other expenses of $3.2 million that consisted of approximately $1.7 million of employee separation charges, $0.6 million in strategic expenses, $0.5 million of acquisition costs and $0.4 million for patent impairment expenses.
In the fiscal year ended April 30, 2009, the Company recorded restructuring and other expenses of $1.0 million that consisted of $1.8 million of severance, $0.1 million for patent impairment expenses and a benefit of $0.9 million for the reversal of a previously established leased facility restructuring reserve.
Fiscal 2011 Actions – The Apparel and Industrial segment incurred $3.4 million of severance costs, $0.4 million of factory-related move costs and $0.2 million of consulting charges related to facility relocation plans. These expenses were primarily incurred as a result of the relocation of a Massachusetts production facility into an existing Connecticut production facility, which was complete as of April 30, 2011, and severance costs related to the relocation of the manufacture of computer-automated material spreading systems from Denmark to China, which will be substantially paid as of April 30, 2012. The United States facility consolidation plan is expected to result in annual savings of approximately $0.9 million as a result of lower annual rent and other building costs. The Denmark relocation plan is expected to result in annual savings of approximately $2.0
109
million as a result of lower rent and other building costs, lower material costs and lower labor costs, beginning in the fiscal year ending April 30, 2013.
The Sign Making and Specialty Graphics segment approved and committed to a plan to discontinue the manufacturing of its product line of UV flatbed inkjet printers, including the Gerber CAT UV and Solara ion, during the fiscal year ended April 30, 2011. These products were manufactured by GSP, a business unit of the Sign Making and Specialty Graphics segment. The Company will continue to service the product line and sell related aftermarket materials. In connection with this action, the Company recorded severance expense of approximately $1.1 million. The Sign Making and Specialty Graphics segment also recorded an additional $0.4 million for other severance actions. The Company expects to complete related cash expenditures by April 30, 2012.
Also included in restructuring and other expenses is $1.2 million of non-cash fixed asset impairment charges related to the discontinued product line. During the fiscal year ended April 30, 2011, the Company evaluated the expected future benefit of several patents as a compared with anticipated ongoing patent maintenance fees, elected to abandon several patents and recorded expense of $0.8 million associated with the abandonment. Corporate unallocated company-wide expenses included the asset impairment charges of $2.0 million and professional fees of $1.1 million related to strategic initiatives for the fiscal year ended April 30, 2011.
The following table shows a rollforward of the severance accruals established during the fiscal year ended April 30, 2011 by segment:
|
In thousands
|
2011
|
|||
|
Sign Making and Specialty Graphics
|
||||
|
Severance expenses
|
$
|
1,540
|
||
|
Cash payments
|
(316
|
)
|
||
|
Ending balance at April 30, 2011
|
$
|
1,224
|
||
|
Apparel and Industrial
|
||||
|
Severance expenses
|
3,422
|
|||
|
Cash payments
|
(622
|
)
|
||
|
Ending balance at April 30, 2011
|
$
|
2,800
|
||
Fiscal 2010 Actions - During the fiscal year ended April 30, 2010, the Company terminated service of certain employees that became redundant with the Yunique acquisition. Fees related to the Yunique acquisition are also classified as Restructuring and other expenses on the accompanying Consolidated Statements of Operations and were paid in full by April 30, 2010. The Company also eliminated certain finance and other positions as a result of business process improvement initiatives and the outsourcing of certain functions.
110
The following table shows a rollforward of the severance accruals established during the fiscal year ended April 30, 2010 by segment through April 30, 2011:
|
In thousands
|
2010
|
|||
|
Sign Making and Specialty Graphics
|
||||
|
Severance expenses
|
$
|
231
|
||
|
Cash payments
|
---
|
|||
|
Ending balance at April 30, 2010
|
231
|
|||
|
Cash payments
|
(231
|
)
|
||
|
Ending balance at April 30, 2011
|
$
|
---
|
||
|
Apparel and Industrial
|
||||
|
Severance expenses
|
$
|
639
|
||
|
Cash payments
|
(362
|
)
|
||
|
Ending balance at April 30, 2010
|
277
|
|||
|
Cash payments
|
(277
|
)
|
||
|
Ending balance at April 30, 2011
|
$
|
---
|
||
|
Corporate
|
||||
|
Severance expenses
|
$
|
854
|
||
|
Cash payments
|
(504
|
)
|
||
|
Ending balance at April 30, 2010
|
350
|
|||
|
Cash payments
|
(292
|
)
|
||
|
Ending balance at April 30, 2011
|
$
|
58
|
||
Fiscal 2009 Actions – During the fiscal year ended April 30, 2009, the Company eliminated several positions and reduced its global workforce as a result of general economic conditions and incurred severance expenses. Also during the fiscal year ended April 30, 2009, the Company completed facility rationalization plans for its Connecticut locations and determined that it would reoccupy a previously vacated leased facility. This determination resulted in the reversal of a previously established leased facility restructuring reserve and resulted in a $0.9 million benefit.
The following table displays a rollforward of the severance accruals of $1.8 million established during the fiscal year ended April 30, 2009 by segment through April 30, 2011:
|
In thousands
|
2009
|
|||
|
Sign Making and Specialty Graphics
|
||||
|
Severance expenses
|
$
|
690
|
||
|
Cash payments
|
(669
|
)
|
||
|
Ending balance at April 30, 2009
|
21
|
|||
|
Cash payments
|
(21
|
)
|
||
|
Ending balance at April 30, 2010 and 2011
|
$
|
---
|
||
|
Apparel and Industrial
|
||||
|
Severance expenses
|
$
|
1,026
|
||
|
Cash payments
|
(949
|
)
|
||
|
Ending balance at April 30, 2009
|
77
|
|||
|
Cash payments
|
(77
|
)
|
||
|
Ending balance at April 30, 2010 and 2011
|
$
|
---
|
||
|
Corporate
|
||||
|
Severance expenses
|
$
|
41
|
||
|
Cash payments
|
(41
|
)
|
||
|
Ending balance at April 30, 2009, 2010 and 2011
|
$
|
---
|
||
111
Note 15. Guarantees
Warranty – A limited warranty is provided on certain of the Company's products for periods ranging from 90 days to one year and allowances for estimated warranty costs are recorded during the period of sale.
The following is a reconciliation of the beginning and ending balances of the Company's accrued standard warranty liability for the fiscal years ended April 30, 2011 and 2010, which are included in Other liabilities on the accompanying Consolidated Balance Sheets:
|
For the Fiscal Years Ended April 30,
|
||||||||
|
In thousands
|
2011
|
2010
|
||||||
|
Beginning balance
|
$
|
2,250
|
$
|
2,815
|
||||
|
Warranties issued in the current period
|
2,843
|
5,155
|
||||||
|
Impact of business dispositions (See Note 19)
|
(368
|
)
|
(574
|
)
|
||||
|
Reductions for costs incurred
|
(2,980
|
)
|
(5,146
|
)
|
||||
|
Ending balance
|
$
|
1,745
|
$
|
2,250
|
||||
The Company incurred additional costs of $0.3 million and $0.5 million for the fiscal years ended April 30, 2011 and 2010, respectively, under extended warranty contracts.
Financing Arrangements – The Company has an agreement with a major financial services institution to assist customers in obtaining lease financing to purchase the Company's equipment. The financial services institution is the lessor and the customer is the lessee. These leases typically have terms ranging from two to six years. As of April 30, 2011, the amount of lease receivables financed under these agreements between the external financial services institution and the lessees was $1.2 million. The Company's net exposure related to recourse provisions under these agreements was approximately $0.7 million as of April 30, 2011. The equipment sold collateralizes the lease receivables. In the event of default by the lessee, the Company has the liability to the financial services institution under recourse provisions once the institution repossesses the equipment from the lessee and returns it to the Company. In most cases, the Company then can resell the equipment, the proceeds of which are expected to substantially cover a majority of the liability to the financial services institution. As of April 30, 2011, the undiscounted accrual for expected losses under recourse provisions was not significant and as of April 30, 2010, the undiscounted accrual for the expected losses under recourse provisions was $0.4 million.
Letter of Credit – As of April 30, 2011, the Company had a $1.0 million outstanding letter of credit with a financial institution that expires annually. This letter of credit is maintained as security for an insurance company.
Guarantees of Debt – As of April 30, 2011, certain subsidiaries of Gerber were guarantors of the Company's Credit Agreement. See Note 9. The guarantors are required to fulfill Gerber’s obligations over the life of the Credit Agreement, if Gerber fails to pay any portion of the outstanding debt when due. Outstanding borrowings under the Credit Agreement were $21.1 million and $45.0 million as of April 30, 2011 and 2010, respectively.
Note 16. Fair Value Measurements
Fair value guidance for the accounting of both financial assets and liabilities and nonrecurring nonfinancial assets and liabilities is part of ASC 820, Fair Value Measurements and Disclosures (“ASC 820”). ASC 820 was adopted by the Company on May 1, 2008 for its financial assets and financial liabilities and on May 1, 2009 for its nonrecurring nonfinancial assets and liabilities. ASC 820 defines fair value, establishes a framework for measuring fair value and expands related disclosure requirements. Nonrecurring nonfinancial assets and liabilities for the Company included those measured at fair value in goodwill impairment testing, asset retirement obligations initially measured at fair value and nonrecurring nonfinancial assets and liabilities initially measured at fair value in a business combination.
ASC 820 defines fair value as the price that would be received to sell an asset or paid to transfer a liability in an orderly business transaction in the principal market for the asset or liability.
ASC 820 establishes a hierarchy of inputs used to measure fair value as Level 1, 2 and 3, as described in the following table,
112
which provides assets and liabilities reported at fair value and measured on a recurring basis as of April 30:
|
April 30, 2011
|
||||||||||||||||
|
In thousands
|
Total
|
Quoted
prices in
active
markets
(Level 1)
|
Significant
other
observable
inputs
(Level 2)
|
Significant
unobservable
inputs
(Level 3)
|
||||||||||||
|
Available for sale investments
|
$
|
3,694
|
$
|
3,694
|
$
|
---
|
$
|
---
|
||||||||
|
Estimated fair value of contingent consideration
|
(3,242
|
)
|
---
|
---
|
(3,242
|
)
|
||||||||||
|
Estimated fair value for lease liability guarantee
|
(700
|
)
|
---
|
---
|
(700
|
)
|
||||||||||
|
Total
|
$
|
(248
|
)
|
$
|
3,694
|
$
|
---
|
$
|
(3,942
|
)
|
||||||
|
April 30, 2010
|
||||||||||||||||
|
In thousands
|
Total
|
Quoted
prices in
active
markets
(Level 1)
|
Significant
other
observable
inputs
(Level 2)
|
Significant
unobservable
inputs
(Level 3)
|
||||||||||||
|
Available for sale investments
|
$
|
3,806
|
$
|
3,806
|
$
|
---
|
$
|
---
|
||||||||
|
Interest rate swap agreements
|
(479
|
)
|
---
|
(479
|
)
|
---
|
||||||||||
|
Estimated fair value of contingent consideration
|
(3,174
|
)
|
---
|
---
|
(3,174
|
)
|
||||||||||
|
Estimated fair value for lease liability guarantee
|
(700
|
)
|
---
|
---
|
(700
|
)
|
||||||||||
|
Total
|
$
|
(547
|
)
|
$
|
3,806
|
$
|
(479
|
)
|
$
|
(3,874
|
)
|
|||||
The fair values for the available for sale investments were based on quoted market prices unadjusted from financial exchanges (Level 1), except for preferred shares in an international private company, for which the fair value was based upon Level 3 evidence and determined to be insignificant. The available for sale investments were primarily composed of investments in a balanced United States mutual fund. The interest rate swap agreements were valued using observable current market information as of the reporting date, such as the prevailing LIBOR-based currency spot and forward rates (Level 2). There were no transfers between level 1 and level 2 categories during the fiscal year ended April 30, 2011 or 2010.
In connection with the acquisition of Yunique (see Note 5), a liability was recognized for the Company’s estimate of the fair value of contingent consideration on the acquisition date based on probability-based forecasted revenue. Any change in fair value of the contingent consideration subsequent to the acquisition date will be recognized in the statement of operations. This fair value measurement is based on significant inputs not observed in the market and thus represents a Level 3 measurement. Level 3 instruments are valued based on unobservable inputs that are supported by little or no market activity and reflect the Company’s own assumptions concerning future revenue of Yunique in measuring fair value. A change in the estimated probabilities of revenue achievement could have a material effect on the statement of operations and balance sheets in the period of change. The fair value increased $0.1 million during the fiscal year ended April 30, 2011 to reflect the time value of money and was offset by changes in expected payments based on forecasted performance. There were no changes to the level 3 liability during the fiscal year ended April 30, 2010.
In connection with the sale of ND Graphics, the Company remained a guarantor under a lease for ND Graphic’s headquarters facility in Toronto, Canada. This lease expires during the fiscal year ending April 30, 2018. The remaining undiscounted monthly lease payments were $2.3 million as of the sale date. The fair value of this liability of $0.7 million was recorded in Other long-term liabilities on the accompanying Consolidated Balance Sheets and was estimated using a probability-based discounted cash flow analysis for the probability of non-performance by ND Graphics. As of April 30, 2011, there was no existing default or indication of a prospective default by ND Graphics under the lease. There were no changes to the level 3 liability during the fiscal years ended April 30, 2011 or 2010.
The above fair values were computed based on quoted market prices or an estimate of the amount received or paid to terminate or settle the agreement, as applicable. The fair values of cash and cash equivalents, accounts receivable, accounts payable and accrued expenses approximate the carrying amounts due to their short-term nature. All of the Company’s outstanding debt
113
accrues interest at variable interest rates. As the underlying interest rates are believed to represent market rates, the carrying amounts are considered to approximate fair value.
Note 17. Segment Reporting
Subsequent to the sale of the Gerber Coburn Unit in the fiscal year ended April 30, 2011, the Company's operations are classified into two reportable operating segments: the Sign Making and Specialty Graphics segment and the Apparel and Industrial segment. The Sign Making and Specialty Graphics reportable operating segment is composed of the Gerber Scientific Products and Spandex business units. During the fiscal year ended April 30, 2011, management realigned the GI business under the Apparel and Industrial segment and reclassified all segment reporting of GI from the GSP business unit of the Sign Making and Specialty Graphics segment to the Apparel and Industrial segment. The management realignment of the GI business was executed for expected synergies from the integration of GI manufacturing into a Connecticut manufacturing facility, which is primarily used for Apparel and Industrial segment production needs, as well as for other benefits to the GI business of sharing the Apparel and Industrial segment service organization.
The Unallocated costs included in segment operating income represent overhead costs previously allocated to the Ophthalmic Lens Processing segment. The Gerber Coburn Unit was sold on December 31, 2010 and was historically included in the Ophthalmic Lens Processing segment. The historical disclosures do not reflect any adjustments for planned overhead and administrative expense reductions arising as a result of the asset sale.
Corporate operating expenses include expenses of the corporate general management, legal, finance and internal audit staffs and public company compliance costs. Corporate unallocated company-wide expenses include company-wide stock-based compensation costs, strategic expenses, incentive compensation costs, insurance costs, pension expense for the U.S. frozen defined benefit plans, and asset impairment charges.
Financial data for the fiscal years ended April 30, 2011, 2010 and 2009 for the Company's reportable segments are shown in the following tables. The accounting policies of the reportable segments are substantially identical to those described in the summary of significant accounting policies (see Note 1). The effects of material intrasegment and intersegment transactions have been eliminated. Asset information by reportable segment is not accumulated and disclosed, as it is not reported to the Company's Chief Executive Officer and is not used internally.
|
For the Fiscal Years Ended April 30,
|
||||||||||||
|
In thousands
|
2011
|
2010
|
2009
|
|||||||||
|
Revenue:
|
||||||||||||
|
Sign Making and Specialty Graphics:
|
||||||||||||
|
Gerber Scientific Products
|
$
|
37,922
|
$
|
36,032
|
$
|
48,004
|
||||||
|
Spandex
|
228,063
|
211,981
|
224,960
|
|||||||||
|
Sign Making and Specialty Graphics
|
265,985
|
248,013
|
272,964
|
|||||||||
|
Apparel and Industrial
|
196,546
|
165,226
|
172,421
|
|||||||||
|
Intersegment revenue elimination
|
(10
|
)
|
(972
|
)
|
---
|
|||||||
|
Consolidated revenue
|
$
|
462,521
|
$
|
412,267
|
$
|
445,385
|
||||||
|
Operating (loss) income:
|
||||||||||||
|
Sign Making and Specialty Graphics:
|
||||||||||||
|
Gerber Scientific Products
|
$
|
(13,520
|
)
|
$
|
(5,486
|
)
|
$
|
(1,060
|
)
|
|||
|
Spandex
|
18,998
|
12,461
|
10,459
|
|||||||||
|
Sign Making and Specialty Graphics
|
5,478
|
6,975
|
9,399
|
|||||||||
|
Apparel and Industrial
|
17,936
|
18,289
|
15,334
|
|||||||||
|
Unallocated
|
(2,577
|
)
|
(3,142
|
)
|
(2,884
|
)
|
||||||
|
Segment operating income
|
20,837
|
22,122
|
21,849
|
|||||||||
|
Corporate operating expenses
|
(8,873
|
)
|
(9,315
|
)
|
(10,901
|
)
|
||||||
|
Corporate unallocated company-wide expenses
|
(16,421
|
)
|
(10,809
|
)
|
(10,480
|
)
|
||||||
|
Consolidate operating (loss) income
|
$
|
(4,457
|
)
|
$
|
1,998
|
$
|
468
|
|||||
Revenue by geographic area for the fiscal years ended April 30, 2011, 2010, and 2009 and net property, plant and equipment by geographic area as of April 30, 2011, 2010 and 2009 are shown in the table below. Revenue was attributed to specific countries
114
based on the shipment destination.
|
In thousands
|
United States
|
Europe
|
All Other
|
Total
|
||||||||||||
|
2011
|
||||||||||||||||
|
Revenue
|
$
|
120,194
|
$
|
227,822
|
$
|
114,505
|
$
|
462,521
|
||||||||
|
Property, plant and equipment
|
$
|
15,336
|
$
|
13,696
|
$
|
1,684
|
$
|
30,716
|
||||||||
|
2010
|
||||||||||||||||
|
Revenue
|
$
|
106,522
|
$
|
210,743
|
$
|
95,002
|
$
|
412,267
|
||||||||
|
Property, plant and equipment
|
$
|
17,574
|
$
|
12,847
|
$
|
1,802
|
$
|
32,223
|
||||||||
|
2009
|
||||||||||||||||
|
Revenue
|
$
|
137,412
|
$
|
233,874
|
$
|
74,099
|
$
|
445,385
|
||||||||
|
Property, plant and equipment
|
$
|
19,020
|
$
|
15,101
|
$
|
2,998
|
$
|
37,119
|
||||||||
Note 18. Commitments and Contingencies
Leases – The Company occupies space and uses machinery and equipment under operating lease arrangements. The Company is not the lessee under any material capital leases as of April 30, 2011. See Note 20. Rental expense under minimum lease commitments was $12.0 million, $12.8 million and $13.2 million for the fiscal years ended April 30, 2011, 2010 and 2009, respectively.
Minimum annual rental commitments as of April 30, 2011 under long-term noncancelable operating leases were:
|
In thousands
|
Building and
Office Space
|
Machinery and
Equipment
|
Total
|
|||||||||
|
2012
|
$
|
9,968
|
$
|
1,666
|
$
|
11,634
|
||||||
|
2013
|
8,686
|
1,195
|
9,881
|
|||||||||
|
2014
|
7,509
|
676
|
8,185
|
|||||||||
|
2015
|
6,091
|
250
|
6,341
|
|||||||||
|
2016
|
4,665
|
71
|
4,736
|
|||||||||
|
After 2017
|
9,525
|
---
|
9,525
|
|||||||||
|
$
|
46,444
|
$
|
3,858
|
$
|
50,302
|
|||||||
Future minimum rentals to be received under noncancelable subleases totaled $6.6 million as of April 30, 2011.
The Company has two significant operating leases for facilities located in Connecticut and the United Kingdom. Each lease was originated under a sale-leaseback transaction. The Connecticut lease is a 17-year lease, entered into in the fiscal year ended April 30, 2002, and the United Kingdom lease is a 15-year lease, entered into in the fiscal year ended April 30, 2001. The United Kingdom lease contains a rent escalation feature that is accounted for on a straight-line basis over the contractual term of the lease. The Connecticut lease was amended in the fiscal year ended April 30, 2011. See Note 20.
In connection with the sale of ND Graphics, the Company remained a guarantor under a lease for ND Graphic’s headquarters facility in Toronto, Canada. This lease expires during the fiscal year ending April 30, 2018. The remaining undiscounted monthly lease payments were $2.3 million as of the sale date. The fair value of this liability of $0.7 million was recorded in Other long-term liabilities on the accompanying Consolidated Balance Sheets. The fair value of the $0.7 million liability was estimated using a probability based discounted cash flow analysis for the probability of non-performance by ND Graphics. The Company also holds a $1.0 million letter of credit to which the Company has immediate access in the event of default by ND Graphics under that lease. The Company has recorded this letter of credit as an asset for $0.7 million in Other assets on the accompanying Consolidated Balance Sheets. As of April 30, 2011, there was no existing default or indication of a prospective default by ND Graphics under the lease.
Litigation matters – The Company is subject to governmental audits and proceedings and various claims and litigation relating to matters incidental to its business. While the outcome of current pending matters cannot be predicted definitively,
115
management, after reviewing such matters and claims and consulting with the Company's internal and external counsel and considering any applicable insurance coverage, does not believe that the ultimate resolution of any current pending claims or litigation will have a material adverse impact on the Company's consolidated financial position, results of operations, cash flows, liquidity or competitive position.
The Company is presently prosecuting an action for infringement of U.S. Patent 5,537,135 (a computerized “print to cut” technology patent) in Hartford, Connecticut Federal District Court against Roland DG Corporation, Hamamatsu, Japan and Roland DGA Corporation, Los Angeles, California, the distribution and sales arm of Roland DG Corporation. The Company is seeking damages and an injunction against Roland's sale of infringing products. The law suit is currently scheduled for trial in June 2012. There can be no assurance that this action or future actions relating to this patent will result in damage awards or licenses.
Note 19. Discontinued Operations
Fiscal Year Ended April 30, 2011
On December 31, 2010, the Company completed the sale (the “Asset Sale”) of substantially all of the assets, properties, rights and interests primarily or solely related to the ophthalmic lens processing unit, the Gerber Coburn Unit, pursuant to an Asset Purchase Agreement, dated as of December 2, 2010, among the Company, Coburn Technologies, Inc. (the “Buyer”) and Edward G. Jepsen, as Guarantor. The Gerber Coburn Unit was engaged in the business of designing, manufacturing, marketing and providing computer-integrated lens processing systems to retail outlets, eye-care professionals and independent lens production laboratories and supplying spare parts and consumables and servicing such systems.
The aggregate consideration for the sale consisted of a cash purchase price of $21.0 million for the assets of the Gerber Coburn Unit (the “Purchase Price”), of which $0.6 million was allocated to consideration for transition services to be provided to the Buyer at no charge for the first four months following the sale. The Buyer also assumed specified liabilities of the Gerber Coburn Unit. The net proceeds of the Asset Sale were approximately $18.9 million, which the Company used to repay the principal amount of loans outstanding under its senior secured revolving credit facility. The Company recognized a net gain of $0.5 million upon the completion of the sale, net of transaction expenses.
On December 31, 2010, the Company entered into a transition services agreement with the Buyer pursuant to which the Company will provide the Buyer with post-closing administrative and operating support services for specified fees, except for certain services that will be provided free of charge to the Buyer for 120 days after the closing date. The estimated fair value of the transition services that the Company will provide to the Buyer free of charge is $0.6 million. In addition, on December 31, 2010, the Buyer agreed to sublease from the Company a manufacturing and office facility in Connecticut. The sublease has a five-year initial term, with two optional, one-year extensions. Quarterly rental payments of $0.1 million will be adjusted based on annual CPI increases (but not decreases) beginning on January 1, 2012, but such increases may not exceed four percent in any year. The expected cash inflows from the transition services agreement and sublease are not expected to be significant as a percentage of the Company’s consolidated results.
Edward G. Jepsen, the chief executive officer and controlling shareholder of the Buyer and a party to the Asset Purchase Agreement, was formerly a Director of Gerber and most recently a member and chair of the Company’s Audit and Finance Committee and a member of its Management Development and Compensation Committee. Upon the execution of the Asset Purchase Agreement, and effective as of December 2, 2010, Mr. Jepsen resigned from the Board of Directors of the Company and all committees of the Board of Directors on which he was then serving.
Alex F. Incera, a former executive officer of Gerber and President of the Gerber Coburn Unit, and other executives of the Gerber Coburn Unit have advised the Company that they are shareholders of the Buyer and continue to serve in executive capacities with the Gerber Coburn Unit following the Asset Sale.
116
Fiscal Year Ended April 30, 2010
On September 1, 2009, the Company sold 100 percent of the capital stock of FOBA for a net sales price of approximately $8.8 million, net of transaction fees. FOBA was acquired in October 2008 as part of the acquisition of Virtek. Sales proceeds of approximately $0.9 million will remain in escrow for a two-year period for possible application to specified contingencies. A gain on sale of $1.7 million was included on the accompanying Consolidated Statements of Operations within Loss from discontinued operations for the fiscal year ended April 30, 2010.
On September 30, 2009, the Company sold substantially all of the assets and liabilities of ND Graphics for a net sales price of approximately $5.3 million, net of transaction fees. A loss on sale of $3.2 million was included on the accompanying Consolidated Statement of Operations within Loss from discontinued operations for the fiscal year ended April 30, 2010. ND Graphics will continue to serve as the Company’s Canadian distributor for its Sign Making and Specialty Graphics segment. The Company expects some continuing cash flows, primarily from sales of equipment and aftermarket supplies to ND Graphics, although these cash flows are not expected to be significant enough to preclude discontinued operations accounting.
The Company closed the majority of its Spandex Poland and Spandex New Zealand operations during the fiscal year ended April 30, 2010. The results of these businesses were previously reported within the Sign Making and Specialty Graphics segment. The Company also closed the majority of its Gerber Coburn Australia operations during the fiscal year ended April 30, 2010. The results of this business were previously reported within the Ophthalmic Lens Processing segment. The Company has reported the results of operations of these three businesses as discontinued operations for the fiscal years ended April 30, 2011, 2010 and 2009 within the consolidated financial statements. The Company expects some continuing cash flow from these operations, primarily related to service contracts on prior equipment sales. These cash flows are not expected to be significant enough to preclude discontinued operations accounting.
Interest Allocations
Net proceeds from the sales transactions were used to reduce the Company’s outstanding debt. The Company allocated a portion of its interest expense to discontinued operations, as the proceeds from the sales were required to reduce the Company’s outstanding obligations under its credit facility. The Company allocated $0.8 million of interest expense to discontinued operations for the fiscal year ended April 30, 2011, $1.6 million of interest expense for the fiscal year ended April 30, 2010 and $1.6 million for the fiscal year ended April 30, 2009.
Historical Results
The following table provides revenue and pretax (loss) income from the Gerber Coburn discontinued operations. The fiscal year ended April 30, 2011 included a $16.9 million non-cash goodwill impairment charge:
|
For the Fiscal Year Ended April 30,
|
||||||||||||
|
In thousands
|
2011
|
2010
|
2009
|
|||||||||
|
Revenue from discontinued operations
|
$
|
29,636
|
$
|
46,088
|
$
|
53,555
|
||||||
|
Pretax (loss) income from discontinued operations
|
$
|
(16,394
|
)
|
$
|
3,452
|
$
|
5,005
|
|||||
117
The following table provides a summary of the assets and liabilities of the Gerber Coburn discontinued operations that were sold as of December 31, 2010:
|
In thousands
|
December 31, 2010
|
|||
|
Assets:
|
||||
|
Accounts receivable, net
|
$ | 8,347 | ||
|
Inventories
|
11,210 | |||
|
Prepaid expenses and other current assets
|
253 | |||
|
Total current assets
|
19,810 | |||
|
Property, plant and equipment, net
|
941 | |||
|
Other assets
|
985 | |||
|
Total assets
|
$ | 21,736 | ||
|
Liabilities:
|
||||
|
Accounts payable
|
$ | 2,696 | ||
|
Accrued compensation and benefits
|
419 | |||
|
Other liabilities
|
793 | |||
|
Deferred tax liabilities, net
|
546 | |||
|
Deferred revenue
|
396 | |||
|
Total liabilities
|
4,850 | |||
|
Net assets
|
$ | 16,886 | ||
The following table provides revenue and pretax (loss) income from the FOBA discontinued operations:
|
For the Fiscal Year Ended April 30,
|
||||||||||||
|
In thousands
|
2011
|
2010
|
2009
|
|||||||||
|
Revenue from discontinued operations
|
$
|
---
|
$
|
5,973
|
$
|
11,601
|
||||||
|
Pretax (loss) income from discontinued operations
|
$
|
(97
|
)
|
$
|
597
|
$
|
(1,089
|
)
|
||||
The following table provides a summary of the assets and liabilities of FOBA as of September 1, 2009 that were sold:
|
In thousands
|
September 1, 2009
|
|||
|
Assets:
|
||||
|
Accounts receivable, net
|
$ | 3,069 | ||
|
Inventories
|
3,848 | |||
|
Prepaid and other assets
|
66 | |||
|
Total current assets
|
6,983 | |||
|
Property, plant and equipment, net
|
1,336 | |||
|
Total assets
|
$ | 8,319 | ||
|
Liabilities:
|
||||
|
Accounts payable
|
$ | 1,142 | ||
|
Accrued compensation and benefits
|
488 | |||
|
Other accrued liabilities
|
1,577 | |||
|
Other liabilities
|
229 | |||
|
Total liabilities
|
$ | 3,436 | ||
|
Net assets
|
$ | 4,883 | ||
118
The following table provides revenue and pretax loss from the ND Graphics discontinued operations:
|
For the Fiscal Year Ended April 30,
|
||||||||||||
|
In thousands
|
2011
|
2010
|
2009
|
|||||||||
|
Revenue from discontinued operations
|
$
|
---
|
$
|
13,901
|
$
|
32,252
|
||||||
|
Pretax loss from discontinued operations
|
$
|
(74
|
)
|
$
|
(3,427
|
)
|
$
|
(115
|
)
|
|||
The following table provides a summary of the assets and liabilities of ND Graphics as of September 30, 2009 that were sold:
|
In thousands
|
September 30, 2009
|
|||
|
Assets:
|
||||
|
Accounts receivable, net
|
$ | 4,413 | ||
|
Inventories
|
4,579 | |||
|
Prepaid and other assets
|
174 | |||
|
Total current assets
|
9,166 | |||
|
Property, plant and equipment, net
|
720 | |||
|
Other long-term assets
|
60 | |||
|
Total assets
|
$ | 9,946 | ||
|
Liabilities:
|
||||
|
Accounts payable
|
$ | 1,332 | ||
|
Accrued compensation and benefits
|
130 | |||
|
Other accrued liabilities
|
146 | |||
|
Total liabilities
|
$ | 1,608 | ||
|
Net assets
|
$ | 8,338 | ||
The following table provides revenue and pretax loss from the Spandex Poland discontinued operations:
|
For the Fiscal Year Ended April 30,
|
||||||||||||
|
In thousands
|
2011
|
2010
|
2009
|
|||||||||
|
Revenue from discontinued operations
|
$
|
---
|
$
|
1,234
|
$
|
4,206
|
||||||
|
Pretax loss from discontinued operations
|
$
|
---
|
$
|
(269
|
)
|
$
|
(1,468
|
)
|
||||
The following table provides revenue and pretax (loss) income from the Spandex New Zealand discontinued operations:
|
For the Fiscal Year Ended April 30,
|
||||||||||||
|
In thousands
|
2011
|
2010
|
2009
|
|||||||||
|
Revenue from discontinued operations
|
$
|
---
|
$
|
2,034
|
$
|
1,827
|
||||||
|
Pretax (loss) income from discontinued operations
|
$
|
(128
|
)
|
$
|
2
|
$
|
(216
|
)
|
||||
The following table provides revenue and pretax income (loss) from the Gerber Coburn Australia discontinued operations:
|
For the Fiscal Year Ended April 30,
|
||||||||||||
|
In thousands
|
2011
|
2010
|
2009
|
|||||||||
|
Revenue from discontinued operations
|
$
|
---
|
$
|
3,570
|
$
|
3,988
|
||||||
|
Pretax income (loss) from discontinued operations
|
$
|
6
|
$
|
(859
|
)
|
$
|
407
|
|||||
119
During the fiscal year ended April 30, 2009, the Company sold the Ophthalmic Lens Processing segment's Australian facility for a sales price of $1.0 million. The Company realized a gain of $0.6 million related to this transaction, which was reflected as a benefit within Income from discontinued operations on the accompanying Consolidated Statement of Operations for the fiscal year ended April 30, 2009.
Note 20. Subsequent Events
Asset Sales
During the fiscal year ended April 30, 2011, the Company amended its United States master operating lease with its landlord to exchange an owned facility in Tolland, Connecticut for a leased facility in South Windsor, Connecticut. After the exchange, the Company owns the South Windsor facility and leases the Tolland facility for the same terms and conditions that previously applied to the South Windsor facility. The exchange of the South Windsor facility for the Tolland facility under the master lease agreement was accounted for as a non-monetary exchange. Under lease accounting rules, at the date of the exchange, the Tolland facility remained an asset of the Company and the South Windsor facility was accounted for as a corporate asset of approximately $7.0 million, the estimated fair value of the facility, offset by a financing obligation. On March 31, 2011, the Company entered into an agreement to sell the South Windsor facility for net proceeds of approximately $6.6 million and classified the building as held for sale on the accompanying Consolidated Balance Sheet as of April 30, 2011.
Subsequent to April 30, 2011, the South Windsor facility was sold in May 2011. The net proceeds were used to reduce outstanding debt. In the fiscal year ending April 30, 2012, the Company plans to enter into a one-year lease with the new owners of the facility for a portion of the facility. At the sale date in the first quarter of the fiscal year ending April 30, 2012, the financing obligation of the South Windsor facility was extinguished. Also at the sale date, the accounting for the Tolland lease triggered a lease reassessment and the lease was determined to be a capital lease. Therefore, in the fiscal year ending April 30, 2012, a leased asset and liability will be established on the Company’s balance sheet for the Tolland capital lease.
Agreement for Acquisition of Gerber by Vector Capital Corporation Funds
On June 10, 2011, Gerber entered into an Agreement and Plan of Merger (the “Merger Agreement”) with Vector Knife Holdings (Cayman), Ltd., a newly formed Cayman company (“Parent”), and Knife Merger Sub, Inc., a newly formed Connecticut corporation and wholly owned subsidiary of Parent (“Merger Sub”), providing for the merger (the “Merger”) of Merger Sub with and into Gerber, with Gerber surviving the Merger as a wholly owned subsidiary of Parent. Parent and Merger Sub are controlled affiliates of Vector Capital Corporation (the “Sponsor”). The Merger Agreement was unanimously adopted by Gerber’s Board of Directors (the “Gerber Board”).
At the effective time of the Merger, each share of Gerber common stock outstanding immediately prior to the effective time (other than shares held by (i) Parent, Merger Sub, any other subsidiary of Parent or any subsidiary of Gerber or (ii) persons who properly exercise appraisal rights under Connecticut law) will be converted into the right to receive (a) $11.00 in cash, without interest (the “Cash Consideration”), and (b) a right to receive contingent cash consideration payments at future times if recoveries are obtained in connection with certain claims for infringement of a Gerber patent covering computerized cut to print technology (such right, a “CCCP”, and together with the Cash Consideration, the “Merger Consideration”).
Consummation of the Merger is subject to customary conditions, including without limitation: (i) the affirmative vote of the holders of a majority of the votes entitled to be cast on approval of the Merger Agreement (the “Shareholder Approval”); (ii) the expiration or early termination of the waiting period under the Hart-Scott-Rodino Antitrust Improvements Act of 1976, as amended; and (iii) the absence of any law, injunction, judgment or ruling making illegal or prohibiting the consummation of the Merger or enjoining Gerber, Parent or Merger Sub from consummating the Merger, and all actions or filings pursuant to the antitrust laws of Germany required to permit the consummation of the Merger having been taken, made or obtained. Moreover, each party’s obligation to consummate the Merger is subject to certain other conditions, including without limitation, (a) the accuracy of the other party’s representations and warranties contained in the Merger Agreement (subject to materiality qualifiers) and (b) the other party’s performance in all material respects of all obligations to be performed by it under the Merger Agreement. In addition, the obligation of Parent and Merger Sub to consummate the Merger is subject to certain other conditions, including: (x) Gerber’s possession of at least $5.0 million of cash and cash equivalents on the date of the closing of the Merger and (y) the absence of any event, occurrence or development of a state of circumstances or facts that has had and
120
continues to have or would reasonably be expected to have a Material Adverse Effect (as defined in the Merger Agreement) on Gerber since the date of the Merger Agreement. The consummation of the Merger is not subject to any financing condition.
Gerber has made customary representations and warranties and covenants in the Merger Agreement, including without limitation covenants regarding: (i) the conduct of Gerber’s business prior to the consummation of the Merger; (ii) the calling and holding of a meeting of Gerber’s shareholders for the purpose of obtaining the Shareholder Approval; and (iii) the use of reasonable best efforts to cause the Merger to be consummated.
During the period beginning on the date of the Merger Agreement and continuing through July 25, 2011 (the “Go-Shop Period”), Gerber may and intends to initiate, solicit and encourage any alternative acquisition proposals from third parties and provide non-public information to and enter into discussions or negotiations with third parties with respect to alternative acquisition proposals. Starting on July 26, 2011 (the “No-Shop Period Start Date”), Gerber will become subject to customary “no-shop” restrictions on its ability to solicit alternative acquisition proposals from third parties and to provide non-public information to and enter into discussions or negotiations with third parties regarding alternative acquisition proposals, except that Gerber may continue to engage in the aforementioned activities for a limited period of time after the Go-Shop Period with certain third parties that contacted Gerber and made an alternative acquisition proposal during the Go-Shop Period that the Gerber Board has determined constitutes a Superior Proposal (as defined below) (each, an “Excluded Party”).
Notwithstanding the limitations applicable after the No-Shop Period Start Date, prior to the receipt of the Shareholder Approval, Gerber may under certain circumstances furnish information to and engage in discussions or negotiations with third parties with respect to unsolicited alternative acquisition proposals that the Gerber Board reasonably believes could lead to a Superior Proposal. A “Superior Proposal” is an acquisition proposal for at least a majority of the outstanding shares of Gerber common stock or all or substantially all of the consolidated assets of Gerber on terms that the Gerber Board has determined is more favorable and makes available greater aggregate value to Gerber’s shareholders from a financial point of view than the Merger.
The Merger Agreement contains certain termination rights for Gerber and Parent. Upon termination of the Merger Agreement under specified circumstances, Gerber will be required to pay Parent a termination fee. If the termination fee becomes payable as a result of Gerber terminating the Merger Agreement in order to enter into a definitive agreement concerning a Superior Proposal with an Excluded Party, (as defined in the Merger Agreement), the amount of the termination fee will be $5.35 million. If the termination fee becomes payable in other circumstances, the amount of the termination fee will be $7.89 million and Gerber also will be required to pay Parent’s transaction expenses in an amount up to $1.69 million. The Merger Agreement also provides that Parent will be required to pay Gerber a reverse termination fee of $16.91 million in the event that Gerber elects not to pursue or cannot obtain specific performance and terminates the Merger Agreement due to Parent’s breach of the Merger Agreement or failure to close the Merger within three business days of notice of the satisfaction or waiver of all conditions to closing.
Pursuant to the terms of the Merger Agreement, immediately prior to the Merger effective time, Gerber will enter into a Contingent Cash Consideration Agreement (the “CCC Agreement”) governing the terms of the CCCPs and establishing a CCCP Committee (the “Committee”). Gerber will fund the pursuit of certain claims for infringement of Gerber’s patent covering computerized cut to print technology with up to $2 million deposited into an escrow account. If any net recoveries are received by Gerber prior to the closing of the Merger, Gerber’s funding obligation will be reduced up to such amount. Any post-closing recoveries from the pursuit of claims against certain agreed parties, net of applicable legal contingency fees and a tax reserve payable to Gerber, will be distributed first to Gerber as a reimbursement for the amount it funded for expenses through the escrow account and then to the holders of CCCPs. Pursuit of any claims against other parties for infringement of the patent covering computerized cut to print technology will require the consent of both Gerber and the Committee. Any post-closing recoveries from the pursuit of claims against other parties, net of applicable legal contingency fees and a tax reserve payable to Gerber, will be distributed first to Gerber as a reimbursement for any out-of-pocket expenses paid by Gerber in connection with the pursuit of such claims and then equally between Gerber, on the one hand, and the holders of CCCPs, on the other hand. The Committee will, at its discretion, determine payment dates on which payouts will be paid pro rata to holders of CCCPs (provided that at such time there are no accrued and unpaid escrow expenses), subject to adjustments for CCCPs issued to holders of out-of-the-money options at the time of the Merger to reflect the extent to which those options are out of the money at the closing of the Merger.
121
Note 21. Earnings Per Share
The following table sets forth the computation of basic and diluted earnings (loss) per common share for income (loss) from continuing operations for the fiscal years indicated below.
|
April 30, 2011
|
April 30, 2010
|
April 30, 2009
|
||||||||||||||||||||||||||||||||||
|
In thousands except per share amounts
|
Loss
from Continuing Operations
|
Average
Shares
|
Per
Share
|
Loss
from Continuing Operations
|
Average
Shares
|
Per
Share
|
Income from Continuing Operations
|
Average
Shares
|
Per
Share
|
|||||||||||||||||||||||||||
|
Basic (loss) earnings per
share
|
$
|
(6,667
|
)
|
25,132
|
$
|
(0.27
|
)
|
$
|
(922
|
)
|
24,961
|
$
|
(0.04
|
)
|
$
|
1,443
|
24,065
|
$
|
0.06
|
|||||||||||||||||
|
Effect of dilutive options and awards
|
---
|
---
|
---
|
---
|
---
|
---
|
---
|
74
|
---
|
|||||||||||||||||||||||||||
|
Diluted (loss) earnings per
share
|
$
|
(6,667
|
)
|
25,132
|
$
|
(0.27
|
)
|
$
|
(922
|
)
|
24,961
|
$
|
(0.04
|
)
|
$
|
1,443
|
24,139
|
$
|
0.06
|
|||||||||||||||||
For the fiscal years ended April 30, 2011, 2010 and 2009, stock options to purchase 1.3 million, 1.9 million and 2.0 million shares of common stock, respectively, were excluded from the calculation of diluted earnings per share because the exercise price of the stock options exceeded the average market price of the Company's common stock.
Note 22. Quarterly Results (Unaudited)
A summary of the quarterly results of operations for the fiscal years ended April 30, 2011 and 2010 is set forth below.
|
In thousands except per share amounts
|
First
Quarter
|
Second
Quarter
|
Third
Quarter
|
Fourth
Quarter
|
||||||||||||
|
Fiscal 2011
|
||||||||||||||||
|
Revenue
|
$
|
106,328
|
$
|
117,540
|
$
|
111,954
|
$
|
126,699
|
||||||||
|
Gross profit
|
$
|
32,118
|
$
|
35,179
|
$
|
37,095
|
$
|
38,371
|
||||||||
|
Net income (loss)
|
$
|
1,524
|
$
|
(16,107
|
)
|
$
|
1,728
|
$
|
(10,761
|
)
|
||||||
|
Earnings (Loss) per common share:
|
||||||||||||||||
|
Basic
|
$
|
0.06
|
$
|
(0.64
|
)
|
$
|
0.07
|
$
|
(0.43
|
)
|
||||||
|
Diluted
|
$
|
0.06
|
$
|
(0.64
|
)
|
$
|
0.07
|
$
|
(0.43
|
)
|
||||||
|
Fiscal 2010
|
||||||||||||||||
|
Revenue
|
$
|
98,644
|
$
|
105,578
|
$
|
99,221
|
$
|
108,824
|
||||||||
|
Gross profit
|
$
|
28,253
|
$
|
30,486
|
$
|
29,763
|
$
|
31,799
|
||||||||
|
Net income (loss)
|
$
|
514
|
$
|
459
|
$
|
(809
|
)
|
$
|
(1,622
|
)
|
||||||
|
Earnings (Loss) per common share:
|
||||||||||||||||
|
Basic
|
$
|
0.02
|
$
|
0.02
|
$
|
(0.03
|
)
|
$
|
(0.06
|
)
|
||||||
|
Diluted
|
$
|
0.02
|
$
|
0.02
|
$
|
(0.03
|
)
|
$
|
(0.06
|
)
|
||||||
Fiscal 2011 fourth quarter net income included costs associated with the Company’s decision to discontinue production of Sign Making and Specialty Graphics UV flatbed printers and to relocate the Apparel and Industrial Denmark manufacturing plant to China. See Note 14. Fiscal 2011 fourth quarter net loss also included a $5.9 million goodwill impairment of the GSP reporting unit. See Note 6.
For the fiscal year ended April 30, 2010, the sum of the four fiscal quarter basic and diluted earnings (loss) per share does not equal the full year basic and diluted earnings (loss) per share due to rounding.
122
Pursuant to the requirements of Section 13 or 15(d) of the Securities Exchange Act of 1934, the Registrant has duly caused this report to be signed on its behalf by the undersigned, thereunto duly authorized.
|
GERBER SCIENTIFIC, INC.
|
|||
|
(Registrant)
|
|||
|
June 29, 2011
|
By:
|
/s/ Michael R. Elia
|
|
|
Michael R. Elia
Executive Vice President, Chief Financial Officer (Chief Accounting Officer and Principal Financial Officer)
|
|||
Pursuant to the requirements of the Securities Exchange Act of 1934, this report has been signed below by the following persons on behalf of the Registrant and in the capacities and on the dates indicated:
|
Date
|
Signature
|
Title
|
|
June 29, 2011
|
/s/ Marc T. Giles
|
President, Chief Executive Officer and Director (Principal Executive Officer)
|
|
(Marc T. Giles)
|
||
|
June 29, 2011
|
/s/ Donald P. Aiken
|
Director, Chairman
|
|
(Donald P. Aiken)
|
||
|
June 29, 2011
|
/s/ Randall D. Ledford
|
Director
|
|
(Randall D. Ledford)
|
||
|
June 29, 2011
|
/s/ John R. Lord
|
Director
|
|
(John R. Lord)
|
||
|
June 29, 2011
|
/s/ James A. Mitarotonda
|
Director
|
|
(James A. Mitarotonda)
|
||
|
June 29, 2011
|
/s/ Javier Perez
|
Director
|
|
(Javier Perez)
|
||
|
June 29, 2011
|
/s/ Carole F. St. Mark
|
Director
|
|
(Carole F. St. Mark)
|
||
|
June 29, 2011
|
/s/ W. Jerome Vereen
|
Director
|
|
(W. Jerome Vereen)
|
123