Attached files
| file | filename |
|---|---|
| 8-K - FORM 8-K - Nalco Holding CO | d8k.htm |
 |
Dave Flitman, President WPS
28th June, 2011
Water and Process Services (WPS)
Segment Review
Exhibit 99.1 |
 |
2
Forward-Looking Statements and Regulation G
This presentation includes “forward-looking statements” within the meaning of
Section 27A of the Securities Act of 1933 and Section 21E of the Securities Exchange
Act of 1934. These forward-looking statements include statements concerning our plans, objectives, goals, strategies, future events,
future revenue or performance, capital expenditures, financing needs, plans or intentions
relating to acquisitions, business trends and other information that is not historical
information. When used in this presentation, the words “estimates,” “expects,” “anticipates,” “projects,” “plans,”
“intends,” “believes,” “forecasts,” or future or conditional
verbs, such as “will,” “should,” “could” or “may,” and variations of such words or similar
expressions are intended to identify forward-looking statements. All forward-looking
statements, including, without limitation, management’s examination of historical
operating trends and data are based upon our current expectations and various assumptions. Our expectations, beliefs and
projections are expressed in good faith and we believe there is a reasonable basis for them.
However, there can be no assurance that management’s expectations, beliefs and
projections will be achieved. There are a number of risks and uncertainties that could cause our actual results to differ
materially from the forward-looking statements contained in this presentation.
Important factors that could cause our actual results to differ materially from the forward-looking statements we make in this
presentation. Such risks, uncertainties and other important factors include, among
others: our leverage; limitations on flexibility in operating our business contained in
our debt agreements; increases in interest rates as a result of our variable rate indebtedness; pricing pressure from our
customers; technological change and innovation; risks associated with our non-U.S.
operations; fluctuations in currency exchange rates; high competition in the markets in
which we operate; adverse changes to environmental, health and safety regulations; operating hazards in our production
facilities; inability to achieve expected cost savings; difficulties in securing or changes in
the pricing of the raw materials we use; our significant pension benefit obligations
and the current underfunding of our pension plans; our ability to realize the full value of our intangible assets; our ability to attract
and retain skilled employees, particularly research scientists, technical sales professionals
and engineers; and our ability to protect our intellectual property rights. There
may be other factors that may cause our actual results to differ materially from the forward-looking statements.
All forward-looking statements attributable to us or persons acting on our behalf apply
only as of the date of this presentation and are expressly qualified in their entirety
by the cautionary statements included in this presentation. We undertake no obligation to update or revise forward-looking
statements which may be made to reflect events or circumstances that arise after the date made
or to reflect the occurrence of unanticipated events. Non-GAAP measures may be discussed in today’s presentation. Management believes
that discussion of these measures provides investors with additional insight into the
ongoing operations of Nalco Holding Company. Non-GAAP measures are reconciled to the closest GAAP measure in
schedules attached to our earnings releases, which may be found at
www.nalco.com. Adjusted EBITDA and Pro Forma EBITDA are non-GAAP measures
used to determine compliance with the Company’s debt covenants or to assess the ongoing
performance of the business. Free Cash Flow is defined as Cash from Operations
less Capital Expenditures and Minority Interest charges. In addition, Nalco may discuss sales growth in terms of nominal (actual),
organic (nominal less foreign currency and acquisition/divestiture/merger/joint venture
impacts), and real (organic growth less that portion of the growth which consists of
price increases that simply pass along higher raw and purchased material costs). The non-GAAP measures should not be
viewed as an alternative to GAAP measures of performance. Furthermore, these measures
may not be consistent with similar measures provided by other companies.
|
 |
3
$4.25 Billion Sales by End Market
2010
NALCO –
A SERVICE COMPANY
Water & Process Services (WPS)
•
60% of total company sales
•
Water, 42%
•
Paper, 18%
•
55% of total company profit
•Water
•
Largest Segment
•
Highly Diverse
•
Strong Growth*
•
6-8% per yr
•
High DC Margin
•
~20-21%
•Paper
•
4-5% per yr Growth*
•
High teens DC Margin
* Real growth is defined as organic growth less the impact of sizable raw material
cost driven price swings. Organic growth excludes FX and M&A
impacts. Assumes economic stabilization. New run rate by YE2011. Upstream
Energy
24.3%
Downstream
Energy
16.4%
Paper, Graphic Grades
8.9%
Paper, Board & Packaging
6.5%
Paper, Tissue
2.3%
Water, Manufacturing
6.7%
Water, Food & Beverage
6.1%
Water, Mining & Minerals
5.6%
Water, Primary Metals
5.2%
Water, Institutional
4.6%
Water, Power
4.2%
Water, Chemicals
3.8%
All others
5.4% |
 |
4
BRIC+ countries
MACROS SUPPORT COMPELLING GROWTH OPPORTUNITIES |
 |
5
WPS GROWTH STRATEGY
•
Leverage our customer intimacy and industry expertise to continue to expand our
core strengths in service, automation, chemistry and specialty
equipment. •
Capture geographic and market trend opportunities in BRIC+ at the interface of
water scarcity and rapid industrial growth.
•
Expand our technology leadership in key areas:
•
Automation and Control
•
3D TRASAR®
Platform
•
OxiPRO®
•
Process Applications in several Industries
•
Paper
•
Mining
•
Light Manufacturing
•
Food and Beverage
•
Industrial Water Recycle and Reuse
•
Integrated Solutions
•
3D TRASAR for Membranes
•
Continue to drive productivity across the business in supply chain and the field
sales force to improve overall efficiency and drive working capital
productivity. |
 |
6
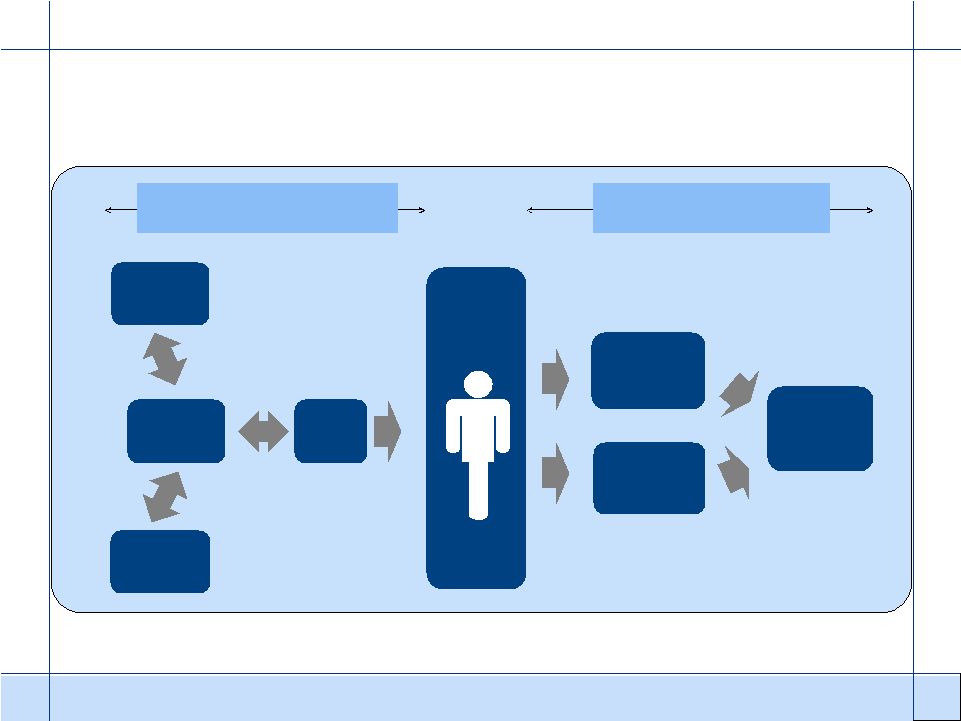
Focused
penetration in
BRIC+ markets
Integrated
pre-treatment &
utility solutions
Process
application
solutions
Integrated
waste water
solutions
Integration across entire facility
Automation, Monitoring and Control
Innovation in Chemistry, Equipment, & Service
Professional Services, On-Site Services, Operating Services
WPS STRATEGY DEPLOYMENT
1
2
3
4 |
 |
7
•Train & develop
•Create & Maintain Value
•Incent
•Salesforce productivity
•Recurring
•Not cyclical
•Bundled agreements
•
Total cost of
operation (TCO)
•
Create & Maintain
Value
•
Environmental
performance;
eROI
•
Brand loyalty
•Services
•Automation/Process Control
•
Chemistry
•Specialty equipment
Nalco
“Sweet spot”
WPS BUSINESS MODEL, HIGHLY DIFFERENTIATED & DIFFICULT TO REPLICATE
sm |
 |
8
WATER
Market Dynamics
Business Model
Growth
Drivers
•
Safety and equipment integrity
•
Productivity
•
Regulatory compliance
•
Water availability and quality
•
Environmental sustainability
•
Total cost of operation (TCO)
Sensitivity
Industrial Production, GDP
Market Size*
$6.4B (4% CAGR chemicals/service)
Market
Share
~ 20%
•
BRIC+
•
Market share gains in key accounts
•
Technology penetration
•
Automation and real time performance
information
•
Integrated solutions
•
Waste
water
reuse
and
recycle
–
eROI
Industries Served
Heavy Industrial (40%)
•Primary Metals
•Power Generation
•Chemicals
Light Industrial (40%)
•Food & Beverage
•Institutional
•Manufacturing
Other (20%)
•
Focused on Industry Leaders in respective
segments
•
Annuity / recurring revenue models
•
Water treatment sales comprise
~70% of Water revenue
•
Measured delivered value utilizing Create &
Maintain Value (CMV) process
•
Pretreatment, process water, and waste
treatment
*See 2010 10K for definition of Water segment market size
|
 |
9
example….POWER GENERATION
Business Model
Growth
Drivers
•
Safety
•
Capacity
•
Availability
•
Life extension
•
Environmental compliance
•
Maintenance
•
Heat rate
Sensitivity
Capacity additions through new
construction, GDP
Market Size
$600M (3-4% CAGR)
Market
Share
> 20%
•
Environmental compliance and pollution
reduction (heavy metals removal) programs
•
Water
scarcity
-
recycle
and
usage
minimization programs
•
Integrated water management (IWM) and
pretreatment outsourcing
•
Core technology penetration in BRIC+
Segments Served
•
Nuclear
•
Fossil
•
Renewables (Geo. / waste / thermal solar)
•
Focused on major regional and global
electricity generators
•
Recurring revenue linked to electricity
production
•
Cooling water, boiler water, waste
treatment services, chemistries, and
equipment
Market Dynamics |
 |
10
example….FOOD & BEVERAGE
Business Model
Growth
Drivers
•
Brand Protection
•
Food Safety
•
Meet sustainability goals
•
Leverage existing assets
Sensitivity
Food commodity prices,
Capital availability
Market
Size
$1.4B boiler,cooling,waste chemistry~ 4-5%
Market
Share
~ 20% share in target markets
Integrated solutions
•Goal of 100% Nalco 360 penetration in global key
accounts to standardize eROI delivery
Process technology
•
Additives for corn oil recovery improvement
•
Fermentation additives for increased yields in ethanol
•
3D TRASAR for Membranes & Services for Process
Beverage
•
3D TRASAR for Clean in Place to reduce water
consumption
BRIC+
•Penetrate Brazil’s $100MM biofuel (sugar) market
Segments Served
•Beverage (Brewing, Water, Functional)
•Grain, Oil (Edible),
Biofuels
•Processed and Prepared Foods
•Dairy
•Meat & Poultry
•
Focus on global multi-national customers
•
Recurring revenue based on price per pound and
fixed monthly payment are the predominant
globally
•
Long term annuity contracts for Waste Water &
Utility treatment chemistry and services
Market Dynamics |
 |
11
PAPER
Market Dynamics
Business Model
Growth
Technology
•Pareto™
–
water and energy savings
•Oxipro –
productivity enhancement
•FillerTEK®
–
TCO enabler
•POSITEK®
3G –
finished product quality
Waste
water
reuse
and
recycle
–
eROI
Grow share every year in BRIC+
Industries Served
•
Graphic Grades
(50%)
•
Board &
Packaging (37%)
•
Tissue (13%)
•
Align with Global Sustainable Assets
•
Focus on Large Multi National Corporations
and Regional Market Leaders
•
Measured delivered value utilizing CMV
process
•
Long term supply agreements (pricing –
indices driven)
Drivers
•
Production Rates
•
Finished product quality
•
Operational productivity
•
Environmental sustainability, eROI
•
Regulations
•
TCO (Total Cost of Operations)
Sensitivity
Industrial Production, GDP,
Regulations
Market Size*
$6.7B (Global CAGR 2.8%)
Market Share
11%
*See 2010 10K for definition of Paper segment market size
|
 |
12
MINING
Market Dynamics
Business Model
Growth
Drivers
•
Demand for metals and energy
•
Environmental sustainability
•
High water intensity with mines
located in water scarce regions
•
Declining ore quality will drive
need for “specialized”
additives
•
TCO
Sensitivity
GDP, Regulations
Market Size
~$1.2B (6-8%)
Market Share
> 20%
Technology
•Flotation
•
Pinnacle®-Sulfide Flotation Technology
•
NALFOTE®-Coal Flotation Technology
•OreBind®-Water Recovery Aid
•Perflow-Potash & Phosphate Coatings
BRIC+ (Brazil, China, Chile, Australia, South
Africa)
Industries
Served
•
Onsite problem prevention/solving in our
customers’
dynamic systems
•
Advanced technology support for significant
process problems
•
High service requirements, expert
process and water knowledge,
assured supply chain
•
Long term supply agreements
(pricing –
indices driven)
These industry’s represent
> 90% of the business.
•
Alumina
•
Coal
•
Precious Metals
•
Base Metals
•
Potash/
Phosphate |
 |
13
Above Market Growth
At Market Growth
Less than Market Growth
WELL POSITIONED TO OUTPACE MARKET GROWTH |
 |
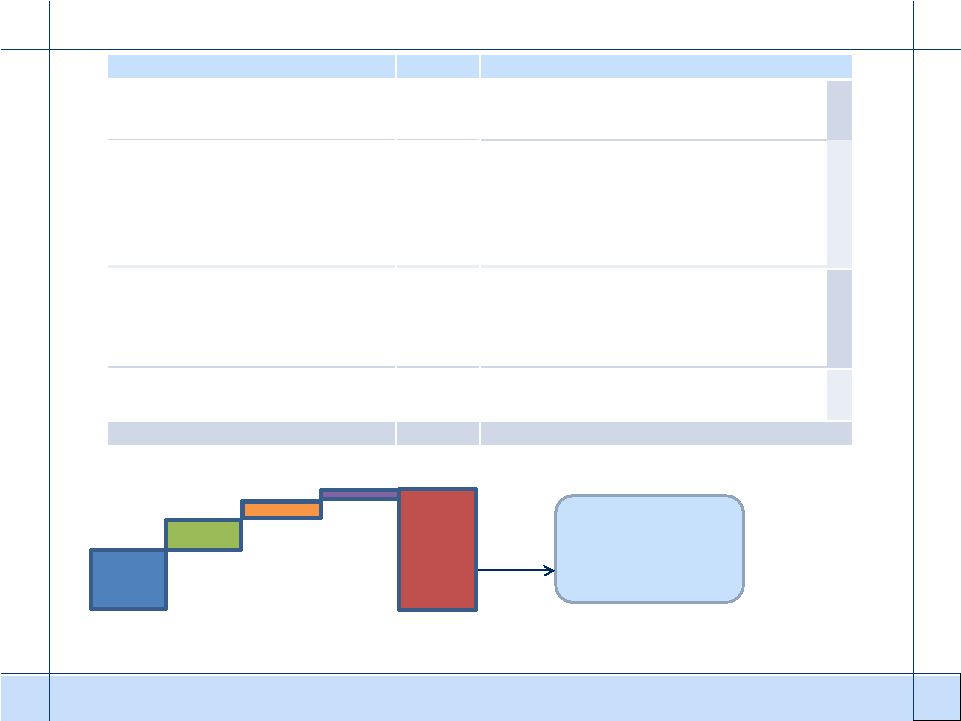
14
New
Account
Production
Scheduled
Sales Calls
Available
Sales Time
Quality of
Opportunity
Quality of
Sales Call
Aligned
Compensation
•
Skill Will Assessments
•
District
Implementation Plans
•
Key Activities &
Milestones of
Sales Stages
Designed into
CRM
•
Compensation Model
With Aligned Rates,
Targets & Deployment
Roles
•
Service Activities Scheduled
Around Sales Calls
•
Sales Calls Scheduled in
Advance (4 Week View)
•
Call Schedule Reviewed by
District Manager at Least
Every Other Week
•
Key Functionality of CRM
•
Target Opportunity
List Created &
Managed Jointly
Between Sales,
SBUs and KAMs
New account targets increased >30% through
COMMERCIAL EXCELLENCE |
 |
15
Industry
Marketing
Product &
Solutions
Marketing
Key
Account
Management
Sales
Mngt
Rep List of
Target
Opportunities
& Offerings
Assign Targets
Based on
Goals &
Available
Sales
Resources
Reps Earn Greater Incentives For Selling Strategically Targeted Opportunities
Target Selection Process
“Where”
and “What”
to Sell
Total
Incentive
Earnings
Profitability Of
Entire Territory
vs. Target
Gross Profit
from Targeted
New Business
vs. Target
Actual Gross Profit Attained in Each
Category is Compared to Role-
Specific Targets to Determine
Incentive Earnings
Results
Sales Incentive Design
Rewarding Strategic Sales
STRATEGIC APPROACH TO MARKET VIA INCENTIVE DESIGN |
 |
16
Membranes
Wastewater
WPS INNOVATION PIPELINE INTEGRAL TO GROWTH STRATEGY
| |
 |
17
% RECOVERY% REJECTION% PRESSURE
WATER USAGE/EFFICIENCY
STEAM FLOW
ENERGY USAGE/ EFFICIENCY
ENERGY/WATER USAGE
FUEL USAGE
BD
ENERGY USAGE/EFFICIENCY
FLOW
ENERGY/ WATER USAGE
TSS
COD
FLOW
TEMP IN
TEMP OUT
ENERGY/PROCESS EFFICIENCY
MU
BD
WATER USAGE
CT FAN SPEED
ENERGY USAGE
BOILER
WASTE
WATER
PROCESS
RO
COOLING
Customer Benefits:
•Reduced Water and Energy Consumption
•Benchmarking Capabilities
•Lower Total Cost of Operation
Not yet
commercialized
3D TRASAR TECHNOLOGY PLATFORM EXPANSION
TOTAL WATER AND
ENERGY IN
MOST EFFICIENT USE OF
WATER AND ENERGY OUT
MINIMIZE
WASTE OUT |
 |
18
Key technology aligned with market drivers
expected to add 2-3% growth by 2015
WPS MARKET DRIVERS AND KEY TECHNOLOGIES
Cost Reduction
Energy
(3D
TRASAR,
PARETO
Mixing
Technology,
Metrix®/VELOX®,
POSITEK
®
3G)
Water
(3D
TRASAR,
PARETO
Mixing
Technology,
Sea
Water,
OreBind,
NALFLOTE)
Total
Cost
of
Operation
(TCO)
–
All
key
technologies
Resources
(APEX™, FillerTEK, Metrix, Pinnacle, Perflow)
Production Efficiency
Tons
(PARETO/RDF,
POSITEK
3G,
Metrix®/VELOX,
OxiPRO,
Tissue
Automation)
Yield
(3D
TRASAR,
PARETO/RDF,
POSITEK
3G,
Metrix/VELOX,
OxiPRO,
Pinnacle,
CGMAX)
Environmental Impact, eROI
Water
reduction
(3D
TRASAR,
PARETO
Mixing
Technology,
Sea
Water,
OreBind,
NALFLOTE)
Water
recycle
and
reuse
(3D
TRASAR,
PARETO
Mixing
Technology)
Energy
Conservation
(3D
TRASAR,
PARETO
Mixing
Technology,
Metrix/VELOX,
POSITEK
3G,
Strength,
Geothermal) |
 |
19
•
Over 70% of 903 Nalco headcount additions during 2010 in BRIC+ countries
–
~300 Customer Facing headcount additions to BRIC+ in WPS
•
Dedicated training University established in China
–
Three graduating classes in 2010: > 225 sales and service professionals
–
Accelerated time and capability to maximum customer value
•
Investment in New R&D Facilities: >$10MM capex
–
Shanghai, China (2009)
–
Pune, India (2010)
–
Campinas, Brazil (2009)
•
Nanjing, China Manufacturing Facility (2008): $25MM capex
–
Nalco 3 largest production facility
•
Increased local…
–
Nalco Leadership
–
Government Relationships
–
Partnerships with National Industrial Leaders
BRIC+ Sales: Nalco achieved 30% growth in 2010; 18% of total
company revenue
Relatively High Market Share vs. Competitors
BRIC+ INVESTMENTS SHOWING EARLY RETURNS
rd |
     |
20
* Real growth is defined as organic growth less the impact of sizable raw material
cost driven price swings. Organic growth excludes FX and M&A
impacts. Assumes economic stabilization. New run rate by YE2011. WPS Growth
Drivers Growth
Results
Next Generation Technology
• 3D TRASAR Cooling Water, Boiler Water,
• 3D TRASAR
Membranes
• Process Initiatives
• OxiPro, Pareto, Thin Stillage, APEX
• Integrated Solutions
• Solutions combining chemistry, equipment,
services and automation
• Align with high growth regions and
industries
• JV in sub-equatorial Africa 2010
• Continued talent acquisition
• Targeted technology expansion,
service bolt-ons (synergy growth)
Expected WPS Real Growth Rate *
5 - 7%
Sustain Historic Base Growth
3%
• Sales channel, leading technology, brand
recognition
.25 - .50%
1 - 2.5%
Historic M&A
Strengthen Key Geographies (BRIC +)
.75 - 1%
2015E
+ $1B
in 5 yrs
WPS GROWING 1.5 –
2X MARKET
3%
1 -
2.5%
.75 -
1%
.25 -
.50%
5 -
7%
Core Water
Technology
BRIC+
M&A
& Paper
Growth
$2.5B
$3.5B |
 |
21
WPS RAW MATERIALS AND PRICING EXPECTATIONS
•
Price, and margin restoration, is our number one focus
•
Globally, price negotiations actioned on > 80 percent of
revenue
•
On pace to cover current quarter cost increases with
price by end Q2 |
 |
22
WATER AND PROCESS SERVICES 2011 OUTLOOK
•
Forecast high single -
double digit revenue growth
•
Growing 1.5-2x the market
•
Value of account targets up over 30% globally
•
Price is our number one focus
•
On track to support corporate commitment of price catching raw cost
increases on run rate basis by end 3Q
•
Nalco Mobotec gaining significant momentum in Europe
•
Direct Contribution Margin approaching 18% |
 |
Questions ? |