As filed with the Securities
and Exchange Commission on June 21,
2011
Registration No. 333-173808
UNITED STATES SECURITIES AND
EXCHANGE COMMISSION
Washington, D.C.
20549
Amendment No. 1
to
Form S-1
REGISTRATION
STATEMENT
UNDER
THE SECURITIES ACT OF
1933
WPX Energy, Inc.
(Exact name of registrant as
specified in its charter)
| |
|
|
|
|
|
Delaware
|
|
1311
|
|
45-1836028
|
(State or other jurisdiction
of
Incorporation or organization)
|
|
(Primary Standard Industrial
Classification Code Number)
|
|
(I.R.S. Employer
Identification Number)
|
One Williams Center
Tulsa, Oklahoma
74172-0172
(918) 573-2000
(Address, including zip code,
and telephone number, including area code, of registrant’s
principal executive offices)
James J.
Bender, Esq.
General Counsel and Corporate
Secretary
One Williams Center,
Suite 4900
Tulsa, Oklahoma
74172-0172
(918) 573-2000
(Name, address, including zip
code, and telephone number, including area code, of agent for
service)
Copies
to:
| |
|
|
Richard M. Russo
Robyn E. Zolman
Gibson, Dunn & Crutcher LLP
1801 California Street, Suite 4200
Denver, CO 80202
|
|
J. Michael Chambers
Ryan J. Maierson
Latham & Watkins LLP
717 Texas Avenue, 16th floor
Houston, TX 77002
|
Approximate date of commencement of proposed sale to the
public: As soon as practicable after the
effective date of this registration statement.
If any of the securities being registered on this Form are being
offered on a delayed or continuous basis pursuant to
Rule 415 under the Securities Act of 1933, check the
following
box: o
If this Form is filed to register additional securities for an
offering pursuant to Rule 462(b) under the Securities Act,
please check the following box and list the Securities Act
registration statement number of the earlier effective
registration statement for the same
offering. o
If this Form is a post-effective amendment filed pursuant to
Rule 462(c) under the Securities Act, check the following
box and list the Securities Act registration statement number of
the earlier effective registration statement for the same
offering. o
If this Form is a post-effective amendment filed pursuant to
Rule 462(d) under the Securities Act, check the following
box and list the Securities Act registration statement number of
the earlier effective registration statement for the same
offering. o
Indicate by check mark whether the registrant is a large
accelerated filer, an accelerated filer, a non-accelerated
filer, or a smaller reporting company. See the definitions of
“large accelerated filer,” “accelerated
filer” and “smaller reporting company” in
Rule 12b-2 of the Exchange Act.
| |
|
|
|
|
|
|
|
Large accelerated
filer o
|
|
Accelerated
filer o
|
|
Non-accelerated
filer þ
(Do not check if a smaller
reporting company)
|
|
Smaller reporting
company o
|
The registrant hereby amends this registration statement on
such date or dates as may be necessary to delay its effective
date until the registrant shall file a further amendment which
specifically states that this registration statement shall
thereafter become effective in accordance with Section 8(a)
of the Securities Act of 1933 or until this registration
statement shall become effective on such date as the Securities
and Exchange Commission, acting pursuant to said
Section 8(a), may determine.
The
information in this prospectus is not complete and may be
changed. We may not sell these securities until the registration
statement filed with the Securities and Exchange Commission is
effective. This prospectus is not an offer to sell these
securities and it is not soliciting an offer to buy these
securities in any state where the offer or sale is not
permitted.
|
Subject
to Completion, dated June 21, 2011
PROSPECTUS
Shares
WPX
Energy, Inc.
Class A
Common Stock
This is the initial
public offering of Class A common stock of WPX Energy, Inc.
We are
offering shares
of our Class A common stock. No public market currently
exists for our Class A common stock.
Following this
offering, we will have two classes of authorized common stock,
Class A common stock and Class B common stock. All of
our shares of Class B common stock will be held by The
Williams Companies, Inc. (“Williams”). The rights of
holders of shares of Class A common stock and Class B
common stock will be identical, except with respect to voting
and conversion rights. Each share of Class A common stock
will be entitled to one vote per share. Each share of
Class B common stock will be entitled to ten votes per
share and will be convertible at any time at the election of
Williams into one share of Class A common stock. Our
Class B common stock will automatically convert into shares
of Class A common stock in certain circumstances.
We intend to apply
to list our Class A common stock on the New York Stock
Exchange under the symbol “WPX.”
We anticipate that
the initial public offering price will be between
$ and
$ per share.
Investing in
our Class A common stock involves risks. See “Risk
Factors” beginning on page 17 of this
prospectus.
| |
|
|
|
|
|
|
|
|
|
|
|
Per
Share
|
|
|
Total
|
|
|
Price to the public
|
|
$
|
|
|
|
$
|
|
|
|
Underwriting discounts and commissions
|
|
$
|
|
|
|
$
|
|
|
|
Proceeds to us (before expenses)
|
|
$
|
|
|
|
$
|
|
|
We have granted the
underwriters a
30-day
option to purchase up to an
additional shares
of Class A common stock on the same terms and conditions
set forth above if the underwriters sell more
than shares of Class A
common stock in this offering.
Neither the
Securities and Exchange Commission nor any state securities
commission has approved or disapproved of these securities or
passed on the adequacy or accuracy of this prospectus. Any
representation to the contrary is a criminal offense.
Barclays Capital, on
behalf of the underwriters, expects to deliver the shares on or
about ,
2011.
|
|
|
| Barclays
Capital |
Citi |
J.P. Morgan |
Prospectus
dated ,
2011
TABLE OF
CONTENTS
You should rely only on the information contained in this
document or any free writing prospectus prepared by or on behalf
of us. We have not authorized anyone to provide you with
information that is different. This document may only be used
where it is legal to sell these securities. The information in
this document may only be accurate on the date of this
document.
Dealer
Prospectus Delivery Obligation
Until ,
2011 (the 25th day after the date of this prospectus), all
dealers that effect transactions in our common shares, whether
or not participating in this offering, may be required to
deliver a prospectus. This is in addition to the dealer’s
obligation to deliver a prospectus when acting as an underwriter
and with respect to unsold allotments or subscriptions.
Industry
and Market Data
We obtained the market and competitive position data used
throughout this prospectus from our own research, surveys or
studies conducted by third parties and industry or general
publications. Industry publications and surveys generally state
that they have obtained information from sources believed to be
reliable, but do not guarantee the accuracy and completeness of
such information. While we believe that each of these studies
and publications is reliable and have no reason to believe they
are inaccurate or incomplete, neither we nor the underwriters
have independently verified such data and neither we nor the
underwriters make any representation as to the accuracy of such
information. Similarly, we believe our internal research is
reliable but it has not been verified by any independent
sources.
ii
CERTAIN
DEFINITIONS
The following oil and gas measurements and industry and other
terms are used in this prospectus. As used herein, production
volumes represent sales volumes, unless otherwise indicated.
Bakken Shale—means the Bakken Shale oil play in the
Williston Basin and can include the Upper Three Forks formation.
Barrel—means one barrel of petroleum products that
equals 42 U.S. gallons.
BBtu—means one billion BTUs.
BBtu/d—means one billion BTUs per day.
Bcfe—means one billion cubic feet of gas equivalent
determined using the ratio of one barrel of oil or condensate to
six thousand cubic feet of natural gas.
Bcf/d—means one billion cubic feet per day.
Boe—means barrels of oil equivalent.
Boe/d—means barrels of oil equivalent per day.
British Thermal Unit or BTU—means a unit of energy
needed to raise the temperature of one pound of water by one
degree Fahrenheit.
FERC—means the Federal Energy Regulatory Commission.
Fractionation—means the process by which a mixed
stream of natural gas liquids is separated into its constituent
products, such as ethane, propane and butane.
LOE—means lease and other operating expense
excluding production taxes, ad valorem taxes and gathering,
processing and transportation fees.
Mbbls—means one thousand barrels.
Mboe/d—means thousand barrels of oil equivalent per
day.
Mcf—means one thousand cubic feet.
Mcfe—means one thousand cubic feet of gas equivalent
using the ratio of one barrel of oil or condensate to six
thousand cubic feet of natural gas.
MMbbls—means one million barrels.
MMboe—means one million barrels of oil equivalent.
MMBtu—means one million BTUs.
MMBtu/d—means one million BTUs per day.
MMcf—means one million cubic feet.
MMcf/d—means
one million cubic feet per day.
MMcfe—means one million cubic feet of gas equivalent
using the ratio of one barrel of oil or condensate to six
thousand cubic feet of natural gas.
MMcfe/d—means one million cubic feet of gas
equivalent per day using the ratio of one barrel of oil or
condensate to six thousand cubic feet of natural gas.
NGLs—means natural gas liquids; natural gas liquids
result from natural gas processing and crude oil refining and
are used as petrochemical feedstocks, heating fuels and gasoline
additives, among other applications.
iii
PROSPECTUS
SUMMARY
This summary highlights certain information contained
elsewhere in this prospectus. This summary is not complete and
does not contain all of the information that you should consider
before investing in our Class A common stock. You should
read this entire prospectus carefully, including the risks
discussed under “Risk Factors” and the financial
statements and notes thereto included elsewhere in this
prospectus. Some of the statements in this summary constitute
forward-looking statements. See “Forward-Looking
Statements.”
Except
where the context otherwise requires or where otherwise
indicated, (1) all references to “Williams” refer
to The Williams Companies, Inc., our parent company, and its
subsidiaries, other than us, and (2) all references to
“WPX Energy,” “WPX,” the
“Company,” “we,” “us” and
“our” refer to WPX Energy, Inc. and its
subsidiaries.
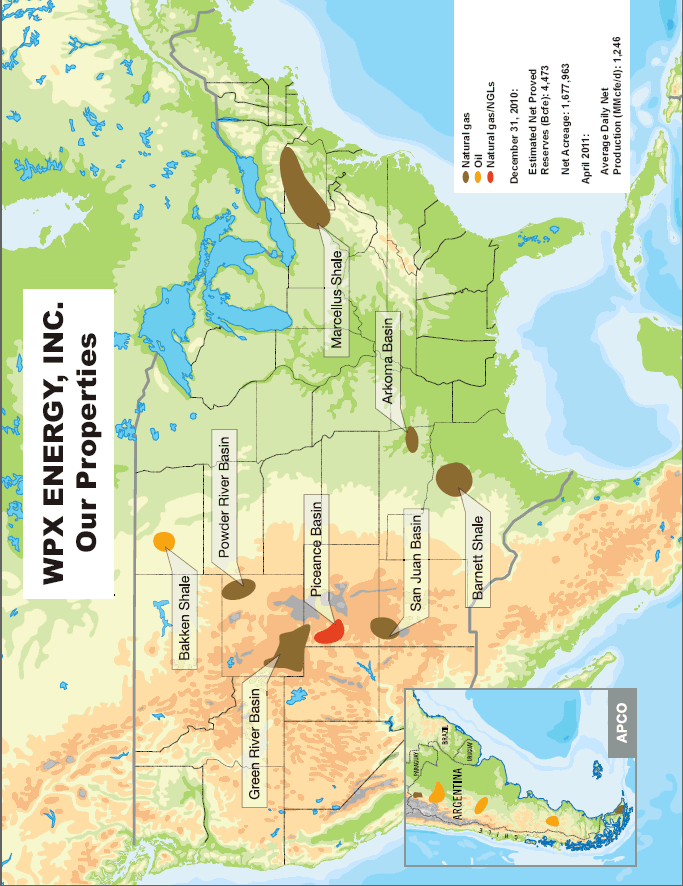
Overview
We are an independent natural gas and oil exploration and
production company engaged in the exploitation and development
of long-life unconventional properties. We are focused on
profitably exploiting our significant natural gas reserve base
and related NGLs in the Piceance Basin of the Rocky Mountain
region, and on developing and growing our positions in the
Bakken Shale oil play in North Dakota and the Marcellus Shale
natural gas play in Pennsylvania. Our other areas of domestic
operations include the Powder River Basin in Wyoming and the
San Juan Basin in the southwestern United States. In
addition, we own a 69 percent controlling ownership
interest in Apco Oil and Gas International, Inc.
(“Apco”), which holds oil and gas concessions in
Argentina and Colombia and trades on the NASDAQ Capital Market
under the symbol “APAGF.”
We have built a geographically diverse portfolio of natural gas
and oil reserves through organic development and strategic
acquisitions. For the five years ended December 31, 2010,
we have grown production at a compound annual growth rate of
12 percent. As of December 31, 2010, our proved
reserves were 4,473 Bcfe, 59 percent of which were
proved developed reserves. Average daily production for the
month of April 2011 was 1,246 MMcfe/d. Our Piceance Basin
operations form the majority of our proved reserves and current
production, providing a low-cost, scalable asset base.
The following table provides summary data for each of our
primary areas of operation as of December 31, 2010, unless
otherwise noted.
| |
|
|
|
|
|
|
|
|
|
|
|
|
|
|
|
|
|
|
|
|
|
|
|
|
|
|
|
|
|
|
|
|
|
|
|
|
|
|
|
Estimated Net
|
|
|
April 2011
|
|
|
|
|
|
|
|
|
|
|
|
2011 Budget Estimate
|
|
|
|
|
|
|
|
Proved Reserves
|
|
|
Average Daily
|
|
|
|
|
|
Identified Drilling
|
|
|
|
|
|
Drilling
|
|
|
|
|
|
|
|
|
|
|
% Proved
|
|
|
Net Production
|
|
|
|
|
|
Locations
|
|
|
|
|
|
Capital(2)
|
|
|
PV-10(3)
|
|
|
Basin/Shale
|
|
Bcfe
|
|
|
Developed
|
|
|
(MMcfe/d)(1)
|
|
|
Net Acreage
|
|
|
Gross
|
|
|
Net
|
|
|
Gross Wells
|
|
|
(Millions)
|
|
|
(Millions)
|
|
|
|
|
Piceance Basin
|
|
|
2,927
|
|
|
|
53
|
%
|
|
|
734
|
|
|
|
211,000
|
|
|
|
10,708
|
|
|
|
8,496
|
|
|
|
376
|
|
|
$
|
575
|
|
|
$
|
2,707
|
|
|
Bakken Shale(4)
|
|
|
136
|
|
|
|
11
|
%
|
|
|
26
|
|
|
|
89,420
|
|
|
|
758
|
|
|
|
397
|
|
|
|
41
|
|
|
|
260
|
|
|
|
399
|
|
|
Marcellus Shale
|
|
|
28
|
|
|
|
71
|
%
|
|
|
7
|
|
|
|
99,301
|
|
|
|
761
|
|
|
|
450
|
|
|
|
62
|
|
|
|
170
|
|
|
|
29
|
|
|
Powder River Basin
|
|
|
348
|
|
|
|
75
|
%
|
|
|
221
|
|
|
|
425,550
|
|
|
|
2,374
|
|
|
|
1,023
|
|
|
|
411
|
|
|
|
70
|
|
|
|
317
|
|
|
San Juan Basin
|
|
|
554
|
|
|
|
79
|
%
|
|
|
134
|
|
|
|
120,998
|
|
|
|
1,485
|
|
|
|
704
|
|
|
|
51
|
|
|
|
40
|
|
|
|
477
|
|
|
Apco(5)
|
|
|
190
|
|
|
|
60
|
%
|
|
|
51
|
|
|
|
404,304
|
|
|
|
526
|
|
|
|
180
|
|
|
|
37
|
|
|
|
30
|
|
|
|
358
|
|
|
Other(6)
|
|
|
290
|
|
|
|
72
|
%
|
|
|
73
|
|
|
|
327,390
|
|
|
|
2,185
|
|
|
|
112
|
|
|
|
94
|
|
|
|
85
|
|
|
|
257
|
|
|
|
|
|
|
|
|
|
|
|
|
|
|
|
|
|
|
|
|
|
|
|
|
|
|
|
|
|
|
|
|
|
|
|
|
|
|
|
|
Total
|
|
|
4,473
|
|
|
|
59
|
%
|
|
|
1,246
|
|
|
|
1,677,963
|
|
|
|
18,797
|
|
|
|
11,362
|
|
|
|
1,072
|
|
|
$
|
1,230
|
|
|
$
|
4,544
|
|
|
|
|
|
|
|
|
|
|
|
|
|
|
|
|
|
|
|
|
|
|
|
|
|
|
|
|
|
|
|
|
|
|
|
|
|
|
|
|
|
|
|
(1) |
|
Represents average daily net production of our continuing
operations for the month of April 2011. |
|
|
|
|
(2) |
|
Based on the midpoint of our estimated capital spending range. |
| |
|
(3) |
|
PV-10 is a
non-GAAP financial measure and generally differs from
Standardized Measure of Discounted Future Net Cash Flows
(“Standardized Measure”), the most directly comparable
GAAP financial measure, because it does not include the effects
of income taxes on future net revenues. Neither
PV-10 nor
Standardized Measure represents an estimate of the fair market
value of our oil and natural gas assets. We |
1
|
|
|
|
|
|
and others in the industry use
PV-10 as a
measure to compare the relative size and value of proved
reserves held by companies without regard to the specific tax
characteristics of such entities. For a definition of
PV-10 and a
reconciliation of
PV-10 to
Standardized Measure, see “—Summary Combined
Historical Operating and Reserve
Data—Non-GAAP Financial Measures and
Reconciliations” below. |
| |
|
(4) |
|
Our estimated net proved reserves in the Bakken Shale have not
been audited by independent reserve engineers. |
| |
|
(5) |
|
Represents approximately 69 percent of each metric (which
corresponds to our ownership interest in Apco) except Percent
Proved Developed, Gross Identified Drilling Locations, Gross
Wells and Drilling Capital. |
|
|
|
|
(6) |
|
Other includes Barnett Shale, Arkoma and Green River Basins and
miscellaneous smaller properties. April 2011 average daily net
production excludes Arkoma production of approximately 10
MMcfe/d as our Arkoma Basin operations were classified as held
for sale and reported as discontinued operations as of
March 31, 2011. |
In addition to our exploration and development activities, we
engage in natural gas sales and marketing. See
“Business—Gas Management.”
Bakken
Shale and Marcellus Shale Acquisitions
An important part of our strategy to grow our business and
enhance shareholder value is to acquire properties complementary
to our existing positions as well as undeveloped acreage with
significant resource potential in new geographic areas. Our
management team applies a disciplined approach to making
acquisitions and evaluates potential acquisitions of oil and gas
properties based on three key criteria: (i) a location in
the core of a large, unconventional resource area, (ii) the
availability of contiguous, scalable acreage positions and
(iii) the ability to replicate our low-cost model. In 2010,
we invested approximately $1.7 billion on properties in the
Bakken Shale and Marcellus Shale that met these criteria.
Approximately 35 percent of our 2011 drilling capital
budget will be dedicated to our Bakken Shale and Marcellus Shale
properties, and our management currently expects approximately
47 percent of our 2012 drilling expenditures to be
dedicated to properties in these regions.
Bakken
Shale
We have acquired 89,420 net acres in the Williston Basin in
North Dakota that is prospective for oil in the Bakken Shale. We
acquired substantially all of this acreage in December 2010
through the acquisition of Dakota-3 E&P Company LLC for
$949 million in cash. Our entry into the Bakken Shale oil
play is part of our strategy to diversify our commodity exposure
through the addition of oil and liquids-rich development
opportunities to our portfolio.
Currently, we have three rigs operating on our Bakken Shale
acreage. We expect to double our level of drilling activity to
six rigs by early 2012, subject to permitting, rig availability
and the then prevailing commodity price environment. Since
acquiring this acreage, we have drilled 10 operated wells on our
Bakken Shale properties; nine Middle Bakken formation wells and
one Three Forks formation well. Five of these wells have been
completed and connected to sales, with initial 30 day
production rates ranging from 750 Boe/d to 1,100
Boe/d.
Marcellus
Shale
Our 99,301 net acres in the Marcellus Shale were acquired
through two key transactions and additional leasing activities.
In June 2009, we entered into a drill to earn agreement with Rex
Energy Corporation in Pennsylvania’s Westmoreland,
Clearfield and Centre Counties. We have acquired and operate
approximately 22,000 net acres pursuant to such agreement.
Following this initial venture, in July 2010, we acquired
42,000 net acres primarily located in Susquehanna County in
northeastern Pennsylvania for $599 million. In addition,
during 2010 we spent a total of $164 million to acquire
additional unproved leasehold acreage positions in the Marcellus
Shale.
2
Currently, we have five rigs operating in the Marcellus Shale.
We expect to increase our level of drilling activity to eight to
nine rigs by the end of 2012 and continue to increase drilling
activity thereafter, subject to permitting, rig availability and
the then prevailing commodity price environment.
Our
Business Strategy
Our business strategy is to increase shareholder value by
finding and developing reserves and producing natural gas, oil
and NGLs at costs that generate an attractive rate of return on
our investment.
|
|
|
| |
•
|
Efficiently Allocate Capital for Optimal Portfolio
Returns. We expect to allocate capital to the
most profitable opportunities in our portfolio based on
commodity price cycles and other market conditions, enabling us
to continue to grow our reserves and production in a manner that
maximizes our return on investment. In determining which
drilling opportunities to pursue, we target a minimum after-tax
internal rate of return on each operated well we drill of
15 percent. While we have a significant portfolio of
drilling opportunities that we believe meet or exceed our return
targets even in challenging commodity price environments, we are
disciplined in our approach to capital spending and will adjust
our drilling capital expenditures based on our level of expected
cash flows, access to capital and overall liquidity position.
For example, in 2009 we demonstrated our capital discipline by
reducing drilling expenditures in response to prevailing
commodity prices and their impact on these factors.
|
|
|
|
| |
•
|
Continue Our Low-Cost Development Approach. We
focus on developing properties that have a low-cost per unit of
production. We manage costs by focusing on establishing large
scale, contiguous acreage blocks on which we can operate a
majority of the properties. We believe this strategy allows us
to better achieve economies of scale and apply continuous
technological improvements in our operations. We intend to
replicate these cost-disciplined approaches in our recently
acquired growth positions in the Bakken Shale and the Marcellus
Shale.
|
|
|
|
| |
•
|
Pursue Strategic Acquisitions with Significant Resource
Potential. We have a history of acquiring
undeveloped properties that meet our disciplined return
requirements and other acquisition criteria to expand upon our
existing positions as well as acquiring undeveloped acreage in
new geographic areas that offer significant resource potential.
This is illustrated by our recent acquisitions in the Bakken
Shale and the Marcellus Shale. We seek to continue expansion of
current acreage positions and opportunistically acquire acreage
positions in new areas where we feel we can establish
significant scale and replicate our low-cost development
approach.
|
| |
| |
•
|
Target a More Balanced Commodity Mix in Our Production
Profile. With our Bakken Shale acquisition in
December 2010 and our liquids-rich Piceance Basin assets, we
have a significant drilling inventory of oil- and liquids-rich
opportunities that we intend to develop rapidly in order to
achieve a more balanced commodity mix in our production. We will
continue to pursue other oil- and liquids-rich organic
development and acquisition opportunities that meet our
investment returns and strategic criteria.
|
|
|
|
| |
•
|
Maintain Substantial Financial Liquidity and Manage Commodity
Price Sensitivity. We plan to conservatively
manage our balance sheet and maintain substantial liquidity
through a mix of cash on hand and availability under our credit
facility. In addition, we have engaged and will continue to
engage in commodity hedging activities to maintain a degree of
cash flow stability. Typically, we target hedging approximately
50 percent of expected revenue from domestic production
during a current calendar year in order to strike an appropriate
balance of commodity price upside with cash flow protection,
although we may vary from this level based on our perceptions of
market risk. At April 30, 2011, our estimated domestic
natural gas production revenues were 65 percent hedged for
2011 and 43 percent hedged for 2012. Estimated domestic oil
production revenues were 49 percent hedged for 2011 and
49 percent hedged for 2012 as of the same date.
|
3
Our
Competitive Strengths
We have a number of competitive strengths that we believe will
help us to successfully execute our business strategies:
|
|
|
| |
•
|
A Leading Piceance Basin Cost Structure. We
have a large position in the lower cost valley area of the
Piceance Basin, which we believe provides us economies
associated with lower elevation drilling and large contiguous
operations, allowing us to continuously drive down operating
costs and increase efficiencies. The existing substantial
midstream infrastructure in the Piceance Basin contributes to
our low-cost structure and provides take-away capacity for our
natural gas and NGLs. Because of this low-cost structure in the
Piceance Basin, we have the ability to generate returns that we
believe are in excess of those typically associated with Rockies
producers.
|
|
|
|
| |
•
|
Attractive Asset Base Across a Number of High Growth
Areas. In addition to our large scale Piceance
Basin properties, our assets include emerging, high growth
opportunities such as our Bakken Shale and Marcellus Shale
positions. Based on our subsurface geological and engineering
analysis of available well data, we believe our Bakken Shale and
Marcellus Shale positions are located in core areas of these
plays, which have associated historic drilling results that we
believe offer highly attractive economic returns.
|
| |
| |
•
|
Extensive Drilling Inventory. As of
December 31, 2010, we have identified approximately
14,000 gross operated drilling locations, for which
approximately 500 gross operated wells are budgeted for
2011. We have established significant scale in each of our core
areas of operation that support multi-year development plans and
allow us to optimally leverage our low-cost development
approach. Our drilling inventory provides opportunities across
diverse geographic markets and products including natural gas,
oil and NGLs.
|
| |
| |
•
|
Significant Operating Flexibility. In the
Piceance Basin, Bakken Shale and Marcellus Shale, our three
primary basins, we operate substantially all of our production.
We expect approximately 91 percent of our projected 2011
domestic drilling capital will be spent on projects we operate.
We believe acting as operator on our properties allows us to
better control costs and capital expenditures, manage
efficiencies, optimize development pace, ensure safety and
environmental stewardship and, ultimately, maximize our return
on investment. As operator, we are also able to leverage our
experience and expertise across all basins and transfer
technology advances between them as applicable. In addition,
substantially all of our Piceance Basin properties are held by
producing wells, which allows us to adjust our level of drilling
activity in response to changing market conditions.
|
| |
| |
•
|
Significant Financial Flexibility. Our capital
structure is intended to provide a high degree of financial
flexibility to grow our asset base, both through organic
projects and opportunistic acquisitions. Immediately following
the completion of this offering, we expect to have
$2.0 billion of liquidity, comprised of availability under
our $1.5 billion credit facility and approximately
$500 million of cash on hand. We believe our pro forma
level of debt to proved reserves is low relative to a majority
of other publicly traded, independent oil and gas producers.
|
| |
| |
•
|
Management Team with Broad Unconventional Resource
Experience. Our management and operating team has
significant experience acquiring, operating and developing
natural gas and oil reserves from tight-sands and shale
formations. Our Chief Executive Officer and his direct reports
have in excess of 238 collective years of experience running
large scale drilling programs and drilling vertical and
horizontal wells requiring complex well design and completion
methods. Our team has demonstrated the ability to manage large
scale operations and apply current technological successes to
new development opportunities. We have deployed members of our
successful Piceance Basin, Powder River Basin and Barnett Shale
teams to the Bakken Shale and Marcellus Shale teams to help
replicate our low-cost model and to apply our highly specialized
technical expertise in the development of those resources.
|
4
Our
Relationship with Williams
We are currently a wholly-owned subsidiary of The Williams
Companies, Inc., an integrated energy company with 2010
consolidated revenues in excess of $9 billion that trades
on the New York Stock Exchange (“NYSE”) under the
symbol “WMB.” We were formed in April 2011 to hold
Williams’ exploration and production business and to effect
this offering and the related transactions.
Upon the completion of this offering, we will be a public
company, and investors in this offering will own all of our
outstanding Class A common stock. Williams will not own any
of our Class A common stock, but will directly own all of
our outstanding Class B common stock, which will represent
approximately
percent of the total shares of common stock outstanding and
approximately
percent of the combined voting power of all outstanding classes
of our common stock, or
approximately percent
and percent,
respectively, if the underwriters exercise their option to
purchase additional Class A common shares in full. As a
result, Williams will have the ability to elect all of the
members of our board of directors and to determine the outcome
of other matters submitted to a vote of our stockholders. For a
discussion of related risks, please read “Risk
Factors—Risks Related to Our Relationship with
Williams.”
We intend to distribute to Williams a substantial portion of the
proceeds we receive in this offering and our concurrent sale of
debt securities. See “Use of Proceeds.” Williams has
advised us that it intends to use the funds it receives from the
proceeds of this offering and our concurrent sale of debt
securities to repay a portion of its indebtedness, and that
following the completion of this offering, it intends to
distribute all of the shares of our common stock that it owns
through a tax-free distribution, or spin-off, to Williams’
stockholders. The determination of whether, and if so, when, to
proceed with the spin-off is entirely within the discretion of
Williams, although Williams has indicated its intention to
complete the spin-off in 2012 and to convert its Class B
common shares to Class A common shares immediately prior to
such spin-off, assuming such conversion would not jeopardize the
ability to consummate the tax-free distribution or the tax-free
treatment of any related restructuring transaction undertaken by
Williams. Williams has the sole discretion to determine the
form, the structure and all other terms of any transactions to
effect the spin-off. If Williams does not proceed with the
spin-off, it could elect to dispose of our Class B common
stock, or the Class A common stock into which the
Class B common stock is convertible, in a number of
different types of transactions, including additional public
offerings, open market sales, sales to one or more third parties
or split-off offerings that would allow Williams’
stockholders the opportunity to exchange Williams shares for
shares of our common stock or a combination of these
transactions. Except for the
“lock-up”
period described under “Underwriting,” Williams is not
subject to any contractual obligation to maintain its
Class B share ownership. For more information on the
potential effects of Williams’ disposition of our common
stock by means of the anticipated spin-off or otherwise, please
read “Risk Factors—Risks Related to Our Relationship
with Williams.”
We currently depend on Williams for a number of administrative
functions. Prior to the completion of this offering, we will
enter into agreements with Williams related to the separation of
our business operations from Williams. These agreements will be
in effect as of the completion of this offering and will govern
various interim and ongoing relationships between Williams and
us, including the extent and manner of our dependence on
Williams for administrative services following the completion of
this offering. Under the terms of these agreements, we are
entitled to the ongoing assistance of Williams only for a
limited period of time following the spin-off. For more
information regarding these agreements, see “Arrangements
Between Williams and Our Company” and the historical
combined financial statements and the notes thereto included
elsewhere in this prospectus. All of the agreements relating to
our separation from Williams will be made in the context of a
parent-subsidiary relationship and will be entered into in the
overall context of our separation from Williams. The terms of
these agreements may be more or less favorable to us than if
they had been negotiated with unaffiliated third parties. See
“Risk Factors—Risks Related to Our Relationship with
Williams—We may have potential business conflicts of
interest with Williams regarding our past and ongoing
relationships, and because of Williams’ controlling
ownership in us, the resolution of these conflicts may not be
favorable to us.”
Our planned two-step separation process ((1) our initial public
offering and concurrent sale of debt securities, including a
distribution of a portion of the proceeds to Williams, followed
by (2) a spin-off of our
5
common stock in the form of a distribution by Williams to its
stockholders) provides us with capital and enables Williams to
repay debt while simultaneously achieving the benefits of our
complete separation from Williams in a tax-efficient manner. In
addition, we believe that our separation from Williams will
enable us to realize the following benefits:
|
|
|
| |
•
|
Focused management attention. Our separation
from Williams will allow us to focus managerial attention solely
on our business, resulting in stream-lined decision making, more
efficient deployment of resources and increased operational
flexibility.
|
| |
| |
•
|
Direct access to the debt and equity capital
markets. As a separate public company, we will
have direct access to the capital markets, thereby enabling us
to optimize our capital structure to meet the specific needs of
our business.
|
| |
| |
•
|
Enhancing our market recognition with
investors. We believe our simpler corporate
structure with a single business segment will allow us to fit
more purely into an exploration and production investor sector
and attract pure play investors.
|
|
|
|
| |
•
|
Improving our ability to pursue
acquisitions. As a stand alone exploration and
production company, we will be better positioned to use our
equity securities as capital in pursuing merger and acquisition
activities. However, we will be subject to certain requirements,
such as (1) prior to the spin-off to Williams’ shareholders
of its retained shares in us, Williams must satisfy certain 80%
ownership thresholds and (2) after the spin-off, we must avoid a
50% or greater change in our ownership in transactions related
to the spin-off. Both of these limitations are necessary in
order to maintain the tax-free treatment of our separation from
Williams. See “Risk Factors—Risks Related to our
Relationship with Williams—Our agreements with Williams may
limit our ability to obtain additional financing or make
acquisitions,” and “Risk Factors—Risks Related to
our Relationship with Williams—Our tax sharing agreement
with Williams may limit our ability to take certain actions and
may require us to indemnify Williams for significant tax
liabilities.”
|
Our
Restructuring
Prior to the completion of this offering:
|
|
|
| |
•
|
Williams will contribute and transfer to us the assets and
liabilities associated with our business and will forgive or
contribute to our capital all intercompany debt associated with
our business;
|
| |
| |
•
|
we will effect a recapitalization whereby the outstanding shares
of our common stock, all of which are owned by Williams, will be
reclassified into shares of
Class B common stock in exchange for all of the assets (net
of the liabilities assumed and the cash we distribute to
Williams) contributed to us by Williams, and a new Class A
common stock will be authorized; and
|
| |
| |
•
|
we will amend and restate our certificate of incorporation and
bylaws.
|
We refer to these transactions as our “restructuring
transactions.”
Concurrent
Financing Transactions
On June 3, 2011, we entered into a new five-year
$1.5 billion senior unsecured revolving credit facility
agreement (the “Credit Facility”), which will become
effective upon the completion of this offering and for which we
will pay associated financing costs. Concurrently with or
shortly following the consummation of this offering, we expect
to issue up to $1.5 billion aggregate principal amount of
senior unsecured notes (the “Notes”) and pay
associated financing costs. The offering of our Class A
common stock is not contingent upon the effectiveness of the
Credit Facility or the completion of the offering of the Notes.
See “Description of Our Concurrent Financing
Transactions” for a more detailed description of these
transactions.
6
Risk
Factors
Investing in our Class A common stock involves substantial
risk. You should carefully consider all of the information in
this prospectus and, in particular, you should evaluate the risk
factors and other cautionary statements set forth under
“Risk Factors” beginning on page 17 in deciding
whether to invest in our Class A common stock. In
particular:
|
|
|
| |
•
|
Our business requires significant capital expenditures and we
may be unable to obtain needed capital or financing on
satisfactory terms.
|
| |
| |
•
|
Failure to replace reserves may negatively affect our business.
|
| |
| |
•
|
Exploration and development drilling may not result in
commercially productive reserves.
|
| |
| |
•
|
Estimating reserves and future net revenues involves
uncertainties. Decreases in natural gas and oil prices, or
negative revisions to reserve estimates or assumptions as to
future natural gas and oil prices may lead to decreased
earnings, losses or impairment of natural gas and oil assets.
|
| |
| |
•
|
Prices for natural gas, oil and NGLs are volatile, and this
volatility could adversely affect our financial results, cash
flows, access to capital and ability to maintain our existing
business.
|
| |
| |
•
|
Our business depends on access to natural gas, oil and NGL
transportation systems and facilities.
|
| |
| |
•
|
Our risk management and measurement systems and hedging
activities might not be effective and could increase the
volatility of our results.
|
| |
| |
•
|
Our operations are subject to operational hazards and unforeseen
interruptions for which they may not be adequately insured.
|
| |
| |
•
|
Our operations are subject to governmental laws and regulations
relating to the protection of the environment, including with
respect to hydraulic fracturing, which may expose us to
significant costs and liabilities and could exceed current
expectations.
|
| |
| |
•
|
Certain of our properties, including our operations in the
Bakken Shale, are located on Native American tribal lands and
are subject to various federal and tribal approvals and
regulations, which may increase our costs and delay or prevent
our efforts to conduct planned operations.
|
| |
| |
•
|
Our acquisition attempts may not be successful or may result in
completed acquisitions that do not perform as anticipated.
|
| |
| |
•
|
Our historical and pro forma combined financial information may
not be representative of the results we would have achieved as a
stand-alone public company and may not be a reliable indicator
of our future results.
|
| |
| |
•
|
As long as we are controlled by Williams, your ability to
influence the outcome of matters requiring stockholder approval
will be limited.
|
Principal
Executive Offices
WPX was incorporated under the laws of the State of Delaware in
April 2011 and, until the completion of this offering, will be a
wholly-owned subsidiary of Williams. Our principal executive
offices are located at One Williams Center, Tulsa, Oklahoma
74172. Our telephone number is
918-573-2000.
Our website address will
be .
Information contained on our website is not incorporated by
reference into this prospectus, and you should not consider
information on our website as part of this prospectus.
7
The
Offering
|
|
|
|
Issuer |
|
WPX Energy, Inc. |
| |
|
Class A common stock offered |
|
shares. |
| |
|
Common stock outstanding after this offering: |
|
|
| |
|
Class A common stock
|
|
shares,
or shares
if the underwriters exercise their option to purchase additional
Class A common shares in full. |
| |
|
Class B common stock
|
|
shares,
or shares
if the underwriters exercise their option to purchase additional
Class A common shares in full. |
| |
|
Total common stock
|
|
shares.
Any shares of Class A common stock issued pursuant to the
underwriters’ over-allotment option will not increase the
total number of shares of common stock outstanding after this
offering, but rather the number of shares of Class B common
stock owned by Williams will be reduced share for share by the
number of shares of Class A common stock issued pursuant to
such over-allotment option. |
| |
|
Common stock to be held by Williams after this offering: |
|
|
| |
|
Class A common stock
|
|
None. |
| |
|
Class B common stock
|
|
shares,
or shares
if the underwriters exercise their option to purchase additional
Class A common shares in full. |
| |
|
Common stock voting rights: |
|
|
| |
|
Class A common stock
|
|
One vote per share on all matters to be voted on by
stockholders, representing in aggregate
approximately
percent of the combined voting power of our outstanding common
stock,
or
percent if the underwriters exercise their option to purchase
additional Class A common shares in full. |
| |
|
Class B common stock
|
|
Ten votes per share on all matters to be voted on by
stockholders, representing in aggregate
approximately
percent of the combined voting power of our outstanding common
stock,
or
percent if the underwriters exercise their option to purchase
additional Class A common shares in full. |
|
|
|
|
Use of proceeds |
|
We estimate that our net proceeds from the sale of shares of
Class A common stock in this offering, after deducting
estimated underwriting discounts and commissions and estimated
offering expenses, will be approximately
$ million
($ million if the
underwriters exercise their option to purchase additional
Class A common shares in full), assuming the shares are
offered at $ per share of
Class A common stock, which is the midpoint of the
estimated offering price range set forth on the cover page of
this prospectus. We expect to retain approximately
$500 million of the net proceeds from this offering. At
current commodity prices, we expect as much as 50 percent of
these proceeds could be used for capital expenditures for
drilling and facilities projects, with the remainder available
to provide additional liquidity and for acquisition, exploration
and general corporate purposes. As part of our |
8
|
|
|
|
|
|
restructuring transactions, the remainder of the net proceeds of
this offering will be distributed to Williams. See “Use of
Proceeds.” |
| |
|
Dividend policy |
|
We do not anticipate paying any dividends on our common stock in
the foreseeable future. See “Dividend Policy.” |
| |
|
Exchange Listing |
|
We intend to apply to have our shares of Class A common
stock listed on the NYSE under the symbol “WPX.” |
Unless we specifically state otherwise, all information in this
prospectus regarding our Class A common stock:
|
|
|
| |
•
|
gives effect to our restructuring transactions;
|
| |
| |
•
|
assumes no exercise by the underwriters of their option to
purchase additional Class A common shares; and
|
| |
| |
•
|
excludes shares of Class A common stock reserved for
issuance, if any, under equity incentive plans.
|
9
Summary
Combined Historical and Unaudited Pro Forma Combined Financial
Data
Set forth below is our summary combined historical and unaudited
pro forma combined financial data for the periods indicated. The
historical unaudited combined financial data for the three
months ended March 31, 2011 and 2010 and balance sheet data as
of March 31, 2011 have been derived from our unaudited condensed
combined financial statements included in this prospectus. The
unaudited condensed combined financial statements have been
prepared on the same basis as our audited combined financial
statements, except as stated in the related notes thereto, and
include all normal recurring adjustments that, in the opinion of
management, are necessary to present fairly our financial
condition and result of operations for such periods. The results
of operations for the three months ended March 31, 2011
presented below are not necessarily indicative of results for
the entire fiscal year. The historical financial data for the
years ended December 31, 2010, 2009 and 2008 and the
balance sheet data as of December 31, 2010 and 2009 have
been derived from our audited combined financial statements
included in this prospectus.
The pro forma financial data was prepared as if the transactions
described below had occurred as of January 1, 2010. The pro
forma financial data gives effect to the following transactions:
|
|
|
| |
•
|
the completion of our restructuring transactions, including the
forgiveness or contribution to our capital of the unsecured
notes payable to Williams;
|
|
|
|
| |
•
|
the receipt of approximately $705 million from the sale of
shares of Class A common stock offered by us at an assumed
initial public offering price of $
per share, which is the midpoint of the estimated offering price
range set forth on the cover page of this prospectus, after
deducting estimated underwriting discounts and commissions and
estimated offering expenses payable by us;
|
|
|
|
| |
•
|
the receipt of approximately $1.5 billion from our expected
offering of the Notes, after deducting the discounts of the
initial purchasers of the Notes and the expenses payable by us
in connection with such offering; and
|
|
|
|
| |
•
|
the distribution of approximately $1.7 billion to Williams
from the combined net proceeds from this offering and the
expected offering of the Notes in connection with our
restructuring transactions.
|
You should read the following summary financial data in
conjunction with “Management’s Discussion and Analysis
of Financial Condition and Results of Operations” and our
historical and pro forma financial statements and related notes
thereto appearing elsewhere in this prospectus.
The unaudited pro forma combined financial data does not purport
to represent what our financial position and results of
operations actually would have been had the restructuring
transactions occurred on the dates indicated or to project our
future financial performance.
10
| |
|
|
|
|
|
|
|
|
|
|
|
|
|
|
|
|
|
|
|
|
|
|
|
|
|
|
|
|
|
|
|
Pro Forma Three
|
|
|
Pro Forma
|
|
|
|
|
|
|
|
|
|
|
Months Ended
|
|
|
Year Ended
|
|
|
Historical Three Months
|
|
|
Historical Year Ended
|
|
|
|
|
March 31,
|
|
|
December 31,
|
|
|
Ended March 31,
|
|
|
December 31,
|
|
|
|
|
2011
|
|
|
2010
|
|
|
2011
|
|
|
2010
|
|
|
2010
|
|
|
2009
|
|
|
2008
|
|
|
|
|
(Millions)
|
|
|
|
|
|
|
|
Statement of Operations Data:
|
|
|
|
|
|
|
|
|
|
|
|
|
|
|
|
|
|
|
|
|
|
|
|
|
|
|
|
|
|
Revenues, including affiliate(1)
|
|
$
|
984
|
|
|
$
|
4,034
|
|
|
$
|
984
|
|
|
$
|
1,164
|
|
|
$
|
4,034
|
|
|
$
|
3,681
|
|
|
$
|
6,184
|
|
|
Costs and expenses:
|
|
|
|
|
|
|
|
|
|
|
|
|
|
|
|
|
|
|
|
|
|
|
|
|
|
|
|
|
|
Lease and facility operating, including affiliate
|
|
|
70
|
|
|
|
286
|
|
|
|
70
|
|
|
|
66
|
|
|
|
286
|
|
|
|
263
|
|
|
|
272
|
|
|
Gathering, processing and transportation, including affiliate
|
|
|
115
|
|
|
|
326
|
|
|
|
115
|
|
|
|
72
|
|
|
|
326
|
|
|
|
273
|
|
|
|
229
|
|
|
Taxes other than income
|
|
|
31
|
|
|
|
125
|
|
|
|
31
|
|
|
|
40
|
|
|
|
125
|
|
|
|
93
|
|
|
|
254
|
|
|
Gas management (including charges for unutilized pipeline
capacity)
|
|
|
417
|
|
|
|
1,771
|
|
|
|
417
|
|
|
|
558
|
|
|
|
1,771
|
|
|
|
1,495
|
|
|
|
3,248
|
|
|
Exploration
|
|
|
13
|
|
|
|
73
|
|
|
|
13
|
|
|
|
8
|
|
|
|
73
|
|
|
|
54
|
|
|
|
37
|
|
|
Depreciation, depletion and amortization
|
|
|
216
|
|
|
|
875
|
|
|
|
216
|
|
|
|
216
|
|
|
|
875
|
|
|
|
887
|
|
|
|
738
|
|
|
Impairment of producing properties and costs of acquired
unproved reserves
|
|
|
—
|
|
|
|
678
|
|
|
|
—
|
|
|
|
—
|
|
|
|
678
|
|
|
|
15
|
|
|
|
—
|
|
|
Goodwill impairment
|
|
|
—
|
|
|
|
1,003
|
|
|
|
—
|
|
|
|
—
|
|
|
|
1,003
|
|
|
|
—
|
|
|
|
—
|
|
|
General and administrative, including affiliate
|
|
|
70
|
|
|
|
253
|
|
|
|
70
|
|
|
|
61
|
|
|
|
253
|
|
|
|
251
|
|
|
|
247
|
|
|
Gain on sale of contractual right to international production
payment
|
|
|
—
|
|
|
|
—
|
|
|
|
—
|
|
|
|
—
|
|
|
|
—
|
|
|
|
—
|
|
|
|
(148
|
)
|
|
Other—net
|
|
|
3
|
|
|
|
(19
|
)
|
|
|
3
|
|
|
|
—
|
|
|
|
(19
|
)
|
|
|
33
|
|
|
|
6
|
|
|
|
|
|
|
|
|
|
|
|
|
|
|
|
|
|
|
|
|
|
|
|
|
|
|
|
|
|
|
|
|
Total costs and expenses
|
|
|
935
|
|
|
|
5,371
|
|
|
|
935
|
|
|
|
1,021
|
|
|
|
5,371
|
|
|
|
3,364
|
|
|
|
4,883
|
|
|
Operating income (loss)
|
|
|
49
|
|
|
|
(1,337
|
)
|
|
|
49
|
|
|
|
143
|
|
|
|
(1,337
|
)
|
|
|
317
|
|
|
|
1,301
|
|
|
Interest expense, including affiliate
|
|
|
(27
|
)
|
|
|
(103
|
)
|
|
|
(49
|
)
|
|
|
(25
|
)
|
|
|
(124
|
)
|
|
|
(100
|
)
|
|
|
(74
|
)
|
|
Interest capitalized
|
|
|
4
|
|
|
|
16
|
|
|
|
4
|
|
|
|
4
|
|
|
|
16
|
|
|
|
18
|
|
|
|
20
|
|
|
Investment income and other
|
|
|
6
|
|
|
|
21
|
|
|
|
6
|
|
|
|
5
|
|
|
|
21
|
|
|
|
8
|
|
|
|
22
|
|
|
|
|
|
|
|
|
|
|
|
|
|
|
|
|
|
|
|
|
|
|
|
|
|
|
|
|
|
|
|
|
Income (loss) before income taxes
|
|
|
32
|
|
|
|
(1,403
|
)
|
|
|
10
|
|
|
|
127
|
|
|
|
(1,424
|
)
|
|
|
243
|
|
|
|
1,269
|
|
|
Provision (benefit) for income taxes
|
|
|
11
|
|
|
|
(142
|
)
|
|
|
3
|
|
|
|
44
|
|
|
|
(150
|
)
|
|
|
94
|
|
|
|
452
|
|
|
|
|
|
|
|
|
|
|
|
|
|
|
|
|
|
|
|
|
|
|
|
|
|
|
|
|
|
|
|
|
Income (loss) from continuing operations(2)
|
|
|
21
|
|
|
|
(1,261
|
)
|
|
|
7
|
|
|
|
83
|
|
|
|
(1,274
|
)
|
|
|
149
|
|
|
|
817
|
|
|
Loss from discontinued operations(3)
|
|
|
(8
|
)
|
|
|
(8
|
)
|
|
|
(8
|
)
|
|
|
—
|
|
|
|
(8
|
)
|
|
|
(7
|
)
|
|
|
(87
|
)
|
|
|
|
|
|
|
|
|
|
|
|
|
|
|
|
|
|
|
|
|
|
|
|
|
|
|
|
|
|
|
|
Net income (loss)
|
|
$
|
13
|
|
|
$
|
(1,269
|
)
|
|
|
(1
|
)
|
|
|
83
|
|
|
|
(1,282
|
)
|
|
|
142
|
|
|
|
730
|
|
|
|
|
|
|
|
|
|
|
|
|
|
|
|
|
|
|
|
|
|
|
|
|
|
|
|
|
|
|
|
|
Less: Net income attributable to noncontrolling interests
|
|
|
|
|
|
|
|
|
|
|
2
|
|
|
|
2
|
|
|
|
8
|
|
|
|
6
|
|
|
|
8
|
|
|
|
|
|
|
|
|
|
|
|
|
|
|
|
|
|
|
|
|
|
|
|
|
|
|
|
|
|
|
|
|
|
|
|
|
|
|
|
|
|
|
|
|
|
|
|
|
|
|
|
|
|
|
|
|
|
|
|
|
|
|
Net income (loss) attributable to WPX Energy
|
|
|
|
|
|
|
|
|
|
$
|
(3
|
)
|
|
$
|
81
|
|
|
$
|
(1,290
|
)
|
|
$
|
136
|
|
|
$
|
722
|
|
|
|
|
|
|
|
|
|
|
|
|
|
|
|
|
|
|
|
|
|
|
|
|
|
|
|
|
|
|
|
|
|
|
|
(1) |
|
Includes gas management revenues of $408 million and
$556 million for the three months ended March 31, 2011
and 2010, respectively and $1,742 million,
$1,456 million and $3,241 million for the year ended
December 31, 2010, 2009 and 2008, respectively. These
revenues were offset by the gas management expenses |
11
|
|
|
|
|
|
shown in the table above. See “Management’s Discussion
and Analysis of Financial Condition and Results of
Operations—Results of Operations.” |
|
|
|
|
(2) |
|
Loss from continuing operations in 2010 includes
$1.7 billion of impairment charges related to goodwill,
producing properties in the Barnett Shale and costs of acquired
unproved reserves in the Piceance Basin. Income from continuing
operations in 2008 includes a $148 million gain related to
the sale of a right to an international production payment. See
Notes 6 and 14 of Notes to Combined Financial Statements
for further discussion of asset sales, impairments and other
accruals in 2010, 2009 and 2008. |
|
|
|
|
(3) |
|
Loss from discontinued operations includes our Arkoma operations
which were classified as held for sale in the first quarter of
2011 and activities associated with Williams’ former power
business that was substantially disposed of in 2007. The loss in
2008 includes a $148 million pre-tax impairment of the
Arkoma producing properties. |
| |
|
|
|
|
|
|
|
|
|
|
|
|
|
|
|
|
|
|
|
Pro Forma
|
|
|
Historical
|
|
|
Historical
|
|
|
|
|
At March 31,
|
|
|
At March 31,
|
|
|
At December 31,
|
|
|
|
|
2011
|
|
|
2011
|
|
|
2010
|
|
|
2009
|
|
|
|
|
(Millions)
|
|
|
|
|
Balance Sheet Data:
|
|
|
|
|
|
|
|
|
|
|
|
|
|
|
|
|
|
Cash and cash equivalents
|
|
$
|
540
|
|
|
$
|
40
|
|
|
$
|
37
|
|
|
$
|
34
|
|
|
Properties and equipment, net
|
|
|
8,503
|
|
|
|
8,503
|
|
|
|
8,449
|
|
|
|
7,662
|
|
|
Total assets
|
|
|
10,291
|
|
|
|
9,764
|
|
|
|
9,846
|
|
|
|
10,553
|
|
|
Unsecured notes payable to Williams—current
|
|
|
—
|
|
|
|
2,364
|
|
|
|
2,261
|
|
|
|
1,216
|
|
|
Senior unsecured notes
|
|
|
1,500
|
|
|
|
—
|
|
|
|
—
|
|
|
|
—
|
|
|
Total equity
|
|
|
5,785
|
|
|
|
4,440
|
|
|
|
4,500
|
|
|
|
5,405
|
|
|
Total liabilities and equity
|
|
|
10,291
|
|
|
|
9,764
|
|
|
|
9,846
|
|
|
|
10,553
|
|
| |
|
|
|
|
|
|
|
|
|
|
|
|
|
|
|
|
|
|
|
|
|
|
|
|
|
|
|
|
|
|
|
Pro Forma
|
|
|
|
|
|
|
|
|
|
|
|
|
|
Three Months
|
|
|
Pro Forma
|
|
|
|
|
|
|
|
|
|
|
Ended
|
|
|
Year Ended
|
|
|
Historical Three Months
|
|
|
|
|
|
|
|
March 31,
|
|
|
December 31,
|
|
|
Ended March 31,
|
|
|
Historical Year Ended December 31,
|
|
|
|
|
2011
|
|
|
2010
|
|
|
2011
|
|
|
2010
|
|
|
2010
|
|
|
2009
|
|
|
2008
|
|
|
|
|
(Millions)
|
|
|
|
|
Other Financial Data:
|
|
|
|
|
|
|
|
|
|
|
|
|
|
|
|
|
|
|
|
|
|
|
|
|
|
|
|
|
|
Net cash provided by operating activities
|
|
|
|
|
|
|
|
|
|
$
|
240
|
|
|
$
|
329
|
|
|
$
|
1,056
|
|
|
$
|
1,181
|
|
|
$
|
2,009
|
|
|
Net cash used in investing activities
|
|
|
|
|
|
|
|
|
|
|
(342
|
)
|
|
|
(286
|
)
|
|
|
(2,337
|
)
|
|
|
(1,435
|
)
|
|
|
(2,252
|
)
|
|
Net cash provided (used) by financing activities
|
|
|
|
|
|
|
|
|
|
|
105
|
|
|
|
(39
|
)
|
|
|
1,284
|
|
|
|
256
|
|
|
|
225
|
|
|
Adjusted EBITDAX(1)
|
|
$
|
288
|
|
|
$
|
1,329
|
|
|
|
288
|
|
|
|
376
|
|
|
|
1,329
|
|
|
|
1,299
|
|
|
|
1,970
|
|
|
Capital expenditures
|
|
|
|
|
|
|
|
|
|
|
(319
|
)
|
|
|
(284
|
)
|
|
|
(1,856
|
)
|
|
|
(1,434
|
)
|
|
|
(2,467
|
)
|
|
|
|
|
(1) |
|
Adjusted EBITDAX is a non-GAAP financial measure. For a
definition of Adjusted EBITDAX and a reconciliation of Adjusted
EBITDAX to our net income (loss), see “—Summary
Combined Historical Operating and Reserve
Data—Non-GAAP Financial Measures and
Reconciliations” below. |
12
Summary
Combined Historical Operating and Reserve Data
The following table presents summary combined data with respect
to our estimated net proved natural gas and oil reserves as of
the dates indicated. Approximately 93 percent of our
year-end 2010 U.S. proved reserves estimates were audited
by Netherland, Sewell & Associates, Inc.
(“NSAI”) and approximately one percent were audited by
Miller and Lents, Ltd. (“M&L”). Approximately
96 percent of Apco’s year-end 2010 proved reserves
estimates (which constitute approximately 94 percent of our
year-end 2010 proved reserves estimates for international
properties) were reviewed and certified by Ralph E. Davis
Associates, Inc. In the judgment of these independent reserve
petroleum engineers, our estimates reviewed in their respective
reports are, in the aggregate, reasonable and have been prepared
in accordance with the Standards Pertaining to the Estimating
and Auditing of Oil and Gas Reserves Information promulgated by
the Society of Petroleum Engineers. Because our acquisition in
the Bakken Shale was completed in late December 2010, our
year-end estimated reserves for those properties are based on
internal estimates only. All of the reserve estimates mentioned
above were prepared in a manner consistent with the rules of the
Securities and Exchange Commission (the “SEC”)
regarding oil and natural gas reserve reporting that are
currently in effect. You should refer to “Risk
Factors,” “Management’s Discussion and Analysis
of Financial Condition and Results of Operations” and
“Business” when evaluating the material presented
below.
| |
|
|
|
|
|
|
|
|
|
|
|
At December 31,
|
|
|
|
|
2010
|
|
|
2009
|
|
|
|
|
Estimated Proved Reserves(1)
|
|
|
|
|
|
|
|
|
|
Natural Gas (Bcf)(2)
|
|
|
4,214
|
|
|
|
4,316
|
|
|
Oil (MMbbls)
|
|
|
43
|
|
|
|
23
|
|
|
Total (Bcfe)
|
|
|
4,473
|
|
|
|
4,452
|
|
|
PV-10 (in
millions)
|
|
$
|
4,544
|
|
|
$
|
2,620
|
|
|
Standardized Measure of Discounted Future Net Cash Flows (in
millions)(3)
|
|
$
|
3,080
|
|
|
$
|
1,923
|
|
|
|
|
|
(1) |
|
Includes approximately 69 percent of Apco’s reserves, which
corresponds to our ownership interest in Apco. Our estimated
proved reserves for domestic properties,
PV-10 and
Standardized Measure were derived using an average price of
$2.72 per Mcf of natural gas and $48.63 per barrel of oil during
2009 and $3.51 per Mcf of natural gas and $68.89 per barrel of
oil during 2010. Our prices were calculated using the
12-month
average,
first-of-the-month
price for the applicable indices for each basin as adjusted for
locational price differentials. The
12-month
average beginning of the month price for Apco properties was
$1.93 per MMbtu of natural gas and $43.62 per barrel of oil for
2009 and $1.63 per MMbtu of natural gas and $52.11 per barrel of
oil for 2010. |
|
|
|
|
(2) |
|
Net wellhead natural gas reserves at December 31, 2010 and
2009 included approximately 99 MMbbls and 69 MMbbls,
respectively, of NGLs to be extracted downstream at processing
plants. The gas volume shrink associated with this processing is
approximately 216 Bcf and 164 Bcf, respectively, or
approximately 4.8 percent and 3.7 percent, respectively, of
our total proved reserves volumes. |
|
|
|
|
(3) |
|
Standardized Measure represents the present value of estimated
future cash inflows from proved natural gas and oil reserves,
less future development and production costs and income tax
expenses, discounted at ten percent per annum to reflect timing
of future cash flows and using the same pricing assumptions as
were used to calculate
PV-10.
Standardized Measure differs from
PV-10
because Standardized Measure includes the effect of future
income taxes. For a reconciliation of the non-GAAP financial
measure of
PV-10 to
Standardized Measure, the most directly comparable GAAP
financial measure, see “—Non-GAAP Financial
Measures and Reconciliations” below. |
13
The following table summarizes our net production for the years
indicated.
| |
|
|
|
|
|
|
|
|
|
|
|
|
|
|
|
Year Ended December 31,
|
|
|
|
|
2010
|
|
|
2009
|
|
|
2008
|
|
|
|
|
Production Data:
|
|
|
|
|
|
|
|
|
|
|
|
|
|
Natural Gas (MMcf)
|
|
|
|
|
|
|
|
|
|
|
|
|
|
U.S.
|
|
|
|
|
|
|
|
|
|
|
|
|
|
Piceance Basin
|
|
|
245,895
|
|
|
|
254,617
|
|
|
|
237,675
|
|
|
Other(1)
|
|
|
158,040
|
|
|
|
167,678
|
|
|
|
153,206
|
|
|
Argentina(2)
|
|
|
7,304
|
|
|
|
7,728
|
|
|
|
6,392
|
|
|
|
|
|
|
|
|
|
|
|
|
|
|
|
|
Total
|
|
|
411,239
|
|
|
|
430,023
|
|
|
|
397,273
|
|
|
Oil (MBbls)
|
|
|
|
|
|
|
|
|
|
|
|
|
|
U.S.
|
|
|
859
|
|
|
|
803
|
|
|
|
731
|
|
|
Argentina(2)
|
|
|
2,035
|
|
|
|
1,998
|
|
|
|
1,991
|
|
|
|
|
|
|
|
|
|
|
|
|
|
|
|
|
Total
|
|
|
2,894
|
|
|
|
2,801
|
|
|
|
2,722
|
|
|
Combined Equivalent Volumes (MMcfe)(2)
|
|
|
428,603
|
|
|
|
446,829
|
|
|
|
413,605
|
|
|
Combined Equivalent Volumes (MBoe)
|
|
|
71,434
|
|
|
|
74,472
|
|
|
|
68,394
|
|
|
Average Daily Combined Equivalent Volumes (MMcfe/d)
|
|
|
|
|
|
|
|
|
|
|
|
|
|
U.S.
|
|
|
|
|
|
|
|
|
|
|
|
|
|
Piceance Basin
|
|
|
674
|
|
|
|
698
|
|
|
|
649
|
|
|
Other(1)
|
|
|
447
|
|
|
|
472
|
|
|
|
431
|
|
|
Argentina(2)
|
|
|
53
|
|
|
|
54
|
|
|
|
50
|
|
|
|
|
|
|
|
|
|
|
|
|
|
|
|
|
Total
|
|
|
1,174
|
|
|
|
1,224
|
|
|
|
1,130
|
|
|
|
|
|
(1) |
|
Excludes production from our Arkoma Basin operations which were
classified as held for sale and reported as discontinued
operations as of March 31, 2011 and comprised less than one
percent of our total production. |
|
|
|
|
(2) |
|
Includes approximately 69 percent of Apco’s production
(which corresponds to our ownership interest in Apco) and other
minor directly held interests. |
The following tables summarize our domestic sales price and cost
information for the years indicated.
| |
|
|
|
|
|
|
|
|
|
|
|
|
|
|
|
Year Ended December 31,
|
|
|
|
|
2010
|
|
|
2009
|
|
|
2008
|
|
|
|
|
Realized average price per unit(1):
|
|
|
|
|
|
|
|
|
|
|
|
|
|
Natural gas, without hedges (per Mcf)(2)
|
|
$
|
4.33
|
|
|
$
|
3.41
|
|
|
$
|
6.94
|
|
|
Impact of hedges (per Mcf)(2)
|
|
|
0.82
|
|
|
|
1.45
|
|
|
|
0.10
|
|
|
|
|
|
|
|
|
|
|
|
|
|
|
|
|
Natural gas, with hedges (per Mcf)(2)
|
|
$
|
5.15
|
|
|
$
|
4.86
|
|
|
$
|
7.04
|
|
|
|
|
|
|
|
|
|
|
|
|
|
|
|
|
Oil, without hedges (per Bbl)
|
|
$
|
66.17
|
|
|
$
|
44.92
|
|
|
$
|
84.63
|
|
|
Impact of hedges (per Bbl)
|
|
|
—
|
|
|
|
—
|
|
|
|
—
|
|
|
|
|
|
|
|
|
|
|
|
|
|
|
|
|
Oil, with hedges (per Bbl)
|
|
$
|
66.17
|
|
|
$
|
44.92
|
|
|
$
|
84.63
|
|
|
|
|
|
|
|
|
|
|
|
|
|
|
|
|
Price per Boe, without hedges(3)
|
|
$
|
26.44
|
|
|
$
|
20.71
|
|
|
$
|
42.14
|
|
|
|
|
|
|
|
|
|
|
|
|
|
|
|
|
Price per Boe, with hedges(3)
|
|
$
|
31.32
|
|
|
$
|
29.36
|
|
|
$
|
42.66
|
|
|
|
|
|
|
|
|
|
|
|
|
|
|
|
|
Price per Mcfe, without hedges(3)
|
|
$
|
4.41
|
|
|
$
|
3.45
|
|
|
$
|
7.02
|
|
|
|
|
|
|
|
|
|
|
|
|
|
|
|
|
Price per Mcfe, with hedges(3)
|
|
$
|
5.22
|
|
|
$
|
4.89
|
|
|
$
|
7.11
|
|
|
|
|
|
|
|
|
|
|
|
|
|
|
|
14
|
|
|
|
(1) |
|
Excludes our Arkoma Basin operations, which were classified as
held for sale and reported as discontinued operations as of
March 31, 2011 and comprised less than one percent of our
total revenues. |
|
|
|
|
(3) |
|
Realized average prices reflect realized market prices, net of
fuel and shrink. |
| |
|
|
|
|
|
|
|
|
|
|
|
|
|
|
|
Year Ended December 31,
|
|
|
|
|
2010
|
|
|
2009
|
|
|
2008
|
|
|
|
|
Expenses per Mcfe(1):
|
|
|
|
|
|
|
|
|
|
|
|
|
|
Operating expenses:
|
|
|
|
|
|
|
|
|
|
|
|
|
|
Lifting costs and workovers
|
|
$
|
0.46
|
|
|
$
|
0.39
|
|
|
$
|
0.45
|
|
|
Facilities operating expense
|
|
|
0.14
|
|
|
|
0.14
|
|
|
|
0.15
|
|
|
Other operating and maintenance
|
|
|
0.05
|
|
|
|
0.05
|
|
|
|
0.04
|
|
|
|
|
|
|
|
|
|
|
|
|
|
|
|
|
Total LOE
|
|
$
|
0.65
|
|
|
$
|
0.58
|
|
|
$
|
0.64
|
|
|
Gathering, processing and transportation charges
|
|
|
0.80
|
|
|
|
0.64
|
|
|
|
0.58
|
|
|
Taxes other than income
|
|
|
0.27
|
|
|
|
0.19
|
|
|
|
0.61
|
|
|
|
|
|
|
|
|
|
|
|
|
|
|
|
|
Production cost
|
|
$
|
1.72
|
|
|
$
|
1.41
|
|
|
$
|
1.83
|
|
|
|
|
|
|
|
|
|
|
|
|
|
|
|
|
General and administrative
|
|
$
|
0.60
|
|
|
$
|
0.57
|
|
|
$
|
0.61
|
|
|
Depreciation, depletion and amortization
|
|
$
|
2.10
|
|
|
$
|
2.04
|
|
|
$
|
1.83
|
|
|
|
|
|
(1) |
|
Excludes our Arkoma Basin operations, which were classified as
held for sale and reported as discontinued operations as of
March 31, 2011. |
Non-GAAP Financial
Measures and Reconciliations
Adjusted
EBITDAX
Adjusted EBITDAX is a supplemental non-GAAP financial measure
that is used by management and external users of our
consolidated financial statements, such as industry analysts,
investors, lenders and rating agencies.
We define Adjusted EBITDAX as earnings before interest expense,
income taxes, depreciation, depletion and amortization,
exploration expenses and the other items described below.
Adjusted EBITDAX is not a measure of net income as determined by
United States generally accepted accounting principles, or GAAP.
Management believes Adjusted EBITDAX is useful because it allows
them to more effectively evaluate our operating performance and
compare the results of our operations from period to period and
against our peers without regard to our financing methods or
capital structure. We exclude the items listed above from net
income in arriving at Adjusted EBITDAX because these amounts can
vary substantially from company to company within our industry
depending upon accounting methods and book values of assets,
capital structures and the method by which the assets were
acquired. Adjusted EBITDAX should not be considered as an
alternative to, or more meaningful than, net income as
determined in accordance with GAAP or as an indicator of our
liquidity. Certain items excluded from Adjusted EBITDAX are
significant components in understanding and assessing a
company’s financial performance, such as a company’s
cost of capital and tax structure, as well as the historic costs
of depreciable assets, none of which are components of Adjusted
EBITDAX. Our computations of Adjusted EBITDAX may not be
comparable to other similarly titled measures of other
companies. We believe that Adjusted EBITDAX is a widely followed
measure of operating performance and may also be used by
investors to measure our ability to meet debt service
requirements.
15
The following table presents a reconciliation of the non-GAAP
financial measure of Adjusted EBITDAX to the GAAP financial
measure of net income (loss).
| |
|
|
|
|
|
|
|
|
|
|
|
|
|
|
|
|
|
|
|
|
|
|
|
|
|
|
|
|
|
|
|
Pro Forma Three
|
|
|
Pro Forma
|
|
|
Historical
|
|
|
|
|
|
|
|
Months Ended
|
|
|
Year Ended
|
|
|
Three Months
|
|
|
Historical
|
|
|
|
|
March 31,
|
|
|
December 31,
|
|
|
Ended March 31,
|
|
|
Year Ended December 31,
|
|
|
|
|
2011
|
|
|
2010
|
|
|
2011
|
|
|
2010
|
|
|
2010
|
|
|
2009
|
|
|
2008
|
|
|
|
|
(Millions)
|
|
|
|
|
Adjusted EBITDAX Reconciliation to Net Income (Loss):
|
|
|
|
|
|
|
|
|
|
|
|
|
|
|
|
|
|
|
|
|
|
|
|
|
|
|
|
|
|
Net income (loss)
|
|
$
|
13
|
|
|
$
|
(1,269
|
)
|
|
$
|
(1
|
)
|
|
$
|
83
|
|
|
$
|
(1,282
|
)
|
|
$
|
142
|
|
|
$
|
730
|
|
|
Interest expense
|
|
|
27
|
|
|
|
103
|
|
|
|
49
|
|
|
|
25
|
|
|
|
124
|
|
|
|
100
|
|
|
|
74
|
|
|
Provision (benefit) for income taxes
|
|
|
11
|
|
|
|
(142
|
)
|
|
|
3
|
|
|
|
44
|
|
|
|
(150
|
)
|
|
|
94
|
|
|
|
452
|
|
|
Depreciation, depletion and amortization
|
|
|
216
|
|
|
|
875
|
|
|
|
216
|
|
|
|
216
|
|
|
|
875
|
|
|
|
887
|
|
|
|
738
|
|
|
Exploration expenses
|
|
|
13
|
|
|
|
73
|
|
|
|
13
|
|
|
|
8
|
|
|
|
73
|
|
|
|
54
|
|
|
|
37
|
|
|
|
|
|
|
|
|
|
|
|
|
|
|
|
|
|
|
|
|
|
|
|
|
|
|
|
|
|
|
|
|
EBITDAX
|
|
|
280
|
|
|
|
(360
|
)
|
|
|
280
|
|
|
|
376
|
|
|
|
(360
|
)
|
|
|
1,277
|
|
|
|
2,031
|
|
|
Gain on sale of contractual right to international production
payment
|
|
|
—
|
|
|
|
—
|
|
|
|
—
|
|
|
|
—
|
|
|
|
—
|
|
|
|
—
|
|
|
|
(148
|
)
|
|
Impairments of goodwill, producing properties and cost of
acquired unproved reserves
|
|
|
—
|
|
|
|
1,681
|
|
|
|
—
|
|
|
|
—
|
|
|
|
1,681
|
|
|
|
15
|
|
|
|
—
|
|
|
Loss from discontinued operations
|
|
|
8
|
|
|
|
8
|
|
|
|
8
|
|
|
|
—
|
|
|
|
8
|
|
|
|
7
|
|
|
|
87
|
|
|
|
|
|
|
|
|
|
|
|
|
|
|
|
|
|
|
|
|
|
|
|
|
|
|
|
|
|
|
|
|
Adjusted EBITDAX
|
|
$
|
288
|
|
|
$
|
1,329
|
|
|
$
|
288
|
|
|
$
|
376
|
|
|
$
|
1,329
|
|
|
$
|
1,299
|
|
|
$
|
1,970
|
|
|
|
|
|
|
|
|
|
|
|
|
|
|
|
|
|
|
|
|
|
|
|
|
|
|
|
|
|
|
|
PV-10
PV-10 is a
non-GAAP financial measure and represents the year-end present
value of estimated future cash inflows from proved natural gas
and crude oil reserves, less future development and production
costs, discounted at 10 percent per annum to reflect the
timing of future cash flows and using pricing assumptions in
effect at the end of the period.
PV-10
differs from Standardized Measure because it does not include
the effects of income taxes on future net revenues. Neither
PV-10 nor
Standardized Measure represents an estimate of fair market value
of our natural gas and crude oil properties.
PV-10 is
used by the industry and by our management as an arbitrary
reserve asset value measure to compare against past reserve
bases and the reserve bases of other business entities that are
not dependent on the taxpaying status of the entity.
The following table provides a reconciliation of our
Standardized Measure to
PV-10 and
includes 69 percent of Apco’s metrics, which
corresponds to our ownership interest in Apco, and includes our
Arkoma Basin operations, which were classified as held for sale
and reported as discontinued operations as of March 31,
2011.
| |
|
|
|
|
|
|
|
|
|
|
|
At December 31,
|
|
|
|
|
2010
|
|
|
2009
|
|
|
|
|
(Millions)
|
|
|
|
|
Standardized Measure of Discounted Future Net Cash Flows
|
|
$
|
3,080
|
|
|
$
|
1,923
|
|
|
Present value of future income tax discounted at 10%
|
|
|
1,464
|
|
|
|
697
|
|
|
|
|
|
|
|
|
|
|
|
|
PV-10
|
|
$
|
4,544
|
|
|
$
|
2,620
|
|
|
|
|
|
|
|
|
|
|
|
16
RISK
FACTORS
Investing in our Class A common stock involves
substantial risk. You should carefully consider the following
risk factors and the other information in this prospectus before
investing in our Class A common stock. If any of the
following risks actually occur, our business, financial
condition, cash flows and results of operations could suffer
materially and adversely. In that case, the trading price of our
Class A common stock could decline, and you might lose all
or part of your investment.
Risks
Related to Our Business
Our
business requires significant capital expenditures and we may be
unable to obtain needed capital or financing on satisfactory
terms.
Our exploration, development and acquisition activities require
substantial capital expenditures. Historically, we have funded
our capital expenditures through a combination of cash flows
from operations, capital contributions or borrowings from
Williams and sales of assets. Future cash flows are subject to a
number of variables, including the level of production from
existing wells, prices of natural gas and oil and our success in
developing and producing new reserves. If our cash flow from
operations is not sufficient to fund our capital expenditure
budget, we may have limited ability to obtain the additional
capital necessary to sustain our operations at current levels.
We may not be able to obtain debt or equity financing on terms
favorable to us or at all. The failure to obtain additional
financing could result in a curtailment of our operations
relating to exploration and development of our prospects, which
in turn could lead to a decline in our natural gas and oil
production or reserves, and in some areas a loss of properties.
Failure
to replace reserves may negatively affect our
business.
The growth of our business depends upon our ability to find,
develop or acquire additional natural gas and oil reserves that
are economically recoverable. Our proved reserves generally
decline when reserves are produced, unless we conduct successful
exploration or development activities or acquire properties
containing proved reserves, or both. We may not always be able
to find, develop or acquire additional reserves at acceptable
costs. If natural gas or oil prices increase, our costs for
additional reserves would also increase; conversely if natural
gas or oil prices decrease, it could make it more difficult to
fund the replacement of our reserves.
Exploration
and development drilling may not result in commercially
productive reserves.
Our past success rate for drilling projects should not be
considered a predictor of future commercial success. Our
decisions to purchase, explore, develop or otherwise exploit
prospects or properties will depend in part on the evaluation of
data obtained through geophysical and geological analyses,
production data and engineering studies, the results of which
are often inconclusive or subject to varying interpretations.
The new wells we drill or participate in may not be commercially
productive, and we may not recover all or any portion of our
investment in wells we drill or participate in. Our efforts will
be unprofitable if we drill dry wells or wells that are
productive but do not produce enough reserves to return a profit
after drilling, operating and other costs. The cost of drilling,
completing and operating a well is often uncertain, and cost
factors can adversely affect the economics of a project.
Further, our drilling operations may be curtailed, delayed,
canceled or rendered unprofitable or less profitable than
anticipated as a result of a variety of other factors, including:
|
|
|
| |
•
|
Increases in the cost of, or shortages or delays in the
availability of, drilling rigs and equipment, supplies, skilled
labor, capital or transportation;
|
| |
| |
•
|
Equipment failures or accidents;
|
| |
| |
•
|
Adverse weather conditions, such as blizzards;
|
| |
| |
•
|
Title and lease related problems;
|
| |
| |
•
|
Limitations in the market for natural gas and oil;
|
17
|
|
|
| |
•
|
Unexpected drilling conditions or problems;
|
| |
| |
•
|
Pressure or irregularities in geological formations;
|
| |
| |
•
|
Regulations and regulatory approvals;
|
| |
| |
•
|
Changes or anticipated changes in energy prices; or
|
| |
| |
•
|
Compliance with environmental and other governmental
requirements.
|
We expect to invest approximately 35 percent of our
drilling capital during 2011 in two relatively new
unconventional projects, the Bakken Shale in western North
Dakota and the Marcellus Shale in Pennsylvania. Due to limited
production history from the relatively few number of wells
drilled in these projects, we are unable to predict with
certainty the quantity of future production from wells to be
drilled in those projects.
If
natural gas and oil prices decrease, we may be required to take
write-downs of the carrying values of our natural gas and oil
properties.
Accounting rules require that we review periodically the
carrying value of our natural gas and oil properties for
possible impairment. Based on specific market factors and
circumstances at the time of prospective impairment reviews and
the continuing evaluation of development plans, production data,
economics and other factors, we may be required to write down
the carrying value of our natural gas and oil properties. A
writedown constitutes a non-cash charge to earnings. For
example, as a result of significant declines in forward natural
gas prices, we recorded impairments of capitalized costs of
certain natural gas properties of $678 million in 2010. We
may incur impairment charges in the future, which could have a
material adverse effect on our results of operations for the
periods in which such charges are taken.
Estimating
reserves and future net revenues involves uncertainties.
Decreases in natural gas and oil prices, or negative revisions
to reserve estimates or assumptions as to future natural gas and
oil prices may lead to decreased earnings, losses or impairment
of natural gas and oil assets.
Reserve estimation is a subjective process of evaluating
underground accumulations of oil and gas that cannot be measured
in an exact manner. Reserves that are “proved
reserves” are those estimated quantities of crude oil,
natural gas and NGLs that geological and engineering data
demonstrate with reasonable certainty are recoverable in future
years from known reservoirs under existing economic and
operating conditions and relate to projects for which the
extraction of hydrocarbons must have commenced or the operator
must be reasonably certain that it will commence the project
within a reasonable time.
The process relies on interpretations of available geological,
geophysical, engineering and production data. There are numerous
uncertainties inherent in estimating quantities of proved
reserves and in projecting future rates of production and timing
of developmental expenditures, including many factors beyond the
control of the producer. The reserve data included in this
prospectus represent estimates. In addition, the estimates of
future net revenues from our proved reserves and the present
value of such estimates are based upon certain assumptions about
future production levels, prices and costs that may not prove to
be correct.
Quantities of proved reserves are estimated based on economic
conditions in existence during the period of assessment. Changes
to oil and gas prices in the markets for such commodities may
have the impact of shortening the economic lives of certain
fields because it becomes uneconomic to produce all recoverable
reserves on such fields, which reduces proved property reserve
estimates.
If negative revisions in the estimated quantities of proved
reserves were to occur, it would have the effect of increasing
the rates of depreciation, depletion and amortization on the
affected properties, which would decrease earnings or result in
losses through higher depreciation, depletion and amortization
expense. These revisions, as well as revisions in the
assumptions of future cash flows of these reserves, may also be
sufficient to trigger impairment losses on certain properties
which would result in a noncash charge to earnings.
18
The
development of our proved undeveloped reserves may take longer
and may require higher levels of capital expenditures than we
currently anticipate.
Approximately 41 percent of our total estimated proved
reserves at December 31, 2010 were proved undeveloped
reserves and may not be ultimately developed or produced.
Recovery of proved undeveloped reserves requires significant
capital expenditures and successful drilling operations. The
reserve data included in the reserve engineer reports assumes
that substantial capital expenditures are required to develop
such reserves. We cannot be certain that the estimated costs of
the development of these reserves are accurate, that development
will occur as scheduled or that the results of such development
will be as estimated. Delays in the development of our reserves
or increases in costs to drill and develop such reserves will
reduce the
PV-10 value
of our estimated proved undeveloped reserves and future net
revenues estimated for such reserves and may result in some
projects becoming uneconomic. In addition, delays in the
development of reserves could cause us to have to reclassify our
proved reserves as unproved reserves.
The
present value of future net revenues from our proved reserves
will not necessarily be the same as the value we ultimately
realize of our estimated natural gas and oil reserves.
You should not assume that the present value of future net
revenues from our proved reserves is the current market value of
our estimated natural gas and oil reserves. For the year ended
December 31, 2008, we based the estimated discounted future
net revenues from our proved reserves on prices and costs in
effect on the day of the estimate in accordance with previous
SEC requirements. In accordance with new SEC requirements for
the years ended December 31, 2009 and 2010, we have based
the estimated discounted future net revenues from our proved
reserves on the
12-month
unweighted arithmetic average of the
first-day-of-the-month
price for the preceding twelve months without giving effect to
derivative transactions. Actual future net revenues from our
natural gas and oil properties will be affected by factors such
as:
|
|
|
| |
•
|
actual prices we receive for natural gas and oil;
|
| |
| |
•
|
actual cost of development and production expenditures;
|
| |
| |
•
|
the amount and timing of actual production; and
|
| |
| |
•
|
changes in governmental regulations or taxation.
|
The timing of both our production and our incurrence of expenses
in connection with the development and production of natural gas
and oil properties will affect the timing and amount of actual
future net revenues from proved reserves, and thus their actual
present value. In addition, the 10 percent discount factor
we use when calculating discounted future net revenues may not
be the most appropriate discount factor based on interest rates
in effect from time to time and risks associated with us or the
natural gas and oil industry in general.
Certain
of our domestic undeveloped leasehold assets are subject to
leases that will expire over the next several years unless
production is established on units containing the
acreage.
The majority of our acreage in the Marcellus Shale and Bakken
Shale is not currently held by production. Unless production in
paying quantities is established on units containing these
leases during their terms, the leases will expire. If our leases
expire and we are unable to renew the leases, we will lose our
right to develop the related properties. Our drilling plans for
these areas are subject to change based upon various factors,
including drilling results, natural gas and oil prices,
availability and cost of capital, drilling and production costs,
availability of drilling services and equipment, gathering
system and pipeline transportation constraints and regulatory
and lease issues.
Prices
for natural gas, oil and NGLs are volatile, and this volatility
could adversely affect our financial results, cash flows, access
to capital and ability to maintain our existing
business.
Our revenues, operating results, future rate of growth and the
value of our business depend primarily upon the prices of
natural gas, oil and NGLs. Price volatility can impact both the
amount we receive for our
19
products and the volume of products we sell. Prices affect the
amount of cash flow available for capital expenditures and our
ability to borrow money or raise additional capital.
The markets for natural gas, oil and NGLs are likely to continue
to be volatile. Wide fluctuations in prices might result from
relatively minor changes in the supply of and demand for these
commodities, market uncertainty and other factors that are
beyond our control, including:
|
|
|
| |
•
|
Worldwide and domestic supplies of and demand for natural gas,
oil and NGLs;
|
| |
| |
•
|
Turmoil in the Middle East and other producing regions;
|
| |
| |
•
|
The activities of the Organization of Petroleum Exporting
Countries;
|
| |
| |
•
|
Terrorist attacks on production or transportation assets;
|
| |
| |
•
|
Weather conditions;
|
| |
| |
•
|
The level of consumer demand;
|
| |
| |
•
|
Variations in local market conditions (basis differential);
|
| |
| |
•
|
The price and availability of other types of fuels;
|
| |
| |
•
|
The availability of pipeline capacity;
|
| |
| |
•
|
Supply disruptions, including plant outages and transportation
disruptions;
|
| |
| |
•
|
The price and quantity of foreign imports of natural gas and oil;
|
| |
| |
•
|
Domestic and foreign governmental regulations and taxes;
|
| |
| |
•
|
Volatility in the natural gas and oil markets;
|
| |
| |
•
|
The overall economic environment;
|
| |
| |
•
|
The credit of participants in the markets where products are
bought and sold; and
|
| |
| |
•
|
The adoption of regulations or legislation relating to climate
change.
|
Our
business depends on access to natural gas, oil and NGL
transportation systems and facilities.
The marketability of our natural gas, oil and NGL production
depends in large part on the operation, availability, proximity,
capacity and expansion of transportation systems and facilities
owned by third parties. For example, we can provide no assurance
that sufficient transportation capacity will exist for expected
production from the Bakken Shale and Marcellus Shale or that we
will be able to obtain sufficient transportation capacity on
economic terms.
A lack of available capacity on transportation systems and
facilities or delays in their planned expansions could result in
the shut-in of producing wells or the delay or discontinuance of
drilling plans for properties. A lack of availability of these
systems and facilities for an extended period of time could
negatively affect our revenues. In addition, we have entered
into contracts for firm transportation and any failure to renew
those contracts on the same or better commercial terms could
increase our costs and our exposure to the risks described above.
We may
have excess capacity under our firm transportation contracts, or
the terms of certain of those contracts may be less favorable
than those we could obtain currently.
We have entered into contracts for firm transportation that may
exceed our transportation needs. Any excess transportation
commitments will result in excess transportation costs that
could negatively affect our results of operations. In addition,
certain of the contracts we have entered into may be on terms
less favorable to us than we could obtain if we were negotiating
them at current rates, which also could negatively affect our
results of operations.
20
We have
limited control over activities on properties we do not operate,
which could reduce our production and revenues.
If we do not operate the properties in which we own an interest,
we do not have control over normal operating procedures,
expenditures or future development of underlying properties. The
failure of an operator of our wells to adequately perform
operations or an operator’s breach of the applicable
agreements could reduce our production and revenues or increase
our costs. As of December 31, 2010, we were not the
operator of approximately 17 percent of our total domestic
net production. Apco generally has outside-operated interests in
its properties. The success and timing of our drilling and
development activities on properties operated by others depend
upon a number of factors outside of our control, including the
operator’s timing and amount of capital expenditures,
expertise and financial resources, inclusion of other
participants in drilling wells and use of technology. Because we
do not have a majority interest in most wells we do not operate,
we may not be in a position to remove the operator in the event
of poor performance.
We might
not be able to successfully manage the risks associated with
selling and marketing products in the wholesale energy
markets.
Our portfolio of derivative and other energy contracts includes
wholesale contracts to buy and sell natural gas, oil and NGLs
that are settled by the delivery of the commodity or cash. If
the values of these contracts change in a direction or manner
that we do not anticipate or cannot manage, it could negatively
affect our results of operations. In the past, certain marketing
and trading companies have experienced severe financial problems
due to price volatility in the energy commodity markets. In
certain instances this volatility has caused companies to be
unable to deliver energy commodities that they had guaranteed
under contract. If such a delivery failure were to occur in one
of our contracts, we might incur additional losses to the extent
of amounts, if any, already paid to, or received from,
counterparties. In addition, in our business, we often extend
credit to our counterparties. We are exposed to the risk that we
might not be able to collect amounts owed to us. If the
counterparty to such a transaction fails to perform and any
collateral that secures our counterparty’s obligation is
inadequate, we will suffer a loss. Downturns in the economy or
disruptions in the global credit markets could cause more of our
counterparties to fail to perform than we expect.
Our risk
management and measurement systems and hedging activities might
not be effective and could increase the volatility of our
results.
The systems we use to quantify commodity price risk associated
with our businesses might not always be followed or might not
always be effective. Further, such systems do not in themselves
manage risk, particularly risks outside of our control, and
adverse changes in energy commodity market prices, volatility,
adverse correlation of commodity prices, the liquidity of
markets, changes in interest rates and other risks discussed in
this prospectus might still adversely affect our earnings, cash
flows and balance sheet under applicable accounting rules, even
if risks have been identified. Furthermore, no single hedging
arrangement can adequately address all commodity price risks
present in a given contract. For example, a forward contract
that would be effective in hedging commodity price volatility
risks would not hedge the contract’s counterparty credit or
performance risk. Therefore, unhedged risks will always continue
to exist.
Our use of hedging arrangements through which we attempt to
reduce the economic risk of our participation in commodity
markets could result in increased volatility of our reported
results. Changes in the fair values (gains and losses) of
derivatives that qualify as hedges under GAAP to the extent that
such hedges are not fully effective in offsetting changes to the
value of the hedged commodity, as well as changes in the fair
value of derivatives that do not qualify or have not been
designated as hedges under GAAP, must be recorded in our income.
This creates the risk of volatility in earnings even if no
economic impact to us has occurred during the applicable period.
The impact of changes in market prices for natural gas, oil and
NGLs on the average prices paid or received by us may be reduced
based on the level of our hedging activities. These hedging
arrangements may limit or enhance our margins if the market
prices for natural gas, oil or NGLs were to change substantially
21
from the price established by the hedges. In addition, our
hedging arrangements expose us to the risk of financial loss if
our production volumes are less than expected.
The
adoption and implementation of new statutory and regulatory
requirements for derivative transactions could have an adverse
impact on our ability to hedge risks associated with our
business and increase the working capital requirements to
conduct these activities.
In July 2010, federal legislation known as the Dodd-Frank Wall
Street Reform and Consumer Protection Act (the “Dodd-Frank
Act”) was enacted. The Dodd-Frank Act provides for new
statutory and regulatory requirements for derivative
transactions, including oil and gas hedging transactions. Among
other things, the Dodd-Frank Act provides for the creation of
position limits for certain derivatives transactions, as well as
requiring certain transactions to be cleared on exchanges for
which cash collateral will be required. The final impact of the
Dodd-Frank Act on our hedging activities is uncertain at this
time due to the requirement that the SEC and the Commodities
Futures Trading Commission (“CFTC”) promulgate rules
and regulations implementing the new legislation within
360 days from the date of enactment. These new rules and
regulations could significantly increase the cost of derivative
contracts, materially alter the terms of derivative contracts or
reduce the availability of derivatives. Although we believe the
derivative contracts that we enter into should not be impacted
by position limits and should be exempt from the requirement to
clear transactions through a central exchange or to post
collateral, the impact upon our businesses will depend on the
outcome of the implementing regulations adopted by the CFTC.
Depending on the rules and definitions adopted by the CFTC or
similar rules that may be adopted by other regulatory bodies, we
might in the future be required to provide cash collateral for
our commodities hedging transactions under circumstances in
which we do not currently post cash collateral. Posting of such
additional cash collateral could impact liquidity and reduce our
cash available for capital expenditures. A requirement to post
cash collateral could therefore reduce our ability to execute
hedges to reduce commodity price uncertainty and thus protect
cash flows. If we reduce our use of derivatives as a result of
the Dodd-Frank Act and regulations, our results of operations
may become more volatile and our cash flows may be less
predictable.
We are
exposed to the credit risk of our customers and counterparties,
and our credit risk management may not be adequate to protect
against such risk.
We are subject to the risk of loss resulting from nonpayment
and/or
nonperformance by our customers and counterparties in the
ordinary course of our business. Our credit procedures and
policies may not be adequate to fully eliminate customer and
counterparty credit risk. We cannot predict to what extent our
business would be impacted by deteriorating conditions in the
economy, including declines in our customers’ and
counterparties’ creditworthiness. If we fail to adequately
assess the creditworthiness of existing or future customers and
counterparties, unanticipated deterioration in their
creditworthiness and any resulting increase in nonpayment
and/or
nonperformance by them could cause us to write-down or write-off
doubtful accounts. Such write-downs or write-offs could
negatively affect our operating results in the periods in which
they occur and, if significant, could have a material adverse
effect on our business, results of operations, cash flows and
financial condition.
We face
competition in acquiring new properties, marketing natural gas
and oil and securing equipment and trained personnel in the
natural gas and oil industry.
Our ability to acquire additional drilling locations and to find
and develop reserves in the future will depend on our ability to
evaluate and select suitable properties and to consummate
transactions in a highly competitive environment for acquiring
properties, marketing natural gas and oil and securing equipment
and trained personnel. We may not be able to compete
successfully in the future in acquiring prospective reserves,
developing reserves, marketing hydrocarbons, attracting and
retaining quality personnel and raising additional capital,
which could have a material adverse effect on our business.
22
Our
operations are subject to operational hazards and unforeseen
interruptions for which they may not be adequately
insured.
There are operational risks associated with drilling for,
production, gathering, transporting, storage, processing and
treating of natural gas and oil and the fractionation and
storage of NGLs, including:
|
|
|
| |
•
|
Hurricanes, tornadoes, floods, extreme weather conditions and
other natural disasters;
|
| |
| |
•
|
Aging infrastructure and mechanical problems;
|
| |
| |
•
|
Damages to pipelines, pipeline blockages or other pipeline
interruptions;
|
| |
| |
•
|
Uncontrolled releases of natural gas (including sour gas), oil,
NGLs, brine or industrial chemicals;
|
| |
| |
•
|
Operator error;
|
| |
| |
•
|
Pollution and environmental risks;
|
| |
| |
•
|
Fires, explosions and blowouts;
|
| |
| |
•
|
Risks related to truck and rail loading and unloading; and
|
| |
| |
•
|
Terrorist attacks or threatened attacks on our facilities or
those of other energy companies.
|
Any of these risks could result in loss of human life, personal
injuries, significant damage to property, environmental
pollution, impairment of our operations and substantial losses
to us. In accordance with customary industry practice, we
maintain insurance against some, but not all, of these risks and
losses, and only at levels we believe to be appropriate. The
location of certain segments of our facilities in or near
populated areas, including residential areas, commercial
business centers and industrial sites, could increase the level
of damages resulting from these risks. In spite of our
precautions, an event such as those described above could cause
considerable harm to people or property and could have a
material adverse effect on our financial condition and results
of operations, particularly if the event is not fully covered by
insurance. Accidents or other operating risks could further
result in loss of service available to our customers.
We do not
insure against all potential losses and could be seriously
harmed by unexpected liabilities or by the inability of our
insurers to satisfy our claims.
We are not fully insured against all risks inherent to our
business, including environmental accidents. We do not maintain
insurance in the type and amount to cover all possible risks of
loss.
We currently maintain excess liability insurance with limits of
$610 million per occurrence and in the annual aggregate
with a $2 million per occurrence deductible. This insurance
covers us, our parent, our subsidiaries and certain of our
affiliates for legal and contractual liabilities arising out of
bodily injury or property damage, including resulting loss of
use to third parties. This excess liability insurance includes
coverage for sudden and accidental pollution liability for full
limits, with the first $135 million of insurance also
providing gradual pollution liability coverage for natural gas
and NGL operations.
Although we maintain property insurance on property we own,
lease or are responsible to insure, the policy may not cover the
full replacement cost of all damaged assets or the entire amount
of business interruption loss we may experience. In addition,
certain perils may be excluded from coverage or
sub-limited.
We may not be able to maintain or obtain insurance of the type
and amount we desire at reasonable rates. We may elect to self
insure a portion of our risks. We do not insure our underground
pipelines for physical damage, except at certain locations. All
of our insurance is subject to deductibles. If a significant
accident or event occurs for which we are not fully insured it
could adversely affect our operations and financial condition.
In addition, any insurance company that provides coverage to us
may experience negative developments that could impair their
ability to pay any of our claims. As a result, we could be
exposed to greater losses than anticipated and may have to
obtain replacement insurance, if available, at a greater cost.
23
Potential
changes in accounting standards might cause us to revise our
financial results and disclosures in the future, which might
change the way analysts measure our business or financial
performance.
Regulators and legislators continue to take a renewed look at
accounting practices, financial and reserves disclosures and
companies’ relationships with their independent public
accounting firms and reserves consultants. It remains unclear
what new laws or regulations will be adopted, and we cannot
predict the ultimate impact of that any such new laws or
regulations could have. In addition, the Financial Accounting
Standards Board or the SEC could enact new accounting standards
that might impact how we are required to record revenues,
expenses, assets, liabilities and equity. Any significant change
in accounting standards or disclosure requirements could have a
material adverse effect on our business, results of operations
and financial condition.
Our
investments and projects located outside of the United States
expose us to risks related to the laws of other countries, and
the taxes, economic conditions, fluctuations in currency rates,
political conditions and policies of foreign governments. These
risks might delay or reduce our realization of value from our
international projects.
We currently own and might acquire
and/or
dispose of material energy-related investments and projects
outside the United States, principally Argentina and Colombia.
The economic, political and legal conditions and regulatory
environment in the countries in which we have interests or in
which we might pursue acquisition or investment opportunities
present risks that are different from or greater than those in
the United States. These risks include delays in construction
and interruption of business, as well as risks of war,
expropriation, nationalization, renegotiation, trade sanctions
or nullification of existing contracts and changes in law or tax
policy, including with respect to the prices we realize for the
commodities we produce and sell. The uncertainty of the legal
environment in certain foreign countries in which we develop or
acquire projects or make investments could make it more
difficult to obtain nonrecourse project financing or other
financing on suitable terms, could adversely affect the ability
of certain customers to honor their obligations with respect to
such projects or investments and could impair our ability to
enforce our rights under agreements relating to such projects or
investments.
Operations and investments in foreign countries also can present
currency exchange rate and convertibility, inflation and
repatriation risk. In certain situations under which we develop
or acquire projects or make investments, economic and monetary
conditions and other factors could affect our ability to convert
to U.S. dollars our earnings denominated in foreign
currencies. In addition, risk from fluctuations in currency
exchange rates can arise when our foreign subsidiaries expend or
borrow funds in one type of currency, but receive revenue in
another. In such cases, an adverse change in exchange rates can
reduce our ability to meet expenses, including debt service
obligations. We may or may not put contracts in place designed
to mitigate our foreign currency exchange risks. We have some
exposures that are not hedged and which could result in losses
or volatility in our results of operations.
Our
operating results might fluctuate on a seasonal and quarterly
basis.
Our revenues can have seasonal characteristics. In many parts of
the country, demand for natural gas and other fuels peaks during
the winter. As a result, our overall operating results in the
future might fluctuate substantially on a seasonal basis. Demand
for natural gas and other fuels could vary significantly from
our expectations depending on the nature and location of our
facilities and the terms of our natural gas transportation
arrangements relative to demand created by unusual weather
patterns.
Our debt
agreements impose restrictions on us that may limit our access
to credit and adversely affect our ability to operate our
business.
Our Credit Facility contains and the indenture governing the
Notes is expected to contain various covenants that restrict or
limit, among other things, our ability to grant liens to support
indebtedness, merge or sell substantially all of our assets,
make certain distributions during an event of default and incur
additional debt. In addition, our debt agreements will contain
financial covenants and other limitations with which we will
need to comply. These covenants could adversely affect our
ability to finance our future operations or capital needs or
engage in, expand or pursue our business activities and prevent
us from engaging in certain
24
transactions that might otherwise be considered beneficial to
us. Our ability to comply with these covenants may be affected
by events beyond our control, including prevailing economic,
financial and industry conditions. If market or other economic
conditions deteriorate, our current assumptions about future
economic conditions turn out to be incorrect or unexpected
events occur, our ability to comply with these covenants may be
significantly impaired.
Our failure to comply with the covenants in our debt agreements
could result in events of default. Upon the occurrence of such
an event of default, the lenders could elect to declare all
amounts outstanding under a particular facility to be
immediately due and payable and terminate all commitments, if
any, to extend further credit. Certain payment defaults or an
acceleration under one debt agreement could cause a
cross-default or cross-acceleration of another debt agreement.
Such a cross-default or cross-acceleration could have a wider
impact on our liquidity than might otherwise arise from a
default or acceleration of a single debt instrument. If an event
of default occurs, or if other debt agreements cross-default,
and the lenders under the affected debt agreements accelerate
the maturity of any loans or other debt outstanding to us, we
may not have sufficient liquidity to repay amounts outstanding
under such debt agreements. For more information regarding our
anticipated debt agreements, please read “Description of
our Concurrent Financing Transactions.”
Our ability to repay, extend or refinance our debt obligations
and to obtain future credit will depend primarily on our
operating performance, which will be affected by general
economic, financial, competitive, legislative, regulatory,
business and other factors, many of which are beyond our
control. Our ability to refinance our debt obligations or obtain
future credit will also depend upon the current conditions in
the credit markets and the availability of credit generally. If
we are unable to meet our debt service obligations or obtain
future credit on favorable terms, if at all, we could be forced
to restructure or refinance our indebtedness, seek additional
equity capital or sell assets. We may be unable to obtain
financing or sell assets on satisfactory terms, or at all.
Difficult
conditions in the global capital markets, the credit markets and
the economy in general could negatively affect our business and
results of operations
Our business may be negatively impacted by adverse economic
conditions or future disruptions in global financial markets.
Included among these potential negative impacts are reduced
energy demand and lower commodity prices, increased difficulty
in collecting amounts owed to us by our customers and reduced
access to credit markets. Our ability to access the capital
markets may be restricted at a time when we would like, or need,
to raise financing. If financing is not available when needed,
or is available only on unfavorable terms, we may be unable to
implement our business plans or otherwise take advantage of
business opportunities or respond to competitive pressures.
We are
subject to risks associated with climate change.
There is a growing belief that emissions of greenhouse gases
(“GHGs”) may be linked to climate change. Climate
change and the costs that may be associated with its impacts and
the regulation of GHGs have the potential to affect our business
in many ways, including negatively impacting the costs we incur
in providing our products and services, the demand for and
consumption of our products and services (due to change in both
costs and weather patterns), and the economic health of the
regions in which we operate, all of which can create financial
risks.
In addition, legislative and regulatory responses related to
GHGs and climate change create the potential for financial risk.
The U.S. Congress has previously considered legislation and
certain states have for some time been considering various forms
of legislation related to GHG emissions. There have also been
international efforts seeking legally binding reductions in
emissions of GHGs. In addition, increased public awareness and
concern may result in more state, regional
and/or
federal requirements to reduce or mitigate GHG emissions.
Numerous states have announced or adopted programs to stabilize
and reduce GHGs. In addition, on December 7, 2009, the EPA
issued a final determination that six GHGs are a threat to
public safety and
25
welfare. Also in 2009, the EPA finalized a GHG emission standard
for mobile sources. On September 22, 2009, the EPA
finalized a GHG reporting rule that requires large sources of
GHG emissions to monitor, maintain records on, and annually
report their GHG emissions. On November 8, 2010, the EPA
also issued GHG monitoring and reporting regulations that went
into effect on December 30, 2010, specifically for oil and
natural gas facilities, including onshore and offshore oil and
natural gas production facilities that emit 25,000 metric tons
or more of carbon dioxide equivalent per year. The rule requires
reporting of GHG emissions by regulated facilities to the EPA by
March 2012 for emissions during 2011 and annually thereafter. We
are required to report our GHG emissions to the EPA by March
2012 under this rule. The EPA also issued a final rule that
makes certain stationary sources and newer modification projects
subject to permitting requirements for GHG emissions, beginning
in 2011, under the CAA. Several of the EPA’s GHG rules are
being challenged in pending court proceedings, and depending on
the outcome of such proceedings, such rules may be modified or
rescinded or the EPA could develop new rules.
The recent actions of the EPA and the passage of any federal or
state climate change laws or regulations could result in
increased costs to (i) operate and maintain our facilities,
(ii) install new emission controls on our facilities and
(iii) administer and manage any GHG emissions program. If
we are unable to recover or pass through a significant level of
our costs related to complying with climate change regulatory
requirements imposed on us, it could have a material adverse
effect on our results of operations and financial condition. To
the extent financial markets view climate change and GHG
emissions as a financial risk, this could negatively impact our
cost of and access to capital. Legislation or regulations that
may be adopted to address climate change could also affect the
markets for our products by making our products more or less
desirable than competing sources of energy.
Our
operations are subject to governmental laws and regulations
relating to the protection of the environment, which may expose
us to significant costs and liabilities and could exceed current
expectations.
Substantial costs, liabilities, delays and other significant
issues could arise from environmental laws and regulations
inherent in drilling and well completion, gathering,
transportation, and storage, and we may incur substantial costs
and liabilities in the performance of these types of operations.
Our operations are subject to extensive federal, state and local
laws and regulations governing environmental protection, the
discharge of materials into the environment and the security of
chemical and industrial facilities. These laws include:
|
|
|
| |
•
|
Clean Air Act (“CAA”) and analogous state laws, which
impose obligations related to air emissions;
|
| |
| |
•
|
Clean Water Act (“CWA”), and analogous state laws,
which regulate discharge of wastewaters and storm water from
some our facilities into state and federal waters, including
wetlands;
|
| |
| |
•
|
Comprehensive Environmental Response, Compensation, and
Liability Act (“CERCLA”), and analogous state laws,
which regulate the cleanup of hazardous substances that may have
been released at properties currently or previously owned or
operated by us or locations to which we have sent wastes for
disposal;
|
| |
| |
•
|
Resource Conservation and Recovery Act (“RCRA”), and
analogous state laws, which impose requirements for the handling
and discharge of solid and hazardous waste from our facilities;
|
| |
| |
•
|
National Environmental Policy Act (“NEPA”), which
requires federal agencies to study likely environment impacts of
a proposed federal action before it is approved, such as
drilling on federal lands;
|
| |
| |
•
|
Safe Drinking Water Act (“SDWA”), which restricts the
disposal, treatment or release of water produced or used during
oil and gas development;
|
| |
| |
•
|
Endangered Species Act (“ESA”), and analogous state
laws, which seek to ensure that activities do not jeopardize
endangered or threatened animals, fish and plant species, nor
destroy or modify the critical habitat of such species; and
|
26
|
|
|
| |
•
|
Oil Pollution Act (“OPA”) of 1990, which requires oil
storage facilities and vessels to submit to the federal
government plans detailing how they will respond to large
discharges, requires updates to technology and equipment,
regulation of above ground storage tanks and sets forth
liability for spills by responsible parties.
|
Various governmental authorities, including the
U.S. Environmental Protection Agency (“EPA”), the
U.S. Department of the Interior, the Bureau of Indian
Affairs and analogous state agencies and tribal governments,
have the power to enforce compliance with these laws and
regulations and the permits issued under them, oftentimes
requiring difficult and costly actions. Failure to comply with
these laws, regulations and permits may result in the assessment
of administrative, civil and criminal penalties, the imposition
of remedial obligations, the imposition of stricter conditions
on or revocation of permits, the issuance of injunctions
limiting or preventing some or all of our operations, delays in
granting permits and cancellation of leases.
There is inherent risk of the incurrence of environmental costs
and liabilities in our business, some of which may be material,
due to the handling of our products as they are gathered,
transported, processed and stored, air emissions related to our
operations, historical industry operations, and water and waste
disposal practices. Joint and several, strict liability may be
incurred without regard to fault under certain environmental
laws and regulations, including CERCLA, RCRA and analogous state
laws, for the remediation of contaminated areas and in
connection with spills or releases of natural gas, oil and
wastes on, under, or from our properties and facilities. Private
parties may have the right to pursue legal actions to enforce
compliance as well as to seek damages for non-compliance with
environmental laws and regulations or for personal injury or
property damage arising from our operations. Some sites at which
we operate are located near current or former third-party oil
and natural gas operations or facilities, and there is a risk
that contamination has migrated from those sites to ours. In
addition, increasingly strict laws, regulations and enforcement
policies could materially increase our compliance costs and the
cost of any remediation that may become necessary. Our insurance
may not cover all environmental risks and costs or may not
provide sufficient coverage if an environmental claim is made
against us.
In March 2010, the EPA announced its National Enforcement
Initiatives for 2011 to 2013, which includes the addition of
“Energy Extraction Activities” to its enforcement
priorities list. To address its concerns regarding the pollution
risks raised by new techniques for oil and gas extraction and
coal mining, the EPA is developing an initiative to ensure that
energy extraction activities are complying with federal
environmental requirements. This initiative could involve a
large scale investigation of our facilities and processes, and
could lead to potential enforcement actions, penalties or
injunctive relief against us.
Our business may be adversely affected by increased costs due to
stricter pollution control equipment requirements or liabilities
resulting from non-compliance with required operating or other
regulatory permits. Also, we might not be able to obtain or
maintain from time to time all required environmental regulatory
approvals for our operations. If there is a delay in obtaining
any required environmental regulatory approvals, or if we fail
to obtain and comply with them, the operation or construction of
our facilities could be prevented or become subject to
additional costs.
We are generally responsible for all liabilities associated with
the environmental condition of our facilities and assets,
whether acquired or developed, regardless of when the
liabilities arose and whether they are known or unknown. In
connection with certain acquisitions and divestitures, we could
acquire, or be required to provide indemnification against,
environmental liabilities that could expose us to material
losses, which may not be covered by insurance. In addition, the
steps we could be required to take to bring certain facilities
into compliance could be prohibitively expensive, and we might
be required to shut down, divest or alter the operation of those
facilities, which might cause us to incur losses.
We make assumptions and develop expectations about possible
expenditures related to environmental conditions based on
current laws and regulations and current interpretations of
those laws and regulations. If the interpretation of laws or
regulations, or the laws and regulations themselves, change, our
assumptions may change, and any new capital costs may be
incurred to comply with such changes. In addition, new
environmental laws and regulations might adversely affect our
products and activities, including drilling,
27
processing, storage and transportation, as well as waste
management and air emissions. For instance, federal and state
agencies could impose additional safety requirements, any of
which could affect our profitability.
Our exploration and production operations outside the United
States are subject to various types of regulations similar to
those described above imposed by the governments of the
countries in which we operate, and may affect our operations and
costs within those countries.
Legislation
and regulatory initiatives relating to hydraulic fracturing
could result in increased costs and additional operating
restrictions or delays.
Legislation has been introduced in the United States Congress
called the Fracturing Responsibility and Awareness of Chemicals
Act (the “FRAC Act”) to amend the SDWA to eliminate an
existing exemption for hydraulic fracturing activities from the
definition of “underground injection” and require
federal permitting and regulatory control of hydraulic
fracturing, as well as require disclosure of the chemical
constituents of the fluids used in the fracturing process.
Hydraulic fracturing involves the injection of water, sand and
additives under pressure into rock formations in order to
stimulate natural gas production. We find that the use of
hydraulic fracturing is necessary to produce commercial
quantities of natural gas and oil from many reservoirs. If
adopted, this legislation could establish an additional level of
regulation and permitting at the federal level, and could make
it easier for third parties opposed to the hydraulic fracturing
process to initiate legal proceedings based on allegations that
specific chemicals used in the fracturing process could
adversely affect the environment, including groundwater, soil or
surface water. At this time, it is not clear what action, if
any, the United States Congress will take on the FRAC Act.
Scrutiny of hydraulic fracturing activities continues in other
ways, with the EPA having commenced a multi-year study of the
potential environmental impacts of hydraulic fracturing, the
initial results of which are anticipated to be available by late
2012. In addition to the EPA study, the administration has
tasked the U.S. Department of Energy (“DOE”) to make
recommendations within six months on necessary steps to make
sure that hydraulic fracturing protects public health and the
environment. The U.S. Government Accountability Office is
examining the environmental impacts of produced water and the
White House Counsel for Environmental Quality has been
petitioned by environmental groups to develop a programmatic
environmental impact statement under NEPA for hydraulic
fracturing. Several states have also adopted or considered
legislation requiring the disclosure of fracturing fluids and
other restrictions on hydraulic fracturing, including states in
which we operate (e.g., Wyoming, Pennsylvania, Texas, Colorado,
North Dakota and New Mexico). The U.S. Department of the
Interior is also considering disclosure requirements or other
mandates for hydraulic fracturing on federal land, which, if
adopted, would affect our operations on federal lands. If new
federal or state laws or regulations that significantly restrict
hydraulic fracturing are adopted, such legal requirements could
result in delays, eliminate certain drilling and injection
activities, make it more difficult or costly for us to perform
fracturing and increase our costs of compliance and doing
business as well as delay or prevent the development of
unconventional gas resources from shale formations which are not
commercial without the use of hydraulic fracturing.
Our
ability to produce gas could be impaired if we are unable to
acquire adequate supplies of water for our drilling and
completion operations or are unable to dispose of the water we
use at a reasonable cost and within applicable environmental
rules.
Our inability to locate sufficient amounts of water, or dispose
of or recycle water used in our exploration and production
operations, could adversely impact our operations, particularly
with respect to our Marcellus Shale, San Juan Basin, Bakken
Shale and Piceance Basin operations. Moreover, the imposition of
new environmental initiatives and regulations could include
restrictions on our ability to conduct certain operations such
as hydraulic fracturing or disposal of waste, including, but not
limited to, produced water, drilling fluids and other wastes
associated with the exploration, development or production of
natural gas. The CWA imposes restrictions and strict controls
regarding the discharge of produced waters and other natural gas
and oil waste into navigable waters. Permits must be obtained to
discharge pollutants to waters and to conduct construction
activities in waters and wetlands. The CWA and similar state
laws provide for civil, criminal and administrative penalties
for any unauthorized discharges of pollutants and unauthorized
discharges of reportable quantities of oil and other hazardous
substances. Many state discharge regulations and the Federal
National Pollutant Discharge
28
Elimination System general permits issued by the EPA prohibit
the discharge of produced water and sand, drilling fluids, drill
cuttings and certain other substances related to the natural gas
and oil industry into coastal waters. The EPA has also adopted
regulations requiring certain natural gas and oil exploration
and production facilities to obtain permits for storm water
discharges. Compliance with environmental regulations and permit
requirements governing the withdrawal, storage and use of
surface water or groundwater necessary for hydraulic fracturing
of wells may increase our operating costs and cause delays,
interruptions or termination of our operations, the extent of
which cannot be predicted.
Legal and
regulatory proceedings and investigations relating to the energy
industry, and the complex government regulations to which our
businesses are subject, have adversely affected our business and
may continue to do so. The operation of our businesses might
also be adversely affected by changes in regulations or in their
interpretation or implementation, or the introduction of new
laws, regulations or permitting requirements applicable to our
businesses or our customers.
Public and regulatory scrutiny of the energy industry has
resulted in increased regulations being either proposed or
implemented. Adverse effects may continue as a result of the
uncertainty of ongoing inquiries, investigations and court
proceedings, or additional inquiries and proceedings by federal
or state regulatory agencies or private plaintiffs. In addition,
we cannot predict the outcome of any of these inquiries or
whether these inquiries will lead to additional legal
proceedings against us, civil or criminal fines or penalties, or
other regulatory action, including legislation or increased
permitting requirements. Current legal proceedings or other
matters against us, including environmental matters, suits,
regulatory appeals, challenges to our permits by citizen groups
and similar matters, might result in adverse decisions against
us. The result of such adverse decisions, either individually or
in the aggregate, could be material and may not be covered fully
or at all by insurance.
In addition, existing regulations might be revised or
reinterpreted, new laws, regulations and permitting requirements
might be adopted or become applicable to us, our facilities, our
customers, our vendors or our service providers, and future
changes in laws and regulations could have a material adverse
effect on our financial condition, results of operations and
cash flows. For example, several ruptures on third party
pipelines have occurred recently. In response, various
legislative and regulatory reforms associated with pipeline
safety and integrity have been proposed, including new
regulations covering gathering pipelines that have not
previously been subject to regulation. Such reforms, if adopted,
could significantly increase our costs.
Certain
of our properties, including our operations in the Bakken Shale,
are located on Native American tribal lands and are subject to
various federal and tribal approvals and regulations, which may
increase our costs and delay or prevent our efforts to conduct
planned operations.
Various federal agencies within the U.S. Department of the
Interior, particularly the Bureau of Indian Affairs, Bureau of
Land Management (“BLM”) and the Office of Natural
Resources Revenue, along with each Native American tribe,
promulgate and enforce regulations pertaining to gas and oil
operations on Native American tribal lands. These regulations
and approval requirements relate to such matters as lease
provisions, drilling and production requirements, environmental
standards and royalty considerations. In addition, each Native
American tribe is a sovereign nation having the right to enforce
laws and regulations and to grant approvals independent from
federal, state and local statutes and regulations. These tribal
laws and regulations include various taxes, fees, requirements
to employ Native American tribal members and other conditions
that apply to lessees, operators and contractors conducting
operations on Native American tribal lands. Lessees and
operators conducting operations on tribal lands are generally
subject to the Native American tribal court system. In addition,
if our relationships with any of the relevant Native American
tribes were to deteriorate, we could face significant risks to
our ability to continue the projected development of our leases
on Native American tribal lands. One or more of these factors
may increase our costs of doing business on Native American
tribal lands and impact the viability of, or prevent or delay
our ability to conduct, our natural gas or oil development and
production operations on such lands.
29
Tax laws
and regulations may change over time, including the elimination
of federal income tax deductions currently available with
respect to oil and gas exploration and development.
Tax laws and regulations are highly complex and subject to
interpretation, and the tax laws, treaties and regulations to
which we are subject may change over time. Our tax filings are
based upon our interpretation of the tax laws in effect in
various jurisdictions at the time that the filings were made. If
these laws, treaties or regulations change, or if the taxing
authorities do not agree with our interpretation of the effects
of such laws, treaties and regulations, it could have a material
adverse effect on us.
Among the changes contained in President Obama’s budget
proposal for fiscal year 2012, released by the White House on
February 14, 2011, is the elimination of certain
U.S. federal income tax provisions currently available to
oil and gas exploration and production companies. Such changes
include, but are not limited to, (i) the repeal of the
percentage depletion allowance for oil and gas properties;
(ii) the elimination of current expensing of intangible
drilling and development costs; (iii) the elimination of
the deduction for certain U.S. production activities; and
(iv) an extension of the amortization period for certain
geological and geophysical expenditures. Members of Congress
have introduced legislation with similar provisions in the
current session. It is unclear, however, whether any such
changes will be enacted or how soon such changes could be
effective.
The passage of any legislation as a result of the budget
proposal or any other similar change in U.S. federal income
tax law could eliminate certain tax deductions that are
currently available with respect to oil and gas exploration and
development. The elimination of such federal tax deductions, as
well as any changes to or the imposition of new state or local
taxes (including the imposition of, or increases in production,
severance, or similar taxes) could negatively affect our
financial condition and results of operations.
Our
acquisition attempts may not be successful or may result in
completed acquisitions that do not perform as
anticipated.
We have made and may continue to make acquisitions of businesses
and properties. However, suitable acquisition candidates may not
continue to be available on terms and conditions we find
acceptable. The following are some of the risks associated with
acquisitions, including any completed or future acquisitions:
|
|
|
| |
•
|
some of the acquired businesses or properties may not produce
revenues, reserves, earnings or cash flow at anticipated levels
or could have environmental, permitting or other problems for
which contractual protections prove inadequate;
|
| |
| |
•
|
we may assume liabilities that were not disclosed to us or that
exceed our estimates;
|
| |
| |
•
|
properties we acquire may be subject to burdens on title that we
were not aware of at the time of acquisition or that interfere
with our ability to hold the property for production;
|
| |
| |
•
|
we may be unable to integrate acquired businesses successfully
and realize anticipated economic, operational and other benefits
in a timely manner, which could result in substantial costs and
delays or other operational, technical or financial problems;
|
| |
| |
•
|
acquisitions could disrupt our ongoing business, distract
management, divert resources and make it difficult to maintain
our current business standards, controls and procedures; and
|
| |
| |
•
|
we may issue additional equity or debt securities related to
future acquisitions.
|
Substantial
acquisitions or other transactions could require significant
external capital and could change our risk and property
profile.
In order to finance acquisitions of additional producing or
undeveloped properties, we may need to alter or increase our
capitalization substantially through the issuance of debt or
equity securities, the sale of production payments or other
means. These changes in capitalization may significantly affect
our risk profile. Additionally, significant acquisitions or
other transactions can change the character of our operations
and
30
business. The character of the new properties may be
substantially different in operating or geological
characteristics or geographic location than our existing
properties. Furthermore, we may not be able to obtain external
funding for future acquisitions or other transactions or to
obtain external funding on terms acceptable to us.
Failure
of our service providers or disruptions to our outsourcing
relationships might negatively impact our ability to conduct our
business.
We rely on Williams for certain services necessary for us to be
able to conduct our business. Williams may outsource some or all
of these services to third parties, and a failure of all or part
of Williams’ relationships with its outsourcing providers
could lead to delays in or interruptions of these services. Our
reliance on Williams and others as service providers and on
Williams’ outsourcing relationships, and our limited
ability to control certain costs, could have a material adverse
effect on our business, results of operations and financial
condition.
Some studies indicate a high failure rate of outsourcing
relationships. A deterioration in the timeliness or quality of
the services performed by the outsourcing providers or a failure
of all or part of these relationships could lead to loss of
institutional knowledge and interruption of services necessary
for us to be able to conduct our business. The expiration of
such agreements or the transition of services between providers
could lead to similar losses of institutional knowledge or
disruptions.
Certain of our accounting, information technology, application
development and help desk services are currently provided by
Williams’ outsourcing provider from service centers outside
of the United States. The economic and political conditions in
certain countries from which Williams’ outsourcing
providers may provide services to us present similar risks of
business operations located outside of the United States,
including risks of interruption of business, war, expropriation,
nationalization, renegotiation, trade sanctions or nullification
of existing contracts and changes in law or tax policy, that are
greater than in the United States.
Our
assets and operations can be adversely affected by weather and
other natural phenomena.
Our assets and operations can be adversely affected by
hurricanes, floods, earthquakes, tornadoes and other natural
phenomena and weather conditions, including extreme
temperatures. Insurance may be inadequate, and in some
instances, we have been unable to obtain insurance on
commercially reasonable terms, or insurance has not been
available at all. A significant disruption in operations or a
significant liability for which we were not fully insured could
have a material adverse effect on our business, results of
operations and financial condition.
Our customers’ energy needs vary with weather conditions.
To the extent weather conditions are affected by climate change
or demand is impacted by regulations associated with climate
change, customers’ energy use could increase or decrease
depending on the duration and magnitude of the changes, leading
either to increased investment or decreased revenues.
Acts of
terrorism could have a material adverse effect on our financial
condition, results of operations and cash flows.
Our assets and the assets of our customers and others may be
targets of terrorist activities that could disrupt our business
or cause significant harm to our operations, such as full or
partial disruption to the ability to produce, process, transport
or distribute natural gas, oil, or NGLs. Acts of terrorism as
well as events occurring in response to or in connection with
acts of terrorism could cause environmental repercussions that
could result in a significant decrease in revenues or
significant reconstruction or remediation costs.
31
We have
identified two material weaknesses in our internal controls over
financial reporting. Our failure to achieve and maintain
effective internal controls could have a material adverse effect
on our business in the future, on the price of our Class A
common stock and our access to the capital markets.
Although we are not currently subject to the requirements of
Section 404 of the Sarbanes-Oxley Act of 2002
(“Sarbanes-Oxley”), during the preparation of our
financial statements for each of the three years in the period
ended December 31, 2010 and for the three months ended
March 31, 2011, two material weaknesses (as defined under
Public Company Accounting Oversight Board Standard No. 5)
in our internal controls were identified: one relating to the
timing of the recognition of certain compression deficiency
obligations under compression service agreements, and one
reflecting the aggregation of two significant deficiencies
relating to aspects of depreciation, depletion and amortization
of property, plant and equipment. As a result of these material
weaknesses, adjustments to the estimated carrying value of
property, plant and equipment aggregating approximately
$20 million on a pre-tax basis have been reflected in our
financial statements as of December 31, 2010 and
adjustments to gathering, processing and transportation expense
aggregating approximately $14 million on a pre-tax basis
have been reflected in our income statements for the years ended
December 31, 2008, 2009 and 2010. We have taken steps to
remediate the internal controls related to the material
weaknesses, although we cannot provide assurance that these
steps will prove to be effective. See Note 2 of Notes to
Combined Financial Statements.
We cannot be certain that future significant deficiencies or
material weaknesses will not develop or be identified. As of
December 31, 2012, we will be required to assess the
effectiveness of our internal control over financial reporting
under Sarbanes-Oxley, and we will be required to have our
independent registered public accounting firm audit the
operating effectiveness of our internal control over financial
reporting. If we or our independent registered public accounting
firm were to conclude that our internal control over financial
reporting was not effective, investors could lose confidence in
our reported financial information, the price of our
Class A common stock could decline and access to the
capital markets or other sources of financing could be limited.
Risks
Related to Our Relationship with Williams
We may
not realize the potential benefits from our separation from
Williams.
We may not realize the benefits that we anticipate from our
separation from Williams. These benefits include the following:
|
|
|
| |
•
|
allowing our management to focus its efforts on our business and
strategic priorities;
|
| |
| |
•
|
enhancing our market recognition with investors;
|
| |
| |
•
|
providing us with direct access to the debt and equity capital
markets;
|
| |
| |
•
|
improving our ability to pursue acquisitions through the use of
shares of our common stock as consideration; and
|
| |
| |
•
|
enabling us to allocate our capital more efficiently.
|
We may not achieve the anticipated benefits from our separation
for a variety of reasons. For example, the process of separating
our business from Williams and operating as an independent
public company may distract our management from focusing on our
business and strategic priorities. In addition, although we will
have direct access to the debt and equity capital markets
following the separation, we may not be able to issue debt or
equity on terms acceptable to us or at all. The availability of
shares of our common stock for use as consideration for
acquisitions also will not ensure that we will be able to
successfully pursue acquisitions or that the acquisitions will
be successful. Moreover, even with equity compensation tied to
our business we may not be able to attract and retain employees
as desired. We also may not fully realize the anticipated
benefits from our separation if any of the matters identified as
risks in this “Risk Factors” section were to occur. If
we do not realize the anticipated benefits from our separation
for any reason, our business may be materially adversely
affected.
32
Our
historical and pro forma combined financial information may not
be representative of the results we would have achieved as a
stand-alone public company and may not be a reliable indicator
of our future results.
The historical and pro forma combined financial information that
we have included in this prospectus has been derived from
Williams’ accounting records and may not necessarily
reflect what our financial position, results of operations or
cash flows would have been had we been an independent,
stand-alone entity during the periods presented or those that we
will achieve in the future. Williams did not account for us, and
we were not operated, as a separate, stand-alone company for the
historical periods presented. The costs and expenses reflected
in our historical financial information include an allocation
for certain corporate functions historically provided by
Williams, including executive oversight, cash management and
treasury administration, financing and accounting, tax, internal
audit, investor relations, payroll and human resources
administration, information technology, legal, regulatory and
government affairs, insurance and claims administration, records
management, real estate and facilities management, sourcing and
procurement, mail, print and other office services, and other
services, that may be different from the comparable expenses
that we would have incurred had we operated as a stand-alone
company. These allocations were based on what we and Williams
considered to be reasonable reflections of the historical
utilization levels of these services required in support of our
business. We have not adjusted our historical or pro forma
combined financial information to reflect changes that will
occur in our cost structure and operations as a result of our
transition to becoming a stand-alone public company, including
changes in our employee base, potential increased costs
associated with reduced economies of scale and increased costs
associated with the SEC reporting and the NYSE requirements.
Therefore, our historical and pro forma combined financial
information may not necessarily be indicative of what our
financial position, results of operations or cash flows will be
in the future. For additional information, see “Selected
Historical Combined Financial Data” and
“Management’s Discussion and Analysis of Financial
Condition and Results of Operations,” and our financial
statements and related notes included elsewhere in this
prospectus.
Following
this offering, we will continue to depend on Williams to provide
us with certain services for our business; the services that
Williams will provide to us following the separation may not be
sufficient to meet our needs, and we may have difficulty finding
replacement services or be required to pay increased costs to
replace these services after our agreements with Williams
expire.
Certain administrative services required by us for the operation
of our business are currently provided by Williams and its
subsidiaries, including services related to cash management and
treasury administration, finance and accounting, tax, internal
audit, investor relations, payroll and human resources
administration, information technology, legal, regulatory and
government affairs, insurance and claims administration, records
management, real estate and facilities management, sourcing and
procurement, mail, print and other office services. Prior to the
completion of this offering, we will enter into agreements with
Williams related to the separation of our business operations
from Williams, including an administrative services agreement
and a transition services agreement. The services provided under
the administrative services agreement will commence on the date
this offering is completed and terminate upon the earlier of
(i) the date immediately prior to the date Williams
distributes all of our shares of common stock that it owns to
its stockholders (which we refer to as the distribution date) or
(ii) sixty days’ notice by Williams if it determines
that the provision of such services involves certain conflicts
of interest between Williams and us or would cause Williams to
violate applicable law. The services provided under the
transition services agreement will commence on the distribution
date and terminate upon the earlier of (i) one year after
the distribution date or (ii) sixty days’ notice by
either party. In addition, Williams may immediately terminate
any of the services it provides to us under the transition
services agreement if it determines that the provision of such
services involves certain conflicts of interest between Williams
and us or would cause Williams to violate applicable law. We
believe it is necessary for Williams to provide services for us
under the administrative services agreement and the transition
services agreement to facilitate the efficient operation of our
business as we transition to becoming a stand alone public
company. We will, as a result, initially depend on Williams for
services following this offering. While these services are being
provided to us by Williams, our operational flexibility to
modify or implement changes with respect to such services or the
amounts we pay for them will be limited. After the
33
expiration or termination of these agreements, we may not be
able to replace these services or enter into appropriate
third-party agreements on terms and conditions, including cost,
comparable to those that we will receive from Williams under our
agreements with Williams. Although we intend to replace portions
of the services currently provided by Williams, we may encounter
difficulties replacing certain services or be unable to
negotiate pricing or other terms as favorable as those we
currently have in effect. See “Arrangements Between
Williams and Our Company—Administrative Services and
Transition Services Agreements.”
Your
investment in our Class A common stock may be adversely
affected if Williams does not spin-off the common stock owned by
Williams.
Williams has advised us that, following the completion of this
offering, it intends to spin-off all of the shares of our common
stock that it owns to its stockholders. Williams has indicated
that it intends to complete the spin-off in 2012 and to convert
its Class B common shares to Class A common shares
immediately prior to such spin-off, assuming such conversion
would not jeopardize the ability to consummate the tax-free
spin-off or the tax-free treatment of any related restructuring
transaction undertaken by Williams. Williams may decide not to
complete this offering or the spin-off if, at any time,
Williams’ board of directors determines, in its sole
discretion, that this offering or the spin-off is not in the
best interests of Williams or its stockholders. Unless and until
such a spin-off occurs, we will face the risks discussed in this
prospectus relating to our continuing relationship with
Williams, including its control of us and potential conflicts of
interest between Williams and us. In addition, if a spin-off
does not occur, the liquidity of the market for our Class A
common stock may be constrained for as long as Williams, or a
successor controlling shareholder, continues to hold a
significant position in our common stock. A lack of liquidity in
the market for our Class A common stock may adversely
affect our share price.
Our share
price may decline because of Williams’ ability to sell
shares of our common stock.
Sales of substantial amounts of our common stock after this
offering, or the possibility of those sales, could adversely
affect the market price of our Class A common stock and
impede our ability to raise capital through the issuance of
equity securities. See “Shares Eligible for Future
Sale” for a discussion of possible future sales of our
common stock.
After the completion of this offering, Williams will own 100% of
our outstanding Class B common stock, giving
Williams % of the shares of our
outstanding common stock, or % if
the underwriters exercise their option to purchase additional
Class A common shares in full. Williams has advised us that
it intends to complete the distribution of all of our common
stock owned by Williams to its stockholders by the end of 2012.
Common stock so distributed will be freely tradable by such
Williams stockholders who are not deemed to be our affiliates or
are otherwise subject to
lock-up
agreements.
Williams has no contractual obligation to retain its shares of
our common stock, except for a limited period described under
“Underwriting” during which it will not sell any of
its shares of our common stock without the consent of Barclays
Capital Inc. until 180 days after the date of this
prospectus, subject to extension in certain circumstances.
Subject to applicable U.S. federal and state securities
laws, after the expiration of this
180-day
waiting period (or before, with consent of the underwriters to
this offering), Williams may sell any and all of the shares of
our common stock that it beneficially owns or distribute any or
all of these shares of our common stock to its stockholders.
This 180-day
waiting period does not apply to the distribution by Williams of
its remaining ownership interest in us to its common
stockholders. The registration rights agreement described
elsewhere in this prospectus grants Williams the right to
require us to register the shares of our common stock it holds
in specified circumstances. In addition, after the expiration of
this 180-day
waiting period, we could issue and sell additional shares of our
Class A common stock. Any sale by Williams or us of our
common stock in the public market, or the perception that sales
could occur (for example, as a result of the distribution),
could adversely affect prevailing market prices for the shares
of our common stock.
34
As long
as we are controlled by Williams, your ability to influence the
outcome of matters requiring stockholder approval will be
limited.
After the completion of this offering, Williams will not own any
shares of our Class A common stock and will own 100% of our
outstanding Class B common stock, giving
Williams % of the shares of our
outstanding common stock and % of
the combined voting power of our outstanding common stock,
or %
and %, respectively, if the
underwriters exercise their option to purchase additional
Class A common shares in full. As long as Williams has
voting control of our company, Williams will have the ability to
take many stockholder actions, including the election or removal
of directors, irrespective of the vote of, and without prior
notice to, any other stockholder. As a result, Williams will
have the ability to influence or control all matters affecting
us, including:
|
|
|
| |
•
|
the composition of our board of directors and, through our board
of directors, decision-making with respect to our business
direction and policies, including the appointment and removal of
our officers;
|
| |
| |
•
|
any determinations with respect to acquisitions of businesses,
mergers, or other business combinations;
|
| |
| |
•
|
our acquisition or disposition of assets;
|
| |
| |
•
|
our capital structure;
|
| |
| |
•
|
changes to the agreements relating to our separation from
Williams;
|
| |
| |
•
|
our payment or non-payment of dividends on our common
stock; and
|
| |
| |
•
|
determinations with respect to our tax returns.
|
Williams’ interests may not be the same as, or may conflict
with, the interests of our other stockholders. As a result,
actions that Williams takes with respect to us, as our
controlling stockholder, may not be favorable to us. In
addition, this voting control may discourage transactions
involving a change of control of our company, including
transactions in which you, as a holder of our Class A
common stock, might otherwise receive a premium for your shares
over the then-current market price. Furthermore, Williams is not
prohibited from selling a controlling interest in our company to
a third party without your approval or without providing for a
purchase of your shares. At any time following the completion of
this offering and the expiration or waiver of the applicable
lock-up
period described under “Underwriting,” Williams has
the right to spin-off shares of our common stock that it owns to
its stockholders. In addition, after the expiration or waiver of
the applicable
lock-up
period described under “Underwriting,” Williams has
the right to sell a controlling interest in us to a third party,
without your approval and without providing for a purchase of
your shares. There is no assurance that Williams will effect the
spin-off, and if Williams elects not to effect the spin-off, it
could remain our stockholder for an extended or indefinite
period of time. In addition, Williams may decide not to complete
the spin-off if, at any time, Williams’ board of directors
determines, in its sole discretion, that the spin-off is not in
the best interests of Williams or its stockholders. As a result,
the spin-off may not occur by 2012 or at all. See
“Shares Eligible For Future Sale.”
We may
have potential business conflicts of interest with Williams
regarding our past and ongoing relationships, and because of
Williams’ controlling ownership in us, the resolution of
these conflicts may not be favorable to us.
Conflicts of interest may arise between Williams and us in a
number of areas relating to our past and ongoing relationships,
including:
|
|
|
| |
•
|
labor, tax, employee benefit, indemnification and other matters
arising under agreements with Williams;
|
| |
| |
•
|
employee recruiting and retention;
|
| |
| |
•
|
sales or distributions by Williams of all or any portion of its
ownership interest in us, which could be to one of our
competitors; and
|
| |
| |
•
|
business opportunities that may be attractive to both Williams
and us.
|
35
We may not be able to resolve any potential conflicts, and, even
if we do so, the resolution may be less favorable to us than if
we were dealing with an unaffiliated party.
Finally, in connection with this offering, we will enter into
several agreements with Williams. These agreements will be made
in the context of a parent-subsidiary relationship and will be
entered into in the overall context of our separation from
Williams. The terms of these agreements may be more or less
favorable to us than if they had been negotiated with
unaffiliated third parties. While we are controlled by Williams,
Williams may seek to cause us to amend these agreements on terms
that may be less favorable to us than the original terms of the
agreement.
During the terms of the administrative services agreement and
the transition services agreement, and for one year thereafter,
neither we nor Williams will be permitted to solicit each
other’s employees for employment without the other’s
consent.
Pursuant
to the terms of our amended and restated certificate of
incorporation, Williams is not required to offer corporate
opportunities to us, and certain of our directors and officers
are permitted to offer certain corporate opportunities to
Williams before us.
Our amended and restated certificate of incorporation provides
that, until both (1) Williams and its subsidiaries no
longer beneficially own 50% or more of the voting power of all
then outstanding shares of our capital stock generally entitled
to vote in the election of our directors and (2) no person
who is a director or officer of Williams or of a subsidiary of
Williams is also a director or officer of ours:
|
|
|
| |
•
|
Williams is free to compete with us in any activity or line of
business;
|
| |
| |
•
|
we do not have any interest or expectancy in any business
opportunity, transaction, or other matter in which Williams
engages or seeks to engage merely because we engage in the same
or similar lines of business;
|
| |
| |
•
|
to the fullest extent permitted by law, Williams will have no
duty to communicate its knowledge of, or offer, any potential
business opportunity, transaction, or other matter to us, and
Williams is free to pursue or acquire such business opportunity,
transaction, or other matter for itself or direct the business
opportunity, transaction, or other matter to its
affiliates; and
|
| |
| |
•
|
if any director or officer of Williams who is also one of our
officers or directors becomes aware of a potential business
opportunity, transaction, or other matter (other than one
expressly offered to that director or officer in writing solely
in his or her capacity as our director or officer), that
director or officer will have no duty to communicate or offer
that business opportunity to us, and will be permitted to
communicate or offer that business opportunity to Williams (or
its affiliates) and that director or officer will not, to the
fullest extent permitted by law, be deemed to have
(1) breached or acted in a manner inconsistent with or
opposed to his or her fiduciary or other duties to us regarding
the business opportunity or (2) acted in bad faith or in a
manner inconsistent with the best interests of our company or
our stockholders.
|
At the completion of this offering, our board of directors will
include persons who are also directors
and/or
officers of Williams. In addition, after the completion of the
spin-off of our stock to Williams’ stockholders, we expect
that our board of directors will continue to include persons who
are also directors
and/or
officers of Williams. As a result, Williams may gain the benefit
of corporate opportunities that are presented to these directors.
Our
agreements with Williams require us to assume the past, present,
and future liabilities related to our business and may be less
favorable to us than if they had been negotiated with
unaffiliated third parties.
We negotiated all of our agreements with Williams as a
wholly-owned subsidiary of Williams and will enter into these
agreements prior to the completion of this offering. If these
agreements had been negotiated with unaffiliated third parties,
they might have been more favorable to us. Pursuant to the
separation and distribution agreement, we have assumed all past,
present and future liabilities (other than tax liabilities which
36
will be governed by the tax sharing agreement as described
herein; see “Arrangements Between Williams and Our
Company—Tax Sharing Agreement”) related to our
business, and we will agree to indemnify Williams for these
liabilities, among other matters. Such liabilities include
unknown liabilities that could be significant. The allocation of
assets and liabilities between Williams and us may not reflect
the allocation that would have been reached between two
unaffiliated parties. See “Arrangements Between Williams
and Our Company” for a description of these obligations and
the allocation of liabilities between Williams and us.
Our
agreements with Williams may limit our ability to obtain
additional financing or make acquisitions.
We may engage, or desire to engage, in future financings or
acquisitions. However, because our agreements with Williams are
designed to preserve the tax-free status of the spin-off and any
related restructuring transaction, we will agree to certain
restrictions in those agreements that may severely limit our
ability to effect future financings or acquisitions. For
example, for the spin-off of our stock to Williams’
stockholders to be tax-free to Williams and its stockholders,
among other things, Williams must own at least 80% of the voting
power of all then outstanding shares of our capital stock
entitled to vote generally in the election of directors (and at
least 80% of the then outstanding shares of any class of
non-voting stock) at the time of the spin-off. In addition,
after the spin-off, our stock may not undergo a 50% or greater
change of ownership (measured by vote or value) in transactions
considered related to the spin-off. Therefore, the tax sharing
agreement and the separation and distribution agreement restrict
our ability to issue or sell additional common stock or other
securities (including securities convertible into our common
stock) prior to the spin-off to the extent that such issuances
or sales would reduce Williams’ ownership below certain
threshold levels, and for a period after the spin-off to the
extent that such issuances would cause us to undergo significant
ownership changes.
In addition, we will agree in the separation and distribution
agreement that we will not (without Williams’ prior written
consent) take any of the following actions prior to the spin-off:
|
|
|
| |
•
|
acquire any businesses or assets with an aggregate value of more
than
$ million
for all such acquisitions;
|
| |
| |
•
|
dispose of any assets with an aggregate value of more than
$ million
for all such dispositions; and
|
| |
| |
•
|
acquire any equity or debt securities of any other person with
an aggregate value of more than
$ million
for all such acquisitions.
|
The separation and distribution agreement will also provide that
for so long as Williams owns 50% or more of the voting power of
all then outstanding shares of our capital stock entitled to
vote generally in the election of directors, we will not
(without the prior written consent of Williams) take any actions
that could reasonably result in Williams being in breach or in
default under any contract or agreement. Also, for so long as
Williams is required to consolidate our results of operations
and financial position, we may not incur any additional
indebtedness (other than under our Credit Facility and the
issuance of the Notes) without the prior written consent of
Williams.
Our tax
sharing agreement with Williams may limit our ability to take
certain actions and may require us to indemnify Williams for
significant tax liabilities.
Under the tax sharing agreement, we will agree to take
reasonable action or reasonably refrain from taking action to
ensure that the spin-off of our stock to Williams’
stockholders and any related restructuring transaction qualify
for tax-free status under section 355 and
section 368(a)(1)(D) of the Internal Revenue Code of 1986,
as amended (the “Code”) (unless Williams receives a
private letter ruling from the Internal Revenue Service
(“IRS”) or the IRS issues other guidance that can be
relied on conclusively to the effect that a contemplated matter
or transaction would not jeopardize such tax-free status of the
spin-off and related restructuring transaction). We will also
make various other covenants in the tax sharing agreement
intended to ensure the tax-free status of the spin-off and any
related restructuring transaction. These covenants may restrict
our ability to sell assets outside the ordinary course of
business, to issue or sell additional common stock or other
securities (including securities convertible into our common
stock), or to enter into certain other corporate transactions.
For example, prior to
37
the spin-off, we may not enter into any transactions that would
reduce Williams’ ownership to less than 80% of the voting
power of all then outstanding shares of our capital stock
entitled to vote generally in the election of directors or 80%
of the then outstanding shares of any class of non-voting stock.
Similarly, after the spin-off, we may not enter into any
transaction that would cause us to undergo either a 50% or
greater change in the ownership of our voting stock or a 50% or
greater change in the ownership (measured by value) of all
classes of our stock (in either case, taking into account shares
issued in this offering) in transactions considered related to
the spin-off. See “Arrangements Between Williams and Our
Company—Tax Sharing Agreement” for a discussion of
these restrictions.
Further, under the tax sharing agreement, we are required to
indemnify Williams against certain
tax-related
liabilities incurred by Williams (including any of its
subsidiaries) relating to the spin-off of our stock to
Williams’ stockholders or relating to any related
restructuring transaction undertaken by Williams, to the extent
caused by our breach of any representations or covenants made in
the tax sharing agreement or the separation and distribution
agreement, or made in connection with the private letter ruling
or tax opinion. These liabilities include the substantial
tax-related liability (calculated without regard to any net
operating loss or other tax attribute of Williams) that would
result if the spin-off of our stock to Williams’
stockholders failed to qualify as a tax-free transaction.
We will
not have complete control over our tax decisions and could be
liable for income taxes owed by Williams.
For so long as Williams continues to own at least 80% of the
total voting power and value of our common stock, we and our
U.S. subsidiaries will be included in Williams’
consolidated group for U.S. federal income tax purposes. In
addition, we or one or more of our U.S. subsidiaries may be
included in the combined, consolidated or unitary tax returns of
Williams or one or more of its subsidiaries for U.S. state
or local income tax purposes. Under the tax sharing agreement,
for each period in which we or any of our subsidiaries are
consolidated or combined with Williams for purposes of any tax
return, Williams will prepare a pro forma tax return for us as
if we filed our own consolidated, combined or unitary return,
except that such pro forma tax return will only include current
income, deductions, credits and losses from us (with certain
exceptions), will not include any carryovers or carrybacks of
losses or credits and will be calculated without regard to the
federal Alternative Minimum Tax. We will reimburse Williams for
any taxes shown on the pro forma tax returns, and Williams will
reimburse us for any current losses or credits we recognize
based on the pro forma tax returns. In addition, by virtue of
Williams’ controlling ownership and the tax sharing
agreement, Williams will effectively control all of our
U.S. tax decisions in connection with any consolidated,
combined or unitary income tax returns in which we (or any of
our subsidiaries) are included. The tax sharing agreement
provides that Williams will have sole authority to respond to
and conduct all tax proceedings (including tax audits) relating
to us, to prepare and file all consolidated, combined or unitary
income tax returns on our behalf (including the making of any
tax elections), and to determine the reimbursement amounts in
connection with any pro forma tax returns. This arrangement may
result in conflicts of interest between Williams and us. For
example, under the tax sharing agreement, Williams will be able
to choose to contest, compromise or settle any adjustment or
deficiency proposed by the relevant taxing authority in a manner
that may be beneficial to Williams and detrimental to us. See
“Arrangements Between Williams and Our Company—Tax
Sharing Agreement.”
Moreover, notwithstanding the tax sharing agreement,
U.S. federal law provides that each member of a
consolidated group is liable for the group’s entire tax
obligation. Thus, to the extent Williams or other members of
Williams’ consolidated group fail to make any
U.S. federal income tax payments required by law, we could
be liable for the shortfall. Similar principles may apply for
foreign, state or local income tax purposes where we file
combined, consolidated or unitary returns with Williams or its
subsidiaries for federal, foreign, state or local income tax
purposes.
38
|
|
|
|
If,
following the completion of the spin-off of our stock to
Williams’ stockholders, there is a determination that the
spin-off is taxable for U.S. federal income tax purposes because
the facts, assumptions, representations, or undertakings
underlying the IRS private letter ruling or tax opinion are
incorrect or for any other reason, then Williams and its
stockholders could incur significant income tax liabilities, and
we could incur significant liabilities.
|
The spin-off will be conditioned upon, among other things,
Williams’ receipt of a private letter ruling from the IRS
and an opinion of its outside tax advisor reasonably acceptable
to the Williams board of directors, to the effect that the
distribution by Williams of the shares of our common stock held
by Williams after the offering, and any related restructuring
transaction undertaken by Williams, will qualify for
U.S. federal income tax purposes as a tax-free transaction
under section 355 and section 368(a)(1)(D) of the
Code. The ruling and opinion will rely on certain facts,
assumptions, representations and undertakings from Williams and
us regarding the past and future conduct of the companies’
respective businesses and other matters. If any of these facts,
assumptions, representations, or undertakings are, or become,
incorrect or not otherwise satisfied, Williams and its
stockholders may not be able to rely on the private letter
ruling and opinion of its tax advisor and could be subject to
significant tax liabilities. In addition, notwithstanding the
opinion of Williams’ tax advisor, the IRS could conclude
upon audit that the spin-off is taxable if it determines that
any of these facts, assumptions, representations, or
undertakings are, or have become, not correct or have been
violated or if it disagrees with the conclusions in the opinion,
or for other reasons, including as a result of certain
significant changes in the stock ownership of Williams or us
after the spin-off. If the spin-off is determined to be taxable
for U.S. federal income tax purposes for any reason,
Williams
and/or its
stockholders could incur significant income tax liabilities, and
we could incur significant liabilities. For a description of the
sharing of such liabilities between Williams and us, see
“Arrangements Between Williams and Our Company—Tax
Sharing Agreement.”
|
|
|
|
Third
parties may seek to hold us responsible for liabilities of
Williams that we did not assume in our agreements.
|
Third parties may seek to hold us responsible for retained
liabilities of Williams. Under our agreements with Williams,
Williams will agree to indemnify us for claims and losses
relating to these retained liabilities. However, if those
liabilities are significant and we are ultimately held liable
for them, we cannot assure you that we will be able to recover
the full amount of our losses from Williams.
|
|
|
|
Our prior
and continuing relationship with Williams exposes us to risks
attributable to businesses of Williams.
|
Williams is obligated to indemnify us for losses that a party
may seek to impose upon us or our affiliates for liabilities
relating to the business of Williams that are incurred through a
breach of the separation and distribution agreement or any
ancillary agreement by Williams or its affiliates other than us,
or losses that are attributable to Williams in connection with
this offering or are not expressly assumed by us under our
agreements with Williams. Immediately following this offering,
any claims made against us that are properly attributable to
Williams in accordance with these arrangements would require us
to exercise our rights under our agreements with Williams to
obtain payment from Williams. We are exposed to the risk that,
in these circumstances, Williams cannot, or will not, make the
required payment.
|
|
|
|
Our
directors and executive officers who own shares of common stock
of Williams, who hold options to acquire common stock of
Williams or other Williams equity-based awards, or who hold
positions with Williams, may have actual or potential conflicts
of interest.
|
Ownership of shares of common stock of Williams, options to
acquire shares of common stock of Williams and other
equity-based securities of Williams by certain of our directors
and officers after this offering, and the presence of directors
or officers of Williams on our board of directors could create,
or appear to create, potential conflicts of interest when those
directors and officers are faced with decisions that could have
different implications for Williams than they do for us. Certain
of our directors will hold director
and/or
officer positions with Williams or beneficially own significant
amounts of common stock of Williams. See “Management.”
39
In addition, initially, if our board of directors does not form
a compensation committee or nominating and governance committee
in connection with the completion of this offering, the Williams
nominating and governance committee may make recommendations to
our board of directors regarding compensation for our directors
and officers, which could also create, or appear to create,
similar potential conflicts of interest. See
“Management” for a description of the extent of the
relationship between our directors and officers and directors
and officers of Williams.
|
|
|
|
We will
be a “controlled company” within the meaning of the
NYSE rules and, as a result, will qualify for, and intend to
rely on, exemptions from certain corporate governance
requirements that provide protection to stockholders of other
companies.
|
After the completion of this offering and prior to the spin-off
of our stock to Williams’ stockholders, Williams will own
more than 50% of the voting power of all then outstanding shares
of our capital stock entitled to vote generally in the election
of directors, and we will be a “controlled company”
under the NYSE corporate governance standards. As a controlled
company, we intend to rely on certain exemptions from the NYSE
standards that will enable us not to comply with certain NYSE
corporate governance requirements, including the requirements
that:
|
|
|
| |
•
|
a majority of our board of directors consists of independent
directors;
|
| |
| |
•
|
we have a nominating and governance committee that is composed
entirely of independent directors, with a written charter
addressing the committee’s purpose and responsibilities;
|
| |
| |
•
|
we have a compensation committee that is composed entirely of
independent directors, with a written charter addressing the
committee’s purpose and responsibilities; and
|
| |
| |
•
|
we conduct an annual performance evaluation of the nominating
and governance committee and compensation committee.
|
We intend to rely on some or all of these exemptions, and, as a
result, prior to the spin-off, you will not have the same
protection afforded to stockholders of companies that are
subject to all of the NYSE corporate governance requirements.
Risks
Related to this Offering
|
|
|
|
No market
currently exists for our Class A common stock. We cannot
assure you that an active trading market will develop for our
Class A common stock.
|
Prior to this offering, there has been no public market for
shares of our Class A common stock. We cannot predict the
extent to which investor interest in our company will lead to
the development of a trading market on the NYSE or otherwise, or
how liquid that market might become. If an active market does
not develop, you may have difficulty selling any shares of our
Class A common stock that you purchase in this initial
public offering. The initial public offering price for the
shares of our Class A common stock has been determined by
negotiations between us and the representatives of the
underwriters, and may not be indicative of prices that will
prevail in the open market following this offering.
|
|
|
|
If our
Class A stock price fluctuates after this offering, you
could lose a significant part of your investment.
|
The market price of our Class A stock may be influenced by
many factors, some of which are beyond our control, including
those described above in “—Risks Related to Our
Business” and the following:
|
|
|
| |
•
|
the failure of securities analysts to cover our Class A
common stock after this offering or changes in financial
estimates by analysts;
|
| |
| |
•
|
the inability to meet the financial estimates of analysts who
follow our Class A common stock;
|
| |
| |
•
|
strategic actions by us or our competitors;
|
40
|
|
|
| |
•
|
announcements by us or our competitors of significant contracts,
acquisitions, joint marketing relationships, joint ventures or
capital commitments;
|
| |
| |
•
|
variations in our quarterly operating results and those of our
competitors;
|
| |
| |
•
|
general economic and stock market conditions;
|
| |
| |
•
|
risks related to our business and our industry, including those
discussed above;
|
| |
| |
•
|
changes in conditions or trends in our industry, markets or
customers;
|
| |
| |
•
|
terrorist acts;
|
| |
| |
•
|
future sales of our Class A common stock or other
securities; and
|
| |
| |
•
|
investor perceptions of the investment opportunity associated
with our Class A common stock relative to other investment
alternatives.
|
As a result of these factors, investors in our Class A
common stock may not be able to resell their shares at or above
the initial offering price or may not be able to resell them at
all. These broad market and industry factors may materially
reduce the market price of our Class A common stock,
regardless of our operating performance. In addition, price
volatility may be greater if the public float and trading volume
of our Class A common stock is low.
|
|
|
|
Future
sales, or the perception of future sales, of our common stock
may depress the price of our Class A common
stock.
|
The market price of our Class A common stock could decline
significantly as a result of sales of a large number of shares
of our common stock in the market after this offering, including
shares which might be offered for sale by Williams. The
perception that these sales might occur could depress the market
price. These sales, or the possibility that these sales may
occur, also might make it more difficult for us to sell equity
securities in the future at a time and at a price that we deem
appropriate.
Upon completion of this offering, we will
have shares
of Class A common stock
( shares
if the underwriters exercise their option to purchase additional
Class A common shares in full)
and shares
of Class B common stock outstanding
( shares
if the underwriters exercise their option to purchase additional
Class A common shares in full). The shares of Class A
common stock offered in this offering will be freely tradable
without restriction under the Securities Act of 1933, as amended
(the “Securities Act”), except for any shares of
Class A common stock that may be held or acquired by our
directors, executive officers and other affiliates, as that term
is defined in the Securities Act, which will be restricted
securities under the Securities Act. Restricted securities may
not be sold in the public market unless the sale is registered
under the Securities Act or an exemption from registration is
available. We will grant registration rights to Williams with
respect to the common stock it owns. Any shares registered
pursuant to the registration rights agreement with Williams
described in “Arrangements Between Williams and Our
Company” will be freely tradable in the public market.
In connection with this offering, we, our directors and
executive officers, Williams and its directors and executive
officers have each agreed to enter into a
lock-up
agreement and thereby be subject to a
lock-up
period, meaning that they and their permitted transferees will
not be permitted to sell any of the shares of our common stock
for 180 days after the date of this prospectus, subject to
certain extensions without the prior consent of the
underwriters. Although we have been advised that there is no
present intention to do so, the underwriters may, in their sole
discretion and without notice, release all or any portion of the
shares of our common stock from the restrictions in any of the
lock-up
agreements described above. See “Underwriting.”
Also, in the future, we may issue our securities in connection
with investments or acquisitions. The amount of shares of our
common stock issued in connection with an investment or
acquisition could constitute a material portion of our then
outstanding shares of our common stock.
41
|
|
|
|
We will
not receive any benefit and accordingly you will suffer
increased dilution if the underwriters exercise their option to
purchase additional Class A common shares.
|
If the underwriters exercise their option to purchase additional
Class A common shares, all of our net proceeds will be
distributed to Williams in connection with our restructuring
transactions. Accordingly, we will receive no benefit from the
issuance of any shares of our Class A common stock subject
to the underwriters’ over-allotment option.
|
|
|
|
Our costs
may increase as a result of operating as a public company, and
our management will be required to devote substantial time to
complying with public company regulations.
|
We have historically operated our business as a segment of a
public company. As a stand-alone public company, we may incur
additional legal, accounting, compliance and other expenses that
we have not incurred historically. After this offering, we will
become obligated to file with the SEC annual and quarterly
information and other reports that are specified in
Section 13 and other sections of the Securities Exchange
Act of 1934, as amended (the “Exchange Act”). We will
also be required to ensure that we have the ability to prepare
financial statements that are fully compliant with all SEC
reporting requirements on a timely basis. In addition, we will
also become subject to other reporting and corporate governance
requirements, including certain requirements of the NYSE, and
certain provisions of Sarbanes-Oxley and the regulations
promulgated thereunder, which will impose significant compliance
obligations upon us.
Sarbanes-Oxley, as well as new rules subsequently implemented by
the SEC and the NYSE, have imposed increased regulation and
disclosure and required enhanced corporate governance practices
of public companies. We are committed to maintaining high
standards of corporate governance and public disclosure, and our
efforts to comply with evolving laws, regulations and standards
in this regard are likely to result in increased marketing,
selling and administrative expenses and a diversion of
management’s time and attention from revenue-generating
activities to compliance activities. These changes will require
a significant commitment of additional resources. We may not be
successful in implementing these requirements and implementing
them could materially adversely affect our business, results of
operations and financial condition. In addition, if we fail to
implement the requirements with respect to our internal
accounting and audit functions, our ability to report our
operating results on a timely and accurate basis could be
impaired. If we do not implement such requirements in a timely
manner or with adequate compliance, we might be subject to
sanctions or investigation by regulatory authorities, such as
the SEC or the NYSE. Any such action could harm our reputation
and the confidence of investors and clients in our company and
could materially adversely affect our business and cause our
share price to fall.
|
|
|
|
Failure
to achieve and maintain effective internal controls in
accordance with Section 404 of
Sarbanes-Oxley could have a material adverse effect on our
business and stock price.
|
As a public company, we will be required to document and test
our internal control procedures in order to satisfy the
requirements of Section 404 of Sarbanes-Oxley, which will
require annual management assessments of the effectiveness of
our internal control over financial reporting and a report by
our independent registered public accounting firm that addresses
the effectiveness of internal control over financial reporting.
During the course of our testing, we may identify deficiencies
which we may not be able to remediate in time to meet our
deadline for compliance with Section 404. Testing and
maintaining internal control can divert our management’s
attention from other matters that are important to the operation
of our business. We also expect the new regulations to increase
our legal and financial compliance costs, make it more difficult
to attract and retain qualified officers and members of our
board of directors, particularly to serve on our audit
committee, and make some activities more difficult, time
consuming and costly. We may not be able to conclude on an
ongoing basis that we have effective internal control over
financial reporting in accordance with Section 404 or our
independent registered public accounting firm may not be able or
willing to issue an unqualified report on the effectiveness of
our internal control over financial reporting. If we conclude
that our internal control over financial reporting is not
effective, we cannot be certain as to the timing of completion
of our evaluation, testing and remediation actions or their
effect on our operations because there is presently no precedent
available by which to measure compliance adequacy. If either we
are unable to conclude that we have effective internal control
over financial reporting or our independent auditors are unable
to provide us with an
42
unqualified report as required by Section 404, then
investors could lose confidence in our reported financial
information, which could have a negative effect on the trading
price of our Class A common stock.
|
|
|
|
If
securities or industry analysts do not publish research or
reports about our business, if they adversely change their
recommendations regarding our stock or if our operating results
do not meet their expectations, our stock price could
decline.
|
The trading market for our Class A common stock will be
influenced by the research and reports that industry or
securities analysts publish about us or our business. If one or
more of these analysts cease coverage of our company or fail to
publish reports on us regularly, we could lose visibility in the
financial markets, which in turn could cause our stock price or
trading volume to decline. Moreover, if one or more of the
analysts who cover our company downgrades our stock or if our
operating results do not meet their expectations, our stock
price could decline.
|
|
|
|
Investors
purchasing Class A common stock in this offering will incur
substantial and immediate dilution.
|
Dilution per share represents the difference between the initial
public offering price per share of our Class A common stock
and the net tangible book value per share of our common stock
upon the completion of this offering. The initial public
offering price of our Class A common stock is substantially
higher than the net tangible book value per share of our
outstanding common stock. Purchasers of our common stock in this
offering will incur immediate and substantial dilution of
$ per share in the net tangible
book value of our common stock from an assumed initial public
offering price of $ per share,
which is the midpoint of the estimated offering price range set
forth on the cover page of this prospectus. If the underwriters
exercise their option to purchase additional Class A common
shares in full, there will be dilution of
$ per share in the net tangible
book value of our common stock. This means that if we were to be
liquidated immediately after this offering, there might be no
assets available for distribution to you after satisfaction of
all our obligations to creditors. For a further description of
the effects of dilution in the net tangible book value of our
common stock, see “Dilution.”
Further, if we issue additional equity securities to raise
additional capital, your ownership interest in our company may
be diluted and the value of your investment may be reduced.
|
|
|
|
We do not
anticipate paying any dividends on our common stock in the
foreseeable future. As a result, you will need to sell your
shares of common stock to receive any income or realize a return
on your investment.
|
We do not anticipate paying any dividends on our common stock in
the foreseeable future. Any declaration and payment of future
dividends to holders of our common stock may be limited by the
provisions of the Delaware General Corporation Law. The future
payment of dividends will be at the sole discretion of our board
of directors and will depend on many factors, including our
earnings, capital requirements, financial condition and other
considerations that our board of directors deems relevant. As a
result, to receive any income or realize a return on your
investment, you will need to sell your shares of Class A
common stock. You may not be able to sell your shares of
Class A common stock at or above the price you paid for
them.
|
|
|
|
Provisions
of Delaware law, our charter documents and our stockholder
rights plan may delay or prevent an acquisition of us that
stockholders may consider favorable or may prevent efforts by
our stockholders to change our directors or our management,
which could decrease the value of your shares.
|
Section 203 of the Delaware General Corporation Law and
provisions in our amended and restated certificate of
incorporation and amended and restated bylaws could make it more
difficult for a third party to acquire us without the consent of
our board of directors. See “Description of Capital
Stock—Anti-Takeover Effects of Certificate of Incorporation
and Bylaws Provisions.” These provisions include the
following:
|
|
|
| |
•
|
restrictions on business combinations for a three-year period
with a stockholder who becomes the beneficial owner of more than
15% of our common stock;
|
43
|
|
|
| |
•
|
restrictions on the ability of our stockholders to remove
directors;
|
| |
| |
•
|
supermajority voting requirements for stockholders to amend our
organizational documents; and
|
| |
| |
•
|
a classified board of directors.
|
Although we believe these provisions protect our stockholders
from coercive or otherwise unfair takeover tactics and thereby
provide an opportunity to receive a higher bid by requiring
potential acquirers to negotiate with our board of directors,
these provisions apply even if the offer may be considered
beneficial by some stockholders. Further, these provisions may
discourage potential acquisition proposals and may delay, deter
or prevent a change of control of our company, including through
unsolicited transactions that some or all of our stockholders
might consider to be desirable. As a result, efforts by our
stockholders to change our direction or our management may be
unsuccessful.
44
FORWARD-LOOKING
STATEMENTS
Certain matters contained in this prospectus include
forward-looking statements that are subject to a number of risks
and uncertainties, many of which are beyond our control. These
forward-looking statements relate to anticipated financial
performance, management’s plans and objectives for future
operations, business prospects, outcome of regulatory
proceedings, market conditions and other matters.
All statements, other than statements of historical facts,
included in this prospectus that address activities, events or
developments that we expect, believe or anticipate will exist or
may occur in the future, are
forward-looking
statements. In some cases, forward-looking statements can be
identified by various forms of words such as
“anticipates,” “believes,”
“seeks,” “could,” “may,”
“should,” “continues,”
“estimates,” “expects,”
“forecasts,” “intends,” “might,”
“goals,” “objectives,” “targets,”
“planned,” “potential,”
“projects,” “scheduled,” “will” or
other similar expressions. These forward-looking statements are
based on management’s beliefs and assumptions and on
information currently available to management and include, among
others, statements regarding:
|
|
|
| |
•
|
Amounts and nature of future capital expenditures;
|
| |
| |
•
|
Expansion and growth of our business and operations;
|
| |
| |
•
|
Financial condition and liquidity;
|
| |
| |
•
|
Business strategy;
|
| |
| |
•
|
Estimates of proved gas and oil reserves;
|
| |
| |
•
|
Reserve potential;
|
| |
| |
•
|
Development drilling potential;
|
| |
| |
•
|
Cash flow from operations or results of operations;
|
| |
| |
•
|
Seasonality of our business; and
|
| |
| |
•
|
Natural gas, crude oil and NGLs prices and demand.
|
Forward-looking statements are based on numerous assumptions,
uncertainties and risks that could cause future events or
results to be materially different from those stated or implied
in this prospectus. Many of the factors that will determine
these results are beyond our ability to control or predict.
Specific factors that could cause actual results to differ from
results contemplated by the forward-looking statements include,
among others, the following:
|
|
|
| |
•
|
Availability of supplies (including the uncertainties inherent
in assessing, estimating, acquiring and developing future
natural gas and oil reserves), market demand, volatility of
prices and the availability and cost of capital;
|
| |
| |
•
|
Inflation, interest rates, fluctuation in foreign exchange and
general economic conditions (including future disruptions and
volatility in the global credit markets and the impact of these
events on our customers and suppliers);
|
| |
| |
•
|
The strength and financial resources of our competitors;
|
| |
| |
•
|
Development of alternative energy sources;
|
| |
| |
•
|
The impact of operational and development hazards;
|
| |
| |
•
|
Costs of, changes in, or the results of laws, government
regulations (including climate change legislation
and/or
potential additional regulation of drilling and completion of
wells), environmental liabilities, litigation and rate
proceedings;
|
| |
| |
•
|
Changes in maintenance and construction costs;
|
| |
| |
•
|
Changes in the current geopolitical situation;
|
45
|
|
|
| |
•
|
Our exposure to the credit risk of our customers;
|
| |
| |
•
|
Risks related to strategy and financing, including restrictions
stemming from our debt agreements, future changes in our credit
ratings and the availability and cost of credit;
|
| |
| |
•
|
Risks associated with future weather conditions;
|
| |
| |
•
|
Acts of terrorism; and
|
| |
| |
•
|
Other factors described in “Management’s Discussion
and Analysis of Financial Condition and Results of
Operations” and “Business.”
|
All forward-looking statements attributable to us or persons
acting on our behalf are expressly qualified in their entirety
by the cautionary statements set forth above. Given the
uncertainties and risk factors that could cause our actual
results to differ materially from those contained in any
forward-looking statement, we caution investors not to unduly
rely on our forward-looking statements. Forward-looking
statements speak only as of the date they are made. We disclaim
any obligation to and do not intend to update the above list or
to announce publicly the result of any revisions to any of the
forward-looking statements to reflect future events or
developments, except to the extent required by applicable laws.
If we update one or more forward-looking statements, no
inference should be drawn that we will make additional updates
with respect to those or other forward-looking statements.
In addition to causing our actual results to differ, the factors
listed above and referred to below may cause our intentions to
change from those statements of intention set forth in this
prospectus. Such changes in our intentions may also cause our
results to differ. We may change our intentions, at any time and
without notice, based upon changes in such factors, our
assumptions, or otherwise.
Because forward-looking statements involve risks and
uncertainties, we caution that there are important factors, in
addition to those listed above, that may cause actual results to
differ materially from those contained in the forward-looking
statements. These factors are described in “Risk
Factors.”
46
USE OF
PROCEEDS
We estimate that our net proceeds from the sale of shares of
Class A common stock in this offering, after deducting
estimated underwriting discounts and commissions and estimated
offering expenses, will be approximately
$ million
($ million if the
underwriters exercise their option to purchase additional
Class A common shares in full), assuming the shares are
offered at $ per share of
Class A common stock, which is the midpoint of the
estimated offering price range set forth on the cover page of
this prospectus. We expect to retain approximately
$500 million of the net proceeds from this offering; the
remaining net proceeds will be distributed to Williams as part
of our restructuring transactions.
The approximately $500 million of retained net proceeds
will be available to us to fund capital spending and acquisition
and exploration opportunities, to provide additional liquidity
and for other general corporate purposes. At current commodity
prices, as much as 50 percent of the retained net proceeds
may be utilized for capital projects including drilling and
construction of facilities, with the remainder utilized to
provide additional liquidity and, if necessary, to fund
additional similar activities prior to issuing additional debt
securities or borrowing under our Credit Facility. Our ability
to access the capital markets could be constrained depending on
our credit rating, and we believe it is prudent to maintain
sufficient liquidity to fund our drilling plan under reduced
commodity prices.
Concurrently with or shortly following the completion of this
offering, we expect to issue up to $1.5 billion aggregate
principal amount of Notes in a private offering exempt from
registration under the Securities Act. The Notes will be offered
and sold solely to qualified institutional buyers pursuant to
Rule 144A and in offshore transactions to persons other
than U.S. persons as defined in Regulation S under the
Securities Act. As part of our restructuring transactions, all
of the net proceeds of the sale of the Notes will be distributed
to Williams. Our offering of Class A common stock is not
contingent upon the completion of our offering of the Notes.
Williams has informed us that it expects to use the net proceeds
distributed to it from this offering and the offering of the
Notes to repay a portion of its indebtedness.
47
DIVIDEND
POLICY
We do not anticipate paying any dividends on our common stock in
the foreseeable future. We currently intend to retain our future
earnings to support the growth and development of our business.
The payment of future cash dividends, if any, will be at the
discretion of our board of directors and will depend upon, among
other things, our financial condition, results of operations,
capital requirements and development expenditures, future
business prospects and any restrictions imposed by future debt
instruments.
48
CAPITALIZATION
The following table sets forth our cash and cash equivalents and
capitalization as of March 31, 2011 on an actual basis and
pro forma basis to give effect to:
|
|
|
| |
•
|
the completion of our restructuring transactions, including the
forgiveness or contribution to our capital of the unsecured
notes payable to Williams;
|
|
|
|
| |
•
|
the receipt of approximately $705 million from the sale of
shares of Class A common stock offered by us at an assumed
initial public offering price of $
per share, which is the midpoint of the estimated offering price
range set forth on the cover page of this prospectus, after
deducting estimated underwriting discounts and commissions and
estimated offering expenses payable by us; and
|
|
|
|
| |
•
|
the receipt of approximately $1.5 billion from our expected
offering of the Notes, after deducting the discounts of the
initial purchasers of the Notes and the expenses payable by us
in connection with such offering;
|
|
|
|
| |
•
|
the distribution of approximately $1.7 billion to Williams
from the combined net proceeds from this offering and the
expected offering of the Notes in connection with our
restructuring transactions.
|
You should read this table in conjunction with “Use of
Proceeds,” “Selected Historical Combined Financial
Data,” “Management’s Discussion and Analysis of
Financial Condition and Results of Operations” and our
historical and unaudited pro forma combined financial statements
and related notes included elsewhere in this prospectus.
| |
|
|
|
|
|
|
|
|
|
|
|
At March 31, 2011
|
|
|
|
|
Historical
|
|
|
Pro Forma
|
|
|
|
|
(Millions)
|
|
|
|
|
Cash and cash equivalents
|
|
$
|
40
|
|
|
|
540
|
|
|
Debt:
|
|
|
|
|
|
|
|
|
|
Senior unsecured credit facility(1)
|
|
|
—
|
|
|
|
—
|
|
|
Unsecured notes payable to Williams—current
|
|
|
2,364
|
|
|
|
—
|
|
|
Senior unsecured notes
|
|
|
—
|
|
|
|
1,500
|
|
|
|
|
|
|
|
|
|
|
|
|
Total debt
|
|
|
2,364
|
|
|
|
1,500
|
|
|
Equity:
|
|
|
|
|
|
|
|
|
|
Owner’s net investment
|
|
|
4,258
|
|
|
|
—
|
|
|
Class A common stock, $ par
value per
share, shares
authorized
and shares
outstanding
|
|
|
—
|
|
|
|
|
|
|
Class B common stock, $ par
value per
share, shares
authorized
and shares
outstanding
|
|
|
—
|
|
|
|
|
|
|
Additional paid-in capital
|
|
|
—
|
|
|
|
5,603
|
|
|
Noncontrolling interests
|
|
|
74
|
|
|
|
74
|
|
|
Accumulated other comprehensive income
|
|
|
108
|
|
|
|
108
|
|
|
|
|
|
|
|
|
|
|
|
|
Total equity
|
|
|
4,440
|
|
|
|
5,785
|
|
|
|
|
|
|
|
|
|
|
|
|
Total capitalization
|
|
$
|
6,804
|
|
|
|
7,285
|
|
|
|
|
|
|
|
|
|
|
|
|
|
|
|
(1) |
|
Our Credit Facility provides for borrowings of up to
$1.5 billion, all of which is expected to be available to
us upon the effectiveness of that facility. Our future borrowing
capacity may be reduced by letters of credit issued under the
Credit Facility. See “Description of our Concurrent
Financing Transactions—Credit Facility.” |
49
DILUTION
If you invest in our Class A common stock, your ownership
interest will be diluted to the extent of the difference between
the initial public offering price per share of our Class A
common stock and the net tangible book value per share of our
common stock upon the completion of this offering.
Our net tangible book value represents the amount of our total
tangible assets less total liabilities. As of March 31,
2011, after giving effect to our restructuring transactions, our
pro forma net tangible book value was approximately
$ million, or approximately
$ per share based
on shares
of our Class B common stock outstanding immediately prior
to the completion of this offering. After giving effect to the
sale of our shares of Class A common stock at the initial
public offering price per share, and after deducting estimated
underwriting discounts and commissions and estimated offering
expenses payable by us, our pro forma net tangible book value as
of March 31, 2011, which we refer to as our pro forma net
tangible book value, would have been approximately
$ million, or
$ per share of our common stock.
This represents an immediate dilution of
$ per share to new investors
purchasing shares of our Class A common stock in this
offering.
| |
|
|
|
|
|
|
|
|
|
Assumed initial public offering price per share
|
|
|
|
|
|
$
|
|
|
|
Pro forma net tangible book value per share as of March 31,
2011 after giving effect to our restructuring transactions but
before giving effect to this offering
|
|
$
|
|
|
|
|
|
|
|
Change in pro forma net tangible book value per share
attributable to new investors purchasing shares in this offering
|
|
$
|
|
|
|
|
|
|
|
|
|
|
|
|
|
|
|
|
|
Less: Pro forma net tangible book value per share after giving
effect to this offering
|
|
|
|
|
|
$
|
|
|
|
|
|
|
|
|
|
|
|
|
|
Dilution in pro forma net tangible book value per share to new
investors
|
|
|
|
|
|
$
|
|
|
|
|
|
|
|
|
|
|
|
|
The foregoing discussion does not give effect to shares of
Class A common stock that we will issue if the underwriters
exercise their option to purchase additional shares.
The following table summarizes the total number of shares of our
common stock on an aggregate basis acquired from us, the total
consideration and the average price per share. The calculations
regarding shares acquired by new investors in this offering
reflect an assumed initial public offering price of
$ per share, which is the midpoint
of the estimated offering price range set forth on the cover
page of this prospectus, and do not reflect the estimated
underwriting discount and offering expenses.
| |
|
|
|
|
|
|
|
|
|
|
|
|
|
|
|
|
|
|
|
|
|
|
|
|
|
|
|
|
|
|
|
|
|
Percentage
|
|
|
|
|
|
|
|
|
Average
|
|
|
|
|
Shares Acquired
|
|
|
of Voting
|
|
|
Total Consideration
|
|
|
Price Per
|
|
|
|
|
Number
|
|
|
Percent
|
|
|
Rights
|
|
|
Amount
|
|
|
Percent
|
|
|
Share
|
|
|
|
|
Williams
|
|
|
|
|
|
|
|
%
|
|
|
|
%
|
|
$
|
—
|
|
|
|
0
|
%
|
|
$
|
—
|
|
|
New investors in this offering
|
|
|
|
|
|
|
|
|
|
|
|
|
|
|
750
|
|
|
|
100
|
|
|
|
|
|
|
|
|
|
|
|
|
|
|
|
|
|
|
|
|
|
|
|
|
|
|
|
|
|
|
|
|
Total
|
|
|
|
|
|
|
100
|
%
|
|
|
100
|
%
|
|
$
|
750
|
|
|
|
100
|
%
|
|
$
|
|
|
|
|
|
|
|
|
|
|
|
|
|
|
|
|
|
|
|
|
|
|
|
|
|
|
|
|
If the underwriters exercise their option to purchase additional
Class A common shares in full, the following will occur:
|
|
|
| |
•
|
the number of shares of Class A common stock held by new
investors will increase
to ,
or approximately % of our total
outstanding common stock and
approximately % of the total voting
power of our common stock; and
|
|
|
|
| |
•
|
the number of shares of our Class B common stock held by
Williams will be reduced
to ,
or approximately % of our total
outstanding common stock and
approximately % of the total voting
power of our common stock.
|
50
SELECTED
HISTORICAL COMBINED FINANCIAL DATA
The following tables set forth our selected historical combined
financial data for the periods indicated below. The historical
unaudited combined financial data for the three months ended
March 31, 2011 and 2010 and balance sheet data as of
March 31, 2011 have been derived from our unaudited
condensed combined financial statements included in this
prospectus. The unaudited condensed combined financial
statements have been prepared on the same basis as our audited
combined financial statements, except as stated in the related
notes thereto, and include all normal recurring adjustments
that, in the opinion of management, are necessary to present
fairly our financial condition and result of operations for such
periods. The results of operations for the three months ended
March 31, 2011 presented below are not necessarily
indicative of results for the entire fiscal year. Our selected
historical combined financial data as of December 31, 2010
and 2009 and for the fiscal years ended December 31, 2010,
2009 and 2008 have been derived from our audited historical
combined financial statements included elsewhere in this
prospectus. Our selected historical combined financial data as
of December 31, 2008, 2007 and 2006 and for the years ended
December 31, 2007 and 2006 have been derived from our
unaudited accounting records not included in this prospectus.
The financial statements included in this prospectus may not
necessarily reflect our financial position, results of
operations and cash flows as if we had operated as a stand-alone
public company during all periods presented. Accordingly, our
historical results should not be relied upon as an indicator of
our future performance.
The following selected historical financial and operating data
should be read in conjunction with “Use of Proceeds,”
“Capitalization,” “Management’s Discussion
and Analysis of Financial Condition and Results of
Operations,” “Arrangements Between Williams and Our
Company” and our combined financial statements and related
notes included elsewhere in this prospectus.
| |
|
|
|
|
|
|
|
|
|
|
|
|
|
|
|
|
|
|
|
|
|
|
|
|
|
|
|
|
|
|
|
Three Months Ended March 31,
|
|
|
Year Ended December 31,
|
|
|
|
|
2011
|
|
|
2010
|
|
|
2010
|
|
|
2009
|
|
|
2008
|
|
|
2007
|
|
|
2006
|
|
|
|
|
(Millions)
|
|
|
|
|
Statement of operations data:
|
|
|
|
|
|
|
|
|
|
|
|
|
|
|
|
|
|
|
|
|
|
|
|
|
|
|
|
|
|
Revenues
|
|
$
|
984
|
|
|
$
|
1,164
|
|
|
$
|
4,034
|
|
|
$
|
3,681
|
|
|
$
|
6,184
|
|
|
$
|
4,479
|
|
|
$
|
4,627
|
|
|
Income (loss) from continuing operations(1)
|
|
|
7
|
|
|
|
83
|
|
|
|
(1,274
|
)
|
|
|
149
|
|
|
|
817
|
|
|
|
192
|
|
|
|
104
|
|
|
Income (loss) from discontinued operations(2)
|
|
|
(8
|
)
|
|
|
—
|
|
|
|
(8
|
)
|
|
|
(7
|
)
|
|
|
(87
|
)
|
|
|
146
|
|
|
|
6
|
|
|
|
|
|
|
|
|
|
|
|
|
|
|
|
|
|
|
|
|
|
|
|
|
|
|
|
|
|
|
|
|
Net income (loss)
|
|
|
(1
|
)
|
|
|
83
|
|
|
|
(1,282
|
)
|
|
|
142
|
|
|
|
730
|
|
|
|
338
|
|
|
|
110
|
|
|
Less: Net income attributable to noncontrolling interests
|
|
|
2
|
|
|
|
2
|
|
|
|
8
|
|
|
|
6
|
|
|
|
8
|
|
|
|
11
|
|
|
|
12
|
|
|
|
|
|
|
|
|
|
|
|
|
|
|
|
|
|
|
|
|
|
|
|
|
|
|
|
|
|
|
|
|
Net income (loss) attributable to WPX Energy
|
|
$
|
(3
|
)
|
|
$
|
81
|
|
|
$
|
(1,290
|
)
|
|
$
|
136
|
|
|
$
|
722
|
|
|
$
|
327
|
|
|
$
|
98
|
|
|
|
|
|
|
|
|
|
|
|
|
|
|
|
|
|
|
|
|
|
|
|
|
|
|
|
|
|
|
|
| |
|
|
|
|
|
|
|
|
|
|
|
|
|
|
|
|
|
|
|
|
|
|
|
|
|
|
|
As of
|
|
|
|
|
|
|
|
|
|
|
|
|
|
|
|
|
|
|
|
March 31,
|
|
|
As of December 31,
|
|
|
|
|
2011
|
|
|
2010
|
|
|
2009
|
|
|
2008
|
|
|
2007
|
|
|
2006
|
|
|
|
|
Balance sheet data
|
|
|
|
|
|
|
|
|
|
|
|
|
|
|
|
|
|
|
|
|
|
|
|
|
|
Notes payable to Williams — current
|
|
$
|
2,364
|
|
|
$
|
2,261
|
|
|
$
|
1,216
|
|
|
$
|
925
|
|
|
$
|
656
|
|
|
$
|
—
|
|
|
Notes receivable from Williams
|
|
|
—
|
|
|
|
—
|
|
|
|
—
|
|
|
|
—
|
|
|
|
—
|
|
|
|
64
|
|
|
Third party debt
|
|
|
—
|
|
|
|
—
|
|
|
|
—
|
|
|
|
|
|
|
|
|
|
|
|
34
|
|
|
Total assets
|
|
|
9,764
|
|
|
|
9,846
|
|
|
|
10,553
|
|
|
|
11,624
|
|
|
|
10,571
|
|
|
|
11,223
|
|
|
Total equity
|
|
|
4,440
|
|
|
|
4,500
|
|
|
|
5,405
|
|
|
|
5,506
|
|
|
|
4,356
|
|
|
|
4,376
|
|
|
|
|
|
(1) |
|
Loss from continuing operations in 2010 includes
$1.7 billion of impairment charges related to goodwill,
producing properties in the Barnett Shale and costs of acquired
unproved reserves in the Piceance Basin. Income from continuing
operations in 2008 includes a $148 million gain related to
the sale of a right to an international production payment. See
Notes 6 and 14 of Notes to Combined Financial Statements
for further discussion of asset sales, impairments and other
accruals in 2010, 2009 and 2008. |
|
|
|
|
(2) |
|
Income (loss) from discontinued operations includes our Arkoma
operations which were classified as held for sale as of
March 31, 2011 and Williams’ former power business
that was substantially disposed of in 2007. The activity in 2010
and 2009 primarily relates to the Arkoma operations and the
remaining indemnity and |
51
|
|
|
|
|
|
other obligations related to the former power business.
Activity in 2008 reflects a $148 million pre-tax impairment
charge related to the producing properties in the Arkoma Basin.
Activity in 2007 and 2006 primarily reflects the operations of
the power business and 2007 includes a pre-tax gain of
$429 million associated with the reclassification of
deferred net hedge gains from accumulated other comprehensive
income (loss) to earnings based on the determination that the
hedged forecasted transactions were probable of not occurring
due to the sale of Williams’ power business. This gain is
partially offset by a pre-tax unrealized
mark-to-market
loss of $23 million, a $37 million loss from
operations and $111 million of pre-tax impairments
primarily related to the carrying value of certain derivative
contracts. |
52
MANAGEMENT’S
DISCUSSION AND ANALYSIS OF FINANCIAL CONDITION AND RESULTS OF
OPERATIONS
We are currently a wholly owned subsidiary of The Williams
Companies, Inc. and were formed in April 2011 to hold the
exploration and production businesses of Williams. We will have
no material assets or liabilities as a separate corporate entity
until the contribution to us by Williams of the businesses
described in this prospectus. Williams conducts our businesses
through various subsidiaries. This prospectus, including the
combined financial statements and the following discussion,
describes us and our financial condition and operations as if we
had held the subsidiaries that will be transferred to us prior
to completion of this offering for all historical periods
presented. The following discussion should be read in
conjunction with the selected historical combined financial data
and the combined financial statements and the related notes
included elsewhere in this prospectus. The matters discussed
below may contain forward-looking statements that reflect our
plans, estimates and beliefs. Our actual results could differ
materially from those discussed in these forward-looking
statements. Factors that could cause or contribute to these
differences include, but are not limited to, those discussed
below and elsewhere in this prospectus, particularly in
“Risk Factors” and “Forward-Looking
Statements.”
We are an independent natural gas and oil exploration and
production company engaged in the exploitation and development
of long-life unconventional properties. We are focused on
profitably exploiting our significant natural gas reserve base
and related NGLs in the Piceance Basin of the Rocky Mountain
region, and on developing and growing our position in the Bakken
Shale oil play in North Dakota and our Marcellus Shale natural
gas position in Pennsylvania. Our other areas of domestic
operations include the Powder River Basin in Wyoming and the
San Juan Basin in the southwestern United States. In
addition, we own a 69 percent controlling ownership
interest in Apco, which holds oil and gas concessions in
Argentina and Colombia and trades on the NASDAQ Capital Market
under the symbol “APAGF.”
In addition to our exploration and development activities, we
engage in natural gas sales and marketing. Our sales and
marketing activities to date include the sale of our natural gas
and oil production, in addition to third party purchases and
sales of natural gas, including sales to Williams Partners L.P.
(NYSE: “WPZ”) (“Williams Partners”) for use
in its midstream business. Following the completion of the
spin-off of our stock to Williams’ stockholders, we do not
expect to continue to provide these services to Williams
Partners on a long-term basis. Our sales and marketing
activities currently include the management of various natural
gas related contracts such as transportation, storage and
related hedges. We also sell natural gas purchased from working
interest owners in operated wells and other area third party
producers. We primarily engage in these activities to enhance
the value received from the sale of our natural gas and oil
production. Revenues associated with the sale of our production
are recorded in oil and gas revenues. The revenues and expenses
related to other marketing activities are reported on a gross
basis as part of gas management revenues and costs and expenses.
Basis of
Presentation
The combined financial statements included elsewhere in this
prospectus have been derived from the accounting records of
Williams, principally representing the Exploration &
Production segment. We have used the historical results of
operations, and historical basis of assets and liabilities of
the subsidiaries we will own and operate after the consummation
of this offering, to prepare the combined financial statements.
The following discussion and analysis of results of operations,
financial condition and liquidity and critical accounting
estimates relates to our current continuing operations and
should be read in conjunction with the combined financial
statements and notes thereto included in this prospectus.
During the first quarter 2011, we initiated a formal process to
pursue the divestiture of our holdings in the Arkoma Basin and
recorded a pretax impairment charge of $11 million based on
an estimated fair value less cost to sell. Our daily Arkoma
Basin production is approximately 10 MMcfd, or less than
one percent of our total production. As we obtained the
requisite approval for disposal and met the other criteria
necessary for considering these assets as held for sale and the
related operations as discontinued, in the first
quarter 2011,
53
we have reported our Arkoma operations, including any
impairment charges, as discontinued operations for all periods
presented. Unless otherwise noted, the following discussions
relates to our continuing operations.
The Combined Statements of Operations included elsewhere in this
prospectus includes allocations of costs for corporate functions
historically provided to us by Williams. These allocations
include the following costs:
Corporate Services. Represents costs for
certain employees of Williams who provide general and
administrative services on our behalf. These charges are either
directly identifiable or allocated based upon usage factors for
our operations. In addition, we receive other allocated costs
for our share of general corporate expenses of Williams, which
are determined based on our relative use of the service or on a
three-factor formula, which considers revenue, properties and
equipment and payroll. All of these costs are reflected in
general and administrative expense in the Combined Statement of
Operations.
Employee Benefits and Incentives. Represents
benefit costs and other incentives, including group health and
welfare benefits, pension plans, postretirement benefit plans
and employee stock-based compensation plans. Costs associated
with incentive and stock-based compensation plans are determined
on a specific identification basis for certain direct employees.
All other employee benefit costs have historically been
allocated using a percentage factor derived from a ratio of
benefit costs to salary costs for Williams’ domestic
employees. These costs are included in lease and facility
operating expenses and general and administrative expenses in
the Combined Statement of Operations.
Subsequent to the completion of this offering, we will be
charged for costs related to these corporate services and
employee benefits and incentives under an administrative
services agreement using methodologies that are consistent with
these historic accounting practices.
Interest Expense. Williams utilizes a
centralized approach to cash management and the financing of its
businesses. Cash receipts and cash expenditures for costs and
expenses from our domestic operations are transferred to or from
Williams on a regular basis and recorded as increases or
decreases in the balance due under unsecured promissory notes we
have in place with Williams. The notes bear interest based on
Williams’ weighted average cost of debt and such interest
is added monthly to the note principal. Prior to or concurrent
with the contribution to us by Williams of the businesses
described in this prospectus, Williams will forgive or
contribute to our capital any amounts due to it under these
notes. Subsequent to the completion of this offering, we will
maintain separate cash accounts from Williams and our interest
expense will relate only to our borrowings (which will consist
of the Notes and any amounts drawn under our Credit Facility).
Our management believes the assumptions and methodologies
underlying the allocation of expenses from Williams are
reasonable. However, such expenses may not be indicative of the
actual level of expense that would have been or will be incurred
by us if we were to operate as an independent, publicly traded
company. We will enter into an administrative services agreement
and a transition services agreement with Williams that will
provide for continuation for some of these services in exchange
for fees specified in these agreements. See “Arrangements
Between Williams and Our Company.”
We believe the assumptions underlying the combined financial
statements are reasonable. However, the combined financial
statements may not necessarily reflect our future results of
operations, financial position and cash flows or what these
items would have been had we been a stand-alone company during
the periods presented.
Overview
of the three months ended March 31, 2011 and 2010
Domestic production revenues for the first three months of 2011
were lower than the first three months of 2010, primarily
because of lower realized average prices on our natural gas
production, partially offset by higher production volumes. The
decrease in realized prices coupled with the increase in
gathering, processing and transportation expenses due to fees as
a result of a new long-term agreement following our fourth
quarter 2010 sale of certain gathering and processing assets in
the Piceance Basin were the significant drivers of the
54
decrease in operating income. Highlights of the comparative
periods, primarily related to our production activities, include:
| |
|
|
|
|
|
|
|
|
|
|
|
|
|
|
|
For the Three Months Ended March 31,
|
|
|
|
|
2011
|
|
|
2010
|
|
|
% Change
|
|
|
|
|
Average daily domestic production (MMcfe/d)
|
|
|
1,155
|
|
|
|
1,091
|
|
|
|
+6
|
%
|
|
Average daily total production (MMcfe/d)
|
|
|
1,210
|
|
|
|
1,145
|
|
|
|
+6
|
%
|
|
Domestic production realized average price ($/Mcfe)(1)
|
|
$
|
5.28
|
|
|
$
|
5.77
|
|
|
|
-8
|
%
|
|
Capital expenditures and acquisitions ($ millions)
|
|
$
|
319
|
|
|
$
|
284
|
|
|
|
12
|
%
|
|
Domestic oil and gas revenues ($ millions)
|
|
$
|
549
|
|
|
$
|
567
|
|
|
|
(3
|
)%
|
|
Revenues ($ millions)
|
|
$
|
984
|
|
|
$
|
1,164
|
|
|
|
(15
|
)%
|
|
Operating income ($ millions)
|
|
$
|
49
|
|
|
$
|
143
|
|
|
|
(66
|
)%
|
|
|
|
|
(1) |
|
Realized average prices include market prices, net of fuel and
shrink and hedge gains and losses. The realized hedge gain per
Mcfe was $0.73 and $0.29 for the first three months of 2011 and
2010, respectively. |
Overview
of 2010
The effects of the severe economic recession during late 2008
and 2009 eased during 2010. Crude oil and NGL prices have
returned to attractive levels, but natural gas prices have
remained low. Forward natural gas prices declined during 2010,
primarily as a result of significant increases in near- and
long-term supplies, which have outpaced near-term demand growth.
The decline in forward natural gas prices contributed
significantly to impairments we recorded in 2010.
In December 2010, we acquired a company that held approximately
85,800 net acres in North Dakota’s Bakken Shale oil
play for cash consideration of approximately $949 million.
This acquisition diversified our interests into light, sweet
crude oil production.
In July 2010, we acquired additional leasehold acreage positions
in the Marcellus Shale and a five percent overriding royalty
interest associated with these acreage positions for cash
consideration of $599 million. These acquisitions nearly
doubled our net acreage holdings in the Marcellus Shale. During
2010, we also invested a total of $164 million to acquire
additional unproved leasehold acreage positions in the Marcellus
Shale.
In November 2010, we completed the sale of certain gathering and
processing assets in the Piceance Basin to Williams Partners for
consideration of $702 million in cash and approximately
1.8 million Williams Partners common units. Because the
Williams Partners common units received by us in this
transaction were intended to be (and have since been)
distributed through a dividend to Williams, these units have
been presented net within equity. In conjunction with this sale,
we entered into a gathering and processing agreement with
Williams Partners. Prior periods reflect our gathering and
processing costs at an internal
cost-of-service
rate. Our gathering, processing and transportation costs
increased as a result of our new agreement with Williams
Partners.
Our 2010 operating income (loss) changed unfavorably by
$1.7 billion compared to 2009. Operating income (loss) for
2010 includes a $1 billion full impairment charge related
to goodwill and $678 million of pre-tax charges associated
with impairments of certain producing properties and costs of
acquired unproved reserves, while 2009 included an expense of
$32 million associated with contractual penalties from the
early termination of drilling rig contracts. Partially
offsetting these costs is the impact of an improved energy
55
commodity price environment in 2010 compared to 2009. Highlights
of the comparative periods, primarily related to our production
activities, include:
| |
|
|
|
|
|
|
|
|
|
|
|
|
|
|
|
Years Ended December 31,
|
|
|
|
|
2010
|
|
|
2009
|
|
|
% Change
|
|
|
|
|
Average daily domestic production
(MMcfe/d)
|
|
|
1,121
|
|
|
|
1,170
|
|
|
|
(4)
|
%
|
|
Average daily total production
(MMcfe/d)
|
|
|
1,174
|
|
|
|
1,224
|
|
|
|
(4)
|
%
|
|
Domestic production realized average price ($/Mcfe)(1)
|
|
$
|
5.22
|
|
|
$
|
4.89
|
|
|
|
7
|
%
|
|
Capital expenditures and acquisitions ($ millions)
|
|
$
|
2,805
|
|
|
$
|
1,434
|
|
|
|
96
|
%
|
|
Domestic oil and gas revenues ($ millions)
|
|
$
|
2,136
|
|
|
$
|
2,090
|
|
|
|
2
|
%
|
|
Revenues ($ millions)
|
|
$
|
4,034
|
|
|
$
|
3,681
|
|
|
|
10
|
%
|
|
Operating income (loss) ($ millions)
|
|
$
|
(1,337
|
)
|
|
$
|
317
|
|
|
|
NM
|
|
|
|
|
|
(1) |
|
Realized average prices include market prices, net of fuel and
shrink and hedge gains and losses. The realized hedge gain per
Mcfe was $0.81 and $1.44 for 2010 and 2009, respectively. |
NM: A percentage calculation is not meaningful due to a change
in signs.
As a result of significant declines in forward natural gas
prices during third quarter 2010, we performed an interim
assessment of our capitalized costs related to property and
goodwill. As a result of these assessments, we recorded a
$503 million impairment charge related to the capitalized
costs of our Barnett Shale properties and a $175 million
impairment charge related to capitalized costs of acquired
unproved reserves in the Piceance Highlands, which were acquired
in 2008. Additionally, we fully impaired our goodwill in the
amount of $1 billion. These impairments were based on our
assessment of estimated future discounted cash flows and other
information. See Notes 6 and 14 of Notes to Combined
Financial Statements for a further discussion of the impairments.
Outlook
for 2011
We believe we are well positioned to execute our business
strategy of finding and developing reserves and producing
natural gas and oil at costs that will generate an attractive
rate of return on our incremental development investments.
Economic and commodity price indicators for 2011 and beyond
reflect improvement in the macroeconomic environment. However,
given the potential volatility of these measures, it is possible
that commodity prices could decline, negatively impacting future
operating results and increasing the risk of nonperformance of
counterparties or impairments of long-lived assets.
We believe that our portfolio of reserves provides an
opportunity to continue to grow in our strategic areas,
including the Piceance Basin, the Marcellus Shale and the Bakken
Shale. We are also focused on developing a more balanced
portfolio that may include a larger portion of oil and NGLs
reserves and production than we have historically maintained,
which we believe will generate long-term, sustainable value for
shareholders. Currently, we expect 2011 capital expenditures of
approximately $1.3 to $1.6 billion.
We continue to operate with a focus on increasing shareholder
value and investing in our businesses in a way that enhances our
competitive position by:
|
|
|
| |
•
|
Continuing to invest in and grow our production and reserves;
|
| |
| |
•
|
Retaining the flexibility to make adjustments to our planned
levels of capital and investment expenditures in response to
changes in economic conditions or business opportunities;
|
| |
| |
•
|
Continuing to diversify our commodity portfolio through the
development of our Bakken Shale oil play position and
liquids-rich basins with high concentrations of NGLs;
|
| |
| |
•
|
Maintaining our industry leadership position in relationship to
costs; and
|
| |
| |
•
|
Continuing to maintain an active hedging program around our
commodity price risks.
|
56
Potential risks or obstacles that could impact the execution of
our plan include:
|
|
|
| |
•
|
Lower than anticipated energy commodity prices;
|
| |
| |
•
|
Lower than expected levels of cash flow from operations;
|
| |
| |
•
|
Unavailability of capital;
|
|
|
|
| |
•
|
Higher capital costs of developing unconventional shale
properties;
|
|
|
|
| |
•
|
Counterparty credit and performance risk;
|
| |
| |
•
|
Decreased drilling success;
|
| |
| |
•
|
General economic, financial markets or industry downturn;
|
| |
| |
•
|
Changes in the political and regulatory environments; and
|
| |
| |
•
|
Increase in the cost of, or shortages or delays in the
availability of, drilling rigs and equipment, supplies, skilled
labor or transportation.
|
We continue to address certain of these risks through
utilization of commodity hedging strategies, disciplined
investment strategies and maintaining adequate liquidity. In
addition, we utilize master netting agreements and collateral
requirements with our counterparties to reduce credit risk and
liquidity requirements.
Commodity
Price Risk Management
To manage the commodity price risk and volatility of owning
producing gas and oil properties, we enter into derivative
contracts for a portion of our future production. For the
remainder of 2011, we have the following contracts for our daily
domestic production, shown at weighted average volumes and
basin-level weighted average prices:
| |
|
|
|
|
|
|
|
|
|
2011 Natural Gas
|
|
|
|
|
|
|
Weighted Average
|
|
|
|
|
|
|
Price ($/MMBtu)
|
|
|
|
Volume
|
|
|
Floor-Ceiling
|
|
|
|
(BBtu/d)
|
|
|
for Collars
|
|
|
|
Collar agreements — Rockies
|
|
|
45
|
|
|
$5.30 - $7.10
|
|
Collar agreements — San Juan
|
|
|
90
|
|
|
$5.27 - $7.06
|
|
Collar agreements — Mid-Continent
|
|
|
80
|
|
|
$5.10 - $7.00
|
|
Collar agreements — Southern California
|
|
|
30
|
|
|
$5.83 - $7.56
|
|
Collar agreements — Appalachia
|
|
|
30
|
|
|
$6.50 - $8.14
|
|
Fixed price at basin swaps
|
|
|
375
|
|
|
$5.19
|
| |
|
|
|
|
|
|
|
|
|
|
|
2011 Crude Oil
|
|
|
|
|
Volume
|
|
|
Weighted Average
|
|
|
|
|
(Bbls/d)
|
|
|
Price ($/Bbl)
|
|
|
|
|
WTI Crude Oil fixed-price
|
|
|
3,917
|
|
|
$
|
96.01
|
|
57
The following is a summary of our derivative contracts for daily
domestic production shown at weighted average volumes and
basin-level weighted average prices for the three months ended
March 31, 2011 and 2010:
| |
|
|
|
|
|
|
|
|
|
|
|
|
|
|
|
Natural Gas
|
|
|
|
Three Months Ended March 31,
|
|
|
|
2011
|
|
2010
|
|
|
|
|
|
|
Weighted
|
|
|
|
|
Weighted
|
|
|
|
|
|
|
Average Price
|
|
|
|
|
Average Price
|
|
|
|
|
|
|
($/MMBtu)
|
|
|
|
|
($/MMBtu)
|
|
|
|
Volume
|
|
|
Floor-Ceiling
|
|
Volume
|
|
|
Floor-Ceiling
|
|
|
|
(BBtu/d)
|
|
|
for Collars
|
|
(BBtu/d)
|
|
|
for Collars
|
|
|
|
Collar agreements — Rockies
|
|
|
45
|
|
|
$5.30 - $7.10
|
|
|
100
|
|
|
$6.53 -$8.94
|
|
Collar agreements — San Juan
|
|
|
90
|
|
|
$5.27 - $7.06
|
|
|
240
|
|
|
$5.72 - $7.77
|
|
Collar agreements — Mid-Continent
|
|
|
80
|
|
|
$5.10 - $7.00
|
|
|
105
|
|
|
$5.37 - $7.41
|
|
Collar agreements — Southern California
|
|
|
30
|
|
|
$5.83 - $7.56
|
|
|
45
|
|
|
$4.80 - $6.43
|
|
Collar agreements — Appalachia
|
|
|
30
|
|
|
$6.50 - $8.14
|
|
|
20
|
|
|
$5.54 - $6.81
|
|
NYMEX and basis fixed-price swaps
|
|
|
344
|
|
|
$5.24
|
|
|
120
|
|
|
$4.42
|
| |
|
|
|
|
|
|
|
|
|
|
|
|
|
|
|
|
|
|
|
Crude Oil
|
|
|
|
|
Three Months Ended March 31,
|
|
|
|
|
2011
|
|
|
2010
|
|
|
|
|
|
|
|
Weighted
|
|
|
|
|
|
Weighted
|
|
|
|
|
Volume
|
|
|
Average Price
|
|
|
Volume
|
|
|
Average Price
|
|
|
|
|
(Bbls/d)
|
|
|
($/Bbl)
|
|
|
(Bbls/d)
|
|
|
($/Bbl)
|
|
|
|
|
WTI Crude Oil fixed-price
|
|
|
1,475
|
|
|
|
94.84
|
|
|
|
—
|
|
|
|
—
|
|
The following is a summary of our agreements and contracts for
daily domestic production shown at weighted average volumes and
basin-level weighted average prices for the years ended
December 31, 2010, 2009 and 2008:
| |
|
|
|
|
|
|
|
|
|
|
|
|
|
|
|
|
|
|
|
|
|
2010
|
|
2009
|
|
2008
|
|
|
|
|
|
|
Weighted Average
|
|
|
|
|
Weighted Average
|
|
|
|
|
Weighted Average
|
|
|
|
|
|
|
Price ($/MMBtu)
|
|
|
|
|
Price ($/MMBtu)
|
|
|
|
|
Price ($/MMBtu)
|
|
|
|
Volume
|
|
|
Floor-Ceiling
|
|
Volume
|
|
|
Floor-Ceiling
|
|
Volume
|
|
|
Floor-Ceiling
|
|
|
|
(BBtu/d)
|
|
|
for Collars
|
|
(BBtu/d)
|
|
|
for Collars
|
|
(BBtu/d)
|
|
|
for Collars
|
|
|
|
Collar agreements — Rockies
|
|
|
100
|
|
|
$6.53 - $8.94
|
|
|
150
|
|
|
$6.11 - $9.04
|
|
|
170
|
|
|
$6.16 - $9.14
|
|
Collar agreements — San Juan
|
|
|
233
|
|
|
$5.75 - $7.82
|
|
|
245
|
|
|
$6.58 - $9.62
|
|
|
202
|
|
|
$6.35 - $8.96
|
|
Collar agreements — Mid-Continent
|
|
|
105
|
|
|
$5.37 - $7.41
|
|
|
95
|
|
|
$7.08 - $9.73
|
|
|
63
|
|
|
$7.02 - $9.72
|
|
Collar agreements — Southern California
|
|
|
45
|
|
|
$4.80 -$6.43
|
|
|
—
|
|
|
—
|
|
|
—
|
|
|
—
|
|
Collar agreements — Other
|
|
|
28
|
|
|
$5.63 - $6.87
|
|
|
—
|
|
|
—
|
|
|
—
|
|
|
—
|
|
NYMEX and basis fixed-price swaps
|
|
|
120
|
|
|
$4.40
|
|
|
106
|
|
|
$3.67
|
|
|
70
|
|
|
$3.97
|
Additionally, we utilize contracted pipeline capacity to move
our production from the Rockies to other locations when pricing
differentials are favorable to Rockies pricing. We hold a
long-term obligation to deliver on a firm basis
200,000 MMbtu/d of natural gas at monthly index pricing to
a buyer at the White River Hub (Greasewood-Meeker, CO), which is
a major market hub exiting the Piceance Basin. Our interests in
the Piceance Basin hold sufficient reserves to meet this
obligation, which expires in 2014.
58
Results
of Operations
Three
Month-Over-Three
Month Results of Operations
The following table and discussion summarize our combined
results of operations for the three months ended March 31,
2011 and 2010.
| |
|
|
|
|
|
|
|
|
|
|
|
|
|
|
|
Historical
|
|
|
|
|
Three Months Ended
|
|
|
|
|
March 31,
|
|
|
|
|
2011
|
|
|
|
|
|
2010
|
|
|
|
|
(Millions)
|
|
|
|
|
|
|
|
% change
|
|
|
|
|
|
|
|
|
|
|
from 2010
|
|
|
|
|
|
|
|
Revenues:
|
|
|
|
|
|
|
|
|
|
|
|
|
|
Oil and gas sales, including affiliate
|
|
$
|
572
|
|
|
|
(3
|
)%
|
|
$
|
587
|
|
|
Gas management, including affiliate
|
|
|
408
|
|
|
|
(27
|
)%
|
|
|
556
|
|
|
Hedge ineffectiveness and
mark-to-market
gains
|
|
|
2
|
|
|
|
(78
|
)%
|
|
|
9
|
|
|
Other
|
|
|
2
|
|
|
|
(83
|
)%
|
|
|
12
|
|
|
|
|
|
|
|
|
|
|
|
|
|
|
|
|
Total revenues
|
|
$
|
984
|
|
|
|
|
|
|
$
|
1,164
|
|
|
|
|
|
|
|
|
|
|
|
|
|
|
|
|
Costs and expenses:
|
|
|
|
|
|
|
|
|
|
|
|
|
|
Lease and facility operating, including affiliate
|
|
|
70
|
|
|
|
6
|
%
|
|
|
66
|
|
|
Gathering, processing and transportation, including affiliate
|
|
|
115
|
|
|
|
60
|
%
|
|
|
72
|
|
|
Taxes other than income
|
|
|
31
|
|
|
|
(23
|
)%
|
|
|
40
|
|
|
Gas management (including charges for unutilized pipeline
capacity)
|
|
|
417
|
|
|
|
(25
|
)%
|
|
|
558
|
|
|
Exploration
|
|
|
13
|
|
|
|
63
|
%
|
|
|
8
|
|
|
Depreciation, depletion and amortization
|
|
|
216
|
|
|
|
—
|
|
|
|
216
|
|
|
General and administrative, including affiliate
|
|
|
70
|
|
|
|
15
|
%
|
|
|
61
|
|
|
Other — net
|
|
|
3
|
|
|
|
NM
|
|
|
|
—
|
|
|
|
|
|
|
|
|
|
|
|
|
|
|
|
|
Total costs and expenses
|
|
$
|
935
|
|
|
|
|
|
|
$
|
1,021
|
|
|
|
|
|
|
|
|
|
|
|
|
|
|
|
|
Operating income
|
|
$
|
49
|
|
|
|
|
|
|
$
|
143
|
|
|
|
|
|
|
|
|
|
|
|
|
|
|
|
|
Interest expense, including affiliate
|
|
|
(49
|
)
|
|
|
96
|
%
|
|
|
(25
|
)
|
|
Interest capitalized
|
|
|
4
|
|
|
|
—
|
|
|
|
4
|
|
|
Investment income and other
|
|
|
6
|
|
|
|
20
|
%
|
|
|
5
|
|
|
|
|
|
|
|
|
|
|
|
|
|
|
|
|
Income before income taxes
|
|
$
|
10
|
|
|
|
|
|
|
$
|
127
|
|
|
Provision (benefit) for income taxes
|
|
|
3
|
|
|
|
(93
|
)%
|
|
|
44
|
|
|
|
|
|
|
|
|
|
|
|
|
|
|
|
|
Income from continuing operations
|
|
$
|
7
|
|
|
|
|
|
|
$
|
83
|
|
|
Loss from discontinued operations
|
|
|
(8
|
)
|
|
|
NM
|
|
|
|
—
|
|
|
|
|
|
|
|
|
|
|
|
|
|
|
|
|
Net income (loss)
|
|
$
|
(1
|
)
|
|
|
|
|
|
$
|
83
|
|
|
Less: Net income attributable to noncontrolling interests
|
|
|
2
|
|
|
|
—
|
|
|
|
2
|
|
|
|
|
|
|
|
|
|
|
|
|
|
|
|
|
Net income (loss) attributable to WPX Energy
|
|
$
|
(3
|
)
|
|
|
|
|
|
$
|
81
|
|
|
|
|
|
|
|
|
|
|
|
|
|
|
|
NM: A percentage calculation is not meaningful due to a change
in signs, a zero-value denominator or a percentage change
greater than 200.
The $180 million decrease in total revenues is primarily
due to the following:
|
|
|
| |
•
|
$15 million lower oil and gas sales revenues, comprised of
a decrease of $50 million associated with an
eight percent decrease in realized average prices including
the effect of hedges, partially offset by an increase of
$33 million associated with a six percent increase in
production volumes sold. Oil and gas
|
59
|
|
|
| |
|
sales in 2011 and 2010 include approximately $97 million
and $70 million, respectively, related to natural gas
liquids and approximately $34 million and $11 million,
respectively, related to oil and condensate. The increase in NGL
revenues is primarily due to higher volumes in our Piceance
Basin related to Williams Partners’ Willow Creek facility.
The increase in crude and condensate is primarily related to our
Bakken properties which were acquired in the fourth quarter of
2010;
|
|
|
|
| |
•
|
$148 million decrease in gas management revenues primarily
due to a 19 percent decrease in average prices on physical
natural gas sales and 9 percent lower natural gas sales
volumes. We experienced a similar decrease of $141 million
in related costs and expenses; and
|
|
|
|
| |
•
|
$10 million decrease in other revenues primarily related to
gathering revenues associated with the gathering and processing
assets in Colorado’s Piceance Basin that we sold to
Williams Partners in the fourth quarter of 2010.
|
The $86 million decrease in costs and expenses is primarily
due to the following:
|
|
|
| |
•
|
$9 million lower taxes other than income, including
severance and ad valorem, primarily due to lower average
commodity prices (excluding the impact of hedges). Our domestic
production taxes averaged $0.27 per Mcfe in the first quarter of
2011 and $0.37 per Mcfe in the first quarter of 2010. The
decrease in the per unit amount is primarily the result of lower
average domestic commodity prices; and
|
|
|
|
| |
•
|
$141 million decrease in gas management expenses, primarily
due to an 18 percent decrease in average prices on physical
natural gas purchases and a nine percent decrease in
natural gas purchase volumes. These gas purchases were made in
connection with our gas purchase activities for Williams
Partners and certain working interest owners’ share of
production and to manage our transportation and storage
activities. The sales associated with our marketing of this gas
are included in gas management revenues. Also included in gas
management expenses are $10 million in the first quarter of
2011 and $13 million in the first quarter of 2010 for
unutilized pipeline capacity.
|
Partially offsetting the decreased costs are increases in costs
and expenses, primarily due to the following:
|
|
|
| |
•
|
$4 million higher lease and facility operating expenses
which reflects higher expenses associated with increased
workover, water management and maintenance activity, offset by
the absence in 2011 of $11 million in expenses associated
with the previously owned gathering and processing assets.
|
|
|
|
| |
•
|
$43 million higher gathering, processing, and
transportation expenses primarily as a result of fees charged in
2011 for gathering and processing associated with certain
gathering and processing assets in the Piceance Basin that we
sold to Williams Partners in the fourth quarter of 2010 and an
increase in natural gas liquids volumes processed at Williams
Partners’ Willow Creek plant. Our domestic gathering,
processing and transportation expenses averaged $1.11 per Mcfe
in the first quarter of 2011 and $0.73 per Mcfe in the first
quarter of 2010. The increase in the per unit amount is
primarily due to the gathering and processing fees charged on
the previously owned gathering and processing assets for which
operating costs of $21 million ($0.20/mcfe) were reflected in
other expense categories for the three months ended
March 31, 2010;
|
|
|
|
| |
•
|
$5 million higher exploration expenses primarily due to an
increase in impairment, amortization and expiration of unproved
leasehold costs; and
|
|
|
|
| |
•
|
$9 million higher general and administrative expenses
primarily due to higher wages, salary and benefits costs as a
result of an increase in the number of employees.
|
The $94 million decrease in operating income reflects the
$180 million decrease in revenues and the previously
discussed net changes in costs and expenses.
Interest expense increased primarily due to higher average
amount outstanding under our unsecured notes payable to Williams.
60
Provision (benefit) for income taxes changed favorably due to
the decrease in the pre-tax income. See Note 7 of the Notes
to Condensed Combined Financial Statements for a discussion of
the effective tax rates compared to the federal statutory rate
for both periods.
Year-Over-Year
Results of Operations
The following table and discussion summarize our combined
results of operations for the years ended December 31,
2010, 2009 and 2008.
| |
|
|
|
|
|
|
|
|
|
|
|
|
|
|
|
|
|
|
|
|
|
|
|
Historical
|
|
|
|
|
Year Ended December 31,
|
|
|
|
|
2010
|
|
|
|
|
|
2009
|
|
|
|
|
|
2008
|
|
|
|
|
(Millions)
|
|
|
|
|
|
|
|
% Change
|
|
|
|
|
|
% Change
|
|
|
|
|
|
|
|
|
|
|
from 2009
|
|
|
|
|
|
from 2008
|
|
|
|
|
|
|
|
Revenues:
|
|
|
|
|
|
|
|
|
|
|
|
|
|
|
|
|
|
|
|
|
|
Oil and gas sales, including affiliate
|
|
$
|
2,225
|
|
|
|
3
|
%
|
|
$
|
2,168
|
|
|
|
(25
|
%)
|
|
$
|
2,882
|
|
|
Gas management, including affiliate
|
|
|
1,742
|
|
|
|
20
|
%
|
|
|
1,456
|
|
|
|
(55
|
%)
|
|
|
3,241
|
|
|
Hedge ineffectiveness and
mark-to-market
gains and losses
|
|
|
27
|
|
|
|
50
|
%
|
|
|
18
|
|
|
|
(38
|
%)
|
|
|
29
|
|
|
Other
|
|
|
40
|
|
|
|
3
|
%
|
|
|
39
|
|
|
|
22
|
%
|
|
|
32
|
|
|
|
|
|
|
|
|
|
|
|
|
|
|
|
|
|
|
|
|
|
|
|
|
Total revenues
|
|
$
|
4,034
|
|
|
|
|
|
|
$
|
3,681
|
|
|
|
|
|
|
$
|
6,184
|
|
|
|
|
|
|
|
|
|
|
|
|
|
|
|
|
|
|
|
|
|
|
|
|
Costs and expenses:
|
|
|
|
|
|
|
|
|
|
|
|
|
|
|
|
|
|
|
|
|
|
Lease and facility operating, including affiliate
|
|
$
|
286
|
|
|
|
9
|
%
|
|
$
|
263
|
|
|
|
(3
|
%)
|
|
$
|
272
|
|
|
Gathering, processing and transportation, including affiliate
|
|
|
326
|
|
|
|
19
|
%
|
|
|
273
|
|
|
|
19
|
%
|
|
|
229
|
|
|
Taxes other than income
|
|
|
125
|
|
|
|
34
|
%
|
|
|
93
|
|
|
|
(63
|
%)
|
|
|
254
|
|
|
Gas management (including charges for unutilized pipeline
capacity)
|
|
|
1,771
|
|
|
|
18
|
%
|
|
|
1,495
|
|
|
|
(54
|
%)
|
|
|
3,248
|
|
|
Exploration
|
|
|
73
|
|
|
|
35
|
%
|
|
|
54
|
|
|
|
46
|
%
|
|
|
37
|
|
|
Depreciation, depletion and amortization
|
|
|
875
|
|
|
|
(1
|
%)
|
|
|
887
|
|
|
|
20
|
%
|
|
|
738
|
|
|
Impairment of producing properties and costs of acquired
unproved reserves
|
|
|
678
|
|
|
|
NM
|
|
|
|
15
|
|
|
|
NM
|
|
|
|
—
|
|
|
Goodwill impairment
|
|
|
1,003
|
|
|
|
NM
|
|
|
|
—
|
|
|
|
NM
|
|
|
|
—
|
|
|
General and administrative, including affiliate
|
|
|
253
|
|
|
|
1
|
%
|
|
|
251
|
|
|
|
2
|
%
|
|
|
247
|
|
|
Gain on sale of contractual right to international production
payment
|
|
|
—
|
|
|
|
NM
|
|
|
|
—
|
|
|
|
NM
|
|
|
|
(148
|
)
|
|
Other — net
|
|
|
(19
|
)
|
|
|
NM
|
|
|
|
33
|
|
|
|
NM
|
|
|
|
6
|
|
|
|
|
|
|
|
|
|
|
|
|
|
|
|
|
|
|
|
|
|
|
|
|
Total costs and expenses
|
|
$
|
5,371
|
|
|
|
|
|
|
$
|
3,364
|
|
|
|
|
|
|
$
|
4,883
|
|
|
|
|
|
|
|
|
|
|
|
|
|
|
|
|
|
|
|
|
|
|
|
|
Operating income (loss)
|
|
$
|
(1,337
|
)
|
|
|
|
|
|
$
|
317
|
|
|
|
|
|
|
$
|
1,301
|
|
|
Interest expense, including affiliate
|
|
|
(124
|
)
|
|
|
24
|
%
|
|
|
(100
|
)
|
|
|
35
|
%
|
|
|
(74
|
)
|
|
Interest capitalized
|
|
|
16
|
|
|
|
(11
|
%)
|
|
|
18
|
|
|
|
(10
|
%)
|
|
|
20
|
|
|
Investment income and other
|
|
|
21
|
|
|
|
163
|
%
|
|
|
8
|
|
|
|
(64
|
%)
|
|
|
22
|
|
|
|
|
|
|
|
|
|
|
|
|
|
|
|
|
|
|
|
|
|
|
|
|
Income (loss) before income taxes
|
|
$
|
(1,424
|
)
|
|
|
|
|
|
$
|
243
|
|
|
|
|
|
|
$
|
1,269
|
|
|
Provision (benefit) for income taxes
|
|
|
(150
|
)
|
|
|
NM
|
|
|
|
94
|
|
|
|
(79
|
%)
|
|
|
452
|
|
|
|
|
|
|
|
|
|
|
|
|
|
|
|
|
|
|
|
|
|
|
|
|
Income (loss) from continuing operations
|
|
$
|
(1,274
|
)
|
|
|
|
|
|
$
|
149
|
|
|
|
|
|
|
$
|
817
|
|
|
Loss from discontinued operations
|
|
|
(8
|
)
|
|
|
|
|
|
|
(7
|
)
|
|
|
|
|
|
|
(87
|
)
|
|
|
|
|
|
|
|
|
|
|
|
|
|
|
|
|
|
|
|
|
|
|
|
Net income (loss)
|
|
$
|
(1,282
|
)
|
|
|
|
|
|
$
|
142
|
|
|
|
|
|
|
$
|
730
|
|
|
Less: Net income attributable to noncontrolling interests
|
|
|
8
|
|
|
|
33
|
%
|
|
|
6
|
|
|
|
(25
|
%)
|
|
|
8
|
|
|
|
|
|
|
|
|
|
|
|
|
|
|
|
|
|
|
|
|
|
|
|
|
Net income (loss) attributable to WPX Energy
|
|
$
|
(1,290
|
)
|
|
|
|
|
|
$
|
136
|
|
|
|
|
|
|
$
|
722
|
|
|
|
|
|
|
|
|
|
|
|
|
|
|
|
|
|
|
|
|
|
|
|
NM: A percentage calculation is not meaningful due to a change
in signs, a zero-value denominator or a percentage change
greater than 200.
61
2010 vs.
2009
The increase in total revenues is primarily due to the following:
|
|
|
| |
•
|
$57 million higher oil and gas sales revenues from an
increase of $134 million resulting from a
seven percent increase in domestic realized average prices
including the effect of hedges, partially offset by a decrease
of $88 million associated with a four percent decrease in
domestic production volumes sold. Oil and gas revenues in 2010
and 2009 include approximately $282 million and
$136 million, respectively, related to NGLs and
approximately $57 million and $38 million,
respectively, related to condensate; and
|
|
|
|
| |
•
|
$286 million higher gas management revenues primarily from
a 21 percent increase in average prices on domestic
physical natural gas sales associated with our transportation
and storage contracts. There is a similar increase of
$276 million in related costs and expenses.
|
The increase in costs and expenses is primarily due to the
following:
|
|
|
| |
•
|
$23 million higher lease and facility operating expenses
due to increased activity and generally higher industry costs.
Our average domestic lease and facility operating expenses are
$0.65 per Mcfe in 2010 and $0.58 per Mcfe in 2009. The increase
in the per unit amount results primarily from an increase in
costs incurred to maintain individual well production rates and
higher industry costs;
|
|
|
|
| |
•
|
$53 million higher gathering, processing and transportation
expenses, primarily as a result of processing fees charged by
Williams Partners at its Willow Creek plant for extracting NGLs
from a portion of our Piceance Basin gas production. Our
domestic gathering, processing and transportation expenses
averaged $0.80 per Mcfe in 2010 and $0.64 per Mcfe in 2009. The
increase in the per unit amount is primarily a result of the
Willow Creek plant going into service in August 2009 resulting
in a partial year of processing. This processing provides us
additional NGL recovery, the revenues for which are included in
oil and gas sales in the Combined Statement of Operations;
|
|
|
|
| |
•
|
$32 million higher taxes other than income, including
severance and ad valorem, primarily due to higher average
commodity prices (excluding the impact of hedges). Our domestic
production taxes averaged $0.27 per Mcfe in 2010 and $0.19 per
Mcfe in 2009. The increase in the per unit amount is primarily
the result of higher average domestic commodity prices;
|
|
|
|
| |
•
|
$276 million increase in gas management expenses, primarily
due to a 18 percent increase in average prices on domestic
physical natural gas purchases. These gas purchases were made in
connection with our gas purchase activities for Williams
Partners and certain working interest owners’ share of
production, and to manage our transportation and storage
activities. The sales associated with our marketing of this gas
are included in gas management revenues. Also included in gas
management expenses are $48 million in 2010 and
$21 million in 2009 for unutilized pipeline capacity;
|
|
|
|
| |
•
|
$19 million higher exploration expense primarily due to an
increase in impairment, amortization and expiration of unproved
leasehold costs; and
|
|
|
|
| |
•
|
$1,681 million impairments of property and goodwill in 2010
as previously discussed. In 2009, $15 million of
impairments were recorded in the Barnett Shale.
|
Partially offsetting the increased costs and expenses in 2010
are decreases due to the following:
|
|
|
| |
•
|
$12 million lower depreciation, depletion and amortization
expenses primarily due to lower domestic production
volumes; and
|
|
|
|
| |
•
|
Other — net includes $32 million of expenses in
2009 related to penalties from the early release of drilling
rigs.
|
The $1,654 million decrease in operating income (loss) is
primarily due to the impairments, partially offset by a seven
percent increase in domestic realized average prices on
production and the other previously discussed changes in
revenues and costs and expenses.
62
Interest expense increased primarily due to higher average
amounts outstanding under our unsecured notes payable to
Williams.
Provision (benefit) for income taxes changed favorably due to
the pre-tax loss in 2010 compared to pre-tax income in 2009. See
Note 10 of Notes to Combined Financial Statements for a
reconciliation of the effective tax rates compared to the
federal statutory rate for both years.
2009 vs.
2008
The decrease in total revenues is primarily due to the following:
|
|
|
| |
•
|
$714 million lower oil and gas sales revenues primarily
from a $947 million decrease resulting from a
31 percent decrease in domestic realized average prices,
partially offset by an increase of $226 million associated
with an eight percent increase in domestic production volumes
sold. Oil and gas revenues in 2009 and 2008 include
approximately $136 million and $89 million,
respectively, related to NGLs and approximately $38 million
and $62 million, respectively, related to condensate. While
NGL volumes were significantly higher than the prior year, NGL
prices were significantly lower;
|
|
|
|
| |
•
|
$1,785 million lower gas management revenues primarily from
a 56 percent decrease in average prices on domestic
physical natural gas sales associated with our transportation
and storage contracts. There is a similar decrease of
$1,753 million in related costs and expenses; and
|
|
|
|
| |
•
|
$11 million lower hedge ineffectiveness and
mark-to-market
gains and losses primarily due to the absence of a
$10 million favorable impact in 2008 for the initial
consideration of our own nonperformance risk in estimating the
fair value of our derivative liabilities.
|
The decrease in total costs and expenses is primarily due to the
following:
|
|
|
| |
•
|
$161 million lower taxes other than income, including
severance and ad valorem, primarily due to 51 percent lower
average commodity prices (excluding the impact of hedges),
partially offset by higher production volumes sold. The lower
operating taxes include a net decrease of $39 million
reflecting a $34 million charge in 2008 and $5 million
of favorable revisions in 2009 relating to Wyoming severance and
ad valorem taxes. Our domestic production taxes averaged $0.19
per Mcfe in 2009 and $0.61 per Mcfe in 2008. The decrease in the
per unit amount is primarily the result of lower average
commodity prices;
|
|
|
|
| |
•
|
$1,753 million decrease in gas management expenses,
primarily due to a 55 percent decrease in domestic average
prices on physical natural gas purchases, slightly offset by a
2 percent increase in natural gas purchase volumes. This
decrease is primarily related to the natural gas purchases
associated with our previously discussed transportation and
storage contracts and is more than offset by a decrease in
revenues. Gas management expenses in 2009 and 2008 include
$21 million and $8 million, respectively, related to
charges for unutilized pipeline capacity. Gas management
expenses in 2009 and 2008 also include $7 million and
$35 million, respectively, related to lower of cost or
market charges to the carrying value of natural gas inventories
in storage; and
|
Partially offsetting the decreased costs and expenses are
increases due to the following:
|
|
|
| |
•
|
$44 million higher gathering, processing and transportation
expense primarily due to higher production volumes and the
processing fees for NGLs at Williams Partners’ Willow Creek
plant, which began processing in August 2009. Our domestic
gathering, processing and transportation expenses averaged $0.64
per Mcfe in 2009 and $0.58 per Mcfe in 2008. The increase in the
per unit amount is primarily a result of the initiation of
processing at the Willow Creek plant in 2009 as previously
discussed; and
|
|
|
|
| |
•
|
$17 million higher exploration expense primarily due to an
increase in geologic and geophysical services.
|
|
|
|
| |
•
|
$149 million higher depreciation, depletion and
amortization expense primarily due to higher capitalized
drilling costs from prior years and higher production volumes
compared to the prior year. Also, we recorded an additional
$17 million of depreciation, depletion and amortization in
the fourth
|
63
|
|
|
| |
|
quarter of 2009 primarily due to new SEC reserves reporting
rules. Our proved reserves decreased primarily due to the new
SEC reserves reporting rules and the related price impact;
|
|
|
|
| |
•
|
The absence in 2009 of a $148 million gain recorded in 2008
from the sale of our contractual right to a production payment
in Peru;
|
| |
| |
•
|
$32 million of expense in 2009 related to penalties from
the early release of drilling rigs as previously
discussed; and
|
| |
| |
•
|
$15 million of impairment expense in 2009 related to costs
of acquired unproved reserves from our 2008 acquisition in the
Barnett Shale. This impairment was based on our assessment of
estimated future discounted cash flows and additional
information obtained from drilling and other activities in 2009.
|
The $984 million decrease in operating income is primarily
due to the 31 percent decrease in realized average domestic
prices and the other previously discussed changes in revenues
and costs and expenses.
Provision (benefit) for income taxes changed favorably primarily
due to lower pre-tax income. See Note 10 of Notes to
Combined Financial Statements for a reconciliation of the
effective tax rates compared to the federal statutory rate for
both years.
Management’s
Discussion and Analysis of Financial Condition and
Liquidity
Overview
In 2010, we continued to focus upon growth through continued
disciplined investments in expanding our natural gas, oil and
NGL portfolio. Examples of this growth included continued
investment in our development drilling programs, as well as
acquisitions that expanded our presence in the Marcellus Shale
and provided our initial entry into the Bakken Shale areas.
These investments were funded through cash flow from operations,
advances on our notes payable from Williams and the proceeds
from the sale of our Piceance Basin gathering and processing
assets to Williams Partners.
Our historical liquidity needs have been managed through an
internal cash management program with Williams. Daily cash
activity from our domestic operations was transferred to or from
Williams on a regular basis and were recorded as increases or
decreases in the balance due under unsecured promissory notes we
have in place with Williams. In consideration of our liquidity
under these conditions, we note the following:
|
|
|
| |
•
|
As of March 31, 2011, Williams maintained liquidity through
cash, cash equivalents and available credit capacity under
credit facilities. Additionally, at that date we had an
unsecured credit agreement that served to reduce our margin
requirements related to our hedging activities. See additional
discussion in the following “—Liquidity” section.
|
|
|
|
| |
•
|
Our credit exposure to derivative counterparties is partially
mitigated by master netting agreements and collateral support.
|
| |
| |
•
|
Apco’s liquidity requirements have historically been
provided by its cash flows from operations.
|
Outlook
Upon completion of this offering, we expect our capital
structure will provide us financial flexibility to meet our
requirements for working capital, capital expenditures and tax
and debt payments while maintaining a sufficient level of
liquidity. We intend to retain approximately $500 million
of the net proceeds from this offering and to distribute the
remaining net proceeds, along with all of the net proceeds from
the offering of the Notes, to Williams. We also expect to have
access to our new unsecured $1.5 billion Credit Facility
that is expected to become effective at the time this offering
is complete. This Credit Facility combined with the
$500 million in cash described above and our expected cash
flows from operations should be sufficient to allow us to pursue
our business strategy and goals for 2011.
64
If energy commodity prices are lower than we expect for 2011, we
believe the effect on our cash flows from operations would be
partially mitigated by our hedging program. In addition, we note
the following assumptions for 2011:
|
|
|
| |
•
|
Our capital expenditures are estimated to be between
$1.3 billion and $1.6 billion, and are generally
considered to be largely discretionary; and
|
| |
| |
•
|
Apco’s liquidity requirements will continue to be provided
from its cash flows from operations and available liquidity
under its credit facility.
|
Potential risks associated with our planned levels of liquidity
and the planned capital and investment expenditures discussed
above include:
|
|
|
| |
•
|
Sustained reductions in energy commodity prices from the range
of current expectations;
|
| |
| |
•
|
Lower than expected levels of cash flow from operations; and
|
| |
| |
•
|
Higher than expected collateral obligations that may be
required, including those required under new commercial
agreements.
|
Liquidity
We plan to conservatively manage our balance sheet. Subsequent
to this offering, we expect to maintain liquidity through a
combination of cash on hand and available capacity under our
$1.5 billion Credit Facility. In addition, we expect our
forecasted levels of cash flow from operations to provide
additional liquidity to assist us in meeting our desired level
of capital expenditures and working capital requirements.
Additional sources of liquidity, if needed, could be sought
through bank financings, the issuance of long term debt and
equity securities and proceeds from asset sales.
Currently we utilize an unsecured credit arrangement in order to
reduce margin requirements related to our hedging activities as
well as lower transaction fees. We expect that this facility
will be terminated concurrently with the completion of this
offering and the expected issuance of our Notes and
effectiveness of our Credit Facility. Upon termination, we
expect we will be able to negotiate agreements with the
respective counterparties to our hedging contracts and keep
margin requirements, if any, to a minimum.
We have certain contractual obligations, primarily interstate
transportation agreements, which contain collateral support
requirements based on our credit ratings. Because Williams has
an investment grade credit rating and guaranteed these
contracts, we have not historically been required to provide
collateral support. After the completion of this offering,
Williams has informed us that it expects it will obtain releases
of the guarantees. Depending on our credit rating, we may be
required to issue letters of credit under our Credit Facility to
satisfy the provisions of these contracts.
Our ability to borrow money will be impacted by several factors,
including our credit ratings. Credit ratings agencies perform
independent analysis when assigning credit ratings. A lower than
anticipated initial credit rating or a downgrade of that rating
would increase our future cost of borrowing and could result in
a requirement that we post additional collateral with third
parties, thereby negatively affecting our available liquidity.
65
Sources
(Uses) of Cash
Three
Months-Over-Three
Months
The following table and discussion summarize our sources (uses)
of cash for the three months ended March 31, 2011 and 2010.
| |
|
|
|
|
|
|
|
|
|
|
|
Three Months
|
|
|
|
|
Ended March 31,
|
|
|
|
|
2011
|
|
|
2010
|
|
|
|
|
(Millions)
|
|
|
|
|
Net cash provided (used) by:
|
|
|
|
|
|
|
|
|
|
Operating activities
|
|
$
|
240
|
|
|
$
|
329
|
|
|
Investing activities
|
|
|
(342
|
)
|
|
|
(286
|
)
|
|
Financing activities
|
|
|
105
|
|
|
|
(39
|
)
|
|
|
|
|
|
|
|
|
|
|
|
Increase in cash and cash equivalents
|
|
$
|
3
|
|
|
$
|
4
|
|
|
|
|
|
|
|
|
|
|
|
Operating
activities
Our net cash provided by operating activities in 2011 decreased
from 2010 primarily due to higher operating costs, primarily
gathering, processing and transportation costs and higher
interest expense.
Investing
activities
Our net cash used by investing activities in 2011 increased from
2010 primarily due to capital expenditures. Expenditures for
drilling and completion were approximately $286 million in
2011 and $220 million in 2010.
Financing
activities
Our net cash provided by financing activities in 2011 increased
from 2010 primarily due to higher borrowings from Williams to
fund our capital expenditures as a result of the decrease in
cash provided by operating activities in 2011 and the 2010
acquisitions.
Year-Over-Year
The following table and discussion summarize our sources (uses)
of cash for the years ended December 31, 2010, 2009 and
2008.
| |
|
|
|
|
|
|
|
|
|
|
|
|
|
|
|
Years Ended December 31,
|
|
|
|
|
2010
|
|
|
2009
|
|
|
2008
|
|
|
|
|
|
|
|
(Millions)
|
|
|
|
|
|
|
|
Net cash provided (used) by:
|
|
|
|
|
|
|
|
|
|
|
|
|
|
Operating activities
|
|
$
|
1,056
|
|
|
$
|
1,181
|
|
|
$
|
2,009
|
|
|
Investing activities
|
|
|
(2,337
|
)
|
|
|
(1,435
|
)
|
|
|
(2,252
|
)
|
|
Financing activities
|
|
|
1,284
|
|
|
|
256
|
|
|
|
225
|
|
|
|
|
|
|
|
|
|
|
|
|
|
|
|
|
Increase (decrease) in cash and cash equivalents
|
|
$
|
3
|
|
|
$
|
2
|
|
|
$
|
(18
|
)
|
|
|
|
|
|
|
|
|
|
|
|
|
|
|
Operating
activities
Our net cash provided by operating activities in 2010 decreased
from 2009 primarily due to the payments made to reduce certain
accrued liabilities affecting our operations.
Our net cash provided by operating activities in 2009 decreased
primarily due to the lower realized energy commodity prices
during 2009 when compared to 2008.
66
Investing
activities
Our net cash used by investing activities in 2010 increased from
2009 primarily due to our capital expenditures related to the
acquisition of Marcellus Shale properties and our entry into the
Bakken Shale.
Significant expenditures include:
2010
|
|
|
| |
•
|
Expenditures for drilling and completion were approximately
$950 million.
|
| |
| |
•
|
Our acquisition in July 2010 of properties in the Marcellus
Shale for $599 million (see “—Overview of
2010”).
|
| |
| |
•
|
Our acquisition in December 2010 of oil and gas properties in
the Bakken Shale for $949 million (see “—Overview
of 2010”).
|
| |
| |
•
|
The sale in November 2010 of certain gathering and processing
assets in the Piceance Basin to Williams Partners for
$702 million in cash and approximately 1.8 million
Williams Partners common units, which units were subsequently
distributed to Williams.
|
2009
|
|
|
| |
•
|
Expenditures for drilling and completion were approximately
$1.0 billion.
|
| |
| |
•
|
A $253 million payment for the purchase of additional
properties in the Piceance Basin.
|
2008
|
|
|
| |
•
|
Expenditures for drilling and completion were approximately
$1.65 billion.
|
| |
| |
•
|
Acquisitions of certain interests in the Piceance Basin for
$285 million. A third party subsequently exercised its
contractual option to purchase a 49 percent interest in a
portion of the acquired assets for $71 million.
|
| |
| |
•
|
Our sale of a contractual right to a production payment in Peru
for $148 million.
|
Financing
activities
Our net cash provided by financing activities in 2010 increased
from 2009 primarily due to higher borrowings from Williams to
fund our capital expenditures, including those related to the
acquisition of Marcellus Shale properties and our acquisition in
the Bakken Shale.
Off-Balance
Sheet Financing Arrangements
We had no guarantees of off-balance sheet debt to third parties
or any other off-balance sheet arrangements at March 31,
2011 and December 31, 2010.
67
Contractual
Obligations
The table below summarizes the maturity dates of our contractual
obligations at March 31, 2011, including obligations
related to discontinued operations.
| |
|
|
|
|
|
|
|
|
|
|
|
|
|
|
|
|
|
|
|
|
|
|
|
April 1 -
|
|
|
|
|
|
|
|
|
|
|
|
|
|
|
|
|
December 31,
|
|
|
2012 -
|
|
|
2014 -
|
|
|
|
|
|
|
|
|
|
|
2011
|
|
|
2013
|
|
|
2015
|
|
|
Thereafter
|
|
|
Total
|
|
|
|
|
(Millions)
|
|
|
|
|
Operating leases and associated service commitments
|
|
|
|
|
|
|
|
|
|
|
|
|
|
|
|
|
|
|
|
|
|
Drilling rig commitments(1)
|
|
$
|
75
|
|
|
$
|
83
|
|
|
$
|
43
|
|
|
$
|
—
|
|
|
$
|
201
|
|
|
Other
|
|
|
6
|
|
|
|
7
|
|
|
|
5
|
|
|
|
16
|
|
|
|
34
|
|
|
Transportation and storage commitments
|
|
|
152
|
|
|
|
402
|
|
|
|
347
|
|
|
|
634
|
|
|
|
1,535
|
|
|
Natural gas purchase commitments(2)
|
|
|
141
|
|
|
|
417
|
|
|
|
388
|
|
|
|
922
|
|
|
|
1,868
|
|
|
Oil and gas activities(3)
|
|
|
110
|
|
|
|
269
|
|
|
|
128
|
|
|
|
216
|
|
|
|
723
|
|
|
Other long-term liabilities, including current portion:
|
|
|
|
|
|
|
|
|
|
|
|
|
|
|
|
|
|
|
|
|
|
Physical and financial derivatives(4)(5)
|
|
|
459
|
|
|
|
1,100
|
|
|
|
909
|
|
|
|
3,666
|
|
|
|
6,134
|
|
|
|
|
|
|
|
|
|
|
|
|
|
|
|
|
|
|
|
|
|
|
|
|
Total
|
|
$
|
943
|
|
|
$
|
2,278
|
|
|
$
|
1,820
|
|
|
$
|
5,454
|
|
|
$
|
10,495
|
|
|
|
|
|
|
|
|
|
|
|
|
|
|
|
|
|
|
|
|
|
|
|
|
|
|
|
(1) |
|
Includes materials and services obligations associated with our
drilling rig contracts. |
|
|
|
|
(2) |
|
Purchase commitments are at market prices and the purchased
natural gas can be sold at market prices. The obligations are
based on market information as of March 31, 2011 and
contracts are assumed to remain outstanding for their full
contractual duration. Because market information changes daily
and is subject to volatility, significant changes to the values
in this category may occur. |
|
|
|
|
(3) |
|
Includes gathering, processing and other oil and gas related
services commitments. Excluded are liabilities associated with
asset retirement obligations, which total $296 million as
of March 31, 2011. The ultimate settlement and timing can
not be precisely determined in advance; however we estimate that
less than 10% of this liability will be settled in the next five
years. |
|
|
|
|
(4) |
|
Includes $5.3 billion of physical natural gas derivatives
related to purchases at market prices. The natural gas expected
to be purchased under these contracts can be sold at market
prices, largely offsetting this obligation. The obligations for
physical and financial derivatives are based on market
information as of March 31, 2011, and assume contracts
remain outstanding for their full contractual duration. Because
market information changes daily and is subject to volatility,
significant changes to the values in this category may occur. |
|
|
|
|
(5) |
|
Expected offsetting cash inflows of $2.4 billion at
March 31, 2011, resulting from product sales or net
positive settlements, are not reflected in these amounts. In
addition, product sales may require additional purchase
obligations to fulfill sales obligations that are not reflected
in these amounts. |
Effects
of Inflation
Although the impact of inflation has been insignificant in
recent years, it is still a factor in the United States economy.
Operating costs are influenced by both competition for
specialized services and specific price changes in natural gas,
oil, NGLs and other commodities. We tend to experience
inflationary pressure on the cost of services and equipment as
increasing oil and gas prices increase drilling activity in our
areas of operation.
Environmental
We are subject to the Clean Air Act (“CAA”) and to the
Clean Air Act Amendments of 1990 (“1990 Amendments”),
which added significantly to the existing requirements
established by the CAA. Pursuant to requirements of the 1990
Amendments and EPA rules designed to mitigate the migration of
ground-level
68
ozone (“NOx”), we are planning installation of air
pollution controls on existing sources at certain facilities in
order to reduce NOx emissions. For many of these facilities, we
are developing more cost effective and innovative compressor
engine control designs.
In March 2008, the EPA promulgated a new, lower National Ambient
Air Quality Standard (“NAAQS”) for NOx. Within two
years, the EPA was expected to designate new
eight-hour
ozone non-attainment areas. However, in September 2009, the EPA
announced it would reconsider the 2008 NAAQS for NOx to ensure
that the standards were clearly grounded in science and were
protective of both public health and the environment. As a
result, the EPA delayed designation of new
eight-hour
ozone non-attainment areas under the 2008 standards until the
reconsideration is complete. In January 2010, the EPA proposed
to further reduce the NOx NAAQS from the March 2008 levels. The
EPA must provide new ozone NAAQS by July 29, 2011.
Designation of new
eight-hour
ozone non-attainment areas are expected to result in additional
federal and state regulatory actions that will likely impact our
operations and increase the cost of additions to property, plant
and equipment — net on the Combined Balance Sheet. We
are unable at this time to estimate the cost of additions that
may be required to meet this new regulation.
Under the CAA, the EPA must review and if appropriate revise New
Source Review Standards every eight years. EPA has agreed to a
proposed consent decree to revise the leak detection and repair
requirements for oil and gas facilities. Under the consent
agreement, EPA must finalize those rules by November 2011.
Additionally, in August 2010, the EPA promulgated National
Emission Standards for Hazardous Air Pollutants
(“NESHAP”) regulations that will impact our
operations. Furthermore, the EPA promulgated the Greenhouse Gas
(“GHG”) Mandatory Reporting Rule on October 30,
2009, which requires facilities that emit 25,000 metric tons or
more of carbon dioxide equivalent per year from stationary
fossil fuel combustion sources to report GHG emissions to the
EPA annually beginning September 30, 2011 for calendar year
2010. On November 30, 2010, the EPA issued additional
regulations that expand the scope of the Mandatory Reporting
Rule to include fugitive and vented greenhouse gas emissions
effective January 1, 2011. Facilities that emit 25,000
metric tons or more carbon dioxide equivalent per year from
stationary fossil-fuel combustion and fugitive/vented sources
combined will be required to report GHG combustion and
fugitive/vented emissions to the EPA annually beginning
March 31, 2012, for calendar year 2011.
In February 2010, the EPA promulgated a final rule establishing
a new
one-hour
nitrogen dioxide NAAQS. The effective date of the new nitrogen
dioxide standard was April 12, 2010. This new standard is
subject to numerous challenges in the federal court. We are
unable at this time to estimate the cost of additions that may
be required to meet this new regulation.
Our facilities and operations are also subject to the Clean
Water Act (“CWA”) and implementing regulations of the
EPA and the U.S. Army Corps of Engineers
(“Corps”). On April 27, 2011, the EPA and the
Corps released new draft guidance governing federal jurisdiction
over wetlands and other “isolated waters.” They would,
if adopted, significantly expand federal jurisdiction and
permitting requirements under the CWA. Additionally, the draft
guidance addresses the expanded scope of the CWA’s key term
“waters of the United States” to all CWA provisions,
which prior guidance limited to Section 404 determinations.
We are unable at this time to estimate the cost that may be
required to meet this proposed guidance.
Quantitative
and Qualitative Disclosures About Market Risk
Interest
Rate Risk
Historically, our current interest rate risk exposure was
substantially mitigated through our cash management program and
the effects of our intercompany note with Williams. The Notes
will be fixed rate debt in order to mitigate the impact of
fluctuations in interest rates and we expect that any borrowings
under our Credit Facility could be at a variable interest rate
and could expose us to the risk of increasing interest rates.
See Note 4 of Notes to Combined Financial Statements.
69
Commodity
Price Risk
We are exposed to the impact of fluctuations in the market price
of natural gas, NGLs and crude oil, as well as other market
factors, such as market volatility and energy commodity price
correlations. We are exposed to these risks in connection with
our owned energy-related assets, our long-term energy-related
contracts and our proprietary trading activities. We manage the
risks associated with these market fluctuations using various
derivatives and nonderivative energy-related contracts. The fair
value of derivative contracts is subject to many factors,
including changes in energy commodity market prices, the
liquidity and volatility of the markets in which the contracts
are transacted and changes in interest rates. See Note 15
of Notes to Combined Financial Statements.
We measure the risk in our portfolios using a
value-at-risk
methodology to estimate the potential
one-day loss
from adverse changes in the fair value of the portfolios. Value
at risk requires a number of key assumptions and is not
necessarily representative of actual losses in fair value that
could be incurred from the portfolios. Our
value-at-risk
model uses a Monte Carlo method to simulate hypothetical
movements in future market prices and assumes that, as a result
of changes in commodity prices, there is a 95 percent
probability that the
one-day loss
in fair value of the portfolios will not exceed the value at
risk. The simulation method uses historical correlations and
market forward prices and volatilities. In applying the
value-at-risk
methodology, we do not consider that the simulated hypothetical
movements affect the positions or would cause any potential
liquidity issues, nor do we consider that changing the
portfolios in response to market conditions could affect market
prices and could take longer than a
one-day
holding period to execute. While a
one-day
holding period has historically been the industry standard, a
longer holding period could more accurately represent the true
market risk given market liquidity and our own credit and
liquidity constraints.
We segregate our derivative contracts into trading and
nontrading contracts, as defined in the following paragraphs. We
calculate value at risk separately for these two categories.
Contracts designated as normal purchases or sales and
nonderivative energy contracts have been excluded from our
estimation of value at risk.
We have policies and procedures that govern our trading and risk
management activities. These policies cover authority and
delegation thereof in addition to control requirements,
authorized commodities and term and exposure limitations.
Value-at-risk
is limited in aggregate and calculated at a 95 percent
confidence level.
Trading
Our trading portfolio consists of derivative contracts entered
into for purposes other than economically hedging our commodity
price-risk exposure. The fair value of our trading derivatives
was less than $1 million at March 31, 2011 and a net
asset of $2 million at December 31, 2010. The value at
risk for contracts held for trading purposes was less than
$1 million at March 31, 2011, December 31, 2010
and December 31, 2009.
Nontrading
Our nontrading portfolio consists of derivative contracts that
hedge or could potentially hedge the price risk exposure from
our natural gas purchases and sales. The fair value of our
derivatives not designated as hedging instruments was a net
asset of $2 million and $16 million at March 31,
2011 and December 31, 2010, respectively.
The value at risk for derivative contracts held for nontrading
purposes was $30 million at March 31, 2011,
$24 million at December 31, 2010, and $34 million
at December 31, 2009. During the year ended
December 31, 2010, our value at risk for these contracts
ranged from a high of $33 million to a low of
$21 million. The decrease in value at risk primarily
reflects the realization of certain derivative positions and the
market price impact, partially offset by new derivative
contracts.
Certain of the derivative contracts held for nontrading purposes
are accounted for as cash flow hedges. Of the total fair value
of nontrading derivatives, cash flow hedges had a net asset
value of $170 million and $266 million as of
March 31, 2011 and December 31, 2010, respectively.
Though these contracts are included in our
value-at-risk
calculation, any changes in the fair value of the effective
portion of these hedge contracts would generally not be
reflected in earnings until the associated hedged item affects
earnings.
70
Critical
Accounting Estimates
The preparation of financial statements in conformity with
generally accepted accounting principles requires management to
make estimates, judgments and assumptions that affect the
reported amounts of assets, liabilities, revenues and expenses
and the disclosure of contingent assets and liabilities. We
believe that the nature of these estimates and assumptions is
material due to the subjectivity and judgment necessary, or the
susceptibility of such matters to change, and the impact of
these on our financial condition or results of operations.
In our management’s opinion, the more significant reporting
areas impacted by management’s judgments and estimates are
impairments of goodwill and long-lived assets, accounting for
derivative instruments and hedging activities, successful
efforts method of accounting, contingent liabilities, valuation
of deferred tax assets and tax contingencies.
Impairments
of Goodwill and Long-Lived Assets
We have assessed goodwill for impairment annually as of the end
of the year and we have performed interim assessments of
goodwill if impairment triggering events or circumstances were
present. One such triggering event is a significant decline in
forward natural gas prices. Early in 2010, we evaluated the
impact of declines in forward gas prices across all future
production periods and determined that the impact was not
significant enough to warrant a full impairment review. Forward
natural gas prices through 2025 used in these prior analyses had
declined less than 10 percent, on average, from
December 31, 2009 through March 31, 2010 and
June 30, 2010. During the third quarter of 2010, these
forward natural gas prices through 2025 declined an additional
19 percent for a total
year-to-date
decline of more than 22 percent on average through
September 30, 2010. Based on forward prices as of
September 30, 2010, we evaluated the impact of this decline
across all future production periods and determined that a full
impairment review was warranted.
As a result, we evaluated our goodwill of approximately
$1 billion resulting from a 2001 acquisition related to our
domestic natural gas production operations (the “reporting
unit”). Our impairment evaluation of goodwill first
considered management’s estimate of the fair value of the
reporting unit compared to its carrying value, including
goodwill. If the carrying value of the reporting unit exceeded
its fair value, a computation of the implied fair value of the
goodwill was compared with its related carrying value. If the
carrying value of the reporting unit goodwill exceeded the
implied fair value of that goodwill, an impairment loss was
recognized in the amount of the excess. Because quoted market
prices were not available for the reporting unit, management
applied reasonable judgments (including market supported
assumptions when available) in estimating the fair value for the
reporting unit. We estimated the fair value of the reporting
unit on a stand-alone basis and also considered Williams’
market capitalization and third party estimates in corroborating
our estimate of the fair value of the reporting unit.
The fair value of the reporting unit was estimated primarily by
valuing proved and unproved reserves. We use an income approach
(discounted cash flows) for valuing reserves, based on inputs we
believed would be utilized by market participants. The
significant inputs into the valuation of proved and unproved
reserves include reserve quantities, forward natural gas prices,
anticipated drilling and operating costs, anticipated production
curves, income taxes and appropriate discount rates. To estimate
the fair value of the reporting unit and the implied fair value
of goodwill under a hypothetical acquisition of the reporting
unit, we assumed a tax structure where a buyer would obtain a
step-up in
the tax basis of the net assets acquired.
In our assessment as of September 30, 2010, the carrying
value of the reporting unit, including goodwill, exceeded its
fair value. We then determined that the implied fair value of
the goodwill was zero. As a result, we recognized a full
$1 billion impairment charge related to our goodwill. See
Notes 6 and 14 of Notes to Combined Financial Statements
for additional discussion and significant inputs into the fair
value determination.
We evaluate our long-lived assets for impairment when we believe
events or changes in circumstances indicate that we may not be
able to recover the carrying value. Our computations utilize
judgments and
71
assumptions that include the estimated fair value of the asset,
undiscounted future cash flows, discounted future cash flows and
the current and future economic environment in which the asset
is operated.
As a result of significant declines in forward natural gas
prices during the third quarter of 2010, we assessed our natural
gas producing properties and acquired unproved reserve costs for
impairment using estimates of future cash flows. Significant
judgments and assumptions in these assessments include estimates
of natural gas reserves quantities, estimates of future natural
gas prices using a forward NYMEX curve adjusted for locational
basis differentials, drilling plans, expected capital costs and
our estimate of an applicable discount rate commensurate with
the risk of the underlying cash flow estimates. The assessment
performed at September 30, 2010 identified certain
properties with a carrying value in excess of their calculated
fair values. As a result, we recognized a $678 million
impairment charge. See Notes 6 and 14 of Notes to Combined
Financial Statements for additional discussion and significant
inputs into the fair value determination.
In addition to those long-lived assets described above for which
impairment charges were recorded, certain others were reviewed
for which no impairment was required. These reviews included our
other domestic producing properties and acquired unproved
reserve costs, and utilized inputs generally consistent with
those described above. Judgments and assumptions are inherent in
our estimate of future cash flows used to evaluate these assets.
The use of alternate judgments and assumptions could result in
the recognition of different levels of impairment charges in the
combined financial statements. For our other producing assets
reviewed, but for which impairment charges were not recorded, we
estimate that approximately 12 percent could be at risk for
impairment if forward prices across all future periods decline
by approximately 8 to 12 percent, on average, as compared
to the forward prices at December 31, 2010. A substantial
portion of the remaining carrying value of these other assets
(primarily related to our assets in the Piceance Basin) could be
at risk for impairment if forward prices across all future
periods decline by at least 30 percent, on average, as
compared to the prices at December 31, 2010.
Accounting
for Derivative Instruments and Hedging Activities
We review our energy contracts to determine whether they are, or
contain, derivatives. Our energy derivatives portfolio is
largely comprised of exchange-traded products or like products
and the tenure of our derivatives portfolio is relatively
short-term, with more than 99 percent of the value of our
derivatives portfolio expiring in the next 24 months. We
further assess the appropriate accounting method for any
derivatives identified, which could include:
|
|
|
| |
•
|
qualifying for and electing cash flow hedge accounting, which
recognizes changes in the fair value of the derivative in other
comprehensive income (to the extent the hedge is effective)
until the hedged item is recognized in earnings;
|
| |
| |
•
|
qualifying for and electing accrual accounting under the normal
purchases and normal sales exception; or
|
| |
| |
•
|
applying
mark-to-market
accounting, which recognizes changes in the fair value of the
derivative in earnings.
|
If cash flow hedge accounting or accrual accounting is not
applied, a derivative is subject to
mark-to-market
accounting. Determination of the accounting method involves
significant judgments and assumptions, which are further
described below.
The determination of whether a derivative contract qualifies as
a cash flow hedge includes an analysis of historical market
price information to assess whether the derivative is expected
to be highly effective in offsetting the cash flows attributed
to the hedged risk. We also assess whether the hedged forecasted
transaction is probable of occurring. This assessment requires
us to exercise judgment and consider a wide variety of factors
in addition to our intent, including internal and external
forecasts, historical experience, changing market and business
conditions, our financial and operational ability to carry out
the forecasted transaction, the length of time until the
forecasted transaction is projected to occur and the quantity of
the forecasted transaction. In addition, we compare actual cash
flows to those that were expected from the
72
underlying risk. If a hedged forecasted transaction is not
probable of occurring, or if the derivative contract is not
expected to be highly effective, the derivative does not qualify
for hedge accounting.
For derivatives designated as cash flow hedges, we must
periodically assess whether they continue to qualify for hedge
accounting. We prospectively discontinue hedge accounting and
recognize future changes in fair value directly in earnings if
we no longer expect the hedge to be highly effective, or if we
believe that the hedged forecasted transaction is no longer
probable of occurring. If the forecasted transaction becomes
probable of not occurring, we reclassify amounts previously
recorded in other comprehensive income into earnings in addition
to prospectively discontinuing hedge accounting. If the
effectiveness of the derivative improves and is again expected
to be highly effective in offsetting the cash flows attributed
to the hedged risk, or if the forecasted transaction again
becomes probable, we may prospectively re-designate the
derivative as a hedge of the underlying risk.
Derivatives for which the normal purchases and normal sales
exception has been elected are accounted for on an accrual
basis. In determining whether a derivative is eligible for this
exception, we assess whether the contract provides for the
purchase or sale of a commodity that will be physically
delivered in quantities expected to be used or sold over a
reasonable period in the normal course of business. In making
this assessment, we consider numerous factors, including the
quantities provided under the contract in relation to our
business needs, delivery locations per the contract in relation
to our operating locations, duration of time between entering
the contract and delivery, past trends and expected future
demand and our past practices and customs with regard to such
contracts. Additionally, we assess whether it is probable that
the contract will result in physical delivery of the commodity
and not net financial settlement.
Since our energy derivative contracts could be accounted for in
three different ways, two of which are elective, our accounting
method could be different from that used by another party for a
similar transaction. Furthermore, the accounting method may
influence the level of volatility in the financial statements
associated with changes in the fair value of derivatives, as
generally depicted below:
| |
|
|
|
|
|
|
|
|
|
|
|
Combined Statement of Operations
|
|
Combined Balance Sheet
|
|
Accounting Method
|
|
Drivers
|
|
Impact
|
|
Drivers
|
|
Impact
|
|
|
|
Accrual Accounting
|
|
Realizations
|
|
Less Volatility
|
|
None
|
|
No Impact
|
|
Cash Flow Hedge
Accounting
|
|
Realizations &
Ineffectiveness
|
|
Less Volatility
|
|
Fair Value Changes
|
|
More Volatility
|
|
Mark-to-Market
Accounting
|
|
Fair Value Changes
|
|
More Volatility
|
|
Fair Value Changes
|
|
More Volatility
|
Our determination of the accounting method does not impact our
cash flows related to derivatives.
Additional discussion of the accounting for energy contracts at
fair value is included in Notes 1 and 14 of Notes to
Combined Financial Statements.
Successful
Efforts Method of Accounting for Oil and Gas Exploration and
Production Activities
We use the successful efforts method of accounting for our oil-
and gas-producing activities. Estimated natural gas and oil
reserves and forward market prices for oil and gas are a
significant part of our financial calculations. Following are
examples of how these estimates affect financial results:
|
|
|
| |
•
|
An increase (decrease) in estimated proved oil and gas reserves
can reduce (increase) our
unit-of-production
depreciation, depletion and amortization rates; and
|
| |
| |
•
|
Changes in oil and gas reserves and forward market prices both
impact projected future cash flows from our oil and gas
properties. This, in turn, can impact our periodic impairment
analyses.
|
The process of estimating natural gas and oil reserves is very
complex, requiring significant judgment in the evaluation of all
available geological, geophysical, engineering and economic
data. After being estimated internally, approximately
94 percent of our domestic reserve estimates are audited by
independent experts. The data may change substantially over time
as a result of numerous factors, including additional
development cost and activity, evolving production history and a
continual reassessment of the viability of production under
73
changing economic conditions. As a result, material revisions to
existing reserve estimates could occur from time to time. Such
changes could trigger an impairment of our oil and gas
properties and have an impact on our depreciation, depletion and
amortization expense prospectively. For example, a change of
approximately 10 percent in our total oil and gas reserves
could change our annual depreciation, depletion and amortization
expense between approximately $76 million and
$93 million. The actual impact would depend on the specific
basins impacted and whether the change resulted from proved
developed, proved undeveloped or a combination of these reserve
categories.
Forward market prices, which are utilized in our impairment
analyses, include estimates of prices for periods that extend
beyond those with quoted market prices. This forward market
price information is consistent with that generally used in
evaluating our drilling decisions and acquisition plans. These
market prices for future periods impact the production economics
underlying oil and gas reserve estimates. The prices of natural
gas and oil are volatile and change from period to period, thus
impacting our estimates. Significant unfavorable changes in the
forward price curve could result in an impairment of our oil and
gas properties.
We record the cost of leasehold acquisitions as incurred.
Individually significant lease acquisition costs are assessed
annually, or as conditions warrant, for impairment considering
our future drilling plans, the remaining lease term and recent
drilling results. Lease acquisition costs that are not
individually significant are aggregated by prospect or
geographically, and the portion of such costs estimated to be
nonproductive prior to lease expiration is amortized over the
average holding period. Changes in our assumptions regarding the
estimates of the nonproductive portion of these leasehold
acquisitions could result in impairment of these costs. Upon
determination that specific acreage will not be developed, the
costs associated with that acreage would be impaired.
Contingent
Liabilities
We record liabilities for estimated loss contingencies,
including environmental matters, when we assess that a loss is
probable and the amount of the loss can be reasonably estimated.
Revisions to contingent liabilities are generally reflected in
income when new or different facts or information become known
or circumstances change that affect the previous assumptions
with respect to the likelihood or amount of loss. Liabilities
for contingent losses are based upon our assumptions and
estimates and upon advice of legal counsel, engineers or other
third parties regarding the probable outcomes of the matter. As
new developments occur or more information becomes available,
our assumptions and estimates of these liabilities may change.
Changes in our assumptions and estimates or outcomes different
from our current assumptions and estimates could materially
affect future results of operations for any particular quarterly
or annual period. See Note 11 of Notes to Combined
Financial Statements.
Valuation
of Deferred Tax Assets and Liabilities
Our domestic operations are included in the consolidated and
combined federal and state income tax returns for Williams,
except for certain separate state filings. The income tax
provision has been calculated on a separate return basis, which
requires judgment in computing a stand-alone effective state tax
rate as we did not exist as a stand-alone filer during these
periods. If the effective state tax rate were to be revised
upward by one percent, this would result in an increase to our
net deferred income tax liability of approximately
$30 million.
We have deferred tax assets resulting from certain investments
and businesses that have a tax basis in excess of book basis and
from certain separate state losses generated in the current and
prior years. We must evaluate whether we will ultimately realize
these tax benefits and establish a valuation allowance for those
that may not be realizable. This evaluation considers tax
planning strategies, including assumptions about the
availability and character of future taxable income. When
assessing the need for a valuation allowance, we consider
forecasts of future company performance, the estimated impact of
potential asset dispositions, and our ability and intent to
execute tax planning strategies to utilize tax carryovers. The
ultimate amount of deferred tax assets realized could be
materially different from those recorded, as influenced by
potential changes in jurisdictional income tax laws and the
circumstances surrounding the actual realization of related tax
assets.
74
For example, Williams manages its tax position based upon its
entire portfolio, which may not be indicative of tax planning
strategies available to us if we were operating as an
independent company.
See Note 10 of Notes to Combined Financial Statements for
additional information.
Fair
Value Measurements
A limited amount of our energy derivative assets and liabilities
trade in markets with lower availability of pricing information
requiring us to use unobservable inputs and are considered
Level 3 in the fair value hierarchy. At December 31,
2010, less than 1 percent of our energy derivative assets
and liabilities measured at fair value on a recurring basis are
included in Level 3. For Level 2 transactions, we do
not make significant adjustments to observable prices in
measuring fair value as we do not generally trade in inactive
markets.
The determination of fair value for our energy derivative assets
and liabilities also incorporates the time value of money and
various credit risk factors which can include the credit
standing of the counterparties involved, master netting
arrangements, the impact of credit enhancements (such as cash
collateral posted and letters of credit) and our nonperformance
risk on our energy derivative liabilities. The determination of
the fair value of our energy derivative liabilities does not
consider noncash collateral credit enhancements. For net
derivative assets, we apply a credit spread, based on the credit
rating of the counterparty, against the net derivative asset
with that counterparty. For net derivative liabilities we apply
our own credit rating. We derive the credit spreads by using the
corporate industrial credit curves for each rating category and
building a curve based on certain points in time for each rating
category. The spread comes from the discount factor of the
individual corporate curves versus the discount factor of the
LIBOR curve. At December 31, 2010, the credit reserve is
less than $1 million on both on our net derivative assets
and net derivative liabilities. Considering these factors and
that we do not have significant risk from our net credit
exposure to derivative counterparties, the impact of credit risk
is not significant to the overall fair value of our derivatives
portfolio.
At December 31, 2010, 89 percent of the fair value of
our derivatives portfolio expires in the next 12 months and
more than 99 percent expires in the next 24 months.
Our derivatives portfolio is largely comprised of
exchange-traded products or like products where price
transparency has not historically been a concern. Due to the
nature of the markets in which we transact and the relatively
short tenure of our derivatives portfolio, we do not believe it
is necessary to make an adjustment for illiquidity. We regularly
analyze the liquidity of the markets based on the prevalence of
broker pricing and exchange pricing for products in our
derivatives portfolio.
The instruments included in Level 3 at December 31,
2010, consist of natural gas index transactions that are used to
manage the physical requirements of our business. The change in
the overall fair value of instruments included in Level 3
primarily results from changes in commodity prices during the
month of delivery. There are generally no active forward markets
or quoted prices for natural gas index transactions.
We have an unsecured credit agreement through December 2015 with
certain banks that, so long as certain conditions are met,
serves to reduce our usage of cash and other credit facilities
for margin requirements related to instruments included in the
facility. We anticipate this agreement will be dissolved and
individual contracts will be executed with the same banks under
similar margining requirements. See further discussion in
“—Management’s Discussion and Analysis of
Financial Condition and Liquidity.”
For the years ended December 31, 2010 and 2009, we
recognized impairments of certain assets that were measured at
fair value on a nonrecurring basis. These impairment
measurements are included in Level 3 as they include
significant unobservable inputs, such as our estimate of future
cash flows and the probabilities of alternative scenarios. See
Note 14 of Notes to Combined Financial Statements.
75
BUSINESS
Overview
We are an independent natural gas and oil exploration and
production company engaged in the exploitation and development
of long-life unconventional properties. We are focused on
profitably exploiting our significant natural gas reserve base
and related NGLs in the Piceance Basin of the Rocky Mountain
region, and on developing and growing our positions in the
Bakken Shale oil play in North Dakota and the Marcellus Shale
natural gas play in Pennsylvania. Our other areas of domestic
operations include the Powder River Basin in Wyoming and the
San Juan Basin in the southwestern United States. In
addition, we own a 69 percent controlling ownership
interest in Apco, which holds oil and gas concessions in
Argentina and Colombia and trades on the NASDAQ Capital Market
under the symbol “APAGF.” Our international interests
make up approximately five percent of our total proved reserves.
In consideration of this percentage, unless specifically
referenced herein, the information included in this section
relates only to our domestic activity.
We have built a geographically diverse portfolio of natural gas
and oil reserves through organic development and strategic
acquisitions. For the five years ended December 31, 2010,
we have grown production at a compound annual growth rate of
12 percent. As of December 31, 2010, our proved
reserves were 4,473 Bcfe, 59 percent of which were
proved developed reserves. Average daily production for the
month of April 2011 was 1,246 MMcfe/d. Our Piceance Basin
operations form the majority of our proved reserves and current
production, providing a low-cost, scalable asset base.
The following table provides summary data for each of our
primary areas of operation as of December 31, 2010, unless
otherwise noted.
| |
|
|
|
|
|
|
|
|
|
|
|
|
|
|
|
|
|
|
|
|
|
|
|
|
|
|
|
|
|
|
|
|
|
|
|
|
|
|
|
Estimated Net
|
|
|
April 2011
|
|
|
|
|
|
|
|
|
|
|
|
2011 Budget Estimate
|
|
|
|
|
|
|
|
Proved Reserves
|
|
|
Average Daily
|
|
|
|
|
|
Identified Drilling
|
|
|
|
|
|
Drilling
|
|
|
|
|
|
|
|
|
|
|
% Proved
|
|
|
Net Production
|
|
|
Net
|
|
|
Locations
|
|
|
Gross
|
|
|
Capital(2)
|
|
|
PV-10(3)
|
|
|
Basin/Shale
|
|
Bcfe
|
|
|
Developed
|
|
|
(MMcfe/d)(1)
|
|
|
Acreage
|
|
|
Gross
|
|
|
Net
|
|
|
Wells
|
|
|
(Millions)
|
|
|
(Millions)
|
|
|
|
|
Piceance Basin
|
|
|
2,927
|
|
|
|
53
|
%
|
|
|
734
|
|
|
|
211,000
|
|
|
|
10,708
|
|
|
|
8,496
|
|
|
|
376
|
|
|
$
|
575
|
|
|
$
|
2,707
|
|
|
Bakken Shale(4)
|
|
|
136
|
|
|
|
11
|
%
|
|
|
26
|
|
|
|
89,420
|
|
|
|
758
|
|
|
|
397
|
|
|
|
41
|
|
|
|
260
|
|
|
|
399
|
|
|
Marcellus Shale
|
|
|
28
|
|
|
|
71
|
%
|
|
|
7
|
|
|
|
99,301
|
|
|
|
761
|
|
|
|
450
|
|
|
|
62
|
|
|
|
170
|
|
|
|
29
|
|
|
Powder River Basin
|
|
|
348
|
|
|
|
75
|
%
|
|
|
221
|
|
|
|
425,550
|
|
|
|
2,374
|
|
|
|
1,023
|
|
|
|
411
|
|
|
|
70
|
|
|
|
317
|
|
|
San Juan Basin
|
|
|
554
|
|
|
|
79
|
%
|
|
|
134
|
|
|
|
120,998
|
|
|
|
1,485
|
|
|
|
704
|
|
|
|
51
|
|
|
|
40
|
|
|
|
477
|
|
|
Apco(5)
|
|
|
190
|
|
|
|
60
|
%
|
|
|
51
|
|
|
|
404,304
|
|
|
|
526
|
|
|
|
180
|
|
|
|
37
|
|
|
|
30
|
|
|
|
358
|
|
|
Other(6)
|
|
|
290
|
|
|
|
72
|
%
|
|
|
73
|
|
|
|
327,390
|
|
|
|
2,185
|
|
|
|
112
|
|
|
|
94
|
|
|
|
85
|
|
|
|
257
|
|
|
|
|
|
|
|
|
|
|
|
|
|
|
|
|
|
|
|
|
|
|
|
|
|
|
|
|
|
|
|
|
|
|
|
|
|
|
|
|
Total
|
|
|
4,473
|
|
|
|
59
|
%
|
|
|
1,246
|
|
|
|
1,677,963
|
|
|
|
18,797
|
|
|
|
11,362
|
|
|
|
1,072
|
|
|
$
|
1,230
|
|
|
$
|
4,544
|
|
|
|
|
|
|
|
|
|
|
|
|
|
|
|
|
|
|
|
|
|
|
|
|
|
|
|
|
|
|
|
|
|
|
|
|
|
|
|
|
|
|
|
(1) |
|
Represents average daily net production of our continuing
operations for the month of April 2011. |
|
|
|
|
(2) |
|
Based on the midpoint of our estimated capital spending range. |
| |
|
(3) |
|
PV-10 is a
non-GAAP financial measure and generally differs from
Standardized Measure, the most directly comparable GAAP
financial measure, because it does not include the effects of
income taxes on future net revenues. Neither
PV-10 nor
Standardized Measure represents an estimate of the fair market
value of our oil and natural gas assets. We and others in the
industry use
PV-10 as a
measure to compare the relative size and value of proved
reserves held by companies without regard to the specific tax
characteristics of such entities. For a definition of
PV-10 and a
reconciliation of
PV-10 to
Standardized Measure, see “Prospectus Summary—Summary
Combined Historical Operating and Reserve
Data—Non-GAAP Financial Measures and
Reconciliations.” |
| |
|
(4) |
|
Our estimated net proved reserves in the Bakken Shale have not
been audited by independent reserve engineers. |
| |
|
(5) |
|
Represents approximately 69 percent of each metric (which
corresponds to our ownership interest in Apco) except Percent
Proved Developed, Gross Identified Drilling Locations, Gross
Wells and Drilling Capital. |
76
|
|
|
|
(6) |
|
Other includes Barnett Shale, Arkoma and Green River Basins and
miscellaneous smaller properties. April 2011 average daily net
production excludes Arkoma production of approximately 10
MMcfe/d as our Arkoma Basin operations were classified as held
for sale and reported as discontinued operations as of
March 31, 2011. |
2011
Capital Expenditures Budget
Our total 2011 capital expenditures budget is expected to be
between $1.30 billion and $1.60 billion, and will
consist of the following, representing the midpoint of this
range:
|
|
|
| |
•
|
approximately $1.23 billion for development
drilling; and
|
|
|
|
| |
•
|
approximately $0.22 billion for facilities, infrastructure,
and land/acquisitions.
|
While we have budgeted between $1.3 billion and
$1.6 billion of capital deployment in 2011, the ultimate
amount and allocation of capital spent in 2011 could vary. We
will evaluate market conditions in each of our operating areas
to determine the estimated economic returns on capital employed.
If those returns exceed or fall short of our thresholds, our
capital expenditures and allocations could change accordingly.
In addition, we believe that after completion of this offering
we will be well positioned to pursue large scale strategic
acquisitions that are not included in our 2011 capital
expenditures budget. However, our ability to enter into
corporate transactions will be subject to certain restrictions.
For example, prior to the spin-off, we may not enter into
transactions that would reduce Williams’ ownership to less
than 80% of the voting power of all then outstanding shares of
our capital stock entitled to vote generally in the election of
directors or less than 80% of the then outstanding shares of any
class of non-voting stock. Similarly, after the spin-off, we may
not enter into transactions that would cause us to undergo
either a 50% or greater change in the ownership of our voting
stock or a 50% or greater change in the ownership (measured by
value) of all classes of our stock taking into account shares
issued in this offering in transactions considered related to
the spin-off. These restrictions are necessary in order to
maintain the tax-free treatment of our separation from Williams.
See “Risk Factors—Risks Related to our Relationship
with Williams—Our agreements with Williams may limit our
ability to obtain additional financing or make
acquisitions,” and “Risk Factors—Risks Related to
our Relationships with Williams—Our tax sharing agreement
with Williams may limit our ability to take certain actions and
may require us to indemnify Williams for significant tax
liabilities.”
Our
Business Strategy
Our business strategy is to increase shareholder value by
finding and developing reserves and producing natural gas, oil
and NGLs at costs that generate an attractive rate of return on
our investment.
|
|
|
| |
•
|
Efficiently Allocate Capital for Optimal Portfolio
Returns. We expect to allocate capital to the
most profitable opportunities in our portfolio based on
commodity price cycles and other market conditions, enabling us
to continue to grow our reserves and production in a manner that
maximizes our return on investment. In determining which
drilling opportunities to pursue, we target a minimum after-tax
internal rate of return on each operated well we drill of
15 percent. While we have a significant portfolio of
drilling opportunities that we believe meet or exceed our return
targets even in challenging commodity price environments, we are
disciplined in our approach to capital spending and will adjust
our drilling capital expenditures based on our level of expected
cash flows, access to capital and overall liquidity position.
For example, in 2009 we demonstrated our capital discipline by
reducing drilling expenditures in response to prevailing
commodity prices and their impact on these factors.
|
|
|
|
| |
•
|
Continue Our Low-Cost Development Approach. We
focus on developing properties that have a low-cost per unit of
production. We manage costs by focusing on establishing large
scale, contiguous acreage blocks on which we can operate a
majority of the properties. We believe this strategy allows us
to better achieve economies of scale and apply continuous
technological improvements in our operations. We intend to
replicate these cost-disciplined approaches in our recently
acquired growth positions in the Bakken Shale and the Marcellus
Shale.
|
|
|
|
| |
•
|
Pursue Strategic Acquisitions with Significant Resource
Potential. We have a history of acquiring
undeveloped properties that meet our disciplined return
requirements and other acquisition criteria to
|
77
|
|
|
| |
|
expand upon our existing positions as well as acquiring
undeveloped acreage in new geographic areas that offer
significant resource potential. This is illustrated by our
recent acquisitions in the Bakken Shale and the Marcellus Shale.
We seek to continue expansion of current acreage positions and
opportunistically acquire acreage positions in new areas where
we feel we can establish significant scale and replicate our
low-cost development approach.
|
|
|
|
| |
•
|
Target a More Balanced Commodity Mix in Our Production
Profile. With our Bakken Shale acquisition in
December 2010 and our liquids-rich Piceance Basin assets, we
have a significant drilling inventory of oil- and liquids-rich
opportunities that we intend to develop rapidly in order to
achieve a more balanced commodity mix in our production. We will
continue to pursue other oil- and liquids-rich organic
development and acquisition opportunities that meet our
investment returns and strategic criteria.
|
|
|
|
| |
•
|
Maintain Substantial Financial Liquidity and Manage Commodity
Price Sensitivity. We plan to conservatively
manage our balance sheet and maintain substantial liquidity
through a mix of cash on hand and availability under our Credit
Facility. In addition, we have engaged and will continue to
engage in commodity hedging activities to maintain a degree of
cash flow stability. Typically, we target hedging approximately
50 percent of expected revenue from domestic production
during a current calendar year in order to strike an appropriate
balance of commodity price upside with cash flow protection,
although we may vary from this level based on our perceptions of
market risk. At April 30, 2011, our estimated domestic
natural gas production revenues were 65 percent hedged for
2011 and 43 percent hedged for 2012. Estimated domestic oil
production revenues were 49 percent hedged for 2011 and
49 percent hedged for 2012 as of the same date.
|
Our
Competitive Strengths
We have a number of competitive strengths that we believe will
help us to successfully execute our business strategies:
|
|
|
| |
•
|
A Leading Piceance Basin Cost Structure. We
have a large position in the lower cost valley area of the
Piceance Basin, which we believe provides us economies
associated with lower elevation drilling and large contiguous
operations, allowing us to continuously drive down operating
costs and increase efficiencies. The existing substantial
midstream infrastructure in the Piceance Basin contributes to
our low-cost structure and provides take-away capacity for our
natural gas and NGLs. Because of this low-cost structure in the
Piceance Basin, we have the ability to generate returns that we
believe are in excess of those typically associated with Rockies
producers.
|
|
|
|
| |
•
|
Attractive Asset Base Across a Number of High Growth
Areas. In addition to our large scale Piceance
Basin properties, our assets include emerging, high growth
opportunities such as our Bakken Shale and Marcellus Shale
positions. Based on our subsurface geological and engineering
analysis of available well data, we believe our Bakken Shale and
Marcellus Shale positions are located in core areas of these
plays, which have associated historic drilling results that we
believe offer highly attractive economic returns.
|
| |
| |
•
|
Extensive Drilling Inventory. As of
December 31, 2010, we have identified approximately
14,000 gross operated drilling locations, for which
approximately 500 gross operated wells are budgeted for
2011. We have established significant scale in each of our core
areas of operation that support multi-year development plans and
allow us to optimally leverage our low-cost development
approach. Our drilling inventory provides opportunities across
diverse geographic markets and products including natural gas,
oil and NGLs.
|
| |
| |
•
|
Significant Operating Flexibility. In the
Piceance Basin, Bakken Shale and Marcellus Shale, our three
primary basins, we operate substantially all of our production.
We expect approximately 91 percent of our projected 2011
domestic drilling capital will be spent on projects we operate.
We believe acting as operator on our properties allows us to
better control costs and capital expenditures, manage
efficiencies, optimize development pace, ensure safety and
environmental stewardship and, ultimately, maximize our return
on investment. As operator, we are also able to leverage our
|
78
|
|
|
| |
|
experience and expertise across all basins and transfer
technology advances between them as applicable. In addition,
substantially all of our Piceance Basin properties are held by
producing wells, which allows us to adjust our level of drilling
activity in response to changing market conditions.
|
|
|
|
| |
•
|
Significant Financial Flexibility. Our capital
structure is intended to provide a high degree of financial
flexibility to grow our asset base, both through organic
projects and opportunistic acquisitions. Immediately following
the completion of this offering, we expect to have
$2.0 billion of liquidity, comprised of availability under
our $1.5 billion Credit Facility and approximately
$500 million of cash on hand. We believe our pro forma
level of debt to proved reserves is low relative to a majority
of other publicly traded, independent oil and gas producers.
|
| |
| |
•
|
Management Team with Broad Unconventional Resource
Experience. Our management and operating team has
significant experience acquiring, operating and developing
natural gas and oil reserves from tight-sands and shale
formations. Our Chief Executive Officer and his direct reports
have in excess of 238 collective years of experience running
large scale drilling programs and drilling vertical and
horizontal wells requiring complex well design and completion
methods. Our team has demonstrated the ability to manage large
scale operations and apply current technological successes to
new development opportunities. We have deployed members of our
successful Piceance Basin, Powder River Basin and Barnett Shale
teams to the Bakken Shale and Marcellus Shale teams to help
replicate our low-cost model and to apply our highly specialized
technical expertise in the development of those resources.
|
Our
Recent Acquisition History
An important part of our strategy to grow our business and
enhance shareholder value is to acquire properties complementary
to our existing positions as well as undeveloped acreage with
significant resource potential in new geographic areas.
Following is a summary of selected recent acquisitions in the
Bakken Shale, Marcellus Shale and Piceance Basin.
Bakken
Shale
|
|
|
| |
•
|
In December 2010, we acquired Dakota-3 E&P Company LLC, a
company that holds approximately 85,800 net acres on the
Fort Berthold Indian Reservation in the Williston Basin,
with then-current net oil production of 3,300 barrels per
day from 24 existing wells, for $949 million.
|
Marcellus
Shale
|
|
|
| |
•
|
In July 2010, we acquired 42,000 net acres of largely
undeveloped properties primarily located in Susquehanna County
in northeastern Pennsylvania for $599 million.
|
| |
| |
•
|
During 2010, we also acquired additional unproved leasehold
acreage positions in the Marcellus Shale for a total of
$164 million.
|
| |
| |
•
|
In June 2009, we initiated our strategy of securing acreage in
the Marcellus Shale with our participation and exploration
agreement to develop natural gas wells with Rex Energy
Corporation. We acquired a 50 percent interest in
44,000 net acres in Pennsylvania’s Westmoreland,
Clearfield and Centre Counties for $33 million in a
“drill to earn” structure.
|
Piceance
Basin
|
|
|
| |
•
|
In September 2009, we completed a bolt-on acquisition of
21,800 net acres in the Piceance Basin, east of our
existing properties, for $253 million. The asset included
then current production of 24 MMcfe/d from 28 wells,
related gas and water gathering facilities, 94 approved drilling
permits and more than 800 drillable locations at
10-acre
spacing. In December 2009, we increased our working interest in
these properties through an additional $22 million
acquisition.
|
79
|
|
|
| |
•
|
In May 2008, we acquired 24,000 net acres in the Piceance
Basin for $285 million. The acreage covered by the
agreement was contiguous to our existing position in the Ryan
Gulch area of the Piceance Basin Highlands in Rio Blanco County.
A third party subsequently exercised its contractual option to
purchase a 49 percent interest in a portion of the acquired
assets for $71 million.
|
Recent
Sales & Dispositions
|
|
|
| |
•
|
In November 2010, we sold certain of our gathering and
processing assets in Colorado’s Piceance Basin to Williams
Partners for $702 million in cash and approximately
1.8 million Williams Partners common units, which units
were subsequently distributed to Williams. These assets include
the Parachute Plant Complex, three other treating facilities
with a combined processing capacity of 1.2 Bcf/d, and a
gathering system with approximately 150 miles of pipeline.
There are more than 3,300 wells connected to the gathering
system, which includes pipelines ranging up to
30-inch
trunk lines. As part of this sale, we agreed to continue to use
this gathering system for our production in this area for the
life of our leases. See “Other Related Party
Transactions—Agreements Related to the Piceance
Disposition.”
|
|
|
|
| |
•
|
In January 2008, we sold a contractual right to a production
payment on certain future hydrocarbon production in Peru for
$148 million. As a result of the contract termination, we
have no further interests associated with this crude oil
concession, which we had obtained through our acquisition of
Barrett Resources Corporation in 2001.
|
Significant
Properties
Our principal areas of operation are the Piceance Basin, Bakken
Shale, Marcellus Shale, Powder River Basin, San Juan Basin
and, through our ownership of Apco, Colombia and Argentina. A
map of our properties within these geographic areas and our
other properties can be found on the inside cover of this
prospectus.
Piceance
Basin
We entered the Piceance Basin in May 2001 with the acquisition
of Barrett Resources and since that time have grown to become
the largest natural gas producer in Colorado. Our Piceance Basin
properties currently comprise our largest area of concentrated
development drilling.
For the month of April 2011, we had an average 734 MMcfe/d
of net production from our Piceance Basin properties.
Approximately 22 million gallons of NGLs are currently
recovered each month from our Piceance Basin properties. A large
majority of our natural gas production in this basin currently
is gathered through a system owned by Williams Partners and
delivered to markets through a number of interstate pipelines.
See “Other Related Party Transactions—Gathering,
Processing and Treating Contracts.” As of December 31,
2010, our properties in the Piceance Basin included:
|
|
|
| |
•
|
211,000 total net acres, including 108,165 undeveloped net acres;
|
| |
| |
•
|
2,927 Bcfe of estimated net proved reserves;
|
| |
| |
•
|
3,587 net producing wells; and
|
| |
| |
•
|
1,596 undrilled proved drilling locations and 10,708 total
undrilled locations.
|
During 2010, we operated an average of 11 drilling rigs in the
basin, including nine in the Piceance Valley and two in the
Piceance Highlands. As of April 30, 2011 we were operating
11 rigs and have an average of 11 rigs budgeted for 2011. We
have allocated approximately $575 million in capital
expenditures to drill 376 gross wells on our Piceance Basin
properties in 2011.
The Piceance Basin is located in northwestern Colorado. Our
operations in the basin are divided into two areas: the Piceance
Valley and the Piceance Highlands. Our Piceance Valley area
includes operations along the Colorado River valley and is the
more developed area where we have produced consistent,
repeatable results. The Piceance Highlands, which are those
areas at higher elevations above the river valley, contain vast
development opportunities that position us well for growth in
the future as infrastructure expands and efficiency
80
improvements continue. Our development activities in the basin
are primarily focused on the Williams Fork section within the
Mesaverde formation. The Williams Fork can be over
2,000 feet in thickness and is comprised of several tight,
interbedded, lenticular sandstone lenses encountered at depths
ranging from 7,000 to 13,000 feet. In order to maximize
producing rates and recovery of natural gas reserves we must
hydraulically fracture the well using a fluid system comprised
of 99 percent water and sand. Advancements in completion
technology, including the use of microseismic data have enabled
us to more effectively stimulate the reservoir and recover a
greater percentage of the natural gas in place. We are currently
evaluating deeper horizons such as the Mancos and Niobrara shale
formations, which have the potential to provide additional
development opportunities.
Initial development of the Piceance Basin was limited to
conventional drilling and completion techniques. In response to
the unique challenges posed by the geology of this area, we
collaborated with our drilling contractors to build
“fit-for-purpose”
type drilling rigs, and beginning in 2005, were the first
operator to introduce these types of drilling rigs to the
Piceance Basin. Utilizing advancements in drilling technology
and several innovative modifications, these special purpose rigs
are capable of drilling 22 wells from a single well pad,
drilling faster and extending the directional length of our
wells, and can accommodate completion and production activities
simultaneously. In addition to reducing surface impacts, these
rigs are quieter, safer to operate, and have allowed us to
significantly reduce cycle times from spud to spud and getting
our gas to market. We have pioneered several other innovative
practices such as green completions, which essentially eliminate
gas flaring and emissions during completion operations, and
using a “clustered” plan of development approach
taking advantage of centralized facilities, as well as allowing
us to fracture stimulate wells from over two miles away from the
pumping equipment. In addition, all of our producing wells and
associated facilities are fully automated and utilize our
state-of-the
art telemetry system, which provides our well technicians with
real time data to ensure we are optimizing well performance. Our
innovative approaches to drilling in the Piceance Basin have
earned us positive state and federal recognition.
Bakken
Shale
In December 2010 we acquired approximately 85,800 net acres
in the Williston Basin. All of our properties in the Williston
Basin are on the Fort Berthold Indian Reservation in North
Dakota, where we will be the primary operator. Based on our
geologic interpretation of the Bakken formation, the evolution
of completion techniques, our own drilling results as well as
the publicly available drilling results for other operators in
the basin, we believe that a substantial portion of our
Williston Basin acreage is prospective in the Bakken formation,
the primary target for all of the well locations in our current
drilling inventory.
For the month of April 2011, we had an average of 4.3 Mboe/d of
net production from our Bakken Shale wells. As of
December 31, 2010, our properties in the Bakken Shale
included:
|
|
|
| |
•
|
89,420 total net acres, including 75,937 undeveloped net acres;
|
|
|
|
| |
•
|
23 MMboe of estimated net proved reserves; and
|
| |
| |
•
|
13 net producing wells.
|
As of April 30, 2011 we were operating three rigs and plan
to add an additional two rigs during 2011. We have allocated
approximately $260 million in capital expenditures to drill
41 gross wells on our Bakken Shale properties in 2011.
We plan to develop oil reserves through horizontal drilling from
both the Middle Bakken and Upper Three Forks shale oil
formations utilizing drilling and completion expertise gained in
part through experience in our other basins. Based on our
subsurface geological analysis, we believe that our position
lies in the area of the basin’s greatest potential recovery
for Bakken formation oil. Currently our Bakken Shale development
has the highest incremental returns of any of our drilling
programs.
The Williston Basin is spread across North Dakota, South Dakota,
Montana and parts of southern Canada, covering approximately
202,000 square miles, of which 143,000 square miles
are in the United States. The basin produces oil and natural gas
from numerous producing horizons including the Bakken, Three
Forks, Madison and Red River formations. A report issued by the
U.S. Geological Survey in April 2008 classified the
81
Bakken formation as the largest continuous oil accumulation
ever assessed by it in the contiguous United States.
The Devonian-age Bakken formation is found within the
Williston Basin underlying portions of North Dakota and Montana
and is comprised of three lithologic members referred to as the
Upper, Middle and Lower Bakken shales. The formation ranges up
to 150 feet thick and is a continuous and structurally
simple reservoir. The upper and lower shales are highly organic,
thermally mature and over pressured and can act as both a source
and reservoir for the oil. The Middle Bakken, which varies in
composition from a silty dolomite to shaly limestone or sand,
serves as the productive formation and is a critical reservoir
for commercial production. Generally, the Bakken formation is
found at vertical depths of 8,500 to 11,500 feet.
The Three Forks formation, generally found immediately under the
Bakken formation, has also proven to contain productive
reservoir rock that may add incremental reserves to our existing
leasehold positions. The Three Forks formation typically
consists of interbedded dolomites and shale with local
development of a discontinuous sandy member at the top, known as
the Sanish sand. The Three Forks formation is an unconventional
carbonate play. Similar to the Bakken formation, the Three Forks
formation has recently been exploited utilizing the same
horizontal drilling and advanced completion techniques as the
Bakken development. Drilling in the Three Forks formation began
in mid-2008 and a number of operators are currently drilling
wells targeting this formation. Based on our geologic
interpretation of the Three Forks formation and the evolution of
completion techniques, we believe that most of our Williston
Basin acreage is prospective in the Three Forks formation. We
are in the process of completing a well drilled in the Three
Forks formation.
Our Middle Bakken development is expected to be comparable to
other established operators in the area. For our typical well
drilled in the Middle Bakken formation, we expect the initial
30 day production rates to be in the range of 750 Boe/d to
1,100 Boe/d, drilling capital to be in the $8 million to
$9 million range and reserve estimates to be from 650 to
850 Mbbls, depending on the area.
Our acreage in the Bakken Shale, as well as a portion of our
acreage in the Piceance Basin and Powder River Basin, is leased
to us by or with the approval of the federal government or its
agencies, and is subject to federal authority, NEPA, the Bureau
of Indian Affairs or other regulatory regimes that require
governmental agencies to evaluate the potential environmental
impacts of a proposed project on government owned lands. These
regulatory regimes impose obligations on the federal government
and governmental agencies that may result in legal challenges
and potentially lengthy delays in obtaining project permits or
approvals and could result in certain instances in the
cancellation of existing leases.
Marcellus
Shale
Our Marcellus Shale acreage is located in four principal areas
of the play within Pennsylvania: the northeast portion of the
play in and near Susquehanna County; the southwest in and around
Westmoreland County; centrally in Clearfield and Centre Counties
and the east in Columbia County. We have continued to expand our
position since our entry into the Marcellus Shale in 2009, both
organically and through third-party acquisitions. We are the
primary operator on our acreage for all four areas and plan to
develop our acreage using horizontal drilling and completion
expertise in part gained through operations in our other basins.
Our most established area is in Westmoreland County but in the
future we expect our most significant drilling area to be in
Susquehanna County. A third party gathering system providing the
main trunkline out of the area is expected to go into service in
the third quarter of 2011.
For the month of April 2011, we had an average of
seven MMcfe/d of net production from our Marcellus Shale
properties. As of December 31, 2010, our properties in the
Marcellus Shale included:
|
|
|
| |
•
|
99,301 total net acres, including 98,387 undeveloped net acres;
|
| |
| |
•
|
28 Bcfe of estimated net proved reserves; and
|
| |
| |
•
|
Six net producing wells.
|
82
As of April 30, 2011 we were operating five rigs and have
an average of five rigs budgeted for 2011. We have allocated
approximately $170 million in capital expenditures to drill
62 gross wells on our Marcellus Shale properties in 2011.
The Marcellus Shale formation is the most expansive shale gas
play in the United States, spanning six states in the
northeastern United States. The Marcellus Shale is a black,
organic rich shale formation located at depths between 4,000 and
8,500 feet, covering approximately 95,000 square miles
at an average net thickness of 50 feet to 300 feet.
The first commercial well in the Marcellus Shale was drilled and
completed in 2005 in Pennsylvania. Since the beginning of 2005,
there have been 6,963 wells permitted in Pennsylvania in
the Marcellus Shale and 3,030 of the approved wells have been
drilled. In 2010, 1,386 wells were drilled in the Marcellus
Shale, making it one of the most active and prominent shale gas
plays in the United States, and active, widespread drilling in
this area is expected to continue. During 2010, there were more
than 80 operators active in the play.
Powder
River Basin
We own a large position in coal bed methane reserves in the
Powder River Basin and together with our co-developer, Lance Oil
& Gas Company Inc., control 950,982 acres, of which
our ownership represents 425,550 net acres. We share
operations with our co-developer and both companies have
extensive experience producing from coal formations in the
Powder River Basin dating from its earliest commercial growth in
the late 1990s. The natural gas produced is gathered by a system
owned by our co-developer.
For the month of April 2011, we had an average of
221 MMcfe/d of net production from our Powder River Basin
properties. As of December 31, 2010, our properties in the
Powder River Basin included:
|
|
|
| |
•
|
425,550 total net acres, including 175,371 undeveloped net acres;
|
| |
| |
•
|
348 Bcfe of estimated net proved reserves; and
|
|
|
|
| |
•
|
2,884 net producing wells.
|
We have allocated approximately $70 million in capital
expenditures to drill 411 gross wells on our Powder River
Basin properties in 2011. We plan to drill 80 operated wells,
participate in 253 wells drilled by our joint venture
partner and participate in the drilling of 78 wells drilled
by others in 2011.
Our Powder River Basin properties are located in northeastern
Wyoming. Our development operations in this basin are focused on
coal bed methane plays in the Big George and Wyodak project
areas. Initially, coal bed methane wells typically produce water
in a process called dewatering. This process lowers pressure,
allowing the natural gas to flow to the wellbore. As the coal
seam pressure declines, the wells begin producing methane gas at
an increasing rate. As the wells mature, the production peaks,
stabilizes and then begins declining. The average life of a coal
bed methane well in the Powder River Basin ranges from five to
15 years. While these wells generally produce at much lower
rates with fewer reserves attributed to them when compared to
conventional natural gas wells in the Rocky Mountains, they also
typically have higher drilling success rates and lower capital
costs.
The coal seams that we target in the Powder River Basin have
been extensively mapped as a result of a variety of natural
resource development projects that have occurred in the region.
Industry data from over 25,000 wellbores drilled through
the Ft. Union coal formation allows us to determine
critical data such as the aerial extent, thickness, gas
saturation, formation pressure and relative permeability of the
coal seams we target for development, which we believe
significantly reduces our dry hole risk.
San Juan
Basin
We acquired our San Juan Basin properties in 1985. These
properties represented the first major area of natural gas
exploration and development activities for Williams following
its acquisition of Northwest Energy in 1982. Our San Juan
Basin properties include holdings across the basin producing
primarily from the Mesa Verde, Fruitland Coal and Mancos shale
gas formations. We operate two units in New Mexico (Rosa and Cox
83
Canyon) as well as several
non-unit
properties, and we operate in three major areas of Colorado
(Northwest Cedar Hills, Ignacio and Bondad). We also own
properties operated by other operators in New Mexico and
Colorado. Approximately 60 percent of our net San Juan
Basin production comes from our operated properties.
For the month of April 2011, we had an average
134 MMcfe/d of net production from our San Juan Basin
properties. As of December 31, 2010, our properties in the
San Juan Basin included:
|
|
|
| |
•
|
120,998 total net acres, including 1,576 undeveloped net acres;
|
| |
| |
•
|
554 Bcfe of estimated net proved reserves; and
|
|
|
|
| |
•
|
880 net producing wells.
|
We have allocated approximately $40 million in capital
expenditures to drill 51 gross wells on our San Juan
Basin properties in 2011. We plan to drill 16 operated wells in
2011 and participate in the drilling of 35 wells operated
by our partners in 2011.
According to a September 2010 Wood Mackenzie report, the
San Juan Basin is one of the oldest and most prolific coal
bed methane plays in the world. This report states that
production from the San Juan Basin in 2010 was expected to
average 3.5 Bcfe/d with approximately 60 percent of
net gas production derived from the Fruitland coal bed. The
Fruitland coal bed extends to depths of approximately 4,200 ft
with net thickness ranging from zero to 100 feet. The Mesa
Verde play is the top producing tight gas play in the basin with
total thickness ranging from 500 to 2,500 feet. The Mesa
Verde is underlain by the upper Mancos Shale and overlain by the
Lewis Shale.
Apco
We hold an approximate 69 percent controlling equity
interest in Apco. Apco in turn owns interests in several blocks
in Argentina, including concessions in the Neuquén,
Austral, Northwest and San Jorge Basins, and in 3
exploration permits in Colombia, with its primary properties
consisting of the Neuquén and Austral Basin concessions.
Apco’s oil and gas reserves are approximately
57 percent oil, 39 percent natural gas and four
percent liquefied petroleum gas. For the month of
April 2011, Apco had an average of 12.2 Mboe/d of net
production. As of December 31, 2010, Apco’s properties
included:
|
|
|
| |
•
|
586,288 total net acres, including 556,661 undeveloped net acres;
|
| |
| |
•
|
45.9 MMboe of estimated net proved reserves; and
|
| |
| |
•
|
322 net producing wells.
|
Apco intends to participate in the drilling of 37 wells
operated by its partners in 2011 of which Apco has allocated,
for its direct ownership interest, approximately
$30 million in capital expenditures.
The government of Argentina has implemented price control
mechanisms over the sale of natural gas and over gasoline prices
in the country. As a result of these controls and other actions
by the Argentine government, sales price realizations for
natural gas and oil sold in Argentina are generally below
international market levels and are significantly influenced by
Argentine governmental actions.
Neuquén Basin. Apco participates in a
joint venture partnership with Petrolera and Petrobras Argentina
S.A. for the exploration and development of the Entre Lomas oil
and gas concession in the provinces of Río Negro and
Neuquén in southwest Argentina. In 2007, the partners
created two new joint ventures consisting of the same partners
with the same interests in order to expand operations into two
areas adjacent to Entre Lomas, the Agua Amarga exploration
permit in the province of Río Negro, and the Bajada del
Palo concession in the province of Neuquén. In 2009, a
portion of the Agua Amarga permit was converted to a
25-year
exploitation concession called Charco del Palenque.
The Entre Lomas concession covers a surface area of
approximately 183,000 acres and produces oil and gas from
seven fields, the largest of which is Charco Bayo/Piedras
Blancas. The Entre Lomas concession has a primary term of
25 years that expires in the year 2016 with an option to
extend for an additional ten-year
84
period based on terms to be agreed with the government. The
Bajada del Palo concession has a total surface area of
approximately 111,000 acres. In 2009, the Bajada del Palo
concession term was extended to September 2025.
The Agua Amarga exploration area was awarded to Petrolera by the
province of Río Negro in 2007. The property has a total
surface area of approximately 95,000 acres and is located
immediately to the southeast of the Entre Lomas concession. The
first exploration period was scheduled to end in May 2010 and
was extended for one year until May 2011. The completion of
Apco’s work commitments and additional activities executed
in the area has enabled Apco to request an additional one-year
extension. If granted, the first exploration period would end on
May 2012. In 2009, a portion of the Agua Amarga area covering
approximately 18,000 acres was converted to an exploitation
concession called Charco del Palenque with a
25-year term
and a five-year optional extension period.
Austral Basin Properties. Apco holds a
25.78 percent non-operated interest in a joint venture
engaged in exploration and production activities in three
concessions located on the island of Tierra del Fuego, which we
refer to as the “TDF concessions.” The operator of the
TDF concessions is ROCH S.A., a privately owned Argentine oil
and gas company. The TDF concessions cover a total surface area
of approximately 467,000 gross acres, or 120,000 acres
net to Apco. Each of the concessions extends three kilometers
offshore with their eastern boundaries paralleling the
coastline. The most developed of the three concessions is the
Las Violetas concession which is the largest onshore concession
on the Argentine side of the island of Tierra del Fuego. The
concessions have terms of 25 years that expire in 2016 with
an option to extend the concessions for an additional ten-year
period based on terms to be agreed with the government.
Northwest Basin Properties. Apco holds a
1.5 percent non-operated interest in the Acambuco
concession located in the province of Salta in northwest
Argentina on the border with Bolivia. The concession covers an
area of 294,000 acres, and is one of the largest gas
producing concessions in Argentina. Wells drilled to the
Huamampampa formation in the Acambuco concession have generally
required one year to drill with total costs for drilling and
completion ranging from $50 to $70 million.
San Jorge Basin Properties. In the
San Jorge Basin, Apco’s areas are more prospective and
exploratory in nature. In the Sur Río Deseado Este
concession in the province of Santa Cruz, Apco has a
16.94 percent working interest in an exploitation area with
limited oil production and an 88 percent working interest
in an exploratory area in the northern sector of the concession.
Apco sold its interest in the Cañadón Ramirez
concession at the end of 2010.
Other
Properties
Our other holdings are comprised of assets in the Barnett Shale
located in north central Texas, gas reserves in the Green River
Basin of southwest Wyoming, interests in the Arkoma Basin in
southeastern Oklahoma and additional international assets in
northwest Argentina that are not part of Apco’s holdings.
For the month of April 2011, we had an average of
73 MMcfe/d of net production from continuing operations
from our other properties. As of December 31, 2010, our
other properties included:
|
|
|
| |
•
|
327,390 total net acres, including 245,497 undeveloped net acres;
|
| |
| |
•
|
290 Bcfe of estimated net proved reserves; and
|
| |
| |
•
|
532 net producing wells.
|
As of April 30, 2011 we were operating one rig on our other
properties. We have allocated approximately $85 million in
capital expenditures to drill 94 gross wells on our other
properties in 2011.
Our Barnett Shale properties produce predominately natural gas
from horizontal wells, where we are the primary operator and
have drilled more than 200 wells. Our Arkoma Basin
properties include 441 gross wells producing gas from coal
and shale formations. We have initiated a process to seek offers
to sell our Arkoma Basin properties, which include approximately
104,000 net acres, including approximately 48,000
undeveloped net acres. Such properties were classified as held
for sale and reported as discontinued operations as of March
85
31, 2011, comprised less than one percent of our assets and are
not included in our average daily net production amount for the
month of April 2011.
Reserves
and Production Information
We have significant oil and gas producing activities primarily
in the Rocky Mountain, northeast and Mid-continent areas of the
United States. Additionally, we have international oil and gas
producing activities, primarily in Argentina. Proved reserves
and revenues related to international activities are
approximately five percent and three percent, respectively, of
our total international and domestic proved reserves and
revenues from producing activities. Accordingly, unless
specifically stated otherwise, the information in the remainder
of this “Business” section relates only to the oil and
gas activities in the United States.
Oil and
Gas Reserves
The following table outlines our estimated net proved reserves
expressed on a gas equivalent basis for the reporting periods
December 31, 2010, 2009 and 2008. We prepare our own
reserves estimates and the majority of our reserves are audited
by NSAI and M&L. Proved reserves information is reported as
gas equivalents, since oil volumes are insignificant in the
three years shown below. Reserves for 2010 are approximately
97 percent natural gas. Reserves are more than
99 percent natural gas for 2009 and 2008. Oil reserves
increased to approximately three percent of total proved
reserves in 2010 as a result of a fourth quarter acquisition of
properties in the Bakken Shale.
Summary of oil and gas reserves:
| |
|
|
|
|
|
|
|
|
|
|
|
|
|
|
|
December 31,
|
|
|
|
|
2010
|
|
|
2009
|
|
|
2008
|
|
|
|
|
(Bcfe)(1)
|
|
|
|
|
Proved developed reserves
|
|
|
2,498
|
|
|
|
2,387
|
|
|
|
2,456
|
|
|
Proved undeveloped reserves
|
|
|
1,774
|
|
|
|
1,868
|
|
|
|
1,883
|
|
|
|
|
|
|
|
|
|
|
|
|
|
|
|
|
Total proved reserves
|
|
|
4,272
|
|
|
|
4,255
|
|
|
|
4,339
|
|
|
|
|
|
|
|
|
|
|
|
|
|
|
|
|
|
|
|
(1) |
|
Gas equivalents are calculated using a ratio of six thousand
cubic feet of natural gas to one barrel of oil. |
| |
|
|
|
|
|
|
|
Estimated Net
|
|
|
|
|
Proved Reserves
|
|
|
Basin / Shale
|
|
December 31, 2010
|
|
|
|
|
(Bcfe)
|
|
|
|
|
Piceance Basin
|
|
|
2,927
|
|
|
Bakken Shale
|
|
|
136
|
|
|
Marcellus Shale
|
|
|
28
|
|
|
Powder River Basin
|
|
|
348
|
|
|
San Juan Basin
|
|
|
554
|
|
|
Other(1)
|
|
|
279
|
|
|
|
|
|
|
|
|
Total(2)
|
|
|
4,272
|
|
|
|
|
|
|
|
|
|
|
|
(1) |
|
Other includes Barnett Shale, Arkoma and Green River Basins and
miscellaneous smaller properties. |
| |
|
(2) |
|
Of our total 4,272 Bcfe of net proved reserves as of
December 31, 2010, three percent are oil. |
We have not filed on a recurring basis estimates of our total
proved net oil and gas reserves with any U.S. regulatory
authority or agency other than with the DOE and the SEC. The
estimates furnished to the DOE have been consistent with those
furnished to the SEC.
Our 2010 year-end estimated proved reserves were derived
using an average price of $3.51 per Mcf, which is the
12-month
average,
first-of-the-month
price for the applicable indices for each basin as adjusted
86
for locational price differentials. During 2010, we added
508 Bcfe of net additions to our proved reserves through
drilling 1,162 gross wells at a capital cost of
approximately $988 million.
Reserves
estimation process
Our reserves are estimated by deterministic methods using an
appropriate combination of production performance analysis and
volumetric techniques. The proved reserves for economic
undrilled locations are estimated by analogy or volumetrically
from offset developed locations. Reservoir continuity and
lateral persistence of our tight-sands, shale and coal bed
methane reservoirs is established by combinations of subsurface
analysis and analysis of 2D and 3D seismic data and pressure
data. Understanding reservoir quality may be augmented by core
samples analysis.
The engineering staff of each basin asset team provides the
reserves modeling and forecasts for their respective areas.
Various departments also participate in the preparation of the
year-end reserves estimate by providing supporting information
such as pricing, capital costs, expenses, ownership, gas
gathering and gas quality. The departments and their roles in
the year-end reserves process are coordinated by our reserves
analysis department. The reserves analysis department’s
responsibilities also include performing an internal review of
reserves data for reasonableness and accuracy, working with the
third-party consultants and the asset teams to successfully
complete the third-party reserves audit, finalizing the year-end
reserves report and reporting reserves data to accounting.
The preparation of our year-end reserves report is a formal
process. Early in the year, we begin with a review of the
existing internal processes and controls to identify where
improvements can be made from the prior year’s reporting
cycle. Later in the year, the reserves staffs from the asset
teams submit their preliminary reserves data to the reserves
analysis department. After review by the reserves analysis
department, the data is submitted to our third party engineering
consultants, NSAI and M&L, to begin their audits. After
this point, reserves data analysis and further review are
conducted and iterated between the asset teams, reserves
analysis department and our third party engineering consultants.
In early December, reserves are reviewed with senior management.
The process concludes when all parties agree upon the reserve
estimates and audit tolerance is achieved.
The reserves estimates resulting from our process are subjected
to both internal and external controls to promote transparency
and accuracy of the year-end reserves estimates. Our internal
reserves analysis team is independent and does not work within
an asset team or report directly to anyone on an asset team. The
reserves analysis department provides detailed independent
review and extensive documentation of the year-end process. Our
internal processes and controls, as they relate to the year-end
reserves, are reviewed and updated. The compensation of our
reserves analysis team is not linked to reserves additions or
revisions.
Approximately 93 percent of our total year-end 2010
domestic proved reserves estimates were audited by NSAI. When
compared on a
well-by-well
basis, some of our estimates are greater and some are less than
the
NSAI is satisfied with our methods and procedures in preparing
the December 31, 2010 reserves estimates and future
revenue, and noted nothing of an unusual nature that would cause
NSAI to take exception with the estimates, in the aggregate, as
prepared by us.
In addition, reserves estimates related to properties associated
with the former Williams Coal Seam Gas Royalty Trust were
audited by M&L. These properties represent approximately
one percent of our total domestic proved reserves estimates. The
Williams Coal Seam Gas Royalty Trust terminated effective
March 1, 2010 and we purchased all the remaining properties
from the trust in October 2010.
The technical person primarily responsible for overseeing
preparation of the reserves estimates and the third party
reserves audit is the Director of Reserves and Production
Services. The Director’s qualifications include
28 years of reserves evaluation experience, a B.S. in
geology from the University of Texas at Austin, an M.S. in
Physical Sciences from the University of Houston and membership
in the American Association of Petroleum Geologists and The
Society of Petroleum Engineers.
87
Proved
undeveloped reserves
The majority of our reserves is concentrated in unconventional
tight-sands, shale and coal bed gas reservoirs. We use available
geoscience and engineering data to establish drainage areas and
reservoir continuity beyond one direct offset from a producing
well, which provides additional proved undeveloped reserves.
Inherent in the methodology is a requirement for significant
well density of economically producing wells to establish
reasonable certainty. In fields where producing wells are less
concentrated, only direct offsets from proved producing wells
were assigned the proved undeveloped reserves classification. No
new technologies were used to assign proved undeveloped reserves.
At December 31, 2010, our proved undeveloped reserves were
1,774 Bcfe, a decrease of 94 Bcfe over our
December 31, 2009 proved undeveloped reserves estimate of
1,868 Bcfe. During 2010, 280 Bcfe of our
December 31, 2009 proved undeveloped reserves were
converted to proved developed reserves at a cost of
$633 million. An additional 129 Bcfe was added due to
the development of unproved locations. As of 2010 year-end,
we have reclassified a net 253 Bcfe from proved to probable
reserves attributable to locations not expected to be developed
within five years. These reclassified reserves are predominately
in the Piceance Basin where we have a large inventory of
drilling locations and have been offset by the addition of
342 Bcfe of new proved undeveloped drilling locations.
All proved undeveloped locations are scheduled to be spud within
the next five years. Based on current projections, we expect to
add additional rigs in 2013 in the Piceance Basin. Our
undeveloped estimate contains 91 Bcfe of aging proved
undeveloped reserves, or those reserves which are approaching
the five-year limit before being reclassified to probable
reserves. The majority of these are scheduled to be spud by
year-end 2011.
Oil and
Gas Properties and Production, Production Prices and Production
Costs
The following table summarizes our net production for the years
indicated.
| |
|
|
|
|
|
|
|
|
|
|
|
|
|
|
|
Year Ended December 31,
|
|
|
|
|
2010
|
|
|
2009
|
|
|
2008
|
|
|
|
|
Production Data:
|
|
|
|
|
|
|
|
|
|
|
|
|
|
Natural Gas (MMcf)
|
|
|
|
|
|
|
|
|
|
|
|
|
|
U.S.
|
|
|
|
|
|
|
|
|
|
|
|
|
|
Piceance Basin
|
|
|
245,895
|
|
|
|
254,617
|
|
|
|
237,675
|
|
|
Other(1)
|
|
|
158,040
|
|
|
|
167,678
|
|
|
|
153,206
|
|
|
Argentina(2)
|
|
|
7,304
|
|
|
|
7,728
|
|
|
|
6,392
|
|
|
|
|
|
|
|
|
|
|
|
|
|
|
|
|
Total
|
|
|
411,239
|
|
|
|
430,023
|
|
|
|
397,273
|
|
|
Oil (MBbls)
|
|
|
|
|
|
|
|
|
|
|
|
|
|
U.S.
|
|
|
859
|
|
|
|
803
|
|
|
|
731
|
|
|
Argentina(2)
|
|
|
2,035
|
|
|
|
1,998
|
|
|
|
1,991
|
|
|
|
|
|
|
|
|
|
|
|
|
|
|
|
|
Total
|
|
|
2,894
|
|
|
|
2,801
|
|
|
|
2,722
|
|
|
Combined Equivalent Volumes (MMcfe)(2)
|
|
|
428,603
|
|
|
|
446,829
|
|
|
|
413,605
|
|
|
Combined Equivalent Volumes (MBoe)
|
|
|
71,434
|
|
|
|
74,472
|
|
|
|
68,394
|
|
|
Average Daily Combined Equivalent Volumes (MMcfe/d)
|
|
|
|
|
|
|
|
|
|
|
|
|
|
U.S.
|
|
|
|
|
|
|
|
|
|
|
|
|
|
Piceance Basin
|
|
|
674
|
|
|
|
698
|
|
|
|
649
|
|
|
Other(1)
|
|
|
447
|
|
|
|
472
|
|
|
|
431
|
|
|
Argentina(2)
|
|
|
53
|
|
|
|
54
|
|
|
|
50
|
|
|
|
|
|
|
|
|
|
|
|
|
|
|
|
|
Total
|
|
|
1,174
|
|
|
|
1,224
|
|
|
|
1,130
|
|
88
|
|
|
|
(1) |
|
Excludes production from our Arkoma Basin operations which were
classified as held for sale and reported as discontinued
operations as of March 31, 2011 and comprised less than one
percent of our total production. |
|
|
|
|
(2) |
|
Includes approximately 69 percent of Apco’s production
(which corresponds to our ownership interest in Apco) and other
minor directly held interests. |
The following tables summarize our domestic sales price and cost
information for the years indicated.
| |
|
|
|
|
|
|
|
|
|
|
|
|
|
|
|
Year Ended December 31,
|
|
|
|
|
2010
|
|
|
2009
|
|
|
2008
|
|
|
|
|
Realized average price per unit(1):
|
|
|
|
|
|
|
|
|
|
|
|
|
|
Natural gas, without hedges (per Mcf)(2)
|
|
$
|
4.33
|
|
|
$
|
3.41
|
|
|
$
|
6.94
|
|
|
Impact of hedges (per Mcf)(2)
|
|
|
0.82
|
|
|
|
1.45
|
|
|
|
0.10
|
|
|
|
|
|
|
|
|
|
|
|
|
|
|
|
|
Natural gas, with hedges (per Mcf)(2)
|
|
$
|
5.15
|
|
|
$
|
4.86
|
|
|
$
|
7.04
|
|
|
|
|
|
|
|
|
|
|
|
|
|
|
|
|
Oil, without hedges (per Bbl)
|
|
$
|
66.17
|
|
|
$
|
44.92
|
|
|
$
|
84.63
|
|
|
Impact of hedges (per Bbl)
|
|
|
—
|
|
|
|
—
|
|
|
|
—
|
|
|
|
|
|
|
|
|
|
|
|
|
|
|
|
|
Oil, with hedges (per Bbl)
|
|
$
|
66.17
|
|
|
$
|
44.92
|
|
|
$
|
84.63
|
|
|
|
|
|
|
|
|
|
|
|
|
|
|
|
|
Price per Boe, without hedges(3)
|
|
$
|
26.44
|
|
|
$
|
20.71
|
|
|
$
|
42.14
|
|
|
|
|
|
|
|
|
|
|
|
|
|
|
|
|
Price per Boe, with hedges(3)
|
|
$
|
31.32
|
|
|
$
|
29.36
|
|
|
$
|
42.66
|
|
|
|
|
|
|
|
|
|
|
|
|
|
|
|
|
Price per Mcfe, without hedges(3)
|
|
$
|
4.41
|
|
|
$
|
3.45
|
|
|
$
|
7.02
|
|
|
|
|
|
|
|
|
|
|
|
|
|
|
|
|
Price per Mcfe, with hedges(3)
|
|
$
|
5.22
|
|
|
$
|
4.89
|
|
|
$
|
7.11
|
|
|
|
|
|
|
|
|
|
|
|
|
|
|
|
|
|
|
|
(1) |
|
Excludes our Arkoma Basin operations, which were classified as
held for sale and reported as discontinued operations as of
March 31, 2011 and comprised less than one percent of our
total revenues. |
|
|
|
|
(3) |
|
Realized average prices reflect realized market prices, net of
fuel and shrink. |
| |
|
|
|
|
|
|
|
|
|
|
|
|
|
|
|
Year Ended December 31,
|
|
|
|
|
2010
|
|
|
2009
|
|
|
2008
|
|
|
|
|
Expenses per Mcfe(1):
|
|
|
|
|
|
|
|
|
|
|
|
|
|
Operating expenses:
|
|
|
|
|
|
|
|
|
|
|
|
|
|
Lifting costs and workovers
|
|
$
|
0.46
|
|
|
$
|
0.39
|
|
|
$
|
0.45
|
|
|
Facilities operating expense
|
|
|
0.14
|
|
|
|
0.14
|
|
|
|
0.15
|
|
|
Other operating and maintenance
|
|
|
0.05
|
|
|
|
0.05
|
|
|
|
0.04
|
|
|
|
|
|
|
|
|
|
|
|
|
|
|
|
|
Total LOE
|
|
$
|
0.65
|
|
|
$
|
0.58
|
|
|
$
|
0.64
|
|
|
Gathering, processing and transportation charges
|
|
|
0.80
|
|
|
|
0.64
|
|
|
|
0.58
|
|
|
Taxes other than income
|
|
|
0.27
|
|
|
|
0.19
|
|
|
|
0.61
|
|
|
|
|
|
|
|
|
|
|
|
|
|
|
|
|
Production cost
|
|
$
|
1.72
|
|
|
$
|
1.41
|
|
|
$
|
1.83
|
|
|
|
|
|
|
|
|
|
|
|
|
|
|
|
|
General and administrative
|
|
$
|
0.60
|
|
|
$
|
0.57
|
|
|
$
|
0.61
|
|
|
Depreciation, depletion and amortization
|
|
$
|
2.10
|
|
|
$
|
2.04
|
|
|
$
|
1.83
|
|
|
|
|
|
(1) |
|
Excludes our Arkoma Basin operations, which were classified as
held for sale and reported as discontinued operations as of
March 31, 2011. |
89
Productive
Oil and Gas Wells
The table below summarizes 2010 productive wells by area.*
| |
|
|
|
|
|
|
|
|
|
|
|
|
|
|
|
|
|
|
|
Gas Wells
|
|
|
Gas Wells
|
|
|
Oil Wells
|
|
|
Oil Wells
|
|
|
|
|
(Gross)
|
|
|
(Net)
|
|
|
(Gross)
|
|
|
(Net)
|
|
|
|
|
Piceance Basin
|
|
|
3,923
|
|
|
|
3,587
|
|
|
|
—
|
|
|
|
—
|
|
|
Bakken Shale
|
|
|
—
|
|
|
|
—
|
|
|
|
19
|
|
|
|
13
|
|
|
Marcellus Shale
|
|
|
14
|
|
|
|
6
|
|
|
|
—
|
|
|
|
—
|
|
|
Powder River Basin
|
|
|
6,404
|
|
|
|
2,884
|
|
|
|
—
|
|
|
|
—
|
|
|
San Juan Basin
|
|
|
3,267
|
|
|
|
881
|
|
|
|
—
|
|
|
|
—
|
|
|
Other(1)
|
|
|
1,626
|
|
|
|
532
|
|
|
|
—
|
|
|
|
—
|
|
|
|
|
|
|
|
|
|
|
|
|
|
|
|
|
|
|
|
|
Total
|
|
|
15,234
|
|
|
|
7,890
|
|
|
|
19
|
|
|
|
13
|
|
|
|
|
|
|
|
|
|
|
|
|
|
|
|
|
|
|
|
|
|
|
|
* |
|
We use the term “gross” to refer to all wells or
acreage in which we have at least a partial working interest and
“net” to refer to our ownership represented by that
working interest. |
|
|
|
|
(1) |
|
Other includes Barnett Shale, Arkoma and Green River Basins and
miscellaneous smaller properties. Our Arkoma Basin operations
were classified as held for sale and reported as discontinued
operations as of March 31, 2011 and comprised less than one
percent of our assets. |
At December 31, 2010, there were 181 gross and
105 net producing wells with multiple completions.
Developed
and Undeveloped Acreage
The following table summarizes our leased acreage as of
December 31, 2010.
| |
|
|
|
|
|
|
|
|
|
|
|
|
|
|
|
|
|
|
|
|
|
|
|
|
|
|
|
Developed
|
|
|
Undeveloped
|
|
|
Total
|
|
|
|
|
Gross Acres
|
|
|
Net Acres
|
|
|
Gross Acres
|
|
|
Net Acres
|
|
|
Gross Acres
|
|
|
Net Acres
|
|
|
|
|
Piceance Basin
|
|
|
133,428
|
|
|
|
102,835
|
|
|
|
157,017
|
|
|
|
108,165
|
|
|
|
290,445
|
|
|
|
211,000
|
|
|
Bakken Shale
|
|
|
16,178
|
|
|
|
13,483
|
|
|
|
114,245
|
|
|
|
75,937
|
|
|
|
130,423
|
|
|
|
89,420
|
|
|
Marcellus Shale
|
|
|
1,828
|
|
|
|
914
|
|
|
|
108,023
|
|
|
|
98,387
|
|
|
|
109,851
|
|
|
|
99,301
|
|
|
Powder River Basin
|
|
|
551,113
|
|
|
|
250,179
|
|
|
|
399,869
|
|
|
|
175,371
|
|
|
|
950,982
|
|
|
|
425,550
|
|
|
San Juan Basin
|
|
|
237,587
|
|
|
|
119,422
|
|
|
|
2,100
|
|
|
|
1,576
|
|
|
|
239,687
|
|
|
|
120,998
|
|
|
Other(1)
|
|
|
149,414
|
|
|
|
81,731
|
|
|
|
326,778
|
|
|
|
241,254
|
|
|
|
476,191
|
|
|
|
322,986
|
|
|
|
|
|
|
|
|
|
|
|
|
|
|
|
|
|
|
|
|
|
|
|
|
|
|
|
|
Total
|
|
|
1,089,548
|
|
|
|
568,565
|
|
|
|
1,108,032
|
|
|
|
700,690
|
|
|
|
2,197,580
|
|
|
|
1,269,255
|
|
|
|
|
|
|
|
|
|
|
|
|
|
|
|
|
|
|
|
|
|
|
|
|
|
|
|
|
|
|
|
(1) |
|
Other includes Barnett Shale, Arkoma and Green River Basins,
other Williston Basin acreage and miscellaneous smaller
properties. Our Arkoma Basin operations were classified as held
for sale and reported as discontinued operations as of
March 31, 2011 and comprised less than one percent of our
assets. |
90
Drilling
and Exploratory Activities
We focus on lower-risk development drilling. Our development
drilling success rate was approximately 99 percent in each
of 2010, 2009 and 2008.
The following table summarizes domestic drilling activity by
number and type of well for the periods indicated.
| |
|
|
|
|
|
|
|
|
|
|
|
|
|
|
|
|
|
|
|
|
|
|
|
|
|
|
|
2010
|
|
|
2009
|
|
|
2008
|
|
|
|
|
|
|
|
Gross Wells
|
|
|
|
Net Wells
|
|
|
|
Gross Wells
|
|
|
|
Net Wells
|
|
|
|
Gross Wells
|
|
|
|
Net Wells
|
|
|
|
|
|
|
|
|
|
|
|
|
|
|
|
|
|
|
|
|
|
|
|
|
|
|
|
|
Piceance Basin
|
|
|
398
|
|
|
|
360
|
|
|
|
349
|
|
|
|
303
|
|
|
|
687
|
|
|
|
624
|
|
|
Bakken Shale
|
|
|
0
|
|
|
|
0
|
|
|
|
n/a
|
|
|
|
n/a
|
|
|
|
n/a
|
|
|
|
n/a
|
|
|
Marcellus Shale
|
|
|
8
|
|
|
|
3
|
|
|
|
8
|
|
|
|
4
|
|
|
|
n/a
|
|
|
|
n/a
|
|
|
Powder River Basin
|
|
|
531
|
|
|
|
242
|
|
|
|
233
|
|
|
|
95
|
|
|
|
702
|
|
|
|
324
|
|
|
San Juan Basin
|
|
|
43
|
|
|
|
15
|
|
|
|
77
|
|
|
|
39
|
|
|
|
95
|
|
|
|
37
|
|
|
Other
|
|
|
177
|
|
|
|
38
|
|
|
|
208
|
|
|
|
45
|
|
|
|
298
|
|
|
|
65
|
|
|
|
|
|
|
|
|
|
|
|
|
|
|
|
|
|
|
|
|
|
|
|
|
|
|
|
|
Productive, development
|
|
|
1,157
|
|
|
|
658
|
|
|
|
875
|
|
|
|
486
|
|
|
|
1,782
|
|
|
|
1,050
|
|
|
Productive, exploration
|
|
|
0
|
|
|
|
0
|
|
|
|
3
|
|
|
|
1
|
|
|
|
4
|
|
|
|
2
|
|
|
|
|
|
|
|
|
|
|
|
|
|
|
|
|
|
|
|
|
|
|
|
|
|
|
|
|
Total Productive
|
|
|
1,157
|
|
|
|
658
|
|
|
|
878
|
|
|
|
487
|
|
|
|
1,786
|
|
|
|
1,052
|
|
|
Dry, development
|
|
|
5
|
|
|
|
3
|
|
|
|
2
|
|
|
|
0
|
|
|
|
1
|
|
|
|
0
|
|
|
Dry, exploration
|
|
|
0
|
|
|
|
0
|
|
|
|
2
|
|
|
|
1
|
|
|
|
0
|
|
|
|
0
|
|
|
|
|
|
|
|
|
|
|
|
|
|
|
|
|
|
|
|
|
|
|
|
|
|
|
|
|
Total Drilled
|
|
|
1,162
|
|
|
|
661
|
|
|
|
882
|
|
|
|
488
|
|
|
|
1,787
|
|
|
|
1,052
|
|
|
|
|
|
|
|
|
|
|
|
|
|
|
|
|
|
|
|
|
|
|
|
|
|
|
|
|
|
|
|
(1) |
|
Other includes Barnett Shale, Arkoma and Green River Basins and
miscellaneous smaller properties. |
In 2010, we drilled five gross nonproductive development wells
and three net nonproductive development wells. Total gross
operated wells drilled were 656 in 2010, 472 in 2009 and 1,125
in 2008.
Present
Activities
At April 30, 2011, we had 35 gross (18 net) wells in
the process of being drilled.
Scheduled
Lease Expirations
Domestic. The table below sets forth, as of
May 31, 2011, the gross and net acres scheduled to expire over
the next several years. The acreage will not expire if we
are able to establish production by drilling wells on the lease
prior to the expiration date. We expect to hold substantially
all of the Bakken and Marcellus Shale acreage by drilling prior
to its expiration. We are working with the BLM to form a federal
unit to prevent a majority of the Piceance acreage shown in the
table below in 2011 and 2012 from expiring and believe that we
will be successful in these efforts. Approximately 83% of the
acreage shown in the table below as “Other” in 2011
through 2013 consists of our Arkoma Basin operations which are
currently held for sale.
| |
|
|
|
|
|
|
|
|
|
|
|
|
|
|
|
|
|
|
|
|
|
|
|
2011
|
|
|
2012
|
|
|
2013
|
|
|
2014 +
|
|
|
Total
|
|
|
|
|
Piceance Basin
|
|
|
22,456
|
|
|
|
4,279
|
|
|
|
5,828
|
|
|
|
2,950
|
|
|
|
35,513
|
|
|
Bakken Shale
|
|
|
280
|
|
|
|
17,048
|
|
|
|
57,715
|
|
|
|
3,868
|
|
|
|
78,911
|
|
|
Marcellus Shale
|
|
|
984
|
|
|
|
2,288
|
|
|
|
46,310
|
|
|
|
61,706
|
|
|
|
111,288
|
|
|
Powder River Basin
|
|
|
3,155
|
|
|
|
8,677
|
|
|
|
16,649
|
|
|
|
1,081
|
|
|
|
29,562
|
|
|
San Juan Basin
|
|
|
0
|
|
|
|
0
|
|
|
|
0
|
|
|
|
0
|
|
|
|
0
|
|
|
Other
|
|
|
50,778
|
|
|
|
11,957
|
|
|
|
8,559
|
|
|
|
81,015
|
|
|
|
152,309
|
|
|
|
|
|
|
|
|
|
|
|
|
|
|
|
|
|
|
|
|
|
|
|
|
Total (Gross Acres)
|
|
|
77,653
|
|
|
|
44,249
|
|
|
|
135,061
|
|
|
|
150,620
|
|
|
|
407,583
|
|
91
| |
|
|
|
|
|
|
|
|
|
|
|
|
|
|
|
|
|
|
|
|
|
|
|
2011
|
|
|
2012
|
|
|
2013
|
|
|
2014 +
|
|
|
Total
|
|
|
|
|
Piceance Basin
|
|
|
20,597
|
|
|
|
2,226
|
|
|
|
2,411
|
|
|
|
2,878
|
|
|
|
28,112
|
|
|
Bakken Shale
|
|
|
196
|
|
|
|
16,639
|
|
|
|
55,429
|
|
|
|
3,611
|
|
|
|
75,875
|
|
|
Marcellus Shale
|
|
|
905
|
|
|
|
1,764
|
|
|
|
32,181
|
|
|
|
51,067
|
|
|
|
85,917
|
|
|
Powder River Basin
|
|
|
1,290
|
|
|
|
2,800
|
|
|
|
8,236
|
|
|
|
547
|
|
|
|
12,873
|
|
|
San Juan Basin
|
|
|
0
|
|
|
|
0
|
|
|
|
0
|
|
|
|
0
|
|
|
|
0
|
|
|
Other
|
|
|
24,737
|
|
|
|
9,745
|
|
|
|
7,346
|
|
|
|
80,789
|
|
|
|
122,617
|
|
|
|
|
|
|
|
|
|
|
|
|
|
|
|
|
|
|
|
|
|
|
|
|
Total (Net Acres)
|
|
|
47,725
|
|
|
|
33,174
|
|
|
|
105,603
|
|
|
|
138,892
|
|
|
|
325,394
|
|
International. In general, all of our
concessions have expiration dates of either 2025 or 2026, except
for two concessions that expire beyond 2030 and four that expire
in 2015 and 2016. With respect to these four we are negotiating
ten year extensions for which we have contractual rights. These
four concessions represent approximately 169,000 acres net
to Apco or approximately 116,000 acres net to WPX based on
our 69% ownership in Apco. Our remaining properties in Argentina
and Colombia are all exploration permits or exploration
contracts that have much shorter terms and on which we have made
exploration investment commitments that must be completed. These
areas will expire in 2011 to 2013 unless discoveries are made.
There are opportunities to extend exploration terms for a year
with good technical justification. We can either declare the
portions of these blocks where we have made discoveries
commercial and convert that acreage to a concession or
exploitation acreage with a specified term for production of 25
to 35 years, or relinquish a portion or the balance of the
acreage if we are not willing to make further exploration
commitments.
Gas
Management
Our sales and marketing activities to date include the sale of
our natural gas and oil production, in addition to third party
purchases and subsequent sales to Williams Partners for fuel and
shrink gas. Following the completion of the spin-off of our
stock to Williams’ stockholders, we do not expect to
continue to provide fuel and shrink gas services to Williams
Partners’ midstream business on a long-term basis. Our
sales and marketing activities also include the management of
various natural gas related contracts such as transportation,
storage and related hedges. We also sell natural gas purchased
from working interest owners in operated wells and other area
third party producers. We primarily engage in these activities
to enhance the value received from the sale of our natural gas
and oil production. Revenues associated with the sale of our
production are recorded in oil and gas revenues. The revenues
and expenses related to other marketing activities are reported
on a gross basis as part of gas management revenues and costs
and expenses.
Delivery
Commitments
We hold a long-term obligation to deliver on a firm basis
200,000 MMBtu/d of natural gas to a buyer at the White
River Hub (Greasewood-Meeker, Colorado), which is the major
market hub exiting the Piceance Basin. The Piceance, being our
largest producing basin, generates ample production to fulfill
this obligation without risk of nonperformance during periods of
normal infrastructure and market operations. While the daily
volume of natural gas is large and represents a significant
percentage of our daily production, this transaction does not
represent a material exposure. This obligation expires in 2014.
Purchase
Commitments
In connection with a gathering agreement entered into by
Williams Partners with a third party in December 2010, we
concurrently agreed to buy up to 200,000 MMBtu/d of natural
gas at Transco Station 515 (Marcellus Shale) priced at market
prices from the same third party. Purchases under the
12-year
contract are expected to begin in the third quarter of 2011. We
expect to sell this natural gas in the open market and may
utilize available transportation capacity to facilitate the
sales.
92
Hedging
Activity
To manage the commodity price risk and volatility of owning
producing natural gas properties, we enter into derivative
contracts for a portion of our expected future production. See
further discussion in “Management’s Discussion and
Analysis of Financial Condition and Results of Operations.”
Customers
Oil and gas production is sold through our sales and marketing
activities to a variety of purchasers under various length
contracts ranging from one day to multi-year at market based
prices. Our third party customers include other producers,
utility companies, power generators, banks, marketing and
trading companies and midstream service providers. In 2010,
natural gas sales to BP Energy Company accounted for
approximately 13 percent of our revenues. We believe that
the loss of one or more of our current natural gas, oil or NGLs
purchasers would not have a material adverse effect on our
ability to sell our production, because any individual purchaser
could be readily replaced by another purchaser, absent a broad
market disruption.
Title to
Properties
Our title to properties is subject to royalty, overriding
royalty, carried, net profits, working and other similar
interests and contractual arrangements customary in the natural
gas and oil industry, to liens for current taxes not yet due and
to other encumbrances. In addition, leases on Native American
reservations are subject to Bureau of Indian Affairs and other
approvals unique to those locations. As is customary in the
industry in the case of undeveloped properties, a limited
investigation of record title is made at the time of
acquisition. Drilling title opinions are usually prepared before
commencement of drilling operations. We believe we have
satisfactory title to substantially all of our active properties
in accordance with standards generally accepted in the natural
gas and oil industry. Nevertheless, we are involved in title
disputes from time to time which can result in litigation and
delay or loss of our ability to realize the benefits of our
leases.
Seasonality
Generally, the demand for natural gas decreases during the
spring and fall months and increases during the winter months
and in some areas during the summer months. Seasonal anomalies
such as mild winters or hot summers can lessen or intensify this
fluctuation. Conversely, during extreme weather events such as
blizzards, hurricanes, or heat waves, pipeline systems can
become temporary constraints to supply meeting demand thus
amplifying localized price spikes. In addition, pipelines,
utilities, local distribution companies and industrial users
utilize natural gas storage facilities and purchase some of
their anticipated winter requirements during the warmer months.
This can lessen seasonal demand fluctuations. World weather and
resultant prices for liquefied natural gas can also affect
deliveries of competing liquefied natural gas into this country
from abroad, affecting the price of domestically produced
natural gas. In addition, adverse weather conditions can also
affect our production rates or otherwise disrupt our operations.
Competition
We compete with other oil and gas concerns, including major and
independent oil and gas companies in the development, production
and marketing of natural gas. We compete in areas such as
acquisition of oil and gas properties and obtaining necessary
equipment, supplies and services. We also compete in recruiting
and retaining skilled employees.
In our gas management services business, we compete directly
with large independent energy marketers, marketing affiliates of
regulated pipelines and utilities and natural gas producers. We
also compete with brokerage houses, energy hedge funds and other
energy-based companies offering similar services.
Environmental
Matters and Regulation
Our operations are subject to numerous federal, state, local,
Native American tribal and foreign laws and regulations
governing the discharge of materials into the environment or
otherwise relating to environmental
93
protection. Applicable U.S. federal environmental laws
include, but are not limited to, the Comprehensive Environmental
Response, Compensation and Liability Act (“CERCLA”),
the Clean Water Act (“CWA”) and the Clean Air Act
(“CAA”). These laws and regulations govern
environmental cleanup standards, require permits for air, water,
underground injection, solid and hazardous waste disposal and
set environmental compliance criteria. In addition, state and
local laws and regulations set forth specific standards for
drilling wells the maintenance of bonding requirements in order
to drill or operate wells, the spacing and location of wells,
the method of drilling and casing wells, the surface use and
restoration of properties upon which wells are drilled, the
plugging and abandoning of wells, and the prevention and cleanup
of pollutants and other matters. We maintain insurance against
costs of
clean-up
operations, but we are not fully insured against all such risks.
Additionally, Congress and federal and state agencies frequently
revise the environmental laws and regulations, and any changes
that result in delay or more stringent and costly permitting,
waste handling, disposal and
clean-up
requirements for the oil and gas industry could have a
significant impact on our operating costs. Although future
environmental obligations are not expected to have a material
impact on the results of our operations or financial condition,
there can be no assurance that future developments, such as
increasingly stringent environmental laws or enforcement
thereof, will not cause us to incur material environmental
liabilities or costs.
Public and regulatory scrutiny of the energy industry has
resulted in increased environmental regulation and enforcement
being either proposed or implemented. For example, in March
2010, EPA announced its National Enforcement Initiatives for
2011 to 2013, which includes the addition of “Energy
Extraction Activities” to its enforcement priorities list.
According to the EPA’s website, “some energy
extraction activities, such as new techniques for oil and gas
extraction and coal mining, pose a risk of pollution of air,
surface waters and ground waters if not properly
controlled.” To address these concerns, the EPA is
developing an initiative to ensure that energy extraction
activities are complying with federal environmental
requirements. This initiative will be focused on those areas of
the country where energy extraction activities are concentrated,
and the focus and nature of the enforcement activities will vary
with the type of activity and the related pollution problem
presented. This initiative could involve a large scale
investigation of our facilities and processes, and could lead to
potential enforcement actions, penalties or injunctive relief
against us.
Failure to comply with these laws and regulations may result in
the assessment of administrative, civil and criminal fines and
penalties and the imposition of injunctive relief. Accidental
releases or spills may occur in the course of our operations,
and we cannot assure you that we will not incur significant
costs and liabilities as a result of such releases or spills,
including any third-party claims for damage to property, natural
resources or persons. Although we believe that we are in
substantial compliance with applicable environmental laws and
regulations and that continued compliance with existing
requirements will not have a material adverse impact on us,
there can be no assurance that this will continue in the future.
The environmental laws and regulations that could have a
material impact on the oil and natural gas exploration and
production industry and our business are as follows:
Hazardous Substances and Wastes. CERCLA, also
known as the “Superfund law,” imposes liability,
without regard to fault or the legality of the original conduct,
on certain classes of persons that are considered to be
responsible for the release of a “hazardous substance”
into the environment. These persons include the owner or
operator of the disposal site or sites where the release
occurred and companies that transported or disposed or arranged
for the transport or disposal of the hazardous substances found
at the site. Persons who are or were responsible for releases of
hazardous substances under CERCLA may be subject to joint and
several liability for the costs of cleaning up the hazardous
substances that have been released into the environment and for
damages to natural resources, and it is not uncommon for
neighboring landowners and other third parties to file claims
for personal injury and property damage allegedly caused by the
hazardous substances released into the environment.
The Resource Conservation and Recovery Act (“RCRA”)
generally does not regulate wastes generated by the exploration
and production of natural gas and oil. The RCRA specifically
excludes from the definition of hazardous waste “drilling
fluids, produced waters and other wastes associated with the
exploration, development or production of crude oil, natural gas
or geothermal energy.” However, legislation has been
proposed in Congress from time to time that would reclassify
certain natural gas and oil exploration and production wastes as
“hazardous wastes,” which would make the reclassified
wastes subject to much more stringent handling, disposal and
clean-up
94
requirements. If such legislation were to be enacted, it could
have a significant impact on our operating costs, as well as the
natural gas and oil industry in general. An environmental
organization recently petitioned the EPA to reconsider certain
RCRA exemptions for exploration and production wastes. Moreover,
ordinary industrial wastes, such as paint wastes, waste
solvents, laboratory wastes and waste oils, may be regulated as
hazardous waste.
We own or lease, and have in the past owned or leased, onshore
properties that for many years have been used for or associated
with the exploration and production of natural gas and oil.
Although we have utilized operating and disposal practices that
were standard in the industry at the time, hydrocarbons or other
wastes may have been disposed of or released on or under the
properties owned or leased by us on or under other locations
where such wastes have been taken for disposal. In addition, a
portion of these properties have been operated by third parties
whose treatment and disposal or release of wastes was not under
our control. These properties and the wastes disposed thereon
may be subject to CERCLA, the CWA, the RCRA and analogous state
laws. Under such laws, we could be required to remove or
remediate previously disposed wastes (including waste disposed
of or released by prior owners or operators) or property
contamination (including groundwater contamination by prior
owners or operators), or to perform remedial plugging or closure
operations to prevent future contamination.
Waste Discharges. The CWA and analogous state
laws impose restrictions and strict controls with respect to the
discharge of pollutants, including spills and leaks of oil and
other substances, into waters of the United States. The
discharge of pollutants into regulated waters is prohibited,
except in accordance with the terms of a permit issued by EPA or
an analogous state agency. The CWA and regulations implemented
thereunder also prohibit the discharge of dredge and fill
material into regulated waters, including jurisdictional
wetlands, unless authorized by an appropriately issued permit.
Spill prevention, control and countermeasure requirements of
federal laws require appropriate containment berms and similar
structures to help prevent the contamination of navigable waters
by a petroleum hydrocarbon tank spill, rupture or leak. In
addition, the CWA and analogous state laws require individual
permits or coverage under general permits for discharges of
storm water runoff from certain types of facilities. Federal and
state regulatory agencies can impose administrative, civil and
criminal penalties as well as other enforcement mechanisms for
non-compliance with discharge permits or other requirements of
the CWA and analogous state laws and regulations. In 2007, 2008
and 2010, we received three separate information requests from
the EPA pursuant to Section 308 of the CWA. The information
requests required us to provide the EPA with information about
releases at three of our facilities and our compliance with
spill prevention, control and countermeasure requirements. We
have responded to these information requests and no proceeding
or enforcement actions have been initiated. We believe that our
operations are in substantial compliance with the CWA.
On April 25, 2011, EPA issued for public comment a new
draft general permit for stormwater discharges from construction
activities involving more than one acre. EPA is developing this
draft construction general permit (“CGP”) to implement
the new Effluent Limitations Guidelines and New Source
Performance Standards for the Construction and Development
Industry. Because the existing permit is set to expire on
June 30, 2011, EPA also is proposing to extend that permit
until January 31, 2012. When EPA finalizes the new CGP,
likely in early January 2012, operators of construction
activities will be subject to significantly more stringent
erosion and sediment control, inspection, and monitoring
requirements.
Air Emissions. The CAA and associated state
laws and regulations restricts the emission of air pollutants
from many sources, including oil and gas operations. New
facilities may be required to obtain permits before construction
can begin, and existing facilities may be required to obtain
additional permits and incur capital costs in order to remain in
compliance. More stringent regulations governing emissions of
toxic air pollutants and greenhouse gases (“GHGs”)
have been developed by the EPA and may increase the costs of
compliance for some facilities.
Oil Pollution Act. The Oil Pollution Act of
1990, as amended (“OPA”) and regulations thereunder
impose a variety of requirements on “responsible
parties” related to the prevention of oil spills and
liability for damages resulting from such spills in United
States waters. A “responsible party” includes the
owner or operator of an onshore facility, pipeline or vessel, or
the lessee or permittee of the area in which an offshore
facility is located. OPA assigns liability to each responsible
party for oil cleanup costs and a variety of public
95
and private damages. While liability limits apply in some
circumstances, a party cannot take advantage of liability limits
if the spill was caused by gross negligence or willful
misconduct or resulted from violation of a federal safety,
construction or operating regulation. If the party fails to
report a spill or to cooperate fully in the cleanup, liability
limits likewise do not apply. Few defenses exist to the
liability imposed by OPA. OPA imposes ongoing requirements on a
responsible party, including the preparation of oil spill
response plans and proof of financial responsibility to cover
environmental cleanup and restoration costs that could be
incurred in connection with an oil spill.
National Environmental Policy Act. Oil and
natural gas exploration and production activities on federal
lands are subject to the National Environmental Policy Act
(“NEPA”). NEPA requires federal agencies, including
the Department of Interior, to evaluate major agency actions
having the potential to significantly impact the environment.
The process involves the preparation of either an environmental
assessment or environmental impact statement depending on
whether the specific circumstances surrounding the proposed
federal action will have a significant impact on the human
environment. The NEPA process involves public input through
comments which can alter the nature of a proposed project either
by limiting the scope of the project or requiring
resource-specific mitigation. NEPA decisions can be appealed
through the court system by process participants. This process
may result in delaying the permitting and development of
projects, increase the costs of permitting and developing some
facilities and could result in certain instances in the
cancellation of existing leases.
Endangered Species Act. The Endangered Species
Act (“ESA”) restricts activities that may affect
endangered or threatened species or their habitats. While some
of our operations may be located in areas that are designated as
habitats for endangered or threatened species, we believe that
we are in substantial compliance with the ESA. However, the
designation of previously unidentified endangered or threatened
species could cause us to incur additional costs or become
subject to operating restrictions or bans in the affected states.
Worker Safety. The Occupational Safety and
Health Act (“OSHA”) and comparable state statutes
regulate the protection of the health and safety of workers. The
OSHA hazard communication standard requires maintenance of
information about hazardous materials used or produced in
operations and provision of such information to employees. Other
OSHA standards regulate specific worker safety aspects of our
operations. Failure to comply with OSHA requirements can lead to
the imposition of penalties.
Safe Drinking Water Act. The Safe Drinking
Water Act (“SDWA”) and comparable state statutes
restrict the disposal, treatment or release of water produced or
used during oil and gas development. Subsurface emplacement of
fluids (including disposal wells or enhanced oil recovery) is
governed by federal or state regulatory authorities that, in
some cases, includes the state oil and gas regulatory authority
or the state’s environmental authority. These regulations
may increase the costs of compliance for some facilities.
Hydraulic Fracturing. We use hydraulic
fracturing as a means to maximize the productivity of our oil
and gas wells in all of the domestic basins in which we operate
other than the Arkoma and Powder River Basins. Our net acreage
position in the basins in which hydraulic fracturing is utilized
total approximately 550,000 acres and represents
approximately 94% of our domestic proved undeveloped oil and gas
reserves. Although average drilling and completion costs for
each basin will vary, as will the cost of each well within a
given basin, on average approximately 31% of the drilling and
completion costs for each of our wells for which we use
hydraulic fracturing is associated with hydraulic fracturing
activities. These costs are treated in the same way that all
other costs of drilling and completion of our wells are treated
and are built into and funded through our normal capital
expenditure budget.
The protection of groundwater quality is extremely important to
us. We follow applicable standard industry practices and legal
requirements for groundwater protection in our operations. These
measures are subject to close supervision by state and federal
regulators (including the BLM with respect to federal acreage),
which conduct many inspections during operations that include
hydraulic fracturing. These protective measures include using
steel casing pipe and concrete in well construction.
Once a pipe is set in place, cement is pumped into the well
where it hardens and creates a permanent, isolating barrier
between the steel casing pipe and surrounding geological
formations. This aspect of the well design essentially
eliminates a “pathway” for the fracturing fluid to
contact any aquifers during the hydraulic
96
fracturing operations. Furthermore, in the basins in which we
conduct hydraulic fracturing, the hydrocarbon bearing formations
are separated from any usable underground aquifers by thousands
of feet of impermeable rock layers. This wide separation serves
as a protective barrier, preventing any migration of fracturing
fluids or hydrocarbons upwards into any groundwater zones.
In addition, the vendors we employ to conduct hydraulic
fracturing are required to monitor all pump rates and pressures
during the fracturing treatments. This monitoring occurs on a
real-time basis and data is recorded to ensure protection of
groundwater.
Approximately 99% of hydraulic fracturing fluids are made up of
water and sand. We utilize major hydraulic fracturing service
companies whose research departments conduct ongoing development
of “greener” chemicals that are used in fracturing. We
evaluate, test, and where appropriate adopt those products that
are more environmentally friendly. We have also chosen to
participate in a voluntary fracturing chemical registry that is
a public website: www.fracfocus.org at which interested persons
can find out information about fracturing fluids. This registry
is a joint project of the Ground Water Protection Council and
the Interstate Oil and Gas Compact Commission and provides our
industry with an avenue to voluntarily disclose chemicals used
in the hydraulic fracturing process. The information included on
this website is not incorporated by reference in this prospectus.
We currently recycle over 90% of the water recovered from our
operations in the Piceance Basin and the Marcellus Shale. This
recycling greatly lessens the demand on local natural water
resources. We recycled more than 30,000 barrels of water
per day on average in 2010. Any water from our hydraulic
fracturing operations that is not recycled is disposed of in a
way that does not impact surface waters.
Despite our efforts to minimize impacts on the environment from
hydraulic fracturing activities, in light of the volume of our
hydraulic fracturing activities, we have occasionally been
engaged in litigation and received requests for information,
notices of alleged violation, and citations related to the
activities of our hydraulic fracturing vendors, none of which
has resulted in any material costs or penalties.
Recently, there has been a heightened debate over whether the
fluids used in hydraulic fracturing may contaminate drinking
water supply and proposals have been made to revisit the
environmental exemption for hydraulic fracturing under the SDWA
or to enact separate federal legislation or legislation at the
state and local government levels that would regulate hydraulic
fracturing. Both the United States House of Representatives and
Senate are considering Fracturing Responsibility and Awareness
of Chemicals Act (“FRAC Act”) bills and a number of
states, including states in which we have operations, are
looking to more closely regulate hydraulic fracturing due to
concerns about water supply. A committee of the U.S. House
of Representatives is also conducting an investigation of
hydraulic fracturing practices. The recent congressional
legislative efforts seek to regulate hydraulic fracturing to
Underground Injection Control program requirements, which would
significantly increase well capital costs. If the exemption for
hydraulic fracturing is removed from the SDWA, or if the FRAC
Act or other legislation is enacted at the federal, state or
local level, any restrictions on the use of hydraulic fracturing
contained in any such legislation could have a significant
impact on our financial condition and results of operations.
Federal agencies are also considering regulation of hydraulic
fracturing. The EPA recently asserted federal regulatory
authority over hydraulic fracturing involving diesel additives
under the SDWA’s Underground Injection Control Program.
While the EPA has yet to take any action to enforce or implement
this newly asserted regulatory authority, the EPA’s
interpretation without formal rule making has been challenged
and industry groups have filed suit challenging the EPA’s
interpretation. If the EPA prevails in this lawsuit, its
interpretation could result in enforcement actions against
service providers or companies that used diesel products in the
hydraulic fracturing process or could require such providers or
companies to conduct additional studies regarding diesel in the
groundwater. Furthermore, the State of Colorado, in response to
an EPA request, has asked companies operating in Colorado,
including us, to report whether diesel products were used in the
hydraulic fracturing process from 2004 to 2009. In response to
this inquiry we consulted our service providers and reported to
the State of Colorado that at least nine wells were subject to
hydraulic fracturing utilizing fluids that contained chemical
products that contained diesel fuel as a component. The State of
Colorado may conduct additional investigations related to this
inquiry.
97
Any enforcement actions or requirements of additional studies or
investigations by the EPA or the State of Colorado could
increase our operating costs and cause delays or interruptions
of our operations.
The EPA is also collecting information as part of a study into
the effects of hydraulic fracturing on drinking water. The
results of this study, expected in late 2012, could result in
additional regulations, which could lead to operational burdens
similar to those described above. Disclosure of chemicals used
in the hydraulic fracturing process could make it easier for
third parties opposing the hydraulic fracturing process to
initiate legal proceedings based on allegations that specific
chemicals used in the fracturing process could adversely affect
groundwater. In addition to the EPA study, the administration
has tasked DOE to make recommendations within six months on
necessary steps to make sure that hydraulic fracturing protects
public health and the environment at the same time, the
Government Accountability Office is examining the environmental
impacts of produced water and the Counsel for Environmental
Quality has been petitioned by environmental groups to develop a
programmatic environmental impact statement under NEPA for
hydraulic fracturing. The United States Department of the
Interior is also considering whether to impose disclosure
requirements or other mandates for hydraulic fracturing on
federal land.
Several states have adopted, and other states are considering
adopting, regulations that could restrict or impose additional
requirements relating to hydraulic fracturing in certain
circumstances including states in which we operate (e.g.,
Wyoming, Pennsylvania, Texas, Colorado, North Dakota and New
Mexico). For example, on March 1, 2011, a bill was
introduced in the Texas Senate that, if adopted, would require
written disclosure to the Railroad Commission of Texas of
specific information about the fluids and additives used in
hydraulic fracturing treatment operations, and on March 11,
2011, a bill was introduced in the Texas House of
Representatives that would require service companies to submit
“master lists” of base fluids, additives and chemical
constituents to be used in hydraulic fracturing activities in
Texas, subject to certain trade secret protections, to the
Railroad Commission. In addition, at least three local
governments in Texas have imposed temporary moratoria on
drilling permits within city limits so that local ordinances may
be reviewed to assess their adequacy to address such activities,
while some state and local governments in the Marcellus Shale
region in Pennsylvania and New York have considered or imposed
temporary moratoria on drilling operations using hydraulic
fracturing until further study of the potential environmental
and human health impacts by EPA or the relative state agencies
are completed. At this time, it is not possible to estimate the
potential impact on our business of these state and local
actions or the enactment of additional federal or state
legislation or regulations affecting hydraulic fracturing.
Additionally, some wastewater treatment plants in Pennsylvania
have ceased processing wastewater from hydraulic fracturing
operations, which will require us to utilize alternate methods
of wastewater disposal.
Global Warming and Climate Change. Recent
scientific studies have suggested that emissions of GHGs,
including carbon dioxide and methane, may be contributing to
warming of the earth’s atmosphere. Both houses of Congress
have previously considered legislation to reduce emissions of
GHGs, and almost one-half of the states have already taken legal
measures to reduce emissions of GHGs, primarily through the
planned development of GHG emission inventories
and/or
regional GHG cap and trade programs. The EPA has begun to
regulate GHG emissions. On December 15, 2009, the EPA
published its findings that emissions of GHGs present an
endangerment to public heath and the environment. These findings
allow the EPA to adopt and implement regulations that would
restrict emissions of GHGs under existing provisions of the CAA.
The EPA has adopted two sets of regulations under the CAA. The
first limits emissions of GHGs from motor vehicles beginning
with the 2012 model year. The EPA has asserted that these final
motor vehicle GHG emission standards trigger CAA construction
and operating permit requirements for stationary sources,
commencing when the motor vehicle standards take effect on
January 2, 2011. On June 3, 2010, the EPA published
its final
98
rule to address the permitting of GHG emissions from stationary
sources under the Prevention of Significant Deterioration and
Title V permitting programs. This rule “tailors”
these permitting programs to apply to certain stationary sources
of GHG emissions in a multi-step process, with the largest
sources first subject to permitting. Most recently, on
November 30, 2010, the EPA published its final rule
expanding the existing GHG monitoring and reporting rule to
include onshore and offshore oil and natural gas production
facilities and onshore oil and natural gas processing,
transmission, storage, and distribution facilities. Reporting of
GHG emissions from such facilities will be required on an annual
basis, with reporting beginning in 2012 for emissions occurring
in 2011. We are required to report our GHG emissions under this
rule but are not subject to GHG permitting requirements. Several
of the EPA’s GHG rules are being challenged in court
proceedings and depending on the outcome of such proceedings,
such rules may be modified or rescinded or the EPA could develop
new rules.
Because regulation of GHG emissions is relatively new, further
regulatory, legislative and judicial developments are likely to
occur. Such developments may affect how these GHG initiatives
will impact our operations. In addition to these regulatory
developments, recent judicial decisions have allowed certain
tort claims alleging property damage to proceed against GHG
emissions sources may increase our litigation risk for such
claims. New legislation or regulatory programs that restrict
emissions of or require inventory of GHGs in areas where we
operate have adversely affected or will adversely affect our
operations by increasing costs. The cost increases so far have
resulted from costs associated with inventorying our GHG
emissions, and further costs may result from the potential new
requirements to obtain GHG emissions permits, install additional
emission control equipment and an increased monitoring and
record-keeping burden.
Legislation or regulations that may be adopted to address
climate change could also affect the markets for our products by
making our products more or less desirable than competing
sources of energy. To the extent that our products are competing
with higher GHG emitting energy sources such as coal, our
products would become more desirable in the market with more
stringent limitations on GHG emissions. To the extent that our
products are competing with lower GHG emitting energy sources
such as solar and wind, our products would become less desirable
in the market with more stringent limitations on GHG emissions.
We cannot predict with any certainty at this time how these
possibilities may affect our operations.
Finally, it should be noted that some scientists have concluded
that increasing concentrations of GHGs in the Earth’s
atmosphere may produce climate changes that have significant
physical effects, such as increased frequency and severity of
storms, floods and other climatic events. If any such effects
were to occur, they could adversely affect or delay demand for
the oil or natural gas or otherwise cause us to incur
significant costs in preparing for or responding to those
effects.
Foreign Operations. Our exploration and
production operations outside the United States are subject to
various types of regulations similar to those described above
imposed by the governments of the countries in which we operate,
and may affect our operations and costs within those countries.
For example, the Argentine Department of Energy and the
government of the provinces in which Apco’s oil and gas
producing concessions are located have environmental control
policies and regulations that must be adhered to when conducting
oil and gas exploration and exploitation activities. Future
environmental regulation of certain aspects of our operations in
Argentina and Columbia that are currently unregulated and
changes in the laws or regulations could materially affect our
financial condition and results of operations.
Other
Regulation of the Oil and Gas Industry
The oil and natural gas industry is extensively regulated by
numerous federal, state, local and foreign authorities,
including Native American tribes in the United States.
Legislation affecting the oil and natural gas industry is under
constant review for amendment or expansion, frequently
increasing the regulatory burden. Also, numerous departments and
agencies, both federal and state, and Native American tribes are
authorized by statute to issue rules and regulations binding on
the oil and natural gas industry and its individual members,
some of which carry substantial penalties for noncompliance.
Although the regulatory burden on the oil and natural gas
industry increases our cost of doing business and, consequently,
affects our profitability, these
99
burdens generally do not affect us any differently or to any
greater or lesser extent than they affect other companies in the
industry with similar types, quantities and locations of
production.
The availability, terms and cost of transportation significantly
affect sales of oil and natural gas. The interstate
transportation and sale for resale of oil and natural gas is
subject to federal regulation, including regulation of the
terms, conditions and rates for interstate transportation,
storage and various other matters, primarily by the FERC.
Federal and state regulations govern the price and terms for
access to oil and natural gas pipeline transportation. The
FERC’s regulations for interstate oil and natural gas
transmission in some circumstances may also affect the
intrastate transportation of oil and natural gas.
Although oil and natural gas prices are currently unregulated,
Congress historically has been active in the area of oil and
natural gas regulation. We cannot predict whether new
legislation to regulate oil and natural gas might be proposed,
what proposals, if any, might actually be enacted by Congress or
the various state legislatures, and what effect, if any, the
proposals might have on our operations. Sales of condensate and
oil and NGLs are not currently regulated and are made at market
prices.
Drilling
and Production
Our operations are subject to various types of regulation at
federal, state, local and Native American tribal levels. These
types of regulation include requiring permits for the drilling
of wells, drilling bonds and reports concerning operations. Most
states, and some counties, municipalities and Native American
tribal areas where we operate also regulate one or more of the
following activities:
|
|
|
| |
•
|
the location of wells;
|
| |
| |
•
|
the method of drilling and casing wells;
|
| |
| |
•
|
the timing of construction or drilling activities including
seasonal wildlife closures;
|
| |
| |
•
|
the employment of tribal members or use of tribal owned service
businesses;
|
| |
| |
•
|
the rates of production or “allowables;”
|
| |
| |
•
|
the surface use and restoration of properties upon which wells
are drilled;
|
| |
| |
•
|
the plugging and abandoning of wells; and
|
| |
| |
•
|
the notice to surface owners and other third parties.
|
State laws regulate the size and shape of drilling and spacing
units or proration units governing the pooling of oil and
natural gas properties. Some states allow forced pooling or
integration of tracts to facilitate exploration while other
states rely on voluntary pooling of lands and leases. In some
instances, forced pooling or unitization may be implemented by
third parties and may reduce our interest in the unitized
properties. In addition, state conservation laws establish
maximum rates of production from oil and natural gas wells,
generally prohibit the venting or flaring of natural gas and
impose requirements regarding the ratability of production.
These laws and regulations may limit the amount of oil and
natural gas we can produce from our wells or limit the number of
wells or the locations at which we can drill. Moreover, each
state generally imposes a production or severance tax with
respect to the production and sale of natural gas, oil and NGLs
within its jurisdiction. States do not regulate wellhead prices
or engage in other similar direct regulation, but there can be
no assurance that they will not do so in the future. The effect
of such future regulations may be to limit the amounts of oil
and gas that may be produced from our wells, negatively affect
the economics of production from these wells, or to limit the
number of locations we can drill.
Federal, state and local regulations provide detailed
requirements for the abandonment of wells, closure or
decommissioning of production facilities and pipelines, and for
site restoration, in areas where we operate. The New Mexico Oil
Conservation requires the posting of performance bonds to
fulfill financial requirements for owners and operators on state
land. The Corps and many other state and local authorities also
have regulations for plugging and abandonment, decommissioning
and site restoration. Although the Corps does not require bonds
or other financial assurances, some state agencies and
municipalities do have such requirements.
100
Natural
Gas Sales and Transportation
Historically, federal legislation and regulatory controls have
affected the price of the natural gas we produce and the manner
in which we market our production. The FERC has jurisdiction
over the transportation and sale for resale of natural gas in
interstate commerce by natural gas companies under the Natural
Gas Act of 1938 and the Natural Gas Policy Act of 1978. Various
federal laws enacted since 1978 have resulted in the complete
removal of all price and non-price controls for sales of
domestic natural gas sold in first sales, which include all of
our sales of our own production. Under the Energy Policy Act of
2005, the FERC has substantial enforcement authority to prohibit
the manipulation of natural gas markets and enforce its rules
and orders, including the ability to assess substantial civil
penalties.
The FERC also regulates interstate natural gas transportation
rates and service conditions and establishes the terms under
which we may use interstate natural gas pipeline capacity, which
affects the marketing of natural gas that we produce, as well as
the revenues we receive for sales of our natural gas and release
of our natural gas pipeline capacity. Commencing in 1985, the
FERC promulgated a series of orders, regulations and rule
makings that significantly fostered competition in the business
of transporting and marketing gas. Today, interstate pipeline
companies are required to provide nondiscriminatory
transportation services to producers, marketers and other
shippers, regardless of whether such shippers are affiliated
with an interstate pipeline company. The FERC’s initiatives
have led to the development of a competitive, open access market
for natural gas purchases and sales that permits all purchasers
of natural gas to buy gas directly from third-party sellers
other than pipelines. However, the natural gas industry
historically has been very heavily regulated; therefore, we
cannot guarantee that the less stringent regulatory approach
currently pursued by the FERC and Congress will continue
indefinitely into the future nor can we determine what effect,
if any, future regulatory changes might have on our natural gas
related activities.
Under the FERC’s current regulatory regime, transmission
services must be provided on an open-access, nondiscriminatory
basis at cost-based rates or at market-based rates if the
transportation market at issue is sufficiently competitive.
Gathering service, which occurs upstream of jurisdictional
transmission services, is regulated by the states onshore and in
state waters. Although its policy is still in flux, the FERC has
in the past reclassified certain jurisdictional transmission
facilities as non-jurisdictional gathering facilities, which has
the tendency to increase our costs of transporting gas to
point-of-sale
locations.
Oil Sales
and Transportation
Sales of crude oil, condensate and NGLs are not currently
regulated and are made at negotiated prices. Nevertheless,
Congress could reenact price controls in the future.
Our crude oil sales are affected by the availability, terms and
cost of transportation. The transportation of oil in common
carrier pipelines is also subject to rate regulation. The FERC
regulates interstate oil pipeline transportation rates under the
Interstate Commerce Act and intrastate oil pipeline
transportation rates are subject to regulation by state
regulatory commissions. The basis for intrastate oil pipeline
regulation, and the degree of regulatory oversight and scrutiny
given to intrastate oil pipeline rates, varies from state to
state. Insofar as effective interstate and intrastate rates are
equally applicable to all comparable shippers, we believe that
the regulation of oil transportation rates will not affect our
operations in any way that is of material difference from those
of our competitors.
Further, interstate and intrastate common carrier oil pipelines
must provide service on a non-discriminatory basis. Under this
open access standard, common carriers must offer service to all
shippers requesting service on the same terms and under the same
rates. When oil pipelines operate at full capacity, access is
governed by prorationing provisions set forth in the
pipelines’ published tariffs. Accordingly, we believe that
access to oil pipeline transportation services generally will be
available to us to the same extent as to our competitors.
101
Operation
on Native American Reservations
A portion of our leases are, and some of our future leases may
be, regulated by Native American tribes. In addition to
regulation by various federal, state, local and foreign agencies
and authorities, an entirely separate and distinct set of
laws and regulations applies to lessees, operators and other
parties within the boundaries of Native American reservations in
the United States. Various federal agencies within the
U.S. Department of the Interior, particularly the Bureau of
Indian Affairs, the Office of Natural Resources Revenue and BLM,
and the EPA, together with each Native American tribe,
promulgate and enforce regulations pertaining to oil and gas
operations on Native American reservations. These regulations
include lease provisions, royalty matters, drilling and
production requirements, environmental standards, Tribal
employment contractor preferences and numerous other matters.
Native American tribes are subject to various federal statutes
and oversight by the Bureau of Indian Affairs and BLM. However,
each Native American tribe is a sovereign nation and has the
right to enact and enforce certain other laws and regulations
entirely independent from federal, state and local statutes and
regulations, as long as they do not supersede or conflict with
such federal statutes. These tribal laws and regulations include
various fees, taxes, requirements to employ Native American
tribal members or use tribal owned service businesses and
numerous other conditions that apply to lessees, operators and
contractors conducting operations within the boundaries of a
Native American reservation. Further, lessees and operators
within a Native American reservation are subject to the Native
American tribal court system, unless there is a specific waiver
of sovereign immunity by the Native American tribe allowing
resolution of disputes between the Native American tribe and
those lessees or operators to occur in federal or state court.
Therefore, we are subject to various laws and regulations
pertaining to Native American tribal surface ownership, Native
American oil and gas leases, fees, taxes and other burdens,
obligations and issues unique to oil and gas ownership and
operations within Native American reservations. One or more of
these requirements, or delays in obtaining necessary approvals
or permits pursuant to these regulations, may increase our costs
of doing business on Native American tribal lands and have an
impact on the economic viability of any well or project on those
lands.
Employees
At March 31, 2011, Williams had approximately
978 full-time employees dedicated to our business,
including personnel who are now employed by certain of the
subsidiaries that Williams will transfer to us prior to the
completion of this offering. This number does not include
employees of Williams who provide services to our business and
other of Williams’ businesses. Prior to the completion of
this offering, the employees of the subsidiaries that Williams
will transfer to us will be transferred to an affiliate services
company owned by Williams, and we will reimburse the services
company for all direct and indirect expenses it incurs or
payments it makes in connection with providing personnel to us.
As a result, we will have no employees at the completion of this
offering.
Offices
Our principal executive offices are located at One Williams
Center, Tulsa, Oklahoma 74172.
Legal
Proceedings
Royalty
litigation
In September 2006, royalty interest owners in Garfield County,
Colorado, filed a class action suit in District Court, Garfield
County Colorado, alleging we improperly calculated oil and gas
royalty payments, failed to account for the proceeds that we
received from the sale of natural gas and extracted products,
improperly charged certain expenses and failed to refund amounts
withheld in excess of ad valorem tax obligations. Plaintiffs
sought to certify a class of royalty interest owners, recover
underpayment of royalties, and obtain corrected payments
resulting from calculation errors. We entered into a final
partial settlement agreement. The partial settlement agreement
defined the class members for class certification, reserved two
102
claims for court resolution, resolved all other class claims
relating to past calculation of royalty and overriding royalty
payments, and established certain rules to govern future royalty
and overriding royalty payments. This settlement resolved all
claims relating to past withholding for ad valorem tax payments
and established a procedure for refunds of any such excess
withholding in the future. The first reserved claim is whether
we are entitled to deduct in our calculation of royalty payments
a portion of the costs we incur beyond the tailgates of the
treating or processing plants for mainline pipeline
transportation. We received a favorable ruling on our motion for
summary judgment on the first reserved claim. Plaintiffs
appealed that ruling and the Colorado Court of Appeals found in
our favor in April 2011. In June, 2011, Plaintiffs filed a
Petition for Certiorari with the Colorado Supreme Court. We
anticipate that the Court will issue a decision on whether to
grant further review later in 2011 or early in 2012. The second
reserved claim relates to whether we are required to have
proportionately increased the value of natural gas by
transporting that gas on mainline transmission lines and, if
required, whether we did so and are thus entitled to deduct a
proportionate share of transportation costs in calculating
royalty payments. We anticipate trial on the second reserved
claim following resolution of the first reserved claim. We
believe our royalty calculations have been properly determined
in accordance with the appropriate contractual arrangements and
Colorado law. At this time, the plaintiffs have not provided us
a sufficient framework to calculate an estimated range of
exposure related to their claims. However, it is reasonably
possible that the ultimate resolution of this item could result
in a future charge that may be material to our results of
operations.
California
energy crisis
Our former power business was engaged in power marketing in
various geographic areas, including California. Prices charged
for power by us and other traders and generators in California
and other western states in 2000 and 2001 were challenged in
various proceedings, including those before the FERC. We have
entered into settlements with the State of California
(“State Settlement”), major California utilities
(“Utilities Settlement”), and others that
substantially resolved each of these issues with these parties.
Although the State Settlement and Utilities Settlement resolved
a significant portion of the refund issues among the settling
parties, we continue to have potential refund exposure to
nonsettling parties, including various California end users that
did not participate in the Utilities Settlement. We are
currently in settlement negotiations with certain California
utilities aimed at eliminating or substantially reducing this
exposure. If successful, and subject to a final
“true-up”
mechanism, the settlement agreement would also resolve our
collection of accrued interest from counterparties as well as
our payment of accrued interest on refund amounts. Thus, as
currently contemplated by the parties, the settlement agreement
would resolve most, if not all, of our legal issues arising from
the
2000-2001
California Energy Crisis. With respect to these matters, amounts
accrued are not material to our financial position.
Certain other issues also remain open at the FERC and for other
nonsettling parties.
Pursuant to the separation and distribution agreement, Williams
will indemnify us for any cash amounts determined to be owed by
us, and will be entitled to any cash amounts received by us, in
connection with pending proceedings related to these matters.
Reporting
of natural gas-related information to trade
publications
Civil suits based on allegations of manipulating published gas
price indices have been brought against us and others, in each
case seeking an unspecified amount of damages. We are currently
a defendant in class action litigation and other litigation
originally filed in state court in Colorado, Kansas, Missouri
and Wisconsin brought on behalf of direct and indirect
purchasers of natural gas in those states. These cases were
transferred to the federal court in Nevada. In 2008, the court
granted summary judgment in the Colorado case in favor of us and
most of the other defendants based on plaintiffs’ lack of
standing. On January 8, 2009, the court denied the
plaintiffs’ request for reconsideration of the Colorado
dismissal and entered judgment in our favor. We expect that the
Colorado plaintiffs will appeal, but the appeal cannot occur
until the case against the remaining defendant is concluded.
103
In the other cases, our joint motions for summary judgment to
preclude the plaintiffs’ state law claims based upon
federal preemption have been pending since late 2009. If the
motions are granted, we expect a final judgment in our favor
which the plaintiffs could appeal. If the motions are denied,
the current stay of activity would be lifted, class
certification would be addressed, and discovery would be
completed as the cases proceed towards trial. Because of the
uncertainty around these current pending unresolved issues,
including an insufficient description of the purported classes
and other related matters, we cannot reasonably estimate a range
of potential exposures at this time. However, it is reasonably
possible that the ultimate resolution of these items could
result in future charges that may be material to our results of
operations.
Pursuant to the separation and distribution agreement, Williams
will indemnify us for any cash payments (including indirect,
punitive or consequential damages) incurred by us in connection
with pending proceedings related to these matters. However, such
indemnification will not extend to losses incurred by us to the
extent those losses arise out of certain legacy natural gas
derivative contracts of Williams Gas Marketing Services (See
Note 15 of Notes to Combined Financial Statements) detailed in
the separation and distribution agreement.
104
MANAGEMENT
Directors
and Executive Officers
Set forth below is certain information regarding persons who
serve as our executive officers and directors. Prior to the
completion of this offering, we may appoint additional persons
to serve as our executive officers and directors upon completion
of this offering.
| |
|
|
|
|
|
|
|
Name
|
|
Age
|
|
Position
|
|
|
|
Alan S. Armstrong
|
|
|
48
|
|
|
Chairman of the Board
|
|
Ralph A. Hill
|
|
|
51
|
|
|
Chief Executive Officer
|
|
Donald R. Chappel
|
|
|
59
|
|
|
Chief Financial Officer
|
|
Ted T. Timmermans
|
|
|
54
|
|
|
Chief Accounting Officer
|
|
James J. Bender
|
|
|
54
|
|
|
General Counsel and Corporate Secretary
|
|
Robyn L. Ewing
|
|
|
55
|
|
|
Chief Administrative Officer
|
|
Rodney J. Sailor
|
|
|
52
|
|
|
Treasurer and Deputy Chief Financial Officer
|
Alan S. Armstrong. Mr. Armstrong was
named Chairman of our Board in April 2011. Mr. Armstrong
has been Chief Executive Officer, President and a Director of
Williams since January 3, 2011. From February 2002 until
January 2011, he was Senior Vice President—Midstream at
Williams and acted as President of the Midstream business at
Williams. From 1999 to February 2002, Mr. Armstrong was
Vice President, Gathering and Processing for Midstream at
Williams. From 1998 to 1999 he was Vice President, Commercial
Development for Midstream at Williams. As of January 2011,
Mr. Armstrong serves as Chairman of the Board and Chief
Executive Officer of Williams Partners GP LLC, the general
partner of Williams Partners, where he was Senior Vice
President—Midstream from February 2010 and Chief Operating
Officer and a director from February 2005.
We believe that Mr. Armstrong is well qualified to serve as
our Chairman of the Board. Mr. Armstrong has many years of
experience in our industry, including over 25 years of
operating and executive experience with Williams, and we believe
this experience will be critical to his ability to identify,
understand and address challenges and opportunities that we will
face. As the current Chief Executive Officer and President of
Williams, we believe Mr. Armstrong is uniquely suited to
serve as our Chairman as we become a newly public company.
Mr. Armstrong also has knowledge and understanding of
corporate governance issues through serving as a public company
senior executive and board member. Further, we believe that his
executive experience dealing with legislators and regulators
will make him an excellent resource for our management and other
directors.
Ralph A. Hill. Mr. Hill was named Chief
Executive Officer in April 2011. Prior to becoming our Chief
Executive Officer, Mr. Hill was Senior Vice
President—Exploration and Production and acted as President
of the Exploration and Production business at Williams since
1998. He was Vice President and General Manager of Exploration
and Production business at Williams from 1993 to 1998, as well
as Senior Vice President and General Manager of Petroleum
Services at Williams from 1998 to 2003. Mr. Hill has served
as the Chairman of the Board and Chief Executive Officer of Apco
since 2002. Mr. Hill has served as a director of Petrolera
Entre Lomas S.A. since 2003. He joined Williams in June 1981 as
a member of a management training program and has worked in
numerous capacities within the Williams organization.
Donald R. Chappel. Mr. Chappel was named
Chief Financial Officer in April 2011. Mr. Chappel has been
Senior Vice President and Chief Financial Officer of Williams
since April 2003. Prior to joining Williams, Mr. Chappel
held various financial, administrative, and operational
leadership positions. Mr. Chappel is included in
Institutional Investor magazine’s Best CFOs listing for
2011, 2010, 2008, 2007, and 2006. Mr. Chappel also serves
as Chief Financial Officer and a director of Williams Partners
GP LLC, the general partner of Williams Partners.
Mr. Chappel was Chief Financial Officer, from August 2007,
and a director, from January 2008, of the general partner of
Williams Pipeline Partners L.P., until its merger with Williams
Partners in August 2010. Mr. Chappel is a director of
SUPERVALU Inc. and Energy Insurance Mutual Limited.
105
Ted T. Timmermans. Mr. Timmermans was
named Chief Accounting Officer in April 2011.
Mr. Timmermans has been Vice President, Controller and
Chief Accounting Officer of Williams since July 2005, and Vice
President, Controller and Chief Accounting Officer of Williams
Partners GP LLC, the general partner of Williams Partners since
September 2005. Mr. Timmermans served as an Assistant
Controller of Williams from April 1998 to July 2005.
Mr. Timmermans served as Chief Accounting Officer of the
general partner of Williams Pipeline Partners L.P., from 2008
until its merger with Williams Partners in August 2010.
James J. Bender. Mr. Bender was named
General Counsel and Corporate Secretary in April 2011.
Mr. Bender has been Senior Vice President and General
Counsel of Williams since December 2002, and General Counsel of
Williams Partners GP LLC, the general partner of Williams
Partners, since September 2005. Mr. Bender served as the
General Counsel of the general partner of Williams Pipeline
Partners L.P., from 2007 until its merger with Williams Partners
in August 2010. From June 2000 to June 2002, Mr. Bender was
Senior Vice President and General Counsel of NRG Energy, Inc.
Mr. Bender was Vice President, General Counsel, and
Secretary of NRG Energy from June 1997 to June 2000. NRG Energy,
Inc. filed a voluntary bankruptcy petition during 2003 and its
plan of reorganization was approved in December 2003.
Robyn L. Ewing. Ms. Ewing was named Chief
Administrative Officer in April 2011. Ms. Ewing has been
Senior Vice President and Chief Administrative Officer of
Williams since April 2008. From 2004 to 2008 Ms. Ewing was
Vice President of Human Resources at Williams. Prior to joining
Williams, Ms. Ewing worked at MAPCO, which merged with
Williams in April 1998. She began her career with Cities Service
Company in 1976.
Rodney J. Sailor. Mr. Sailor was named
Treasurer and Deputy Chief Financial Officer in April 2011.
Mr. Sailor has served as Vice President and Treasurer of
Williams since July 2005. He served as Assistant Treasurer of
Williams from 2001 to 2005 and was responsible for capital
restructuring and capital markets transactions, management of
Williams’ liquidity position and oversight of
Williams’ balance sheet restructuring program. From 1985 to
2001, Mr. Sailor served in various capacities for Williams.
Mr. Sailor was a director of Williams Partners GP LLC, the
general partner of Williams Partners, from October 2007 to
February 2010. Mr. Sailor has served as a director of Apco
since September 2006.
Board
Composition
Our business and affairs will be managed under the direction of
our board of directors. Immediately following the completion of
this offering, we expect that at least one member of our board
of directors will be “independent” under applicable
rules of the NYSE. Within one year following the completion of
this offering, the board of directors will include three
independent directors under applicable rules of the NYSE. The
directors will have discretion to increase or decrease the size
of the board of directors.
Status as
a “Controlled Company”
Upon completion of this offering and prior to the anticipated
spin-off of our stock to Williams’ stockholders, Williams
will control a majority of the voting power for the election of
our directors, and we will therefore be a “controlled
company” under NYSE corporate governance standards. A
controlled company need not comply with NYSE corporate
governance rules that require its board of directors to have a
majority of independent directors and independent compensation
and nominating and corporate governance committees. We intend to
avail ourselves of the controlled company exception under the
NYSE corporate governance standards. Notwithstanding our status
as a controlled company, we will remain subject to the NYSE
corporate governance standard that requires us to have an audit
committee composed entirely of independent directors. As a
result, we must have at least one independent director on our
audit committee by the date our Class A common stock is
listed on the NYSE, or the listing date, at least two
independent directors within 90 days of the listing date
and at least three independent directors within one year of the
listing date.
If Williams completes a spin-off of all of the shares of our
common stock that it owns to its stockholders or holds less than
a majority of the voting power for any other reason, we will no
longer be a controlled company within the meaning of the NYSE
corporate governance standards. Once we cease to be a controlled
company, our board of directors will be required to have a
compensation committee and a nominating and
106
governance committee, each with at least one independent
director. Within 90 days of ceasing to be a controlled
company, we will be required to have each of a compensation
committee and a nominating and governance committee with a
majority of independent directors, and within one year of
ceasing to be a controlled company, a majority of our board of
directors must be comprised of independent directors.
Board
Committees
Audit
committee
Prior to completion of this offering, our board of directors
will establish an audit committee, composed
of
directors. The audit committee will consist of the number of
independent directors as required by the applicable NYSE rules
within the applicable time periods following the completion of
this offering. The board of directors will determine that all of
the audit committee members are financially literate.
The audit committee’s functions will include providing
assistance to the board of directors in fulfilling its oversight
responsibility relating to our financial statements and the
financial reporting process, compliance with legal and
regulatory requirements, the qualifications and independence of
our independent registered public accounting firm, our system of
internal controls, the internal audit function, our code of
ethical conduct, retaining and, if appropriate, terminating the
independent registered public accounting firm, and approving
audit and non-audit services to be performed by the independent
registered public accounting firm. In addition, as the audit
committee will be made up exclusively of independent directors,
it will be responsible for the future amendment or establishment
of all related party transactions between us and Williams.
In compliance with the NYSE listing standards, our audit
committee will annually conduct a self-evaluation to determine
whether it is functioning effectively. In addition, the audit
committee will prepare the report of the committee required by
the rules and regulations of the SEC to be included in our
annual proxy statement.
Our board of directors will adopt a written charter for our
audit committee, which will be available on our corporate
website prior to or upon completion of this offering.
Other
Committees
Because we will be a “controlled company” within the
meaning of the NYSE corporate governance standards, we will not
be required to, and will not, have a compensation or nominating
and governance committee. While we are a controlled company,
Williams’ nominating and corporate governance committee
will identify and evaluate potential candidates for nomination
as a director and recommend any such candidates to our board of
directors.
Our board of directors may form a compensation committee
and/or a
nominating and governance committee after the completion of this
offering.
Compensation
Committee Interlocks and Insider Participation
Initially, compensation recommendations regarding our executive
officers may be made by the Williams compensation committee. Our
board of directors may appoint a successor compensation
committee after the completion of this offering. None of our
executive officers serves, or has served during the last
completed fiscal year, on the compensation committee or board of
directors of any other company that has one or more executive
officers serving on our compensation committee or board of
directors.
Code of
Ethics
In connection with this offering, our board of directors will
adopt a Code of Ethics for Senior Officers that applies to our
Chief Executive Officer, Chief Financial Officer and Controller,
or persons performing similar functions. Our code of ethics will
be publicly available on our corporate website. Any waiver of
our code of ethics with respect to our Chief Executive Officer,
Chief Financial Officer and Controller, or persons performing
similar functions may only be authorized by our audit committee
and will be disclosed as required by applicable law.
107
EXECUTIVE
COMPENSATION
Compensation
Discussion and Analysis
We have yet to establish a compensation committee of our board
of directors. As a result, the compensation information provided
herein reflects the compensation program established by the
compensation committee of Williams’ board of directors
(“Committee”) in place to compensate Williams’
officers on December 31, 2010, except as otherwise
indicated.
As our compensation program is developed, the Williams board of
directors
and/or
Committee will provide input, analyze and approve WPX
Energy’s compensation and benefit plans and policies until
our compensation committee is formed. To date, the Committee has
approved our pay philosophy and our comparator group of
companies. Specific compensation and benefit programs for WPX
Energy have yet to be developed.
It should be noted that Williams provides generally consistent
compensation programs and metrics for all officers across the
enterprise. In 2010, an officer working in Williams’
Exploration & Production business unit, the base group
for WPX Energy, had the same long-term incentive and annual
incentive award metrics and design as an officer working in any
other part of Williams. Therefore, the compensation programs
described for the named executive officers of WPX Energy
(“NEOs”) in this Compensation Discussion and Analysis
are consistent in form with the compensation program received by
officers in the Exploration & Production business unit.
The executive officers who were largely responsible for
conducting the business of WPX Energy and for managing the
operations of Williams’ Exploration & Production
business unit during 2010 are also executive officers of
Williams. For the fiscal year ending December 31, 2010, the
Williams executive officers who comprised the executive team for
WPX Energy and who are referred to as the NEOs were: Steven J.
Malcolm, former Chairman, President and Chief Executive Officer
(“CEO”) of Williams; Donald R. Chappel, Chief
Financial Officer of Williams and our Chief Financial Officer;
Ralph A. Hill, Senior Vice
President—Exploration & Production of Williams,
and our CEO; James J. Bender, Senior Vice President and General
Counsel of Williams and our General Counsel and Corporate
Secretary; and Robyn L. Ewing, Senior Vice President and Chief
Administrative Officer of Williams and our Chief Administrative
Officer.
Objective
of Williams’ Compensation Programs
The role of compensation for Williams is to attract and retain
the talent needed to drive stockholder value and to help enable
each business of Williams to meet or exceed financial and
operational performance targets. The objective of Williams’
compensation programs is to reward employees for successfully
implementing the strategy to grow the business and create
long-term stockholder value. To that end, Williams uses relative
and absolute Total Shareholder Return (“TSR”) to
measure long-term performance, and Economic Value
Added®
(“EVA®”)1
to measure annual performance. Williams believes using both TSR
and
EVA®
to incent and pay NEOs helps ensure that the business decisions
made are aligned with the long-term interests of Williams’
stockholders.
Looking forward—While our pay philosophy has been
approved by the Committee, the specific design of our long-term
incentive, the annual cash incentive, the base pay and benefit
plans has yet to be determined.
Williams’
2010 Pay Philosophy
Williams’ pay philosophy throughout the entire organization
is to pay for performance, be competitive in the marketplace and
consider the value a job provides to Williams. The compensation
programs reward NEOs and employees not just for accomplishing
goals, but also for how those goals are pursued. Williams
strives to reward the right results and the right behaviors
while fostering a culture of collaboration and teamwork.
1 Economic
Value
Added®
(EVA®)
is a registered trademark of Stern, Stewart & Co.
108
The principles of Williams’ pay philosophy influence the
design and administration of its pay programs. Decisions about
how to pay NEOs are based on these principles. The Committee
uses several different types of pay that are linked to both
long-term and short-term performance in the executive
compensation programs. Included are long-term incentives, annual
cash incentives, base pay and benefits. The chart below
illustrates the linkage between the types of pay used and the
pay principles.
| |
|
|
|
|
|
|
|
|
|
|
|
|
|
|
|
|
|
|
|
Long-term
|
|
|
Annual Cash
|
|
|
|
|
|
|
|
|
Williams’ Pay Principles
|
|
Incentives
|
|
|
Incentives
|
|
|
Base Pay
|
|
|
Benefits
|
|
|
|
|
Pay should reinforce business objectives and values
|
|
|
ü
|
|
|
|
ü
|
|
|
|
ü
|
|
|
|
|
|
|
A significant portion of an NEO’s total pay should be
variable based on performance
|
|
|
ü
|
|
|
|
ü
|
|
|
|
|
|
|
|
|
|
|
Incentive pay should balance long-term, intermediate and
short-term performance
|
|
|
ü
|
|
|
|
ü
|
|
|
|
|
|
|
|
|
|
|
Incentives should align interest of NEOs with stockholders
|
|
|
ü
|
|
|
|
ü
|
|
|
|
|
|
|
|
|
|
|
Pay opportunity should be competitive
|
|
|
ü
|
|
|
|
ü
|
|
|
|
ü
|
|
|
|
ü
|
|
|
A portion of pay should be provided to compensate for the core
activities required for performing in the role
|
|
|
|
|
|
|
|
|
|
|
ü
|
|
|
|
ü
|
|
|
Pay should foster a culture of collaboration with shared focus
and commitment to Williams
|
|
|
ü
|
|
|
|
ü
|
|
|
|
|
|
|
|
|
|
Looking Forward—Our pay philosophy, which will serve
to influence the design and delivery of our pay programs, has
been approved by the Committee. Our approved pay philosophy is
substantially the same as Williams’ pay philosophy.
Williams’
2010 Compensation Summary
In 2010, Williams, including its Exploration and Production
business unit, continued to focus on creating stockholder value
by delivering solid financial and operational performance. The
effects of the economic recession during late 2008 and 2009
eased during 2010. Crude oil and NGL prices returned to
attractive levels, but natural gas prices remained low. Williams
continued to respond to the changing landscape and completed a
number of significant business transactions as detailed on
page 106. Williams took several actions, described below,
to ensure that its executive pay program remains affordable and
competitive in the current market and after market conditions
improve.
Williams’
2010 Pay Decisions
As indicated above, significant consideration was given to the
need to balance Williams’ pay philosophy and practices with
affordability and sustainability. Williams continued to grant
long-term incentives in the form of performance-based restricted
stock units (“RSUs”), stock options and time-based
RSUs in 2010 to emphasize its commitment to pay for performance.
Consistent with its commitment to provide a meaningful
connection between pay and performance, Williams has granted
performance-based RSUs to NEOs since 2004. The performance-based
RSUs granted in 2008 for the
2008-2010
performance period did not meet threshold targets set at the
beginning of the period as a result of the global economic
crisis. The challenging performance targets established in 2008
for the three-year performance period included economic
assumptions that could not anticipate the significant decline in
economic conditions. In accordance with the design of the
awards, these awards were cancelled. This is the second
consecutive year the performance-based RSUs were not earned.
This resulted in each NEO losing a significant portion of pay
that was targeted for
2007-2009
and
2008-2010.
It is important to note that the Summary Compensation Table
displays a value for equity awards on the date of grant. This
approach does not reflect the actual realized value associated
with equity award grants. While the grant date values make it
appear that NEOs’ pay has been fairly consistent in recent
years, the value realized by the NEOs has significantly declined
in recent years due to Williams’ pay for performance
philosophy.
109
Historically, Williams sets performance targets for its Annual
Incentive Program (“AIP”) during the first quarter.
The targets established in 2010 anticipated an improving
economic environment and required significantly improved
performance over 2009. While
EVA®
performance exceeded 2009 levels, the 2010 AIP results paid less
than 2009 due to higher 2010 performance targets.
With respect to base salary, Mr. Malcolm did not receive a
base pay increase in 2009 or 2010. The remaining NEOs did not
receive a base pay increase in 2009 and received a two percent
base pay increase in 2010, other than Ms. Ewing who
received a 3.5% increase in 2010.
Williams’
Plan Design Decisions
The Committee regularly reviews Williams’ existing pay
programs to ensure Williams’ ability to attract and retain
the talent needed to deliver the strong financial and operating
performance necessary to create stockholder value while ensuring
its program effectively links pay to the performance of
Williams. As part of this process in 2010, the Committee reached
several important decisions. The Committee decided to continue
awarding a significant portion of long-term incentive awards in
the form of performance-based restricted stock units
(“RSUs”). The metric for these awards utilizes
absolute and relative TSR. NEOs will earn their targeted
performance-based RSUs for the 2010 to 2012 period only if
Williams delivers positive absolute TSR and also achieves solid
TSR in relation to the Williams’ comparator group of
companies. The Committee believes it is important to include
both relative and absolute TSR to ensure that results are
impacted by the absolute TSR actually delivered to stockholders,
as well as the company’s performance relative to comparator
companies. Williams’ commitment to these awards combined
with the utilization of both relative and absolute TSR metrics
demonstrates the emphasis on linking pay to long-term
performance and aligning its pay programs with the interest of
stockholders.
Williams continues to deliver a significant portion of equity in
performance-based awards and stock options because these awards
have the strongest alignment to stockholders. Shown below is the
long-term incentive mix for the NEOs under Williams’
compensation program for 2010.
| |
|
|
|
|
|
|
|
|
|
|
|
Mr. Malcolm
|
|
|
Other NEOs
|
|
|
|
|
Performance-Based RSUs
|
|
|
50
|
%
|
|
|
35
|
%
|
|
Stock Options
|
|
|
50
|
%
|
|
|
30
|
%
|
|
Time-Based RSUs
|
|
|
0
|
%
|
|
|
35
|
%
|
As to Williams’ AIP,
EVA®
improvement remained the performance metric in 2010. The
difficult economic and commodity price environment made
establishing a target level of performance very challenging. In
anticipation of an improving economic environment, the Committee
approved a 2010
EVA®
performance target that was substantially higher than targets
established for 2009. The Committee also continued a decision
reached in 2009 to require that the AIP performance necessary to
move from threshold to target was doubled from 2008 levels.
Likewise, the performance required to move from target to
stretch was doubled from 2008 levels. This design attempts to
keep the AIP as a meaningful performance incentive throughout
the year while ensuring a payout significantly above target only
occurs if Williams significantly exceeds established performance
targets.
Mitigating
Risk
After a thorough review and analysis, it was determined that the
risks arising from Williams’ compensation policies and
practices are not reasonably likely to have a material adverse
effect on Williams.
Williams’
Compensation Recommendation and Decision Process
Role of
Williams’ Management
In order to make pay recommendations, management provides the
Williams CEO with data from the annual proxy statements of
companies in Williams’ comparator group along with pay
information compiled from nationally recognized executive and
industry related compensation surveys. The survey data is used
to confirm that pay practices among companies in the comparator
group are aligned with the market as a whole.
110
Role of
Williams’ CEO
Before recommending base pay adjustments and long-term incentive
awards to the Committee, Williams’ CEO reviews the
competitive market information related to each of Williams other
named executive officers while also considering internal equity
and individual performance.
For the annual cash incentive program, the Williams CEO’s
recommendation is based on
EVA®
attainment with a potential adjustment for individual
performance. Individual performance includes business unit
EVA®
results for the business unit leaders, achievement of business
goals and demonstrated key leadership competencies (for more on
leadership competencies, see the section entitled “Base
Pay” in this Compensation Discussion and Analysis). The
modifications made are fairly modest. For 2010 the adjustments
made to the NEOs’ annual cash incentive awards were in
total less than 5%.
Role of
the Other NEOs
The NEOs, and Williams’ other named executive officers,
have no role in setting compensation for any of the NEOs.
Role of
Williams’ Compensation Committee
For all NEOs, except the Williams CEO, the Committee reviews the
Williams CEO’s recommendations, supporting market data and
individual performance assessments. In addition, the
Committee’s independent compensation consultant, Frederic
W. Cook & Co., Inc., reviews all of the data and
advises on the reasonableness of the Williams CEO’s pay
recommendations.
For the Williams CEO, the Williams board of directors meets in
executive session without management present to review the
Williams CEO’s performance. In this session, the Williams
board of directors reviewed:
|
|
|
| |
•
|
Evaluations of the Williams CEO completed by the board members
and the executive officers (excluding the Williams CEO);
|
| |
| |
•
|
The Williams CEO’s written assessment of
his/her own
performance compared with the stated goals; and
|
| |
| |
•
|
EVA®
performance of the Company relative to established targets as
well as the financial and safety metrics presented as a
supplement to
EVA®
performance.
|
The Committee uses these evaluations and competitive market
information provided by its independent compensation consultant
to determine the Williams CEO’s long-term incentive
amounts, annual cash incentive target, base pay and any
performance adjustments to be made to the Williams CEO’s
annual cash incentive payment.
Role of
the Independent Compensation Consultant
Frederic W. Cook & Co., Inc. assists the Committee in
determining or approving the compensation for Williams’
executive officers. Frederick W. Cook & Co., Inc. will
serve as the independent compensation consultant to the
Committee as the Committee provides input and analyzes and
approves our compensation and benefit plans and policies until
our compensation committee is formed.
To assist the Committee in discussions and decisions about
compensation for the NEOs, the Committee’s independent
compensation consultant presents competitive market data that
includes proxy data from the approved Williams’ comparator
group and published compensation data, using the same surveys
and methodology used for the other NEOs (described in the
“Role of Management” section in this Compensation
Discussion and Analysis). The Williams comparator group is
developed by the Committee’s independent compensation
consultant, with input from management, and is approved by the
Committee.
111
2010
Williams’ Comparator Group
How
Williams Uses its Comparator Group
Williams refers to publicly available data showing how much
Williams’ comparator group pays, as well as how that pay is
divided among base pay, annual incentive, equity and other forms
of compensation. This allows the Committee to ensure
competitiveness and appropriateness of proposed compensation
packages. When setting pay, the Committee uses market median
information of Williams’ comparator group, as opposed to
market averages, to ensure that the impact of any unusual events
that may occur at one or two companies during any particular
year is diminished from the analysis. If an event is
particularly unusual and surrounds unique circumstances, the
data is completely removed from the assessment.
Composition
of the Williams Comparator Group
Each year the Committee reviews the prior year’s
Williams’ comparator group to ensure that it is still
appropriate. Williams last made changes to this group for 2009.
Williams’ comparator group focuses on companies that work
in the same industry segment and reflect where Williams competes
for business and talent. The 2010 Williams’ comparator
group for 2010 included 20 companies, which comprise a mix
of both direct competitors to Williams and companies whose
primary business is similar to at least one of Williams’
business segments. These companies are included in the chart
below under the column entitled Williams’ 2010 Comparator
Company Group.
Characteristics
of Williams’ Comparator Group
Companies in Williams’ comparator group have a range of
revenues, assets and market capitalization. Business
consolidation and unique operating models today create some
challenges in identifying comparator companies. Accordingly,
Williams takes a broader view of comparability to include
organizations that are similar to Williams in some, but not all,
respects. This results in compensation that is appropriately
scaled and reflects comparable complexities in business
operations.
Composition
of Our Comparator Group
Our comparator company group approved by the Committee is
provided below. This group is anticipated to be used in making
our compensation decisions that we currently expect to be
applied beginning in 2012.
| |
|
|
|
|
|
|
|
|
|
|
|
Williams’ 2010
|
|
|
Our
|
|
|
|
|
Comparator
|
|
|
Comparator
|
|
|
|
|
Company
|
|
|
Company
|
|
|
Company Name
|
|
Group
|
|
|
Group
|
|
|
|
|
Anadarko Petroleum Corp.
|
|
|
X
|
|
|
|
|
|
|
Apache Corp.
|
|
|
X
|
|
|
|
|
|
|
Cabot Oil & Gas Corp.
|
|
|
|
|
|
|
X
|
|
|
Centerpoint Energy Inc.
|
|
|
X
|
|
|
|
|
|
|
Chesapeake Energy Corp.
|
|
|
X
|
|
|
|
X
|
|
|
Cimarex Energy Corp.
|
|
|
|
|
|
|
X
|
|
|
Devon Energy Corp.
|
|
|
X
|
|
|
|
X
|
|
|
Dominion Resources Inc.
|
|
|
X
|
|
|
|
|
|
|
El Paso Corp.
|
|
|
X
|
|
|
|
|
|
|
EOG Resources Inc.
|
|
|
X
|
|
|
|
X
|
|
|
EQT Corp.
|
|
|
X
|
|
|
|
|
|
|
Forest Oil Corp.
|
|
|
|
|
|
|
X
|
|
|
Hess Corp.
|
|
|
X
|
|
|
|
|
|
|
Murphy Oil Corp.
|
|
|
X
|
|
|
|
|
|
112
| |
|
|
|
|
|
|
|
|
|
|
|
Williams’ 2010
|
|
|
Our
|
|
|
|
|
Comparator
|
|
|
Comparator
|
|
|
|
|
Company
|
|
|
Company
|
|
|
Company Name
|
|
Group
|
|
|
Group
|
|
|
|
|
Newfield Exploration Co.
|
|
|
|
|
|
|
X
|
|
|
NiSource Inc.
|
|
|
X
|
|
|
|
|
|
|
Noble Energy Inc.
|
|
|
X
|
|
|
|
X
|
|
|
Oneok Inc.
|
|
|
X
|
|
|
|
|
|
|
Petrohawk Energy Corp.
|
|
|
|
|
|
|
X
|
|
|
Pioneer Natural Resources Co.
|
|
|
|
|
|
|
X
|
|
|
Plains All American Pipeline
|
|
|
X
|
|
|
|
|
|
|
QEP Resources Inc.
|
|
|
|
|
|
|
X
|
|
|
Questar Corp.
|
|
|
X
|
|
|
|
|
|
|
Range Resources Corp.
|
|
|
|
|
|
|
X
|
|
|
Sandridge Energy Inc.
|
|
|
|
|
|
|
X
|
|
|
Sempra Energy
|
|
|
X
|
|
|
|
|
|
|
SM Energy Co.
|
|
|
|
|
|
|
X
|
|
|
Southern Union Co.
|
|
|
X
|
|
|
|
|
|
|
Southwestern Energy Co.
|
|
|
|
|
|
|
X
|
|
|
Spectra Energy Corp
|
|
|
X
|
|
|
|
|
|
|
Ultra Petroleum Corp.
|
|
|
|
|
|
|
X
|
|
|
XTO Energy Inc. (acquired by ExxonMobil—removed)
|
|
|
X
|
|
|
|
|
|
Characteristics
of Our Comparator Group
Our comparator group focuses on companies that work in the same
industry segment and reflect where we compete for business and
talent. Companies in the comparator group have a range of
revenues, assets and market capitalization as well as a range of
operational measures such as production and reserves. Our
comparator group is appropriately scaled and these
companies’ primary business is similar to ours and is
subject to similar economic circumstances.
Williams’
Pay Setting Process
Setting pay for our NEOs historically has been an annual process
that occurs during the first quarter of the year. The Committee
completes a review to ensure that pay is competitive, equitable
and encourages and rewards performance.
The compensation data of Williams’ comparator group
disclosed in proxy statements is the primary market data used
when benchmarking the competitive pay of the NEOs. Aggregate
market data obtained from recognized third-party executive
compensation survey companies (e.g. Towers Watson, Mercer,
AonHewitt) is used to supplement and validate Williams’
comparator group market data for these executive officers.
Typically, the Committee is presented with a range of annual
revenues of the companies whose data is included in the
aggregate analysis provided by the third party survey, but does
not know the identities of the specific companies included.
Although the Committee reviews relevant data as it designs
compensation packages, setting pay is not an exact science.
Since market data alone does not reflect the strategic
competitive value of various roles within Williams, internal pay
equity is also considered when making pay decisions. Because
Williams applies an enterprise-wide perspective to promote
collaboration and ensure overall success, paying the executive
officers equitably is important. Other considerations when
making pay decisions for the NEOs include historical pay and
tally sheets that include annual pay and benefit amounts, wealth
accumulated over the past five years and the total aggregate
value of the NEOs’ equity awards and holdings.
113
When setting pay, Williams determines a target pay mix
(distribution of pay among long-term incentives, annual
incentives, base pay and other forms of compensation) for the
NEOs. Consistent with Williams’
pay-for-performance
philosophy, the actual amounts paid, excluding benefits, are
determined based on Williams’ and individual performance.
The following table provides the 2010 target pay mix by NEO.
| |
|
|
|
|
|
|
|
|
|
|
|
|
|
|
|
|
|
|
|
2010 Target Pay Mix by NEO
|
|
|
|
|
Base
|
|
|
Annual
|
|
|
Long-Term
|
|
|
|
|
|
|
|
Salary
|
|
|
Incentive
|
|
|
Incentive
|
|
|
Total
|
|
|
|
|
Mr. Malcolm
|
|
|
14
|
%
|
|
|
14
|
%
|
|
|
72
|
%
|
|
|
100
|
%
|
|
Mr. Chappel
|
|
|
20
|
%
|
|
|
15
|
%
|
|
|
65
|
%
|
|
|
100
|
%
|
|
Mr. Hill
|
|
|
19
|
%
|
|
|
13
|
%
|
|
|
68
|
%
|
|
|
100
|
%
|
|
Mr. Bender
|
|
|
23
|
%
|
|
|
15
|
%
|
|
|
62
|
%
|
|
|
100
|
%
|
|
Mrs. Ewing
|
|
|
22
|
%
|
|
|
14
|
%
|
|
|
64
|
%
|
|
|
100
|
%
|
Game Plan
for Growth
Williams’ goal for 2010 was to grow the natural gas-based
businesses in order to generate superior value for investors in
Williams and Williams Partners. The performance of the NEOs and
other employees is measured by progress made towards the Game
Plan for Growth goals. Individual adjustments within
Williams’ annual cash incentive program are based on each
NEO’s contributions to the Game Plan for Growth. The goals
defined in the Game Plan for Growth include:
Invest
in Growth
|
|
|
| |
•
|
Enhance Williams’ relationships with customers so that
Williams continues to grow its competitive advantage and earn
recognition for the reliable service and value that is essential
to their success.
|
| |
| |
•
|
Invest in Williams’ businesses in ways that grow
EVA®,
earnings and cash flows for Williams and Williams Partners; meet
Williams’ customers’ needs; and enhance Williams’
competitive position.
|
| |
| |
•
|
Pursue additional investment opportunities in new and emerging
basins to capture significant, strategic, long-lived growth.
|
| |
| |
•
|
Expand Williams’ intellectual, operational and leadership
capacities so that Williams can successfully grow and develop
high-performing employees and businesses.
|
Support
Williams’ Growth
|
|
|
| |
•
|
Comply with applicable laws and regulations.
|
| |
| |
•
|
Continuously improve Williams’ safety and environmental
compliance performance in all of Williams’ operations.
|
| |
| |
•
|
Assess and manage risks effectively; take appropriate,
well-considered risks in order to create value. Exercise
financial discipline so that Williams’ and Williams
Partners’ financial condition is strong and credit ratings
are investment-grade.
|
Deliver
the Growth
|
|
|
| |
•
|
Achieve or exceed Williams’
EVA®,
earnings and cash flow goals. Also achieve attractive growth in
value for Williams and Williams Partners investors.
|
| |
| |
•
|
Openly engage with communities, vendors and other stakeholders
crucial to Williams’ success so that Williams grows the
competitive advantage we enjoy as a preferred partner.
|
| |
| |
•
|
Operate the business in a way that grows Williams’
reputation as a leader in environmental stewardship.
|
114
During 2010, Williams made significant strides toward achieving
Williams’ Game Plan for Growth. The following are some of
the most impactful 2010 accomplishments:
|
|
|
| |
•
|
Completed the transformation of Williams Partners to a large
diversified master limited partnership with reliable access to
capital markets. This was accomplished through:
|
|
|
|
| |
•
|
Strategic asset drop-downs from Williams to Williams Partners;
and
|
| |
| |
•
|
The merger of Williams Partners and Williams Pipeline Partners
L.P.
|
|
|
|
| |
•
|
Completed significant asset acquisitions in the Marcellus Shale.
All of Williams’ businesses have a strategic presence in
the Marcellus Shale allowing Williams to leverage the strengths
of each business unit;
|
| |
| |
•
|
Invested $2.8 billion in drilling activity and acquisitions
in Williams’ Exploration & Production business.
This included $1.7 billion related to acquisitions in the
Bakken and Marcellus Shale areas. The Bakken Shale transaction
creates more diversification in Williams’ Exploration and
Production business by expanding the long-term crude oil
portfolio;
|
| |
| |
•
|
Invested $1 billion in capital and investment expenditures
in the midstream businesses and invested $473 million in
capital expenditures in Williams’ gas pipelines business in
2010;
|
| |
| |
•
|
Expanded ownership of the Overland Pass Pipeline;
|
| |
| |
•
|
Maintained Williams’ investment grade credit rating while
achieving an upgrade of Williams Partners to an investment grade
credit rating; and
|
| |
| |
•
|
In addition to continuing to expand Williams’ natural gas
businesses and drive stockholder value, Williams was recognized
for its efforts to make Williams a great place to work for its
employees;
|
|
|
|
| |
•
|
The Houston Business Journal recognized Williams as a Best Place
to Work in Houston among companies not based in Houston. This
was the third year in a row Williams was recognized on the Best
Place to Work in Houston list;
|
| |
| |
•
|
Utah Business magazine named Williams as a finalist in its Best
Companies to Work for program, where Williams was recognized as
one of the four best medium-sized companies in Utah for the
second year in a row;
|
| |
| |
•
|
OKCBiz magazine recognized Williams on its Best Places to Work
in Oklahoma list for the third year in a row; and
|
| |
| |
•
|
Tulsa Business Journal’s Economic Development Impact Awards
recognized Williams as a finalist for the Best Workplace for
Young Professionals.
|
How
Williams Determines the Amount for Each Type of Pay
Long-term incentives, annual cash incentives, base pay and
benefits accomplish different objectives.
Long-Term
Incentives
Williams awards long-term incentives to reward performance and
align NEOs with long-term stockholder interests by providing
NEOs with an ownership stake in Williams, encouraging sustained
long-term performance and providing an important retention
element to their compensation program. Long-term incentives are
provided in the form of equity and may include performance based
RSUs, stock options and time-based RSUs.
To determine the value for long-term incentives granted to an
NEO each year, Williams considers the following factors:
|
|
|
| |
•
|
the proportion of long-term incentives relative to base pay;
|
| |
| |
•
|
the NEO’s impact on Williams’ performance and ability
to create value;
|
115
|
|
|
| |
•
|
long-term business objectives;
|
| |
| |
•
|
awards made to NEOs in similar positions within Williams’
comparator group of companies
|
| |
| |
•
|
the market demand for the NEO’s particular skills and
experience;
|
| |
| |
•
|
the amount granted to other NEOs in comparable positions at
Williams;
|
| |
| |
•
|
the NEO’s demonstrated performance over the past few
years; and
|
| |
| |
•
|
the NEO’s leadership performance.
|
The allocation of the long-term incentive program for 2010 is
shown on page 105. The long-term incentive mix for the NEOs
is shown on page 101.
The primary objectives for each type of equity awarded are shown
below. The size of the circles in the chart indicates how
closely each equity type aligns with each objective.
| |
|
|
|
|
|
|
|
|
|
|
|
|
|
|
|
Drives operating
|
|
|
|
|
|
Stockholder
|
|
|
|
and financial
|
|
Retention
|
|
Equity type and Performance Drivers
|
|
alignment
|
|
Stock ownership
|
|
performance
|
|
Incentive
|
|
|
Performance-Based RSUs
Absolute and Relative TSR
|
|
l
|
|
l
|
|
l
|
|
|
Stock Options
Stock Price Appreciation
|
|
l
|
|
l
|
|
l
|
|
|
Time-Based RSUs
Stock Price Appreciation
|
|
l
|
|
l
|
|
|
|
l
|
2010
Performance-Based RSUs
Performance-based RSU awards further strengthen the relationship
between pay and performance and over time will more closely link
the long-term pay of the NEOs to the experience of
Williams’ long-term stockholders.
Williams believes it is important to measure TSR on both an
absolute and a relative basis. In absolute terms, Williams wants
to ensure it is delivering a responsible return to stockholders.
Additionally, Williams believes awards should be influenced by
how TSR compares to the TSR of companies in Williams’
comparator group. Shown in the chart below are the absolute and
relative TSR targets for the performance-based restricted stock
unit awards for the 2010 to 2012 performance period and the
continuum that will determine the resulting potential payout
level:
2008
Performance-Based RSUs
The performance cycle for Williams’ 2008 performance-based
RSUs ended in 2010. As discussed earlier, Williams did not
attain threshold performance during the three-year period as a
result of the global economic crisis. No performance-based RSU
awards that were granted in 2008 were paid out under this plan.
This resulted in each NEO losing a significant portion of pay
that was targeted for
2008-2010.
The performance goals for this award were set during a less
volatile time based on market guidance and expectations for
116
Williams’ performance at that time. The following is a
chart of the threshold, target and stretch goals that were
established in early 2008.
| |
|
|
EVA®
|
|
Payout Level as a % of Target
|
|
(Millions)
|
|
(Attainment %)
|
|
|
|
|
|
Threshold
|
|
$191
|
|
(where incentives start to be earned)
|
|
$299
|
|
100%
|
|
$407
|
|
200%
|
Stock
Option Awards
For recipients, stock options have value only to the extent the
price of the common stock is higher on the date the options are
exercised than it was on the date the options were granted.
Time-Based
RSUs
Williams uses this type of equity to retain executives and to
facilitate stock ownership. The use of time-based RSUs is also
consistent with the practices of Williams’ comparator group
of companies.
Grant
Practices
Historically, the Committee typically approves the annual equity
grant in February or early March of each year shortly after the
annual earnings release. The grant date for awards is on or
after the date of such approval to ensure the market has time to
absorb material information disclosed in the earnings release
and reflect that information in the stock price.
The grant date for off-cycle grants for individuals who are not
Williams’ executive officers, for reasons such as retention
or new hires, is the first business day of the month following
the approval of the grant. By using this consistent approach,
Williams removes grant timing from the influence of the release
of material information.
Looking Forward—We intend to establish an equity
plan prior to completion of this offering. The design of the
plan and the form, terms and conditions of future long-term
incentive awards available for grant thereunder have not been
determined at this time.
Annual
Cash Incentives
Williams provides annual cash incentives to encourage and reward
NEOs for making decisions that improve Williams’
performance as measured by
EVA®.
EVA®
measures the value created by a company. Simply stated, it is
the financial return in a given period less the capital charge
for that period. The calculation used is as follows:
| |
|
|
|
|
|
|
|
|
|
EVA®
|
|
=
|
|
Adjusted Net Operating
Profits after Taxes
(NOPAT)
|
|
Less
|
|
Adjusted Capital Charge (the amount
of capital invested by Williams
multiplied by the cost of capital)
|
Generating profits in excess of both operating and capital costs
(debt and equity) creates
EVA®.
If
EVA®
improves, value has been created. The objectives of the
EVA®
-based incentive program are to:
|
|
|
| |
•
|
Motivate and incent management to choose strategies and
investments that maximize long-term stockholder value;
|
| |
| |
•
|
Offer sufficient incentive compensation to motivate management
to put forth extra effort, take prudent risks and make tough
decisions to maximize stockholder value;
|
| |
| |
•
|
Provide sufficient total compensation to retain
management; and
|
117
|
|
|
| |
•
|
Limit the cost of compensation to levels that will maximize the
wealth of current stockholders without compromising the other
objectives.
|
The
EVA®
Calculation
EVA®
is first calculated as NOPAT less Capital Charge. Williams’
incentive program allows for the Committee to make adjustments
to
EVA®
calculations to reflect certain business events. After studying
companies that utilize
EVA®
as an incentive measure, Williams determined that it is standard
practice to make adjustments to
EVA®
calculations to create better alignment with stockholders.
When determining which adjustments are appropriate, Williams is
guided by the principle that incentive payments should not
result in unearned windfalls or impose undue penalties. In other
words, Williams makes adjustments to ensure NEOs are not
rewarded for positive results they did not facilitate nor are
they penalized for certain unusual circumstances outside their
control. Williams believes the adjustments improve the alignment
of incentives with stockholder value creation and ensure
EVA®
is an incentive measure that effectively encourages NEOs to take
actions to create value for stockholders. The categories of
potential adjustments to the
EVA®
calculation are:
|
|
|
| |
•
|
Gains, losses and impairments;
|
| |
| |
•
|
Mark-to-market,
commodity price collar and construction
work-in-progress; and
|
| |
| |
•
|
Other unusual items that could result in unearned windfalls or
undue penalties to NEOs such as certain litigation matters and
natural disasters.
|
Williams’ management regularly reviews with the Committee a
supplemental scorecard reflecting Williams’ segment profit,
earnings per share, cash flow from operations and safety to
provide updates regarding Williams’ performance as well as
to ensure alignment between these measures and
EVA®.
This scorecard provides the Committee with additional data to
assist in determining final AIP awards. There is strong
correlation between Williams’
EVA®
performance and other metrics included on the supplemental
scorecard.
The Committee’s independent compensation consultant
annually compares Williams’ relative performance on various
measures, including total stockholder return, earnings per share
and cash flow, with Williams’ comparator group of
companies. The Committee also uses this analysis to validate the
reasonableness of the
EVA®
results.
Annual
Cash Incentives—Target
The starting point to determine annual cash incentive targets
(expressed as a percent of base pay) is competitive market
information, which gives Williams an idea of what other
companies target to pay in annual cash incentives for similar
jobs. Williams also considers the internal value of each
job—i.e., how important the job is to executing its
strategy compared to other jobs in Williams—before the
target is set for the year. The annual cash incentive targets as
a percentage of base pay for the NEOs in 2010 were as follows:
| |
|
|
|
|
|
Mr. Malcolm
|
|
|
100
|
%
|
|
Mr. Chappel
|
|
|
75
|
%
|
|
Other NEOs
|
|
|
65
|
%
|
Annual
Cash Incentives—Actual
For NEOs, the annual cash incentive program is funded when
Williams attains an established level of
EVA®
performance. Applying
EVA®
measurement to this annual cash incentive process encourages
management to make business decisions that help drive long-term
stockholder value. To determine the funding of the annual cash
incentive, Williams uses the following calculation for each NEO:
| |
|
|
|
|
|
|
|
|
|
Base Pay received in 2010
|
|
X
|
|
Incentive Target %
|
|
X
|
|
EVA®
Goal Attainment %
|
118
Actual payments may be adjusted upwards to recognize individual
performance that exceeded expectations, such as success toward
the Game Plan for Growth and individual goals and successful
demonstration of the leadership competencies discussed in the
Base Pay section on page 111. Payments may also be adjusted
downwards if performance warrants.
How
Williams Sets the
EVA®
Goals
Setting the
EVA®
goals for the annual cash incentive program begins with internal
budgeting and planning. This rigorous process includes an
evaluation of the challenges and opportunities for Williams and
each of its business units. The key steps are as follows:
|
|
|
| |
•
|
Business and financial plans are submitted by the business units
and consolidated by the corporate planning department.
|
| |
| |
•
|
The business and financial plans are reviewed and analyzed by
Williams’ chief executive officer, chief financial officer
and other named executive officers.
|
| |
| |
•
|
Using the plan guidance, Williams’ management establishes
the
EVA®
goal and recommends it to the Committee.
|
| |
| |
•
|
The Committee reviews, discusses and makes adjustments as
necessary to management’s recommendations and sets the goal
at the beginning of each fiscal year.
|
| |
| |
•
|
Thereafter, progress toward the goal is regularly monitored and
reported to the Committee throughout the year.
|
2010
EVA®
Goal for the Annual Cash Incentive Program
The attainment percentage of
EVA®
goals results in payment of annual cash incentives along a
continuum between threshold and stretch levels, which
corresponds to 0% through 250% of the NEO’s annual cash
incentive target. The chart below shows the
EVA®
improvement goals for the 2010 annual cash incentive and the
resulting payout level. It is important to note that setting the
EVA®
goal for 2010 was again challenging considering the uncertain
economic and commodity price environment. The
EVA®
goal established in 2010 was more challenging than the 2009
EVA®
goal, reflecting an anticipated improvement in economic
conditions.
| |
|
|
EVA®
|
|
Payout Level as a % of Target
|
|
(Millions)
|
|
(Attainment %)
|
|
|
|
|
|
Threshold
|
|
($563)
|
|
(where incentives start to be earned)
|
|
($347)
|
|
100%
|
|
($131)
|
|
200%
|
As noted,
EVA®
considers both financial earnings and a cost of capital in
measuring performance. The two main components of
EVA®
are NOPAT and a charge for the cost of capital.
EVA®,
like other performance metrics, has been impacted by the
economic environment. NOPAT improved from 2009, but fell
slightly below the 2010 plan while the 2010 charge for the cost
of capital was better than 2009 and better than plan. As a
result of the NOPAT and capital charge changes, total
EVA®
improved significantly from 2009 but was only modestly above the
2010 plan target.
Based on
EVA®
performance relative to the established goals, the Committee
certified performance results of ($337) million in
EVA®
and approved payment of the annual cash incentive program at
105% of target.
Looking Forward—We intend to establish an annual
cash incentive program to reward our executive officers. At this
time, the design of the program, including the target
opportunity and the performance metric(s), has not been
determined.
119
Base
Pay
Base pay compensates NEOs for carrying out the duties of their
jobs, and serves as the foundation of Williams’ pay
program. Most other major components of pay are set based on a
relationship to base pay, including annual and long-term
incentives and retirement benefits.
Base pay for NEOs is set considering the market median, with
potential individual variation from the median due to
experience, skills and sustained performance of the individual
as part of Williams’
pay-for-performance
philosophy. Performance is measured in two ways: through the
“Right Results” obtained in the “Right Way.”
Right Results considers the NEOs’ success in attaining
their annual goals as they relate to the Game Plan for Growth,
business unit strategies and personal development plans. Right
Way reflects the NEOs’ behavior as exhibited through
Williams’ leadership competencies. The following table
contains these competencies grouped within Williams’ five
leadership areas.
| |
|
|
|
|
|
|
|
|
|
|
|
INSPIRE A
|
|
|
|
|
|
OPTIMIZE
|
MODEL THE
|
|
SHARED
|
|
CHAMPION
|
|
LEVERAGE
|
|
BUSINESS
|
|
WAY
|
|
VISION
|
|
INNOVATION
|
|
TALENT
|
|
PERFORMANCE
|
|
|
|
Caring About People
|
|
Enterprise Perspective
|
|
Change Leadership
|
|
Building Effective Teams
|
|
Business Acumen
|
|
Integrity
|
|
Vision and Strategic Perspective
|
|
Entrepreneurial Spirit
|
|
Communication
|
|
Customer and Market Focus
|
|
Loyalty and Commitment
|
|
|
|
Promoting Diversity and Creativity
|
|
Developing People Resources
|
|
Decision Making
|
|
|
|
|
|
Willingness to Take Risks
|
|
Empowering Others
|
|
Drive for Results
|
|
|
|
|
|
|
|
Managerial Courage
|
|
Functional/Technical Skills
|
|
|
|
|
|
|
|
Motivating and Inspiring Others
|
|
|
Looking Forward—Our pay philosophy and comparator
company group has been determined. This philosophy along with
comparator company pay information will influence the base pay
decisions of our executive officers. We currently expect this to
be applied beginning in 2012.
Benefits
Consistent with Williams’ philosophy to emphasize pay for
performance, NEOs receive very few perquisites (perks) or
supplemental benefits. They are as follows:
|
|
|
| |
•
|
Retirement Restoration Benefits. All NEOs
participate in Williams’ qualified retirement program on
the same terms as other Williams’ employees. Williams
offers a retirement restoration plan to NEOs to maintain a
proportional level of pension benefits to officers as provided
to other employees. The Code limits qualified pension benefits
based on an annual compensation limit. For 2010, the limit was
$245,000. Any reduction in an NEO’s pension benefit in the
tax-qualified pension plan due to this limit is made up for
(subject to a cap) in the unfunded restoration retirement plan.
Benefits for NEOs are calculated using the same benefit formula
as that used to calculate benefits for all employees in the
qualified pension plan. The value of pay in the form of stock
option or other equity is not used in the formula to calculate
benefits under the pension plan or restoration plan for NEOs,
which is consistent with the treatment for all employees.
Additionally, Williams does not provide a nonqualified benefit
related to the qualified 401(k) defined contribution retirement
plan.
|
| |
| |
•
|
Financial Planning Allowance. Williams offers
financial planning to the NEOs to provide expertise on current
tax laws with personal financial planning and preparations for
contingencies such as death and disability. In addition, by
working with a financial planner, executive officers gain a
better understanding of and appreciation for the programs
Williams provides, which helps to maximize the retention and
engagement aspects of the dollars Williams spends on these
programs.
|
120
|
|
|
| |
•
|
Home Security. Williams paid 2010 home
security system and monitoring fees for its former CEO,
Mr. Malcolm.
|
| |
| |
•
|
Personal Use of Williams’ Company
Aircraft. Williams provides limited personal use
of Williams’ company aircraft at the Williams CEO’s
discretion. There was limited personal use of Williams’
company aircraft by the NEOs in 2010 and the details are
provided in the footnote to the Summary Compensation Table.
|
| |
| |
•
|
Event Center. Williams has a suite and club
seats at an event center that were purchased for business
purposes. If it is not being used for business purposes,
Williams makes them available to all employees, including the
NEOs, as a form of reward and recognition.
|
| |
| |
•
|
Executive Physicals. The Committee approved
physicals for the NEOs beginning in 2009. Executive officer
physicals align with Williams’ wellness initiative as well
as assist Williams in mitigating risk. These physicals reduce
vacancy succession risk because they help to identify and
prevent issues that would leave a role vacated unexpectedly.
|
Looking Forward—Our pay philosophy has been
determined. This information and competitive market information
will influence the design of our benefits program. The form of
these designed benefit programs will influence the offering of
any supplemental benefits. Any perquisites to be offered have
not been defined at this time.
Additional
Components of Williams’ Executive Compensation
Program
In addition to establishing the pay elements described above,
Williams has adopted a number of policies to further the goals
of the executive compensation program, particularly with respect
to strengthening the alignment of NEOs’ interests with
stockholder long-term interests.
Recoupment
Policy
In 2008, the Committee approved a recoupment policy to allow
Williams to recover incentive-based compensation from executive
officers in the event Williams is required to restate the
financial statements due to fraud or intentional misconduct. The
policy provides the Board discretion to determine situations
where recovery of incentive pay is appropriate.
Stock
Ownership Guidelines
All NEOs must hold an equity interest in
Williams. The chart below shows the NEO stock
ownership guidelines, which have been in effect since 2005:
| |
|
|
|
|
|
|
|
|
|
|
|
|
|
|
|
Holding Requirement as
|
|
|
|
|
|
|
|
a multiple of Base Pay
|
|
|
Time Frame for
|
|
|
Position
|
|
2010
|
|
|
2011
|
|
|
Compliance
|
|
|
|
|
Mr. Malcolm
|
|
|
5
|
|
|
|
6
|
|
|
|
5 Years
|
|
|
Other NEOs
|
|
|
3
|
|
|
|
3
|
|
|
|
5 Years
|
|
Annually the Committee reviews the guidelines for
competitiveness and alignment with best practice and monitors
the NEOs’ progress toward compliance. The Committee
increased the Williams CEO’s ownership guideline from five
times base pay to six times base pay beginning in 2011. Shares
owned outright and unvested performance-based and time-based
RSUs count as owned for purposes of the program. Stock options
are not included. The Committee maintains discretion to modify
the guidelines in special circumstances of financial hardship
such as illness of the NEO or a family member.
Derivative
Transactions
Williams’ insider trading policy applies to transactions in
positions or interests whose value is based on the performance
or price of the common stock. Because of the inherent potential
for abuse, Williams prohibits
121
officers, directors and certain key employees from entering into
short sales or use of equivalent derivative securities.
Accounting
and Tax Treatment
Williams considers the impact of accounting and tax treatment
when designing all aspects of pay, but the primary driver of its
program design is to support its business objectives. Stock
options and performance-based RSUs are intended to satisfy the
requirements for performance-based compensation as defined in
Section 162(m) of the Code and are therefore considered a
tax deductible expense. Time-based RSUs do not qualify as
performance-based and may not be fully deductible.
Williams’ annual cash incentive program satisfies the
requirements for performance-based compensation as defined in
Section 162(m) of the Code and is therefore a tax
deductible expense. For payments under Williams’ annual
cash incentive program to be considered performance-based
compensation under Section 162(m), the Committee can only
exercise negative discretion relative to actual performance when
determining the amount to be paid. In order to ensure compliance
with Section 162(m), the Committee has established a target
in excess of the maximum individual payout allowed to
Williams’ named executive officers under the annual cash
incentive program. Reductions are made each year and are not a
reflection of the performance of the Williams’ named
executive officers but rather ensure flexibility with respect to
paying based upon performance.
Employment
Agreements
Williams does not enter into employment agreements with the NEOs
and can remove an NEO when it is in the best interest of the
Company.
Termination
and Severance Arrangements
The NEOs are not covered under a severance plan. However the
Committee may exercise judgment and consider the circumstances
surrounding each departure and may decide a severance package is
appropriate. In designing a severance package, the Committee
takes into consideration the NEO’s term of employment, past
accomplishments, reasons for separation from Williams and
competitive market practice. The only pay or benefits an
employee has a right to receive upon termination of employment
are those that have already vested or which vest under the terms
in place when an award was granted.
Rationale
for Change in Control Agreements
Williams’ change in control agreements, in conjunction with
the NEOs’ RSU agreements, provide separation benefits for
the NEOs. Williams’ program includes a double trigger for
benefits and equity vesting. This means there must be a change
in control of Williams and the NEO’s employment must
terminate prior to receiving benefits under the agreement. While
a double trigger for equity is not the competitive norm of
Williams’ comparator group, this practice creates security
for the NEOs but does not provide an incentive for NEOs to leave
Williams. The program is designed to encourage the NEOs to focus
on the best interests of Williams’ stockholders by
alleviating their concerns about a possible detrimental impact
to their compensation and benefits under a potential Williams
change in control, not to provide compensation advantages to
NEOs for executing a transaction.
The Committee reviews Williams’ change in control benefits
annually to ensure they are consistent with competitive practice
and aligned with Williams’ compensation philosophy. As part
of the review, calculations are performed to determine the
overall program costs to Williams if a change in control event
were to occur and all covered NEOs were terminated as a result.
An assessment of competitive norms including the reasonableness
of the elements of compensation received is used to validate
benefit levels for a change in control. In reviewing the change
in control program in 2010 and 2011, the Committee concluded
that certain changes to the benefits provided are appropriate.
The Committee approved eliminating the excise tax
gross-up
provision from the change in control program. The Committee
opted to provide a ‘best net’ provision providing NEOs
with the better of their after-tax benefit capped at the safe
harbor amount or their benefit paid in full subjecting them to
possible excise tax payments. Therefore, in 2011 Williams
provided the one year
122
notice required by the NEOs’ change in control agreements
in order to effect the change in 2012. After this provision is
implemented, Williams will no longer provide additional
compensation to address excise taxes. The Committee continues to
believe that offering a change in control program is appropriate
and critical to attracting and retaining executive talent and
keeping them aligned with Williams’ stockholder interests
in the event of a change in control of Williams.
The following chart details the benefits received if an NEO were
to be terminated or resigned for a defined good reason following
a change in control as well as an analysis of those benefits as
it relates to Williams, stockholders and the NEO. Please also
see the “Change in Control Agreements” section below
for further discussion of Williams’ change in control
program.
| |
|
|
|
|
|
|
|
What does the
|
|
|
|
|
|
benefit provide to
|
|
What does the
|
Change in Control
|
|
Williams and
|
|
benefit provide to
|
|
Benefit
|
|
stockholders?
|
|
the NEO?
|
|
|
|
Multiple of 3x base pay plus annual cash incentive at target
|
|
Encourages NEOs to remain engaged and stay focused on
successfully closing the transaction.
|
|
Financial security for the NEO equivalent to three years of
continued employment.
|
|
|
|
|
|
|
|
Accelerated vesting of stock awards
|
|
An incentive to stay during and after a change in control. If
there is risk of forfeiture, NEOs may be less inclined to stay
or to support the transaction.
|
|
The NEOs are kept whole, if they have a separation from service
following a change in control.
|
|
|
|
|
|
|
|
Up to 18 months of medical or health coverage through COBRA
|
|
This is a minimal cost to Williams that creates a competitive
benefit.
|
|
Access to health coverage.
|
|
|
|
|
|
|
|
3x the previous year’s retirement restoration allocation
|
|
This is a minimal cost to Williams that creates a competitive
benefit.
|
|
May allow those NEOs who are nearing retirement to receive a
cash payment to make up for lost allocations due to a change in
control.
|
|
|
|
|
|
|
|
Reimbursement of legal fees to enforce benefit
|
|
Keeps NEOs focused on Williams and not concerned about whether
the acquiring company will honor commitments after a change in
control.
|
|
Security during a non-stable period of time.
|
|
|
|
|
|
|
|
Outplacement assistance
|
|
Keeps NEOs focused on supporting the transaction and less
concerned about trying to secure another position.
|
|
Assists NEOs in finding a comparable executive position.
|
Looking Forward—We have yet to determine the extent
to which any of these programs may be provided to our executive
officers.
123
Executive
Compensation and Other Information
2010
Summary Compensation Table
The following table sets forth certain information with respect
to the compensation of the NEOs earned during fiscal years 2010,
2009 and 2008.
| |
|
|
|
|
|
|
|
|
|
|
|
|
|
|
|
|
|
|
|
|
|
|
|
|
|
|
|
|
|
|
|
|
|
|
|
|
|
|
|
|
|
|
|
|
|
|
|
|
|
|
|
|
|
|
|
|
|
Change in
|
|
|
|
|
|
|
|
|
|
|
|
|
|
|
|
|
|
|
|
|
|
|
|
|
|
|
|
|
Pension
|
|
|
|
|
|
|
|
|
|
|
|
|
|
|
|
|
|
|
|
|
|
|
|
|
|
|
|
|
Value and
|
|
|
|
|
|
|
|
|
|
|
|
|
|
|
|
|
|
|
|
|
|
|
|
|
|
|
|
|
Nonqualified
|
|
|
|
|
|
|
|
|
|
|
|
|
|
|
|
|
|
|
|
|
|
|
|
|
|
Non-Equity
|
|
|
Deferred
|
|
|
|
|
|
|
|
Name and Principal
|
|
|
|
|
|
|
|
|
|
|
Stock
|
|
|
Option
|
|
|
Incentive Plan
|
|
|
Compensation
|
|
|
All Other
|
|
|
|
|
|
Position(1)
|
|
Year
|
|
|
Salary(2)
|
|
|
Bonus
|
|
|
Awards(3)
|
|
|
Awards(4)
|
|
|
Compensation(5)
|
|
|
Earnings(6)
|
|
|
Compensation(7)
|
|
|
Total
|
|
|
|
|
|
|
|
|
|
|
|
|
|
|
|
|
|
|
|
|
|
|
|
|
|
|
|
|
|
|
|
|
|
|
|
|
|
|
|
|
|
|
Steven J. Malcolm
|
|
|
2010
|
|
|
$
|
1,100,000
|
|
|
$
|
—
|
|
|
$
|
2,936,283
|
|
|
$
|
1,902,806
|
|
|
$
|
1,276,378
|
|
|
$
|
744,426
|
|
|
$
|
43,805
|
|
|
$
|
8,003,698
|
|
|
Former Chairman, President &
|
|
|
2009
|
|
|
|
1,142,308
|
|
|
|
—
|
|
|
|
2,116,863
|
|
|
|
2,846,407
|
|
|
|
1,903,360
|
|
|
|
1,399,796
|
|
|
|
71,100
|
|
|
|
9,479,835
|
|
|
Chief Executive Officer
|
|
|
2008
|
|
|
|
1,094,231
|
|
|
|
—
|
|
|
|
2,906,309
|
|
|
|
2,789,127
|
|
|
|
2,000,000
|
|
|
|
1,201,514
|
|
|
|
56,134
|
|
|
|
10,047,315
|
|
|
of Williams
|
|
|
|
|
|
|
|
|
|
|
|
|
|
|
|
|
|
|
|
|
|
|
|
|
|
|
|
|
|
|
|
|
|
|
|
|
|
|
|
|
|
|
|
|
|
|
|
|
|
|
|
|
|
|
|
|
|
|
|
|
|
|
|
|
|
|
|
|
|
|
|
|
|
|
|
|
|
|
|
|
|
|
|
|
|
|
|
|
|
|
|
|
|
|
|
|
|
|
|
|
|
|
|
|
|
|
|
|
|
|
|
|
|
Donald R. Chappel
|
|
|
2010
|
|
|
|
610,154
|
|
|
|
—
|
|
|
|
1,436,882
|
|
|
|
407,743
|
|
|
|
559,052
|
|
|
|
225,539
|
|
|
|
16,320
|
|
|
|
3,255,690
|
|
|
Chief Financial Officer
|
|
|
2009
|
|
|
|
623,077
|
|
|
|
—
|
|
|
|
1,242,734
|
|
|
|
618,783
|
|
|
|
765,047
|
|
|
|
383,380
|
|
|
|
16,320
|
|
|
|
3,649,341
|
|
|
of Williams
|
|
|
2008
|
|
|
|
597,115
|
|
|
|
—
|
|
|
|
2,114,349
|
|
|
|
651,405
|
|
|
|
780,008
|
|
|
|
330,531
|
|
|
|
15,744
|
|
|
|
4,489,152
|
|
|
|
|
|
|
|
|
|
|
|
|
|
|
|
|
|
|
|
|
|
|
|
|
|
|
|
|
|
|
|
|
|
|
|
|
|
|
|
|
|
|
|
|
|
|
|
|
|
|
|
|
|
|
|
|
|
|
|
|
|
|
|
|
|
|
|
|
|
|
|
|
|
|
|
|
|
|
Ralph A. Hill
|
|
|
2010
|
|
|
|
493,208
|
|
|
|
—
|
|
|
|
1,257,287
|
|
|
|
356,777
|
|
|
|
384,479
|
|
|
|
315,626
|
|
|
|
16,304
|
|
|
|
2,823,681
|
|
|
Senior Vice President —
|
|
|
2009
|
|
|
|
503,654
|
|
|
|
—
|
|
|
|
1,056,319
|
|
|
|
525,969
|
|
|
|
566,473
|
|
|
|
427,867
|
|
|
|
37,786
|
|
|
|
3,118,068
|
|
|
Exploration & Production of Williams
|
|
|
2008
|
|
|
|
480,962
|
|
|
|
—
|
|
|
|
1,606,867
|
|
|
|
495,071
|
|
|
|
579,633
|
|
|
|
363,151
|
|
|
|
30,371
|
|
|
|
3,556,055
|
|
|
|
|
|
|
|
|
|
|
|
|
|
|
|
|
|
|
|
|
|
|
|
|
|
|
|
|
|
|
|
|
|
|
|
|
|
|
|
|
|
|
|
|
|
|
|
|
|
|
|
|
|
|
|
|
|
|
|
|
|
|
|
|
|
|
|
|
|
|
|
|
|
|
|
|
|
|
James J. Bender
|
|
|
2010
|
|
|
|
477,954
|
|
|
|
—
|
|
|
|
933,975
|
|
|
|
265,033
|
|
|
|
359,122
|
|
|
|
188,427
|
|
|
|
33,900
|
|
|
|
2,258,411
|
|
|
Senior Vice President and General
|
|
|
2009
|
|
|
|
488,077
|
|
|
|
—
|
|
|
|
807,773
|
|
|
|
402,209
|
|
|
|
522,119
|
|
|
|
250,679
|
|
|
|
26,647
|
|
|
|
2,497,504
|
|
|
Counsel of Williams
|
|
|
2008
|
|
|
|
466,538
|
|
|
|
—
|
|
|
|
1,271,209
|
|
|
|
390,840
|
|
|
|
533,132
|
|
|
|
216,799
|
|
|
|
30,323
|
|
|
|
2,908,842
|
|
|
|
|
|
|
|
|
|
|
|
|
|
|
|
|
|
|
|
|
|
|
|
|
|
|
|
|
|
|
|
|
|
|
|
|
|
|
|
|
|
|
|
|
|
|
|
|
|
|
|
|
|
|
|
|
|
|
|
|
|
|
|
|
|
|
|
|
|
|
|
|
|
|
|
|
|
|
Robyn L. Ewing
|
|
|
2010
|
|
|
|
442,692
|
|
|
|
—
|
|
|
|
933,975
|
|
|
|
265,033
|
|
|
|
328,364
|
|
|
|
233,254
|
|
|
|
35,579
|
|
|
|
2,238,897
|
|
|
Senior Vice President and Chief
|
|
|
2009
|
|
|
|
446,538
|
|
|
|
—
|
|
|
|
745,640
|
|
|
|
371,269
|
|
|
|
485,362
|
|
|
|
304,374
|
|
|
|
31,093
|
|
|
|
2,384,277
|
|
|
Administrative Officer of
|
|
|
2008
|
|
|
|
370,198
|
|
|
|
—
|
|
|
|
299,757
|
|
|
|
118,485
|
|
|
|
435,072
|
|
|
|
248,784
|
|
|
|
30,096
|
|
|
|
1,502,392
|
|
|
Williams
|
|
|
|
|
|
|
|
|
|
|
|
|
|
|
|
|
|
|
|
|
|
|
|
|
|
|
|
|
|
|
|
|
|
|
|
|
|
|
|
|
(1) |
|
Name and Principal Position. On January 3, 2011
Mr. Malcolm retired as Chairman, President and Chief
Executive Officer of Williams. |
| |
|
(2) |
|
Salary. All NEOs did not receive a salary increase in
2009. The increase in the reported 2009 salary was due to a
payroll timing issue resulting in a 27th bi-weekly paycheck
being issued in the calendar year. |
| |
|
(3) |
|
Stock Awards. Awards were granted under the terms of
Williams’ 2007 Incentive Plan and include time-based and
performance-based RSUs. Amounts shown are the grant date fair
value of awards computed in accordance with FASB ASC Topic 718.
The assumptions used to value the stock awards can be found in
Williams’ Annual Report on
Form 10-K
for the year-ended December 31, 2010. |
| |
|
|
|
The potential maximum values of the performance-based RSUs,
subject to changes in performance outcomes, are as follows: |
| |
|
|
|
|
|
|
|
2010 Performance-Based RSU
|
|
|
|
|
Maximum potential
|
|
|
|
|
Steven J. Malcolm
|
|
$
|
5,872,566
|
|
|
Donald R. Chappel
|
|
|
1,468,141
|
|
|
Ralph A. Hill
|
|
|
1,284,639
|
|
|
James J. Bender
|
|
|
954,294
|
|
|
Robyn L. Ewing
|
|
|
954,294
|
|
|
|
|
|
(4) |
|
Option Awards. Awards are granted under the terms of
Williams’ 2007 Incentive Plan and include non-qualified
stock options. Amounts shown are the grant date fair value of
awards computed in accordance with FASB ASC Topic 718. The
assumptions used to value the option awards can be found in our
Annual Report on
Form 10-K
for the year-ended December 31, 2010. |
| |
|
(5) |
|
Non-Equity Incentive Plan. Under Williams’ AIP, the
maximum annual incentive pool funding for NEOs is 250% of
target. The reserve provision of the AIP was eliminated in 2009
and the outstanding balances for the NEOs remained at risk over
a three year performance period in which threshold performance
levels must be attained in order for the balances to be paid and
will be reduced if threshold is not met in accordance with
previous plan provisions. Threshold performance was met in 2009
and 2010 and a portion of the respective reserve balance was
paid to each NEO each year. |
124
|
|
|
|
|
|
The annual cash incentive and reserve amounts paid in 2011 as it
relates to 2010 performance are as follows: |
| |
|
|
|
|
|
|
|
|
|
|
|
|
|
|
|
|
|
|
|
|
|
|
|
|
|
Amount of
|
|
|
Total AIP plus
|
|
|
|
|
Reserve
|
|
|
AIP
|
|
|
Reserve
|
|
|
Reserve
|
|
|
|
|
Balance
|
|
|
for 2010
|
|
|
Paid in 2011
|
|
|
for 2010
|
|
|
|
|
Steven J. Malcolm
|
|
$
|
242,756
|
|
|
$
|
1,155,000
|
|
|
$
|
121,378
|
|
|
$
|
1,276,378
|
|
|
Donald R. Chappel
|
|
|
60,103
|
|
|
|
529,000
|
|
|
|
30,052
|
|
|
|
559,052
|
|
|
Ralph A. Hill
|
|
|
72,958
|
|
|
|
348,000
|
|
|
|
36,479
|
|
|
|
384,479
|
|
|
James J. Bender
|
|
|
44,244
|
|
|
|
337,000
|
|
|
|
22,122
|
|
|
|
359,122
|
|
|
Robyn L. Ewing
|
|
|
20,728
|
|
|
|
318,000
|
|
|
|
10,364
|
|
|
|
328,364
|
|
|
|
|
|
(6) |
|
Change in Pension Value and Nonqualified Deferred
Compensation Earnings. The amount shown is the aggregate
change from December 31, 2009 to December 31, 2010 in
the actuarial present value of the accrued benefit under the
qualified pension and supplemental plan sponsored by Williams.
Please refer to the “Pension Benefits” table for
further details of the present value of the accrued benefit. The
underlying benefit programs have been consistent during the time
period displayed. The primary reason for the fluctuation in the
change in present value during this time is due to the use of
updated discount rates and conversion rates. |
| |
|
(7) |
|
All Other Compensation. Amounts shown represent payments
by Williams made on behalf of the NEOs and includes life
insurance premium, a 401(k) matching contribution and
perquisites (if applicable). Perquisites include financial
planning services, mandated annual physical exam, home security
monitoring for the CEO and personal use of Williams’
company aircraft. The incremental cost method was used to
calculate the personal use of the Company aircraft. The
incremental cost calculation includes such items as fuel,
maintenance, weather and airport services, pilot meals, pilot
overnight expenses, aircraft telephone and catering. The amounts
of perquisites for Mr. Malcolm, Mr. Bender and
Ms. Ewing are included because the aggregate amounts exceed
$10,000. |
| |
|
|
|
|
|
|
|
|
|
|
|
|
|
|
|
|
|
|
|
|
|
|
|
|
|
|
|
|
Company
|
|
|
|
|
|
|
|
Annual
|
|
|
|
|
|
Aircraft
|
|
|
|
|
Financial
|
|
|
Physical
|
|
|
Home
|
|
|
Personal
|
|
|
|
|
Planning
|
|
|
Exam
|
|
|
Security
|
|
|
Usage
|
|
|
|
|
Steven J. Malcolm
|
|
$
|
15,000
|
|
|
$
|
0
|
|
|
$
|
438
|
|
|
$
|
12,047
|
|
|
James J. Bender
|
|
|
15,000
|
|
|
|
2,646
|
|
|
|
0
|
|
|
|
0
|
|
|
Robyn L. Ewing
|
|
|
15,000
|
|
|
|
4,437
|
|
|
|
0
|
|
|
|
0
|
|
125
2010
Grants of Williams’ Plan Based Awards
The following table sets forth certain information with respect
to the grant of stock options to acquire Williams’ stock,
RSUs with respect to Williams’ stock and awards payable
under Williams’ annual cash incentive program during the
fiscal year 2010 to the NEOs.
| |
|
|
|
|
|
|
|
|
|
|
|
|
|
|
|
|
|
|
|
|
|
|
|
|
|
|
|
|
|
|
|
|
|
|
|
|
|
|
|
|
|
|
|
|
|
|
|
|
|
|
|
|
|
|
|
|
|
|
|
|
|
|
|
|
|
|
|
|
All Other
|
|
|
|
|
|
|
|
|
|
|
|
|
|
|
|
|
|
|
|
|
|
|
|
|
|
|
|
|
|
|
|
|
|
|
Stock
|
|
|
All Other
|
|
|
|
|
|
|
|
|
|
|
|
|
|
|
|
|
|
|
|
|
|
|
|
|
|
|
|
|
|
|
|
Awards:
|
|
|
Option
|
|
|
|
|
|
Grant
|
|
|
|
|
|
|
|
|
|
|
|
|
|
|
|
|
|
|
|
|
|
|
|
|
|
Number
|
|
|
Awards
|
|
|
Exercise
|
|
|
Date Fair
|
|
|
|
|
|
|
|
|
|
|
|
|
|
|
|
|
|
|
|
|
|
|
|
|
|
of Shares
|
|
|
Number of
|
|
|
or Base
|
|
|
Value of
|
|
|
|
|
|
|
|
Equity Future Payouts Under
|
|
|
Estimated Future Payouts Under
|
|
|
of Stock
|
|
|
Securities
|
|
|
Price of
|
|
|
Stock and
|
|
|
|
|
Grant
|
|
|
Non-Equity Incentive Plan Awards(1)
|
|
|
Equity Incentive Plan Awards
|
|
|
or
|
|
|
Underlying
|
|
|
Option
|
|
|
Option
|
|
|
Name
|
|
Date
|
|
|
Threshold
|
|
|
Target
|
|
|
Maximum
|
|
|
Threshold
|
|
|
Target(2)
|
|
|
Maximum
|
|
|
Units(3)
|
|
|
Options(4)
|
|
|
Awards
|
|
|
Awards
|
|
|
|
|
Steven J. Malcolm
|
|
|
2/23/2010
|
|
|
$
|
121,378
|
|
|
$
|
1,221,378
|
|
|
$
|
2,871,378
|
|
|
|
|
|
|
|
|
|
|
|
|
|
|
|
|
|
|
|
271,055
|
|
|
$
|
21.22
|
|
|
$
|
1,902,806
|
|
|
|
|
|
2/23/2010
|
|
|
|
|
|
|
|
|
|
|
|
|
|
|
|
—
|
|
|
|
140,492
|
|
|
|
280,984
|
|
|
|
|
|
|
|
|
|
|
|
|
|
|
|
2,936,283
|
|
|
|
|
|
|
|
|
|
|
|
|
|
|
|
|
|
|
|
|
|
|
|
|
|
|
|
|
|
|
|
|
|
|
|
|
|
|
|
|
|
|
|
|
|
|
|
|
Donald R. Chappel
|
|
|
2/23/2010
|
|
|
|
30,052
|
|
|
|
487,667
|
|
|
|
1,174,090
|
|
|
|
|
|
|
|
|
|
|
|
|
|
|
|
|
|
|
|
58,083
|
|
|
|
21.22
|
|
|
|
407,743
|
|
|
|
|
|
2/23/2010
|
|
|
|
|
|
|
|
|
|
|
|
|
|
|
|
—
|
|
|
|
35,123
|
|
|
|
70,246
|
|
|
|
|
|
|
|
|
|
|
|
|
|
|
|
734,071
|
|
|
|
|
|
2/23/2010
|
|
|
|
|
|
|
|
|
|
|
|
|
|
|
|
|
|
|
|
|
|
|
|
|
|
|
|
35,123
|
|
|
|
|
|
|
|
|
|
|
|
702,811
|
|
|
|
|
|
|
|
|
|
|
|
|
|
|
|
|
|
|
|
|
|
|
|
|
|
|
|
|
|
|
|
|
|
|
|
|
|
|
|
|
|
|
|
|
|
|
|
|
|
|
|
|
|
|
|
|
|
|
|
|
|
|
|
|
|
|
|
|
|
|
|
|
|
|
|
|
|
|
|
|
|
|
|
|
|
|
|
|
|
|
|
|
|
|
Ralph A. Hill
|
|
|
2/23/2010
|
|
|
|
36,479
|
|
|
|
357,064
|
|
|
|
837,941
|
|
|
|
|
|
|
|
|
|
|
|
|
|
|
|
|
|
|
|
50,823
|
|
|
|
21.22
|
|
|
|
356,777
|
|
|
|
|
|
2/23/2010
|
|
|
|
|
|
|
|
|
|
|
|
|
|
|
|
—
|
|
|
|
30,733
|
|
|
|
61,466
|
|
|
|
|
|
|
|
|
|
|
|
|
|
|
|
642,320
|
|
|
|
|
|
2/23/2010
|
|
|
|
|
|
|
|
|
|
|
|
|
|
|
|
|
|
|
|
|
|
|
|
|
|
|
|
30,733
|
|
|
|
|
|
|
|
|
|
|
|
614,967
|
|
|
|
|
|
|
|
|
|
|
|
|
|
|
|
|
|
|
|
|
|
|
|
|
|
|
|
|
|
|
|
|
|
|
|
|
|
|
|
|
|
|
|
|
|
|
|
|
James J. Bender
|
|
|
2/23/2010
|
|
|
|
22,122
|
|
|
|
332,792
|
|
|
|
798,797
|
|
|
|
|
|
|
|
|
|
|
|
|
|
|
|
|
|
|
|
37,754
|
|
|
|
21.22
|
|
|
|
265,033
|
|
|
|
|
|
2/23/2010
|
|
|
|
|
|
|
|
|
|
|
|
|
|
|
|
—
|
|
|
|
22,830
|
|
|
|
45,660
|
|
|
|
|
|
|
|
|
|
|
|
|
|
|
|
477,147
|
|
|
|
|
|
2/23/2010
|
|
|
|
|
|
|
|
|
|
|
|
|
|
|
|
|
|
|
|
|
|
|
|
|
|
|
|
22,830
|
|
|
|
|
|
|
|
|
|
|
|
456,828
|
|
|
|
|
|
|
|
|
|
|
|
|
|
|
|
|
|
|
|
|
|
|
|
|
|
|
|
|
|
|
|
|
|
|
|
|
|
|
|
|
|
|
|
|
|
|
|
|
|
|
|
|
|
|
|
|
|
|
|
|
|
|
|
|
|
|
|
|
|
|
|
|
|
|
|
|
|
|
|
|
|
|
|
|
|
|
|
|
|
|
|
|
|
|
Robyn L. Ewing
|
|
|
2/23/2010
|
|
|
|
10,364
|
|
|
|
298,114
|
|
|
|
729,739
|
|
|
|
|
|
|
|
|
|
|
|
|
|
|
|
|
|
|
|
37,754
|
|
|
|
21.22
|
|
|
|
265,033
|
|
|
|
|
|
2/23/2010
|
|
|
|
|
|
|
|
|
|
|
|
|
|
|
|
—
|
|
|
|
22,830
|
|
|
|
45,660
|
|
|
|
|
|
|
|
|
|
|
|
|
|
|
|
477,147
|
|
|
|
|
|
2/23/2010
|
|
|
|
|
|
|
|
|
|
|
|
|
|
|
|
|
|
|
|
|
|
|
|
|
|
|
|
22,830
|
|
|
|
|
|
|
|
|
|
|
|
456,828
|
|
|
|
|
|
(1) |
|
Non-Equity Incentive Awards. Awards from Williams’ 2010 AIP
are shown. |
|
|
|
| |
•
|
Threshold: Because one-half of the AIP reserve balance from
prior years is payable in 2011 upon meeting threshold
performance, one-half of the reserve balance is shown.
|
| |
| |
•
|
Target: The amount shown is based upon an
EVA®
attainment of 100%, plus one-half of the existing AIP reserve
balance.
|
| |
| |
•
|
Maximum: The maximum amount the NEOs can receive is 250% of
their AIP target, plus one-half of the AIP reserve balance.
|
|
|
|
|
(2) |
|
Represents performance-based RSUs granted under Williams’
2007 Incentive Plan. Performance-based RSUs can be earned over a
three-year period only if the established performance target is
met and the NEO is employed on the certification date, subject
to certain exceptions such as the executive’s death or
disability. These shares will be distributed no earlier than the
third anniversary of the grant other than due to a termination
upon a change in control. If performance plan goals are
exceeded, the NEO can receive up to 200% of target. If plan
goals are not met, the NEO can receive as little as 0% of target. |
| |
|
(3) |
|
Represents time-based RSUs granted under Williams’ 2007
Incentive Plan. Time-based units vest three years from the grant
date of 2/23/2010 on 2/23/2013. |
| |
|
(4) |
|
Represents stock options granted under Williams’ 2007
Incentive Plan. Stock options granted in 2010 become exercisable
in three equal annual installments beginning one year after the
grant date. One-third of the options vested on 2/23/2011.
Another one-third will vest on 2/23/2012, with the final
one-third vesting on 2/23/2013. Once vested, stock options are
exercisable for a period of 10 years from the grant date. |
126
2010
Outstanding Williams’ Equity Awards
The following table sets forth certain information with respect
to the outstanding Williams’ equity awards held by the NEOs
at the end of fiscal year 2010.
| |
|
|
|
|
|
|
|
|
|
|
|
|
|
|
|
|
|
|
|
|
|
|
|
|
|
|
|
|
|
|
|
|
|
|
|
|
|
|
|
|
|
|
|
|
|
|
|
|
|
|
|
Option Award
|
|
Stock Awards
|
|
|
|
|
|
|
|
|
|
|
|
|
|
|
|
|
|
|
|
|
|
|
|
|
|
Equity
|
|
|
|
|
|
|
|
|
|
|
|
|
|
|
|
|
|
|
|
|
|
|
|
Equity
|
|
Incentive
|
|
|
|
|
|
|
|
|
|
|
|
|
|
|
|
|
|
|
|
|
|
|
|
Incentive
|
|
Plan Award:
|
|
|
|
|
|
|
|
|
|
|
|
|
|
|
|
|
|
|
|
|
|
|
|
Plan
|
|
Market or
|
|
|
|
|
|
|
|
|
|
|
|
Equity
|
|
|
|
|
|
|
|
|
|
|
|
Awards:
|
|
Payout
|
|
|
|
|
|
|
|
|
|
|
|
Incentive
|
|
|
|
|
|
|
|
|
|
|
|
Number of
|
|
Value of
|
|
|
|
|
|
|
|
|
|
|
|
Plan
|
|
|
|
|
|
|
|
|
|
Market
|
|
Unearned
|
|
Unearned
|
|
|
|
|
|
|
|
|
|
|
|
Awards:
|
|
|
|
|
|
|
|
Number
|
|
Value of
|
|
Shares,
|
|
Shares,
|
|
|
|
|
|
|
|
Number of
|
|
Number of
|
|
Number of
|
|
|
|
|
|
|
|
of Shares
|
|
Shares or
|
|
Units of
|
|
Units or
|
|
|
|
|
|
|
|
Securities
|
|
Securities
|
|
Securities
|
|
|
|
|
|
|
|
or Units
|
|
Units of
|
|
Stock or
|
|
Other
|
|
|
|
|
|
|
|
Underlying
|
|
Underlying
|
|
Underlying
|
|
|
|
|
|
|
|
of Stock
|
|
Stock
|
|
Other
|
|
Rights
|
|
|
|
|
|
|
|
Unexercised
|
|
Unexercised
|
|
Unexercised
|
|
Option
|
|
|
|
|
|
That
|
|
That
|
|
Rights
|
|
That Have
|
|
|
|
|
|
Grant
|
|
Options (#)
|
|
Options (#)
|
|
Unearned
|
|
Exercise
|
|
Expiration
|
|
Grant
|
|
Have Not
|
|
Have Not
|
|
That Have
|
|
Not
|
|
|
|
Name
|
|
Date(1)
|
|
Exercisable
|
|
Unexercisable
|
|
Options
|
|
Price
|
|
Date
|
|
Date
|
|
Vested
|
|
Vested
|
|
Not Vested
|
|
Vested(4)
|
|
|
|
|
|
Steven J. Malcolm
|
|
|
2/23/2010
|
|
|
|
—
|
|
|
|
271,055
|
|
|
|
|
|
|
$
|
21.22
|
|
|
|
2/23/2020
|
|
|
|
2/23/2010(3
|
)
|
|
|
|
|
|
|
140,492
|
|
|
$
|
3,472,962
|
|
|
|
|
|
|
|
|
|
|
|
|
|
2/23/2009
|
|
|
|
169,429
|
|
|
|
338,858
|
|
|
|
|
|
|
|
10.86
|
|
|
|
2/23/2019
|
|
|
|
2/23/2009(3
|
)
|
|
|
|
|
|
|
288,401
|
|
|
|
7,129,273
|
|
|
|
|
|
|
|
|
|
|
|
|
|
2/25/2008
|
|
|
|
144,927
|
|
|
|
72,464
|
|
|
|
|
|
|
|
36.50
|
|
|
|
2/25/2018
|
|
|
|
2/25/2008(3
|
)
|
|
|
|
|
|
|
82,192
|
|
|
|
2,031,786
|
|
|
|
|
|
|
|
|
|
|
|
|
|
2/26/2007
|
|
|
|
200,000
|
|
|
|
—
|
|
|
|
|
|
|
|
28.30
|
|
|
|
2/26/2017
|
|
|
|
|
|
|
|
|
|
|
|
|
|
|
|
|
|
|
|
|
|
|
|
|
|
|
|
|
|
3/3/2006
|
|
|
|
250,000
|
|
|
|
—
|
|
|
|
|
|
|
|
21.67
|
|
|
|
3/3/2016
|
|
|
|
|
|
|
|
|
|
|
|
|
|
|
|
|
|
|
|
|
|
|
|
|
|
|
|
|
|
2/25/2005
|
|
|
|
225,000
|
|
|
|
—
|
|
|
|
|
|
|
|
19.29
|
|
|
|
2/25/2015
|
|
|
|
|
|
|
|
|
|
|
|
|
|
|
|
|
|
|
|
|
|
|
|
|
|
|
|
|
|
2/5/2004
|
|
|
|
300,000
|
|
|
|
—
|
|
|
|
|
|
|
|
9.93
|
|
|
|
2/5/2014
|
|
|
|
|
|
|
|
|
|
|
|
|
|
|
|
|
|
|
|
|
|
|
|
|
|
|
|
|
|
2/11/2002
|
|
|
|
200,000
|
|
|
|
—
|
|
|
|
|
|
|
|
15.86
|
|
|
|
2/11/2012
|
|
|
|
|
|
|
|
|
|
|
|
|
|
|
|
|
|
|
|
|
|
|
|
|
|
|
|
|
|
9/19/2001
|
|
|
|
33,333
|
|
|
|
—
|
|
|
|
|
|
|
|
26.79
|
|
|
|
9/19/2011
|
|
|
|
|
|
|
|
|
|
|
|
|
|
|
|
|
|
|
|
|
|
|
|
|
|
|
|
|
|
4/2/2001
|
|
|
|
27,232
|
|
|
|
—
|
|
|
|
|
|
|
|
39.98
|
|
|
|
4/2/2011
|
|
|
|
|
|
|
|
|
|
|
|
|
|
|
|
|
|
|
|
|
|
|
|
|
|
|
|
|
|
1/18/2001
|
|
|
|
114,373
|
|
|
|
—
|
|
|
|
|
|
|
|
34.77
|
|
|
|
1/18/2011
|
|
|
|
|
|
|
|
|
|
|
|
|
|
|
|
|
|
|
|
|
|
|
|
|
|
|
Donald R. Chappel
|
|
|
2/23/2010
|
|
|
|
—
|
|
|
|
58,083
|
|
|
|
|
|
|
|
21.22
|
|
|
|
2/23/2020
|
|
|
|
2/23/2010(2
|
)
|
|
|
|
|
|
|
35,123
|
|
|
|
868,241
|
|
|
|
|
|
|
|
|
|
|
|
|
|
2/23/2009
|
|
|
|
36,832
|
|
|
|
73,665
|
|
|
|
|
|
|
|
10.86
|
|
|
|
2/23/2019
|
|
|
|
2/23/2010(3
|
)
|
|
|
|
|
|
|
35,123
|
|
|
|
868,241
|
|
|
|
|
|
|
|
|
|
|
|
|
|
2/25/2008
|
|
|
|
33,848
|
|
|
|
16,924
|
|
|
|
|
|
|
|
36.50
|
|
|
|
2/25/2018
|
|
|
|
2/23/2009(2
|
)
|
|
|
|
|
|
|
73,145
|
|
|
|
1,808,144
|
|
|
|
|
|
|
|
|
|
|
|
|
|
2/26/2007
|
|
|
|
48,450
|
|
|
|
—
|
|
|
|
|
|
|
|
28.30
|
|
|
|
2/26/2017
|
|
|
|
2/23/2009(3
|
)
|
|
|
|
|
|
|
73,145
|
|
|
|
1,808,144
|
|
|
|
|
|
|
|
|
|
|
|
|
|
3/3/2006
|
|
|
|
41,921
|
|
|
|
—
|
|
|
|
|
|
|
|
21.67
|
|
|
|
3/3/2016
|
|
|
|
2/25/2008(2
|
)
|
|
|
|
|
|
|
19,911
|
|
|
|
492,200
|
|
|
|
|
|
|
|
|
|
|
|
|
|
2/25/2005
|
|
|
|
55,000
|
|
|
|
—
|
|
|
|
|
|
|
|
19.29
|
|
|
|
2/25/2015
|
|
|
|
2/25/2008(3
|
)
|
|
|
|
|
|
|
39,822
|
|
|
|
984,400
|
|
|
|
|
|
|
|
|
|
|
|
|
|
2/5/2004
|
|
|
|
75,000
|
|
|
|
—
|
|
|
|
|
|
|
|
9.93
|
|
|
|
2/5/2014
|
|
|
|
|
|
|
|
|
|
|
|
|
|
|
|
|
|
|
|
|
|
|
|
|
|
|
|
|
|
4/16/2003
|
|
|
|
175,000
|
|
|
|
—
|
|
|
|
|
|
|
|
5.10
|
|
|
|
4/16/2013
|
|
|
|
|
|
|
|
|
|
|
|
|
|
|
|
|
|
|
|
|
|
|
|
|
|
|
Ralph A. Hill
|
|
|
2/23/2010
|
|
|
|
—
|
|
|
|
50,823
|
|
|
|
|
|
|
|
21.22
|
|
|
|
2/23/2020
|
|
|
|
2/23/2010(2
|
)
|
|
|
|
|
|
|
30,733
|
|
|
|
759,720
|
|
|
|
|
|
|
|
|
|
|
|
|
|
2/23/2009
|
|
|
|
31,307
|
|
|
|
62,616
|
|
|
|
|
|
|
|
10.86
|
|
|
|
2/23/2019
|
|
|
|
2/23/2010(3
|
)
|
|
|
|
|
|
|
30,733
|
|
|
|
759,720
|
|
|
|
|
|
|
|
|
|
|
|
|
|
2/25/2008
|
|
|
|
25,724
|
|
|
|
12,863
|
|
|
|
|
|
|
|
36.50
|
|
|
|
2/25/2018
|
|
|
|
2/23/2009(2
|
)
|
|
|
|
|
|
|
62,173
|
|
|
|
1,536,917
|
|
|
|
|
|
|
|
|
|
|
|
|
|
2/26/2007
|
|
|
|
43,605
|
|
|
|
—
|
|
|
|
|
|
|
|
28.30
|
|
|
|
2/26/2017
|
|
|
|
2/23/2009(3
|
)
|
|
|
|
|
|
|
62,173
|
|
|
|
1,536,917
|
|
|
|
|
|
|
|
|
|
|
|
|
|
3/3/2006
|
|
|
|
30,488
|
|
|
|
—
|
|
|
|
|
|
|
|
21.67
|
|
|
|
3/3/2016
|
|
|
|
2/25/2008(2
|
)
|
|
|
|
|
|
|
15,132
|
|
|
|
374,063
|
|
|
|
|
|
|
|
|
|
|
|
|
|
2/25/2005
|
|
|
|
40,000
|
|
|
|
—
|
|
|
|
|
|
|
|
19.29
|
|
|
|
2/25/2015
|
|
|
|
2/25/2008(3
|
)
|
|
|
|
|
|
|
30,264
|
|
|
|
748,126
|
|
|
|
|
|
|
|
|
|
|
|
|
|
1/18/2001
|
|
|
|
22,875
|
|
|
|
—
|
|
|
|
|
|
|
|
34.77
|
|
|
|
1/18/2011
|
|
|
|
|
|
|
|
|
|
|
|
|
|
|
|
|
|
|
|
|
|
|
|
|
|
|
James J. Bender
|
|
|
2/23/2010
|
|
|
|
—
|
|
|
|
37,754
|
|
|
|
|
|
|
|
21.22
|
|
|
|
2/23/2020
|
|
|
|
2/23/2010(2
|
)
|
|
|
|
|
|
|
22,830
|
|
|
|
564,358
|
|
|
|
|
|
|
|
|
|
|
|
|
|
2/23/2009
|
|
|
|
23,941
|
|
|
|
47,882
|
|
|
|
|
|
|
|
10.86
|
|
|
|
2/23/2019
|
|
|
|
2/23/2010(3
|
)
|
|
|
|
|
|
|
22,830
|
|
|
|
564,358
|
|
|
|
|
|
|
|
|
|
|
|
|
|
2/25/2008
|
|
|
|
20,308
|
|
|
|
10,155
|
|
|
|
|
|
|
|
36.50
|
|
|
|
2/25/2018
|
|
|
|
2/23/2009(2
|
)
|
|
|
|
|
|
|
47,544
|
|
|
|
1,175,288
|
|
|
|
|
|
|
|
|
|
|
|
|
|
2/26/2007
|
|
|
|
29,070
|
|
|
|
—
|
|
|
|
|
|
|
|
28.30
|
|
|
|
2/26/2017
|
|
|
|
2/23/2009(3
|
)
|
|
|
|
|
|
|
47,544
|
|
|
|
1,175,288
|
|
|
|
|
|
|
|
|
|
|
|
|
|
3/3/2006
|
|
|
|
24,136
|
|
|
|
—
|
|
|
|
|
|
|
|
21.67
|
|
|
|
3/3/2016
|
|
|
|
2/25/2008(2
|
)
|
|
|
|
|
|
|
11,946
|
|
|
|
295,305
|
|
|
|
|
|
|
|
|
|
|
|
|
|
2/25/2005
|
|
|
|
40,000
|
|
|
|
—
|
|
|
|
|
|
|
|
19.29
|
|
|
|
2/25/2015
|
|
|
|
2/25/2008(3
|
)
|
|
|
|
|
|
|
23,893
|
|
|
|
590,635
|
|
|
|
|
|
|
|
|
|
|
|
|
|
2/5/2004
|
|
|
|
15,000
|
|
|
|
—
|
|
|
|
|
|
|
|
9.93
|
|
|
|
2/5/2014
|
|
|
|
|
|
|
|
|
|
|
|
|
|
|
|
|
|
|
|
|
|
|
|
|
|
|
Robyn L. Ewing
|
|
|
2/23/2010
|
|
|
|
—
|
|
|
|
37,754
|
|
|
|
|
|
|
|
21.22
|
|
|
|
2/23/2020
|
|
|
|
2/23/2010(2
|
)
|
|
|
|
|
|
|
22,830
|
|
|
|
564,358
|
|
|
|
|
|
|
|
|
|
|
|
|
|
2/23/2009
|
|
|
|
22,099
|
|
|
|
44,199
|
|
|
|
|
|
|
|
10.86
|
|
|
|
2/23/2019
|
|
|
|
2/23/2010(3
|
)
|
|
|
|
|
|
|
22,830
|
|
|
|
564,358
|
|
|
|
|
|
|
|
|
|
|
|
|
|
2/25/2008
|
|
|
|
6,156
|
|
|
|
3,079
|
|
|
|
|
|
|
|
36.50
|
|
|
|
2/25/2018
|
|
|
|
2/23/2009(2
|
)
|
|
|
|
|
|
|
43,887
|
|
|
|
1,084,887
|
|
|
|
|
|
|
|
|
|
|
|
|
|
2/26/2007
|
|
|
|
10,174
|
|
|
|
—
|
|
|
|
|
|
|
|
28.30
|
|
|
|
2/26/2017
|
|
|
|
2/23/2009(3
|
)
|
|
|
|
|
|
|
43,887
|
|
|
|
1,084,887
|
|
|
|
|
|
|
|
|
|
|
|
|
|
3/3/2006
|
|
|
|
11,738
|
|
|
|
—
|
|
|
|
|
|
|
|
21.67
|
|
|
|
3/3/2016
|
|
|
|
2/25/2008(2
|
)
|
|
|
|
|
|
|
3,622
|
|
|
|
89,536
|
|
|
|
|
|
|
|
|
|
|
|
|
|
2/25/2005
|
|
|
|
23,000
|
|
|
|
—
|
|
|
|
|
|
|
|
19.29
|
|
|
|
2/25/2015
|
|
|
|
2/25/2008(3
|
)
|
|
|
|
|
|
|
4,829
|
|
|
|
119,373
|
|
|
|
|
|
|
|
|
|
Stock
Options
|
|
|
|
(1) |
|
The following table reflects the vesting schedules for
associated stock option grant dates for awards that had not been
100% vested as of December 31, 2010. |
127
| |
|
|
|
|
|
|
|
Grant Date
|
|
Vesting Schedule
|
|
Vesting Dates
|
|
|
|
2/23/2010
|
|
One-third vests each year for three years
|
|
|
2/23/2011, 2/23/2012, 2/23/2013
|
|
|
2/23/2009
|
|
One-third vests each year for three years
|
|
|
2/23/2010, 2/23/2011, 2/23/2012
|
|
|
2/25/2008
|
|
One-third vests each year for three years
|
|
|
2/25/2009, 2/25/2010, 2/25/2011
|
|
Stock
Awards
|
|
|
|
(2) |
|
The following table reflects the vesting dates for associated
time-based restricted stock unit award grant dates. |
| |
|
|
|
|
|
|
|
Grant Date
|
|
Vesting Schedule
|
|
Vesting Dates
|
|
|
|
2/23/2010
|
|
100% vests in three years
|
|
|
2/23/2013
|
|
|
2/23/2009
|
|
100% vests in three years
|
|
|
2/23/2012
|
|
|
2/25/2008
|
|
100% vests in three years
|
|
|
2/25/2011
|
|
|
|
|
|
(3) |
|
All performance-based RSUs are subject to attainment of
performance targets established by the Committee. These awards
will vest no earlier than the end of the performance period and
therefore do not have a specific vesting date. The awards
included on the table are outstanding as of December 31,
2010. |
| |
|
(4) |
|
Values are based on a closing stock price for Williams of $24.72
on December 31, 2010. |
2010
Williams’ Option Exercises and Stock Vested
The following table sets forth certain information with respect
to options to acquire the stock of Williams exercised by the NEO
and stock that vested during fiscal year 2010.
| |
|
|
|
|
|
|
|
|
|
|
|
|
|
|
|
|
|
|
|
Option Awards
|
|
Stock Awards
|
|
|
|
Number of Shares
|
|
|
|
Number of Shares
|
|
|
|
|
|
Acquired on
|
|
Value Realized
|
|
Acquired on
|
|
Value Realized
|
|
Name
|
|
Exercise
|
|
on Exercise
|
|
Vesting
|
|
on Vesting
|
|
|
|
Steven J. Malcolm
|
|
|
475,000
|
|
|
$
|
10,096,083
|
|
|
|
—
|
|
|
$
|
—
|
|
|
Donald R. Chappel
|
|
|
—
|
|
|
|
—
|
|
|
|
19,069
|
|
|
|
410,746
|
|
|
Ralph A. Hill
|
|
|
—
|
|
|
|
—
|
|
|
|
17,162
|
|
|
|
369,669
|
|
|
James J. Bender
|
|
|
—
|
|
|
|
—
|
|
|
|
11,442
|
|
|
|
246,461
|
|
|
Robyn L. Ewing
|
|
|
—
|
|
|
|
—
|
|
|
|
4,005
|
|
|
|
86,268
|
|
The Committee determines pay based on a target total
compensation amount. While the Committee reviews tally sheets
and wealth accumulation information on each NEO, thus far
amounts realized from previous equity grants have not been a
material factor when the Committee determines pay. How much
compensation the NEOs actually receive is significantly impacted
by the stock market performance of Williams’ shares.
Retirement
Plan
The retirement plan for Williams’ executives consists of
two plans: the pension plan and the retirement restoration plan
as described below. Together these plans provide the same level
of benefits to our executives as the pension plan provides to
all other employees of Williams. The retirement restoration plan
was implemented to address the annual compensation limit of the
Code.
Pension
Plan
Williams’ executives who have completed one year of service
participate in Williams’ pension plan on the same terms as
other Williams’ employees. The pension plan is a
noncontributory, tax qualified defined benefit plan (with a cash
balance design) subject to the Employee Retirement Income
Security Act of 1974, as amended.
128
Each year, participants earn compensation credits that are
posted to their cash balance account. The annual compensation
credits are equal to the sum of a percentage of eligible pay
(base pay and certain bonuses) and a percentage of eligible pay
greater than the social security wage base. The percentage
credited is based upon the participant’s age as shown in
the following table.
| |
|
|
|
|
|
|
|
|
|
|
|
|
|
Percentage of
|
|
|
|
Percent of Eligible Pay Greater
|
|
Age
|
|
Eligible Pay
|
|
|
|
than the Social Security Wage Base
|
|
|
|
Less than 30
|
|
|
4.5
|
%
|
|
|
+
|
|
|
from 1% to 1.2%
|
|
30-39
|
|
|
6
|
%
|
|
|
+
|
|
|
2%
|
|
40-49
|
|
|
8
|
%
|
|
|
+
|
|
|
3%
|
|
50 or over
|
|
|
10
|
%
|
|
|
+
|
|
|
5%
|
For participants who were active employees and participants
under the plan on March 31, 1998, and April 1, 1998,
the percentage of eligible pay is increased by 0.3% multiplied
by the participant’s total years of benefit service earned
as of March 31, 1998.
In addition, interest is credited to account balances quarterly
at a rate determined annually in accordance with the terms of
the plan.
The monthly annuity available to those who take normal
retirement is based on the participant’s account balance as
of the date of retirement. Normal retirement age is 65. Early
retirement eligibility begins at 55. At retirement, participants
may choose to receive a single-life annuity (for single
participants) or a qualified joint and survivor annuity (for
married participants) or they may choose one of several other
forms of payment having an actuarial value equal to that of the
relevant annuity.
Retirement
Restoration Plan
The Code limits pension benefits based on the annual
compensation limit that can be accrued in tax-qualified defined
benefit plans, such as Williams’ pension plan. Any
reduction in an executive’s pension benefit accrual due to
these limits will be compensated, subject to a cap, under an
unfunded top hat plan—Williams’ retirement restoration
plan.
The elements of compensation that are included in applying the
payment and benefit formula for the retirement restoration plan
are the same elements that are used, except for application of a
cap, in the base pension plan for all Williams’ employees.
The elements of pay included in that definition are total base
pay, including any overtime, base pay-reduction amounts and cash
bonus awards, if paid (unless specifically excluded under a
written bonus or incentive-pay arrangement). Specifically
excluded from the definition are severance pay,
cost-of-living
pay, housing pay, relocation pay (including mortgage interest
differential), taxable and non-taxable fringe benefits and all
other extraordinary pay, including any amounts received from
equity compensation awards.
With respect to bonuses, annual cash incentives are considered
in determining eligible pay under the pension plan. Long-term
equity compensation incentives are not considered.
129
2010
Williams’ Pension Benefits
The following table sets forth certain information with respect
to the actuarial present value of the accrued benefit as of
December 31, 2010 under Williams’ qualified pension
plan and retirement restoration plan.
| |
|
|
|
|
|
|
|
|
|
|
|
|
|
|
|
|
|
|
|
Number of
|
|
|
|
Payments
|
|
|
|
|
|
Years Credited
|
|
Present Value of
|
|
During Last
|
|
Name
|
|
Plan Name
|
|
Services
|
|
Accrued Benefit(1)
|
|
Fiscal Year
|
|
|
|
Steven J. Malcolm(2)(3)
|
|
Pension Plan
|
|
|
27
|
|
|
$
|
829,307
|
|
|
|
—
|
|
|
|
|
Retirement Restoration Plan
|
|
|
27
|
|
|
|
5,497,857
|
|
|
|
—
|
|
|
Donald R. Chappel(2)
|
|
Pension Plan
|
|
|
8
|
|
|
|
245,359
|
|
|
|
—
|
|
|
|
|
Retirement Restoration Plan
|
|
|
8
|
|
|
|
1,319,741
|
|
|
|
—
|
|
|
Ralph A. Hill(3)
|
|
Pension Plan
|
|
|
27
|
|
|
|
586,869
|
|
|
|
—
|
|
|
|
|
Retirement Restoration Plan
|
|
|
27
|
|
|
|
1,321,013
|
|
|
|
—
|
|
|
James J. Bender
|
|
Pension Plan
|
|
|
8
|
|
|
|
216,010
|
|
|
|
—
|
|
|
|
|
Retirement Restoration Plan
|
|
|
8
|
|
|
|
799,037
|
|
|
|
—
|
|
|
Robyn L. Ewing(2)
|
|
Pension Plan
|
|
|
30
|
|
|
|
598,781
|
|
|
|
—
|
|
|
|
|
Retirement Restoration Plan
|
|
|
30
|
|
|
|
723,095
|
|
|
|
—
|
|
|
|
|
|
(1) |
|
The primary actuarial assumptions used to determine the present
values include an annual interest credit to normal retirement
age equal to 5% and a discount rate equal to 5.29% for the
pension plan and discount rate equal to 5.1% for the retirement
restoration plan. |
| |
|
(2) |
|
Mr. Malcolm, Mr. Chappel and Ms. Ewing are the
only NEOs eligible to retire as of December 31, 2010. |
| |
|
(3) |
|
Williams’ pension plan includes a Rule of 55 benefit that
is a transition benefit that was provided to all employees
meeting the eligibility criteria at the time Williams’
pension plan was converted from a final average pay formula to a
cash balance formula. To be eligible for the Rule of 55
enhancement an employee’s age and years of service at the
time of the cash balance conversion in 1998 must have totaled
55. Mr. Malcolm and Mr. Hill are the only NEOs that
met the eligibility criteria for the Rule of 55 transitional
benefit. |
Nonqualified
Deferred Compensation
Williams does not provide nonqualified deferred compensation for
any NEOs or other employees.
Change in
Control Agreements
Williams has entered into change in control agreements with
certain officers, including each of the NEOs, to facilitate
continuity of management if there is a change in control of
Williams. These arrangements do not provide for the payment of
any benefits in the event of a future change in control of the
ownership of WPX Energy. The provisions of such agreements are
described below. The definitions of words in quotations are also
provided below.
If during the term of a change in control agreement, a
“change in control” occurs and (i) the employment
of any NEO is terminated other than for “cause,”
“disability,” death or a “disqualification
disaggregation” or (ii) an NEO resigns for “good
reason,” such NEO is entitled to the following:
|
|
|
| |
•
|
Within 10 business days after the termination date:
|
|
|
|
| |
•
|
Accrued but unpaid base salary, accrued earned but unpaid cash
incentive, accrued but unpaid paid time off and any other
amounts or benefits due but not paid (lump sum payment);
|
130
|
|
|
| |
•
|
On the first business day following six months after the
termination date:
|
|
|
|
| |
•
|
Prorated annual bonus for the year of separation through the
termination date (lump sum payment);
|
| |
| |
•
|
A severance amount equal to three times
his/her base
salary for the NEO as of the termination date plus an annual
bonus amount equal to
his/her
target percentage multiplied by
his/her base
salary in effect at the termination date as if performance goals
were achieved at 100% (lump sum payment);
|
| |
| |
•
|
An amount equal to three times for the total allocations made by
Williams for the NEOs in the preceding calendar year under our
retirement restoration plan (lump sum payment);
|
| |
| |
•
|
An amount equal to the sum of the value of the unvested portion
of the NEO’s accounts or accrued benefits under
Williams’ 401(k) plan that would have otherwise been
forfeited (lump sum payment);
|
|
|
|
| |
•
|
Continued participation in Williams’ medical benefit plans
for so long as the NEO elects coverage or 18 months from
the termination, whichever is less, in the same manner and at
the same cost as similarly situated active employees;
|
| |
| |
•
|
All restrictions on stock options held by the NEO will lapse,
and the options will vest and become immediately exercisable;
|
| |
| |
•
|
All restricted stock will vest and will be paid out only in
accordance with the terms of the respective award agreements;
|
| |
| |
•
|
Continued participation in Williams’ directors’ and
officers’ liability insurance for six years or any longer
known applicable statute of limitations period;
|
| |
| |
•
|
Indemnification as set forth under Williams’
bylaws; and
|
| |
| |
•
|
Outplacement benefits for six months at a cost not exceeding
$25,000.
|
In addition, each NEO is generally entitled to receive a
gross-up
payment in an amount sufficient to make him/her whole for any
federal excise tax on excess parachute payments imposed under
Section 280G and 4999 of the Code or any similar tax under
any state, local, foreign or other law (other than
Section 409A of the Code). However, in reviewing the change
in control agreements in 2010 and 2011, the Committee approved
eliminating this excise tax
gross-up
provision. The Committee opted to provide a ‘best net’
provision providing the NEOs with the better of their after-tax
benefit capped at the safe harbor amount or their benefit paid
in full subjecting them to possible excise tax payments.
Therefore, in 2011 Williams will provide the one year notice
required by the NEOs’ change in control agreements in order
to effect the change in 2012. After this change is implemented,
Williams will no longer provide additional compensation to
address excise taxes.
If an NEO’s employment is terminated for “cause”
during the period beginning upon a change of control and
continuing for two years or until the termination of the
agreement, whichever happens first, the NEO is entitled to
accrued but unpaid base salary, accrued earned but unpaid cash
incentive, accrued but unpaid paid time off and any other
amounts or benefits due but not paid (lump sum payment).
The agreements with our NEOs use the following definitions:
“Cause” means an NEO’s
|
|
|
| |
•
|
conviction of or a plea of nolo contendere to a felony or a
crime involving fraud, dishonesty or moral turpitude;
|
| |
| |
•
|
willful or reckless material misconduct in the performance of
his/her
duties that has an adverse effect on Williams or any of its
subsidiaries or affiliates;
|
| |
| |
•
|
willful or reckless violation or disregard of the code of
business conduct of Williams or the policies of Williams or its
subsidiaries; or
|
| |
| |
•
|
habitual or gross neglect of
his/her
duties.
|
131
Cause generally does not include bad judgment or negligence
(other than habitual neglect or gross negligence); acts or
omissions made in good faith after reasonable investigation by
the NEO or acts or omissions with respect to which
Williams’ board of directors could determine that the NEO
had satisfied the standards of conduct for indemnification or
reimbursement under Williams’ bylaws, indemnification
agreement or applicable law; or failure (despite good faith
efforts) to meet performance goals, objectives or measures for a
period beginning upon a change of control and continuing for two
years or until the termination of the agreement, whichever
happens first. An NEO’s act or failure to act (except as
relates to a conviction or plea of nolo contendere described
above), when done in good faith and with a reasonable belief
after reasonable investigation that such action or non-action
was in the best interest of Williams or its affiliate or
required by law shall not be Cause if the NEO cures the action
or non-action within 10 days of notice. Furthermore, no act
or failure to act will be Cause if the NEO acted under the
advice of Williams’ counsel or required by the legal
process.
“Change in control” means:
|
|
|
| |
•
|
Any person or group (other than an affiliate of Williams or an
employee benefit plan sponsored by Williams or its affiliates)
becomes a beneficial owner, as such term is defined under the
Exchange Act, of 20% or more of the common stock of Williams or
20% or more of the combined voting power of all securities
entitled to vote generally in the election of directors of
Williams (“Voting Securities”), unless such person
owned both more than 75% of common stock and Voting Securities,
directly or indirectly, in substantially the same proportion
immediately before such acquisition;
|
| |
| |
•
|
Williams’ directors as of a date of the agreement
(“Existing Directors”) and directors approved after
that date by at least two-thirds of the Existing Directors cease
to constitute a majority of the directors of Williams;
|
| |
| |
•
|
Consummation of any merger, reorganization, recapitalization
consolidation or similar transaction (“Reorganization
Transaction”), other than a Reorganization Transaction that
results in the person who was the direct or indirect owner of
outstanding common stock and Voting Securities of Williams prior
to the transaction becoming, immediately after the transaction,
the owner of at least 65% of the then outstanding common stock
and Voting Securities representing 65% of the combined voting
power of the then outstanding Voting Securities of the surviving
corporation in substantially the same respective proportion as
that person’s ownership immediately before such
Reorganization Transaction; or
|
| |
| |
•
|
approval by the stockholders of Williams of the sale or other
disposition of all or substantially all of the consolidated
assets of Williams or the complete liquidation of Williams other
than a transaction that would result in (i) a related party
owning more than 50% of the assets that were owned by Williams
immediately prior to the transaction or (ii) the persons
who were the direct or indirect owners of outstanding Williams
common stock and Voting Securities prior to the transaction
continuing to own, directly or indirectly, 50% or more of the
assets that were owned by Williams immediately prior to the
transaction.
|
A change in control will not occur if:
|
|
|
| |
•
|
the NEO agrees in writing prior to an event that such an event
will not be a change in control; or
|
| |
| |
•
|
Williams’ board of directors determines that a liquidation,
sale or other disposition approved by the stockholders, as
described in the fourth bullet above, will not occur, except to
the extent termination occurred prior to such determination.
|
“Disability” means a physical or mental infirmity that
impairs the NEO’s ability to substantially perform
his/her
duties for twelve months or more and for which
he/she is
receiving income replacement benefits from a Williams’ plan
for not less than three months.
132
“Disqualification disaggregation” means:
|
|
|
| |
•
|
the termination of an NEO’s employment from Williams or an
affiliate before a change in control for any reason; or
|
| |
| |
•
|
the termination of an NEO’s employment by a successor
(during the period beginning upon a change of control and
continuing for two years or until the termination of the
agreement, whichever happens first), if the NEO is employed in
substantially the same position and the successor has assumed
the Williams’ change in control agreement.
|
“Good reason” means, generally, a material adverse
change in the NEO’s title, position or responsibilities, a
reduction in the NEO’s base salary, a reduction in the
NEO’s annual bonus, required relocation, a material
reduction in the level of aggregate compensation or benefits not
applicable to Williams’ peers, a successor company’s
failure to honor the agreement or the failure of Williams’
board of directors to provide written notice of the act or
omission constituting “cause.”
Termination
Scenarios
The following table sets forth circumstances that provide for
payments by Williams to the NEOs following or in connection with
a change in control of Williams or an NEO’s termination of
employment for cause, upon retirement, upon death and disability
or not for cause, all while employed by Williams. NEOs are
generally eligible to retire at the earlier of age 55 and
completion of 3 years of service or age 65.
All values are based on a hypothetical termination date of
December 31, 2010 and a closing stock price for
Williams’ common stock of $24.72 on such date. The values
shown are intended to provide reasonable estimates of the
potential benefits the NEOs would receive upon termination. The
values are based on various assumptions and may not represent
the actual amount an NEO would receive. In addition to the
amounts disclosed in the following table, a departing NEO would
retain the amounts
he/she has
earned over the course of
his/her
employment prior to the termination event, including accrued
retirement benefits and previously vested stock options and RSUs.
| |
|
|
|
|
|
|
|
|
|
|
|
|
|
|
|
|
|
|
|
|
|
|
|
|
|
|
|
For
|
|
|
|
|
|
Death &
|
|
|
Not for
|
|
|
|
|
|
Name
|
|
Payment
|
|
Cause(1)
|
|
|
Retirement(2)
|
|
|
Disability(3)
|
|
|
Cause(4)
|
|
|
CIC(5)
|
|
|
|
|
Malcolm, Steven J
|
|
AIP Reserve
|
|
|
—
|
|
|
$
|
242,756
|
|
|
$
|
242,756
|
|
|
$
|
242,756
|
|
|
$
|
242,756
|
|
|
|
|
Stock options
|
|
|
—
|
|
|
|
5,645,264
|
|
|
|
5,645,264
|
|
|
|
—
|
|
|
|
5,645,264
|
|
|
|
|
Stock awards
|
|
|
—
|
|
|
|
7,240,399
|
|
|
|
7,240,399
|
|
|
|
7,240,399
|
|
|
|
12,634,022
|
|
|
|
|
Cash Severance
|
|
|
—
|
|
|
|
—
|
|
|
|
—
|
|
|
|
—
|
|
|
|
6,600,000
|
|
|
|
|
Outplacement
|
|
|
—
|
|
|
|
—
|
|
|
|
—
|
|
|
|
—
|
|
|
|
25,000
|
|
|
|
|
Health & Welfare
|
|
|
—
|
|
|
|
—
|
|
|
|
—
|
|
|
|
—
|
|
|
|
18,170
|
|
|
|
|
Retirement Restoration
|
|
|
|
|
|
|
|
|
|
|
|
|
|
|
|
|
|
|
|
|
|
|
|
Plan
|
|
|
—
|
|
|
|
—
|
|
|
|
—
|
|
|
|
—
|
|
|
|
2,207,808
|
|
|
|
|
Enhancement
|
|
|
|
|
|
|
|
|
|
|
|
|
|
|
|
|
|
|
|
|
|
|
|
Tax Gross Up
|
|
|
—
|
|
|
|
—
|
|
|
|
—
|
|
|
|
—
|
|
|
|
8,649,197
|
|
|
|
|
|
|
|
|
|
|
|
|
|
|
|
|
|
|
|
|
|
|
|
|
|
|
|
|
Total
|
|
|
—
|
|
|
$
|
13,128,419
|
|
|
$
|
13,128,419
|
|
|
$
|
7,483,155
|
|
|
$
|
36,022,217
|
|
|
|
|
|
|
|
|
|
|
|
|
|
|
|
|
|
|
|
|
|
|
|
|
|
|
|
|
|
|
|
|
|
|
|
|
|
|
|
|
|
|
|
|
|
|
|
|
|
|
Chappel, Donald R
|
|
AIP Reserve
|
|
|
—
|
|
|
$
|
60,103
|
|
|
$
|
60,103
|
|
|
$
|
60,103
|
|
|
$
|
60,103
|
|
|
|
|
Stock options
|
|
|
—
|
|
|
|
1,224,287
|
|
|
|
1,224,287
|
|
|
|
—
|
|
|
|
1,224,287
|
|
|
|
|
Stock awards
|
|
|
—
|
|
|
|
4,086,877
|
|
|
|
5,444,451
|
|
|
|
5,444,451
|
|
|
|
6,829,365
|
|
|
|
|
Cash Severance
|
|
|
—
|
|
|
|
—
|
|
|
|
—
|
|
|
|
—
|
|
|
|
3,213,000
|
|
|
|
|
Outplacement
|
|
|
—
|
|
|
|
—
|
|
|
|
—
|
|
|
|
—
|
|
|
|
25,000
|
|
|
|
|
Health & Welfare
|
|
|
—
|
|
|
|
—
|
|
|
|
—
|
|
|
|
—
|
|
|
|
26,699
|
|
|
|
|
Retirement Restoration Plan
|
|
|
—
|
|
|
|
—
|
|
|
|
—
|
|
|
|
—
|
|
|
|
|
|
|
|
|
Enhancement
|
|
|
|
|
|
|
|
|
|
|
|
|
|
|
|
|
|
|
646,557
|
|
|
|
|
Tax Gross Up
|
|
|
—
|
|
|
|
—
|
|
|
|
—
|
|
|
|
—
|
|
|
|
2,966,960
|
|
|
|
|
|
|
|
|
|
|
|
|
|
|
|
|
|
|
|
|
|
|
|
|
|
|
|
|
Total
|
|
|
—
|
|
|
$
|
5,371,267
|
|
|
$
|
6,728,841
|
|
|
$
|
5,504,554
|
|
|
$
|
14,991,971
|
|
|
|
|
|
|
|
|
|
|
|
|
|
|
|
|
|
|
|
|
|
|
|
|
|
133
| |
|
|
|
|
|
|
|
|
|
|
|
|
|
|
|
|
|
|
|
|
|
|
|
|
|
|
|
For
|
|
|
|
|
|
Death &
|
|
|
Not for
|
|
|
|
|
|
Name
|
|
Payment
|
|
Cause(1)
|
|
|
Retirement(2)
|
|
|
Disability(3)
|
|
|
Cause(4)
|
|
|
CIC(5)
|
|
|
|
|
Hill, Ralph A
|
|
AIP Reserve
|
|
|
—
|
|
|
$
|
72,958
|
|
|
$
|
72,958
|
|
|
$
|
72,958
|
|
|
$
|
72,958
|
|
|
|
|
Stock options
|
|
|
—
|
|
|
|
1,045,738
|
|
|
|
1,045,738
|
|
|
|
—
|
|
|
|
1,045,738
|
|
|
|
|
Stock awards
|
|
|
—
|
|
|
|
3,360,366
|
|
|
|
4,527,523
|
|
|
|
4,527,523
|
|
|
|
5,715,453
|
|
|
|
|
Cash Severance
|
|
|
—
|
|
|
|
—
|
|
|
|
—
|
|
|
|
—
|
|
|
|
2,448,765
|
|
|
|
|
Outplacement
|
|
|
—
|
|
|
|
—
|
|
|
|
—
|
|
|
|
—
|
|
|
|
25,000
|
|
|
|
|
Health & Welfare
|
|
|
—
|
|
|
|
—
|
|
|
|
—
|
|
|
|
—
|
|
|
|
26,346
|
|
|
|
|
Retirement Restoration Plan
|
|
|
—
|
|
|
|
—
|
|
|
|
—
|
|
|
|
—
|
|
|
|
|
|
|
|
|
Enhancement
|
|
|
|
|
|
|
|
|
|
|
|
|
|
|
|
|
|
|
636,018
|
|
|
|
|
Tax Gross Up
|
|
|
—
|
|
|
|
—
|
|
|
|
—
|
|
|
|
—
|
|
|
|
—
|
|
|
|
|
|
|
|
|
|
|
|
|
|
|
|
|
|
|
|
|
|
|
|
|
|
|
|
|
Total
|
|
|
—
|
|
|
$
|
4,479,062
|
|
|
$
|
5,646,219
|
|
|
$
|
4,600,481
|
|
|
$
|
9,970,278
|
|
|
|
|
|
|
|
|
|
|
|
|
|
|
|
|
|
|
|
|
|
|
|
|
|
|
|
|
|
|
|
|
|
|
|
|
|
|
|
|
|
|
|
|
|
|
|
|
|
|
Bender, James J
|
|
AIP Reserve
|
|
|
—
|
|
|
$
|
44,244
|
|
|
$
|
44,244
|
|
|
$
|
44,244
|
|
|
$
|
44,244
|
|
|
|
|
Stock options
|
|
|
—
|
|
|
|
795,784
|
|
|
|
795,784
|
|
|
|
—
|
|
|
|
795,784
|
|
|
|
|
Stock awards
|
|
|
—
|
|
|
|
2,586,716
|
|
|
|
3,467,769
|
|
|
|
3,467,769
|
|
|
|
4,365,230
|
|
|
|
|
Cash Severance
|
|
|
—
|
|
|
|
—
|
|
|
|
—
|
|
|
|
—
|
|
|
|
2,373,030
|
|
|
|
|
Outplacement
|
|
|
—
|
|
|
|
—
|
|
|
|
—
|
|
|
|
—
|
|
|
|
25,000
|
|
|
|
|
Health & Welfare
|
|
|
—
|
|
|
|
—
|
|
|
|
—
|
|
|
|
—
|
|
|
|
26,346
|
|
|
|
|
Retirement Restoration Plan
|
|
|
—
|
|
|
|
—
|
|
|
|
—
|
|
|
|
—
|
|
|
|
|
|
|
|
|
Enhancement
|
|
|
|
|
|
|
|
|
|
|
|
|
|
|
|
|
|
|
423,896
|
|
|
|
|
Tax Gross Up
|
|
|
—
|
|
|
|
—
|
|
|
|
—
|
|
|
|
—
|
|
|
|
2,217,566
|
|
|
|
|
|
|
|
|
|
|
|
|
|
|
|
|
|
|
|
|
|
|
|
|
|
|
|
|
Total
|
|
|
—
|
|
|
$
|
3,426,744
|
|
|
$
|
4,307,797
|
|
|
$
|
3,512,013
|
|
|
$
|
10,271,096
|
|
|
|
|
|
|
|
|
|
|
|
|
|
|
|
|
|
|
|
|
|
|
|
|
|
|
|
|
|
|
|
|
|
|
|
|
|
|
|
|
|
|
|
|
|
|
|
|
|
|
Ewing, Robyn L
|
|
AIP Reserve
|
|
|
—
|
|
|
$
|
20,728
|
|
|
$
|
20,728
|
|
|
$
|
20,728
|
|
|
$
|
20,728
|
|
|
|
|
Stock options
|
|
|
—
|
|
|
|
744,737
|
|
|
|
744,737
|
|
|
|
—
|
|
|
|
744,737
|
|
|
|
|
Stock awards
|
|
|
—
|
|
|
|
1,836,807
|
|
|
|
2,671,273
|
|
|
|
2,671,273
|
|
|
|
3,507,393
|
|
|
|
|
Cash Severance
|
|
|
—
|
|
|
|
—
|
|
|
|
—
|
|
|
|
—
|
|
|
|
2,202,750
|
|
|
|
|
Outplacement
|
|
|
—
|
|
|
|
—
|
|
|
|
—
|
|
|
|
—
|
|
|
|
25,000
|
|
|
|
|
Health & Welfare
|
|
|
—
|
|
|
|
—
|
|
|
|
—
|
|
|
|
—
|
|
|
|
26,346
|
|
|
|
|
Retirement Restoration Plan
|
|
|
—
|
|
|
|
—
|
|
|
|
—
|
|
|
|
—
|
|
|
|
|
|
|
|
|
Enhancement
|
|
|
|
|
|
|
|
|
|
|
|
|
|
|
|
|
|
|
437,948
|
|
|
|
|
Tax Gross Up
|
|
|
—
|
|
|
|
—
|
|
|
|
—
|
|
|
|
—
|
|
|
|
1,861,484
|
|
|
|
|
|
|
|
|
|
|
|
|
|
|
|
|
|
|
|
|
|
|
|
|
|
|
|
|
Total
|
|
|
—
|
|
|
$
|
2,602,272
|
|
|
$
|
3,436,738
|
|
|
$
|
2,692,001
|
|
|
$
|
8,826,386
|
|
|
|
|
|
|
|
|
|
|
|
|
|
|
|
|
|
|
|
|
|
|
|
|
|
|
|
|
|
(1) |
|
If an NEO is terminated for cause or leaves Williams
voluntarily, no additional benefits will be received. |
| |
|
(2) |
|
If an NEO retires from Williams, then all unvested stock options
will fully accelerate. A pro-rated portion of the unvested time
based RSUs will accelerate and a pro-rated portion of any
performance-based RSUs will vest on the original vesting date if
the Committee certifies that the performance measures were met. |
| |
|
(3) |
|
If an NEO dies or becomes disabled, then all unvested stock
options will fully accelerate. All unvested time-based RSUs will
fully accelerate, and a pro-rated portion of any
performance-based RSUs will vest if the Committee certifies that
the performance measures were met. |
| |
|
(4) |
|
For an NEO who is involuntarily terminated who receives
severance or for an NEO whose job is outsourced with no
comparable internal offer, all unvested time-based RSUs will
fully accelerate and a pro-rated portion of any
performance-based RSUs will vest if the Committee certifies that
the performance measures were met. However all unvested stock
options cancel. |
| |
|
(5) |
|
See “Change In Control Agreements” above. |
Please note that we make no assumptions as to the achievement of
performance goals as it relates to the performance based RSUs.
If an award is covered by Section 409A of the Code, lump
sum payments and distributions occurring from these events will
occur six months after the triggering event as required by the
Code and our award agreements.
134
PRINCIPAL
STOCKHOLDER
All outstanding shares of our common stock are owned
beneficially and of record by Williams. The following table sets
forth information with respect to the beneficial ownership of
our common stock immediately after the completion of this
offering by:
|
|
|
| |
•
|
each person who is an executive officer;
|
| |
| |
•
|
each person who is a director;
|
| |
| |
•
|
all directors and executive officers as a group; and
|
| |
| |
•
|
Williams, who, after completion of this offering will own 100%
of the outstanding shares of our Class B common stock,
which will represent (1) % of all
classes of our outstanding common stock
( % if the underwriters exercise
their option to purchase additional Class A common shares
in full) and (2) % of the combined
voting power of all classes of our outstanding common stock on
all matters ( % if the underwriters
exercise their option to purchase additional Class A common
shares in full).
|
Prior to the completion of this offering, we intend to appoint
additional persons to serve as our executive officers and
directors.
Beneficial ownership has been determined in accordance with the
rules of the SEC and includes the power to vote or direct the
voting of securities, or to dispose or direct the disposition
thereof, or the right to acquire such powers within
60 days. Except as otherwise indicated, the persons or
entities listed below have sole voting and investment power with
respect to all shares of our common stock beneficially owned by
them. The address for Williams is One Williams Center, Tulsa,
Oklahoma
74172-0172.
Unless otherwise indicated, the address for each director and
executive officer listed is:
c/o WPX
Energy, Inc., One Williams Center, Tulsa, Oklahoma
74172-0172.
| |
|
|
|
|
|
|
|
|
|
|
|
|
|
|
|
|
|
|
|
Number of Class A
|
|
|
|
Number of Class B
|
|
|
|
|
|
Shares Beneficially
|
|
Percentage
|
|
Shares Beneficially
|
|
Percentage
|
|
Name of Beneficial Owner
|
|
Owned
|
|
of Class
|
|
Owned
|
|
of Class
|
|
|
|
The Williams Companies, Inc.
|
|
|
|
|
|
|
|
|
|
|
|
|
|
|
|
|
|
Alan S. Armstrong
|
|
|
|
|
|
|
|
|
|
|
|
|
|
|
|
|
|
Ralph A. Hill
|
|
|
|
|
|
|
|
|
|
|
|
|
|
|
|
|
|
Donald R. Chappel
|
|
|
|
|
|
|
|
|
|
|
|
|
|
|
|
|
|
Ted T. Timmermans
|
|
|
|
|
|
|
|
|
|
|
|
|
|
|
|
|
|
James J. Bender
|
|
|
|
|
|
|
|
|
|
|
|
|
|
|
|
|
|
Robyn L. Ewing
|
|
|
|
|
|
|
|
|
|
|
|
|
|
|
|
|
|
Rodney J. Sailor
|
|
|
|
|
|
|
|
|
|
|
|
|
|
|
|
|
|
All executive officers and directors as a group (seven persons)
|
|
|
|
|
|
|
|
|
|
|
|
|
|
|
|
|
|
Total
|
|
|
|
|
|
|
|
|
|
|
|
|
|
|
|
|
135
ARRANGEMENTS
BETWEEN WILLIAMS AND OUR COMPANY
This section provides a summary description of agreements
between Williams and us relating to our restructuring
transactions, this offering and our relationship with Williams
after this offering. When used in this section,
“distribution date” refers to the date, if any,
following the offering on which Williams will distribute, or
spin-off, its shares of our common stock to its stockholders.
This description of the agreements between Williams and us is a
summary and, with respect to each such agreement, is qualified
by reference to the terms of the agreement, each of which will
be filed as an exhibit to the registration statement of which
this prospectus is a part. We encourage you to read the full
text of these agreements. We will enter into these agreements
with Williams prior to the completion of this offering;
accordingly, we will enter into these agreements with Williams
in the context of our relationship as a wholly-owned subsidiary
of Williams. The terms of these agreements may be more or less
favorable to us than if they had been negotiated with
unaffiliated third parties.
Separation
and Distribution Agreement
We will enter into a separation and distribution agreement with
Williams that will set forth our agreements with Williams
regarding the principal corporate transactions required to
effect our restructuring transactions, this offering and the
distribution of our shares to Williams common stockholders. It
will also set forth the other agreements governing our
relationship with Williams that we describe in this section.
Transfer of Assets and Assumption of
Liabilities. The separation and distribution
agreement will identify the assets to be contributed and
transferred, and liabilities to be assumed, in connection with
our separation from Williams so that each of Williams and us
ultimately retains the assets of, and the liabilities associated
with, our respective businesses.
In connection with the separation, all agreements, arrangements,
commitments and understandings, including all intercompany loans
and accounts payable and receivable, between us and our
subsidiaries and other affiliates, on the one hand, and Williams
and its other subsidiaries and other affiliates, on the other
hand, will terminate, except certain agreements and arrangements
which are expressly identified as intended to survive the
separation.
This Offering. The separation and distribution
agreement will require us to use commercially reasonable efforts
to consummate this offering.
The Distribution. The separation and
distribution agreement will govern the rights and obligations of
Williams and us regarding the proposed distribution by Williams
to its common stockholders of the shares of our common stock
held by Williams. We will be required to cooperate with Williams
to accomplish the distribution and, at Williams’
discretion, promptly take any and all actions necessary or
desirable to effect the distribution.
In the separation and distribution agreement, Williams will
represent its intention to complete the distribution during
2012. However, the completion of the distribution will be
subject to various conditions that must be satisfied or waived
by Williams in its sole discretion. In addition, Williams will
have the right not to complete the distribution if, at any time,
Williams’ board of directors determines, in its sole
discretion, that the distribution is not in the best interest of
Williams or its stockholders. As a result, we cannot assure you
as to when or whether the distribution will occur.
Representations and Warranties. Except as
expressly set forth in the separation and distribution agreement
or in any other ancillary agreement, neither we nor Williams
will make any representation or warranty in connection with our
separation from Williams, this offering or the distribution.
136
Contractual Restrictions. For so long as
Williams owns at least 50% of the total voting power of our
outstanding stock generally entitled to elect our directors, we
will not (without Williams’ prior written consent):
|
|
|
| |
•
|
take any action that would limit the ability of Williams to
transfer its shares of our common stock or limit the rights of
any transferee of Williams as a holder of our common stock;
|
|
|
|
| |
•
|
issue any shares of our capital stock, or any rights, warrants
or options to acquire our capital stock, if the issuance would
cause Williams to own less than 50% of the total value of all
classes of our outstanding capital stock, 80% of the total
voting power of all classes of our outstanding capital stock
generally entitled to elect our directors or 80% of any class of
outstanding capital stock not entitled to vote; or
|
|
|
|
| |
•
|
take any action, or fail to take any action, to the extent such
action or failure could reasonably result in Williams being in
breach or default under a contract of which Williams has
notified us.
|
In addition, for so long as Williams is required to consolidate
our results of operations and financial position, we will agree
not to incur any additional indebtedness (excluding the Credit
Facility and the Notes) without the consent of Williams.
During the term of the administrative services agreement and the
transition services agreement, and for one year thereafter,
neither we nor Williams will be permitted to solicit each
other’s employees for employment without the other’s
consent.
Financial Reporting. We will agree, for so
long as Williams is required to consolidate our results of
operations and financial position, to:
|
|
|
| |
•
|
comply with all requirements under applicable law regarding
disclosure controls and procedures and internal control over
financial reporting;
|
| |
| |
•
|
maintain internal systems and procedures that will provide
Williams with reasonable assurance that our financial statements
and other publicly reported information is reliable and timely
prepared in accordance with GAAP and any other applicable law;
|
| |
| |
•
|
provide Williams with financial reports, including consolidated
financial statements (and notes thereto) and discussion and
analysis by management of our financial condition and liquidity,
in the form, and in accordance with the dates, specified by
Williams;
|
| |
| |
•
|
unless required by law, use the auditors (and lead audit
partners) directed by Williams; and
|
| |
| |
•
|
unless required by law, to the extent requested by Williams,
keep our accounting practices and principles consistent with
those of Williams.
|
Releases. Except as otherwise provided in the
separation and distribution agreement, each of Williams and us
will release and discharge the other and their respective
subsidiaries and other affiliates from all liabilities existing
or arising from any acts or events occurring or failing to occur
or alleged to have occurred or to have failed to occur or any
conditions existing or alleged to have existed on or before the
separation from Williams. The releases will not extend to
obligations or liabilities under any agreements between Williams
and us that remain in effect following the separation, which
agreements include, but are not limited to, the separation and
distribution agreement, the administrative services agreement,
the transition services agreement, the registration rights
agreement and the tax sharing agreement.
Confidentiality. Each party will agree to
treat as confidential and not disclose confidential information
of the other party except in specific circumstances identified
in the separation and distribution agreement.
Further Assurances. Each party will agree to
use its reasonable best efforts to take or cause to be taken all
actions, and to do or cause be done all things reasonably
necessary, proper or advisable under applicable law, regulations
and agreements to consummate and make effective the transactions
contemplated by the separation and distribution agreement and
the ancillary agreements.
137
Indemnification. The separation and
distribution agreement will provide that we will indemnify,
defend and hold harmless Williams, its subsidiaries, and each of
their respective current, former and future directors, officers
and employees, and each of the heirs, executors, successors and
assigns of any of the foregoing for any losses arising out of or
resulting from:
|
|
|
| |
•
|
the liabilities being assumed by us pursuant to the separation
and distribution agreement;
|
| |
| |
•
|
the operation of our business;
|
| |
| |
•
|
any breach by us of the separation and distribution agreement or
the ancillary agreements; and
|
| |
| |
•
|
any untrue statement or alleged untrue statement of a material
fact or omission or alleged omission to state a material fact
required to be stated therein or necessary to make the
statements therein not misleading, with respect to all
information (i) contained in the registration statement of
which this prospectus is a part or in this prospectus,
(ii) contained in any public filings made by us with the
SEC following the separation; and (iii) provided by us to
Williams specifically for inclusion in Williams’ annual or
quarterly reports following the separation.
|
Williams will indemnify, defend and hold harmless us, our
subsidiaries, and each of our and their respective current,
former and future directors, officers and employees, and each of
the heirs, executors, successors and assigns of any of the
foregoing for any losses arising out of or resulting from:
|
|
|
| |
•
|
the liabilities being retained by Williams pursuant to the
separation and distribution agreement;
|
| |
| |
•
|
the operation of Williams’ business;
|
| |
| |
•
|
any breach by Williams of the separation and distribution
agreement or the ancillary agreements; and
|
| |
| |
•
|
certain pending or threatened litigation related to the
2000-2001
California Energy Crisis and the reporting of certain natural
gas-related information to trade publications.
|
The separation and distribution agreement will also specify
procedures with respect to claims subject to indemnification and
related matters.
Termination. The separation and distribution
agreement will be terminable before the separation in the sole
discretion of Williams. In the event of such a termination, no
party will have any liability or further obligation with respect
to the separation and distribution agreement.
Dispute Resolution. In the event of a dispute
relating to the separation and distribution agreement between us
and our subsidiaries and other affiliates, on the one hand, and
Williams and its other subsidiaries and other affiliates, on the
other hand, the separation and distribution agreement will
provide for the following procedures:
|
|
|
| |
•
|
first, the parties will use commercially reasonable efforts to
resolve the dispute through negotiations between our
representatives and Williams’ representatives;
|
| |
| |
•
|
if negotiations fail, then the parties will attempt to resolve
the dispute through non-binding mediation; and
|
| |
| |
•
|
if mediation fails, then the parties may seek relief in any
court of competent jurisdiction.
|
Expenses. Except as expressly set forth in the
separation and distribution agreement or in any other ancillary
agreement, all fees and expenses incurred in connection with our
separation from Williams will be paid by the party incurring
such fees or expenses.
Administrative
Services and Transition Services Agreements
We will enter into an administrative services agreement and a
transition services agreement with Williams under which Williams
will provide to us, on an interim basis, various corporate
support services. These
138
services will consist generally of the services that have been
provided to WPX on an intercompany basis prior to this offering.
These services relate to:
|
|
|
| |
•
|
cash management and treasury administration;
|
| |
| |
•
|
finance and accounting;
|
| |
| |
•
|
tax;
|
| |
| |
•
|
internal audit;
|
| |
| |
•
|
investor relations;
|
| |
| |
•
|
payroll and human resource administration;
|
| |
| |
•
|
information technology;
|
| |
| |
•
|
legal and government affairs;
|
| |
| |
•
|
insurance and claims administration;
|
| |
| |
•
|
records management;
|
| |
| |
•
|
real estate and facilities management;
|
| |
| |
•
|
sourcing and procurement; and
|
| |
| |
•
|
mail, print and other office services.
|
Pursuant to the administrative services agreement, Williams will
provide these services to us for the period beginning on the
date this offering is completed and ending on the earlier of (i)
the date immediately prior to the distribution date or (ii)
sixty days’ notice by Williams if it determines that the
provision of such services involves certain conflicts of
interest between Williams and us or would cause Williams to
violate applicable law. Williams will provide the services and
we will pay Williams’ costs, including Williams’
direct and indirect administrative and overhead charges
allocated in accordance with Williams’ regular and
consistent accounting practices. Pursuant to the transition
services agreement, Williams will provide certain services for
up to one year after the distribution date. The transition
services agreement may be terminated by either us or Williams
upon 60 days notice after the distribution date. In
addition, Williams may immediately terminate any of the services
it provides under the transition services agreement if it
determines that the provision of such services involves certain
conflicts of interest between Williams and us or would cause
Williams to violate applicable law.
Williams may decline to provide certain services under these
agreements if the provision of such services causes Williams to
violate applicable law, creates a conflict of interest, requires
Williams to retain additional employees or other resources or
the provision of such services become impracticable due to
reasons outside the control of Williams. Williams will charge us
for its full salary and benefits costs associated with
individuals providing the services as well as any
out-of-pocket
expenses incurred by Williams in the provision of the services,
plus an administrative fee.
In both cases, Williams will provide these services with the
same general degree of care, at the same general volumes and at
the same general degree of accuracy and responsiveness, as when
the services were performed prior to the separation.
In addition, in the event that Williams determines that it will
require any services from us after the distribution date, the
transition services agreement will permit Williams to request
such services from us prior to the distribution date. If
Williams makes such a request, we will use commercially
reasonable efforts to provide such services on the same terms
and conditions as those governing the services Williams is
providing to us under the transition services agreement.
139
Registration
Rights Agreement
The registration rights agreement provides Williams with rights
relating to the shares of our common stock held by Williams.
Under the registration rights agreement, Williams has the right,
subject to the terms of its
lock-up
agreement with the underwriters, to require us to register for
offer and sale all or a portion of the shares of our common
stock covered by the agreement.
Shares Covered. The registration rights
agreement covers those shares of our common stock that are held
by Williams or a transferee of Williams.
Demand Registration. Williams may request
registration under the Securities Act of all or any portion of
our shares covered by the registration rights agreement, and we
will be obligated, subject to limited exceptions, to register
such shares as requested by Williams. The maximum number of
registrations Williams may require us to effect is five.
Williams has the right to designate the terms of each offering
it requests.
We are not required to undertake any demand registration
requested by Williams within 90 days after completion of a
previously-requested demand registration other than pursuant to
a shelf registration statement. In addition, we have the right,
which may be exercised once in any
12-month
period, to postpone the filing or effectiveness of any demand
registration if we determine in the good faith judgment of our
general counsel, confirmed by our board of directors, that such
registration would reasonably be expected to require the
disclosure of material information that we have a business
purpose to keep confidential and the disclosure of which would
have a material adverse effect on any then-active proposals to
engage in certain material transactions until the earlier of
(i) 15 business days after the date of disclosure of such
material information, or (ii) 75 days after we make
such determination.
Piggy-Back Registration. If we at any time
intend to file on our behalf or on behalf of any of our other
security holders a registration statement in connection with a
public offering of any of our securities on a form and in a
manner that would permit the registration for offer and sale of
the shares of our common stock, Williams has the right to have
those shares included in that offering.
Registration Expenses. We are responsible for
all registration expenses incurred in connection with the
performance of our obligations under the registration rights
agreement. Williams is responsible for all of the fees and
expenses of counsel to Williams, any applicable underwriting
discounts or commissions, and any registration or filing fees
incurred with respect to shares of our common stock being sold
under the registration rights agreement.
Indemnification. The registration rights
agreement contains indemnification and contribution provisions
by us for the benefit of Williams and its affiliates and
representatives and, in limited situations, by Williams for the
benefit of us and any underwriters with respect to information
included in any registration statement, prospectus or related
documents.
Transfer. Williams may transfer shares covered
by the registration rights agreement and the holders of such
transferred shares will be entitled to the benefits of the
registration rights agreement, provided that each such
transferee agrees to be bound by the terms of the registration
rights agreement.
Duration. The registration rights under the
registration rights agreement will remain in effect with respect
to any shares of common stock covered by the agreement until:
|
|
|
| |
•
|
such shares have been sold pursuant to an effective registration
statement under the Securities Act;
|
| |
| |
•
|
such shares have been sold to the public pursuant to
Rule 144 under the Securities Act;
|
|
|
|
| |
•
|
such shares have been otherwise transferred and new certificates
evidencing such shares have been delivered and do not bear a
legend restricting further transfer of such shares, provided
that subsequent public distribution of such shares does not
require registration or qualification of them under the
Securities Act or any similar state law;
|
|
|
|
| |
•
|
such shares have ceased to be outstanding; or
|
140
Tax
Sharing Agreement
In connection with this offering, we will enter into a tax
sharing agreement with Williams. The tax sharing agreement will
govern the respective rights, responsibilities, and obligations
of Williams and us with respect to the payment of taxes, filing
of tax returns, reimbursements of taxes, control of audits and
other tax proceedings, liability for taxes that may be triggered
as a result of the spin-off of our stock to Williams’
stockholders and other matters regarding taxes. The tax sharing
agreement will remain in effect until the parties agree in
writing to its termination.
Tax Returns and Taxes. Williams will be
responsible for the preparation and filing of all consolidated,
combined, or unitary income tax returns in which we (or our
subsidiaries) are included, and the payment of all taxes that
relate to such returns. Williams will be entitled to make all
decisions regarding the preparation of such tax returns,
including the making of any tax elections, and we will be bound
by such decisions. We will be responsible for the preparation,
filing, and payment of all returns other than those described
above that are required to be filed with respect to us or any of
our subsidiaries; however, Williams may, in its discretion,
assist us in preparing any such returns.
Pro Forma Returns and Reimbursements. For each
tax period in which we or any of our subsidiaries are
consolidated or combined with Williams for purposes of any tax
return, Williams will prepare a pro forma tax return for us as
if we filed our own consolidated, combined, or unitary return.
Such pro forma returns will take into account all elections and
methods of accounting reflected on the true returns; will only
include current income, deductions, credits and losses from us
(with certain exceptions); will not include any carryovers or
carrybacks of any items from us for prior or subsequent periods;
and will not take into account the federal Alternative Minimum
Tax. For any periods shorter than a full taxable year, the pro
forma return computations will be made based on a hypothetical
closing of the books for us and our subsidiaries. We will
reimburse Williams for any taxes shown on the pro forma tax
returns, and Williams will reimburse us for any current losses
or credits we recognize based on the pro forma tax returns.
Redeterminations. In the case of any tax audit
adjustments, all pro forma returns and associated tax
reimbursement obligations will be recomputed to give effect to
such adjustments, but only for adjustments that originate from a
federal audit.
Spin-off. Williams and we expect that the
spin-off of our stock to Williams’ stockholders and any
related restructuring transaction, taken together, will qualify
for U.S. federal income tax purposes as a tax-free
transaction under section 355 and section 368(a)(1)(D)
of the Code. Williams intends to seek a private letter ruling
from the IRS and an opinion from its outside tax advisor to such
effect. In connection with the private letter ruling and the
opinion, we will be required to make certain factual statements
and representations regarding our company and our business, and
Williams will be required to make certain representations
regarding itself and its business. In the tax sharing agreement,
we and Williams will each represent and warrant that any factual
statements and representations relating to our respective
companies and businesses made in connection with the private
letter ruling and tax opinion are true, correct, and complete,
and that we have no plan or intention of taking any actions nor
know of any circumstances that could cause such factual
statements or representations (or any factual statements or
representations in the tax sharing agreement or separation and
distribution agreement) to be untrue. We and Williams will each
also represent and warrant that, for a period leading up to the
IPO, there was no agreement or arrangement by any of our
officers or directors (or by any person with permission of our
officers or directors) regarding an acquisition of more than 50%
of the stock of WPX, Williams, or Apco, and that we have no
current plan or intention to enter into any such agreements. In
addition, we and Williams will each covenant not to take any
actions that would (i) be inconsistent with any factual
statement or representation made in the tax sharing agreement,
the separation and distribution agreement, or in connection with
the private letter ruling or tax opinion, (ii) create a
material risk that the spin-off or any related restructuring
transaction would fail to qualify as tax-free, or
(iii) create a material risk that section 355(d) or
section 355(e) of the Code would apply to the spin-off.
Further, we and Williams will each agree not to take any
position on a tax return that is inconsistent with the tax free
treatment of the spin-off. We and Williams will also agree to
notify each other if we or they become aware of a transaction
that could affect the status of the spin-off or any related
restructuring transaction under section 355 or
section 368(a)(1)(D) of the Code, and to take reasonable
action or
141
reasonably refrain from taking action to ensure the
qualification of the spin-off as tax free, unless the IRS has
issued a private letter ruling or other guidance conclusively
establishing that such matter or transaction does not adversely
affect the tax-free nature of the spin-off. If we and Williams
cannot agree on a course of action in this respect, we will be
required to take the course of action consistent with applicable
law that Williams reasonably determines in good faith, taking
into account both our interests and Williams’ interests.
Last, we will agree that our officers and directors will not
discuss any acquisitions of our stock or the stock of any of our
subsidiaries during the
two-year
period beginning after the spin-off without permission from
Williams, such permission not to be unreasonably withheld.
Indemnities. If Williams (or any of its
subsidiaries) becomes liable for any taxes because of a failure
of the spin-off or any related restructuring transaction to be
wholly-tax free under section 355 or
section 368(a)(1)(D) of the Code, we will indemnify
Williams for such taxes to the extent caused by our breach of
any representations or covenants made in the tax sharing
agreement, the separation and distribution agreement, or made in
connection with the private letter ruling or tax opinion.
Williams will indemnify us for all taxes arising from the
failure of the spin-off or any related restructuring transaction
to be tax-free except for those caused by us as described above.
Proceedings and Cooperation. Williams will
have the right to control any tax proceedings or disputes and to
make any decisions regarding taxes, payments and settlements
relating to consolidated, combined, or unitary returns that
include us or our subsidiaries. If a proceeding or dispute could
require us to pay taxes arising from the spin-off, Williams will
agree to consult with us and give us an opportunity to comment
and participate in the proceeding. However, Williams retains
sole discretion over all the positions taken in such
proceedings, except that we will have consent rights, which have
to be exercised reasonably, to approve any settlement. We and
Williams will cooperate with each other in good faith regarding
all provisions of the tax sharing agreement, and will retain
books and records relating to the filing of returns in the
agreement for 10 years.
142
OTHER
RELATED PARTY TRANSACTIONS
In addition to the related party transactions described in
“Arrangements Between Williams and Our Company” above,
this section discusses other transactions and relationships with
related persons during the past three fiscal years.
Reimbursement
of Expenses of Williams
Williams charges us for the payroll and benefit costs associated
with operations employees (referred to as direct employees) and
carries the obligations for many employee-related benefits in
its financial statements, including the liabilities related to
employee retirement and medical plans. Our share of those costs
is charged to us through affiliate billings and reflected in
lease and facility operating and general and administrative
within costs and expenses in the accompanying Combined Statement
of Operations. These costs totaled $128 million,
$126 million and $115 million for the years ended
December 31, 2010, 2009 and 2008, respectively.
In addition, Williams charges us for certain employees of
Williams who provide general and administrative services on our
behalf (referred to as indirect employees). These charges are
either directly identifiable or allocated to our operations.
Direct charges include goods and services provided by Williams
at our request. Allocated general corporate costs are based on
our relative use of the service or on a three-factor formula,
which considers revenues; properties and equipment; and payroll.
Our share of direct general and administrative expenses and our
share of allocated general corporate expenses is reflected in
general and administrative expense in the Combined Statement of
Operations. These costs totaled $134 million,
$136 million and $128 million for the years ended
December 31, 2010, 2009 and 2008, respectively. In our
management’s estimation, the allocation methodologies used
are reasonable and result in a reasonable allocation to us of
their costs of doing business incurred by Williams.
Commodity
Sales Contracts
We procure and sell natural gas for shrink replacement and fuel
to Williams Partners and other Williams affiliates. We sell
substantially all of the NGLs related to our production to
Williams Partners. We conduct these transactions at market
prices at the time of purchase. Revenues from these sales
totaled $786 million, $547 million and
$1,078 million for the years ended December 31, 2010,
2009 and 2008, respectively.
In addition, through an agency agreement, we manage the
jurisdictional merchant gas sales for Transcontinental Gas Pipe
Line Company LLC (“Transco”), an indirect, wholly
owned subsidiary of Williams Partners. We are authorized to make
gas sales on Transco’s behalf in order to manage its gas
purchase obligations. Although there is no exchange of payments
between us and Transco for these transactions, we receive all
margins associated with jurisdictional merchant gas sales
business and, as Transco’s agent, assume all market and
credit risk associated with such sales.
Gathering,
Processing and Treating Contracts
We purchase gathering, processing and treating services from
Williams Partners, primarily in the San Juan and Piceance
Basins, under several contracts. We paid $163 million,
$72 million and $44 million under these contracts for
the years ended December 31, 2010, 2009 and 2008,
respectively. The rates Williams Partners charges us to provide
these services are comparable to those that Williams Partners
charges to similarly-situated nonaffiliated customers.
Transportation
Contracts
We purchase natural gas transportation services from Williams
Partners. Costs for these purchases were $25 million,
$28 million and $34 million for the years ended
December 31, 2010, 2009 and 2008, respectively. The rates
Williams Partners charges us to provide these services are
comparable to those that Williams Partners charges to
similarly-situated nonaffiliated customers.
143
We have executed a capacity commitment of 135,000 MMBtu/d
on Williams Partners’ Transco Northeast Supply Link, which
is scheduled to be in-service in the fourth quarter of 2013.
Construction of the Northeast Supply Link remains subject to
regulatory approvals. The transportation rate for this firm
capacity commitment is $0.59/MMbtu and represents a demand
payment obligation of $436MM over the 15 year life of the
project. The receipt point is Transco Station 517 and the
delivery point is the New York City market area.
We manage a transportation capacity contract for Williams
Partners. To the extent the transportation is not fully utilized
or does not recover full-rate demand expense, Williams Partners
reimburses us for these transportation costs. These
reimbursements to us totaled approximately $9.8 million,
$9.1 million and $10.9 million for the years ended
December 31, 2010, 2009 and 2008, respectively.
Derivative
Contracts
We periodically enter into derivative contracts with Williams
Partners to hedge Williams Partners’ forecasted NGL sales
and natural gas purchases. The revenues for these contracts were
$14 million and $6 million for the years ended
December 31, 2010 and 2009, respectively, and an expense of
$3 million for the year ended December 31, 2008. We
enter into offsetting derivative contracts with third parties at
equivalent pricing and volumes.
Agreements
Related to the Piceance Disposition
We entered into a contribution agreement and certain other
agreements with Williams Partners that effected our sale to
Williams Partners of certain gathering and processing assets in
Colorado’s Piceance Basin (the “Piceance
Disposition”). These agreements were the result of
arm’s-length negotiations between Williams and the
Conflicts Committee of the board of directors of the general
partner Williams Partners, which is composed solely of
independent directors unaffiliated with Williams.
Contribution Agreement. On November 19,
2010, we closed the Piceance Disposition as contemplated by the
contribution agreement. The Piceance Disposition was made in
exchange for consideration of $702 million in cash and
1,849,138 Williams Partners common units. In March 2011, the
Williams Partners common units we received in this transaction
were distributed to Williams in a dividend.
Conveyance, Contribution, and Assumption
Agreement. In connection with the closing of the
Piceance Disposition, the parties to the contribution agreement
entered into a conveyance, contribution, and assumption
agreement. This conveyance, contribution, and assumption
agreement effected the contribution of the contributed interests
from us to Williams Partners.
Piceance Omnibus Agreement. Under an omnibus
agreement entered into in connection with the Piceance
Disposition, we are obligated to reimburse Williams Partners for
(i) amounts incurred by Williams Partners for any costs
required to complete the pipeline and compression projects known
collectively as the Ryan Gulch Expansion Project,
(ii) amounts incurred by Williams Partners prior to
January 31, 2011 related to the development of a cryogenic
processing arrangement with a subsidiary of ours, up to
$20 million, and (iii) amounts incurred by Williams
Partners for notice of violation or enforcement actions related
to compression station land use permits or other losses, costs
and expenses related certain surface lease use agreements. As of
December 31, 2010, we paid obligations of Williams Partners
related to the Ryan Gulch Expansion Project of
$2.9 million. Williams Partners is obligated to reimburse
us for any costs related to the pipeline and compression
projects known collectively as the Kokopelli Expansion
irrespective of whether those costs were incurred prior to the
effective date of the Piceance Disposition. We received $432,000
in reimbursements for the Kokopelli Expansion for the year ended
December 31, 2010.
Transition Services Agreement. We provide
transition services to Williams Partners related to the Piceance
Disposition. As of December 31, 2010, we incurred expenses
of $3 million for which we were reimbursed by Williams
Partners pursuant to this agreement.
Meter Agency Agreements. We have agreed to
provide for the operation, calibration and maintenance of
certain meters for the benefit of Williams Partners. It is
anticipated that payments under these agreements will be
approximately $275,000 in 2011.
144
DESCRIPTION
OF OUR CONCURRENT FINANCING TRANSACTIONS
Concurrent with or shortly following this offering, we expect
that we will issue up to $1.5 billion in aggregate
principal amount of senior unsecured notes and our senior
unsecured credit facility will become effective. The following
summary is a description of the principal terms of the Notes and
the Credit Facility. This offering of our Class A common
stock is not contingent upon the effectiveness of the Credit
Facility or the completion of the Notes Offering.
Notes
We expect to offer and sell the Notes only to qualified
institutional buyers in reliance on Rule 144A under the
Securities Act and to certain
non-U.S. persons
in transactions outside the United States in reliance on
Regulation S under the Securities Act. We do not expect to
register the offer and sale of the Notes under the Securities
Act and, as a result, the Notes may not be offered and sold in
the United States absent registration or an applicable exemption
from registration requirements. This prospectus shall not be
deemed to be an offer to sell or a solicitation of an offer to
buy the Notes.
We expect the Notes will bear interest at a fixed rate agreed to
by us and the initial purchasers in the Notes Offering. In
connection with the Notes Offering, we expect to enter into a
registration rights agreement that will obligate us to file an
exchange offer registration statement for the exchange of the
Notes for a new issue of substantially identical debt
securities, the issuance of which has been registered under the
Securities Act, as evidence of the same underlying obligation of
indebtedness.
Credit
Facility
On June 3, 2011 we entered into a $1.5 billion,
five-year senior unsecured revolving credit facility agreement.
The Credit Facility may, under certain conditions, be increased
by an additional $300 million. Funds may be borrowed under
two methods of calculating interest: a fluctuating base rate
equal to the lender’s base rate plus an applicable margin,
or a periodic base rate equal to LIBOR plus an applicable
margin. The applicable margin and the commitment fee are based
on our senior unsecured long-term debt ratings. The Credit
Facility contains various covenants consistent with like
companies’ unsecured credit facilities, with similar credit
ratings in the industry. These covenants limit, among other
things, our and our subsidiaries’ ability to incur
indebtedness, grant certain liens supporting indebtedness, merge
or consolidate, sell all or substantially all of our assets,
enter into certain affiliate transactions and allow any material
change in the nature of our or our subsidiaries’
businesses. Significant financial covenants under the Credit
Facility include:
|
|
|
| |
•
|
a ratio of Debt to Capitalization (as such terms will be defined
in the Credit Facility) no greater than 60% for us and our
consolidated subsidiaries as calculated at the end of each
fiscal quarter; and
|
| |
| |
•
|
if our senior unsecured debt rating at the time of this offering
is below investment grade with a stable outlook, an additional
covenant will require a minimum ratio of Net Present Value of
Projected Future Cash Flows from Proved Reserves to Debt (as
defined in the Credit Facility) for us and our consolidated
subsidiaries as calculated at the end of each fiscal quarter.
This covenant would fall away if and when an investment grade
rating with a stable outlook is received.
|
The Credit Facility includes customary events of default. If an
event of default occurs under the Credit Facility, the lenders
will be able to terminate the commitments and accelerate the
maturity of any loans under the Credit Facility and exercise
other rights and remedies.
145
DESCRIPTION
OF CAPITAL STOCK
The following is a description of the material terms of our
capital stock as to be provided in our amended and restated
certificate of incorporation and amended and restated bylaws, as
each is anticipated to be in effect upon the completion of this
offering. We also refer you to our amended and restated
certificate of incorporation and amended and restated bylaws,
copies of which are filed as exhibits to the registration
statement of which this prospectus forms a part.
Authorized
Capitalization
Following completion of this offering, our authorized capital
stock will consist of
(i) shares of Class A
common stock, par value $ per
share, (ii) shares of
Class B common stock, par value
$ per share and
(iii) shares of preferred
stock, par value $ per share.
Authorized but unissued shares of our capital stock may be used
for a variety of corporate purposes, including future public
offerings, to raise additional capital or to facilitate
acquisitions. The Delaware General Corporation Law does not
require stockholder approval for any issuance of authorized
shares. However, the listing requirements of the NYSE, which
would apply so long as our Class A common stock is listed
on the NYSE, require stockholder approval of certain issuances
equal to or exceeding 20% of the then outstanding voting power
or then outstanding number of shares of Class A common
stock.
Common
Stock
Voting
Rights
The holders of Class A common stock and Class B common
stock generally have identical rights, except that holders of
Class A common stock are entitled to one vote per share
while holders of Class B common stock are entitled to ten
votes per share on all matters to be voted on by stockholders.
Holders of shares of Class A common stock and Class B
common stock are not entitled to cumulate their votes in the
election of directors. Generally, except as discussed in
“—Anti-Takeover Effects of Certificate of
Incorporation and Bylaws Provisions,” all matters to be
voted on by stockholders must be approved by a majority of the
total voting power of the Class A common stock and
Class B common stock present in person or represented by
proxy, voting together as a single class, at a meeting at which
a quorum exists, subject to any voting rights granted to holders
of any preferred stock. Except as otherwise provided by law or
in the amended and restated certificate of incorporation (as
further discussed in “—Anti-Takeover Effects of
Certificate of Incorporation and Bylaws Provisions”), and
subject to any voting rights granted to holders of any
outstanding preferred stock, amendments to the amended and
restated certificate of incorporation must be approved by a
majority of the votes entitled to be cast by the holders of
Class A common stock and Class B common stock, voting
together as a single class. Any provision for the voluntary,
mandatory and other conversion or exchange of the Class B
common stock into or for Class A common stock on a
one-for-one
basis, whether by amendment to the amended and restated
certificate of incorporation, will be deemed not to affect
adversely the rights of the Class A common stock.
Dividends
Holders of Class A common stock and Class B common
stock will share equally on a per share basis in any dividend
declared by our board of directors, subject to any preferential
rights of any outstanding shares of preferred stock. Dividends
payable in shares of common stock may be paid only as follows:
|
|
|
| |
•
|
shares of Class A common stock may be paid only to holders
of Class A common stock, and
|
| |
| |
•
|
shares of Class B common stock may be paid only to holders
of Class B common stock.
|
The number of shares so paid will be equal on a per share basis
with respect to each outstanding share of Class A common
stock and Class B common stock.
We may not reclassify, subdivide or combine shares of either
class of common stock without at the same time proportionally
reclassifying, subdividing or combining shares of the other
class.
146
Conversion
Each share of Class B common stock is convertible at the
option of the holder thereof into one share of Class A
common stock. Williams has indicated that it intends to convert
its Class B common shares to Class A common shares
immediately prior to a spin-off of our common stock to
Williams’ stockholders, assuming such conversion would not
jeopardize the ability to consummate the tax-free spin-off or
the tax-free treatment of any related restructuring transaction
undertaken by Williams. In the event that Williams does not
convert its Class B common shares to Class A common
shares prior to such spin-off, then following any distribution
of Class B common stock to Williams common stockholders in
a transaction (including any distribution in exchange for
Williams shares or securities) intended to qualify as a tax-free
distribution under section 355 of the Code, or any
corresponding provision of any successor statute (a
“Tax-Free Spin-Off”), shares of Class B common
stock will no longer be convertible into shares of Class A
common stock.
Any shares of Class B common stock transferred to a person
other than Williams or any of its affiliates will be converted
automatically into shares of Class A common stock upon such
transfer. To the extent that Williams does not convert its
Class B common shares to Class A common shares prior
to a Tax-Free Spin-Off, shares of Class B common stock
transferred to stockholders of Williams in such Tax-Free
Spin-Off will not be converted into shares of Class A
common stock and, following a Tax-Free Spin-Off, shares of
Class B common stock will be transferable as Class B
common stock, subject to applicable laws.
All shares of Class B common stock will be converted
automatically into Class A common stock if the number of
outstanding shares of Class B common stock beneficially
owned by Williams and its affiliates falls below 50% of the
aggregate number of outstanding shares of our common stock. This
automatic conversion of Class B common stock into
Class A common stock will prevent Williams from decreasing
its economic interest in our company to less than 50% while
still retaining control of more than 80% of our voting power.
All conversions will be effected on a
one-for-one
basis.
Other
Rights
Unless approved by a majority of the votes entitled to be cast
by the holders of each class of our common stock, voting
separately as a class, in the event of any reorganization or
consolidation of WPX with one or more corporations or a merger
of WPX with another corporation in which shares of common stock
are converted into or exchangeable for shares of stock, other
securities or property (including cash), all holders of our
common stock, regardless of class, will be entitled to receive
the same kind and amount of shares of stock and other securities
and property (including cash).
On liquidation, dissolution or winding up of WPX, after payment
in full of the amounts required to be paid to holders of
preferred stock, if any, all holders of common stock, regardless
of class, are entitled to receive the same amount per share with
respect to any distribution of assets to holders of shares of
common stock.
No shares of either class of common stock are subject to
redemption or have preemptive rights to purchase additional
shares of our common stock or other securities.
Upon completion of this offering, all the outstanding shares of
Class A common stock and Class B common stock will be
validly issued, fully paid and nonassessable.
Preferred
Stock
Our amended and restated certificate of incorporation authorizes
our board of directors to establish one or more series of
preferred stock. Unless required by law or by any stock exchange
on which our common stock is listed, the authorized shares of
preferred stock will be available for issuance without further
action by you.
147
Our board of directors is able to determine, with respect to any
series of preferred stock, the terms and rights of that series,
including the following:
|
|
|
| |
•
|
the designation of the series;
|
| |
| |
•
|
the number of shares of the series, which our board may, except
where otherwise provided in the preferred stock designation,
increase or decrease, but not below the number of shares then
outstanding;
|
| |
| |
•
|
whether dividends, if any, will be cumulative or non-cumulative
and the dividend rate of the series;
|
| |
| |
•
|
the dates at which dividends, if any, will be payable;
|
| |
| |
•
|
the redemption rights and price or prices, if any, for shares of
the series;
|
| |
| |
•
|
the terms and amounts of any sinking fund provided for the
purchase or redemption of shares of the series;
|
| |
| |
•
|
the amounts payable on shares of the series in the event of any
voluntary or involuntary liquidation, dissolution or
winding-up
of the affairs of our company;
|
|
|
|
| |
•
|
whether the shares of the series will have conversion privileges
and if so, the terms and conditions of such privileges,
including provision for adjustment of the conversion rate, if
any;
|
|
|
|
| |
•
|
restrictions on the issuance of shares of the same series or of
any other class or series; and
|
| |
| |
•
|
the voting rights, if any, of the holders of the series.
|
Provisions
of Amended and Restated Certificate of Incorporation Governing
Corporate Opportunities
After the completion of this offering, Williams will remain a
substantial stockholder of ours until it completes the spin-off
of our stock to Williams’ stockholders or otherwise
disposes of our common stock that it owns. We and Williams are
engaged in similar activities or lines of business and have an
interest in the same areas of corporate opportunities. Williams
will not have a duty to refrain from engaging directly or
indirectly in the same or similar business activities or lines
of business as us, and to the fullest extent permitted by law,
neither Williams nor any of its directors or officers will be
liable to us or our stockholders for breach of any fiduciary
duty, by reason of any such activities. Additionally, if
Williams acquires knowledge of a potential transaction or matter
that may be a corporate opportunity for Williams and us, to the
fullest extent permitted by law, Williams will have no duty to
communicate or offer such corporate opportunity to us and will
not be liable to us or our stockholders for breach of any duty
(fiduciary or otherwise) if Williams pursues or acquires such
corporate opportunity for itself or directs such corporate
opportunity to its affiliates. If any director or officer of
Williams who is also one of our officers or directors becomes
aware of a potential business opportunity, transaction or other
matter (other than one expressly offered to that director or
officer in writing solely in his or her capacity as our director
or officer), that director or officer will have no duty to
communicate or offer that opportunity to us, and will be
permitted to communicate or offer that opportunity to Williams
(or its affiliates) and that director or officer will not to the
fullest extent permitted by law, be deemed to have
(1) breached or acted in a manner inconsistent with or
opposed to his or her fiduciary or other duties to us regarding
the opportunity or (2) acted in bad faith or in a manner
inconsistent with the best interests of our company or our
stockholders. See “Risk Factors—Risks Related to Our
Relationship with Williams—Pursuant to the terms of our
amended and restated certificate of incorporation, Williams is
not required to offer corporate opportunities to us, and certain
of our directors and officers are permitted to offer certain
corporate opportunities to Williams before us.”
The provisions in our amended and restated certificate of
incorporation governing corporate opportunities between Williams
and us will automatically terminate, expire and have no further
force and effect once (1) Williams and its subsidiaries
(excluding us and our subsidiaries) cease to beneficially own
shares of capital
148
stock representing 50% or more of the voting power of all then
outstanding shares of our capital stock entitled to vote
generally in the election of directors and (2) no person
who is a director or officer of Williams is also a director or
officer of ours. At that point, any such activities will be
governed by Delaware law generally.
Anti-Takeover
Effects of Certificate of Incorporation and Bylaws
Provisions
Some provisions of our amended and restated certificate of
incorporation and amended and restated bylaws could make the
following more difficult, although they have little significance
while we are controlled by Williams:
|
|
|
| |
•
|
acquisition of us by means of a tender offer or merger;
|
| |
| |
•
|
acquisition of us by means of a proxy contest or
otherwise; or
|
| |
| |
•
|
removal of our incumbent officers and directors.
|
These provisions, summarized below, are expected to discourage
coercive takeover practices and inadequate takeover bids. These
provisions also are designed to encourage persons seeking to
acquire control of us to first negotiate with our board of
directors. We believe that the benefits of the potential ability
to negotiate with the proponent of an unfriendly or unsolicited
proposal to acquire or restructure our company outweigh the
disadvantages of discouraging those proposals because
negotiation of them could result in an improvement of their
terms.
Classified
Board
Our amended and restated certificate of incorporation provides
that our board of directors is divided into three classes. The
term of the first class of directors expires at our 2012 annual
meeting of stockholders, the term of the second class of
directors expires at our 2013 annual meeting of stockholders and
the term of the third class of directors expires at our 2014
annual meeting of stockholders. At each of our annual meetings
of stockholders, the successors of the class of directors whose
term expires at that meeting of stockholders will be elected for
a three-year term, one class being elected each year by our
stockholders. This system of electing and removing directors may
discourage a third party from making a tender offer or otherwise
attempting to obtain control of us if Williams no longer
controls us because it generally makes it more difficult for
stockholders to replace a majority of our directors.
Election
and Removal of Directors
A director nominee shall be elected to our board of directors if
the votes cast for such nominee’s election exceed the votes
cast against such nominee’s election.
Directors may be removed, with or without cause, by the
affirmative vote of shares representing a majority of the votes
entitled to be cast by the outstanding capital stock in the
election of our board of directors as long as Williams owns
shares representing at least a majority of the votes entitled to
be cast by the outstanding capital stock in the election of our
board of directors. Once Williams ceases to own shares
representing at least a majority of the votes entitled to be
cast by the outstanding capital stock in the election of our
board of directors, our amended and restated certificate of
incorporation requires that directors may only be removed for
cause and only by the affirmative vote of not less than 75% of
votes entitled to be cast by the outstanding capital stock in
the election of our board of directors.
Size
of Board and Vacancies
Our amended and restated certificate of incorporation provides
that the number of directors on our board of directors will be
fixed exclusively by our board of directors. Newly created
directorships resulting from any increase in our authorized
number of directors will be filled solely by the vote of our
remaining directors in office. Any vacancies in our board of
directors resulting from death, resignation, retirement,
disqualification, removal from office or other cause will be
filled solely by the vote of our remaining directors in office;
provided, however, that as long as Williams continues to
beneficially own shares representing at least a
149
majority of the votes entitled to be cast by the outstanding
capital stock in the election of our board of directors and such
vacancy was caused by the action of stockholders, then such
vacancy also may be filled by the affirmative vote of shares
representing at least a majority of the votes entitled to be
cast by the outstanding capital stock in the election of our
board of directors.
Stockholder
Action by Written Consent
Our amended and restated certificate of incorporation permits
our stockholders to act by written consent without a meeting as
long as Williams continues to beneficially own shares
representing at least a majority of the votes entitled to be
cast by the outstanding capital stock in the election of our
board of directors. Once Williams ceases to beneficially own at
least a majority of the votes entitled to be cast by the
outstanding capital stock in the election of our board of
directors, our amended and restated certificate of incorporation
eliminates the right of our stockholders to act by written
consent.
Stockholder
Meetings
Our amended and restated certificate of incorporation and
amended and restated bylaws provide that a special meeting of
our stockholders may be called only by (i) Williams, so
long as it beneficially owns at least a majority of the votes
entitled to be cast by the outstanding capital stock in the
election of our board of directors, (ii) our board of
directors, or (iii) the chairman of our board of directors
with the concurrence of a majority of our board of directors.
Amendments
to Certain Provisions of our Bylaws
Our amended and restated certificate of incorporation and
amended and restated bylaws provide that the provisions of our
bylaws relating to the calling of meetings of stockholders,
notice of meetings of stockholders, stockholder action by
written consent, advance notice of stockholder business or
director nominations, the authorized number of directors, the
classified board structure, the filling of director vacancies or
the removal of directors (and any provision relating to the
amendment of any of these provisions) may only be amended by the
vote of a majority of our entire board of directors or, as long
as Williams owns shares representing at least a majority of the
votes entitled to be cast by the outstanding capital stock in
the election of our board of directors, by the vote of holders
of a majority of the votes entitled to be cast by outstanding
capital stock in the election of our board of directors. Once
Williams ceases to own shares representing at least a majority
of the votes entitled to be cast by the outstanding capital
stock in the election of our board of directors, our amended and
restated certificate of incorporation and amended and restated
bylaws provide that these provisions may only be amended by the
vote of a majority of our entire board of directors or by the
vote of holders of at least 75% of the votes entitled to be cast
by the outstanding capital stock in the election of our board of
directors.
Amendment
of Certain Provisions of our Certificate of
Incorporation
The amendment of any of the above provisions in our amended and
restated certificate of incorporation requires approval by
holders of shares representing at least a majority of the votes
entitled to be cast by the outstanding capital stock in the
election of our board of directors, as long as Williams owns
shares representing at least a majority of the votes entitled to
be cast by the outstanding capital stock in the election of our
board of directors. Once Williams ceases to own shares
representing at least a majority of the votes entitled to be
cast by the outstanding capital stock in the election of our
board of directors, our amended and restated certificate of
incorporation and amended and restated bylaws provide that these
provisions may only be amended by the vote of a majority of our
entire board of directors followed by the vote of holders of at
least 75% of the votes entitled to be cast by the outstanding
capital stock in the election of our board of directors.
150
Requirements
for Advance Notification of Stockholder Nominations and
Proposals
Our amended and restated bylaws establish advance notice
procedures with respect to stockholder proposals and nomination
of candidates for election as directors other than nominations
made by or at the direction of our board of directors or a
committee of our board of directors.
No
Cumulative Voting
Our amended and restated certificate of incorporation and
amended and restated bylaws do not provide for cumulative voting
in the election of directors.
Undesignated
Preferred Stock
The authorization of our undesignated preferred stock makes it
possible for our board of directors to issue our preferred stock
with voting or other rights or preferences that could impede the
success of any attempt to change control of us. These and other
provisions may have the effect of deferring hostile takeovers or
delaying changes of control of our management.
Delaware
Anti-Takeover Statute
For so long as Williams beneficially owns shares representing at
least 15% of the votes entitled to be cast by the outstanding
capital stock in the election of our board of directors,
Section 203 of the Delaware General Corporation Law, which
relates to business combinations with interested stockholders,
shall not apply to us. Once Williams ceases to beneficially own
shares representing at least 15% of the votes entitled to be
cast by the outstanding capital stock in the election of our
board of directors, Section 203 of the Delaware General
Corporation Law will apply to us. Subject to specific
exceptions, Section 203 prohibits a publicly held Delaware
corporation from engaging in a “business combination”
with an “interested stockholder” for a period of three
years after the date of the transaction in which the person
became an interested stockholder, unless:
|
|
|
| |
•
|
the “business combination,” or the transaction in
which the stockholder became an “interested
stockholder” is approved by the board of directors prior to
the date the “interested stockholder” attained that
status;
|
| |
| |
•
|
upon completion of the transaction that resulted in the
stockholder becoming an “interested stockholder,” the
“interested stockholder” owned at least 85% of the
voting stock of the corporation outstanding at the time the
transaction commenced (excluding for purposes of determining the
voting stock outstanding and not outstanding, voting stock owned
by the interested stockholder, those shares owned by persons who
are directors and also officers, and employee stock plans in
which employee participants do not have the right to determine
confidentiality whether shares held subject to the plan will be
tendered in a tender or exchange offer); or
|
| |
| |
•
|
on or subsequent to the date a person became an “interested
stockholder,” the “business combination” is
approved by the board of directors and authorized at an annual
or special meeting of stockholders by the affirmative vote of at
least two-thirds of the outstanding voting stock that is not
owned by the “interested stockholder.”
|
“Business combinations” include mergers, asset sales
and other transactions resulting in a financial benefit to the
“interested stockholder.” Subject to various
exceptions, an “interested stockholder” is a person
who, together with his or her affiliates and associates, owns,
or within the previous three years did own, 15% or more of the
corporation’s outstanding voting stock. These restrictions
could prohibit or delay the accomplishment of mergers or other
takeover or change in control attempts with respect to us and,
therefore, may discourage attempts to acquire us.
Limitations
on Liability and Indemnification of Officers and
Directors
The Delaware General Corporation Law authorizes corporations to
limit or eliminate the personal liability of directors to
corporations and their stockholders for monetary damages for
breaches of directors’ fiduciary
151
duties. Under our amended and restated certificate of
incorporation, subject to limitations imposed by the Delaware
General Corporation Law, no director shall be personally liable
to us or our stockholders for monetary damages for breach of
fiduciary duty as a director, except for liability:
|
|
|
| |
•
|
for any breach of the director’s duty of loyalty to the
corporation or its stockholders;
|
| |
| |
•
|
for acts or omissions not in good faith or which involve
intentional misconduct or a knowing violation of law;
|
| |
| |
•
|
pursuant to Section 174 of the Delaware General Corporation
Law (providing for liability of directors for unlawful payment
of dividends or unlawful stock purchases or redemptions); or
|
| |
| |
•
|
for any transaction from which a director derived an improper
personal benefit.
|
Our amended and restated bylaws provide that we must indemnify
our directors and officers to the fullest extent authorized by
the Delaware General Corporation Law. We are also expressly
authorized to advance certain expenses (including
attorneys’ fees and disbursements and court costs) and
carry directors’ and officers’ insurance providing
indemnification for our directors, officers and certain
employees for some liabilities. We believe that these
indemnification provisions and insurance are useful to attract
and retain qualified directors and executive officers. There is
currently no pending material litigation or proceeding involving
any of our directors, officers or employees for which
indemnification is sought.
Transfer
Agent and Registrar
Computershare Trust Company, N.A. will be the transfer
agent and registrar for our Class A and Class B common
stock.
Listing
We intend to apply to have our Class A common stock listed
on the NYSE under the symbol “WPX.”
152
SHARES ELIGIBLE
FOR FUTURE SALE
Prior to this offering, there has not been any public market for
our Class A common stock, and a significant public market
for our Class A common stock may not develop or be
sustained after this offering. We cannot predict what effect, if
any, sales of shares of our Class A common stock or the
availability of shares of our Class A common stock for sale
will have on the prevailing market price of our Class A
common stock from time to time. The number of shares of our
Class A common stock available for future sale into the
public markets is subject to legal and contractual restrictions,
some of which are described below. The expiration of these
restrictions will permit sales of substantial amounts of our
Class A common stock in the public market or could create
the perception that these sales could occur, which could
adversely affect the market price for our Class A common
stock and could make it more difficult for us to raise capital
through the sale of our equity or equity-related securities at a
time and price that we deem acceptable.
Upon the completion of this offering, we expect to have a total
of shares
of our Class A common stock outstanding
( if
the underwriters exercise their option to purchase additional
Class A common shares in full). All of the shares of our
Class A common stock sold in this offering will be freely
tradable without restriction or further registration under the
Securities Act, except for “restricted” shares held by
persons who may be deemed our “affiliates,” as that
term is defined under Rule 144 of the Securities Act. An
“affiliate” is a person that directly, or indirectly
through one or more intermediaries, controls or is controlled by
us or is under common control with us.
Rule 144
In general, pursuant to Rule 144 under the Securities Act
in effect on the date of this prospectus, once we have been
subject to public company reporting requirements for at least
90 days, a person who is not one of our affiliates at any
time during the 90 days preceding a sale and who has
beneficially owned the shares of our Class A common stock
to be sold for at least six months, including the holding period
of any prior owner other than our affiliates, would be entitled
to sell those shares without complying with the manner of sale,
volume limitation or notice provisions of Rule 144, subject
to compliance with the public information requirements of
Rule 144. In addition, under Rule 144, a person who is
not one of our affiliates at any time during the 90 days
preceding a sale, and who has beneficially owned the shares of
our Class A common stock to be sold for at least one year,
including the holding period of any prior owner other than our
affiliates, would be entitled to sell those shares without
regard to the requirements of Rule 144. Our affiliates or
persons selling on behalf of our affiliates are entitled to
sell, upon expiration of the
lock-up
agreements described below, within any three-month period
beginning 90 days after the date of this prospectus, a
number of shares that does not exceed the greater of:
|
|
|
| |
•
|
1.0% of the number of shares of Class A common stock then
outstanding, which is
approximately
( if
the underwriters exercise their option to purchase additional
Class A common shares in full) shares of Class A
common stock upon the completion of this offering; and
|
| |
| |
•
|
the average weekly trading volume of our Class A common
stock on the NYSE during the four calendar weeks preceding each
such sale, subject to certain restrictions.
|
Sales under Rule 144 by our affiliates or persons selling
on behalf of our affiliates are also subject to manner of sale
provisions and notice requirements and to the availability of
current public information about us. Rule 144 also provides
that affiliates relying on Rule 144 to sell shares of our
Class A common stock that are not restricted shares must
nonetheless comply with the same restrictions applicable to
restricted shares, other than the holding period requirement.
Lock-up
Agreements
We, our directors, certain of our officers and Williams have
agreed with the underwriters not to sell or otherwise transfer
or dispose of any shares of our common stock, subject to
specified exceptions, during the period from the date of this
prospectus continuing through the date that is 180 days
after the date of this prospectus, subject to an extension in
certain circumstances, except with the prior written consent of
Barclays
153
Capital Inc. and except that 120 days after the date of
this prospectus, Williams will be permitted to spin-off all of
our shares of common stock that it owns to its stockholders as
described below under “—Spin-off.” See
“Underwriting” for a description of these provisions.
Shares Issued
Under Employee Plans
We intend to file a registration statement on
Form S-8
under the Securities Act to register Class A common stock
issuable under our employee plans. This registration statement
is expected to be filed following the effective date of the
registration statement of which this prospectus is a part and
will be effective upon filing. Accordingly, shares registered
under such registration statement will be available for sale in
the public market following the effective date, unless such
shares are subject to vesting restrictions with us,
Rule 144 restrictions applicable to our affiliates, or the
lock-up
agreements described above.
Registration
Rights
After the completion of this offering, Williams will be entitled
to certain rights with respect to the registration under the
Securities Act of our common stock that it owns, under the terms
of a registration rights agreement between us and Williams. See
“Arrangements Between Williams and Our
Company—Registration Rights Agreement.”
Spin-off
Williams has advised us that, following the completion of this
offering, it intends to distribute all of the shares of our
common stock that it owns through a tax-free distribution, or
spin-off, to Williams’ stockholders. The determination of
whether, and if so, when, to proceed with the spin-off is
entirely within the discretion of Williams, although Williams
has indicated its intention to complete the spin-off in 2012 and
to convert its Class B common shares to Class A common
shares immediately prior to such spin-off, assuming such
conversion would not jeopardize the ability to consummate the
tax-free distribution or the tax-free treatment of any related
restructuring transaction undertaken by Williams. Williams has
the sole discretion to determine the form, the structure and all
other terms of any transactions to effect the spin-off. Williams
will not effect the spin-off unless Williams has obtained a
private letter ruling from the IRS and an opinion of its outside
tax advisor, in either case reasonably acceptable to the
Williams board of directors, to the effect that the distribution
by Williams of the shares of our common stock held by Williams
after the offering will qualify for U.S. federal income tax
purposes as a tax-free transaction under section 355 and
section 368(a)(1)(D) of the Code. Williams may decide not
to complete the spin-off if, at any time, Williams’ board
of directors determines, in its sole discretion, that the
spin-off is not in the best interests of Williams or its
stockholders. Common stock distributed to Williams’
stockholders in the spin-off transaction generally would be
freely transferable, except for common stock received by persons
who may be deemed to be our affiliates or otherwise subject to
the lock-up
agreements described above and under “Underwriting.”
154
CERTAIN
U.S. FEDERAL INCOME TAX CONSIDERATIONS
The following is a summary of the material U.S. federal
income tax considerations relating to the purchase, ownership
and disposition of the shares of our Class A common stock,
as of the date hereof. This summary deals only with shares of
our Class A common stock purchased in this offering for
cash and held as capital assets. Additionally, this summary does
not deal with special situations. For example, this summary does
not address:
|
|
|
| |
•
|
tax consequences to holders who may be subject to special tax
treatment, such as dealers in securities or currencies,
financial institutions, regulated investment companies, real
estate investment trusts, expatriates, tax-exempt entities,
traders in securities that elect to use a
mark-to-market
method of accounting for their securities or insurance companies;
|
| |
| |
•
|
tax consequences to persons holding shares of our Class A
common stock as part of a hedging, integrated, or conversion
transaction or a straddle or persons deemed to sell shares of
our Class A common stock under the constructive sale
provisions of the Code;
|
| |
| |
•
|
tax consequences to persons who at any time hold more than 5% of
the total fair market value of any class of our stock;
|
| |
| |
•
|
tax consequences to U.S. holders of shares of our
Class A common stock whose “functional currency”
is not the U.S. dollar;
|
| |
| |
•
|
tax consequences to partnerships or other pass-through entities
and investors in such entities; or
|
| |
| |
•
|
alternative minimum tax consequences, if any.
|
Finally, this summary does not address U.S. federal tax
consequences other than income taxes (such as estate and gift
tax consequences) or any state, local or foreign tax
consequences.
The discussion below is based upon the provisions of the Code,
and U.S. Treasury regulations, rulings and judicial
decisions as of the date hereof. Those authorities may be
changed, perhaps retroactively, so as to result in
U.S. federal income tax consequences different from those
discussed below. This summary does not address all aspects of
U.S. federal income taxation and does not deal with all tax
consequences that may be relevant to holders in light of their
personal circumstances.
If a partnership holds shares of our Class A common stock,
the tax treatment of a partner in the partnership will generally
depend upon the status of the partner and the activities of the
partnership. If you are a partner of a partnership holding
shares of our Class A common stock, you should consult your
tax advisor.
If you are considering the purchase of shares of our
Class A common stock, you should consult your own tax
advisors concerning the U.S. federal income tax
consequences to you in light of your particular facts and
circumstances and any consequences arising under the laws of any
state, local, foreign or other taxing jurisdiction.
Consequences
to U.S. Holders
The following is a summary of the U.S. federal income tax
consequences that will apply to a U.S. holder of shares of
our Class A common stock. “U.S. holder”
means a beneficial owner of common stock for U.S. federal
income tax purposes that is:
|
|
|
| |
•
|
an individual citizen or resident of the United States;
|
| |
| |
•
|
a corporation (or any other entity treated as a corporation for
U.S. federal income tax purposes) created or organized in
or under the laws of the United States, any state thereof or the
District of Columbia;
|
| |
| |
•
|
an estate the income of which is subject to U.S. federal
income taxation regardless of its source; or
|
155
|
|
|
| |
•
|
a trust if (1) it is subject to the primary supervision of
a court within the United States and one or more
U.S. persons have the authority to control all substantial
decisions of the trust, or (2) it has a valid election in
effect under applicable U.S. Treasury regulations to be
treated as a U.S. person.
|
Distributions
A distribution in respect of shares of our Class A common
stock generally will be treated as a dividend to the extent it
is paid from current or accumulated earnings and profits. If the
distribution exceeds current and accumulated earnings and
profits, the excess will be treated as a nontaxable return of
capital reducing the U.S. holder’s tax basis in the
Class A common stock to the extent of the
U.S. holder’s tax basis in that stock. Any remaining
excess will be treated as capital gain. Subject to certain
holding period requirements and exceptions, dividends received
by individual holders generally will be subject to a reduced
maximum tax rate of 15% for qualified dividend income through
December 31, 2012, after which the rate applicable to
dividends is scheduled to return to the tax rate generally
applicable to ordinary income. If a U.S. holder is a
U.S. corporation, it may be eligible to claim the deduction
allowed to U.S. corporations in respect of dividends
received from other U.S. corporations equal to a portion of
any dividends received, subject to generally applicable
limitations on that deduction.
U.S. holders should consult their tax advisors regarding
the holding period and other requirements that must be satisfied
in order to qualify for the dividends-received deduction and the
reduced maximum tax rate for qualified dividend income.
Sale,
Exchange, Redemption or Certain Other Taxable Dispositions of
our Class A Common Stock
A U.S. holder will generally recognize capital gain or loss
on a sale, exchange, redemption (provided the redemption is
treated as a sale or exchange) or certain other taxable
dispositions of our Class A common stock. The
U.S. holder’s gain or loss will equal the difference
between the amount realized by the U.S. holder and the
U.S. holder’s tax basis in the stock. The amount
realized by the U.S. holder will include the amount of any
cash and the fair market value of any other property received
for the stock. Gain or loss recognized by a U.S. holder on
a sale or exchange of stock will be long-term capital gain or
loss if the holder held the stock for more than one year.
Long-term capital gains of non-corporate taxpayers are generally
taxed at lower rates than those applicable to ordinary income.
The deductibility of capital losses is subject to certain
limitations.
Information
Reporting and Backup Withholding
When required, we or our paying agent will report to the holders
of our Class A common stock and to the IRS amounts paid on
or with respect to the Class A common stock during each
calendar year and the amount of tax, if any, withheld from such
payments. A U.S. holder will be subject to backup
withholding on any dividends paid on our Class A common
stock and proceeds from the sale of our Class A common
stock at the applicable rate if the U.S. holder
(a) fails to provide us or our paying agent with a correct
taxpayer identification number or certification of exempt
status, (b) has been notified by the IRS that it is subject
to backup withholding as a result of the failure to properly
report payments of interest or dividends, or (c) in certain
circumstances, has failed to certify under penalty of perjury
that it is not subject to backup withholding. A U.S. holder
may be eligible for an exemption from backup withholding by
providing a properly completed IRS
Form W-9
to us or our paying agent. Any amounts withheld under the backup
withholding rules will generally be allowed as a refund or a
credit against a U.S. holder’s U.S. federal
income tax liability provided the required information is
properly furnished to the IRS by the U.S. holder on a
timely basis.
Consequences
to Non-U.S.
Holders
The following is a summary of the U.S. federal income tax
consequences that will apply to you if you are a
non-U.S. holder
of shares of our Class A common stock. The term
“non-U.S. holder”
means a beneficial owner of shares of common stock that is, for
U.S. federal income tax purposes, an individual,
corporation, trust or estate that is not a U.S. holder.
Special rules may apply to certain
non-U.S. holders
such as “controlled
156
foreign corporations” or “passive foreign investment
companies.” Such entities should consult their own tax
advisors to determine the U.S. federal, state, local and
other tax consequences that may be relevant to them.
Distributions
Any dividends paid to a
non-U.S. holder
with respect to the shares of our Class A common stock will
be subject to withholding tax at a 30% rate or such lower rate
as specified by an applicable income tax treaty. However,
dividends that are effectively connected with the conduct of a
trade or business within the United States and, where an
applicable tax treaty so provides, are attributable to a
U.S. permanent establishment, are not subject to the
withholding tax, but instead are subject to U.S. federal
income tax on a net income basis at applicable graduated
individual or corporate rates. Certain certification and
disclosure requirements must be complied with in order for
effectively connected income to be exempt from withholding. Any
such effectively connected dividends received by a foreign
corporation may, under certain circumstances, be subject to an
additional branch profits tax at a 30% rate or such lower rate
as specified by an applicable income tax treaty.
A
non-U.S. holder
of shares of our Class A common stock who wishes to claim
the benefit of an applicable treaty rate is required to satisfy
applicable certification and other requirements. If a
non-U.S. holder
is eligible for a reduced rate of U.S. withholding tax
pursuant to an income tax treaty, the holder may obtain a refund
of any excess amounts withheld by timely filing an appropriate
claim for refund with the IRS.
Sale,
Exchange, Redemption or Other Taxable Disposition of our
Class A Common Stock
Any gain realized by a
non-U.S. holder
upon the sale, exchange, redemption (provided the redemption is
treated as a sale or exchange) or other taxable disposition of
shares of our Class A common stock will not be subject to
U.S. federal income tax with respect to such gain unless:
|
|
|
| |
•
|
that gain is effectively connected with the conduct of a trade
or business in the United States (and, if required by an
applicable income tax treaty, is attributable to a
U.S. permanent establishment);
|
| |
| |
•
|
the
non-U.S. holder
is an individual who is present in the United States for
183 days or more in the taxable year of that disposition,
and certain other conditions are met; or
|
| |
| |
•
|
our Class A common stock constitutes a U.S. real
property interest by reason of our status as a
“U.S. real property holding corporation” (a
“USRPHC”) for U.S. federal income tax purposes at
any time within the shorter of the five-year period preceding
the disposition or the period that the
non-U.S. holder
held our Class A common stock.
|
A
non-U.S. holder
described in the first bullet point above will be subject to
U.S. federal income tax on the net gain derived from the
sale in the same manner as a U.S. holder. If a
non-U.S. holder
is eligible for the benefits of a tax treaty between the United
States and its country of residence, any such gain will be
subject to U.S. federal income tax in the manner specified
by the treaty. To claim the benefit of a treaty, a
non-U.S. holder
must properly submit an IRS
Form W-8BEN
(or suitable successor or substitute form). A
non-U.S. holder
that is a foreign corporation and is described in the first
bullet point above will be subject to tax on gain under regular
graduated U.S. federal income tax rates and, in addition,
may be subject to a branch profits tax at a 30% rate or a lower
rate if so specified by an applicable income tax treaty. An
individual
non-U.S. holder
described in the second bullet point above will be subject to a
flat 30% U.S. federal income tax on the gain derived from
the sale, which may be offset by U.S. source capital losses.
With regard to the third bullet point above, generally, a
corporation is a USRPHC if the fair market value of its United
States real property interests equals or exceeds 50% of the sum
of the fair market value of its worldwide real property
interests and its other assets used or held for use in a trade
or business. We expect to be a USRPHC for U.S. federal
income tax purposes. However, even if we are or become a USRPHC,
our Class A common stock will be treated as a
U.S. real property interest only if the
non-U.S. holder
actually or constructively holds more than 5% of our
Class A common stock at any time during the holding period
described above, provided that our Class A common stock
does not cease to be regularly traded on an established
securities market prior to the year in which the sale occurs.
Any taxable gain generally would be taxed in the same manner as
gain that is effectively connected with the conduct of a trade
or business in the
157
United States, except that the branch profits tax will not
apply.
Non-U.S. holders
should consult their own advisors about the consequences that
could result if we are, or become, a USRPHC.
Information
Reporting and Backup Withholding
Generally, we must report to the IRS and to
non-U.S. holders
the amount of dividends paid to the holder and the amount of
tax, if any, withheld with respect to those payments. Copies of
the information returns reporting such dividend payments and any
withholding may also be made available to the tax authorities in
the country in which the holder resides under the provisions of
an applicable income tax treaty.
In general, a
non-U.S. holder
will not be subject to backup withholding with respect to
payments of dividends that we make to the holder if the
non-U.S. holder
certifies under penalty of perjury that it is a
non-U.S. holder
or otherwise establishes an exemption. A
non-U.S. holder
will be subject to information reporting and, depending on the
circumstances, backup withholding with respect to the proceeds
of the sale or other disposition of shares of our Class A
common stock within the United States or conducted through
certain
U.S.-related
payors, unless the payor of the proceeds receives the statement
described above or the holder otherwise establishes an exemption.
Any amounts withheld under the backup withholding rules will be
allowed as a refund or a credit against a holder’s
U.S. federal income tax liability provided the required
information is furnished to the IRS.
New
Legislation Relating to Foreign Accounts
Newly enacted legislation may impose withholding taxes on
certain types of payments made to “foreign financial
institutions” and certain other
non-U.S. entities
after December 31, 2012. The legislation imposes a 30%
withholding tax on dividends on, or gross proceeds from the sale
or other disposition of, common stock paid to a foreign
financial institution unless the foreign financial institution
enters into an agreement with the U.S. Treasury to, among
other things, undertake to identify accounts held by certain
U.S. persons or
U.S.-owned
foreign entities, annually report certain information about such
accounts, and withhold 30% on payments to account holders whose
actions prevent it from complying with these reporting and other
requirements. In addition, the legislation imposes a 30%
withholding tax on the same types of payments to a foreign
non-financial entity unless the entity certifies that it does
not have any substantial U.S. owners or furnishes
identifying information regarding each substantial
U.S. owner. Prospective investors should consult their tax
advisors regarding the effect of this legislation, if any, on
their ownership and disposition of the shares of our
Class A common stock.
Health
Care Education and Reconciliation Act of 2010
On March 30, 2010, President Obama signed into law the
Health Care Education and Reconciliation Act of 2010, which
requires certain United States persons who are individuals,
estates or trusts to pay a 3.8% tax on, among other things,
dividends and capital gains from the sale, exchange, redemption
or other taxable disposition of equity investments, including
common stock, for taxable years beginning after
December 31, 2012. Prospective investors should consult
their tax advisors regarding the effect, if any, of this
legislation on their ownership and disposition of the shares of
our Class A common stock.
158
UNDERWRITING
Barclays Capital Inc., Citigroup Global Markets Inc. and
J.P. Morgan Securities LLC are acting as representatives of
the underwriters and joint book-running managers of this
offering. Under the terms of an underwriting agreement, which
will be filed as an exhibit to the registration statement, each
of the underwriters named below has severally agreed to purchase
from us the respective number of Class A common stock shown
opposite its name below:
| |
|
|
|
|
|
|
|
Number of
|
|
|
Underwriters
|
|
Shares
|
|
|
|
|
Barclays Capital Inc.
|
|
|
|
|
|
Citigroup Global Markets Inc.
|
|
|
|
|
|
J.P. Morgan Securities LLC
|
|
|
|
|
|
|
|
|
|
|
|
Total
|
|
|
|
|
|
|
|
|
|
|
The underwriting agreement provides that the underwriters’
obligation to purchase shares of Class A common stock
depends on the satisfaction of the conditions contained in the
underwriting agreement including:
|
|
|
| |
•
|
the obligation to purchase all of the shares of Class A
common stock offered hereby (other than those shares of
Class A common stock covered by their option to purchase
additional shares as described below), if any of the shares are
purchased;
|
| |
| |
•
|
the representations and warranties made by us to the
underwriters are true;
|
| |
| |
•
|
there is no material change in our business or the financial
markets; and
|
| |
| |
•
|
we deliver customary closing documents to the underwriters.
|
Commissions
and Expenses
The following table summarizes the underwriting discounts and
commissions we will pay to the underwriters. These amounts are
shown assuming both no exercise and full exercise of the
underwriters’ option to purchase additional shares. The
underwriting fee is the difference between the initial price to
the public and the amount the underwriters pay to us for the
shares.
| |
|
|
|
|
|
|
|
|
|
|
|
No Exercise
|
|
|
Full Exercise
|
|
|
|
|
Per share
|
|
|
|
|
|
|
|
|
|
|
|
|
|
|
|
|
|
|
|
Total
|
|
|
|
|
|
|
|
|
|
|
|
|
|
|
|
|
|
|
The representatives of the underwriters have advised us that the
underwriters propose to offer the shares of Class A common
stock directly to the public at the public offering price on the
cover of this prospectus and to selected dealers, which may
include the underwriters, at such offering price less a selling
concession not in excess of $ per
share. After the offering, the representatives may change the
offering price and other selling terms. Sales of shares made
outside of the United States may be made by affiliates of the
underwriters.
The expenses of the offering that are payable by us are
estimated to be
$
(excluding underwriting discounts and commissions).
Option to
Purchase Additional Shares
We have granted the underwriters an option exercisable for
30 days after the date of the underwriting agreement, to
purchase, from time to time, in whole or in part, up to an
aggregate
of shares
at the public offering price less underwriting discounts and
commissions. This option may be exercised if the underwriters
sell more
than shares
in connection with this offering. To the extent that this option
is exercised, each underwriter will be obligated, subject to
certain conditions, to purchase its pro rata portion of
159
these additional shares based on the underwriter’s
underwriting commitment in the offering as indicated in the
table at the beginning of this Underwriting section.
Lock-Up
Agreements
We, our directors, certain of our officers and Williams have
agreed that, subject to certain exceptions, without the prior
written consent of Barclays Capital Inc., we and they will not
directly or indirectly, (1) offer for sale, sell, pledge,
or otherwise dispose of (or enter into any transaction or device
that is designed to, or could be expected to, result in the
disposition by any person at any time in the future of) any
shares of Class A common stock (including, without
limitation, shares of Class A common stock that may be
deemed to be beneficially owned by us or them in accordance with
the rules and regulations of the SEC and shares of Class A
common stock that may be issued upon exercise of any options or
warrants) or securities convertible into or exercisable or
exchangeable for Class A common stock, (2) enter into
any swap or other derivatives transaction that transfers to
another, in whole or in part, any of the economic consequences
of ownership of the Class A common stock, (3) make any
demand for or exercise any right or file or cause to be filed a
registration statement, including any amendments thereto, with
respect to the registration of any shares of Class A common
stock or securities convertible, exercisable or exchangeable
into Class A common stock or any of our other securities,
or (4) publicly disclose the intention to do any of the
foregoing for a period of 180 days after the date of this
prospectus, except that 120 days after the date of this
prospectus, Williams will be permitted to spin-off all of our
shares of common stock that it owns to its stockholders.
The 180-day
restricted period described in the preceding paragraph will be
extended if:
|
|
|
| |
•
|
during the last 17 days of the
180-day
restricted period we issue an earnings release or material news
or a material event relating to us occurs; or
|
| |
| |
•
|
prior to the expiration of the
180-day
restricted period, we announce that we will release earnings
results during the
16-day
period beginning on the last day of the
180-day
period,
|
in which case the restrictions described in the preceding
paragraph will continue to apply until the expiration of the
18-day
period beginning on the issuance of the earnings release or the
announcement of the material news or occurrence of a material
event, unless such extension is waived in writing by Barclays
Capital Inc.
Barclays Capital Inc., in its sole discretion, may release the
Class A common stock and other securities subject to the
lock-up
agreements described above in whole or in part at any time with
or without notice. When determining whether or not to release
Class A common stock and other securities from
lock-up
agreements, Barclays Capital Inc. will consider, among other
factors, the holder’s reasons for requesting the release,
the number of shares of Class A common stock and other
securities for which the release is being requested and market
conditions at the time.
Directed
Share Program
At our request, the underwriters have reserved for sale at the
initial public offering price up
to shares of our Class A
common stock offered hereby for officers, directors, employees
and certain other persons associated with us. The number of
Class A shares available for sale to the general public
will be reduced to the extent such persons purchase such
reserved shares. Any reserved shares not so purchased will be
offered by the underwriters to the general public on the same
basis as the other shares of our Class A common stock
offered hereby. Any participants in this program shall be
prohibited from selling, pledging or assigning any shares sold
to them pursuant to this program for a period of 180 days
after the date of this prospectus. This
180-day lock
up period shall be extended with respect to our issuance of an
earnings release or if a material news or a material event
relating to us occurs, in the same manner as described above
under
“— Lock-Up
Agreements.”
160
Offering
Price Determination
Prior to this offering, there has been no public market for our
Class A common stock. The initial public offering price
will be negotiated between the representatives and us. In
determining the initial public offering price of our
Class A common stock, the representatives will consider:
|
|
|
| |
•
|
the history and prospects for the industry in which we compete;
|
| |
| |
•
|
our financial information;
|
| |
| |
•
|
the ability of our management and our business potential and
earning prospects;
|
| |
| |
•
|
the prevailing securities markets at the time of this
offering; and
|
| |
| |
•
|
the recent market prices of, and the demand for, publicly traded
shares of generally comparable companies.
|
Indemnification
We have agreed to indemnify the underwriters against certain
liabilities, including liabilities under the Securities Act, and
to contribute to payments that the underwriters may be required
to make for these liabilities.
Stabilization,
Short Positions and Penalty Bids
The representatives may engage in stabilizing transactions,
short sales and purchases to cover positions created by short
sales, and penalty bids or purchases for the purpose of pegging,
fixing or maintaining the price of the Class A common
stock, in accordance with Regulation M under the
Exchange Act:
|
|
|
| |
•
|
Stabilizing transactions permit bids to purchase the underlying
security so long as the stabilizing bids do not exceed a
specified maximum.
|
| |
| |
•
|
A short position involves a sale by the underwriters of shares
in excess of the number of shares the underwriters are obligated
to purchase in the offering, which creates the syndicate short
position. This short position may be either a covered short
position or a naked short position. In a covered short position,
the number of shares involved in the sales made by the
underwriters in excess of the number of shares they are
obligated to purchase is not greater than the number of shares
that they may purchase by exercising their option to purchase
additional shares. In a naked short position, the number of
shares involved is greater than the number of shares in their
option to purchase additional shares. The underwriters may close
out any short position by either exercising their option to
purchase additional shares
and/or
purchasing shares in the open market. In determining the source
of shares to close out the short position, the underwriters will
consider, among other things, the price of shares available for
purchase in the open market as compared to the price at which
they may purchase shares through their option to purchase
additional shares. A naked short position is more likely to be
created if the underwriters are concerned that there could be
downward pressure on the price of the shares in the open market
after pricing that could adversely affect investors who purchase
in the offering.
|
| |
| |
•
|
Syndicate covering transactions involve purchases of the
Class A common stock in the open market after the
distribution has been completed in order to cover syndicate
short positions.
|
| |
| |
•
|
Penalty bids permit the representatives to reclaim a selling
concession from a syndicate member when the Class A common
stock originally sold by the syndicate member is purchased in a
stabilizing or syndicate covering transaction to cover syndicate
short positions.
|
These stabilizing transactions, syndicate covering transactions
and penalty bids may have the effect of raising or maintaining
the market price of our Class A common stock or preventing
or retarding a decline in the market price of the Class A
common stock. As a result, the price of the Class A common
stock may be higher than the price that might otherwise exist in
the open market. These transactions may be effected on the NYSE
or otherwise and, if commenced, may be discontinued at any time.
161
Neither we nor any of the underwriters make any representation
or prediction as to the direction or magnitude of any effect
that the transactions described above may have on the price of
the Class A common stock. In addition, neither we nor any
of the underwriters make representation that the representatives
will engage in these stabilizing transactions or that any
transaction, once commenced, will not be discontinued without
notice.
Electronic
Distribution
A prospectus in electronic format may be made available on the
Internet sites or through other online services maintained by
one or more of the underwriters
and/or
selling group members participating in this offering, or by
their affiliates. In those cases, prospective investors may view
offering terms online and, depending upon the particular
underwriter or selling group member, prospective investors may
be allowed to place orders online. The underwriters may agree
with us to allocate a specific number of shares for sale to
online brokerage account holders. Any such allocation for online
distributions will be made by the representatives on the same
basis as other allocations.
Other than the prospectus in electronic format, the information
on any underwriter’s or selling group member’s web
site and any information contained in any other web site
maintained by an underwriter or selling group member is not part
of the prospectus or the registration statement of which this
prospectus forms a part, has not been approved
and/or
endorsed by us or any underwriter or selling group member in its
capacity as underwriter or selling group member and should not
be relied upon by investors.
New York
Stock Exchange
We intend to apply to list our shares of Class A common
stock for quotation on the NYSE under the symbol
“WPX.” In connection with that listing, the
underwriters will undertake to sell the minimum number of
Class A common shares to the minimum number of beneficial
owners necessary to meet the NYSE listing requirements.
Discretionary
Sales
The underwriters have informed us that they do not intend to
confirm sales to discretionary accounts that exceed 5% of the
total number of shares offered by them.
Stamp
Taxes
If you purchase shares of Class A common stock offered in
this prospectus, you may be required to pay stamp taxes and
other charges under the laws and practices of the country of
purchase, in addition to the offering price listed on the cover
page of this prospectus.
Relationships
Certain of the underwriters
and/or their
affiliates have engaged, and may in the future engage, in
investment banking transactions with us in the ordinary course
of their business. They have received, and expect to receive,
customary compensation and expense reimbursement for these
investment banking transactions.
Selling
Restrictions
European
Economic Area
In relation to each member state of the European Economic Area
which has implemented the Prospectus Directive (each, a
“Relevant Member State”), including each Relevant
Member State that has implemented the 2010 PD Amending Directive
with regard to persons to whom an offer of securities is
addressed and the denomination per unit of the offer of
securities (each, an “Early Implementing Member
State”), with effect from and including the date on which
the Prospectus Directive is implemented in that Relevant Member
State (the “Relevant Implementation Date”), no offer
of shares will be made to the public in that Relevant Member
162
State (other than offers (the “Permitted Public
Offers”) where a prospectus will be published in relation
to the shares that has been approved by the competent authority
in a Relevant Member State or, where appropriate, approved in
another Relevant Member State and notified to the competent
authority in that Relevant Member State, all in accordance with
the Prospectus Directive), except that with effect from and
including that Relevant Implementation Date, offers of shares
may be made to the public in that Relevant Member State at any
time:
|
|
|
| |
(a)
|
to “qualified investors” as defined in the Prospectus
Directive, including:
|
|
|
|
| |
(i)
|
(in the case of Relevant Member States other than Early
Implementing Member States), legal entities which are authorized
or regulated to operate in the financial markets or, if not so
authorized or regulated, whose corporate purpose is solely to
invest in securities, or any legal entity which has two or more
of (i) an average of at least 250 employees during the
last financial year; (ii) a total balance sheet of more
than €43.0 million and (iii) an annual turnover
of more than €50.0 million as shown in its last annual
or consolidated accounts; or
|
|
|
|
| |
(ii)
|
(in the case of Early Implementing Member States), persons or
entities that are described in points (1) to (4) of
Section I of Annex II to Directive 2004/39/EC, and
those who are treated on request as professional clients in
accordance with Annex II to Directive 2004/39/EC, or
recognized as eligible counterparties in accordance with
Article 24 of Directive 2004/39/EC unless they have
requested that they be treated as non-professional clients;
|
|
|
|
| |
(b)
|
to fewer than 100 (or, in the case of Early Implementing Member
States, 150) natural or legal persons (other than
“qualified investors” as defined in the Prospectus
Directive), as permitted in the Prospectus Directive, subject to
obtaining the prior consent of the representatives for any such
offer; or
|
|
|
|
| |
(c)
|
in any other circumstances falling within Article 3(2) of
the Prospectus Directive,
|
provided that no such offer of shares shall result in a
requirement for the publication of a prospectus pursuant to
Article 3 of the Prospectus Directive or of a supplement to
a prospectus pursuant to Article 16 of the Prospectus
Directive.
Each person in a Relevant Member State (other than a Relevant
Member State where there is a Permitted Public Offer) who
initially acquires any shares or to whom any offer is made will
be deemed to have represented, acknowledged and agreed that
(A) it is a “qualified investor”, and (B) in
the case of any shares acquired by it as a financial
intermediary, as that term is used in Article 3(2) of the
Prospectus Directive, (x) the shares acquired by it in the
offering have not been acquired on behalf of, nor have they been
acquired with a view to their offer or resale to, persons in any
Relevant Member State other than “qualified investors”
as defined in the Prospectus Directive, or in circumstances in
which the prior consent of the Subscribers has been given to the
offer or resale, or (y) where shares have been acquired by
it on behalf of persons in any Relevant Member State other than
“qualified investors” as defined in the Prospectus
Directive, the offer of those shares to it is not treated under
the Prospectus Directive as having been made to such persons.
For the purpose of the above provisions, the expression “an
offer to the public” in relation to any shares in any
Relevant Member State means the communication in any form and by
any means of sufficient information on the terms of the offer of
any shares to be offered so as to enable an investor to decide
to purchase any shares, as the same may be varied in the
Relevant Member State by any measure implementing the Prospectus
Directive in the Relevant Member State and the expression
“Prospectus Directive” means Directive
2003/71 EC
(including the 2010 PD Amending Directive, in the case of Early
Implementing Member States) and includes any relevant
implementing measure in each Relevant Member State and the
expression “2010 PD Amending Directive” means
Directive
2010/73/EU.
United
Kingdom
This prospectus is only being distributed to, and is only
directed at, persons in the United Kingdom that are qualified
investors within the meaning of Article 2(1)(e) of the
Prospectus Directive (“Qualified Investors”) that are
also (i) investment professionals falling within
Article 19(5) of the Financial Services and Markets Act
163
2000 (Financial Promotion) Order 2005 (the “Order”) or
(ii) high net worth entities, and other persons to whom it
may lawfully be communicated, falling within
Article 49(2)(a) to (d) of the Order (all such persons
together being referred to as “relevant persons”).
This prospectus and its contents are confidential and should not
be distributed, published or reproduced (in whole or in part) or
disclosed by recipients to any other persons in the United
Kingdom. Any person in the United Kingdom that is not a relevant
persons should not act or rely on this document or any of its
contents.
Australia
No prospectus or other disclosure document (as defined in the
Corporations Act 2001 (Cth) of Australia (“Corporations
Act”)) in relation to the shares has been or will be lodged
with the Australian Securities & Investments
Commission (“ASIC”). This document has not been lodged
with ASIC and is only directed to certain categories of exempt
persons. Accordingly, if you receive this document in Australia:
|
|
|
| |
(a)
|
you confirm and warrant that you are either:
|
|
|
|
| |
(i)
|
a “sophisticated investor” under
section 708(8)(a) or (b) of the Corporations Act;
|
|
|
|
| |
(ii)
|
a “sophisticated investor” under
section 708(8)(c) or (d) of the Corporations Act and
that you have provided an accountant’s certificate to us
which complies with the requirements of
section 708(8)(c)(i) or (ii) of the Corporations Act
and related regulations before the offer has been made;
|
| |
| |
(iii)
|
a person associated with the Company under section 708(12)
of the Corporations Act; or
|
|
|
|
| |
(iv)
|
a “professional investor” within the meaning of
section 708(11)(a) or (b) of the Corporations Act,
|
and to the extent that you are unable to confirm or warrant that
you are an exempt sophisticated investor, associated person or
professional investor under the Corporations Act any offer made
to you under this document is void and incapable of
acceptance; and
|
|
|
| |
(b)
|
you warrant and agree that you will not offer any of the shares
for resale in Australia within 12 months of those shares
being issued unless any such resale offer is exempt from the
requirement to issue a disclosure document under
section 708 of the Corporations Act.
|
Hong
Kong
The shares may not be offered or sold in Hong Kong, by means of
any document, other than (a) to “professional
investors” as defined in the Securities and Futures
Ordinance (Cap. 571, Laws of Hong Kong) and any rules made under
that Ordinance or (b) in other circumstances which do not
result in the document being a “prospectus” as defined
in the Companies Ordinance (Cap. 32, Laws of Hong Kong) or which
do not constitute an offer to the public within the meaning of
that Ordinance. No advertisement, invitation or document
relating to the shares may be issued or may be in the possession
of any person for the purpose of the issue, whether in Hong Kong
or elsewhere, which is directed at, or the contents of which are
likely to be read by, the public in Hong Kong (except if
permitted to do so under the laws of Hong Kong) other than with
respect to the shares which are intended to be disposed of only
to persons outside Hong Kong or only to “professional
investors” as defined in the Securities and Futures
Ordinance (Cap. 571, Laws of Hong Kong) or any rules made under
that Ordinance.
India
This prospectus has not been and will not be registered as a
prospectus with the Registrar of Companies in India or with the
Securities and Exchange Board of India. This prospectus or any
other material relating to these securities is for information
purposes only and may not be circulated or distributed, directly
or indirectly, to the public or any members of the public in
India and in any event to not more than 50 persons in
India. Further, persons into whose possession this prospectus
comes are required to inform themselves about and to observe any
such restrictions. Each prospective investor is advised to
consult its advisors about the particular
164
consequences to it of an investment in these securities. Each
prospective investor is also advised that any investment in
these securities by it is subject to the regulations prescribed
by the Reserve Bank of India and the Foreign Exchange Management
Act and any regulations framed thereunder.
Japan
No securities registration statement (“SRS”) has been
filed under Article 4, Paragraph 1 of the Financial
Instruments and Exchange Law of Japan (Law No. 25 of 1948,
as amended) (“FIEL”) in relation to the shares. The
shares are being offered in a private placement to
“qualified institutional investors”
(tekikaku-kikan-toshika)
under Article 10 of the Cabinet Office Ordinance concerning
Definitions provided in Article 2 of the FIEL (the Ministry
of Finance Ordinance No. 14, as amended)
(“QIIs”), under Article 2, Paragraph 3,
Item 2 i of the FIEL. Any QII acquiring the shares in this
offer may not transfer or resell those shares except to other
QIIs.
Korea
The shares may not be offered, sold and delivered directly or
indirectly, or offered or sold to any person for reoffering or
resale, directly or indirectly, in Korea or to any resident of
Korea except pursuant to the applicable laws and regulations of
Korea, including the Korea Securities and Exchange Act and the
Foreign Exchange Transaction Law and the decrees and regulations
thereunder. The shares have not been registered with the
Financial Services Commission of Korea for public offering in
Korea. Furthermore, the shares may not be resold to Korean
residents unless the purchaser of the shares complies with all
applicable regulatory requirements (including but not limited to
government approval requirements under the Foreign Exchange
Transaction Law and its subordinate decrees and regulations) in
connection with the purchase of the shares.
Singapore
This prospectus has not been registered as a prospectus with the
Monetary Authority of Singapore. Accordingly, this prospectus
and any other document or material in connection with the offer
or sale, or invitation for subscription or purchase, of the
shares may not be circulated or distributed, nor may the shares
be offered or sold, or be made the subject of an invitation for
subscription or purchase, whether directly or indirectly, to
persons in Singapore other than (i) to an institutional
investor under Section 274 of the Securities and Future
Act, Chapter 289 of Singapore (the “SFA”),
(ii) to a “relevant person” as defined in
Section 275(2) of the SFA, or any person pursuant to
Section 275 (1A), and in accordance with the conditions,
specified in Section 275 of the SFA or (iii) otherwise
pursuant to, and in accordance with the conditions of, any other
applicable provision of the SFA.
Where the shares are subscribed and purchased under
Section 275 of the SFA by a relevant person which is:
|
|
|
| |
(a)
|
a corporation (which is not an accredited investor (as defined
in Section 4A of the SFA)) the sole business of which is to
hold investments and the entire share capital of which is owned
by one or more individuals, each of whom is an accredited
investor; or
|
|
|
|
| |
(b)
|
a trust (where the trustee is not an accredited investor (as
defined in Section 4A of the SFA)) whose sole whole purpose
is to hold investments and each beneficiary is an accredited
investor, shares, debentures and units of shares and debentures
of that corporation or the beneficiaries’ rights and
interest (howsoever described) in that trust shall not be
transferable within six months after that corporation or that
trust has acquired the shares under Section 275 of the SFA
except:
|
|
|
|
| |
(i)
|
to an institutional investor under Section 274 of the SFA
or to a relevant person (as defined in Section 275(2) of
the SFA) and in accordance with the conditions, specified in
Section 275 of the SFA;
|
|
|
|
| |
(ii)
|
(in the case of a corporation) where the transfer arises from an
offer referred to in Section 275(1A) of the SFA, or (in the
case of a trust) where the transfer arises from an offer that is
made on terms that such rights or interests are acquired at a
consideration of not less
|
165
|
|
|
| |
|
than S$200,000 (or its equivalent in a foreign currency) for
each transaction, whether such amount is to be paid for in cash
or by exchange of securities or other assets;
|
|
|
|
| |
(iii)
|
where no consideration is or will be given for the
transfer; or
|
|
|
|
| |
(iv)
|
where the transfer is by operation of law.
|
By accepting this prospectus, the recipient hereof represents
and warrants that he is entitled to receive it in accordance
with the restrictions set forth above and agrees to be bound by
limitations contained herein. Any failure to comply with these
limitations may constitute a violation of law.
LEGAL
MATTERS
The validity of the Class A common stock offered hereby
will be passed upon for us by Gibson, Dunn & Crutcher
LLP. Certain legal matters in connection with the Class A
common stock offered hereby will be passed upon for the
underwriters by Latham & Watkins LLP, Houston, Texas.
EXPERTS
Ernst & Young LLP, independent registered public
accounting firm, has audited the combined financial statements
and schedule at December 31, 2010 and 2009, and for each of
the three years in the period ended December 31, 2010, as
set forth in their report included in this prospectus. We have
included the combined financial statements and schedule in this
prospectus and elsewhere in the registration statement in
reliance on Ernst & Young LLP’s report, given on
their authority as experts in accounting and auditing.
Approximately 94 percent of our year-end 2010
U.S. proved reserves estimates included in this prospectus
were either audited by Netherland, Sewell &
Associates, Inc., or, in the case of reserves estimates related
to properties underlying the former Williams Coal Seam Gas
Royalty Trust, were audited by Miller and Lents, Ltd.
Approximately 94 percent of our year-end 2010 proved
reserves estimates for international properties were reviewed
and certified by Ralph E. Davis Associates, Inc.
WHERE YOU
CAN FIND MORE INFORMATION
We have filed with the SEC a registration statement on
Form S-1
under the Securities Act with respect to the common stock we
propose to sell in this offering. This prospectus, which
constitutes part of the registration statement, does not contain
all of the information set forth in the registration statement.
For further information about us and the common stock that we
propose to sell in this offering, we refer you to the
registration statement and the exhibits and schedules filed as a
part of the registration statement. Statements contained in this
prospectus as to the contents of any contract or other document
filed as an exhibit to the registration statement are not
necessarily complete. If a contract or document has been filed
as an exhibit to the registration statement, we refer you to the
copy of the contract or document that has been filed as an
exhibit to the registration statement. When we complete this
offering, we will also be required to file annual, quarterly and
special reports, proxy statements and other information with
the SEC.
You can read our SEC filings, including the registration
statement, over the Internet at the SEC’s website at
www.sec.gov. You may also read and copy any document we filed
with the SEC at its public reference facility at
100 F Street, N.E., Washington, D.C. 20549. You
may also obtain copies of the documents at prescribed rates by
writing to the Public Reference Section of the SEC at 100 F
Street, N.E., Washington, D.C. 20549. Please call the SEC
at
1-800-SEC-0330
for further information on the operation of the public reference
facilities.
166
INDEX TO
FINANCIAL STATEMENTS
| |
|
|
|
|
|
|
|
Page
|
|
|
|
Unaudited pro forma combined financial statements
|
|
|
|
|
|
|
|
|
F-2
|
|
|
|
|
|
F-3
|
|
|
|
|
|
F-4
|
|
|
|
|
|
F-5
|
|
|
Interim unaudited condensed combined financial statements
|
|
|
|
|
|
|
|
|
F-7
|
|
|
|
|
|
F-8
|
|
|
|
|
|
F-9
|
|
|
|
|
|
F-10
|
|
|
|
|
|
F-11
|
|
|
Annual audited combined financial statements
|
|
|
|
|
|
|
|
|
F-27
|
|
|
|
|
|
F-28
|
|
|
|
|
|
F-29
|
|
|
|
|
|
F-30
|
|
|
|
|
|
F-31
|
|
|
|
|
|
F-32
|
|
F-1
WPX
Energy
Unaudited
Pro Forma Combined Financial Statements
Introduction
The unaudited pro forma combined financial statements are based
upon the historical combined financial position and results of
operations of WPX Energy (the “Company”), a wholly
owned subsidiary of The Williams Companies, Inc.
(“Williams”). Prior to the completion of the offering,
Williams will contribute to the Company its investment in
certain subsidiaries related to its exploration and production
business. This contribution will be recorded at historical cost
as it is considered to be a reorganization of entities under
common control. Additionally, prior to contributing its
investment in these certain subsidiaries, Williams will
contribute to capital all notes payable to Williams owed by the
combined entities and; as a result, WPX will receive its
investment in these certain subsidiaries without debt to
Williams. The unaudited pro forma combined financial statements
for the Company have been derived from the historical combined
financial statements of WPX Energy set forth elsewhere in this
Prospectus and are qualified in their entirety by reference to
such historical combined financial statements and notes thereto.
The unaudited pro forma combined financial statements should be
read in conjunction with the notes accompanying such unaudited
pro forma combined financial statements, as well as in
conjunction with our historical combined financial statements
and related notes thereto, “Management’s Discussion
and Analysis of Financial Condition and Results of
Operations” and “Use of Proceeds,” each of which
is included elsewhere in this prospectus.
The unaudited pro forma combined financial statements as of
March 31, 2011 and for the three months ended
March 31, 2011 and year ended December 31, 2010 were
derived by adjusting the historical combined financial
statements of WPX Energy. The pro forma adjustments are based
upon currently available information and certain estimates and
assumptions; therefore, actual adjustments will differ from the
pro forma adjustments. However, management believes the
adjustments provide a reasonable basis for presenting the
significant effects of the transactions as contemplated and that
the pro forma adjustments give appropriate effect to those
assumptions and are properly applied in the pro forma combined
financial statements. Williams has advised us that, following
the completion of this offering, it intends to distribute all of
the shares of our common stock it owns through a tax-free
distribution, or spin-off, to Williams’ stockholders. The
determination of whether, and if so, when, to proceed with the
spin-off is entirely within the discretion of Williams, although
Williams has indicated its intention to complete the spin-off in
2012. Due to the uncertainty of the spin-off, the unaudited pro
forma combined financial statements do not include any
adjustments related to such a spin-off of Williams’
ownership in the Company.
The unaudited pro forma combined statement of operations may not
be indicative of the actual results that would have been
achieved had the transactions been consummated on the dates
indicated. Also, the unaudited pro forma combined financial
statements should not be viewed as indicative of our financial
condition or results of operations as of any future dates or for
any future period.
F-2
WPX
Energy
Unaudited
Pro Forma Combined Balance Sheet
March 31, 2011
| |
|
|
|
|
|
|
|
|
|
|
|
|
|
|
|
|
|
|
|
|
|
|
|
|
|
|
Pro Forma Adjustments
|
|
|
|
|
|
|
|
Combined
|
|
|
Restructuring
|
|
|
Concurrent Financing
|
|
|
Offering
|
|
|
Combined
|
|
|
|
|
Historical (a)
|
|
|
Transactions
|
|
|
Transactions
|
|
|
Transactions
|
|
|
Pro Forma
|
|
|
|
|
(millions)
|
|
|
|
|
Assets
|
|
|
|
|
|
|
|
|
|
|
|
|
|
|
|
|
|
|
|
|
|
Current assets:
|
|
|
|
|
|
|
|
|
|
|
|
|
|
|
|
|
|
|
|
|
|
Cash and cash equivalents
|
|
$
|
40
|
|
|
$
|
—
|
|
|
$
|
1,480
|
(c)
|
|
$
|
705
|
(g)
|
|
$
|
540
|
|
|
|
|
|
|
|
|
|
|
|
|
|
(7
|
)(d)
|
|
|
|
|
|
|
|
|
|
|
|
|
|
|
|
|
|
|
|
|
(1,678
|
)(e)
|
|
|
|
|
|
|
|
|
|
Accounts receivable:
|
|
|
|
|
|
|
|
|
|
|
|
|
|
|
|
|
|
|
|
|
|
Trade, net of allowance for doubtful accounts
|
|
|
356
|
|
|
|
—
|
|
|
|
—
|
|
|
|
—
|
|
|
|
356
|
|
|
Affiliate
|
|
|
43
|
|
|
|
—
|
|
|
|
—
|
|
|
|
—
|
|
|
|
43
|
|
|
Derivative assets
|
|
|
306
|
|
|
|
—
|
|
|
|
—
|
|
|
|
—
|
|
|
|
306
|
|
|
Inventories
|
|
|
43
|
|
|
|
—
|
|
|
|
—
|
|
|
|
—
|
|
|
|
43
|
|
|
Other
|
|
|
56
|
|
|
|
—
|
|
|
|
—
|
|
|
|
—
|
|
|
|
56
|
|
|
|
|
|
|
|
|
|
|
|
|
|
|
|
|
|
|
|
|
|
|
|
|
|
|
|
|
|
|
|
|
|
|
|
|
|
|
|
|
|
|
|
|
|
|
Total current assets
|
|
|
844
|
|
|
|
—
|
|
|
|
(205
|
)
|
|
|
705
|
|
|
|
1,344
|
|
|
Investments
|
|
|
109
|
|
|
|
—
|
|
|
|
—
|
|
|
|
—
|
|
|
|
109
|
|
|
Properties and equipment, net
|
|
|
8,503
|
|
|
|
—
|
|
|
|
—
|
|
|
|
—
|
|
|
|
8,503
|
|
|
Derivative assets
|
|
|
167
|
|
|
|
—
|
|
|
|
—
|
|
|
|
—
|
|
|
|
167
|
|
|
Other noncurrent assets
|
|
|
141
|
|
|
|
—
|
|
|
|
20
|
(c)
|
|
|
—
|
|
|
|
168
|
|
|
|
|
|
|
|
|
|
|
|
|
|
7
|
(d)
|
|
|
|
|
|
|
|
|
|
|
|
|
|
|
|
|
|
|
|
|
|
|
|
|
|
|
|
|
|
|
|
|
|
|
|
|
|
|
|
|
|
|
|
|
|
|
|
|
|
|
|
|
|
Total assets
|
|
$
|
9,764
|
|
|
$
|
—
|
|
|
$
|
(178
|
)
|
|
$
|
705
|
|
|
$
|
10,291
|
|
|
|
|
|
|
|
|
|
|
|
|
|
|
|
|
|
|
|
|
|
|
|
|
|
|
|
|
|
|
|
|
|
|
|
|
|
|
|
|
|
|
|
|
|
|
Liabilities and Equity
|
|
|
|
|
|
|
|
|
|
|
|
|
|
|
|
|
|
|
|
|
|
Current liabilities:
|
|
|
|
|
|
|
|
|
|
|
|
|
|
|
|
|
|
|
|
|
|
Accounts payable:
|
|
|
|
|
|
|
|
|
|
|
|
|
|
|
|
|
|
|
|
|
|
Trade
|
|
$
|
387
|
|
|
$
|
—
|
|
|
$
|
—
|
|
|
$
|
—
|
|
|
$
|
387
|
|
|
Affiliates
|
|
|
51
|
|
|
|
—
|
|
|
|
—
|
|
|
|
—
|
|
|
|
51
|
|
|
Accrued and other current liabilities
|
|
|
156
|
|
|
|
—
|
|
|
|
—
|
|
|
|
—
|
|
|
|
156
|
|
|
Deferred income taxes
|
|
|
58
|
|
|
|
—
|
|
|
|
—
|
|
|
|
—
|
|
|
|
58
|
|
|
Notes payable to Williams
|
|
|
2,364
|
|
|
|
(2,364
|
)(a)
|
|
|
—
|
|
|
|
—
|
|
|
|
—
|
|
|
Derivative liabilities
|
|
|
143
|
|
|
|
—
|
|
|
|
—
|
|
|
|
—
|
|
|
|
143
|
|
|
|
|
|
|
|
|
|
|
|
|
|
|
|
|
|
|
|
|
|
|
|
|
Total current liabilities
|
|
|
3,159
|
|
|
|
(2,364
|
)
|
|
|
—
|
|
|
|
—
|
|
|
|
795
|
|
|
Deferred income taxes
|
|
|
1,612
|
|
|
|
—
|
|
|
|
—
|
|
|
|
—
|
|
|
|
1,612
|
|
|
Long-term debt
|
|
|
—
|
|
|
|
—
|
|
|
|
1,500
|
(c)
|
|
|
—
|
|
|
|
1,500
|
|
|
Derivative liabilities
|
|
|
158
|
|
|
|
—
|
|
|
|
—
|
|
|
|
—
|
|
|
|
158
|
|
|
Asset retirement obligations
|
|
|
290
|
|
|
|
—
|
|
|
|
—
|
|
|
|
—
|
|
|
|
290
|
|
|
Other noncurrent liabilities
|
|
|
105
|
|
|
|
46
|
(a)
|
|
|
—
|
|
|
|
—
|
|
|
|
151
|
|
|
Equity:
|
|
|
|
|
|
|
|
|
|
|
|
|
|
|
|
|
|
|
|
|
|
Owner’s net investment
|
|
|
4,258
|
|
|
|
2,364
|
(a)
(46)(a)
|
|
|
(1,678
|
)(e)
|
|
|
—
|
|
|
|
—
|
|
|
|
|
|
|
|
|
|
(4,898
|
)(b)
|
|
|
|
|
|
|
|
|
|
|
|
|
|
Accumulated other comprehensive income
|
|
|
108
|
|
|
|
—
|
|
|
|
—
|
|
|
|
—
|
|
|
|
108
|
|
|
Class A common stock
|
|
|
—
|
|
|
|
—
|
|
|
|
—
|
|
|
|
705
|
(g)
|
|
|
705
|
|
|
Class B common stock
|
|
|
—
|
|
|
|
4,898
|
(b)
|
|
|
—
|
|
|
|
—
|
|
|
|
4,898
|
|
|
Noncontrolling interests
|
|
|
74
|
|
|
|
—
|
|
|
|
—
|
|
|
|
—
|
|
|
|
74
|
|
|
|
|
|
|
|
|
|
|
|
|
|
|
|
|
|
|
|
|
|
|
|
|
Total equity
|
|
|
4,440
|
|
|
|
2,318
|
|
|
|
(1,678
|
)
|
|
|
705
|
|
|
|
5,785
|
|
|
|
|
|
|
|
|
|
|
|
|
|
|
|
|
|
|
|
|
|
|
|
|
Total liabilities and equity
|
|
$
|
9,764
|
|
|
$
|
—
|
|
|
$
|
(178
|
)
|
|
$
|
705
|
|
|
$
|
10,291
|
|
|
|
|
|
|
|
|
|
|
|
|
|
|
|
|
|
|
|
|
|
|
|
See accompanying notes to pro forma financial statements
F-3
WPX
Energy
| |
|
|
|
|
|
|
|
|
|
|
|
|
|
|
|
|
|
|
|
|
|
|
|
|
|
|
|
Three Months Ended March 31, 2011
|
|
|
Year Ended December 31, 2010
|
|
|
|
|
Combined
|
|
|
Pro Forma
|
|
|
Combined
|
|
|
Combined
|
|
|
Pro Forma
|
|
|
Combined
|
|
|
|
|
Historical
|
|
|
Adjustments
|
|
|
Pro Forma
|
|
|
Historical
|
|
|
Adjustments
|
|
|
Pro Forma
|
|
|
|
|
(Millions - except per share amounts)
|
|
|
|
|
Revenues
|
|
$
|
984
|
|
|
$
|
|
|
|
$
|
984
|
|
|
$
|
4,034
|
|
|
$
|
|
|
|
$
|
4,034
|
|
|
Costs and expenses:
|
|
|
|
|
|
|
|
|
|
|
|
|
|
|
|
|
|
|
|
|
|
|
|
|
|
Lease and facility operating expense, including affiliate
|
|
|
70
|
|
|
|
|
|
|
|
70
|
|
|
|
286
|
|
|
|
|
|
|
|
286
|
|
|
Gathering, processing and transportation, including affiliate
|
|
|
115
|
|
|
|
|
|
|
|
115
|
|
|
|
326
|
|
|
|
|
|
|
|
326
|
|
|
Taxes other than income
|
|
|
31
|
|
|
|
|
|
|
|
31
|
|
|
|
125
|
|
|
|
|
|
|
|
125
|
|
|
Gas management (including charges for unutilized pipeline
capacity)
|
|
|
417
|
|
|
|
|
|
|
|
417
|
|
|
|
1,771
|
|
|
|
|
|
|
|
1,771
|
|
|
Exploration
|
|
|
13
|
|
|
|
|
|
|
|
13
|
|
|
|
73
|
|
|
|
|
|
|
|
73
|
|
|
Depreciation, depletion and amortization
|
|
|
216
|
|
|
|
|
|
|
|
216
|
|
|
|
875
|
|
|
|
|
|
|
|
875
|
|
|
Impairment of producing properties and costs of acquired
unproved reserves
|
|
|
—
|
|
|
|
|
|
|
|
—
|
|
|
|
678
|
|
|
|
|
|
|
|
678
|
|
|
Goodwill impairment
|
|
|
—
|
|
|
|
|
|
|
|
—
|
|
|
|
1,003
|
|
|
|
|
|
|
|
1,003
|
|
|
General and administrative, including affiliate
|
|
|
70
|
|
|
|
|
|
|
|
70
|
|
|
|
253
|
|
|
|
|
|
|
|
253
|
|
|
Other — net
|
|
|
3
|
|
|
|
|
|
|
|
3
|
|
|
|
(19
|
)
|
|
|
|
|
|
|
(19
|
)
|
|
|
|
|
|
|
|
|
|
|
|
|
|
|
|
|
|
|
|
|
|
|
|
|
|
|
|
Total costs and expenses
|
|
|
935
|
|
|
|
—
|
|
|
|
935
|
|
|
|
5,371
|
|
|
|
—
|
|
|
|
5,371
|
|
|
|
|
|
|
|
|
|
|
|
|
|
|
|
|
|
|
|
|
|
|
|
|
|
|
|
|
Operating income (loss)
|
|
|
49
|
|
|
|
|
|
|
|
49
|
|
|
|
(1,337
|
)
|
|
|
|
|
|
|
(1,337
|
)
|
|
Interest expense, including affiliate
|
|
|
(49
|
)
|
|
|
46
|
(a)
|
|
|
(27
|
)
|
|
|
(124
|
)
|
|
|
119
|
(a)
|
|
|
(103
|
)
|
|
|
|
|
|
|
|
|
(24
|
)(f)
|
|
|
|
|
|
|
|
|
|
|
(98
|
)(f)
|
|
|
|
|
|
Interest capitalized
|
|
|
4
|
|
|
|
|
|
|
|
4
|
|
|
|
16
|
|
|
|
|
|
|
|
16
|
|
|
Investment income and other
|
|
|
6
|
|
|
|
|
|
|
|
6
|
|
|
|
21
|
|
|
|
|
|
|
|
21
|
|
|
|
|
|
|
|
|
|
|
|
|
|
|
|
|
|
|
|
|
|
|
|
|
|
|
|
|
Income (loss) before income taxes
|
|
|
10
|
|
|
|
22
|
|
|
|
32
|
|
|
|
(1,424
|
)
|
|
|
21
|
|
|
|
(1,403
|
)
|
|
Provision (benefit) for income taxes
|
|
|
3
|
|
|
|
8
|
(h)
|
|
|
11
|
|
|
|
(150
|
)
|
|
|
8
|
(h)
|
|
|
(142
|
)
|
|
|
|
|
|
|
|
|
|
|
|
|
|
|
|
|
|
|
|
|
|
|
|
|
|
|
|
Income (loss) from continuing operations
|
|
|
7
|
|
|
|
14
|
|
|
|
21
|
|
|
|
(1,274
|
)
|
|
|
13
|
|
|
|
(1,261
|
)
|
|
Loss from discontinued operations
|
|
|
(8
|
)
|
|
|
|
|
|
|
(8
|
)
|
|
|
(8
|
)
|
|
|
|
|
|
|
(8
|
)
|
|
|
|
|
|
|
|
|
|
|
|
|
|
|
|
|
|
|
|
|
|
|
|
|
|
|
|
Net income (loss)
|
|
$
|
(1
|
)
|
|
$
|
14
|
|
|
$
|
13
|
|
|
$
|
(1,282
|
)
|
|
$
|
13
|
|
|
$
|
(1,269
|
)
|
|
|
|
|
|
|
|
|
|
|
|
|
|
|
|
|
|
|
|
|
|
|
|
|
|
|
|
Pro forma income (loss) from continuing operations per share
(Note 3):
|
|
|
|
|
|
|
|
|
|
|
|
|
|
|
|
|
|
|
|
|
|
|
|
|
|
Basic
|
|
$
|
|
|
|
|
|
|
|
$
|
|
|
|
|
|
|
|
|
|
|
|
$
|
|
|
|
|
|
|
|
|
|
|
|
|
|
|
|
|
|
|
|
|
|
|
|
|
|
|
|
|
|
Diluted
|
|
$
|
|
|
|
|
|
|
|
$
|
|
|
|
|
|
|
|
|
|
|
|
$
|
|
|
|
|
|
|
|
|
|
|
|
|
|
|
|
|
|
|
|
|
|
|
|
|
|
|
|
|
|
Weighted average shares outstanding:
|
|
|
|
|
|
|
|
|
|
|
|
|
|
|
|
|
|
|
|
|
|
|
|
|
|
Basic
|
|
|
|
|
|
|
|
(g)
|
|
|
|
|
|
|
|
|
|
|
|
(g)
|
|
|
|
|
|
|
|
|
|
|
|
|
|
|
|
|
|
|
|
|
|
|
|
|
|
|
|
|
|
|
|
Diluted
|
|
|
|
|
|
|
|
(g)
|
|
|
|
|
|
|
|
|
|
|
|
(g)
|
|
|
|
|
|
|
|
|
|
|
|
|
|
|
|
|
|
|
|
|
|
|
|
|
|
|
|
|
|
|
See accompanying notes to pro forma financial statements
F-4
WPX
Energy
(Unaudited)
|
|
|
Note 1.
|
Basis of
Presentation
|
The historical financial information is derived from the
historical combined financial statements of WPX Energy set forth
elsewhere in this Prospectus and is qualified in its entirety by
reference to such historical combined financial statements and
notes thereto. The pro forma adjustments have been prepared as
if the transactions to be effected prior to or at the completion
of this offering had taken place on March 31, 2011, in the
case of the unaudited pro forma combined balance sheet or as of
January 1, 2010, in the case of the unaudited pro forma
combined statement of operations for the year ended
December 31, 2010, and the three months ended
March 31, 2011.
Upon completion of this offering, we anticipate incurring
incremental general and administrative expense as a result of
being a public company. No pro forma adjustment has been made
for these additional expenses, as an estimate of these expenses
is not objectively determinable. Additionally, we currently
depend on Williams for a number of administrative functions.
Prior to the completion of this offering, we will enter into an
administrative services agreement under which Williams will
provide to us, on an interim basis, various corporate support
services. These services will consist generally of the services
that have been provided to us on an intercompany basis prior to
this offering and we will pay Williams’ costs, including
Williams’ direct and indirect administrative and overhead
charges allocated in accordance with Williams’ regular and
consistent accounting practices. For more information regarding
this agreement, see “Arrangements Between Williams and Our
Company.”
Upon completion of this offering, we will enter into a tax
sharing agreement with Williams. The tax sharing agreement will
govern the respective rights, responsibilities and obligations
of Williams and us with respect to various matters regarding
taxes. The Company’s domestic operations are included in
the consolidated federal and state income tax returns for
Williams, except for certain separate state filings. The income
tax provision presented in the Company’s historical
combined financial statements has been calculated on a separate
return basis, except for certain state and federal tax
attributes (primarily minimum tax credit carry-forwards) for
which the actual allocation (if any) cannot be determined until
the consolidated tax returns are complete for the year in which
an income tax deconsolidation event occurs. For more information
regarding this agreement and the presentation of income taxes in
the historical financial statements, see “Arrangements
Between Williams and Our Company” and Note 10 of Notes
to Combined Financial Statements.
|
|
|
Note 2.
|
Pro Forma
Adjustments
|
Restructuring
Transactions
(a) In accordance with our separation and distribution
agreement with Williams, prior to the completion of this
offering, Williams will contribute its investment in certain
subsidiaries related to its exploration and production business
to us. This contribution will be recorded at historical cost as
it is considered to be a reorganization of entities under common
control. Additionally, prior to contributing its investment in
these certain subsidiaries, Williams will contribute to our
capital all notes payable to Williams owed by the combined
entities and, as a result, we will receive our investment in
these certain subsidiaries without any debt to Williams. This
adjustment also includes the effect of certain indemnifications
included in the separation and distribution agreement.
Additionally, the unaudited pro forma combined statement of
operations reflects the elimination of affiliate interest
expense associated with the notes payable to Williams.
(b) Reflects the conversion of the outstanding shares of
our common stock, all of which are owned by Williams,
into shares
of Class B common stock in exchange for all of the assets
(net of the liabilities assumed and the cash we distribute to
Williams) contributed to us by Williams.
F-5
WPX
Energy
Notes to
Pro Forma Combined Financial
Statements — (Continued)
Concurrent
Financing Transactions
(c) Reflects the receipt of approximately $1.5 billion
from our expected offering of the senior unsecured notes, after
deducting the discounts of the initial purchasers of these notes
and other issuance costs totaling $20 million. These costs
will be amortized to interest expense over the respective terms
of the notes.
(d) Reflects the payment of $7 million of estimated
fees to establish a new $1.5 billion senior unsecured
revolving credit facility (of which none is assumed to be
outstanding in the unaudited pro forma combined financial
statements). These costs will be amortized to interest expense
over the five-year term of the facility.
(e) Reflects the distribution of approximately
$1.7 billion to Williams from the combined net proceeds
from this offering in excess of $500 million, or
approximately $205 million and approximately
$1.5 billion from the expected offering of the notes
discussed in adjustment (c) less the estimated fees associated
with the new $1.5 billion senior unsecured revolving credit
facility.
(f) Reflects total interest expense for our
$1.5 billion expected offering of the notes discussed in
adjustment (c) at an assumed average interest rate
of % and our new $1.5 billion
senior unsecured revolving credit facility. The amount is
comprised of:
|
|
|
| |
•
|
interest expense on the notes;
|
|
|
|
| |
•
|
amortized debt issuance costs related to our debt; and
|
|
|
|
| |
•
|
commitment fees and amortized costs related to our new credit
facility.
|
No borrowings under the revolving credit facility are assumed
for any period presented. Actual interest expense we incur in
future periods may be higher or lower depending on the final
terms of the senior unsecured notes and our actual utilization
of the revolving credit facility. An increase in the average
interest rate applicable to the senior unsecured notes of
one-eighth of one percent (0.125%) would result in additional
interest expense of approximately
$ million and
$ million for the year ended
December 31, 2010 and the three months ended March 31,
2011, respectively.
Offering
Transactions
(g) Reflects the receipt of approximately $705 million
from the sale
of shares
of Class A common stock offered by us at an assumed initial
public offering price of $ per
share, net of $45 million of estimated underwriter
discounts and commissions and offering expenses.
Other
Adjustments
(h) Reflects the adjustment of the provision (benefit) for
income taxes for the adjustments made to income (loss) before
income taxes at an estimated statutory rate of approximately 36%.
|
|
|
Note 3.
|
Earnings
per Share
|
Pro forma basic and diluted income (loss) from continuing
operations per share was calculated by dividing the pro forma
income (loss) from continuing operations by the assumed issuance
of
Class A common shares
and
Class B common shares, each as previously discussed. All
shares were assumed to have been outstanding since
January 1, 2010. Basic and diluted pro forma income (loss)
from continuing operations per share are equivalent as there are
no dilutive shares or potentially dilutive items at the closing
of the initial public offering. Holders of Class A common
stock and Class B common stock will share equally on a per
share basis in any dividend declared and are entitled to receive
the same amount per share with respect to any distribution of
assets to holders of shares of common stock upon liquidation,
dissolution or winding up of WPX.
F-6
WPX
Energy
(Note 1)
Condensed Combined Statement of Operations
(Unaudited)
| |
|
|
|
|
|
|
|
|
|
|
|
Three Months Ended March 31,
|
|
|
|
|
2011
|
|
|
2010
|
|
|
|
|
(Dollars in millions)
|
|
|
|
|
Revenues:
|
|
|
|
|
|
|
|
|
|
Oil and gas sales, including affiliate
|
|
$
|
572
|
|
|
$
|
587
|
|
|
Gas management, including affiliate
|
|
|
408
|
|
|
|
556
|
|
|
Hedge ineffectiveness and mark to market gains and losses
|
|
|
2
|
|
|
|
9
|
|
|
Other
|
|
|
2
|
|
|
|
12
|
|
|
|
|
|
|
|
|
|
|
|
|
Total revenues
|
|
|
984
|
|
|
|
1,164
|
|
|
Costs and expenses:
|
|
|
|
|
|
|
|
|
|
Lease and facility operating, including affiliate
|
|
|
70
|
|
|
|
66
|
|
|
Gathering, processing and transportation, including affiliate
|
|
|
115
|
|
|
|
72
|
|
|
Taxes other than income
|
|
|
31
|
|
|
|
40
|
|
|
Gas management (including charges for unutilized pipeline
capacity)
|
|
|
417
|
|
|
|
558
|
|
|
Exploration
|
|
|
13
|
|
|
|
8
|
|
|
Depreciation, depletion and amortization
|
|
|
216
|
|
|
|
216
|
|
|
General and administrative, including affiliate
|
|
|
70
|
|
|
|
61
|
|
|
Other — net
|
|
|
3
|
|
|
|
—
|
|
|
|
|
|
|
|
|
|
|
|
|
Total costs and expenses
|
|
|
935
|
|
|
|
1,021
|
|
|
|
|
|
|
|
|
|
|
|
|
Operating income
|
|
|
49
|
|
|
|
143
|
|
|
Interest expense, including affiliate
|
|
|
(49
|
)
|
|
|
(25
|
)
|
|
Interest capitalized
|
|
|
4
|
|
|
|
4
|
|
|
Investment income and other
|
|
|
6
|
|
|
|
5
|
|
|
|
|
|
|
|
|
|
|
|
|
Income before income taxes
|
|
|
10
|
|
|
|
127
|
|
|
Provision for income taxes
|
|
|
3
|
|
|
|
44
|
|
|
|
|
|
|
|
|
|
|
|
|
Income from continuing operations
|
|
|
7
|
|
|
|
83
|
|
|
Loss from discontinued operations
|
|
|
(8
|
)
|
|
|
—
|
|
|
|
|
|
|
|
|
|
|
|
|
Net income (loss)
|
|
|
(1
|
)
|
|
|
83
|
|
|
Less: Net income attributable to noncontrolling interests
|
|
|
2
|
|
|
|
2
|
|
|
|
|
|
|
|
|
|
|
|
|
Net income (loss) attributable to WPX Energy
|
|
$
|
(3
|
)
|
|
$
|
81
|
|
|
|
|
|
|
|
|
|
|
|
|
Supplemental pro forma combined basic loss per common share
(Note 2)
|
|
$
|
|
|
|
|
|
|
|
|
|
|
|
|
|
|
|
|
|
Supplemental pro forma combined diluted loss per common share
(Note 2)
|
|
$
|
|
|
|
|
|
|
|
|
|
|
|
|
|
|
|
|
See accompanying notes.
F-7
WPX
Energy
(Note 1)
Condensed Combined Balance Sheet
(Unaudited)
| |
|
|
|
|
|
|
|
|
|
|
|
|
|
|
|
Supplemental
|
|
|
|
|
|
|
|
|
|
|
Pro Forma
|
|
|
|
|
|
|
|
|
|
|
March 31,
|
|
|
March 31,
|
|
|
December 31,
|
|
|
|
|
2011 (Note 2)
|
|
|
2011
|
|
|
2010
|
|
|
|
|
(Dollars in millions)
|
|
|
|
|
Assets
|
|
|
|
|
|
|
|
|
|
|
|
|
|
Current assets:
|
|
|
|
|
|
|
|
|
|
|
|
|
|
Cash and cash equivalents
|
|
$
|
40
|
|
|
$
|
40
|
|
|
$
|
37
|
|
|
Accounts receivable:
|
|
|
|
|
|
|
|
|
|
|
|
|
|
Trade, net of allowance for doubtful accounts of $19 at
March 31, 2011 and $16 at December 31, 2010
|
|
|
356
|
|
|
|
356
|
|
|
|
362
|
|
|
Affiliate
|
|
|
43
|
|
|
|
43
|
|
|
|
60
|
|
|
Derivative assets
|
|
|
306
|
|
|
|
306
|
|
|
|
400
|
|
|
Inventories
|
|
|
43
|
|
|
|
43
|
|
|
|
77
|
|
|
Other
|
|
|
56
|
|
|
|
56
|
|
|
|
22
|
|
|
|
|
|
|
|
|
|
|
|
|
|
|
|
|
Total current assets
|
|
|
844
|
|
|
|
844
|
|
|
|
958
|
|
|
Investments
|
|
|
109
|
|
|
|
109
|
|
|
|
105
|
|
|
Properties and equipment (successful efforts method of
accounting)
|
|
|
12,789
|
|
|
|
12,789
|
|
|
|
12,564
|
|
|
Less — accumulated depreciation, depletion and
amortization
|
|
|
(4,286
|
)
|
|
|
(4,286
|
)
|
|
|
(4,115
|
)
|
|
|
|
|
|
|
|
|
|
|
|
|
|
|
|
Properties and equipment, net
|
|
|
8,503
|
|
|
|
8,503
|
|
|
|
8,449
|
|
|
Derivative assets
|
|
|
167
|
|
|
|
167
|
|
|
|
173
|
|
|
Other noncurrent assets
|
|
|
141
|
|
|
|
141
|
|
|
|
161
|
|
|
|
|
|
|
|
|
|
|
|
|
|
|
|
|
Total assets
|
|
$
|
9,764
|
|
|
$
|
9,764
|
|
|
$
|
9,846
|
|
|
|
|
|
|
|
|
|
|
|
|
|
|
|
|
Liabilities and Equity
|
|
|
|
|
|
|
|
|
|
|
|
|
|
Current liabilities:
|
|
|
|
|
|
|
|
|
|
|
|
|
|
Accounts payable:
|
|
|
|
|
|
|
|
|
|
|
|
|
|
Trade
|
|
$
|
387
|
|
|
$
|
387
|
|
|
$
|
451
|
|
|
Affiliates
|
|
|
51
|
|
|
|
51
|
|
|
|
64
|
|
|
Accrued and other current liabilities
|
|
|
156
|
|
|
|
156
|
|
|
|
158
|
|
|
Deferred income taxes
|
|
|
58
|
|
|
|
58
|
|
|
|
87
|
|
|
Notes payable to Williams
|
|
|
2,364
|
|
|
|
2,364
|
|
|
|
2,261
|
|
|
Accrued distribution to Williams
|
|
|
1,678
|
|
|
|
—
|
|
|
|
—
|
|
|
Derivative liabilities
|
|
|
143
|
|
|
|
143
|
|
|
|
146
|
|
|
|
|
|
|
|
|
|
|
|
|
|
|
|
|
Total current liabilities
|
|
|
4,837
|
|
|
|
3,159
|
|
|
|
3,167
|
|
|
Deferred income taxes
|
|
|
1,612
|
|
|
|
1,612
|
|
|
|
1,629
|
|
|
Derivative liabilities
|
|
|
158
|
|
|
|
158
|
|
|
|
143
|
|
|
Asset retirement obligations
|
|
|
290
|
|
|
|
290
|
|
|
|
282
|
|
|
Other noncurrent liabilities
|
|
|
105
|
|
|
|
105
|
|
|
|
125
|
|
|
Contingent liabilities and commitments (Note 8)
|
|
|
|
|
|
|
|
|
|
|
|
|
|
Equity:
|
|
|
|
|
|
|
|
|
|
|
|
|
|
Owner’s net equity:
|
|
|
|
|
|
|
|
|
|
|
|
|
|
Owner’s net investment
|
|
|
4,258
|
|
|
|
4,258
|
|
|
|
4,260
|
|
|
Accrued distribution to Williams
|
|
|
(1,678
|
)
|
|
|
—
|
|
|
|
—
|
|
|
Accumulated other comprehensive income
|
|
|
108
|
|
|
|
108
|
|
|
|
168
|
|
|
|
|
|
|
|
|
|
|
|
|
|
|
|
|
Total owner’s net equity
|
|
|
2,688
|
|
|
|
4,366
|
|
|
|
4,428
|
|
|
Noncontrolling interests in combined subsidiaries
|
|
|
74
|
|
|
|
74
|
|
|
|
72
|
|
|
|
|
|
|
|
|
|
|
|
|
|
|
|
|
Total equity
|
|
|
2,762
|
|
|
|
4,440
|
|
|
|
4,500
|
|
|
|
|
|
|
|
|
|
|
|
|
|
|
|
|
Total liabilities and equity
|
|
$
|
9,764
|
|
|
$
|
9,764
|
|
|
$
|
9,846
|
|
|
|
|
|
|
|
|
|
|
|
|
|
|
|
See accompanying notes.
F-8
WPX
Energy
(Note 1)
Condensed
Combined Statement of Equity
(Unaudited)
| |
|
|
|
|
|
|
|
|
|
|
|
|
|
|
|
|
|
|
|
|
|
|
|
|
|
|
|
Three Months Ended March 31,
|
|
|
|
|
2011
|
|
|
2010
|
|
|
|
|
Owner’s Net
|
|
|
Noncontrolling
|
|
|
|
|
|
Owner’s Net
|
|
|
Noncontrolling
|
|
|
|
|
|
|
|
Equity
|
|
|
Interests*
|
|
|
Total
|
|
|
Equity
|
|
|
Interests*
|
|
|
Total
|
|
|
|
|
(Millions)
|
|
|
|
|
Beginning balance
|
|
$
|
4,428
|
|
|
$
|
72
|
|
|
$
|
4,500
|
|
|
$
|
5,341
|
|
|
$
|
64
|
|
|
$
|
5,405
|
|
|
Comprehensive income (loss):
|
|
|
|
|
|
|
|
|
|
|
|
|
|
|
|
|
|
|
|
|
|
|
|
|
|
Net income (loss)
|
|
|
(3
|
)
|
|
|
2
|
|
|
|
(1
|
)
|
|
|
81
|
|
|
|
2
|
|
|
|
83
|
|
|
Other comprehensive income (loss), net of tax:
|
|
|
|
|
|
|
|
|
|
|
|
|
|
|
|
|
|
|
|
|
|
|
|
|
|
Net change in cash flow hedges
|
|
|
(60
|
)
|
|
|
—
|
|
|
|
(60
|
)
|
|
|
163
|
|
|
|
—
|
|
|
|
163
|
|
|
|
|
|
|
|
|
|
|
|
|
|
|
|
|
|
|
|
|
|
|
|
|
|
|
|
|
Total comprehensive income (loss)
|
|
|
(63
|
)
|
|
|
2
|
|
|
|
(61
|
)
|
|
|
244
|
|
|
|
2
|
|
|
|
246
|
|
|
Net transfers with Williams
|
|
|
1
|
|
|
|
—
|
|
|
|
1
|
|
|
|
1
|
|
|
|
—
|
|
|
|
1
|
|
|
|
|
|
|
|
|
|
|
|
|
|
|
|
|
|
|
|
|
|
|
|
|
|
|
|
|
Ending balance
|
|
$
|
4,366
|
|
|
$
|
74
|
|
|
$
|
4,440
|
|
|
$
|
5,586
|
|
|
$
|
66
|
|
|
$
|
5,652
|
|
|
|
|
|
|
|
|
|
|
|
|
|
|
|
|
|
|
|
|
|
|
|
|
|
|
|
|
|
|
|
* |
|
Represents the 31 percent interest in Apco Oil and Gas
International Inc. owned by others. |
See accompanying notes.
F-9
WPX
Energy
(Note 1)
Condensed
Combined Statement of Cash Flows
(Unaudited)
| |
|
|
|
|
|
|
|
|
|
|
|
Three Months Ended March 31,
|
|
|
|
|
2011
|
|
|
2010
|
|
|
|
|
(Dollars in millions)
|
|
|
|
|
Operating Activities:
|
|
|
|
|
|
|
|
|
|
Net income (loss)
|
|
$
|
(1
|
)
|
|
$
|
83
|
|
|
Adjustments to reconcile net income (loss) to net cash provided
by operating activities:
|
|
|
|
|
|
|
|
|
|
Depreciation, depletion, and amortization
|
|
|
218
|
|
|
|
218
|
|
|
Deferred income taxes provision (benefit)
|
|
|
(11
|
)
|
|
|
29
|
|
|
Provision for impairment of properties and equipment (including
certain exploration expenses)
|
|
|
24
|
|
|
|
4
|
|
|
Cash provided (used) by operating assets and liabilities:
|
|
|
|
|
|
|
|
|
|
Accounts receivable and payable — affiliate
|
|
|
4
|
|
|
|
6
|
|
|
Accounts receivable — trade
|
|
|
2
|
|
|
|
34
|
|
|
Inventories
|
|
|
33
|
|
|
|
11
|
|
|
Margin deposits and customer margin deposits payable
|
|
|
(19
|
)
|
|
|
11
|
|
|
Other current assets
|
|
|
—
|
|
|
|
1
|
|
|
Accounts payable — trade
|
|
|
(18
|
)
|
|
|
(30
|
)
|
|
Accrued and other current liabilities
|
|
|
13
|
|
|
|
(19
|
)
|
|
Changes in current and noncurrent derivative assets and
liabilities
|
|
|
17
|
|
|
|
(15
|
)
|
|
Other, including changes in noncurrent assets and liabilities
|
|
|
(22
|
)
|
|
|
(4
|
)
|
|
|
|
|
|
|
|
|
|
|
|
Net cash provided by operating activities
|
|
|
240
|
|
|
|
329
|
|
|
|
|
|
|
|
|
|
|
|
|
Investing Activities:
|
|
|
|
|
|
|
|
|
|
Capital expenditures*
|
|
|
(319
|
)
|
|
|
(284
|
)
|
|
Purchases of investments
|
|
|
(4
|
)
|
|
|
(2
|
)
|
|
Other — net
|
|
|
(19
|
)
|
|
|
—
|
|
|
|
|
|
|
|
|
|
|
|
|
Net cash used by investing activities
|
|
|
(342
|
)
|
|
|
(286
|
)
|
|
|
|
|
|
|
|
|
|
|
|
Financing Activities:
|
|
|
|
|
|
|
|
|
|
Net changes in notes payable to parent
|
|
|
103
|
|
|
|
(40
|
)
|
|
Net changes in owner’s investment
|
|
|
2
|
|
|
|
1
|
|
|
|
|
|
|
|
|
|
|
|
|
Net cash provided (used) by financing activities
|
|
|
105
|
|
|
|
(39
|
)
|
|
|
|
|
|
|
|
|
|
|
|
Increase in cash and cash equivalents
|
|
|
3
|
|
|
|
4
|
|
|
Cash and cash equivalents at beginning of period
|
|
|
37
|
|
|
|
34
|
|
|
|
|
|
|
|
|
|
|
|
|
Cash and cash equivalents at end of period
|
|
$
|
40
|
|
|
$
|
38
|
|
|
|
|
|
|
|
|
|
|
|
|
|
|
|
|
|
|
|
|
|
|
* Increases to property, plant, and equipment
|
|
$
|
(271
|
)
|
|
$
|
(271
|
)
|
|
Changes in related accounts payable and accrued liabilities
|
|
|
(48
|
)
|
|
|
(13
|
)
|
|
|
|
|
|
|
|
|
|
|
|
Capital expenditures
|
|
$
|
(319
|
)
|
|
$
|
(284
|
)
|
|
|
|
|
|
|
|
|
|
|
See accompanying notes.
F-10
WPX
Energy
Notes to
Condensed Combined Financial Statements
(Unaudited)
The combined businesses represented herein as WPX Energy (also
referred to as the “Company”) comprise substantially
all of the exploration and production operating segment of The
Williams Companies, Inc. (“Williams”). In these notes,
WPX Energy is referred to in the first person as “we”,
“us” or “our”.
On February 16, 2011, Williams announced that its Board of
Directors approved pursuing a plan to separate Williams’
businesses into two stand-alone, publicly traded companies. The
plan first calls for Williams to separate its exploration and
production business via an initial public offering (the
“Offering”) of up to 20 percent of its interest.
As a result, WPX Energy, Inc. was formed in April 2011 to effect
the separation. Prior to the close of the Offering, Williams
will contribute and transfer to the Company its investment in
certain subsidiaries related to its exploration and production
business, including its wholly-owned subsidiaries Williams
Production Holdings, LLC, Williams Production Company, LLC and
its 69 percent ownership interest in Apco Oil and Gas
International (“Apco”, NASDAQ listed: APAGF), as well
as all on-going operations of Williams Gas Marketing Services,
Inc. (collectively referred to as the “Contribution”).
WPX Energy includes natural gas development, production and gas
management activities located in the Rocky Mountain (primarily
Colorado, New Mexico, and Wyoming), Mid-Continent (Texas), and
Appalachian regions of the United States. We specialize in
natural gas production from tight-sands and shale formations and
coal bed methane reserves in the Piceance, San Juan, Powder
River, Green River, Fort Worth, and Appalachian Basins.
During 2010, we acquired a company with a significant acreage
position in the Williston Basin (Bakken Shale) in North Dakota,
which is primarily comprised of crude oil reserves. We also have
international oil and gas interests which represented
approximately two percent of combined revenues and approximately
six percent of proved reserves for the year ended
December 31, 2010. These international interests primarily
consist of our ownership in Apco, an oil and gas exploration and
production company with operations in South America.
|
|
|
Note 2.
|
Basis of
Presentation
|
Our accompanying interim condensed combined financial statements
are unaudited and do not include all disclosures required in
annual financial statements and therefore should be read in
conjunction with the combined financial statements and notes
thereto of the Company as of December 31, 2010 and 2009 and
for each of the three years in the period ended
December 31, 2010, included elsewhere in this registration
statement. The accompanying unaudited condensed combined
financial statements include all normal recurring adjustments
that, in the opinion of our management, are necessary to present
fairly our financial position at March 31, 2011 and our
results of operations, changes in equity, and cash flows for the
three months ended March 31, 2011 and 2010.
The preparation of financial statements in conformity with
accounting principles generally accepted in the United States
requires management to make estimates and assumptions that
affect the amounts reported in the condensed combined financial
statements and accompanying notes. Actual results could differ
from those estimates.
Discontinued
operations
The accompanying condensed combined financial statements and
notes reflect the results of operations and financial position
of our Arkoma Basin operations as discontinued operations for
all periods (See Note 3).
Unless indicated otherwise, the information in the Notes to
Condensed Combined Financial Statements relates to our
continuing operations.
F-11
WPX
Energy
Notes to
Condensed Combined Financial
Statements—(Continued)
Unaudited
Supplemental pro forma balance sheet and pro forma combined loss
per share
The unaudited Supplemental pro forma balance sheet as of
March 31, 2011 gives pro forma effect to the estimated
$1,678 million distribution to Williams from the estimated
Offering proceeds. For pro forma purposes, such payment is
considered a dividend to Williams.
Basic and diluted pro forma combined loss per share for the
three months ended March 31, 2011 were calculated using the
assumed issuance
of
Class A common shares from the Offering, and the assumed
issuance
of
Class B common shares to Williams in exchange for all of
the net assets contributed to us by Williams. Additionally, for
purposes of calculating basic and diluted pro forma combined
loss per share, our historical net loss was further increased by
$22 million to reflect incremental interest expense (net of
tax) related to the portion of the $1,678 million
distribution that exceeds the proceeds from the Offering and our
earnings for the previous twelve months.
|
|
|
Note 3.
|
Discontinued
Operations
|
Summarized
Results of Discontinued Operations
| |
|
|
|
|
|
|
|
|
|
|
|
Three Months Ended March 31,
|
|
|
|
|
2011
|
|
|
2010
|
|
|
|
|
(Millions)
|
|
|
|
|
Revenues
|
|
$
|
3
|
|
|
$
|
5
|
|
|
|
|
|
|
|
|
|
|
|
|
Income (loss) from discontinued operations before impairment and
income taxes
|
|
$
|
(2
|
)
|
|
$
|
—
|
|
|
Impairment of producing properties
|
|
|
(11
|
)
|
|
|
—
|
|
|
(Provision) benefit for income taxes
|
|
|
5
|
|
|
|
—
|
|
|
|
|
|
|
|
|
|
|
|
|
Loss from discontinued operations
|
|
$
|
(8
|
)
|
|
$
|
—
|
|
|
|
|
|
|
|
|
|
|
|
Impairment in 2011 reflects a write-down to an estimate of fair
value less costs to sell the assets of our Arkoma Basin
operations that were classified as held for sale as of
March 31, 2011. This nonrecurring fair value measurement,
which falls within Level 3 of the fair value hierarchy, was
based on a probability-weighted discounted cash flow analysis
that included offers we have received on the assets.
The assets of our discontinued operations comprise significantly
less than one percent of our total combined assets as of
March 31, 2011, and December 31, 2010, and are
reported within other current assets and other noncurrent
assets, respectively, on our Condensed Combined Balance Sheet.
Liabilities of our discontinued operations are insignificant for
these periods.
F-12
WPX
Energy
Notes to
Condensed Combined Financial
Statements—(Continued)
|
|
|
4.
|
Related
Party Transactions
|
Transactions
with Williams and Other Affiliated Entities
Below is a summary of the related party transactions for the
three months ended March 31, 2011 and 2010:
| |
|
|
|
|
|
|
|
|
|
|
|
Three Months
|
|
|
|
|
Ended
|
|
|
|
|
March 31,
|
|
|
|
|
2011
|
|
|
2010
|
|
|
|
|
(Millions)
|
|
|
|
|
Oil and gas sales revenues — sales of NGLs to WPZ
|
|
$
|
81
|
|
|
$
|
57
|
|
|
Gas management revenues — sales of natural gas for
fuel and shrink to WPZ and another Williams subsidiary
|
|
|
132
|
|
|
|
167
|
|
|
Lease and facility operating expenses from Williams-direct
employee salary and benefit costs
|
|
|
5
|
|
|
|
6
|
|
|
Gathering, processing and transportation expense from WPZ:
|
|
|
|
|
|
|
|
|
|
Gathering and processing
|
|
|
75
|
|
|
|
25
|
|
|
Transportation
|
|
|
10
|
|
|
|
6
|
|
|
General and administrative from Williams:
|
|
|
|
|
|
|
|
|
|
Direct employee salary and benefit costs
|
|
|
28
|
|
|
|
25
|
|
|
Charges for general and administrative services
|
|
|
15
|
|
|
|
14
|
|
|
Allocated general corporate costs
|
|
|
16
|
|
|
|
16
|
|
|
Other
|
|
|
3
|
|
|
|
3
|
|
|
Interest expense on notes payable to Williams
|
|
|
46
|
|
|
|
25
|
|
In addition, the current amount due to or from affiliates
consists of normal course receivables and payables resulting
from the sale of products to and cost of gathering services
provided by WPZ. Below is a summary of these payables and
receivables which are settled monthly:
| |
|
|
|
|
|
|
|
|
|
|
|
March 31,
|
|
|
December 31,
|
|
|
|
|
2011
|
|
|
2010
|
|
|
|
|
(Millions)
|
|
|
|
|
Current:
|
|
|
|
|
|
|
|
|
|
Accounts receivable:
|
|
|
|
|
|
|
|
|
|
Due from WPZ and another Williams subsidiary
|
|
$
|
43
|
|
|
$
|
60
|
|
|
|
|
|
|
|
|
|
|
|
|
Accounts payable:
|
|
|
|
|
|
|
|
|
|
Due to WPZ
|
|
$
|
8
|
|
|
$
|
12
|
|
|
Due to Williams for cash overdraft
|
|
|
33
|
|
|
|
38
|
|
|
Due to Williams for accrued payroll and benefits
|
|
|
10
|
|
|
|
14
|
|
|
|
|
|
|
|
|
|
|
|
|
|
|
$
|
51
|
|
|
$
|
64
|
|
|
|
|
|
|
|
|
|
|
|
|
Current derivative asset with WPZ
|
|
$
|
4
|
|
|
$
|
—
|
|
|
|
|
|
|
|
|
|
|
|
|
Current derivative liability with WPZ
|
|
$
|
3
|
|
|
$
|
—
|
|
|
|
|
|
|
|
|
|
|
|
F-13
WPX
Energy
Notes to
Condensed Combined Financial
Statements—(Continued)
|
|
|
Note 5.
|
Exploration
Expenses
|
The following presents a summary of exploration expenses:
| |
|
|
|
|
|
|
|
|
|
|
|
Three Months
|
|
|
|
|
Ended
|
|
|
|
|
March 31,
|
|
|
|
|
2011
|
|
|
2010
|
|
|
|
|
(Millions)
|
|
|
|
|
Geologic and geophysical costs
|
|
$
|
2
|
|
|
$
|
5
|
|
|
Unproved leasehold property impairment, amortization and
expiration
|
|
|
11
|
|
|
|
3
|
|
|
|
|
|
|
|
|
|
|
|
|
Total exploration expense
|
|
$
|
13
|
|
|
$
|
8
|
|
|
|
|
|
|
|
|
|
|
|
| |
|
|
|
|
|
|
|
|
|
|
|
March 31,
|
|
|
December 31,
|
|
|
|
|
2011
|
|
|
2010
|
|
|
|
|
(Millions)
|
|
|
|
|
Natural gas in underground storage
|
|
$
|
3
|
|
|
$
|
31
|
|
|
Materials, supplies and other
|
|
|
40
|
|
|
|
46
|
|
|
|
|
|
|
|
|
|
|
|
|
Total inventories
|
|
$
|
43
|
|
|
$
|
77
|
|
|
|
|
|
|
|
|
|
|
|
|
|
|
Note 7.
|
Provision
for Income Taxes
|
The provision for income taxes includes:
| |
|
|
|
|
|
|
|
|
|
|
|
Three Months
|
|
|
|
|
Ended
|
|
|
|
|
March 31,
|
|
|
|
|
2011
|
|
|
2010
|
|
|
|
|
(Millions)
|
|
|
|
|
Current:
|
|
|
|
|
|
|
|
|
|
Federal
|
|
$
|
6
|
|
|
$
|
15
|
|
|
State
|
|
|
1
|
|
|
|
(2
|
)
|
|
Foreign
|
|
|
2
|
|
|
|
2
|
|
|
|
|
|
|
|
|
|
|
|
|
|
|
|
9
|
|
|
|
15
|
|
|
Deferred:
|
|
|
|
|
|
|
|
|
|
Federal
|
|
|
(5
|
)
|
|
|
27
|
|
|
State
|
|
|
(1
|
)
|
|
|
2
|
|
|
Foreign
|
|
|
—
|
|
|
|
—
|
|
|
|
|
|
|
|
|
|
|
|
|
|
|
|
(6
|
)
|
|
|
29
|
|
|
|
|
|
|
|
|
|
|
|
|
Total provision
|
|
$
|
3
|
|
|
$
|
44
|
|
|
|
|
|
|
|
|
|
|
|
The effective income tax rate on the total provision for the
three months ended March 31, 2011 is less than the federal
statutory rate due primarily to taxes on foreign operations.
The effective income tax rate on the total provision for the
three months ended March 31, 2010, is greater than the
federal statutory rate due primarily to the effect of state
income taxes.
During the next twelve months, we do not expect ultimate
resolution of any uncertain tax position will result in a
significant increase or decrease of our unrecognized tax benefit.
F-14
WPX
Energy
Notes to
Condensed Combined Financial
Statements—(Continued)
|
|
|
Note 8.
|
Contingent
Liabilities and Commitments
|
Royalty
litigation
In September 2006, royalty interest owners in Garfield County,
Colorado, filed a class action suit in District Court, Garfield
County Colorado, alleging we improperly calculated oil and gas
royalty payments, failed to account for the proceeds that we
received from the sale of natural gas and extracted products,
improperly charged certain expenses and failed to refund amounts
withheld in excess of ad valorem tax obligations. Plaintiffs
sought to certify as a class of royalty interest owners, recover
underpayment of royalties and obtain corrected payments
resulting from calculation errors. We entered into a final
partial settlement agreement. The partial settlement agreement
defined the class members for class certification, reserved two
claims for court resolution, resolved all other class claims
relating to past calculation of royalty and overriding royalty
payments, and established certain rules to govern future royalty
and overriding royalty payments. This settlement resolved all
claims relating to past withholding for ad valorem tax payments
and established a procedure for refunds of any such excess
withholding in the future. The first reserved claim is whether
we are entitled to deduct in our calculation of royalty payments
a portion of the costs we incur beyond the tailgates of the
treating or processing plants for mainline pipeline
transportation. We received a favorable ruling on our motion for
summary judgment on the first reserved claim. Plaintiffs
appealed that ruling and the Colorado Court of Appeals found in
our favor in April 2011. In June 2011, Plaintiffs filed a
Petition for Certiorari with the Colorado Supreme Court. We
anticipate that Court will issue a decision on whether to grant
further review later in 2011 or early in 2012. The second
reserved claim relates to whether we are required to have
proportionately increased the value of natural gas by
transporting that gas on mainline transmission lines and, if
required, whether we did so and are thus entitled to deduct a
proportionate share of transportation costs in calculating
royalty payments. We anticipate trial on the second reserved
claim following resolution of the first reserved claim. We
believe our royalty calculations have been properly determined
in accordance with the appropriate contractual arrangements and
Colorado law. At this time, the plaintiffs have not provided us
a sufficient framework to calculate an estimated range of
exposure related to their claims. However, it is reasonably
possible that the ultimate resolution of this item could result
in a future charge that may be material to our results of
operations.
Other producers have been in litigation or discussions with a
federal regulatory agency and a state agency in New Mexico
regarding certain deductions, comprised primarily of processing,
treating and transportation costs, used in the calculation of
royalties. Although we are not a party to these matters, we have
monitored them to evaluate whether their resolution might have
the potential for unfavorable impact on our results of
operations. One of these matters involving federal litigation
was decided on October 5, 2009. The resolution of this
specific matter is not material to us. However, other related
issues in these matters that could be material to us remain
outstanding. We received notice from the U.S. Department of
Interior Office of Natural Resources Revenue (ONRR) in the
fourth quarter of 2010, intending to clarify the guidelines for
calculating federal royalties on conventional gas production
applicable to our federal leases in New Mexico. The ONRR’s
guidance provides its view as to how much of a producer’s
bundled fees for transportation and processing can be deducted
from the royalty payment. We believe using these guidelines
would not result in a material difference in determining our
historical federal royalty payments for our leases in New
Mexico. No similar specific guidance has been issued by ONRR for
leases in other states, but such guidelines are expected in the
future. However, the timing of receipt of the necessary
guidelines is uncertain. In addition, these interpretive
guidelines on the applicability of certain deductions in the
calculation of federal royalties are extremely complex and will
vary based upon the ONRR’s assessment of the configuration
of processing, treating and transportation operations supporting
each federal lease. From January 2004 through December 2010, our
deductions used in the calculation of the royalty payments in
states other than New Mexico associated with conventional gas
production total approximately $55 million. Correspondence
in 2009 with the ONRR’s predecessor did not take issue with
our calculation regarding the Piceance Basin assumptions which
we believe
F-15
WPX
Energy
Notes to
Condensed Combined Financial
Statements—(Continued)
have been consistent with the requirements. The issuance of
similar guidelines in Colorado and other states could affect our
previous royalty payments and the effect could be material to
our results of operations.
Environmental
matters
The EPA and various state regulatory agencies routinely
promulgate and propose new rules, and issue updated guidance to
existing rules. These new rules and rulemakings include, but are
not limited to, rules for reciprocating internal combustion
engine maximum achievable control technology, new air quality
standards for ground level ozone, and one hour nitrogen dioxide
emission limits. We are unable to estimate the costs of asset
additions or modifications necessary to comply with these new
regulations due to uncertainty created by the various legal
challenges to these regulations and the need for further
specific regulatory guidance.
Matters
related to Williams’ former power business
California
energy crisis
Our former power business was engaged in power marketing in
various geographic areas, including California. Prices charged
for power by us and other traders and generators in California
and other western states in 2000 and 2001 were challenged in
various proceedings, including those before the FERC. We have
entered into settlements with the State of California (State
Settlement), major California utilities (Utilities Settlement),
and others that substantially resolved each of these issues with
these parties.
Although the State Settlement and Utilities Settlement resolved
a significant portion of the refund issues among the settling
parties, we continue to have potential refund exposure to
nonsettling parties, including various California end users that
did not participate in the Utilities Settlement. We are
currently in settlement negotiations with certain California
utilities aimed at eliminating or substantially reducing this
exposure. If successful, and subject to a final
“true-up”
mechanism, the settlement agreement would also resolve our
collection of accrued interest from counterparties as well as
our payment of accrued interest on refund amounts. Thus, as
currently contemplated by the parties, the settlement agreement
would resolve most, if not all, of our legal issues arising from
the
2000-2001
California Energy Crisis. With respect to these matters, amounts
accrued are not material to our financial position.
Certain other issues also remain open at the FERC and for other
nonsettling parties.
Reporting
of natural gas-related information to trade
publications
Civil suits based on allegations of manipulating published gas
price indices have been brought against us and others, in each
case seeking an unspecified amount of damages. We are currently
a defendant in class action litigation and other litigation
originally filed in state court in Colorado, Kansas, Missouri
and Wisconsin brought on behalf of direct and indirect
purchasers of natural gas in those states. These cases were
transferred to the federal court in Nevada. In 2008, the court
granted summary judgment in the Colorado case in favor of us and
most of the other defendants based on plaintiffs’ lack of
standing. On January 8, 2009, the court denied the
plaintiffs’ request for reconsideration of the Colorado
dismissal and entered judgment in our favor. We expect that the
Colorado plaintiffs will appeal, but the appeal cannot occur
until the case against the remaining defendant is concluded.
In the other cases, our joint motions for summary judgment to
preclude the plaintiffs’ state law claims based upon
federal preemption have been pending since late 2009. If the
motions are granted, we expect a final judgment in our favor
which the plaintiffs could appeal. If the motions are denied,
the current stay of activity would be lifted, class
certification would be addressed, and discovery would be
completed as the cases proceed towards trial. Because of the
uncertainty around these current pending unresolved issues,
including an insufficient description of the purported classes
and other related matters, we cannot reasonably estimate a
F-16
WPX
Energy
Notes to
Condensed Combined Financial
Statements—(Continued)
range of potential exposures at this time. However, it is
reasonably possible that the ultimate resolution of these items
could result in future charges that may be material to our
results of operations.
Other
Divestiture Indemnifications
Pursuant to various purchase and sale agreements relating to
divested businesses and assets, we have indemnified certain
purchasers against liabilities that they may incur with respect
to the businesses and assets acquired from us. The indemnities
provided to the purchasers are customary in sale transactions
and are contingent upon the purchasers incurring liabilities
that are not otherwise recoverable from third parties. The
indemnities generally relate to breach of warranties, tax,
historic litigation, personal injury, environmental matters,
right of way and other representations that we have provided.
At March 31, 2011, we do not expect any of the indemnities
provided pursuant to the sales agreements to have a material
impact on our future financial position. However, if a claim for
indemnity is brought against us in the future, it may have a
material adverse effect on our results of operations in the
period in which the claim is made.
In addition to the foregoing, various other proceedings are
pending against us which are incidental to our operations.
Summary
Litigation, arbitration, regulatory matters, and environmental
matters are subject to inherent uncertainties. Were an
unfavorable ruling to occur, there exists the possibility of a
material adverse impact on the results of operations in the
period in which the ruling occurs. As of March 31, 2011 and
December 31, 2010, the Company had accrued approximately
$22 million and $21 million, respectively, for loss
contingencies associated with royalty litigation, reporting of
natural gas information to trade publications and other
contingencies. Management, including internal counsel, currently
believes that the ultimate resolution of the foregoing matters,
taken as a whole and after consideration of amounts accrued,
insurance coverage, recovery from customers or other
indemnification arrangements, is not expected to have a
materially adverse effect upon our future liquidity or financial
position; however, it could be material to our results of
operations in any given year.
Commitments
As part of managing our commodity price risk, we utilize
contracted pipeline capacity (including capacity on
affiliates’ systems, resulting in a total of
$431 million for all years) primarily to move our natural
gas production to other locations in an attempt to obtain more
favorable pricing differentials. Our commitments under these
contracts are as follows:
| |
|
|
|
|
|
|
|
(Millions)
|
|
|
|
|
2011
|
|
$
|
152
|
|
|
2012
|
|
|
204
|
|
|
2013
|
|
|
198
|
|
|
2014
|
|
|
177
|
|
|
2015
|
|
|
170
|
|
|
Thereafter
|
|
|
634
|
|
|
|
|
|
|
|
|
Total
|
|
$
|
1,535
|
|
|
|
|
|
|
|
We also have certain commitments to an equity investee and
others, primarily for natural gas gathering and treating
services and well completion services, which total
$653 million over approximately seven years.
F-17
WPX
Energy
Notes to
Condensed Combined Financial
Statements—(Continued)
We hold a long-term obligation to deliver on a firm basis
200,000 MMBtu per day of natural gas to a buyer at the
White River Hub (Greasewood-Meeker, Colorado), which is the
major market hub exiting the Piceance Basin. This obligation
expires in 2014.
In connection with a gathering agreement entered into by WPZ
with a third party in December 2010, we concurrently agreed to
buy up to 200,000 MMBtu per day of natural gas at Transco
Station 515 (Marcellus Basin) at market prices from the same
third party. Purchases under the
12-year
contract are expected to begin in the third quarter of 2011. We
expect to sell this natural gas in the open market and may
utilize available transportation capacity to facilitate the
sales.
Future minimum annual rentals under noncancelable operating
leases as of March 31, 2011, are payable as follows:
| |
|
|
|
|
|
|
|
(Millions)
|
|
|
|
|
2011
|
|
$
|
17
|
|
|
2012
|
|
|
33
|
|
|
2013
|
|
|
27
|
|
|
2014
|
|
|
23
|
|
|
2015
|
|
|
9
|
|
|
Thereafter
|
|
|
15
|
|
|
|
|
|
|
|
|
Total
|
|
$
|
124
|
|
|
|
|
|
|
|
|
|
|
Note 9.
|
Fair
Value Measurements
|
The following table presents, by level within the fair value
hierarchy, our assets and liabilities that are measured at fair
value on a recurring basis.
| |
|
|
|
|
|
|
|
|
|
|
|
|
|
|
|
|
|
|
|
|
|
|
|
|
|
|
|
|
|
|
|
|
|
|
|
March 31, 2011
|
|
December 31, 2010
|
|
|
|
Level 1
|
|
Level 2
|
|
Level 3
|
|
Total
|
|
Level 1
|
|
Level 2
|
|
Level 3
|
|
Total
|
|
|
|
|
|
(Millions)
|
|
|
|
|
|
(Millions)
|
|
|
|
|
|
Assets:
|
|
|
|
|
|
|
|
|
|
|
|
|
|
|
|
|
|
|
|
|
|
|
|
|
|
|
|
|
|
|
|
|
|
Energy derivatives
|
|
$
|
58
|
|
|
$
|
412
|
|
|
$
|
3
|
|
|
$
|
473
|
|
|
$
|
97
|
|
|
$
|
474
|
|
|
$
|
2
|
|
|
$
|
573
|
|
|
|
|
|
|
|
|
|
|
|
|
|
|
|
|
|
|
|
|
|
|
|
|
|
|
|
|
|
|
|
|
|
|
|
|
Liabilities:
|
|
|
|
|
|
|
|
|
|
|
|
|
|
|
|
|
|
|
|
|
|
|
|
|
|
|
|
|
|
|
|
|
|
Energy derivatives
|
|
$
|
54
|
|
|
$
|
245
|
|
|
$
|
2
|
|
|
$
|
301
|
|
|
$
|
78
|
|
|
$
|
210
|
|
|
$
|
1
|
|
|
$
|
289
|
|
|
|
|
|
|
|
|
|
|
|
|
|
|
|
|
|
|
|
|
|
|
|
|
|
|
|
|
|
|
|
|
|
|
|
Energy derivatives include commodity based exchange-traded
contracts and over the counter (OTC) contracts. Exchange-traded
contracts include futures, swaps, and options. OTC contracts
include forwards, swaps and options.
Many contracts have bid and ask prices that can be observed in
the market. Our policy is to use a mid-market pricing (the
mid-point price between bid and ask prices) convention to value
individual positions and then adjust on a portfolio level to a
point within the bid and ask range that represents our best
estimate of fair value. For offsetting positions by location,
the mid-market price is used to measure both the long and short
positions.
The determination of fair value for our assets and liabilities
also incorporates the time value of money and various credit
risk factors which can include the credit standing of the
counterparties involved, master netting arrangements, the impact
of credit enhancements (such as cash collateral posted and
letters of credit) and our nonperformance risk on our
liabilities. The determination of the fair value of our
liabilities does not consider noncash collateral credit
enhancements.
F-18
WPX
Energy
Notes to
Condensed Combined Financial
Statements—(Continued)
Exchange-traded contracts include New York Mercantile Exchange
and Intercontinental Exchange contracts and are valued based on
quoted prices in these active markets and are classified within
Level 1.
Forward, swap, and option contracts included in Level 2 are
valued using an income approach including present value
techniques and option pricing models. Option contracts, which
hedge future sales of our production, are structured as costless
collars and are financially settled. They are valued using an
industry standard Black-Scholes option pricing model.
Significant inputs into our Level 2 valuations include
commodity prices, implied volatility by location, and interest
rates, as well as considering executed transactions or broker
quotes corroborated by other market data. These broker quotes
are based on observable market prices at which transactions
could currently be executed. In certain instances where these
inputs are not observable for all periods, relationships of
observable market data and historical observations are used as a
means to estimate fair value. Where observable inputs are
available for substantially the full term of the asset or
liability, the instrument is categorized in Level 2.
Our energy derivatives portfolio is largely comprised of
exchange-traded products or like products and the tenure of our
derivatives portfolio is relatively short with more than
99 percent of the net fair value of our derivatives
portfolio expiring in the next 24 months. Due to the nature
of the products and tenure, we are consistently able to obtain
market pricing. All pricing is reviewed on a daily basis and is
formally validated with broker quotes and documented on a
monthly basis.
Certain instruments trade with lower availability of pricing
information. These instruments are valued with a present value
technique using inputs that may not be readily observable or
corroborated by other market data. These instruments are
classified within Level 3 when these inputs have a
significant impact on the measurement of fair value. The
instruments included in Level 3 at March 31, 2011,
consist primarily of natural gas index transactions that are
used to manage our physical requirements.
Reclassifications of fair value between Level 1,
Level 2, and Level 3 of the fair value hierarchy, if
applicable, are made at the end of each quarter. No significant
transfers between Level 1 and Level 2 occurred during
the period ended March 31, 2011 or 2010. During the period
ended March 31, 2011, certain NGL swaps that originated
during the first quarter of 2011 were transferred from
Level 3 to Level 2. Prior to March 31, 2011,
these swaps were considered Level 3 due to a lack of
observable third-party market quotes. Due to an increase in
exchange traded transactions and greater visibility from OTC
trading, we transferred these instruments to Level 2.
The following table presents a reconciliation of changes in the
fair value of our net energy derivatives classified as
Level 3 in the fair value hierarchy.
Level 3
Fair Value Measurements Using Significant Unobservable
Inputs
| |
|
|
|
|
|
|
|
|
|
|
|
Three Months Ended March 31,
|
|
|
|
|
2011
|
|
|
2010
|
|
|
|
|
(Millions)
|
|
|
|
|
Beginning balance
|
|
$
|
1
|
|
|
$
|
1
|
|
|
Realized and unrealized gains included in income from continuing
operations
|
|
|
5
|
|
|
|
—
|
|
|
Settlements
|
|
|
(2
|
)
|
|
|
—
|
|
|
Transfers into Level 3
|
|
|
—
|
|
|
|
—
|
|
|
Transfers out of Level 3
|
|
|
(3
|
)
|
|
|
—
|
|
|
|
|
|
|
|
|
|
|
|
|
Ending balance
|
|
$
|
1
|
|
|
$
|
1
|
|
|
|
|
|
|
|
|
|
|
|
|
Unrealized gains included in income from continuing operations
relating to instruments still held at March 31
|
|
$
|
3
|
|
|
$
|
—
|
|
|
|
|
|
|
|
|
|
|
|
F-19
WPX
Energy
Notes to
Condensed Combined Financial
Statements—(Continued)
Realized and unrealized gains included in income from continuing
operations for the above periods are reported in revenues in our
Condensed Combined Statement of Operations.
|
|
|
Note 10.
|
Financial
Instruments, Derivatives, Guarantees, and Concentration of
Credit Risk
|
Financial
Instruments
Fair-value
methods
We use the following methods and assumptions in estimating our
fair-value disclosures for financial instruments:
Cash and cash equivalents and restricted
cash: The carrying amounts reported in the
Condensed Combined Balance Sheet approximate fair value due to
the nature of the instrument
and/or the
short-term maturity of these instruments.
Other: Includes margin deposits and
customer margin deposits payable for which the amounts reported
in the Condensed Combined Balance Sheet approximate fair value.
Energy derivatives: Energy derivatives
include futures, forwards, swaps, and options. These are carried
at fair value in the Condensed Combined Balance Sheet. See
Note 9 for a discussion of the valuation of our energy
derivatives.
Carrying amounts and fair values of our financial instruments
were as follows:
| |
|
|
|
|
|
|
|
|
|
|
|
|
|
|
|
|
|
|
|
March 31, 2011
|
|
|
December 31, 2010
|
|
|
|
|
Carrying
|
|
|
Fair
|
|
|
Carrying
|
|
|
Fair
|
|
|
Asset (Liability)
|
|
Amount
|
|
|
Value
|
|
|
Amount
|
|
|
Value
|
|
|
|
|
|
|
|
(Millions)
|
|
|
|
|
|
|
|
Cash and cash equivalents
|
|
$
|
40
|
|
|
$
|
40
|
|
|
$
|
37
|
|
|
$
|
37
|
|
|
Restricted cash
|
|
$
|
23
|
|
|
$
|
23
|
|
|
$
|
24
|
|
|
$
|
24
|
|
|
Other
|
|
$
|
(8
|
)
|
|
$
|
(8
|
)
|
|
$
|
(25
|
)
|
|
$
|
(25
|
)
|
|
Net energy derivatives:
|
|
|
|
|
|
|
|
|
|
|
|
|
|
|
|
|
|
Energy commodity cash flow hedges
|
|
$
|
170
|
|
|
$
|
170
|
|
|
$
|
266
|
|
|
$
|
266
|
|
|
Other energy derivatives
|
|
$
|
2
|
|
|
$
|
2
|
|
|
$
|
18
|
|
|
$
|
18
|
|
Energy
Commodity Derivatives
Risk
management activities
We are exposed to market risk from changes in energy commodity
prices within our operations. We utilize derivatives to manage
exposure to the variability in expected future cash flows from
forecasted sales of natural gas and crude oil attributable to
commodity price risk. Certain of these derivatives utilized for
risk management purposes have been designated as cash flow
hedges, while other derivatives have not been designated as cash
flow hedges or do not qualify for hedge accounting despite
hedging our future cash flows on an economic basis.
We produce, buy, and sell natural gas and crude oil at different
locations throughout the United States. To reduce exposure to a
decrease in revenues from fluctuations in natural gas and crude
oil market prices, we enter into natural gas and crude oil
futures contracts, swap agreements, and financial option
contracts to mitigate the price risk on forecasted sales of
natural gas and crude oil. We have also entered into basis swap
agreements to reduce the locational price risk associated with
our producing basins. These cash flow hedges are expected to be
highly effective in offsetting cash flows attributable to the
hedged risk during the term of the hedge. However,
ineffectiveness may be recognized primarily as a result of
locational differences between
F-20
WPX
Energy
Notes to
Condensed Combined Financial
Statements—(Continued)
the hedging derivative and the hedged item. Our financial option
contracts are either purchased options or a combination of
options that comprise a net purchased option or a zero-cost
collar.
The following table sets forth the derivative volumes designated
as hedges of production volumes as of March 31, 2011:
| |
|
|
|
|
|
|
|
|
|
|
|
|
|
|
|
|
|
|
|
|
|
|
|
|
|
|
|
Weighted Average
|
|
|
|
|
|
|
|
|
|
|
Notional
|
|
|
Price
|
|
Commodity
|
|
Period
|
|
|
Contract Type
|
|
Location
|
|
Volume (BBtu)
|
|
|
($/MMBtu)
|
|
|
|
Natural Gas
|
|
|
Apr-Dec 2011
|
|
|
Costless Collar
|
|
Rockies
|
|
|
12,375
|
|
|
$5.30 - $7.10
|
|
Natural Gas
|
|
|
Apr-Dec 2011
|
|
|
Costless Collar
|
|
San Juan
|
|
|
24,750
|
|
|
$5.27 - $7.06
|
|
Natural Gas
|
|
|
Apr-Dec 2011
|
|
|
Costless Collar
|
|
MidCon
|
|
|
22,000
|
|
|
$5.10 - $7.00
|
|
Natural Gas
|
|
|
Apr-Dec 2011
|
|
|
Costless Collar
|
|
SoCal
|
|
|
8,250
|
|
|
$5.83 - $7.56
|
|
Natural Gas
|
|
|
Apr-Dec 2011
|
|
|
Costless Collar
|
|
Appalachia
|
|
|
8,250
|
|
|
$6.50 - $8.14
|
|
Natural Gas
|
|
|
Apr-Dec 2011
|
|
|
Location Swaps
|
|
Rockies
|
|
|
26,125
|
|
|
$5.31
|
|
Natural Gas
|
|
|
Apr-Dec 2011
|
|
|
Location Swaps
|
|
San Juan
|
|
|
30,250
|
|
|
$5.10
|
|
Natural Gas
|
|
|
Apr-Dec 2011
|
|
|
Location Swaps
|
|
MidCon
|
|
|
6,875
|
|
|
$5.05
|
|
Natural Gas
|
|
|
Apr-Dec 2011
|
|
|
Location Swaps
|
|
SoCal
|
|
|
11,000
|
|
|
$4.95
|
|
Natural Gas
|
|
|
Apr-Dec 2011
|
|
|
Location Swaps
|
|
Appalachia
|
|
|
28,875
|
|
|
$5.32
|
|
Natural Gas
|
|
|
2012
|
|
|
Location Swaps
|
|
Rockies
|
|
|
34,770
|
|
|
$4.76
|
|
Natural Gas
|
|
|
2012
|
|
|
Location Swaps
|
|
San Juan
|
|
|
40,260
|
|
|
$4.94
|
|
Natural Gas
|
|
|
2012
|
|
|
Location Swaps
|
|
MidCon
|
|
|
30,195
|
|
|
$4.75
|
|
Natural Gas
|
|
|
2012
|
|
|
Location Swaps
|
|
SoCal
|
|
|
11,895
|
|
|
$5.14
|
|
Natural Gas
|
|
|
2012
|
|
|
Location Swaps
|
|
Appalachia
|
|
|
42,090
|
|
|
$5.55
|
|
|
|
|
|
|
|
|
|
|
Notional
|
|
|
Weighted Average
|
|
Commodity
|
|
Period
|
|
|
Contract Type
|
|
Location
|
|
Volume (Mbbls)
|
|
|
Price ($/Bbl)
|
|
|
|
Crude Oil
|
|
|
Apr-Dec 2011
|
|
|
Business Day Avg Swaps
|
|
WTI
|
|
|
1,077
|
|
|
$96.01
|
|
Crude Oil
|
|
|
2012
|
|
|
Business Day Avg Swaps
|
|
WTI
|
|
|
2,624
|
|
|
$97.32
|
We also enter into forward contracts to buy and sell natural gas
to maximize the economic value of transportation agreements and
storage capacity agreements. To reduce exposure to a decrease in
margins from fluctuations in natural gas market prices, we may
enter into futures contracts, swap agreements, and financial
option contracts to mitigate the price risk associated with
these contracts. Hedges for transportation contracts are
designated as cash flow hedges and are expected to be highly
effective in offsetting cash flows attributable to the hedged
risk during the term of the hedge. However, ineffectiveness may
be recognized primarily as a result of locational differences
between the hedging derivative and the hedged item. Hedges for
storage contracts have not been designated as hedging
instruments, despite economically hedging the expected cash
flows generated by those agreements.
We also enter into energy commodity derivatives for other than
risk management purposes, including managing certain remaining
legacy natural gas contracts and positions from our former power
business and providing services to third parties. These legacy
natural gas contracts include substantially offsetting positions
and have an insignificant net impact on earnings.
The following table depicts the notional amounts of the net long
(short) positions which we did not designate as hedges of our
production in our commodity derivatives portfolio as of
March 31, 2011. Natural gas is presented in millions of
British Thermal Units (MMBtu). All of the Central hub risk
realizes by March 31, 2012 and 99% of the basis risk
realizes in 2012. The net index position includes contracts for
the future sale of physical natural gas related to our
production. Offsetting these sales are contracts for the future
F-21
WPX
Energy
Notes to
Condensed Combined Financial
Statements—(Continued)
production of physical natural gas related to WPZ’s natural
gas shrink requirements. These contracts result in minimal
commodity price risk exposure and have a value of less than
$1 million at March 31, 2011.
| |
|
|
|
|
|
|
|
|
|
|
|
|
|
|
|
|
|
|
|
Unit of
|
|
Central Hub
|
|
Basis
|
|
Index
|
|
Derivative Notional Volumes
|
|
Measure
|
|
Risk(a)(d)
|
|
Risk(b)
|
|
Risk(c)
|
|
|
|
Not Designated as Hedging Instruments
|
|
|
|
|
|
|
|
|
|
|
|
|
|
|
|
|
|
Risk Management
|
|
|
MMBtu
|
|
|
|
(6,542,400
|
)
|
|
|
(17,452,400
|
)
|
|
|
(30,877,696
|
)
|
|
Other
|
|
|
MMBtu
|
|
|
|
(1,500
|
)
|
|
|
(226,500
|
)
|
|
|
|
|
|
|
|
|
(a) |
|
includes physical and financial derivative transactions that
settle against the Henry Hub price; |
|
|
|
|
(b) |
|
includes financial derivative transactions priced off the
difference in value between the Central Hub and another specific
delivery point; |
|
|
|
|
(c) |
|
includes physical derivative transactions at an unknown future
price, including purchases of 135,017,130 MMBtu primarily
on behalf of WPZ and sales of 165,894,826 MMBtu. |
|
|
|
|
(d) |
|
includes financial derivatives entered into with WPZ to reduce
its exposure to decreases in its revenues from fluctuations in
NGL market prices or increases in costs and operating expenses
from fluctuations in natural gas market prices. These contracts
are offset by 3rd party agreements. |
Fair
values and gains (losses)
The following table presents the fair value of energy commodity
derivatives. Our derivatives are presented as separate line
items in our Condensed Combined Balance Sheet as current and
noncurrent derivative assets and liabilities. Derivatives are
classified as current or noncurrent based on the contractual
timing of expected future net cash flows of individual
contracts. The expected future net cash flows for derivatives
classified as current are expected to occur within the next
12 months. The fair value amounts are presented on a gross
basis and do not reflect the netting of asset and liability
positions permitted under the terms of our master netting
arrangements. Further, the amounts below do not include cash
held on deposit in margin accounts that we have received or
remitted to collateralize certain derivative positions.
| |
|
|
|
|
|
|
|
|
|
|
|
|
|
|
|
|
|
|
|
March 31, 2011
|
|
|
December 31, 2010
|
|
|
|
|
Assets
|
|
|
Liabilities
|
|
|
Assets
|
|
|
Liabilities
|
|
|
|
|
|
|
|
(Millions)
|
|
|
|
|
|
|
|
Designated as hedging instruments
|
|
$
|
230
|
|
|
$
|
60
|
|
|
$
|
288
|
|
|
$
|
22
|
|
|
Not designated as hedging instruments:
|
|
|
|
|
|
|
|
|
|
|
|
|
|
|
|
|
|
Legacy natural gas contracts from former power business
|
|
|
223
|
|
|
|
224
|
|
|
|
186
|
|
|
|
187
|
|
|
All other
|
|
|
20
|
|
|
|
17
|
|
|
|
99
|
|
|
|
80
|
|
|
|
|
|
|
|
|
|
|
|
|
|
|
|
|
|
|
|
|
Total derivatives not designated as hedging instruments
|
|
|
243
|
|
|
|
241
|
|
|
|
285
|
|
|
|
267
|
|
|
|
|
|
|
|
|
|
|
|
|
|
|
|
|
|
|
|
|
Total derivatives
|
|
$
|
473
|
|
|
$
|
301
|
|
|
$
|
573
|
|
|
$
|
289
|
|
|
|
|
|
|
|
|
|
|
|
|
|
|
|
|
|
|
|
F-22
WPX
Energy
Notes to
Condensed Combined Financial
Statements—(Continued)
The following table presents pre-tax gains and losses for our
energy commodity derivatives designated as cash flow hedges, as
recognized in accumulated other comprehensive income (AOCI) or
revenues.
| |
|
|
|
|
|
|
|
|
|
|
|
|
|
|
|
Three Months Ended
|
|
|
|
|
|
|
|
March 31,
|
|
|
|
|
|
|
|
2011
|
|
|
2010
|
|
|
Classification
|
|
|
|
|
(Millions)
|
|
|
|
|
|
|
|
Net gain (loss) recognized in other comprehensive income (loss)
(effective portion)
|
|
$
|
(20
|
)
|
|
$
|
284
|
|
|
|
AOCI
|
|
|
Net gain reclassified from AOCI into income (effective portion)
|
|
$
|
75
|
|
|
$
|
27
|
|
|
|
Revenues
|
|
|
Gain (loss) recognized in income (ineffective portion)
|
|
$
|
(1
|
)
|
|
$
|
5
|
|
|
|
Revenues
|
|
There were no gains or losses recognized in income as a result
of excluding amounts from the assessment of hedge.
The following table presents pre-tax gains and losses for our
energy commodity derivatives not designated as hedging
instruments.
| |
|
|
|
|
|
|
|
|
|
|
|
Three Months Ended March 31,
|
|
|
|
|
2011
|
|
|
2010
|
|
|
|
|
(Millions)
|
|
|
|
|
Gas management revenues
|
|
$
|
3
|
|
|
$
|
26
|
|
|
Gas management expenses
|
|
|
—
|
|
|
|
—
|
|
|
|
|
|
|
|
|
|
|
|
|
Net gain
|
|
$
|
3
|
|
|
$
|
26
|
|
|
|
|
|
|
|
|
|
|
|
The cash flow impact of our derivative activities is presented
in the Condensed Combined Statement of Cash Flows as changes
in current and noncurrent derivative assets and liabilities.
Credit-risk-related
features
Certain of our derivative contracts contain credit-risk-related
provisions that would require us, in certain circumstances, to
post additional collateral in support of our net derivative
liability positions. These credit-risk-related provisions
require us to post collateral in the form of cash or letters of
credit when our net liability positions exceed an established
credit threshold. The credit thresholds are typically based on
our senior unsecured debt ratings from Standard and Poor’s
and/or
Moody’s Investors Service. Under these contracts, a credit
ratings decline would lower our credit thresholds, thus
requiring us to post additional collateral. We also have
contracts that contain adequate assurance provisions giving the
counterparty the right to request collateral in an amount that
corresponds to the outstanding net liability. Additionally, we
have an unsecured credit agreement with certain banks related to
hedging activities. We are not required to provide collateral
support for net derivative liability positions under the credit
agreement as long as the value of our domestic natural gas
reserves, as determined under the provisions of the agreement,
exceeds by a specified amount certain of its obligations
including any outstanding debt and the aggregate
out-of-the-money
position on hedges entered into under the credit agreement.
As of March 31, 2011, we did not have any collateral posted
to derivative counterparties to support the aggregate fair value
of our net $25 million derivative liability position
(reflecting master netting arrangements in place with certain
counterparties), which includes a reduction of significantly
less than $1 million to our liability balance for our own
nonperformance risk. At December 31, 2010, we had
collateral totaling $8 million posted to derivative
counterparties, all of which was in the form of letters of
credit, to support the aggregate fair value of our net
derivative liability position (reflecting master netting
arrangements in place with certain counterparties) of
$36 million, which included a reduction of less than
$1 million to our liability balance for
F-23
WPX
Energy
Notes to
Condensed Combined Financial
Statements—(Continued)
our own nonperformance risk. The additional collateral that we
would have been required to post, assuming our credit thresholds
were eliminated and a call for adequate assurance under the
credit risk provisions in our derivative contracts was
triggered, was $25 million and $29 million at
March 31, 2011 and December 31, 2010, respectively.
Cash flow
hedges
Changes in the fair value of our cash flow hedges, to the extent
effective, are deferred in AOCI and reclassified into earnings
in the same period or periods in which the hedged forecasted
purchases or sales affect earnings, or when it is probable that
the hedged forecasted transaction will not occur by the end of
the originally specified time period. As of March 31, 2011,
we have hedged portions of future cash flows associated with
anticipated energy commodity purchases and sales for up to two
years. Based on recorded values at March 31, 2011,
$101 million of net gains (net of income tax provision of
$59 million) will be reclassified into earnings within the
next year. These recorded values are based on market prices of
the commodities as of March 31, 2011. Due to the volatile
nature of commodity prices and changes in the creditworthiness
of counterparties, actual gains or losses realized within the
next year will likely differ from these values. These gains or
losses are expected to substantially offset net losses or gains
that will be realized in earnings from previous unfavorable or
favorable market movements associated with underlying hedged
transactions.
Concentration
of Credit Risk
Derivative
assets and liabilities
We have a risk of loss from counterparties not performing
pursuant to the terms of their contractual obligations.
Counterparty performance can be influenced by changes in the
economy and regulatory issues, among other factors. Risk of loss
is impacted by several factors, including credit considerations
and the regulatory environment in which a counterparty
transacts. We attempt to minimize credit-risk exposure to
derivative counterparties and brokers through formal credit
policies, consideration of credit ratings from public ratings
agencies, monitoring procedures, master netting agreements and
collateral support under certain circumstances. Collateral
support could include letters of credit, payment under margin
agreements, and guarantees of payment by credit worthy parties.
The gross credit exposure from our derivative contracts as of
March 31, 2011, is summarized as follows:
| |
|
|
|
|
|
|
|
|
|
|
|
Investment
|
|
|
|
|
|
Counterparty Type
|
|
Grade(a)
|
|
|
Total
|
|
|
|
|
(Millions)
|
|
|
|
|
Gas and electric utilities
|
|
$
|
6
|
|
|
$
|
7
|
|
|
Energy marketers and traders
|
|
|
—
|
|
|
|
142
|
|
|
Financial institutions
|
|
|
324
|
|
|
|
324
|
|
|
|
|
|
|
|
|
|
|
|
|
|
|
$
|
330
|
|
|
|
473
|
|
|
|
|
|
|
|
|
|
|
|
|
Credit reserves
|
|
|
|
|
|
|
—
|
|
|
|
|
|
|
|
|
|
|
|
|
Gross credit exposure from derivatives
|
|
|
|
|
|
$
|
473
|
|
|
|
|
|
|
|
|
|
|
|
We assess our credit exposure on a net basis to reflect master
netting agreements in place with certain counterparties. We
offset our credit exposure to each counterparty with amounts we
owe the counterparty
F-24
WPX
Energy
Notes to
Condensed Combined Financial
Statements—(Continued)
under derivative contracts. The net credit exposure from our
derivatives as of March 31, 2011, excluding collateral
support discussed below, is summarized as follows:
| |
|
|
|
|
|
|
|
|
|
|
|
Investment
|
|
|
|
|
|
Counterparty Type
|
|
Grade(a)
|
|
|
Total
|
|
|
|
|
(Millions)
|
|
|
|
|
Gas and electric utilities
|
|
$
|
3
|
|
|
$
|
3
|
|
|
Energy marketers and traders
|
|
|
—
|
|
|
|
1
|
|
|
Financial institutions
|
|
|
192
|
|
|
|
192
|
|
|
|
|
|
|
|
|
|
|
|
|
|
|
$
|
195
|
|
|
|
196
|
|
|
|
|
|
|
|
|
|
|
|
|
Credit reserves
|
|
|
|
|
|
|
—
|
|
|
|
|
|
|
|
|
|
|
|
|
Net credit exposure from derivatives
|
|
|
|
|
|
$
|
196
|
|
|
|
|
|
|
|
|
|
|
|
|
|
|
|
(a) |
|
We determine investment grade primarily using publicly available
credit ratings. We include counterparties with a minimum
Standard & Poor’s rating of BBB- or Moody’s
Investors Service rating of Baa3 in investment grade. |
Our seven largest net counterparty positions represent
approximately 93 percent of our net credit exposure from
derivatives and are all with investment grade counterparties.
Included within this group are counterparty positions,
representing 82 percent of our net credit exposure from
derivatives, associated our hedging facility. Under certain
conditions, the terms of this credit agreement may require the
participating financial institutions to deliver collateral
support to a designated collateral agent (which is another
participating financial institution in the agreement). The level
of collateral support required is dependent on whether the net
position of the counterparty financial institution exceeds
specified thresholds. The thresholds may be subject to
prescribed reductions based on changes in the credit rating of
the counterparty financial institution.
At March 31, 2011, the designated collateral agent is not
required to hold any collateral support on our behalf under our
hedging facility. We hold collateral support, which may include
cash or letters of credit, of $8 million related to our
other derivative positions.
|
|
|
Note 11.
|
Subsequent
Events
|
On June 3, 2011, WPX Energy, Inc., as borrower, entered
into a new $1.5 billion five-year senior unsecured
revolving credit facility agreement (the “Credit Facility
Agreement”), together with the lenders named therein, and
Citibank N.A. (“Citi”), as administrative agent and
swingline lender. Under the terms of the Credit Facility
Agreement and subject to certain requirements, WPX Energy, Inc.
may request an increase in the commitments of up to an
additional $300 million by either commitments from new
lenders or increased commitments from existing lenders.
Borrowings under the Credit Facility Agreement may be used for
working capital, acquisitions, capital expenditures and other
general corporate purposes.
Under the Credit Facility Agreement, WPX Energy, Inc. may also
obtain same day funds by requesting a swingline loan of up to an
amount of $125 million from the swingline lender. Interest
on swingline loans will be payable at a fluctuating base rate
equal to Citi’s adjusted base rate plus the applicable
margin.
The Credit Facility Agreement will not be effective until the
date on which certain conditions listed in the agreement
(including, among others, the completion of the initial public
offering of WPX Energy, Inc.) have been met or waived; provided
that the effective date must be on or before November 30,
2011 or such later date as may be agreed to by WPX Energy, Inc.
and the lenders. If the effective date has not occurred by
November 30, 2011, the Credit Facility Agreement will
automatically terminate unless otherwise extended by WPX Energy,
Inc. and the lenders.
F-25
WPX
Energy
Notes to
Condensed Combined Financial
Statements—(Continued)
Interest on borrowings under the Credit Facility Agreement will
be payable at rates per annum equal to, at the option of WPX
Energy, Inc.: (1) a fluctuating base rate equal to
Citi’s adjusted base rate plus the applicable margin, or
(2) a periodic fixed rate equal to LIBOR plus the
applicable margin. The adjusted base rate will be the highest of
(i) the federal funds rate plus 0.5 percent,
(ii) Citi’s publicly announced base rate, and
(iii) one-month LIBOR plus 1.0 percent. WPX Energy,
Inc. will be required to pay a commitment fee based on the
unused portion of the commitments under the Credit Facility
Agreement. The applicable margin and the commitment fee will be
determined by reference to a pricing schedule based on WPX
Energy, Inc.’s senior unsecured debt ratings.
Under the Credit Facility Agreement, prior to the occurrence of
the Investment Grade Date (as defined below), WPX Energy, Inc.
will be required to maintain a ratio of PV to debt (each as
defined in the Credit Facility Agreement) of at least 1.50 to
1.00. PV is determined as of the end of each fiscal year and
reflects the present value, discounted at 9 percent, of
projected future cash flows of domestic proved oil and gas
reserves (with a limitation of no more than 35% of proved
undeveloped reserves), based on lender projected commodity price
assumptions and after giving effect to hedge arrangements. Also,
for WPX Energy, Inc. and its consolidated subsidiaries, the
ratio of debt to capitalization (defined as net worth plus debt)
will not be permitted to be greater than 60%. Each of the above
ratios will be tested beginning June 30, 2011 at the end of
each fiscal quarter. Investment Grade Date means the first date
on which WPX Energy, Inc.’s long-term senior unsecured debt
ratings are BBB- or better by S&P or Baa3 or better by
Moody’s (without negative outlook or negative watch),
provided that the other of the two ratings is at least BB+ by
S&P or Ba1 by Moody’s.
The Credit Facility Agreement contains customary representations
and warranties and affirmative, negative and financial covenants
which were made only for the purposes of the Credit Facility
Agreement and as of the specific date (or dates) set forth
therein, and may be subject to certain limitations as agreed
upon by the contracting parties. The covenants limit, among
other things, the ability of WPX Energy, Inc.’s
subsidiaries to incur indebtedness, WPX Energy, Inc. and its
material subsidiaries from granting certain liens supporting
indebtedness, making investments, loans or advances and entering
into certain hedging agreements, WPX Energy, Inc.’s ability
to merge or consolidate with any person or sell all or
substantially all of its assets to any person, enter into
certain affiliate transactions, make certain distributions
during the continuation of an event of default and allow
material changes in the nature of its business. In addition, the
representations, warranties and covenants contained in the
Credit Facility Agreement may be subject to standards of
materiality applicable to the contracting parties that differ
from those applicable to investors. Investors are not
third-party beneficiaries of the Credit Facility Agreement and
should not rely on the representations, warranties and covenants
contained therein, or any descriptions thereof, as
characterizations of the actual state of facts or conditions of
WPX Energy, Inc.
The Credit Facility Agreement includes customary events of
default, including events of default relating to non-payment of
principal, interest or fees, inaccuracy of representations and
warranties in any material respect when made or when deemed
made, violation of covenants, cross payment-defaults, cross
acceleration, bankruptcy and insolvency events, certain
unsatisfied judgments and a change of control. If an event of
default with respect to a borrower occurs under the Credit
Facility Agreement, the lenders will be able to terminate the
commitments and accelerate the maturity of the loans of the
defaulting borrower under the Credit Facility Agreement and
exercise other rights and remedies.
F-26
Report of
Independent Registered Public Accounting Firm
The Board of Directors
WPX Energy, Inc.
We have audited the accompanying combined balance sheet of WPX
Energy (see Note 1) as of December 31, 2010 and 2009,
and the related combined statements of operations, equity, and
cash flows for each of the three years in the period ended
December 31, 2010. Our audits also included the financial
statement schedule listed at Item 16(b). These financial
statements and schedule are the responsibility of the
Company’s management. Our responsibility is to express an
opinion on these financial statements and schedule based on our
audits.
We conducted our audits in accordance with the standards of the
Public Company Accounting Oversight Board (United States). Those
standards require that we plan and perform the audit to obtain
reasonable assurance about whether the financial statements are
free of material misstatement. We were not engaged to perform an
audit of the Company’s internal control over financial
reporting. Our audits included consideration of internal control
over financial reporting as a basis for designing audit
procedures that are appropriate in the circumstances, but not
for the purpose of expressing an opinion on the effectiveness of
the Company’s internal control over financial reporting.
Accordingly, we express no such opinion. An audit also includes
examining, on a test basis, evidence supporting the amounts and
disclosures in the financial statements, assessing the
accounting principles used and significant estimates made by
management, and evaluating the overall financial statement
presentation. We believe that our audits provide a reasonable
basis for our opinion.
In our opinion, the financial statements referred to above
present fairly, in all material respects, the combined financial
position of WPX Energy at December 31, 2010 and 2009, and
the combined results of their operations and their cash flows
for each of the three years in the period ended
December 31, 2010, in conformity with U.S. generally
accepted accounting principles. Also, in our opinion, the
related financial statement schedule, when considered in
relation to the basic financial statements taken as a whole,
presents fairly in all material respects the information set
forth therein.
As discussed in Note 5 to the combined financial
statements, beginning in 2009, the Company changed its reserve
estimates and related disclosures as a result of adopting new
oil and gas reserve estimation and disclosure requirements.
Tulsa, Oklahoma
April 29, 2011, except as it relates to the matter
discussed
in the first paragraph of Basis of
Presentation—Discontinued
Operations as set forth in Note 1, and the matter discussed in
Note 2,
as to which the date is
June 21, 2011
F-27
| |
|
|
|
|
|
|
|
|
|
|
|
|
|
|
|
Years Ended December 31,
|
|
|
|
|
2010
|
|
|
2009
|
|
|
2008
|
|
|
|
|
(Dollars in millions)
|
|
|
|
|
Revenues:
|
|
|
|
|
|
|
|
|
|
|
|
|
|
Oil and gas sales, including affiliate
|
|
$
|
2,225
|
|
|
$
|
2,168
|
|
|
$
|
2,882
|
|
|
Gas management, including affiliate
|
|
|
1,742
|
|
|
|
1,456
|
|
|
|
3,241
|
|
|
Hedge ineffectiveness and mark to market gains and losses
|
|
|
27
|
|
|
|
18
|
|
|
|
29
|
|
|
Other
|
|
|
40
|
|
|
|
39
|
|
|
|
32
|
|
|
|
|
|
|
|
|
|
|
|
|
|
|
|
|
Total revenues
|
|
|
4,034
|
|
|
|
3,681
|
|
|
|
6,184
|
|
|
Costs and expenses:
|
|
|
|
|
|
|
|
|
|
|
|
|
|
Lease and facility operating, including affiliate
|
|
|
286
|
|
|
|
263
|
|
|
|
272
|
|
|
Gathering, processing and transportation, including affiliate
|
|
|
326
|
|
|
|
273
|
|
|
|
229
|
|
|
Taxes other than income
|
|
|
125
|
|
|
|
93
|
|
|
|
254
|
|
|
Gas management (including charges for unutilized pipeline
capacity)
|
|
|
1,771
|
|
|
|
1,495
|
|
|
|
3,248
|
|
|
Exploration
|
|
|
73
|
|
|
|
54
|
|
|
|
37
|
|
|
Depreciation, depletion and amortization
|
|
|
875
|
|
|
|
887
|
|
|
|
738
|
|
|
Impairment of producing properties and costs of acquired
unproved reserves
|
|
|
678
|
|
|
|
15
|
|
|
|
—
|
|
|
Goodwill impairment
|
|
|
1,003
|
|
|
|
—
|
|
|
|
—
|
|
|
General and administrative, including affiliate
|
|
|
253
|
|
|
|
251
|
|
|
|
247
|
|
|
Gain on sale of contractual right to international production
payment
|
|
|
—
|
|
|
|
—
|
|
|
|
(148
|
)
|
|
Other — net
|
|
|
(19
|
)
|
|
|
33
|
|
|
|
6
|
|
|
|
|
|
|
|
|
|
|
|
|
|
|
|
|
Total costs and expenses
|
|
|
5,371
|
|
|
|
3,364
|
|
|
|
4,883
|
|
|
|
|
|
|
|
|
|
|
|
|
|
|
|
|
Operating income (loss)
|
|
|
(1,337
|
)
|
|
|
317
|
|
|
|
1,301
|
|
|
Interest expense, including affiliate
|
|
|
(124
|
)
|
|
|
(100
|
)
|
|
|
(74
|
)
|
|
Interest capitalized
|
|
|
16
|
|
|
|
18
|
|
|
|
20
|
|
|
Investment income and other
|
|
|
21
|
|
|
|
8
|
|
|
|
22
|
|
|
|
|
|
|
|
|
|
|
|
|
|
|
|
|
Income (loss) before income taxes
|
|
|
(1,424
|
)
|
|
|
243
|
|
|
|
1,269
|
|
|
Provision (benefit) for income taxes
|
|
|
(150
|
)
|
|
|
94
|
|
|
|
452
|
|
|
|
|
|
|
|
|
|
|
|
|
|
|
|
|
Income (loss) from continuing operations
|
|
|
(1,274
|
)
|
|
|
149
|
|
|
|
817
|
|
|
Loss from discontinued operations
|
|
|
(8
|
)
|
|
|
(7
|
)
|
|
|
(87
|
)
|
|
|
|
|
|
|
|
|
|
|
|
|
|
|
|
Net income (loss)
|
|
|
(1,282
|
)
|
|
|
142
|
|
|
|
730
|
|
|
Less: Net income attributable to noncontrolling interests
|
|
|
8
|
|
|
|
6
|
|
|
|
8
|
|
|
|
|
|
|
|
|
|
|
|
|
|
|
|
|
Net income (loss) attributable to WPX Energy
|
|
$
|
(1,290
|
)
|
|
$
|
136
|
|
|
$
|
722
|
|
|
|
|
|
|
|
|
|
|
|
|
|
|
|
|
Unaudited Supplemental pro forma combined basic loss per common
share (Note 1)
|
|
$
|
|
|
|
|
|
|
|
|
|
|
|
|
|
|
|
|
|
|
|
|
|
|
|
|
|
Unaudited Supplemental pro forma combined diluted loss per
common share (Note 1)
|
|
$
|
|
|
|
|
|
|
|
|
|
|
|
|
|
|
|
|
|
|
|
|
|
|
|
|
See accompanying notes.
F-28
| |
|
|
|
|
|
|
|
|
|
|
|
December 31,
|
|
|
|
|
2010
|
|
|
2009
|
|
|
|
|
(Dollars in millions)
|
|
|
|
|
Assets
|
|
|
|
|
|
|
|
|
|
Current assets:
|
|
|
|
|
|
|
|
|
|
Cash and cash equivalents
|
|
$
|
37
|
|
|
$
|
34
|
|
|
Accounts receivable:
|
|
|
|
|
|
|
|
|
|
Trade, net of allowance for doubtful accounts of $16 and $19 as
of December 31, 2010 and 2009, respectively
|
|
|
362
|
|
|
|
359
|
|
|
Affiliate
|
|
|
60
|
|
|
|
54
|
|
|
Derivative assets
|
|
|
400
|
|
|
|
650
|
|
|
Inventories
|
|
|
77
|
|
|
|
61
|
|
|
Other
|
|
|
22
|
|
|
|
41
|
|
|
|
|
|
|
|
|
|
|
|
|
Total current assets
|
|
|
958
|
|
|
|
1,199
|
|
|
Investments
|
|
|
105
|
|
|
|
95
|
|
|
Properties and equipment, net (successful efforts method of
accounting)
|
|
|
8,449
|
|
|
|
7,662
|
|
|
Derivative assets
|
|
|
173
|
|
|
|
444
|
|
|
Goodwill, net
|
|
|
—
|
|
|
|
1,003
|
|
|
Other noncurrent assets
|
|
|
161
|
|
|
|
150
|
|
|
|
|
|
|
|
|
|
|
|
|
Total assets
|
|
$
|
9,846
|
|
|
$
|
10,553
|
|
|
|
|
|
|
|
|
|
|
|
|
Liabilities and Equity
|
|
|
|
|
|
|
|
|
|
Current liabilities:
|
|
|
|
|
|
|
|
|
|
Accounts payable:
|
|
|
|
|
|
|
|
|
|
Trade
|
|
$
|
451
|
|
|
$
|
462
|
|
|
Affiliates
|
|
|
64
|
|
|
|
37
|
|
|
Accrued and other current liabilities
|
|
|
158
|
|
|
|
231
|
|
|
Deferred income taxes
|
|
|
87
|
|
|
|
28
|
|
|
Notes payable to Williams
|
|
|
2,261
|
|
|
|
1,216
|
|
|
Derivative liabilities
|
|
|
146
|
|
|
|
578
|
|
|
|
|
|
|
|
|
|
|
|
|
Total current liabilities
|
|
|
3,167
|
|
|
|
2,552
|
|
|
Deferred income taxes
|
|
|
1,629
|
|
|
|
1,841
|
|
|
Derivative liabilities
|
|
|
143
|
|
|
|
428
|
|
|
Asset retirement obligations
|
|
|
282
|
|
|
|
235
|
|
|
Other noncurrent liabilities
|
|
|
125
|
|
|
|
92
|
|
|
Contingent liabilities and commitments (Note 11)
|
|
|
|
|
|
|
|
|
|
Equity:
|
|
|
|
|
|
|
|
|
|
Owner’s net equity:
|
|
|
|
|
|
|
|
|
|
Owner’s net investment
|
|
|
4,260
|
|
|
|
5,269
|
|
|
Accumulated other comprehensive income
|
|
|
168
|
|
|
|
72
|
|
|
|
|
|
|
|
|
|
|
|
|
Total owner’s net equity
|
|
|
4,428
|
|
|
|
5,341
|
|
|
Noncontrolling interests in combined subsidiaries
|
|
|
72
|
|
|
|
64
|
|
|
|
|
|
|
|
|
|
|
|
|
Total equity
|
|
|
4,500
|
|
|
|
5,405
|
|
|
|
|
|
|
|
|
|
|
|
|
Total liabilities and equity
|
|
$
|
9,846
|
|
|
$
|
10,553
|
|
|
|
|
|
|
|
|
|
|
|
See accompanying notes.
F-29
| |
|
|
|
|
|
|
|
|
|
|
|
|
|
|
|
|
|
|
|
|
|
|
|
|
|
|
Accumulated Other
|
|
|
|
|
|
|
|
|
|
|
|
|
|
Owner’s Net
|
|
|
Comprehensive
|
|
|
Total Owner’s Net
|
|
|
Noncontrolling
|
|
|
|
|
|
|
|
Investment
|
|
|
Income (Loss)*
|
|
|
Equity
|
|
|
Interest**
|
|
|
Total
|
|
|
|
|
(Dollars in millions)
|
|
|
|
|
Balance at December 31, 2007
|
|
$
|
4,462
|
|
|
$
|
(161
|
)
|
|
$
|
4,301
|
|
|
$
|
55
|
|
|
$
|
4,356
|
|
|
Comprehensive income:
|
|
|
|
|
|
|
|
|
|
|
|
|
|
|
|
|
|
|
|
|
|
Net income
|
|
|
722
|
|
|
|
—
|
|
|
|
722
|
|
|
|
8
|
|
|
|
730
|
|
|
Other comprehensive income:
|
|
|
|
|
|
|
|
|
|
|
|
|
|
|
|
|
|
|
|
|
|
Change in fair value of cash flow hedges (net of $260 of income
tax)
|
|
|
—
|
|
|
|
454
|
|
|
|
454
|
|
|
|
—
|
|
|
|
454
|
|
|
Net reclassifications into earnings of net cash flow hedge
losses (net of $3 income tax benefit)
|
|
|
—
|
|
|
|
5
|
|
|
|
5
|
|
|
|
—
|
|
|
|
5
|
|
|
|
|
|
|
|
|
|
|
|
|
|
|
|
|
|
|
|
|
|
|
|
|
Total other comprehensive income
|
|
|
|
|
|
|
|
|
|
|
|
|
|
|
|
|
|
|
459
|
|
|
|
|
|
|
|
|
|
|
|
|
|
|
|
|
|
|
|
|
|
|
|
|
Total comprehensive income
|
|
|
|
|
|
|
|
|
|
|
|
|
|
|
|
|
|
|
1,189
|
|
|
|
|
|
|
|
|
|
|
|
|
|
|
|
|
|
|
|
|
|
|
|
|
Net transfers with Williams
|
|
|
(35
|
)
|
|
|
—
|
|
|
|
(35
|
)
|
|
|
—
|
|
|
|
(35
|
)
|
|
Dividends to noncontrolling interests
|
|
|
—
|
|
|
|
—
|
|
|
|
—
|
|
|
|
(4
|
)
|
|
|
(4
|
)
|
|
|
|
|
|
|
|
|
|
|
|
|
|
|
|
|
|
|
|
|
|
|
|
Balance at December 31, 2008
|
|
|
5,149
|
|
|
|
298
|
|
|
|
5,447
|
|
|
|
59
|
|
|
|
5,506
|
|
|
|
|
|
|
|
|
|
|
|
|
|
|
|
|
|
|
|
|
|
|
|
|
Comprehensive income:
|
|
|
|
|
|
|
|
|
|
|
|
|
|
|
|
|
|
|
|
|
|
Net income
|
|
|
136
|
|
|
|
—
|
|
|
|
136
|
|
|
|
6
|
|
|
|
142
|
|
|
Other comprehensive income:
|
|
|
|
|
|
|
|
|
|
|
|
|
|
|
|
|
|
|
|
|
|
Change in fair value of net cash flow hedges (net of $97 of
income tax)
|
|
|
—
|
|
|
|
169
|
|
|
|
169
|
|
|
|
—
|
|
|
|
169
|
|
|
Net reclassifications into earnings of cash flow hedge gain (net
of $226 income tax provision)
|
|
|
—
|
|
|
|
(395
|
)
|
|
|
(395
|
)
|
|
|
—
|
|
|
|
(395
|
)
|
|
|
|
|
|
|
|
|
|
|
|
|
|
|
|
|
|
|
|
|
|
|
|
Total other comprehensive loss
|
|
|
|
|
|
|
|
|
|
|
|
|
|
|
|
|
|
|
(226
|
)
|
|
|
|
|
|
|
|
|
|
|
|
|
|
|
|
|
|
|
|
|
|
|
|
Total comprehensive loss
|
|
|
|
|
|
|
|
|
|
|
|
|
|
|
|
|
|
|
(84
|
)
|
|
|
|
|
|
|
|
|
|
|
|
|
|
|
|
|
|
|
|
|
|
|
|
Net transfers with Williams
|
|
|
(16
|
)
|
|
|
—
|
|
|
|
(16
|
)
|
|
|
—
|
|
|
|
(16
|
)
|
|
Dividends to noncontrolling interests
|
|
|
—
|
|
|
|
—
|
|
|
|
—
|
|
|
|
(1
|
)
|
|
|
(1
|
)
|
|
|
|
|
|
|
|
|
|
|
|
|
|
|
|
|
|
|
|
|
|
|
|
Balance at December 31, 2009
|
|
|
5,269
|
|
|
|
72
|
|
|
|
5,341
|
|
|
|
64
|
|
|
|
5,405
|
|
|
|
|
|
|
|
|
|
|
|
|
|
|
|
|
|
|
|
|
|
|
|
|
Comprehensive income:
|
|
|
|
|
|
|
|
|
|
|
|
|
|
|
|
|
|
|
|
|
|
Net loss
|
|
|
(1,290
|
)
|
|
|
—
|
|
|
|
(1,290
|
)
|
|
|
8
|
|
|
|
(1,282
|
)
|
|
Other comprehensive income:
|
|
|
|
|
|
|
|
|
|
|
|
|
|
|
|
|
|
|
|
|
|
Change in fair value of net cash flow hedges (net of $184 of
income tax)
|
|
|
—
|
|
|
|
321
|
|
|
|
321
|
|
|
|
—
|
|
|
|
321
|
|
|
Net reclassifications into earnings of cash flow hedge gains
(net of $129 income tax provision)
|
|
|
—
|
|
|
|
(225
|
)
|
|
|
(225
|
)
|
|
|
—
|
|
|
|
(225
|
)
|
|
|
|
|
|
|
|
|
|
|
|
|
|
|
|
|
|
|
|
|
|
|
|
Total other comprehensive income
|
|
|
|
|
|
|
|
|
|
|
|
|
|
|
|
|
|
|
96
|
|
|
|
|
|
|
|
|
|
|
|
|
|
|
|
|
|
|
|
|
|
|
|
|
Total comprehensive loss
|
|
|
|
|
|
|
|
|
|
|
|
|
|
|
|
|
|
|
(1,186
|
)
|
|
|
|
|
|
|
|
|
|
|
|
|
|
|
|
|
|
|
|
|
|
|
|
Cash proceeds in excess of historical book value related to
assets sold to an affiliate
|
|
|
244
|
|
|
|
—
|
|
|
|
244
|
|
|
|
—
|
|
|
|
244
|
|
|
Net transfers with Williams
|
|
|
37
|
|
|
|
—
|
|
|
|
37
|
|
|
|
—
|
|
|
|
37
|
|
|
Dividends to noncontrolling interests
|
|
|
—
|
|
|
|
—
|
|
|
|
—
|
|
|
|
—
|
|
|
|
—
|
|
|
|
|
|
|
|
|
|
|
|
|
|
|
|
|
|
|
|
|
|
|
|
|
Balance at December 31, 2010
|
|
$
|
4,260
|
|
|
$
|
168
|
|
|
$
|
4,428
|
|
|
$
|
72
|
|
|
$
|
4,500
|
|
|
|
|
|
|
|
|
|
|
|
|
|
|
|
|
|
|
|
|
|
|
|
|
|
|
|
* |
|
Accumulated other Comprehensive income (loss) is comprised
primarily of unrealized gains relating to natural gas hedges
totaling $169 million (net of $97 million for income
taxes), $74 million (net of $42 million for income
taxes) and $299 million (net of $172 million for
income taxes) as of December 31, 2010, 2009 and 2008,
respectively. |
| |
|
** |
|
Represents the 31 percent interest in Apco Oil and Gas
International Inc. owned by others. |
See accompanying notes.
F-30
| |
|
|
|
|
|
|
|
|
|
|
|
|
|
|
|
Years Ended December 31,
|
|
|
|
|
2010
|
|
|
2009
|
|
|
2008
|
|
|
|
|
(Dollars in millions)
|
|
|
|
|
Operating Activities
|
|
|
|
|
|
|
|
|
|
|
|
|
|
Net income (loss)
|
|
$
|
(1,282
|
)
|
|
$
|
142
|
|
|
$
|
730
|
|
|
Adjustments to reconcile net income (loss) to net cash provided
by operating activities:
|
|
|
|
|
|
|
|
|
|
|
|
|
|
Depreciation, depletion and amortization
|
|
|
882
|
|
|
|
894
|
|
|
|
758
|
|
|
Deferred income tax provision (benefit)
|
|
|
(167
|
)
|
|
|
106
|
|
|
|
456
|
|
|
Provision for impairment of goodwill and properties and
equipment (including certain exploration expenses)
|
|
|
1,734
|
|
|
|
38
|
|
|
|
173
|
|
|
Provision for loss on cost-based investment
|
|
|
—
|
|
|
|
11
|
|
|
|
—
|
|
|
Gain on sale of contractual right to international production
payment
|
|
|
—
|
|
|
|
—
|
|
|
|
(148
|
)
|
|
(Gain) loss on sales of other assets
|
|
|
(22
|
)
|
|
|
1
|
|
|
|
1
|
|
|
Cash provided (used) by operating assets and liabilities:
|
|
|
|
|
|
|
|
|
|
|
|
|
|
Accounts receivable and payable — affiliate
|
|
|
21
|
|
|
|
(72
|
)
|
|
|
20
|
|
|
Accounts receivable — trade
|
|
|
7
|
|
|
|
103
|
|
|
|
127
|
|
|
Other current assets
|
|
|
19
|
|
|
|
(17
|
)
|
|
|
(11
|
)
|
|
Inventories
|
|
|
(16
|
)
|
|
|
24
|
|
|
|
(32
|
)
|
|
Margin deposits and customer margin deposit payable
|
|
|
(1
|
)
|
|
|
4
|
|
|
|
87
|
|
|
Accounts payable — trade
|
|
|
(54
|
)
|
|
|
(17
|
)
|
|
|
(91
|
)
|
|
Accrued and other current liabilities
|
|
|
(62
|
)
|
|
|
(109
|
)
|
|
|
27
|
|
|
Changes in current and noncurrent derivative assets and
liabilities
|
|
|
(45
|
)
|
|
|
38
|
|
|
|
(119
|
)
|
|
Other, including changes in other noncurrent assets and
liabilities
|
|
|
42
|
|
|
|
35
|
|
|
|
31
|
|
|
|
|
|
|
|
|
|
|
|
|
|
|
|
|
Net cash provided by operating activities
|
|
|
1,056
|
|
|
|
1,181
|
|
|
|
2,009
|
|
|
|
|
|
|
|
|
|
|
|
|
|
|
|
|
Investing Activities
|
|
|
|
|
|
|
|
|
|
|
|
|
|
Capital expenditures*
|
|
|
(1,856
|
)
|
|
|
(1,434
|
)
|
|
|
(2,467
|
)
|
|
Purchase of business
|
|
|
(949
|
)
|
|
|
—
|
|
|
|
—
|
|
|
Proceeds from sale of contractual right to international
production payment
|
|
|
—
|
|
|
|
—
|
|
|
|
148
|
|
|
Proceeds from sales of assets
|
|
|
493
|
|
|
|
—
|
|
|
|
72
|
|
|
Purchases of investments
|
|
|
(7
|
)
|
|
|
(1
|
)
|
|
|
(5
|
)
|
|
Other
|
|
|
(18
|
)
|
|
|
—
|
|
|
|
—
|
|
|
|
|
|
|
|
|
|
|
|
|
|
|
|
|
Net cash used in investing activities
|
|
|
(2,337
|
)
|
|
|
(1,435
|
)
|
|
|
(2,252
|
)
|
|
|
|
|
|
|
|
|
|
|
|
|
|
|
|
Financing Activities
|
|
|
|
|
|
|
|
|
|
|
|
|
|
Net changes in notes payable to parent
|
|
|
1,045
|
|
|
|
270
|
|
|
|
269
|
|
|
Net changes in owner’s net investment
|
|
|
241
|
|
|
|
(16
|
)
|
|
|
(38
|
)
|
|
Other
|
|
|
(2
|
)
|
|
|
2
|
|
|
|
(6
|
)
|
|
|
|
|
|
|
|
|
|
|
|
|
|
|
|
Net cash provided by financing activities
|
|
|
1,284
|
|
|
|
256
|
|
|
|
225
|
|
|
|
|
|
|
|
|
|
|
|
|
|
|
|
|
Net change in cash and cash equivalents
|
|
|
3
|
|
|
|
2
|
|
|
|
(18
|
)
|
|
Cash and cash equivalents at beginning of period
|
|
|
34
|
|
|
|
32
|
|
|
|
50
|
|
|
|
|
|
|
|
|
|
|
|
|
|
|
|
|
Cash and cash equivalents at end of period
|
|
$
|
37
|
|
|
$
|
34
|
|
|
$
|
32
|
|
|
|
|
|
|
|
|
|
|
|
|
|
|
|
|
|
|
|
|
|
|
|
|
|
|
|
|
|
|
* Increase to properties and equipment
|
|
$
|
(1,891
|
)
|
|
$
|
(1,291
|
)
|
|
$
|
(2,520
|
)
|
|
Changes in related accounts payable
|
|
|
35
|
|
|
|
(143
|
)
|
|
|
53
|
|
|
|
|
|
|
|
|
|
|
|
|
|
|
|
|
Capital expenditures
|
|
$
|
(1,856
|
)
|
|
$
|
(1,434
|
)
|
|
$
|
(2,467
|
)
|
|
|
|
|
|
|
|
|
|
|
|
|
|
|
See accompanying notes.
F-31
WPX
Energy
|
|
|
1.
|
Description
of Business, Basis of Presentation and Summary of Significant
Accounting Policies
|
Description
of Business
The combined businesses represented herein as WPX Energy (also
referred to herein as the “Company”) comprise
substantially all of the exploration and production operating
segment of The Williams Companies, Inc. (“Williams”).
In these notes, WPX Energy is at times referred to in the first
person as “we”, “us” or “our”.
On February 16, 2011, Williams announced that its Board of
Directors approved pursuing a plan to separate Williams’
businesses into two stand-alone, publicly traded companies. The
plan first calls for Williams to separate its exploration and
production business via an initial public offering (the
“Offering”) of up to 20 percent of its interest.
As a result, WPX Energy, Inc. has been formed to effect the
separation. Prior to the close of the Offering, Williams will
contribute and transfer to the Company its investment in certain
subsidiaries related to its exploration and production business,
including its wholly-owned subsidiaries Williams Production
Holdings, LLC, Williams Production Company, LLC and its
69 percent ownership interest in Apco Oil and Gas
International (“Apco”, NASDAQ listed: APAGF), as well
as all on-going operations of Williams Gas Marketing Services,
Inc. (collectively referred to as the “Contribution”).
WPX Energy includes natural gas development, production and gas
management activities located in the Rocky Mountain (primarily
Colorado, New Mexico, and Wyoming), Mid-Continent (Texas), and
Appalachian regions of the United States. We specialize in
natural gas production from tight-sands and shale formations and
coal bed methane reserves in the Piceance, San Juan, Powder
River, Green River, Fort Worth, and Appalachian Basins.
During 2010, we acquired a company with a significant acreage
position in the Williston Basin (Bakken Shale) in North Dakota,
which is primarily comprised of crude oil reserves. We also have
international oil and gas interests which represented
approximately two percent of combined revenues and approximately
six percent of proved reserves for the year ended
December 31, 2010. These international interests primarily
consist of our ownership in Apco, an oil and gas exploration and
production company with operations in South America.
Basis of
Presentation
These financial statements are prepared on a combined, rather
than a consolidated basis. The combined financial statements
have been derived from the financial statements and accounting
records of Williams using the historical results of operations
and historical basis of the assets and liabilities of the
companies that are to be part of the Contribution to WPX Energy.
Management believes the assumptions underlying the financial
statements are reasonable. However, the financial statements
included herein may not necessarily reflect the Company’s
results of operations, financial position and cash flows in the
future or what its results of operations, financial position and
cash flows would have been had the Company been a stand-alone
company during the periods presented. Because a direct ownership
relationship did not exist among the various entities that will
comprise the Company, Williams’ net investment in the
Company, excluding notes payable to Williams, is shown as
owner’s net investment in lieu of stockholder’s equity
in the combined financial statements. Transactions between the
Company and Williams which are not part of the notes payable
have been identified in the Combined Statements of Equity as net
transfers with Williams (see Note 4). Transactions with
Williams’ other operating businesses, which generally
settle monthly, are shown as accounts receivable-affiliate or
accounts payable-affiliate (see Note 4). The accompanying
combined financial statements do not reflect any changes that
will occur upon the Contribution and recapitalization of the
Company, or may occur in the capitalization and operations of
the Company as a result of, or after, any spin-off of the
Company.
During fourth quarter 2010, the Company sold certain gathering
and processing assets in Colorado’s Piceance Basin (the
“Piceance Sale”) with a net book value of
$458 million to Williams Partners L.P.
F-32
WPX
Energy
Notes to
Combined Financial Statements—(Continued)
(“WPZ”), an entity under the common control of
Williams, in exchange for $702 million in cash and
1.8 million WPZ limited partner units. As the Company and
WPZ are under common control, no gain was recognized on this
transaction in the Combined Statement of Operations.
Accordingly, the $244 million difference between the cash
consideration received and the historical net book value of the
assets has been reflected in the Combined Statement of Equity
for the year ended December 31, 2010. Since the WPZ units
received in this transaction by the Company were intended to be
(and now have been, as described below) distributed through a
dividend to Williams, these units (as well as the tax effects
associated with these units of $42 million) have been
presented net within equity and are included in net transfers
with Williams in 2010. Further, as a result of the limitations
on the Company’s ability to sell these units and the
subsequent dividend to Williams, no gains on the value of the
common units during the holding period have been recognized in
the Combined Statement of Operations. In conjunction with the
Piceance Sale, we entered into long-term contracts with WPZ for
gathering and processing of our natural gas production in the
area. Due to the continuation of significant direct cash flows
related to these assets, historical operating results of these
assets continue to be presented in the Combined Statement of
Operations as continuing operations for all periods presented.
In March, 2011, the 1.8 million WPZ units and related tax
basis were distributed via dividend to Williams.
Discontinued
operations
During the first quarter 2011, we initiated a formal process to
pursue the divestiture of our holdings in the Arkoma Basin. As
these assets are currently held for sale, will be eliminated
from our ongoing operations, and we will not have any
significant continuing involvement, we have reported the results
of operations and financial position of the Arkoma operations as
discontinued operations.
Additionally, the accompanying combined financial statements and
notes include the results of operations of Williams’ former
power business most of which was disposed in 2007 as
discontinued operations. The discontinued operations have been
included in these combined financial statements because
contingent obligations related to this former business directly
relate to Williams Gas Marketing Services, resulting in the
potential of charges or benefits to the Company in periods
subsequent to the exit from this business. See Note 11 for
a discussion of contingencies related to this discontinued power
business.
Unless indicated otherwise, the information in the Notes to
Combined Financial Statements relates to continuing operations.
Summary
of Significant Accounting Policies
Basis of
combination
The combined financial statements include the accounts of the
combined entities as set forth in Description of Business and
Basis of Presentation above. Companies in which WPX Energy
entities own 20 percent to 50 percent of the voting
common stock, or otherwise exercise significant influence over
operating and financial policies of the company, are accounted
for under the equity method. All material intercompany
transactions have been eliminated.
Use of
estimates
The preparation of financial statements in conformity with
accounting principles generally accepted in the United States
requires management to make estimates and assumptions that
affect the amounts reported in the combined financial statements
and accompanying notes. Actual results could differ from those
estimates.
Significant estimates and assumptions which impact these
financials include:
|
|
|
| |
•
|
Impairment assessments of long-lived assets and goodwill;
|
| |
| |
•
|
Assessments of litigation-related contingencies;
|
F-33
WPX
Energy
Notes to
Combined Financial Statements—(Continued)
|
|
|
| |
•
|
Valuations of derivatives;
|
| |
| |
•
|
Hedge accounting correlations and probability;
|
| |
| |
•
|
Estimation of oil and natural gas reserves.
|
These estimates are discussed further throughout these notes.
Cash and
cash equivalents
Our cash and cash equivalents relate primarily to our
international operations. We consider all investments with a
maturity of three months or less when acquired to be cash
equivalents.
Additionally, our domestic businesses currently participate in
the Williams’ cash management program (see
Note 4) rather than maintaining cash and cash
equivalent balances.
Restricted
cash
Restricted cash primarily consists of approximately
$19 million in both 2010 and 2009 related to escrow
accounts established as part of the settlement agreement with
certain California utilities (see Note 11) and is
included in noncurrent other assets.
Accounts
receivable
Accounts receivable are carried on a gross basis, with no
discounting, less the allowance for doubtful accounts. We
estimate the allowance for doubtful accounts based on existing
economic conditions, the financial conditions of the customers
and the amount and age of past due accounts. Receivables are
considered past due if full payment is not received by the
contractual due date. Past due accounts are generally written
off against the allowance for doubtful accounts only after all
collection attempts have been exhausted. A portion of our
receivables are from joint interest owners of properties we
operate. Thus, we may have the ability to withhold future
revenue disbursements to recover any non-payment of joint
interest billings.
Inventories
All inventories are stated at the lower of cost or market. Our
inventories consist primarily of tubular goods and production
equipment for future transfer to wells of $46 million in
2010 and $34 million in 2009. Additionally, we have natural
gas in storage of $31 million in 2010 and $27 million
in 2009 primarily related to our gas management activities.
Inventory is recorded and relieved using the weighted average
cost method except for production equipment which is on the
specific identification method. We recorded lower of cost or
market writedowns on natural gas in storage of $2 million
in 2010, $7 million in 2009 and $35 million in 2008.
Properties
and equipment
Oil and gas exploration and production activities are accounted
for under the successful efforts method. Costs incurred in
connection with the drilling and equipping of exploratory wells
are capitalized as incurred. If proved reserves are not found,
such costs are charged to exploration expense. Other exploration
costs, including geological and geophysical costs and lease
rentals are charged to expense as incurred. All costs related to
development wells, including related production equipment and
lease acquisition costs, are capitalized when incurred whether
productive or nonproductive.
Unproved properties include lease acquisition costs and costs of
acquired unproved reserves. Individually significant lease
acquisition costs are assessed annually, or as conditions
warrant, for impairment considering our future drilling plans,
the remaining lease term and recent drilling results. Lease
acquisition costs that are not individually significant are
aggregated by prospect or geographically, and the portion of
such costs estimated to
F-34
WPX
Energy
Notes to
Combined Financial Statements—(Continued)
be nonproductive prior to lease expiration is amortized over the
average holding period. The estimate of what could be
nonproductive is based on our historical experience or other
information, including current drilling plans and existing
geological data. Impairment and amortization of lease
acquisition costs are included in exploration expense in the
Combined Statement of Operations. A majority of the costs of
acquired unproved reserves are associated with areas to which we
or other producers have identified significant proved developed
producing reserves. Generally, economic recovery of unproved
reserves in such areas is not yet supported by actual production
or conclusive formation tests, but may be confirmed by our
continuing development program. Ultimate recovery of unproved
reserves in areas with established production generally has
greater probability than in areas with limited or no prior
drilling activity. If the unproved properties are determined to
be productive, the appropriate related costs are transferred to
proved oil and gas properties. We refer to unproved lease
acquisition costs and costs of acquired unproved reserves as
unproved properties.
Other
capitalized costs
Costs related to the construction or acquisition of field
gathering, processing and certain other facilities are recorded
at cost. Ordinary maintenance and repair costs are expensed as
incurred.
Depreciation,
depletion and amortization
Capitalized exploratory and developmental drilling costs,
including lease and well equipment and intangible development
costs are depreciated and amortized using the
units-of-production
method based on estimated proved developed oil and gas reserves
on a field basis or concession for our international properties.
International concession reserve estimates are limited to
production quantities estimated through the life of the
concession. Depletion of producing leasehold costs is based on
the
units-of-production
method using estimated proved oil and gas reserves on a field
basis. In arriving at rates under the
units-of-production
methodology, the quantities of proved oil and gas reserves are
established based on estimates made by our geologists and
engineers.
Costs related to gathering, processing and certain other
facilities are depreciated on the straight-line method over the
estimated useful lives.
Gains or losses from the ordinary sale or retirement of
properties and equipment are recorded in other—net included
in operating income (loss).
Impairment
of long-lived assets
We evaluate our long-lived assets for impairment when events or
changes in circumstances indicate, in our management’s
judgment, that the carrying value of such assets may not be
recoverable. When an indicator of impairment has occurred, we
compare our management’s estimate of undiscounted future
cash flows attributable to the assets to the carrying value of
the assets to determine whether an impairment has occurred. If
an impairment of the carrying value has occurred, we determine
the amount of the impairment recognized in the financial
statements by estimating the fair value of the assets and
recording a loss for the amount that the carrying value exceeds
the estimated fair value.
Proved properties, including developed and undeveloped, are
assessed for impairment using estimated future undiscounted cash
flows on a field basis. If the undiscounted cash flows are less
than the book value of the assets, then a subsequent analysis is
performed using discounted cash flows.
Costs of acquired unproved reserves are assessed for impairment
using estimated fair value determined through the use of future
discounted cash flows on a field basis and considering market
participants’ future drilling plans.
F-35
WPX
Energy
Notes to
Combined Financial Statements—(Continued)
Judgments and assumptions are inherent in our management’s
estimate of undiscounted future cash flows and an asset’s
fair value. Additionally, judgment is used to determine the
probability of sale with respect to assets considered for
disposal. These judgments and assumptions include such matters
as the estimation of oil and gas reserve quantities, risks
associated with the different categories of oil and gas
reserves, the timing of development and production, expected
future commodity prices, capital expenditures, production costs
and appropriate discount rates.
Asset
retirement obligations
We record an asset and a liability upon incurrence equal to the
present value of each expected future asset retirement
obligation (“ARO”). These estimates include, as a
component of future expected costs, an estimate of the price
that a third party would demand, and could expect to receive,
for bearing the uncertainties inherent in the obligations,
sometimes referred to as a market risk premium. The ARO asset is
depreciated in a manner consistent with the depreciation of the
underlying physical asset. We measure changes in the liability
due to passage of time by applying an interest method of
allocation. This amount is recognized as an increase in the
carrying amount of the liability and as a corresponding
accretion expense in lease and facility operating expense
included in costs and expenses.
Goodwill
Goodwill represents the excess of cost over fair value of the
assets of businesses acquired. It is evaluated at least annually
(in the fourth quarter) for impairment by first comparing our
management’s estimate of the fair value of a reporting unit
with its carrying value, including goodwill. If the carrying
value of the reporting unit exceeds its fair value, a
computation of the implied fair value of the goodwill is
compared with its related carrying value. If the carrying value
of the reporting unit’s goodwill exceeds the implied fair
value of that goodwill, an impairment loss is recognized in the
amount of the excess.
As a result of significant declines in forward natural gas
prices during third quarter of 2010, we performed an interim
impairment assessment of our goodwill related to our domestic
production reporting unit. As a result of that assessment, we
recorded an impairment of goodwill of approximately
$1 billion (see Note 6).
Judgments and assumptions are inherent in our management’s
estimate of future cash flows used to determine the estimate of
the reporting unit’s fair value.
Derivative
instruments and hedging activities
We utilize derivatives to manage our commodity price risk. These
instruments consist primarily of futures contracts, swap
agreements, option contracts, and forward contracts involving
short- and long-term purchases and sales of a physical energy
commodity.
We report the fair value of derivatives, except for those for
which the normal purchases and normal sales exception has been
elected, on the Combined Balance Sheet in derivative assets and
derivative liabilities as either current or noncurrent. We
determine the current and noncurrent classification based on the
timing of expected future cash flows of individual trades. We
report these amounts on a gross basis. Additionally, we report
cash collateral receivables and payables with our counterparties
on a gross basis.
The accounting for the changes in fair value of a commodity
derivative can be summarized as follows:
| |
|
|
|
Derivative Treatment
|
|
Accounting Method
|
|
|
|
Normal purchases and normal sales exception
|
|
Accrual accounting
|
|
Designated in a qualifying hedging relationship
|
|
Hedge accounting
|
|
All other derivatives
|
|
Mark-to-market accounting
|
F-36
WPX
Energy
Notes to
Combined Financial Statements—(Continued)
We may elect the normal purchases and normal sales exception for
certain short- and long-term purchases and sales of a physical
energy commodity. Under accrual accounting, any change in the
fair value of these derivatives is not reflected on the balance
sheet after the initial election of the exception.
We have also designated a hedging relationship for certain
commodity derivatives. For a derivative to qualify for
designation in a hedging relationship, it must meet specific
criteria and we must maintain appropriate documentation. We
establish hedging relationships pursuant to our risk management
policies. We evaluate the hedging relationships at the inception
of the hedge and on an ongoing basis to determine whether the
hedging relationship is, and is expected to remain, highly
effective in achieving offsetting changes in fair value or cash
flows attributable to the underlying risk being hedged. We also
regularly assess whether the hedged forecasted transaction is
probable of occurring. If a derivative ceases to be or is no
longer expected to be highly effective, or if we believe the
likelihood of occurrence of the hedged forecasted transaction is
no longer probable, hedge accounting is discontinued
prospectively, and future changes in the fair value of the
derivative are recognized currently in revenues or costs and
operating expenses dependent upon the underlying hedge
transaction.
For commodity derivatives designated as a cash flow hedge, the
effective portion of the change in fair value of the derivative
is reported in accumulated other comprehensive income (loss)
(“AOCI”) and reclassified into earnings in the period
in which the hedged item affects earnings. Any ineffective
portion of the derivative’s change in fair value is
recognized currently in revenues. Gains or losses deferred in
AOCI associated with terminated derivatives, derivatives that
cease to be highly effective hedges, derivatives for which the
forecasted transaction is reasonably possible but no longer
probable of occurring, and cash flow hedges that have been
otherwise discontinued remain in AOCI until the hedged item
affects earnings. If it becomes probable that the forecasted
transaction designated as the hedged item in a cash flow hedge
will not occur, any gain or loss deferred in AOCI is recognized
in revenues at that time. The change in likelihood is a
judgmental decision that includes qualitative assessments made
by management.
For commodity derivatives that are not designated in a hedging
relationship, and for which we have not elected the normal
purchases and normal sales exception, we report changes in fair
value currently in revenues dependent upon the underlying of the
hedged transaction.
Certain gains and losses on derivative instruments included in
the Combined Statement of Operations are netted together to a
single net gain or loss, while other gains and losses are
reported on a gross basis. Gains and losses recorded on a net
basis include:
|
|
|
| |
•
|
Unrealized gains and losses on all derivatives that are not
designated as hedges and for which we have not elected the
normal purchases and normal sales exception;
|
| |
| |
•
|
The ineffective portion of unrealized gains and losses on
derivatives that are designated as cash flow hedges;
|
| |
| |
•
|
Realized gains and losses on all derivatives that settle
financially;
|
| |
| |
•
|
Realized gains and losses on derivatives held for trading
purposes; and
|
| |
| |
•
|
Realized gains and losses on derivatives entered into as a
pre-contemplated buy/sell arrangement.
|
Realized gains and losses on derivatives that require physical
delivery, as well as natural gas derivatives which are not held
for trading purposes nor were entered into as a pre-contemplated
buy/sell arrangement, are recorded on a gross basis. In reaching
our conclusions on this presentation, we considered whether we
act as principal in the transaction; whether we have the risks
and rewards of ownership, including credit risk; and whether we
have latitude in establishing prices.
F-37
WPX
Energy
Notes to
Combined Financial Statements—(Continued)
Business
segment information
The Company has a single operating segment that consists of all
continuing operations, including gas management and oil and gas
production activities. An operating segment is a component of an
entity that engages in activities from which it may earn
revenues and incur expenses, and for which discrete financial
information is available and regularly reviewed by the chief
operating decision maker for the purposes of assessing
performance and allocating resources. We are controlled by
Williams and we have determined that our chief operating
decision maker is Williams’ Chief Executive Officer (who
also serves as the Chairman of our Board of Directors).
Performance evaluation and resource allocation decisions are
made by our chief operating decision maker based on financial
information presented for WPX Energy as a single operating
segment.
Oil and
gas sales revenues
Revenues for sales of natural gas, oil and condensate and
natural gas liquids are recognized when the product is sold and
delivered. Revenues from the production of natural gas in
properties for which we have an interest with other producers
are recognized based on the actual volumes sold during the
period. Any differences between volumes sold and entitlement
volumes, based on our net working interest, that are determined
to be nonrecoverable through remaining production are recognized
as accounts receivable or accounts payable, as appropriate. Our
cumulative net natural gas imbalance position based on market
prices as of December 31, 2010 and 2009 was insignificant.
Additionally, oil and gas sales revenues include hedge gains
realized on production sold of $333 million in 2010,
$615 million in 2009 and $34 million in 2008.
Gas
management revenues and expenses
Revenues for sales related to gas management activities are
recognized when the product is sold and physically delivered.
Our gas management activities to date include purchases and
subsequent sales to WPZ for fuel and shrink gas (see
Note 4). Additionally, gas management activities include
the managing of various natural gas related contracts such as
transportation, storage and related hedges. The Company also
sells natural gas purchased from working interest owners in
operated wells and other area third party producers. The
revenues and expenses related to these marketing activities are
reported on a gross basis as part of gas management revenues and
costs and expenses.
Charges for unutilized transportation capacity included in gas
management expenses were $48 million in 2010,
$21 million in 2009 and $8 million in 2008.
Capitalization
of interest
We capitalize interest during construction on projects with
construction periods of at least three months or a total
estimated project cost in excess of $1 million. The
interest rate used is the rate charged to us by Williams, based
on Williams’ average quarterly interest rate on its debt.
Income
taxes
The Company’s domestic operations are included in the
consolidated federal and state income tax returns for Williams,
except for certain separate state filings. The income tax
provision for the Company has been calculated on a separate
return basis, except for certain state and federal tax
attributes (primarily minimum tax credit carry-forwards) for
which the actual allocation (if any) cannot be determined until
the consolidated tax returns are complete for the year in which
an income tax deconsolidation event occurs. This allocation
methodology results in the recognition of deferred assets and
liabilities for the differences between the financial statement
carrying amounts and their respective tax basis, except to the
extent of deferred taxes on income considered to be permanently
reinvested in foreign jurisdictions. Deferred tax assets and
liabilities are
F-38
WPX
Energy
Notes to
Combined Financial Statements—(Continued)
measured using enacted tax rates for the years in which those
temporary differences are expected to be recovered or settled.
In addition, Williams manages its tax position based upon its
entire portfolio which may not be indicative of tax planning
strategies available to us if we were operating as an
independent company.
Employee
stock-based compensation
Certain employees providing direct service to the Company
participate in Williams’ common-stock-based awards plans.
The plans provide for Williams common-stock-based awards to both
employees and Williams’ non-management directors. The plans
permit the granting of various types of awards including, but
not limited to, stock options and restricted stock units. Awards
may be granted for no consideration other than prior and future
services or based on certain financial performance targets.
Williams charges us for compensation expense related to
stock-based compensation awards granted to our direct employees.
Stock based compensation is also a component of allocated
amounts charged to us by Williams for general and administrative
personnel providing services on our behalf.
Foreign
exchange
Translation gains and losses that arise from exchange rate
fluctuations applicable to transactions denominated in a
currency other than the United States dollar are included in the
results of operations as incurred.
Earnings
(loss) per share
Historical earnings per share are not presented since the
Company’s common stock was not part of the capital
structure of Williams for the periods presented.
Unaudited
Supplemental Pro forma combined loss per share
Basic and diluted pro forma combined loss per share for the year
ended December 31, 2010 were calculated using the assumed
issuance
of
Class A common shares from the Offering, and the assumed
issuance
of
Class B common shares to Williams in exchange for all of
the net assets contributed to us by Williams. Additionally, for
purposes of calculating basic and diluted pro forma combined
loss per share, our historical net loss was further increased by
$88 million to reflect incremental interest expense (net of
tax) related to the portion of the $1,678 million
distribution that exceeds the proceeds from the Offering and our
earnings for the previous twelve months.
|
|
|
2.
|
Restatement
of Prior Periods
|
In the first quarter of 2011, we determined that for the years
ended December 31, 2010, 2009 and 2008, we had failed to
properly accrue estimates of the minimum annual volumetric
throughput requirements associated with certain of our
compression services agreements. As a result of this error, our
costs and expenses were understated by $3 million,
$5 million and $6 million for the years ended
December 31, 2010, 2009 and 2008, respectively. Based on
guidance set forth in Staff Accounting
Bulletin No. 99, “Materiality” and in
Staff Accounting Bulletin No. 108,
“Considering the Effects of Prior Year Misstatements
when Quantifying Misstatements in Current Year Financial
Statements,” (“SAB 108”), we have
determined that these amounts are immaterial to each of the
periods affected and, therefore, we are not required to amend
our previously filed reports. However, if these adjustments were
recorded in 2011, we believe the impact could be material to
this reporting period. As a result, we have adjusted, in the
tables below, our previously reported results for the years
ended December 31, 2010, 2009 and 2008 for these amounts as
required by SAB 108. In addition to recording the
obligations associated with the minimum annual volumetric
throughput requirements previously discussed, we have made five
other immaterial adjustments to prior year amounts as follows:
(1) oil and gas sales revenue decrease of $3 million
and $2 million for additional royalties expected to be
paid for
F-39
WPX
Energy
Notes to
Combined Financial Statements—(Continued)
the years ended December 31, 2010 and 2009, respectively;
(2) gas management revenue decrease of $3 million for
natural gas measurement adjustments related to the year ended
December 31, 2008; (3) gas management expense decrease
of $3 million and $1 million for adjustments made under gas
purchase agreements for the years ended December 31, 2010
and 2009, respectively; (4) depreciation, depletion and
amortization expense increase of $1 million related to the
year ended December 31, 2010; and (5) bad debt expense
increase of $1 million related the year ended
December 31, 2010.
| |
|
|
|
|
|
|
|
|
|
|
|
|
|
|
|
|
|
|
|
|
|
|
|
|
|
|
|
|
|
|
|
|
|
|
|
|
|
|
|
Year Ended
|
|
|
Year Ended
|
|
|
Year Ended
|
|
|
|
|
December 31, 2010
|
|
|
December 31, 2009
|
|
|
December 31, 2008
|
|
|
|
|
Previously
|
|
|
|
|
|
As
|
|
|
Previously
|
|
|
|
|
|
As
|
|
|
Previously
|
|
|
|
|
|
As
|
|
|
|
|
Reported(1)
|
|
|
Adjustments
|
|
|
Adjusted
|
|
|
Reported(1)
|
|
|
Adjustments
|
|
|
Adjusted
|
|
|
Reported(1)
|
|
|
Adjustments
|
|
|
Adjusted
|
|
|
|
|
Revenues:
|
|
|
|
|
|
|
|
|
|
|
|
|
|
|
|
|
|
|
|
|
|
|
|
|
|
|
|
|
|
|
|
|
|
|
|
|
|
Oil and gas sales, including affiliate
|
|
$
|
2,228
|
|
|
$
|
(3
|
)
|
|
$
|
2,225
|
|
|
$
|
2,170
|
|
|
$
|
(2
|
)
|
|
$
|
2,168
|
|
|
$
|
2,882
|
|
|
$
|
—
|
|
|
$
|
2,882
|
|
|
Gas management, including affiliate
|
|
|
1,742
|
|
|
|
—
|
|
|
|
1,742
|
|
|
|
1,456
|
|
|
|
—
|
|
|
|
1,456
|
|
|
|
3,244
|
|
|
|
(3
|
)
|
|
|
3,241
|
|
|
Hedge ineffectiveness and mark to market gains and losses
|
|
|
27
|
|
|
|
—
|
|
|
|
27
|
|
|
|
18
|
|
|
|
—
|
|
|
|
18
|
|
|
|
29
|
|
|
|
—
|
|
|
|
29
|
|
|
Other
|
|
|
40
|
|
|
|
—
|
|
|
|
40
|
|
|
|
39
|
|
|
|
—
|
|
|
|
39
|
|
|
|
32
|
|
|
|
—
|
|
|
|
32
|
|
|
|
|
|
|
|
|
|
|
|
|
|
|
|
|
|
|
|
|
|
|
|
|
|
|
|
|
|
|
|
|
|
|
|
|
|
|
|
|
Total revenues
|
|
|
4,037
|
|
|
|
(3
|
)
|
|
|
4,034
|
|
|
|
3,683
|
|
|
|
(2
|
)
|
|
|
3,681
|
|
|
|
6,187
|
|
|
|
(3
|
)
|
|
|
6,184
|
|
|
Costs and expenses:
|
|
|
|
|
|
|
|
|
|
|
|
|
|
|
|
|
|
|
|
|
|
|
|
|
|
|
|
|
|
|
|
|
|
|
|
|
|
Lease and facility operating, including affiliate
|
|
|
286
|
|
|
|
—
|
|
|
|
286
|
|
|
|
263
|
|
|
|
—
|
|
|
|
263
|
|
|
|
272
|
|
|
|
—
|
|
|
|
272
|
|
|
Gathering, processing and transportation, including affiliate
|
|
|
323
|
|
|
|
3
|
|
|
|
326
|
|
|
|
268
|
|
|
|
5
|
|
|
|
273
|
|
|
|
223
|
|
|
|
6
|
|
|
|
229
|
|
|
Taxes other than income
|
|
|
125
|
|
|
|
—
|
|
|
|
125
|
|
|
|
93
|
|
|
|
—
|
|
|
|
93
|
|
|
|
254
|
|
|
|
—
|
|
|
|
254
|
|
|
|
|
|
|
|
|
|
|
|
|
|
|
|
|
|
|
|
|
|
|
|
|
|
|
|
|
|
|
|
|
|
|
|
|
|
|
|
|
Gas management (including charges for unutilized pipeline
capacity)
|
|
|
1,774
|
|
|
|
(3
|
)
|
|
|
1,771
|
|
|
|
1,496
|
|
|
|
(1
|
)
|
|
|
1,495
|
|
|
|
3,248
|
|
|
|
—
|
|
|
|
3,248
|
|
|
Exploration
|
|
|
73
|
|
|
|
—
|
|
|
|
73
|
|
|
|
54
|
|
|
|
—
|
|
|
|
54
|
|
|
|
37
|
|
|
|
—
|
|
|
|
37
|
|
|
Depreciation, depletion and amortization
|
|
|
874
|
|
|
|
1
|
|
|
|
875
|
|
|
|
887
|
|
|
|
—
|
|
|
|
887
|
|
|
|
738
|
|
|
|
—
|
|
|
|
738
|
|
|
Impairment of producing properties and costs of acquired
unproved reserves
|
|
|
678
|
|
|
|
—
|
|
|
|
678
|
|
|
|
15
|
|
|
|
—
|
|
|
|
15
|
|
|
|
—
|
|
|
|
—
|
|
|
|
—
|
|
|
|
|
|
|
|
|
|
|
|
|
|
|
|
|
|
|
|
|
|
|
|
|
|
|
|
|
|
|
|
|
|
|
|
|
|
|
|
|
Goodwill impairment
|
|
|
1,003
|
|
|
|
—
|
|
|
|
1,003
|
|
|
|
—
|
|
|
|
—
|
|
|
|
—
|
|
|
|
—
|
|
|
|
—
|
|
|
|
—
|
|
|
General and administrative, including affiliate
|
|
|
252
|
|
|
|
1
|
|
|
|
253
|
|
|
|
251
|
|
|
|
—
|
|
|
|
251
|
|
|
|
247
|
|
|
|
—
|
|
|
|
247
|
|
|
Gain on sale of contractual right to international production
payment
|
|
|
—
|
|
|
|
—
|
|
|
|
—
|
|
|
|
—
|
|
|
|
—
|
|
|
|
—
|
|
|
|
(148
|
)
|
|
|
—
|
|
|
|
(148
|
)
|
|
Other—net
|
|
|
(19
|
)
|
|
|
—
|
|
|
|
(19
|
)
|
|
|
33
|
|
|
|
—
|
|
|
|
33
|
|
|
|
6
|
|
|
|
—
|
|
|
|
6
|
|
|
|
|
|
|
|
|
|
|
|
|
|
|
|
|
|
|
|
|
|
|
|
|
|
|
|
|
|
|
|
|
|
|
|
|
|
|
|
|
Total costs and expenses
|
|
|
5,369
|
|
|
|
2
|
|
|
|
5,371
|
|
|
|
3,360
|
|
|
|
4
|
|
|
|
3,364
|
|
|
|
4,877
|
|
|
|
6
|
|
|
|
4,883
|
|
|
|
|
|
|
|
|
|
|
|
|
|
|
|
|
|
|
|
|
|
|
|
|
|
|
|
|
|
|
|
|
|
|
|
|
|
|
|
|
Operating income (loss)
|
|
|
(1,332
|
)
|
|
|
(5
|
)
|
|
|
(1,337
|
)
|
|
|
323
|
|
|
|
(6
|
)
|
|
|
317
|
|
|
|
1,310
|
|
|
|
(9
|
)
|
|
|
1,301
|
|
|
Interest expense, including affiliate
|
|
|
(124
|
)
|
|
|
—
|
|
|
|
(124
|
)
|
|
|
(100
|
)
|
|
|
—
|
|
|
|
(100
|
)
|
|
|
(74
|
)
|
|
|
—
|
|
|
|
(74
|
)
|
|
Interest capitalized
|
|
|
16
|
|
|
|
—
|
|
|
|
16
|
|
|
|
18
|
|
|
|
—
|
|
|
|
18
|
|
|
|
20
|
|
|
|
—
|
|
|
|
20
|
|
|
Investment income and other
|
|
|
21
|
|
|
|
—
|
|
|
|
21
|
|
|
|
8
|
|
|
|
—
|
|
|
|
8
|
|
|
|
22
|
|
|
|
—
|
|
|
|
22
|
|
|
|
|
|
|
|
|
|
|
|
|
|
|
|
|
|
|
|
|
|
|
|
|
|
|
|
|
|
|
|
|
|
|
|
|
|
|
|
|
Income (loss) before income taxes
|
|
|
(1,419
|
)
|
|
|
(5
|
)
|
|
|
(1,424
|
)
|
|
|
249
|
|
|
|
(6
|
)
|
|
|
243
|
|
|
|
1,278
|
|
|
|
(9
|
)
|
|
|
1,269
|
|
|
Provision (benefit) for income taxes
|
|
|
(148
|
)
|
|
|
(2
|
)
|
|
|
(150
|
)
|
|
|
96
|
|
|
|
(2
|
)
|
|
|
94
|
|
|
|
455
|
|
|
|
(3
|
)
|
|
|
452
|
|
|
|
|
|
|
|
|
|
|
|
|
|
|
|
|
|
|
|
|
|
|
|
|
|
|
|
|
|
|
|
|
|
|
|
|
|
|
|
|
Income (loss) from continuing operations
|
|
|
(1,271
|
)
|
|
|
(3
|
)
|
|
|
(1,274
|
)
|
|
|
153
|
|
|
|
(4
|
)
|
|
|
149
|
|
|
|
823
|
|
|
|
(6
|
)
|
|
|
817
|
|
|
Loss from discontinued operations
|
|
|
(8
|
)
|
|
|
—
|
|
|
|
(8
|
)
|
|
|
(7
|
)
|
|
|
—
|
|
|
|
(7
|
)
|
|
|
(87
|
)
|
|
|
—
|
|
|
|
(87
|
)
|
|
|
|
|
|
|
|
|
|
|
|
|
|
|
|
|
|
|
|
|
|
|
|
|
|
|
|
|
|
|
|
|
|
|
|
|
|
|
|
Net income (loss)
|
|
|
(1,279
|
)
|
|
|
(3
|
)
|
|
|
(1,282
|
)
|
|
|
146
|
|
|
|
(4
|
)
|
|
|
142
|
|
|
|
736
|
|
|
|
(6
|
)
|
|
|
730
|
|
|
Less: Net income attributable to noncontrolling interests
|
|
|
8
|
|
|
|
—
|
|
|
|
8
|
|
|
|
6
|
|
|
|
—
|
|
|
|
6
|
|
|
|
8
|
|
|
|
—
|
|
|
|
8
|
|
|
|
|
|
|
|
|
|
|
|
|
|
|
|
|
|
|
|
|
|
|
|
|
|
|
|
|
|
|
|
|
|
|
|
|
|
|
|
|
Net income (loss) attributable to WPX Energy
|
|
$
|
(1,287
|
)
|
|
$
|
(3
|
)
|
|
$
|
(1,290
|
)
|
|
$
|
140
|
|
|
$
|
(4
|
)
|
|
$
|
136
|
|
|
$
|
728
|
|
|
$
|
(6
|
)
|
|
$
|
722
|
|
|
|
|
|
|
|
|
|
|
|
|
|
|
|
|
|
|
|
|
|
|
|
|
|
|
|
|
|
|
|
|
|
|
|
|
|
|
|
|
|
|
|
(1) |
|
Includes reclassifications made to report the results of
operations of our Arkoma properties as discontinued operations
(See Note 1). |
F-40
WPX
Energy
Notes to
Combined Financial Statements—(Continued)
| |
|
|
|
|
|
|
|
|
|
|
|
|
|
|
|
|
|
|
|
|
|
|
|
|
|
|
|
December 31, 2010
|
|
|
December 31, 2009
|
|
|
|
|
Previously
|
|
|
|
|
|
As
|
|
|
Previously
|
|
|
|
|
|
As
|
|
|
|
|
Reported(1)
|
|
|
Adjustments
|
|
|
Adjusted
|
|
|
Reported(1)
|
|
|
Adjustments
|
|
|
Adjusted
|
|
|
|
|
Assets
|
|
|
|
|
|
|
|
|
|
|
|
|
|
|
|
|
|
|
|
|
|
|
|
|
|
Current assets:
|
|
|
|
|
|
|
|
|
|
|
|
|
|
|
|
|
|
|
|
|
|
|
|
|
|
Cash and cash equivalents
|
|
$
|
37
|
|
|
$
|
—
|
|
|
$
|
37
|
|
|
$
|
34
|
|
|
$
|
—
|
|
|
$
|
34
|
|
|
Accounts receivable:
|
|
|
|
|
|
|
|
|
|
|
|
|
|
|
|
|
|
|
|
|
|
|
|
|
|
Trade, net of allowance for doubtful accounts of $15 and $19 as
of December 31, 2010 and 2009, respectively
|
|
|
362
|
|
|
|
—
|
|
|
|
362
|
|
|
|
361
|
|
|
|
(2
|
)
|
|
|
359
|
|
|
Affiliate
|
|
|
60
|
|
|
|
—
|
|
|
|
60
|
|
|
|
54
|
|
|
|
—
|
|
|
|
54
|
|
|
Derivative assets
|
|
|
400
|
|
|
|
—
|
|
|
|
400
|
|
|
|
650
|
|
|
|
—
|
|
|
|
650
|
|
|
Inventories
|
|
|
77
|
|
|
|
—
|
|
|
|
77
|
|
|
|
61
|
|
|
|
—
|
|
|
|
61
|
|
|
Other
|
|
|
22
|
|
|
|
—
|
|
|
|
22
|
|
|
|
41
|
|
|
|
—
|
|
|
|
41
|
|
|
|
|
|
|
|
|
|
|
|
|
|
|
|
|
|
|
|
|
|
|
|
|
|
|
|
|
Total current assets
|
|
|
958
|
|
|
|
—
|
|
|
|
958
|
|
|
|
1,201
|
|
|
|
(2
|
)
|
|
|
1,199
|
|
|
Investments
|
|
|
105
|
|
|
|
—
|
|
|
|
105
|
|
|
|
95
|
|
|
|
—
|
|
|
|
95
|
|
|
Properties and equipment, net (successful efforts method of
accounting)
|
|
|
8,450
|
|
|
|
(1
|
)
|
|
|
8,449
|
|
|
|
7,662
|
|
|
|
—
|
|
|
|
7,662
|
|
|
Derivative assets
|
|
|
173
|
|
|
|
—
|
|
|
|
173
|
|
|
|
444
|
|
|
|
—
|
|
|
|
444
|
|
|
Goodwill, net
|
|
|
—
|
|
|
|
—
|
|
|
|
—
|
|
|
|
1,003
|
|
|
|
—
|
|
|
|
1,003
|
|
|
Other noncurrent assets
|
|
|
161
|
|
|
|
—
|
|
|
|
161
|
|
|
|
150
|
|
|
|
—
|
|
|
|
150
|
|
|
|
|
|
|
|
|
|
|
|
|
|
|
|
|
|
|
|
|
|
|
|
|
|
|
|
|
Total assets
|
|
$
|
9,847
|
|
|
$
|
(1
|
)
|
|
$
|
9,846
|
|
|
$
|
10,555
|
|
|
$
|
(2
|
)
|
|
$
|
10,553
|
|
|
|
|
|
|
|
|
|
|
|
|
|
|
|
|
|
|
|
|
|
|
|
|
|
|
|
|
|
|
|
|
|
|
|
|
|
|
|
|
|
|
|
|
|
|
|
|
|
|
|
|
|
|
Liabilities and Equity
|
|
|
|
|
|
|
|
|
|
|
|
|
|
|
|
|
|
|
|
|
|
|
|
|
|
Current liabilities:
|
|
|
|
|
|
|
|
|
|
|
|
|
|
|
|
|
|
|
|
|
|
|
|
|
|
Accounts payable:
|
|
|
|
|
|
|
|
|
|
|
|
|
|
|
|
|
|
|
|
|
|
|
|
|
|
Trade
|
|
$
|
446
|
|
|
$
|
5
|
|
|
$
|
451
|
|
|
$
|
460
|
|
|
$
|
2
|
|
|
$
|
462
|
|
|
Affiliate
|
|
|
64
|
|
|
|
—
|
|
|
|
64
|
|
|
|
37
|
|
|
|
—
|
|
|
|
37
|
|
|
Accrued and other current liabilities
|
|
|
144
|
|
|
|
14
|
|
|
|
158
|
|
|
|
220
|
|
|
|
11
|
|
|
|
231
|
|
|
Deferred income taxes
|
|
|
87
|
|
|
|
—
|
|
|
|
87
|
|
|
|
28
|
|
|
|
—
|
|
|
|
28
|
|
|
Notes payable to Williams
|
|
|
2,261
|
|
|
|
—
|
|
|
|
2,261
|
|
|
|
1,216
|
|
|
|
—
|
|
|
|
1,216
|
|
|
Derivative liabilities
|
|
|
146
|
|
|
|
—
|
|
|
|
146
|
|
|
|
578
|
|
|
|
—
|
|
|
|
578
|
|
|
|
|
|
|
|
|
|
|
|
|
|
|
|
|
|
|
|
|
|
|
|
|
|
|
|
|
Total current liabilities
|
|
|
3,148
|
|
|
|
19
|
|
|
|
3,167
|
|
|
|
2,539
|
|
|
|
13
|
|
|
|
2,552
|
|
|
Deferred income taxes
|
|
|
1,629
|
|
|
|
—
|
|
|
|
1,629
|
|
|
|
1,841
|
|
|
|
—
|
|
|
|
1,841
|
|
|
Derivative liabilities
|
|
|
143
|
|
|
|
—
|
|
|
|
143
|
|
|
|
428
|
|
|
|
—
|
|
|
|
428
|
|
|
Asset retirement obligations
|
|
|
282
|
|
|
|
—
|
|
|
|
282
|
|
|
|
235
|
|
|
|
—
|
|
|
|
235
|
|
|
Other noncurrent liabilities
|
|
|
125
|
|
|
|
—
|
|
|
|
125
|
|
|
|
92
|
|
|
|
—
|
|
|
|
92
|
|
|
|
|
|
|
|
|
|
|
|
|
|
|
|
|
|
|
|
|
|
|
|
|
|
|
|
|
Contingent liabilities and commitments (Note 11)
|
|
|
|
|
|
|
|
|
|
|
|
|
|
|
|
|
|
|
|
|
|
|
|
|
|
|
|
|
|
|
|
|
|
|
|
|
|
|
|
|
|
|
|
|
|
|
|
|
|
|
|
Equity:
|
|
|
|
|
|
|
|
|
|
|
|
|
|
|
|
|
|
|
|
|
|
|
|
|
|
Owner’s net equity:
|
|
|
|
|
|
|
|
|
|
|
|
|
|
|
|
|
|
|
|
|
|
|
|
|
|
Owner’s net investment
|
|
|
4,280
|
|
|
|
(20
|
)
|
|
|
4,260
|
|
|
|
5,284
|
|
|
|
(15
|
)
|
|
|
5,269
|
|
|
Accumulated other comprehensive income
|
|
|
168
|
|
|
|
—
|
|
|
|
168
|
|
|
|
72
|
|
|
|
—
|
|
|
|
72
|
|
|
|
|
|
|
|
|
|
|
|
|
|
|
|
|
|
|
|
|
|
|
|
|
|
|
|
|
Total owner’s net equity
|
|
|
4,448
|
|
|
|
(20
|
)
|
|
|
4,428
|
|
|
|
5,356
|
|
|
|
(15
|
)
|
|
|
5,341
|
|
|
Noncontrolling interests in combined subsidiaries
|
|
|
72
|
|
|
|
—
|
|
|
|
72
|
|
|
|
64
|
|
|
|
—
|
|
|
|
64
|
|
|
|
|
|
|
|
|
|
|
|
|
|
|
|
|
|
|
|
|
|
|
|
|
|
|
|
|
Total equity
|
|
|
4,520
|
|
|
|
(20
|
)
|
|
|
4,500
|
|
|
|
5,420
|
|
|
|
(15
|
)
|
|
|
5,405
|
|
|
|
|
|
|
|
|
|
|
|
|
|
|
|
|
|
|
|
|
|
|
|
|
|
|
|
|
Total liabilities and equity
|
|
$
|
9,847
|
|
|
$
|
(1
|
)
|
|
$
|
9,846
|
|
|
|
10,555
|
|
|
$
|
(2
|
)
|
|
|
10,553
|
|
|
|
|
|
|
|
|
|
|
|
|
|
|
|
|
|
|
|
|
|
|
|
|
|
|
|
|
|
|
|
(1) |
|
Includes reclassifications made to report the financial position
of our Arkoma properties as held for sale (See Note 1). |
F-41
WPX
Energy
Notes to
Combined Financial Statements—(Continued)
|
|
|
3.
|
Discontinued
Operations
|
Summarized
Results of Discontinued Operations
| |
|
|
|
|
|
|
|
|
|
|
|
|
|
|
|
2010
|
|
|
2009
|
|
|
2008
|
|
|
|
|
Revenues
|
|
$
|
16
|
|
|
$
|
17
|
|
|
$
|
43
|
|
|
|
|
|
|
|
|
|
|
|
|
|
|
|
|
Income (loss) from discontinued operations before impairments,
gain on sale and income taxes
|
|
$
|
(13
|
)
|
|
$
|
(11
|
)
|
|
$
|
4
|
|
|
(Impairments) and gain on sale
|
|
|
—
|
|
|
|
—
|
|
|
|
(140
|
)
|
|
Benefit for income taxes
|
|
|
5
|
|
|
|
4
|
|
|
|
49
|
|
|
|
|
|
|
|
|
|
|
|
|
|
|
|
|
Loss from discontinued operations
|
|
$
|
(8
|
)
|
|
$
|
(7
|
)
|
|
$
|
(87
|
)
|
|
|
|
|
|
|
|
|
|
|
|
|
|
|
(Impairments) and gain on sale for 2008 includes
$148 million of impairments related to properties in the
Arkoma Basin and the final proceeds from the 2007 sale of
Williams’ former power business.
The assets of our holdings in the Arkoma Basin comprise
significantly less than 1% of our total assets as of
December 31, 2010 and 2009 and are reported in other assets
and other noncurrent assets on our Combined Balance Sheet.
Liabilities of our discontinued operations are insignificant for
these periods.
|
|
|
4.
|
Related
Party Transactions
|
Transactions
with Williams and Other Affiliated Entities
Our employees are also employees of Williams. Williams charges
us for the payroll and benefit costs associated with operations
employees (referred to as direct employees) and carries the
obligations for many employee-related benefits in its financial
statements, including the liabilities related to employee
retirement and medical plans. Our share of those costs is
charged to us through affiliate billings and reflected in lease
and facility operating and general and administrative within
costs and expenses in the accompanying Combined Statement of
Operations.
In addition, Williams charges us for certain employees of
Williams who provide general and administrative services on our
behalf (referred to as indirect employees). These charges are
either directly identifiable or allocated to our operations.
Direct charges include goods and services provided by Williams
at our request. Allocated general corporate costs are based on
our relative usage of the service or on a three-factor formula,
which considers revenues; properties and equipment; and payroll.
Our share of direct general and administrative expenses and our
share of allocated general corporate expenses is reflected in
general and administrative expense in the accompanying Combined
Statement of Operations. In management’s estimation, the
allocation methodologies used are reasonable and result in a
reasonable allocation to us of our costs of doing business
incurred by Williams. We also have operating activities with WPZ
and another Williams subsidiary. Our revenues include revenues
from the following types of transactions:
|
|
|
| |
•
|
Sales of natural gas liquids (NGLs) related to our production to
WPZ at market prices at the time of sale and included within our
oil and gas sales revenues; and
|
| |
| |
•
|
Sale to WPZ and another Williams subsidiary of natural gas
procured by Williams Gas Marketing Services for those
companies’ fuel and shrink replacement at market prices at
the time of sale and included in our gas management revenues.
|
Our costs and operating expenses include the following services
provided by WPZ:
|
|
|
| |
•
|
Gathering, treating and processing services under several
contracts for our production primarily in the San Juan and
Piceance Basins; and
|
F-42
WPX
Energy
Notes to
Combined Financial Statements—(Continued)
|
|
|
| |
•
|
Pipeline transportation for both our oil and gas sales and gas
management activities which includes commitments totaling
$442 million (see Note 11 for capacity commitments
with affiliates).
|
In addition, through an agency agreement, we manage the
jurisdictional merchant gas sales for Transcontinental Gas Pipe
Line Company LLC (“Transco”), an indirect, wholly
owned subsidiary of WPZ. We are authorized to make gas sales on
Transco’s behalf in order to manage its gas purchase
obligations. Although there is no exchange of payments between
us and Transco for these transactions, we receive all margins
associated with jurisdictional merchant gas sales business and,
as Transco’s agent, assume all market and credit risk
associated with such sales. Gas sales and purchases related to
our management of these jurisdictional merchant gas sales are
included in gas management revenues and expenses, respectively
in the Combined Statement of Operations and the margins we
realized related to these activities totaled less than
$1 million in each of the years ended December 31,
2010, 2009 and 2008.
We manage a transportation capacity contract for WPZ. To the
extent the transportation is not fully utilized or does not
recover full-rate demand expense, WPZ reimburses us for these
transportation costs. These reimbursements to us totaled
approximately $10 million, $9 million and
$11 million for the years ended December 31, 2010,
2009 and 2008, respectively, and are included in gas management
revenues.
WPZ periodically enters into derivative contracts with us to
hedge their forecasted NGL sales and natural gas purchases. We
enter into offsetting derivative contracts with third parties at
equivalent pricing and volumes. These contracts are included in
derivative assets and liabilities on the Combined Balance Sheet
(see Note 15).
Williams utilizes a centralized approach to cash management and
the financing of its businesses. Cash receipts from the
Company’s domestic operations are transferred to Williams
on a regular basis and cleared through unsecured promissory note
agreements with Williams. Cash expenditures for property
operating and development costs and expenses are also cleared
through these unsecured promissory note agreements with
Williams. The amounts receivable or due under the note
agreements are due on demand, however, Williams has agreed to
not make demand on these notes payable prior to the completion
of the Offering. Williams has also agreed to forgive or
contribute any amounts outstanding on these note agreements
prior to or concurrent with the Contribution. The notes bear
interest based on Williams’ weighted average cost of debt
and such interest is added monthly to the note principal. The
interest rate for the notes payable to Williams was 8.08% and
8.01% at December 31, 2010 and 2009, respectively. As of
December 31, 2010 and 2009, our net amounts due to Williams
are reflected as notes payable to Williams. None of
Williams’ cash or debt at the Williams corporate level has
been allocated to the Company in the financial statements.
Changes in the notes represent any funding required from
Williams for working capital, acquisitions or capital
expenditures and after giving effect to the Company’s
transfers to Williams from its cash flows from operations or
proceeds from sales of assets. Concurrently with or shortly
following the consummation of the Offering, we expect to issue
up to $1.5 billion aggregate principal amount of senior
unsecured notes. Furthermore, we expect to distribute the net
proceeds from the Offering and the issuance of the notes in
excess of approximately $500 million to Williams.
Under Williams’ cash-management system, certain cash
accounts reflect negative balances to the extent checks written
have not been presented for payment. These negative amounts
represent obligations and have been reclassified to accounts
payable-affiliate. Accounts payable-affiliate includes
approximately $38 million and $26 million of these
negative balances at December 31, 2010 and 2009,
respectively.
F-43
WPX
Energy
Notes to
Combined Financial Statements—(Continued)
Below is a summary of the related party transactions discussed
above:
| |
|
|
|
|
|
|
|
|
|
|
|
|
|
|
|
2010
|
|
|
2009
|
|
|
2008
|
|
|
|
|
(Millions)
|
|
|
|
|
Oil and gas sales revenues—sales of NGLs to WPZ
|
|
$
|
277
|
|
|
$
|
116
|
|
|
$
|
36
|
|
|
Gas management revenues—sales of natural gas for fuel and
shrink to WPZ and another Williams subsidiary
|
|
|
509
|
|
|
|
431
|
|
|
|
1,042
|
|
|
Lease and facility operating expenses from Williams-direct
employee salary and benefit costs
|
|
|
23
|
|
|
|
23
|
|
|
|
19
|
|
|
Gathering, processing and transportation expense from
|
|
|
|
|
|
|
|
|
|
|
|
|
|
WPZ:
|
|
|
|
|
|
|
|
|
|
|
|
|
|
Gathering and processing
|
|
|
163
|
|
|
|
72
|
|
|
|
44
|
|
|
Transportation
|
|
|
25
|
|
|
|
28
|
|
|
|
34
|
|
|
General and administrative from Williams:
|
|
|
|
|
|
|
|
|
|
|
|
|
|
Direct employee salary and benefit costs
|
|
|
102
|
|
|
|
100
|
|
|
|
92
|
|
|
Charges for general and administrative services
|
|
|
58
|
|
|
|
60
|
|
|
|
60
|
|
|
Allocated general corporate costs
|
|
|
64
|
|
|
|
63
|
|
|
|
56
|
|
|
Other
|
|
|
12
|
|
|
|
13
|
|
|
|
12
|
|
|
Interest expense on notes payable to Williams
|
|
|
119
|
|
|
|
92
|
|
|
|
64
|
|
In addition, the current amount due to or from affiliates
consists of normal course receivables and payables resulting
from the sale of products to and cost of gathering services
provided by WPZ. Below is a summary of these payables and
receivables which are settled monthly:
| |
|
|
|
|
|
|
|
|
|
|
|
December 31,
|
|
|
|
|
2010
|
|
|
2009
|
|
|
|
|
(Millions)
|
|
|
|
|
Current:
|
|
|
|
|
|
|
|
|
|
Accounts receivable:
|
|
|
|
|
|
|
|
|
|
Due from WPZ and another Williams subsidiary
|
|
$
|
60
|
|
|
$
|
54
|
|
|
|
|
|
|
|
|
|
|
|
|
Accounts payable:
|
|
|
|
|
|
|
|
|
|
Due to WPZ
|
|
$
|
12
|
|
|
$
|
2
|
|
|
Due to Williams for cash overdraft.
|
|
|
38
|
|
|
|
26
|
|
|
Due to Williams for accrued payroll and benefits
|
|
|
14
|
|
|
|
9
|
|
|
|
|
|
|
|
|
|
|
|
|
|
|
$
|
64
|
|
|
$
|
37
|
|
|
|
|
|
|
|
|
|
|
|
As discussed in Note 1, the Company sold certain gathering
and processing assets in Colorado’s Piceance Basin to WPZ.
Under an Omnibus Agreement entered into in connection with this
transaction, we are obligated to reimburse WPZ for
(i) amounts incurred by WPZ or its subsidiaries for any
costs required to complete the pipeline and compression projects
known collectively as the Ryan Gulch Expansion Project,
(ii) amounts incurred by WPZ or its subsidiaries prior to
January 31, 2011, related to the development of a cryogenic
processing arrangement with a subsidiary of Williams, up to
$20 million, and (iii) amounts incurred by WPZ or its
subsidiaries for notice of violation or enforcement actions
related to compression station land use permits or other losses,
costs and expenses related to certain surface lease use
agreements. In addition, WPZ is obligated to reimburse us for
any costs related to the pipeline and compression projects known
collectively as the Kokopelli Expansion irrespective of whether
those costs were incurred prior to the effective date of the
transaction. Estimated amounts for these obligations were
recorded at the time of the sale and were less than
$5 million. Differences in the estimated amounts and actual
payments will be reflected within
F-44
WPX
Energy
Notes to
Combined Financial Statements—(Continued)
Owner’s Net Investment consistent with the treatment of the
difference in the net book value and proceeds from sale.
|
|
|
5.
|
Investment
Income and Other
|
Investment income and other for the years ended
December 31, 2010, 2009 and 2008, is as follows:
| |
|
|
|
|
|
|
|
|
|
|
|
|
|
|
|
Years Ended December 31,
|
|
|
|
|
2010
|
|
|
2009
|
|
|
2008
|
|
|
|
|
(Millions)
|
|
|
|
|
Equity earnings
|
|
$
|
20
|
|
|
$
|
18
|
|
|
$
|
20
|
|
|
Impairment of cost-based investment
|
|
|
—
|
|
|
|
(11
|
)
|
|
|
—
|
|
|
Other
|
|
|
1
|
|
|
|
1
|
|
|
|
2
|
|
|
|
|
|
|
|
|
|
|
|
|
|
|
|
|
Total investment income and other
|
|
$
|
21
|
|
|
$
|
8
|
|
|
$
|
22
|
|
|
|
|
|
|
|
|
|
|
|
|
|
|
|
Impairment of cost-based investment in 2009 reflects an
$11 million full impairment of our 4 percent interest
in a Venezuelan corporation that owns and operates oil and gas
activities in Venezuela.
Investments
Investment balance as of December 31, 2010 and 2009 is as
follows:
| |
|
|
|
|
|
|
|
|
|
|
|
December 31,
|
|
|
|
|
2010
|
|
|
2009
|
|
|
|
|
(Millions)
|
|
|
|
|
Petrolera Entre Lomas S.A.—40.8%
|
|
$
|
82
|
|
|
$
|
81
|
|
|
Other
|
|
|
23
|
|
|
|
14
|
|
|
|
|
|
|
|
|
|
|
|
|
|
|
$
|
105
|
|
|
$
|
95
|
|
|
|
|
|
|
|
|
|
|
|
Dividends and distributions received from companies accounted
for by the equity method were $19 million in 2010,
$9 million in 2009 and $11 million in 2008.
|
|
|
6.
|
Asset
Sales, Impairments, Exploration Expenses and Other
Accruals
|
The following table presents a summary of significant gains or
losses reflected in impairment of producing properties and costs
of acquired unproved reserves, goodwill impairment and
other—net within costs and expenses:
| |
|
|
|
|
|
|
|
|
|
|
|
|
|
|
|
Years Ended December 31,
|
|
|
|
|
2010
|
|
|
2009
|
|
|
2008
|
|
|
|
|
(Millions)
|
|
|
|
|
Goodwill impairment
|
|
$
|
1,003
|
|
|
$
|
—
|
|
|
$
|
—
|
|
|
Impairment of producing properties and costs of acquired
unproved reserves*
|
|
|
678
|
|
|
|
15
|
|
|
|
—
|
|
|
Penalties from early release of drilling rigs included in other
(income) expense—net
|
|
|
—
|
|
|
|
32
|
|
|
|
—
|
|
|
Gain on sale of contractual right to an international production
payment
|
|
|
—
|
|
|
|
—
|
|
|
|
(148
|
)
|
|
(Gain) loss on sales of other assets
|
|
|
(22
|
)
|
|
|
1
|
|
|
|
1
|
|
|
|
|
|
* |
|
Excludes unproved leasehold property impairment, amortization
and expiration included in exploration expenses. |
F-45
WPX
Energy
Notes to
Combined Financial Statements—(Continued)
As a result of significant declines in forward natural gas
prices during 2010, we performed an interim impairment
assessment of our capitalized costs related to goodwill and
domestic producing properties. As a result of these assessments,
we recorded an impairment of goodwill, as noted above, and
impairments of our capitalized costs of certain natural gas
producing properties in the Barnett Shale of $503 million
and capitalized costs of certain acquired unproved reserves in
the Piceance Highlands acquired in 2008 of $175 million
(see Note 14).
Based on a comparison of the estimated fair value to the
carrying value, we recorded a $15 million impairment in
2009 related to costs of acquired unproved reserves resulting
from a 2008 acquisition in the Fort Worth Basin (see
Note 14).
Our impairment analyses included an assessment of undiscounted
(except for the costs of acquired unproved reserves) and
discounted future cash flows, which considered information
obtained from drilling, other activities, and natural gas
reserve quantities.
In July 2010, we sold a portion of our gathering and processing
facilities in the Piceance Basin to a third party for cash
proceeds of $30 million resulting in a gain of
$12 million. The remaining portion of the facilities was
part of the Piceance Sale (see Note 1). Also in 2010, we
exchanged undeveloped leasehold acreage in different areas with
a third party resulting in a $7 million gain.
In January 2008, we sold a contractual right to a production
payment on certain future international hydrocarbon production
for $148 million. We obtained this interest (for which we
allocated no value) through the acquisition of Barrett Resources
Corporation in 2001 and there were no operations associated with
this interest. As a result of the contract termination, we have
no further interests associated with the crude oil concession
which is located in Peru.
The following presents a summary of exploration expenses:
| |
|
|
|
|
|
|
|
|
|
|
|
|
|
|
|
Years Ended December 31
|
|
|
|
|
2010
|
|
|
2009
|
|
|
2008
|
|
|
|
|
(Millions)
|
|
|
|
|
Geologic and geophysical costs
|
|
$
|
22
|
|
|
$
|
33
|
|
|
$
|
13
|
|
|
Dry hole costs
|
|
|
17
|
|
|
|
11
|
|
|
|
16
|
|
|
Unproved leasehold property impairment, amortization and
expiration
|
|
|
34
|
|
|
|
10
|
|
|
|
8
|
|
|
|
|
|
|
|
|
|
|
|
|
|
|
|
|
Total exploration expense
|
|
$
|
73
|
|
|
$
|
54
|
|
|
$
|
37
|
|
|
|
|
|
|
|
|
|
|
|
|
|
|
|
Additional
Items
Production and ad valorem taxes in 2008 include a
$34 million accrual (which was reduced by $5 million
in 2009) for additional Wyoming severance and ad valorem
taxes associated with our initial estimate for settlement of an
assessment initially for production years 2000 through 2002, but
expanded through 2008 by the Wyoming Department of Audit (DOA),
of additional severance tax and interest and notification of an
increase in the taxable value of our interests for ad valorem
tax purposes. Associated with this charge is an interest expense
accrual of $4 million. All matters related to this issue
have been settled with the State and respective counties for the
amounts accrued.
F-46
WPX
Energy
Notes to
Combined Financial Statements—(Continued)
|
|
|
7.
|
Properties
and Equipment
|
Properties and equipment is carried at cost and consists of the
following:
| |
|
|
|
|
|
|
|
|
|
|
|
|
|
|
|
Estimated
|
|
|
|
|
|
|
|
|
|
|
Useful Life(a)
|
|
|
December 31,
|
|
|
|
|
(Years)
|
|
|
2010
|
|
|
2009
|
|
|
|
|
|
|
|
(Millions)
|
|
|
|
|
Proved properties
|
|
|
(b)
|
|
|
$
|
9,822
|
|
|
$
|
8,784
|
|
|
Unproved properties
|
|
|
(c)
|
|
|
|
1,893
|
|
|
|
922
|
|
|
Gathering, processing and other facilities
|
|
|
15-25
|
|
|
|
119
|
|
|
|
787
|
|
|
Construction in progress
|
|
|
(c)
|
|
|
|
603
|
|
|
|
573
|
|
|
Other
|
|
|
3-25
|
|
|
|
127
|
|
|
|
123
|
|
|
|
|
|
|
|
|
|
|
|
|
|
|
|
|
Total properties and equipment, at cost
|
|
|
|
|
|
|
12,564
|
|
|
|
11,189
|
|
|
Accumulated depreciation, depletion and amortization
|
|
|
|
|
|
|
(4,115
|
)
|
|
|
(3,527
|
)
|
|
|
|
|
|
|
|
|
|
|
|
|
|
|
|
Properties and equipment—net
|
|
|
|
|
|
$
|
8,449
|
|
|
$
|
7,662
|
|
|
|
|
|
|
|
|
|
|
|
|
|
|
|
|
|
|
|
(a) |
|
Estimated useful lives are presented as of December 31,
2010. |
| |
|
(b) |
|
Proved properties are depreciated, depleted and amortized using
the
units-of-production
method (see Note 1). |
| |
|
(c) |
|
Unproved properties and construction in progress are not yet
subject to depreciation and depletion. |
Unproved properties consist primarily of non-producing leasehold
in the Williston Basin (Bakken Shale) and the Appalachian Basin
(Marcellus Shale) and acquired unproved reserves in the Powder
River and Piceance Basins.
On December 21, 2010, we closed the acquisition of
100 percent of the equity of Dakota-3 E&P Company LLC
for $949 million, including closing adjustments. This
company holds approximately 85,800 net acres on the
Fort Berthold Indian Reservation in the Williston Basin of
North Dakota. Approximately 85% of the acreage is undeveloped.
Approximately $400 million of the purchase price was
recorded as proved properties, $542 million as unproved
properties within properties and equipment and $5 million
of prepaid drilling costs (no significant working capital was
acquired). Revenues and earnings for the acquired company were
nominal and thus insignificant to us for the three years ended
December 31, 2010, 2009 and 2008; accordingly, pro forma
operating results would be substantially similar to those
reflected on our historical Combined Statement of Operations.
As discussed in Notes 1 and 4, the Company sold certain
gathering and processing assets in Colorado’s Piceance
Basin with a net book value of $458 million to WPZ.
In May 2010, we entered into a purchase agreement consisting
primarily of non-producing leasehold acreage in the Appalachian
Basin and a 5 percent overriding royalty interest
associated with the acreage position for $599 million. We
also acquired additional non-producing leasehold acreage in the
Appalachian Basin for $164 million during the year.
Construction in progress includes $142 million in 2010 and
$136 million in 2009 related to wells located in Powder
River. In order to produce gas from the coal seams, an extended
period of dewatering is required prior to natural gas production.
In 2009, we adopted Accounting Standards Update
No. 2010-03,
which aligned oil and gas reserve estimation and disclosure
requirements to those in the Securities and Exchange
Commission’s final rule related thereto. Accordingly, our
fourth quarter 2009 depreciation, depletion and amortization
expense was approximately $17 million more than had it been
computed under the prior requirements.
F-47
WPX
Energy
Notes to
Combined Financial Statements—(Continued)
Asset
Retirement Obligations
Our asset retirement obligations relate to producing wells, gas
gathering well connections and related facilities. At the end of
the useful life of each respective asset, we are legally
obligated to plug producing wells and remove any related surface
equipment and to cap gathering well connections at the wellhead
and remove any related facility surface equipment.
A rollforward of our asset retirement obligation for the years
ended 2010 and 2009 is presented below.
| |
|
|
|
|
|
|
|
|
|
|
|
2010
|
|
|
2009
|
|
|
|
|
(Millions)
|
|
|
|
|
Balance, January 1
|
|
$
|
242
|
|
|
$
|
194
|
|
|
Liabilities incurred during the period
|
|
|
43
|
|
|
|
18
|
|
|
Liabilities settled during the period
|
|
|
(2
|
)
|
|
|
(1
|
)
|
|
Liabilities associated with assets sold
|
|
|
(22
|
)
|
|
|
—
|
|
|
Estimate revisions
|
|
|
3
|
|
|
|
15
|
|
|
Accretion expense*
|
|
|
21
|
|
|
|
16
|
|
|
|
|
|
|
|
|
|
|
|
|
Balance, December 31
|
|
$
|
285
|
|
|
$
|
242
|
|
|
|
|
|
|
|
|
|
|
|
|
Amount reflected as current
|
|
$
|
3
|
|
|
$
|
7
|
|
|
|
|
|
|
|
|
|
|
|
|
|
|
|
* |
|
Accretion expense is included in lease and facility operating
expense on the Combined Statement of Operations. |
|
|
|
8.
|
Accrued
and other current liabilities
|
Accrued and other current liabilities as of December 31,
2010 and 2009 is as follows:
| |
|
|
|
|
|
|
|
|
|
|
|
December 31,
|
|
|
|
|
2010
|
|
|
2009
|
|
|
|
|
(Millions)
|
|
|
|
|
Taxes other than income taxes
|
|
$
|
76
|
|
|
$
|
126
|
|
|
Customer margin deposit payable
|
|
|
25
|
|
|
|
31
|
|
|
Other
|
|
|
57
|
|
|
|
74
|
|
|
|
|
|
|
|
|
|
|
|
|
|
|
$
|
158
|
|
|
$
|
231
|
|
|
|
|
|
|
|
|
|
|
|
|
|
|
9.
|
Unsecured
Credit Agreement
|
We have an unsecured credit agreement with certain banks in
order to reduce margin requirements related to our hedging
activities as well as lower transaction fees. In July 2010, the
term of this facility was extended from December 2013 to
December 2015. Under the credit agreement, we are not required
to post collateral as long as the value of our domestic natural
gas reserves, as determined under the provisions of the
agreement, exceeds by a specified amount certain of our
obligations including any outstanding debt and the aggregate
out-of-the-money
positions on hedges entered into under the credit agreement. We
are subject to additional covenants under the credit agreement
including restrictions on hedge limits (70% of annual forecasted
production as defined in the agreement), the creation of liens,
the incurrence of debt, the sale of assets and properties, and
making certain payments during an event of default, such as
dividends. In December 2010, a waiver with the same terms and
restrictions as the original agreement, was executed that will
allow us to also hedge up to 70% of annual forecasted oil
production, as defined in the agreement.
F-48
WPX
Energy
Notes to
Combined Financial Statements—(Continued)
The Company’s domestic operations are included in the
consolidated federal and state income tax returns for Williams,
except for certain separate state filings. The income tax
provision for the Company has been calculated on a separate
return basis, except for certain state and federal tax
attributes (primarily minimum tax credit carry-forwards) for
which the actual allocation (if any) cannot be determined until
the consolidated tax returns are complete for the year in which
an income tax deconsolidation event occurs. If the income tax
deconsolidation event had occurred December 31, 2010, the
Company’s allocated share of minimum tax credit
carry-forwards are estimated to be in the range of $35 to
$45 million. This estimate of potential tax attributes has
not been included in these financial statements. The valuation
allowance at December 31, 2010 and 2009 serves to reduce
the recognized tax assets of $22 million associated with
state losses, net of federal benefit, to an amount that will
more likely than not be realized by the Company. There have been
no significant effects on the income tax provision associated
with changes in the valuation allowance for the years ended
December 31, 2010, 2009 and 2008. Williams manages its tax
position based upon its entire portfolio which may not be
indicative of tax planning strategies available to us if we were
operating as an independent company.
The provision (benefit) for income taxes from continuing
operations includes:
| |
|
|
|
|
|
|
|
|
|
|
|
|
|
|
|
Years Ended December 31,
|
|
|
|
|
2010
|
|
|
2009
|
|
|
2008
|
|
|
|
|
(Millions)
|
|
|
|
|
Provision (benefit):
|
|
|
|
|
|
|
|
|
|
|
|
|
|
Current:
|
|
|
|
|
|
|
|
|
|
|
|
|
|
Federal
|
|
$
|
7
|
|
|
$
|
(17
|
)
|
|
$
|
(52
|
)
|
|
State
|
|
|
1
|
|
|
|
(1
|
)
|
|
|
(3
|
)
|
|
Foreign
|
|
|
11
|
|
|
|
9
|
|
|
|
8
|
|
|
|
|
|
|
|
|
|
|
|
|
|
|
|
|
|
|
|
19
|
|
|
|
(9
|
)
|
|
|
(47
|
)
|
|
|
|
|
|
|
|
|
|
|
|
|
|
|
|
Deferred:
|
|
|
|
|
|
|
|
|
|
|
|
|
|
Federal
|
|
|
(159
|
)
|
|
|
97
|
|
|
|
470
|
|
|
State
|
|
|
(10
|
)
|
|
|
6
|
|
|
|
30
|
|
|
Foreign
|
|
|
—
|
|
|
|
—
|
|
|
|
(1
|
)
|
|
|
|
|
|
|
|
|
|
|
|
|
|
|
|
|
|
|
(169
|
)
|
|
|
103
|
|
|
|
499
|
|
|
|
|
|
|
|
|
|
|
|
|
|
|
|
|
Total provision (benefit)
|
|
$
|
(150
|
)
|
|
$
|
94
|
|
|
$
|
452
|
|
|
|
|
|
|
|
|
|
|
|
|
|
|
|
Reconciliations from the provision (benefit) for income taxes
from continuing operations at the federal statutory rate to the
realized provision (benefit) for income taxes are as follows:
| |
|
|
|
|
|
|
|
|
|
|
|
|
|
|
|
Years Ended December 31,
|
|
|
|
|
2010
|
|
|
2009
|
|
|
2008
|
|
|
|
|
(Millions)
|
|
|
|
|
Provision (benefit) at statutory rate
|
|
$
|
(498
|
)
|
|
$
|
85
|
|
|
$
|
444
|
|
|
Increases (decreases) in taxes resulting from:
|
|
|
|
|
|
|
|
|
|
|
|
|
|
State income taxes (net of federal benefit)
|
|
|
(6
|
)
|
|
|
3
|
|
|
|
18
|
|
|
Foreign operations—net
|
|
|
3
|
|
|
|
5
|
|
|
|
(2
|
)
|
|
Goodwill impairment
|
|
|
351
|
|
|
|
—
|
|
|
|
—
|
|
|
Other—net
|
|
|
—
|
|
|
|
1
|
|
|
|
(8
|
)
|
|
|
|
|
|
|
|
|
|
|
|
|
|
|
|
Provision (benefit) for income taxes
|
|
$
|
(150
|
)
|
|
$
|
94
|
|
|
$
|
452
|
|
|
|
|
|
|
|
|
|
|
|
|
|
|
|
F-49
WPX
Energy
Notes to
Combined Financial Statements—(Continued)
Income (loss) from continuing operations before income taxes
includes $36 million, $21 million, and
$30 million of foreign income in 2010, 2009, and 2008,
respectively.
Significant components of deferred tax liabilities and deferred
tax assets are as follows:
| |
|
|
|
|
|
|
|
|
|
|
|
December 31,
|
|
|
|
|
2010
|
|
|
2009
|
|
|
|
|
(Millions)
|
|
|
|
|
Deferred tax liabilities:
|
|
|
|
|
|
|
|
|
|
Properties and equipment
|
|
$
|
1,723
|
|
|
$
|
1,939
|
|
|
Derivatives, net
|
|
|
110
|
|
|
|
61
|
|
|
|
|
|
|
|
|
|
|
|
|
Total deferred tax liabilities
|
|
|
1,833
|
|
|
|
2,000
|
|
|
|
|
|
|
|
|
|
|
|
|
Deferred tax assets:
|
|
|
|
|
|
|
|
|
|
Accrued liabilities and other
|
|
|
117
|
|
|
|
131
|
|
|
State loss carryovers
|
|
|
22
|
|
|
|
22
|
|
|
|
|
|
|
|
|
|
|
|
|
Total deferred tax assets
|
|
|
139
|
|
|
|
153
|
|
|
Less: valuation allowance
|
|
|
22
|
|
|
|
22
|
|
|
|
|
|
|
|
|
|
|
|
|
Total net deferred tax assets
|
|
|
117
|
|
|
|
131
|
|
|
|
|
|
|
|
|
|
|
|
|
Net deferred tax liabilities
|
|
$
|
1,716
|
|
|
$
|
1,869
|
|
|
|
|
|
|
|
|
|
|
|
Undistributed earnings of certain combined foreign subsidiaries
at December 31, 2010, totaled approximately
$109 million. No provision for deferred U.S. income
taxes has been made for these subsidiaries because we intend to
permanently reinvest such earnings in foreign operations.
The payments and receipts for domestic income taxes were made to
or received from Williams via the notes payable to parent (see
Note 4) in accordance with our historical tax
allocation procedure. The cash payments for domestic income
taxes (net of refunds) were $5 million in 2010. Cash
receipts for domestic income taxes (net of payments) were
$13 million and $44 million in 2009 and 2008,
respectively. Additionally, payments made directly to
international taxing authorities were $8 million,
$4 million, and $8 million in 2010, 2009, and 2008,
respectively.
We recognize related interest and penalties as a component of
income tax expense. The amounts accrued for interest and
penalties are insignificant.
As of December 31, 2010, the amount of unrecognized tax
benefits is insignificant.
During the first quarter of 2011, Williams finalized settlements
with the IRS for 1997 through 2008. These settlements will not
have a material impact on our unrecognized tax benefits. The
statute of limitations for most states expires one year after
expiration of the IRS statute. Income tax returns for our
Colombian (2008 through 2010), Venezuelan (2006 through
2010) and Argentine (2003 through 2010) entities are
also open to audit.
During the next 12 months, we do not expect ultimate
resolution of any uncertain tax position associated with a
domestic or international matter will result in a significant
increase or decrease of our unrecognized tax benefit.
|
|
|
11.
|
Contingent
Liabilities and Commitments
|
Royalty
litigation
In September 2006, royalty interest owners in Garfield County,
Colorado, filed a class action suit in District Court, Garfield
County Colorado, alleging we improperly calculated oil and gas
royalty payments, failed to account for the proceeds that we
received from the sale of natural gas and extracted products,
improperly charged certain expenses and failed to refund amounts
withheld in excess of ad valorem tax obligations. Plaintiffs
sought to certify as a class of royalty interest owners, recover
underpayment of royalties and obtain corrected payments
resulting from calculation errors. We entered into a final
partial settlement agreement. The partial settlement agreement
defined the class members for class certification, reserved two
claims for court resolution, resolved all other class
F-50
WPX
Energy
Notes to
Combined Financial Statements—(Continued)
claims relating to past calculation of royalty and overriding
royalty payments, and established certain rules to govern future
royalty and overriding royalty payments. This settlement
resolved all claims relating to past withholding for ad valorem
tax payments and established a procedure for refunds of any such
excess withholding in the future. The first reserved claim is
whether we are entitled to deduct in our calculation of royalty
payments a portion of the costs we incur beyond the tailgates of
the treating or processing plants for mainline pipeline
transportation. We received a favorable ruling on our motion for
summary judgment on the first reserved claim. Plaintiffs
appealed that ruling and the Colorado Court of Appeals found in
our favor in April 2011. The second reserved claim relates to
whether we are required to have proportionately increased the
value of natural gas by transporting that gas on mainline
transmission lines and, if required, whether we did so and are
thus entitled to deduct a proportionate share of transportation
costs in calculating royalty payments. We anticipate trial on
the second reserved claim following resolution of the first
reserved claim. We believe our royalty calculations have been
properly determined in accordance with the appropriate
contractual arrangements and Colorado law. At this time, the
plaintiffs have not provided us a sufficient framework to
calculate an estimated range of exposure related to their
claims. However, it is reasonably possible that the ultimate
resolution of this item could result in a future charge that may
be material to our results of operations.
Other producers have been in litigation or discussions with a
federal regulatory agency and a state agency in New Mexico
regarding certain deductions, comprised primarily of processing,
treating and transportation costs, used in the calculation of
royalties. Although we are not a party to these matters, we have
monitored them to evaluate whether their resolution might have
the potential for unfavorable impact on our results of
operations. One of these matters involving federal litigation
was decided on October 5, 2009. The resolution of this
specific matter is not material to us. However, other related
issues in these matters that could be material to us remain
outstanding. We received notice from the U.S. Department of
Interior Office of Natural Resources Revenue (ONRR) in the
fourth quarter of 2010, intending to clarify the guidelines for
calculating federal royalties on conventional gas production
applicable to our federal leases in New Mexico. The ONRR’s
guidance provides its view as to how much of a producer’s
bundled fees for transportation and processing can be deducted
from the royalty payment. We believe using these guidelines
would not result in a material difference in determining our
historical federal royalty payments for our leases in New
Mexico. No similar specific guidance has been issued by ONRR for
leases in other states, but such guidelines are expected in the
future. However, the timing of receipt of the necessary
guidelines is uncertain. In addition, these interpretive
guidelines on the applicability of certain deductions in the
calculation of federal royalties are extremely complex and will
vary based upon the ONRR’s assessment of the configuration
of processing, treating and transportation operations supporting
each federal lease. From January 2004 through
December 2010, our deductions used in the calculation of
the royalty payments in states other than New Mexico associated
with conventional gas production total approximately
$55 million. Based on correspondence in 2009 with the
ONRR’s predecessor, we believe our assumptions in the
calculations have been consistent with the requirements. The
issuance of similar guidelines in Colorado and other states
could affect our previous royalty payments and the effect could
be material to our results of operations.
Environmental
matters
The EPA and various state regulatory agencies routinely
promulgate and propose new rules, and issue updated guidance to
existing rules. These new rules and rulemakings include, but are
not limited to, rules for reciprocating internal combustion
engine maximum achievable control technology, new air quality
standards for ground level ozone, and one hour nitrogen dioxide
emission limits. We are unable to estimate the costs of asset
additions or modifications necessary to comply with these new
regulations due to uncertainty created by the various legal
challenges to these regulations and the need for further
specific regulatory guidance.
Matters
related to Williams’ former power business
California
energy crisis
Our former power business was engaged in power marketing in
various geographic areas, including California. Prices charged
for power by us and other traders and generators in California
and other western
F-51
WPX
Energy
Notes to
Combined Financial Statements—(Continued)
states in 2000 and 2001 were challenged in various proceedings,
including those before the FERC. We have entered into
settlements with the State of California (State Settlement),
major California utilities (Utilities Settlement), and others
that substantially resolved each of these issues with these
parties.
Although the State Settlement and Utilities Settlement resolved
a significant portion of the refund issues among the settling
parties, we continue to have potential refund exposure to
nonsettling parties, including various California end users that
did not participate in the Utilities Settlement. We are
currently in settlement negotiations with certain California
utilities aimed at eliminating or substantially reducing this
exposure. If successful, and subject to a final
“true-up”
mechanism, the settlement agreement would also resolve our
collection of accrued interest from counterparties as well as
our payment of accrued interest on refund amounts. Thus, as
currently contemplated by the parties, the settlement agreement
would resolve most, if not all, of our legal issues arising from
the
2000-2001
California Energy Crisis. With respect to these matters, amounts
accrued are not material to our financial position.
Certain other issues also remain open at the FERC and for other
nonsettling parties.
Reporting
of natural gas-related information to trade
publications
Civil suits based on allegations of manipulating published gas
price indices have been brought against us and others, in each
case seeking an unspecified amount of damages. We are currently
a defendant in class action litigation and other litigation
originally filed in state court in Colorado, Kansas, Missouri
and Wisconsin brought on behalf of direct and indirect
purchasers of natural gas in those states. These cases were
transferred to the federal court in Nevada. In 2008, the court
granted summary judgment in the Colorado case in favor of us and
most of the other defendants based on plaintiffs’ lack of
standing. On January 8, 2009, the court denied the
plaintiffs’ request for reconsideration of the Colorado
dismissal and entered judgment in our favor. We expect that the
Colorado plaintiffs will appeal, but the appeal cannot occur
until the case against the remaining defendant is concluded.
In the other cases, our joint motions for summary judgment to
preclude the plaintiffs’ state law claims based upon
federal preemption have been pending since late 2009. If the
motions are granted, we expect a final judgment in our favor
which the plaintiffs could appeal. If the motions are denied,
the current stay of activity would be lifted, class
certification would be addressed, and discovery would be
completed as the cases proceed towards trial. Because of the
uncertainty around these current pending unresolved issues,
including an insufficient description of the purported classes
and other related matters, we cannot reasonably estimate a range
of potential exposures at this time. However, it is reasonably
possible that the ultimate resolution of these items could
result in future charges that may be material to our results of
operations.
Other
Divestiture Indemnifications
Pursuant to various purchase and sale agreements relating to
divested businesses and assets, we have indemnified certain
purchasers against liabilities that they may incur with respect
to the businesses and assets acquired from us. The indemnities
provided to the purchasers are customary in sale transactions
and are contingent upon the purchasers incurring liabilities
that are not otherwise recoverable from third parties. The
indemnities generally relate to breach of warranties, tax,
historic litigation, personal injury, environmental matters,
right of way and other representations that we have provided.
At December 31, 2010, we do not expect any of the
indemnities provided pursuant to the sales agreements to have a
material impact on our future financial position. However, if a
claim for indemnity is brought against us in the future, it may
have a material adverse effect on our results of operations in
the period in which the claim is made.
In addition to the foregoing, various other proceedings are
pending against us which are incidental to our operations.
F-52
WPX
Energy
Notes to
Combined Financial Statements—(Continued)
Summary
Litigation, arbitration, regulatory matters, and environmental
matters are subject to inherent uncertainties. Were an
unfavorable ruling to occur, there exists the possibility of a
material adverse impact on the results of operations in the
period in which the ruling occurs. As of December 31, 2010
and 2009, the Company had accrued approximately $21 million
and $30 million, respectively, for loss contingencies
associated with royalty litigation, reporting of natural gas
information to trade publications and other contingencies.
Management, including internal counsel, currently believes that
the ultimate resolution of the foregoing matters, taken as a
whole and after consideration of amounts accrued, insurance
coverage, recovery from customers or other indemnification
arrangements, is not expected to have a materially adverse
effect upon our future liquidity or financial position; however,
it could be material to our results of operations in any given
year.
Commitments
As part of managing our commodity price risk, we utilize
contracted pipeline capacity (including capacity on
affiliates’ systems, resulting in a total of
$442 million for all years) primarily to move our natural
gas production to other locations in an attempt to obtain more
favorable pricing differentials. Our commitments under these
contracts are as follows:
| |
|
|
|
|
|
|
|
(Millions)
|
|
|
|
|
2011
|
|
$
|
204
|
|
|
2012
|
|
|
208
|
|
|
2013
|
|
|
200
|
|
|
2014
|
|
|
174
|
|
|
2015
|
|
|
166
|
|
|
Thereafter
|
|
|
635
|
|
|
|
|
|
|
|
|
Total
|
|
$
|
1,587
|
|
|
|
|
|
|
|
We have certain commitments to an equity investee and others for
natural gas gathering and treating services, which total
$447 million over approximately eleven years.
We have a long-term obligation to deliver on a firm basis
200,000 MMBtu per day of natural gas to a buyer at the
White River Hub (Greasewood-Meeker, Colorado), which is the
major market hub exiting the Piceance Basin. This obligation
expires in 2014.
In connection with a gathering agreement entered into by WPZ
with a third party in December 2010, we concurrently agreed to
buy up to 200,000 MMBtu per day of natural gas at Transco
Station 515 (Marcellus Basin) at market prices from the same
third party. Purchases under the
12-year
contract are expected to begin in the third quarter of 2011. We
expect to sell this natural gas in the open market and may
utilize available transportation capacity to facilitate the
sales.
F-53
WPX
Energy
Notes to
Combined Financial Statements—(Continued)
Future minimum annual rentals under noncancelable operating
leases as of December 31, 2010, are payable as follows:
| |
|
|
|
|
|
|
|
(Millions)
|
|
|
|
|
2011
|
|
$
|
14
|
|
|
2012
|
|
|
10
|
|
|
2013
|
|
|
9
|
|
|
2014
|
|
|
4
|
|
|
2015
|
|
|
3
|
|
|
Thereafter
|
|
|
15
|
|
|
|
|
|
|
|
|
Total
|
|
$
|
55
|
|
|
|
|
|
|
|
Total rent expense, excluding
month-to-month
rentals, was $13 million, $22 million and
$21 million in 2010, 2009 and 2008, respectively. Rent
charges incurred for drilling rig rentals are capitalized under
the successful efforts method of accounting.
|
|
|
12.
|
Employee
Benefit Plans
|
Certain benefit costs associated with direct employees who
support our operations are determined based on a specific
employee basis and are charged to us by Williams as described
below. These pension and post retirement benefit costs include
amounts associated with vested participants who are no longer
employees. As described in Note 4, Williams also charges us
for the allocated cost of certain indirect employees of Williams
who provide general and administrative services on our behalf.
Williams includes an allocation of the benefit costs associated
with these Williams employees based upon a Williams’
determined benefit rate, not necessarily specific to the
employees providing general and administrative services on our
behalf. As a result, the information described below is limited
to amounts associated with the direct employees supporting our
operations.
For the periods presented, we were not the plan sponsor for
these plans. Accordingly, our Combined Balance Sheet does not
reflect any assets or liabilities related to these plans.
Pension
plans
Williams is the sponsor of noncontributory defined benefit
pension plans that provide pension benefits for its eligible
employees. Pension expense charged to us by Williams for 2010,
2009 and 2008 totaled $7 million, $7 million and
$3 million, respectively.
Other
postretirement benefits
Williams is the sponsor of subsidized retiree medical and life
insurance benefit plans (other postretirement benefits) that
provides benefits to certain eligible participants, generally
including employees hired on or before December 31, 1991,
and other miscellaneous defined participant groups. The
allocation of cost for the plan anticipates future cost-sharing
changes to the plan that are consistent with Williams’
expressed intent to increase the retiree contribution level,
generally in line with health care cost increases. Other
postretirement benefit expense charged to us by Williams for
2010, 2009, and 2008 totaled less than $1 million for each
period.
Defined
contribution plan
Williams also is the sponsor of a defined contribution plan that
provides benefits to certain eligible participants and thus has
charged us compensation expense of $5 million,
$5 million and $4 million in 2010,
F-54
WPX
Energy
Notes to
Combined Financial Statements—(Continued)
2009 and 2008, respectively, for Williams’ matching
contributions to this plan. Additionally, Apco maintains a
defined contribution plan for its employees. Total annual
compensation expense related to Apco’s plan was
approximately $0.1 million for each period.
|
|
|
13.
|
Stock-Based
Compensation
|
Certain of our direct employees participate in The Williams
Companies, Inc. 2007 Incentive Plan, which provides for Williams
common-stock-based awards to both employees and Williams’
nonmanagement directors. The plan permits the granting of
various types of awards including, but not limited to, stock
options and restricted stock units. Awards may be granted for no
consideration other than prior and future services or based on
certain financial performance targets. Additionally, certain of
direct our employees participate in Williams’ Employee
Stock Purchase Plan (ESPP). The ESPP enables eligible
participants to purchase through payroll deductions a limited
amount of Williams’ common stock at a discounted price.
We are charged by Williams for stock-based compensation expense
related to our direct employees. Williams also charges us for
the allocated costs of certain indirect employees of Williams
(including stock-based compensation) who provide general and
administrative services on our behalf and may become our
employees in the future. However, information included in this
note is limited to stock-based compensation associated with the
direct employees (see Note 4 for total costs charged to us
by Williams).
Total stock-based compensation expense included in general and
administrative expense for the years ended December 31,
2010, 2009 and 2008 was $14 million, $13 million, and
$11 million, respectively.
Employee
stock-based awards
Stock options are valued at the date of award, which does not
precede the approval date, and compensation cost is recognized
on a straight-line basis, net of estimated forfeitures, over the
requisite service period. The purchase price per share for stock
options may not be less than the market price of the underlying
stock on the date of grant.
Stock options generally become exercisable over a three-year
period from the date of grant and generally expire ten years
after the grant.
Restricted stock units are generally valued at market value on
the grant date and generally vest over three years. Restricted
stock unit compensation cost, net of estimated forfeitures, is
generally recognized over the vesting period on a straight-line
basis.
Stock
Options
The following summary reflects stock option activity and related
information for the year ended December 31, 2010.
F-55
WPX
Energy
Notes to
Combined Financial Statements—(Continued)
| |
|
|
|
|
|
|
|
|
|
|
|
|
|
|
|
|
|
|
Weighted-
|
|
|
|
|
|
|
|
|
|
|
Average
|
|
|
Aggregate
|
|
|
|
|
|
|
|
Exercise
|
|
|
Intrinsic
|
|
|
Stock Options
|
|
Options
|
|
|
Price
|
|
|
Value
|
|
|
|
|
(Millions)
|
|
|
|
|
|
(Millions)
|
|
|
|
|
Outstanding at December 31, 2009
|
|
|
1.6
|
|
|
$
|
17.47
|
|
|
|
|
|
|
Granted
|
|
|
0.2
|
|
|
$
|
21.22
|
|
|
|
|
|
|
Exercised
|
|
|
(0.1
|
)
|
|
$
|
7.65
|
|
|
$
|
2
|
|
|
|
|
|
|
|
|
|
|
|
|
|
|
|
|
Expired
|
|
|
(0.1
|
)
|
|
$
|
42.29
|
|
|
|
|
|
|
Forfeited
|
|
|
—
|
|
|
$
|
—
|
|
|
|
|
|
|
|
|
|
|
|
|
|
|
|
|
|
|
|
|
Outstanding at December 31, 2010
|
|
|
1.6
|
|
|
$
|
18.23
|
|
|
$
|
13
|
|
|
|
|
|
|
|
|
|
|
|
|
|
|
|
|
Exercisable at December 31, 2010
|
|
|
1.2
|
|
|
$
|
18.20
|
|
|
$
|
10
|
|
|
|
|
|
|
|
|
|
|
|
|
|
|
|
The total intrinsic value of options exercised during the years
ended December 31, 2010, 2009, and 2008 was
$2 million, $0.2 million, and $7 million,
respectively.
The following summary provides additional information about
stock options that are outstanding and exercisable at
December 31, 2010.
| |
|
|
|
|
|
|
|
|
|
|
|
|
|
|
|
|
|
|
|
|
|
|
|
|
|
|
|
Stock Options Outstanding
|
|
|
Stock Options Exercisable
|
|
|
|
|
|
|
|
|
|
|
Weighted-
|
|
|
|
|
|
|
|
|
Weighted-
|
|
|
|
|
|
|
|
Weighted-
|
|
|
Average
|
|
|
|
|
|
Weighted-
|
|
|
Average
|
|
|
|
|
|
|
|
Average
|
|
|
Remaining
|
|
|
|
|
|
Average
|
|
|
Remaining
|
|
|
|
|
|
|
|
Exercise
|
|
|
Contractual
|
|
|
|
|
|
Exercise
|
|
|
Contractual
|
|
|
Range of Exercise Prices
|
|
Options
|
|
|
Price
|
|
|
Life
|
|
|
Options
|
|
|
Price
|
|
|
Life
|
|
|
|
|
(Millions)
|
|
|
|
|
|
(Years)
|
|
|
(Millions)
|
|
|
|
|
|
(Years)
|
|
|
|
|
$2.58 to $11.84
|
|
|
0.6
|
|
|
$
|
8.79
|
|
|
|
4.9
|
|
|
|
0.5
|
|
|
$
|
7.88
|
|
|
|
3.4
|
|
|
$11.85 to 21.67
|
|
|
0.6
|
|
|
$
|
20.32
|
|
|
|
6.1
|
|
|
|
0.4
|
|
|
$
|
19.79
|
|
|
|
4.3
|
|
|
$21.68 to $33.65
|
|
|
0.2
|
|
|
$
|
27.84
|
|
|
|
6.0
|
|
|
|
0.2
|
|
|
$
|
27.84
|
|
|
|
6.0
|
|
|
$33.66 to $36.50
|
|
|
0.2
|
|
|
$
|
36.21
|
|
|
|
5.9
|
|
|
|
0.1
|
|
|
$
|
36.09
|
|
|
|
5.5
|
|
|
|
|
|
|
|
|
|
|
|
|
|
|
|
|
|
|
|
|
|
|
|
|
|
|
|
|
Total
|
|
|
1.6
|
|
|
$
|
18.23
|
|
|
|
5.6
|
|
|
|
1.2
|
|
|
$
|
18.20
|
|
|
|
4.4
|
|
|
|
|
|
|
|
|
|
|
|
|
|
|
|
|
|
|
|
|
|
|
|
|
|
|
|
The estimated fair value at date of grant of options for
Williams common stock granted in each respective year, using the
Black-Scholes option pricing model, is as follows:
| |
|
|
|
|
|
|
|
|
|
|
|
|
|
|
|
2010
|
|
|
2009
|
|
|
2008
|
|
|
|
|
Weighted-average grant date fair value of options granted
|
|
$
|
7.02
|
|
|
$
|
5.60
|
|
|
$
|
12.83
|
|
|
|
|
|
|
|
|
|
|
|
|
|
|
|
|
Weighted-average assumptions:
|
|
|
|
|
|
|
|
|
|
|
|
|
|
Dividend yield
|
|
|
2.6
|
%
|
|
|
1.6
|
%
|
|
|
1.2
|
%
|
|
Volatility
|
|
|
39.0
|
%
|
|
|
60.8
|
%
|
|
|
33.4
|
%
|
|
Risk-free interest rate
|
|
|
3.0
|
%
|
|
|
2.3
|
%
|
|
|
3.5
|
%
|
|
Expected life (years)
|
|
|
6.5
|
|
|
|
6.5
|
|
|
|
6.5
|
|
The expected dividend yield is based on the average annual
dividend yield as of the grant date. Expected volatility is
based on the historical volatility of Williams stock and the
implied volatility of Williams stock based on traded options. In
calculating historical volatility, returns during calendar year
2002 were excluded as the extreme volatility during that time is
not reasonably expected to be repeated in the future. The
risk-free interest rate is based on the U.S. Treasury
Constant Maturity rates as of the grant date. The expected life
of the option is based on historical exercise behavior and
expected future experience.
F-56
WPX
Energy
Notes to
Combined Financial Statements—(Continued)
Nonvested
Restricted Stock Units
The following summary reflects nonvested restricted stock unit
activity and related information for the year ended
December 31, 2010.
| |
|
|
|
|
|
|
|
|
|
|
|
|
|
|
Weighted-
|
|
|
|
|
|
|
|
Average
|
|
|
Restricted Stock Units
|
|
Shares
|
|
|
Fair Value*
|
|
|
|
|
(Millions)
|
|
|
|
|
|
|
|
Nonvested at December 31, 2009
|
|
|
1.7
|
|
|
$
|
18.24
|
|
|
Granted
|
|
|
0.6
|
|
|
$
|
21.19
|
|
|
Forfeited
|
|
|
(0.1
|
)
|
|
$
|
19.36
|
|
|
Cancelled
|
|
|
(0.1
|
)
|
|
$
|
0.00
|
|
|
Vested
|
|
|
(0.3
|
)
|
|
$
|
28.35
|
|
|
|
|
|
|
|
|
|
|
|
|
Nonvested at December 31, 2010
|
|
|
1.8
|
|
|
$
|
17.96
|
|
|
|
|
|
|
|
|
|
|
|
|
|
|
|
* |
|
Performance-based shares are primarily valued using the
end-of-period
market price until certification that the performance objectives
have been completed, a value of zero once it has been determined
that it is unlikely that performance objectives will be met, or
a valuation pricing model. All other shares are valued at the
grant-date market price. |
Other
restricted stock unit information
| |
|
|
|
|
|
|
|
|
|
|
|
|
|
|
|
2010
|
|
|
2009
|
|
|
2008
|
|
|
|
|
Weighted-average grant date fair value of restricted stock units
granted during the year, per share
|
|
$
|
21.19
|
|
|
$
|
10.53
|
|
|
$
|
32.34
|
|
|
|
|
|
|
|
|
|
|
|
|
|
|
|
|
Total fair value of restricted stock units vested during the
year ($’s in millions)
|
|
$
|
9
|
|
|
$
|
8
|
|
|
$
|
6
|
|
|
|
|
|
|
|
|
|
|
|
|
|
|
|
|
|
|
14.
|
Fair
Value Measurements
|
Fair value is the amount received to sell an asset or the amount
paid to transfer a liability in an orderly transaction between
market participants (an exit price) at the measurement date.
Fair value is a market-based measurement considered from the
perspective of a market participant. We use market data or
assumptions that we believe market participants would use in
pricing the asset or liability, including assumptions about risk
and the risks inherent in the inputs to the valuation. These
inputs can be readily observable, market corroborated, or
unobservable. We apply both market and income approaches for
recurring fair value measurements using the best available
information while utilizing valuation techniques that maximize
the use of observable inputs and minimize the use of
unobservable inputs.
The fair value hierarchy prioritizes the inputs used to measure
fair value, giving the highest priority to quoted prices in
active markets for identical assets or liabilities (Level 1
measurement) and the lowest priority to unobservable inputs
(Level 3 measurement). We classify fair value balances
based on the observability of those inputs. The three levels of
the fair value hierarchy are as follows:
|
|
|
| |
•
|
Level 1—Quoted prices for identical assets or
liabilities in active markets that we have the ability to
access. Active markets are those in which transactions for the
asset or liability occur in sufficient frequency and volume to
provide pricing information on an ongoing basis. Our
Level 1 primarily consists of financial instruments that
are exchange traded;
|
| |
| |
•
|
Level 2—Inputs are other than quoted prices in active
markets included in Level 1, that are either directly or
indirectly observable. These inputs are either directly
observable in the marketplace or
|
F-57
WPX
Energy
Notes to
Combined Financial Statements—(Continued)
|
|
|
| |
|
indirectly observable through corroboration with market data for
substantially the full contractual term of the asset or
liability being measured. Our Level 2 primarily consists of
over-the-counter
(OTC) instruments such as forwards, swaps, and options. These
options, which hedge future sales of production, are structured
as costless collars and are financially settled. They are valued
using an industry standard Black-Scholes option pricing model.
Prior to 2009, these options were included in Level 3
because a significant input to the model, implied volatility by
location, was considered unobservable. However, due to the
increased transparency, we now consider this input to be
observable and have included these options in Level 2; and
|
|
|
|
| |
•
|
Level 3—Inputs that are not observable for which there
is little, if any, market activity for the asset or liability
being measured. These inputs reflect management’s best
estimate of the assumptions market participants would use in
determining fair value. Our Level 3 consists of instruments
valued using industry standard pricing models and other
valuation methods that utilize unobservable pricing inputs that
are significant to the overall fair value.
|
In valuing certain contracts, the inputs used to measure fair
value may fall into different levels of the fair value
hierarchy. For disclosure purposes, assets and liabilities are
classified in their entirety in the fair value hierarchy level
based on the lowest level of input that is significant to the
overall fair value measurement. Our assessment of the
significance of a particular input to the fair value measurement
requires judgment and may affect the placement within the fair
value hierarchy levels.
The following table presents, by level within the fair value
hierarchy, our assets and liabilities that are measured at fair
value on a recurring basis.
Fair
Value Measurements Using:
| |
|
|
|
|
|
|
|
|
|
|
|
|
|
|
|
|
|
|
|
|
|
|
|
|
|
|
|
|
|
|
|
|
|
|
|
December 31, 2010
|
|
|
December 31, 2009
|
|
|
|
|
Level 1
|
|
|
Level 2
|
|
|
Level 3
|
|
|
Total
|
|
|
Level 1
|
|
|
Level 2
|
|
|
Level 3
|
|
|
Total
|
|
|
|
|
(Millions)
|
|
|
(Millions)
|
|
|
|
|
Energy derivative assets
|
|
$
|
97
|
|
|
$
|
474
|
|
|
$
|
2
|
|
|
$
|
573
|
|
|
$
|
178
|
|
|
$
|
912
|
|
|
$
|
4
|
|
|
$
|
1,094
|
|
|
Energy derivative liabilities
|
|
$
|
78
|
|
|
$
|
210
|
|
|
$
|
1
|
|
|
$
|
289
|
|
|
$
|
177
|
|
|
$
|
826
|
|
|
$
|
3
|
|
|
$
|
1,006
|
|
Energy derivatives include commodity based exchange-traded
contracts and OTC contracts. Exchange-traded contracts include
futures, swaps, and options. OTC contracts include forwards,
swaps and options.
Many contracts have bid and ask prices that can be observed in
the market. Our policy is to use a mid-market pricing (the
mid-point price between bid and ask prices) convention to value
individual positions and then adjust on a portfolio level to a
point within the bid and ask range that represents our best
estimate of fair value. For offsetting positions by location,
the mid-market price is used to measure both the long and short
positions.
The determination of fair value for our assets and liabilities
also incorporates the time value of money and various credit
risk factors which can include the credit standing of the
counterparties involved, master netting arrangements, the impact
of credit enhancements (such as cash collateral posted and
letters of credit) and our nonperformance risk on our
liabilities. The determination of the fair value of our
liabilities does not consider noncash collateral credit
enhancements.
Exchange-traded contracts include New York Mercantile Exchange
and Intercontinental Exchange contracts and are valued based on
quoted prices in these active markets and are classified within
Level 1.
Forward, swap, and option contracts included in Level 2 are
valued using an income approach including present value
techniques and option pricing models. Option contracts, which
hedge future sales of our production, are structured as costless
collars and are financially settled. They are valued using an
industry standard Black-Scholes option pricing model.
Significant inputs into our Level 2 valuations include
commodity
F-58
WPX
Energy
Notes to
Combined Financial Statements—(Continued)
prices, implied volatility by location, and interest rates, as
well as considering executed transactions or broker quotes
corroborated by other market data. These broker quotes are based
on observable market prices at which transactions could
currently be executed. In certain instances where these inputs
are not observable for all periods, relationships of observable
market data and historical observations are used as a means to
estimate fair value. Where observable inputs are available for
substantially the full term of the asset or liability, the
instrument is categorized in Level 2.
Our energy derivatives portfolio is largely comprised of
exchange-traded products or like products and the tenure of our
derivatives portfolio is relatively short with more than
99 percent of the value of our derivatives portfolio
expiring in the next 24 months. Due to the nature of the
products and tenure, we are consistently able to obtain market
pricing. All pricing is reviewed on a daily basis and is
formally validated with broker quotes and documented on a
monthly basis.
Certain instruments trade with lower availability of pricing
information. These instruments are valued with a present value
technique using inputs that may not be readily observable or
corroborated by other market data. These instruments are
classified within Level 3 when these inputs have a
significant impact on the measurement of fair value. The
instruments included in Level 3 at December 31, 2010,
consist primarily of natural gas index transactions that are
used to manage our physical requirements.
Reclassifications of fair value between Level 1,
Level 2, and Level 3 of the fair value hierarchy, if
applicable, are made at the end of each quarter. No significant
transfers in or out of Level 1 and Level 2 occurred
during the year ended December 31, 2010. In 2009, certain
options which hedge future sales of production were transferred
from Level 3 to Level 2. These options were originally
included in Level 3 because a significant input to the
model, implied volatility by location, was considered
unobservable. Due to increased transparency, this input was
considered observable, and we transferred these options to
Level 2.
The following tables present a reconciliation of changes in the
fair value of our net energy derivatives and other assets
classified as Level 3 in the fair value hierarchy.
Level 3
Fair Value Measurements Using Significant Unobservable
Inputs
| |
|
|
|
|
|
|
|
|
|
|
|
|
|
|
|
Year Ended December 31,
|
|
|
|
|
2010
|
|
|
2009
|
|
|
2008
|
|
|
|
|
Net Energy
|
|
|
Net Energy
|
|
|
Net Energy
|
|
|
|
|
Derivatives
|
|
|
Derivatives
|
|
|
Derivatives
|
|
|
|
|
(Millions)
|
|
|
|
|
|
|
|
Beginning balance
|
|
$
|
1
|
|
|
$
|
506
|
|
|
$
|
(5
|
)
|
|
Realized and unrealized gains (losses):
|
|
|
|
|
|
|
|
|
|
|
|
|
|
Included in income (loss) from continuing operations
|
|
|
1
|
|
|
|
476
|
|
|
|
96
|
|
|
Included in other comprehensive income (loss)
|
|
|
—
|
|
|
|
(329
|
)
|
|
|
478
|
|
|
Purchases, issuances, and settlements
|
|
|
(1
|
)
|
|
|
(479
|
)
|
|
|
(61
|
)
|
|
Transfers into Level 3
|
|
|
—
|
|
|
|
—
|
|
|
|
3
|
|
|
Transfers out of Level 3
|
|
|
—
|
|
|
|
(173
|
)
|
|
|
(5
|
)
|
|
|
|
|
|
|
|
|
|
|
|
|
|
|
|
Ending balance
|
|
$
|
1
|
|
|
$
|
1
|
|
|
$
|
506
|
|
|
|
|
|
|
|
|
|
|
|
|
|
|
|
|
Unrealized gains included in income from continuing operations
relating to instruments held at December 31
|
|
$
|
—
|
|
|
$
|
—
|
|
|
$
|
—
|
|
|
|
|
|
|
|
|
|
|
|
|
|
|
|
Realized and unrealized gains (losses) included in income (loss)
from continuing operations for the above periods are reported in
revenues in our Combined Statement of Operations.
F-59
WPX
Energy
Notes to
Combined Financial Statements—(Continued)
The following table presents impairments associated with certain
assets that have been measured at fair value on a nonrecurring
basis within Level 3 of the fair value hierarchy.
Fair
Value Measurements Using:
| |
|
|
|
|
|
|
|
|
|
|
|
Total Losses for the Years
|
|
|
|
|
Ended December 31,
|
|
|
|
|
2010
|
|
|
2009
|
|
|
|
|
(Millions)
|
|
|
|
|
Impairments:
|
|
|
|
|
|
|
|
|
|
Goodwill (see Note 6)
|
|
$
|
1,003
|
(a)
|
|
$
|
—
|
|
|
Producing properties and costs of acquired unproved reserves
(see Note 6)
|
|
|
678
|
(b)
|
|
|
15
|
(c)
|
|
Cost-based investment (see Note 5)
|
|
|
—
|
|
|
|
11
|
(d)
|
|
|
|
|
|
|
|
|
|
|
|
|
|
$
|
1,681
|
|
|
$
|
26
|
|
|
|
|
|
|
|
|
|
|
|
|
|
|
|
(a) |
|
Due to a significant decline in forward natural gas prices
across all future production periods during 2010, we determined
that we had a trigger event and thus performed an interim
impairment assessment of the approximate $1 billion of
goodwill related to our domestic natural gas production
operations (the reporting unit). Forward natural gas prices
through 2025 as of September 30, 2010, used in our analysis
declined more than 22 percent on average compared to the
forward prices as of December 31, 2009. We estimated the
fair value of the reporting unit on a stand-alone basis by
valuing proved and unproved reserves, as well as estimating the
fair values of other assets and liabilities which are identified
to the reporting unit. We used an income approach (discounted
cash flow) for valuing reserves. The significant inputs into the
valuation of proved and unproved reserves included reserve
quantities, forward natural gas prices, anticipated drilling and
operating costs, anticipated production curves, income taxes,
and appropriate discount rates. To estimate the fair value of
the reporting unit and the implied fair value of goodwill under
a hypothetical acquisition of the reporting unit, we assumed a
tax structure where a buyer would obtain a
step-up in
the tax basis of the net assets acquired. Significant
assumptions in valuing proved reserves included reserves
quantities of more than 4.4 trillion cubic feet of gas
equivalent; forward prices averaging approximately $4.65 per
thousand cubic feet of gas equivalent (Mcfe) for natural gas
(adjusted for locational differences), natural gas liquids and
oil; and an after-tax discount rate of 11 percent. Unproved
reserves (probable and possible) were valued using similar
assumptions adjusted further for the uncertainty associated with
these reserves by using after- tax discount rates of
13 percent and 15 percent, respectively, commensurate
with our estimate of the risk of those reserves. In our
assessment as of September 30, 2010, the carrying value of
the reporting unit, including goodwill, exceeded its estimated
fair value. We then determined that the implied fair value of
the goodwill was zero. As a result of our analysis, we
recognized a full $1 billion impairment charge related to
this goodwill. |
| |
|
(b) |
|
As of September 30, 2010, we also believed we had a trigger
event as a result of recent significant declines in forward
natural gas prices and therefore, we assessed the carrying value
of our natural gas-producing properties and costs of acquired
unproved reserves for impairments. Our assessment utilized
estimates of future cash flows. Significant judgments and
assumptions in these assessments are similar to those used in
the goodwill evaluation and include estimates of natural gas
reserve quantities, estimates of future natural gas prices using
a forward NYMEX curve adjusted for locational basis
differentials, drilling plans, expected capital costs, and an
applicable discount rate commensurate with risk of the
underlying cash flow estimates. The assessment performed at
September 30, 2010, identified certain properties with a
carrying value in excess of their calculated fair values. As a
result, we recorded a $678 million impairment charge in the |
F-60
WPX
Energy
Notes to
Combined Financial Statements—(Continued)
|
|
|
|
|
|
third-quarter 2010 as further described below. Fair value
measured for these properties at September 30, 2010, was
estimated to be approximately $320 million. |
|
|
|
| |
•
|
$503 million of the impairment charge related to natural
gas-producing properties in the Barnett Shale. Significant
assumptions in valuing these properties included proved reserves
quantities of more than 227 billion cubic feet of gas
equivalent, forward weighted average prices averaging
approximately $4.67 per Mcfe for natural gas (adjusted for
locational differences), natural gas liquids and oil, and an
after-tax discount rate of 11 percent.
|
| |
| |
•
|
$175 million of the impairment charge related to acquired
unproved reserves in the Piceance Highlands acquired in 2008
Significant assumptions in valuing these unproved reserves
included evaluation of probable and possible reserves
quantities, drilling plans, forward natural gas (adjusted for
locational differences) and natural gas liquids prices, and an
after-tax discount rate of 13 percent.
|
|
|
|
|
(c) |
|
Fair value of costs of acquired reserves in the Barnett Shale
measured at December 31, 2009, was $22 million.
Significant assumption in valuing these unproved reserves
included evaluation of probable and possible reserves
quantities, drilling plans, forward natural gas prices (adjusted
for locational differences) and an after-tax discount rate of
11 percent. |
| |
|
(d) |
|
Fair value measured at March 31, 2009, was zero. This value
was based on an
other-than-temporary
decline in the value of our investment considering the
deteriorating financial condition of a Venezuelan corporation in
which we own a 4 percent interest. |
|
|
|
15.
|
Financial
Instruments, Derivatives, Guarantees and Concentration of Credit
Risk
|
We use the following methods and assumptions in estimating our
fair-value disclosures for financial instruments:
Cash and cash equivalents and restricted
cash: The carrying amounts reported in the
Combined Balance Sheet approximate fair value due to the nature
of the instrument
and/or the
short-term maturity of these instruments.
Other: Includes margin deposits and
customer margin deposits payable for which the amounts reported
in the combined Balance Sheet approximate fair value.
Energy derivatives: Energy derivatives
include futures, forwards, swaps, and options. These are carried
at fair value in the Combined Balance Sheet. See Note 14
for a discussion of valuation of energy derivatives.
Carrying amounts and fair values of our financial instruments
were as follows:
| |
|
|
|
|
|
|
|
|
|
|
|
|
|
|
|
|
|
|
|
December 31,
|
|
|
|
|
2010
|
|
|
2009
|
|
|
|
|
Carrying
|
|
|
Fair
|
|
|
Carrying
|
|
|
Fair
|
|
|
Asset (Liability)
|
|
Amount
|
|
|
Value
|
|
|
Amount
|
|
|
Value
|
|
|
|
|
(Millions)
|
|
|
|
|
Cash and cash equivalents
|
|
$
|
37
|
|
|
$
|
37
|
|
|
$
|
34
|
|
|
$
|
34
|
|
|
Restricted cash
|
|
|
24
|
|
|
|
24
|
|
|
|
19
|
|
|
|
19
|
|
|
Other
|
|
|
(25
|
)
|
|
|
(25
|
)
|
|
|
(26
|
)
|
|
|
(26
|
)
|
|
Net energy derivatives:
|
|
|
|
|
|
|
|
|
|
|
|
|
|
|
|
|
|
Energy commodity cash flow hedges
|
|
|
266
|
|
|
|
266
|
|
|
|
180
|
|
|
|
180
|
|
|
Other energy derivatives
|
|
|
18
|
|
|
|
18
|
|
|
|
(92
|
)
|
|
|
(92
|
)
|
F-61
WPX
Energy
Notes to
Combined Financial Statements—(Continued)
Energy
Commodity Derivatives
We are exposed to market risk from changes in energy commodity
prices within our operations. We utilize derivatives to manage
exposure to the variability in expected future cash flows from
forecasted sales of natural gas attributable to commodity price
risk. Certain of these derivatives utilized for risk management
purposes have been designated as cash flow hedges, while other
derivatives have not been designated as cash flow hedges or do
not qualify for hedge accounting despite hedging our future cash
flows on an economic basis.
We produce, buy and sell natural gas at different locations
throughout the United States. To reduce exposure to a decrease
in revenues from fluctuations in natural gas market prices, we
enter into natural gas futures contracts, swap agreements, and
financial option contracts to mitigate the price risk on
forecasted sales of natural gas. We have also entered into basis
swap agreements to reduce the locational price risk associated
with our producing basins. These cash flow hedges are expected
to be highly effective in offsetting cash flows attributable to
the hedged risk during the term of the hedge. However,
ineffectiveness may be recognized primarily as a result of
locational differences between the hedging derivative and the
hedged item. Our financial option contracts are either purchased
options or a combination of options that comprise a net
purchased option or a zero-cost collar. Our designation of the
hedging relationship and method of assessing effectiveness for
these option contracts are generally such that the hedging
relationship is considered perfectly effective and no
ineffectiveness is recognized in earnings.
The following table sets forth the derivative volumes designated
as hedges of production volumes as of December 31, 2010:
| |
|
|
|
|
|
|
|
|
|
|
|
|
|
|
|
|
|
|
|
|
|
|
|
|
|
|
|
Weighted Average
|
|
|
|
|
|
|
|
|
|
|
Notional Volume
|
|
|
Price
|
|
Commodity
|
|
Period
|
|
|
Contract Type
|
|
Location
|
|
(BBtu)
|
|
|
($/MMBtu)
|
|
|
|
Natural Gas
|
|
|
2011
|
|
|
Costless Collar
|
|
Rockies
|
|
|
16,425
|
|
|
$5.30 - $7.10
|
|
Natural Gas
|
|
|
2011
|
|
|
Costless Collar
|
|
San Juan
|
|
|
32,850
|
|
|
$5.27 - $7.06
|
|
Natural Gas
|
|
|
2011
|
|
|
Costless Collar
|
|
MidCon
|
|
|
29,200
|
|
|
$5.10 - $7.00
|
|
Natural Gas
|
|
|
2011
|
|
|
Costless Collar
|
|
SoCal
|
|
|
10,950
|
|
|
$5.83 - $7.56
|
|
Natural Gas
|
|
|
2011
|
|
|
Costless Collar
|
|
Appalachia
|
|
|
10,950
|
|
|
$6.50 - $8.14
|
|
Natural Gas
|
|
|
2011
|
|
|
Location Swaps
|
|
Rockies
|
|
|
27,375
|
|
|
$5.57
|
|
Natural Gas
|
|
|
2011
|
|
|
Location Swaps
|
|
San Juan
|
|
|
38,325
|
|
|
$5.14
|
|
Natural Gas
|
|
|
2011
|
|
|
Location Swaps
|
|
MidCon
|
|
|
7,300
|
|
|
$5.22
|
|
Natural Gas
|
|
|
2011
|
|
|
Location Swaps
|
|
SoCal
|
|
|
7,300
|
|
|
$5.34
|
|
Natural Gas
|
|
|
2011
|
|
|
Location Swaps
|
|
Appalachia
|
|
|
23,725
|
|
|
$5.59
|
|
Natural Gas
|
|
|
2012
|
|
|
Location Swaps
|
|
Rockies
|
|
|
25,620
|
|
|
$4.79
|
|
Natural Gas
|
|
|
2012
|
|
|
Location Swaps
|
|
San Juan
|
|
|
26,535
|
|
|
$5.06
|
|
Natural Gas
|
|
|
2012
|
|
|
Location Swaps
|
|
MidCon
|
|
|
14,640
|
|
|
$4.74
|
|
Natural Gas
|
|
|
2012
|
|
|
Location Swaps
|
|
SoCal
|
|
|
9,150
|
|
|
$5.22
|
|
Natural Gas
|
|
|
2012
|
|
|
Location Swaps
|
|
Appalachia
|
|
|
20,130
|
|
|
$5.93
|
We also enter into forward contracts to buy and sell natural gas
to maximize the economic value of transportation agreements and
storage capacity agreements. To reduce exposure to a decrease in
margins from fluctuations in natural gas market prices, we may
enter into futures contracts, swap agreements, and financial
option contracts to mitigate the price risk associated with
these contracts. Hedges for transportation contracts are
designated as cash flow hedges and are expected to be highly
effective in offsetting cash flows attributable to the hedged
risk during the term of the hedge. However, ineffectiveness may
be recognized primarily as a result of locational differences
between the hedging derivative and the hedged item. Hedges for
storage
F-62
WPX
Energy
Notes to
Combined Financial Statements—(Continued)
contracts have not been designated as hedging instruments,
despite economically hedging the expected cash flows generated
by those agreements.
We also enter into commodity derivatives for other than risk
management purposes, including managing certain remaining legacy
natural gas contracts and positions from our former power
business and providing services to third parties. These legacy
natural gas contracts include substantially offsetting positions
and have had an insignificant net impact on earnings.
The following table depicts the notional amounts of the net long
(short) positions which we did not designate as hedges of our
production in our commodity derivatives portfolio as of
December 31, 2010. Natural gas is presented in millions of
British Thermal Units (MMBtu). All of the Central hub risk
realizes in 2011 and 99% of the basis risk realizes in 2011. The
net index position includes contracts for the future sale of
physical natural gas related to our production. Offsetting these
sales are contracts for the future production of physical
natural gas related to WPZ’s natural gas shrink
requirements. These contracts result in minimal commodity price
risk exposure and have a value of less than $1 million at
December 31, 2010.
| |
|
|
|
|
|
|
|
|
|
|
|
|
|
|
|
|
|
|
|
Unit of
|
|
|
Central Hub
|
|
|
Basis
|
|
|
Index
|
|
|
Derivative Notional Volumes
|
|
Measure
|
|
|
Risk(a)
|
|
|
Risk(b)
|
|
|
Risk(c)
|
|
|
|
|
Not Designated as Hedging Instruments
|
|
|
|
|
|
|
|
|
|
|
|
|
|
|
|
|
|
Risk Management
|
|
|
MMBtu
|
|
|
|
(9,077,499
|
)
|
|
|
(20,195,000
|
)
|
|
|
16,586,059
|
|
|
Other
|
|
|
MMBtu
|
|
|
|
150,400
|
|
|
|
(14,766,500
|
)
|
|
|
|
|
|
|
|
|
(a) |
|
includes physical and financial derivative transactions that
settle against the Henry Hub price; |
| |
|
(b) |
|
includes financial derivative transactions priced off the
difference in value between the Central Hub and another specific
delivery point; |
| |
|
(c) |
|
includes physical derivative transactions at an unknown future
price, including purchases of 84,583,157 MMBtu primarily on
behalf of WPZ and sales of 67,997,098 MMBtu. |
Fair
values and gains (losses)
The following table presents the fair value of energy commodity
derivatives. Our derivatives are presented as separate line
items in our Combined Balance Sheet as current and noncurrent
derivative assets and liabilities. Derivatives are classified as
current or noncurrent based on the contractual timing of
expected future net cash flows of individual contracts. The
expected future net cash flows for derivatives classified as
current are expected to occur within the next 12 months.
The fair value amounts are presented on a gross basis and do not
reflect the netting of asset and liability positions permitted
under the terms of our master netting arrangements. Further, the
amounts below do not include cash held on deposit in margin
accounts that we have received or remitted to collateralize
certain derivative positions.
| |
|
|
|
|
|
|
|
|
|
|
|
|
|
|
|
|
|
|
|
December 31,
|
|
|
|
|
2010
|
|
|
2009
|
|
|
|
|
Assets
|
|
|
Liabilities
|
|
|
Assets
|
|
|
Liabilities
|
|
|
|
|
(Millions)
|
|
|
|
|
Designated as hedging instruments
|
|
$
|
288
|
|
|
$
|
22
|
|
|
$
|
352
|
|
|
$
|
172
|
|
|
Not designated as hedging instruments:
|
|
|
|
|
|
|
|
|
|
|
|
|
|
|
|
|
|
Legacy natural gas contracts from former power business
|
|
|
186
|
|
|
|
187
|
|
|
|
505
|
|
|
|
526
|
|
|
Hedges for storage contracts and other
|
|
|
99
|
|
|
|
80
|
|
|
|
237
|
|
|
|
308
|
|
|
|
|
|
|
|
|
|
|
|
|
|
|
|
|
|
|
|
|
Total derivatives not designated as hedging instruments
|
|
|
285
|
|
|
|
267
|
|
|
|
742
|
|
|
|
834
|
|
|
|
|
|
|
|
|
|
|
|
|
|
|
|
|
|
|
|
|
Total derivatives
|
|
$
|
573
|
|
|
$
|
289
|
|
|
$
|
1,094
|
|
|
$
|
1,006
|
|
|
|
|
|
|
|
|
|
|
|
|
|
|
|
|
|
|
|
F-63
WPX
Energy
Notes to
Combined Financial Statements—(Continued)
The following table presents pre-tax gains and losses for our
energy commodity derivatives designated as cash flow hedges, as
recognized in accumulated other comprehensive income (AOCI) or
revenues.
| |
|
|
|
|
|
|
|
|
|
|
|
|
|
|
|
Years Ended December 31,
|
|
|
|
|
|
|
|
2010
|
|
|
2009
|
|
|
Classification
|
|
|
|
|
(Millions)
|
|
|
|
|
|
|
|
Net gain recognized in other comprehensive income (loss)
(effective portion)
|
|
$
|
505
|
|
|
$
|
266
|
|
|
|
AOCI
|
|
|
Net gain reclassified from accumulated other comprehensive
income (loss) into income (effective portion)(1)
|
|
$
|
354
|
|
|
$
|
621
|
|
|
|
Revenues
|
|
|
Gain recognized in income (ineffective portion)
|
|
$
|
9
|
|
|
$
|
4
|
|
|
|
Revenues
|
|
|
|
|
|
(1) |
|
Gains reclassified from accumulated other comprehensive income
(loss) primarily represent realized gains associated with our
production reflected in oil and gas sales. |
There were no gains or losses recognized in income as a result
of excluding amounts from the assessment of hedge effectiveness.
The following table presents pre-tax gains and losses for our
energy commodity derivatives not designated as hedging
instruments.
| |
|
|
|
|
|
|
|
|
|
|
|
Years Ended
|
|
|
|
|
December 31,
|
|
|
|
|
2010
|
|
|
2009
|
|
|
|
|
(Millions)
|
|
|
|
|
Gas management revenues
|
|
$
|
47
|
|
|
$
|
33
|
|
|
Gas management expenses
|
|
|
28
|
|
|
|
33
|
|
|
|
|
|
|
|
|
|
|
|
|
Net gain
|
|
$
|
19
|
|
|
$
|
—
|
|
|
|
|
|
|
|
|
|
|
|
The cash flow impact of our derivative activities is presented
in the Combined Statement of Cash Flows as changes in current
and noncurrent derivative assets and liabilities.
Credit-risk-related
features
Certain of our derivative contracts contain credit-risk-related
provisions that would require us, in certain circumstances, to
post additional collateral in support of our net derivative
liability positions. These credit-risk-related provisions
require us to post collateral in the form of cash or letters of
credit when our net liability positions exceed an established
credit threshold. The credit thresholds are typically based on
our senior unsecured debt ratings from Standard and Poor’s
and/or
Moody’s Investors Service. Under these contracts, a credit
ratings decline would lower our credit thresholds, thus
requiring us to post additional collateral. We also have
contracts that contain adequate assurance provisions giving the
counterparty the right to request collateral in an amount that
corresponds to the outstanding net liability. Additionally, we
have an unsecured credit agreement with certain banks related to
hedging activities. We are not required to provide collateral
support for net derivative liability positions under the credit
agreement as long as the value of our domestic natural gas
reserves, as determined under the provisions of the agreement,
exceeds by a specified amount certain of its obligations
including any outstanding debt and the aggregate
out-of-the-money
position on hedges entered into under the credit agreement.
As of December 31, 2010, we have collateral totaling
$8 million, all of which is in the form of letters of
credit, posted to derivative counterparties, to support the
aggregate fair value of our net derivative liability position
(reflecting master netting arrangements in place with certain
counterparties) of $36 million, which includes a reduction
of less than $1 million to our liability balance for our
own nonperformance risk. At
F-64
WPX
Energy
Notes to
Combined Financial Statements—(Continued)
December 31, 2009, we had collateral totaling
$96 million posted to derivative counterparties, all of
which was in the form of letters of credit, to support the
aggregate fair value of our net derivative liabilities position
(reflecting master netting arrangements in place with certain
counterparties) of $164 million, which included a reduction
of $3 million to our liability balance for our own
nonperformance risk. The additional collateral that we would
have been required to post, assuming our credit thresholds were
eliminated and a call for adequate assurance under the credit
risk provisions in our derivative contracts was triggered, was
$29 million and $71 million at December 31, 2010
and December 31, 2009, respectively.
Cash flow
hedges
Changes in the fair value of our cash flow hedges, to the extent
effective, are deferred in other comprehensive income and
reclassified into earnings in the same period or periods in
which the hedged forecasted purchases or sales affect earnings,
or when it is probable that the hedged forecasted transaction
will not occur by the end of the originally specified time
period. As of December 31, 2010, we have hedged portions of
future cash flows associated with anticipated energy commodity
purchases and sales for up to two years. Based on recorded
values at December 31, 2010, $148 million of net gains
(net of income tax provision of $88 million) will be
reclassified into earnings within the next year. These recorded
values are based on market prices of the commodities as of
December 31, 2010. Due to the volatile nature of commodity
prices and changes in the creditworthiness of counterparties,
actual gains or losses realized within the next year will likely
differ from these values. These gains or losses are expected to
substantially offset net losses or gains that will be realized
in earnings from previous unfavorable or favorable market
movements associated with underlying hedged transactions.
Concentration
of Credit Risk
Cash
equivalents
Our cash equivalents are primarily invested in funds with
high-quality, short-term securities and instruments that are
issued or guaranteed by the U.S. government.
Accounts
receivable
The following table summarizes concentration of receivables
(other than as relates to affiliates), net of allowances, by
product or service as of December 31:
| |
|
|
|
|
|
|
|
|
|
|
|
2010
|
|
|
2009
|
|
|
|
|
(Millions)
|
|
|
|
|
Receivables by product or service:
|
|
|
|
|
|
|
|
|
|
Sale of natural gas and related products and services
|
|
$
|
272
|
|
|
$
|
286
|
|
|
Joint interest owners
|
|
|
83
|
|
|
|
66
|
|
|
Other
|
|
|
7
|
|
|
|
7
|
|
|
|
|
|
|
|
|
|
|
|
|
Total
|
|
$
|
362
|
|
|
$
|
359
|
|
|
|
|
|
|
|
|
|
|
|
Natural gas customers include pipelines, distribution companies,
producers, gas marketers and industrial users primarily located
in the eastern and northwestern United States, Rocky Mountains
and Gulf Coast. As a general policy, collateral is not required
for receivables, but customers’ financial condition and
credit worthiness are evaluated regularly.
Derivative
assets and liabilities
We have a risk of loss from counterparties not performing
pursuant to the terms of their contractual obligations.
Counterparty performance can be influenced by changes in the
economy and regulatory issues,
F-65
WPX
Energy
Notes to
Combined Financial Statements—(Continued)
among other factors. Risk of loss is impacted by several
factors, including credit considerations and the regulatory
environment in which a counterparty transacts. We attempt to
minimize credit-risk exposure to derivative counterparties and
brokers through formal credit policies, consideration of credit
ratings from public ratings agencies, monitoring procedures,
master netting agreements and collateral support under certain
circumstances. Collateral support could include letters of
credit, payment under margin agreements, and guarantees of
payment by credit worthy parties.
We also enter into master netting agreements to mitigate
counterparty performance and credit risk. During 2010 and 2009,
we did not incur any significant losses due to counterparty
bankruptcy filings.
The gross credit exposure from our derivative contracts as of
December 31, 2010, is summarized as follows.
| |
|
|
|
|
|
|
|
|
|
|
|
Investment
|
|
|
|
|
|
Counterparty Type
|
|
Grade*
|
|
|
Total
|
|
|
|
|
(Millions)
|
|
|
|
|
Gas and electric utilities
|
|
$
|
7
|
|
|
$
|
8
|
|
|
Energy marketers and traders
|
|
|
—
|
|
|
|
133
|
|
|
Financial institutions
|
|
|
432
|
|
|
|
432
|
|
|
|
|
|
|
|
|
|
|
|
|
|
|
$
|
439
|
|
|
|
573
|
|
|
|
|
|
|
|
|
|
|
|
|
Credit reserves
|
|
|
|
|
|
|
—
|
|
|
|
|
|
|
|
|
|
|
|
|
Gross credit exposure from derivatives
|
|
|
|
|
|
$
|
573
|
|
|
|
|
|
|
|
|
|
|
|
We assess our credit exposure on a net basis to reflect master
netting agreements in place with certain counterparties. We
offset our credit exposure to each counterparty with amounts we
owe the counterparty under derivative contracts. The net credit
exposure from our derivatives as of December 31, 2010,
excluding collateral support discussed below, is summarized as
follows.
| |
|
|
|
|
|
|
|
|
|
|
|
Investment
|
|
|
|
|
|
Counterparty Type
|
|
Grade*
|
|
|
Total
|
|
|
|
|
(Millions)
|
|
|
|
|
Gas and electric utilities
|
|
$
|
3
|
|
|
$
|
3
|
|
|
Financial institutions
|
|
|
317
|
|
|
|
317
|
|
|
|
|
|
|
|
|
|
|
|
|
|
|
$
|
320
|
|
|
|
320
|
|
|
|
|
|
|
|
|
|
|
|
|
Credit reserves
|
|
|
|
|
|
|
—
|
|
|
|
|
|
|
|
|
|
|
|
|
Net credit exposure from derivatives
|
|
|
|
|
|
$
|
320
|
|
|
|
|
|
|
|
|
|
|
|
|
|
|
|
* |
|
We determine investment grade primarily using publicly available
credit ratings. We include counterparties with a minimum
Standard & Poor’s rating of BBB- or Moody’s
Investors Service rating of Baa3 in investment grade. |
Our nine largest net counterparty positions represent
approximately 99 percent of our net credit exposure from
derivatives and are all with investment grade counterparties.
Included within this group are eight counterparty positions,
representing 81 percent of our net credit exposure from
derivatives, associated with our hedging facility (see
Note 9). Under certain conditions, the terms of this credit
agreement may require the participating financial institutions
to deliver collateral support to a designated collateral agent
(which is another participating financial institution in the
agreement). The level of collateral support required is
dependent on whether the net position of the counterparty
financial institution exceeds specified thresholds.
F-66
WPX
Energy
Notes to
Combined Financial Statements—(Continued)
The thresholds may be subject to prescribed reductions based on
changes in the credit rating of the counterparty financial
institution.
At December 31, 2010, the designated collateral agent holds
$19 million of collateral support on our behalf under our
hedging facility. In addition, we hold collateral support, which
may include cash or letters of credit, of $15 million
related to our other derivative positions.
Revenues
During 2010, BP Energy Company accounted for 13% of our combined
revenues. During 2009, and 2008, there were no customers for
which our sales exceeded 10 percent of our combined
revenues. Management believes that the loss of any individual
purchaser would not have a long-term material adverse impact on
the financial position or results of operations of the Company.
Net
Assets of Operations in Foreign Locations
Net assets of operations in Argentina were $231 million and
$208 million as of December 31, 2010 and 2009,
respectively.
Information subsequent to initial date of independent
registered public accounting firm report
On June 3, 2011, WPX Energy, Inc., as borrower, entered
into a new $1.5 billion five-year senior unsecured
revolving credit facility agreement (the “Credit Facility
Agreement”), together with the lenders named therein, and
Citibank N.A. (“Citi”), as administrative agent and
swingline lender. Under the terms of the Credit Facility
Agreement and subject to certain requirements, WPX Energy, Inc.
may request an increase in the commitments of up to an
additional $300 million by either commitments from new
lenders or increased commitments from existing lenders.
Borrowings under the Credit Facility Agreement may be used for
working capital, acquisitions, capital expenditures and other
general corporate purposes.
Under the Credit Facility Agreement, WPX Energy, Inc. may also
obtain same day funds by requesting a swingline loan of up to an
amount of $125 million from the swingline lender. Interest
on swingline loans will be payable at a fluctuating base rate
equal to Citi’s adjusted base rate plus the applicable
margin.
The Credit Facility Agreement will not be effective until the
date on which certain conditions listed in the agreement
(including, among others, the completion of the initial public
offering of WPX Energy, Inc.) have been met or waived; provided
that the effective date must be on or before November 30,
2011 or such later date as may be agreed to by WPX Energy, Inc.
and the lenders. If the effective date has not occurred by
November 30, 2011, the Credit Facility Agreement will
automatically terminate unless otherwise extended by WPX Energy,
Inc. and the lenders.
Interest on borrowings under the Credit Facility Agreement will
be payable at rates per annum equal to, at the option of WPX
Energy, Inc.: (1) a fluctuating base rate equal to
Citi’s adjusted base rate plus the applicable margin, or
(2) a periodic fixed rate equal to LIBOR plus the
applicable margin. The adjusted base rate will be the highest of
(i) the federal funds rate plus 0.5 percent,
(ii) Citi’s publicly announced base rate, and
(iii) one-month LIBOR plus 1.0 percent. WPX Energy,
Inc. will be required to pay a commitment fee based on the
unused portion of the commitments under the Credit Facility
Agreement. The applicable margin and the commitment fee will be
determined by reference to a pricing schedule based on WPX
Energy, Inc.’s senior unsecured debt ratings.
Under the Credit Facility Agreement, prior to the occurrence of
the Investment Grade Date (as defined below), WPX Energy, Inc.
will be required to maintain a ratio of PV to debt (each as
defined in the Credit Facility Agreement) of at least 1.50 to
1.00. PV is determined as of the end of each fiscal year and
reflects the
F-67
WPX
Energy
Notes to
Combined Financial Statements—(Continued)
present value, discounted at 9 percent, of projected future
cash flows of domestic proved oil and gas reserves (with a
limitation of no more than 35% of proved undeveloped reserves),
based on lender projected commodity price assumptions and after
giving effect to hedge arrangements. Also, for WPX Energy, Inc.
and its consolidated subsidiaries, the ratio of debt to
capitalization (defined as net worth plus debt) will not be
permitted to be greater than 60%. Each of the above ratios will
be tested beginning June 30, 2011 at the end of each fiscal
quarter. Investment Grade Date means the first date on which WPX
Energy, Inc.’s long-term senior unsecured debt ratings are
BBB- or better by S&P or Baa3 or better by Moody’s
(without negative outlook or negative watch), provided that the
other of the two ratings is at least BB+ by S&P or Ba1 by
Moody’s.
The Credit Facility Agreement contains customary representations
and warranties and affirmative, negative and financial covenants
which were made only for the purposes of the Credit Facility
Agreement and as of the specific date (or dates) set forth
therein, and may be subject to certain limitations as agreed
upon by the contracting parties. The covenants limit, among
other things, the ability of WPX Energy, Inc.’s
subsidiaries to incur indebtedness, WPX Energy, Inc. and its
material subsidiaries from granting certain liens supporting
indebtedness, making investments, loans or advances and entering
into certain hedging agreements, WPX Energy, Inc.’s ability
to merge or consolidate with any person or sell all or
substantially all of its assets to any person, enter into
certain affiliate transactions, make certain distributions
during the continuation of an event of default and allow
material changes in the nature of its business. In addition, the
representations, warranties and covenants contained in the
Credit Facility Agreement may be subject to standards of
materiality applicable to the contracting parties that differ
from those applicable to investors. Investors are not
third-party beneficiaries of the Credit Facility Agreement and
should not rely on the representations, warranties and covenants
contained therein, or any descriptions thereof, as
characterizations of the actual state of facts or conditions of
WPX Energy, Inc.
The Credit Facility Agreement includes customary events of
default, including events of default relating to non-payment of
principal, interest or fees, inaccuracy of representations and
warranties in any material respect when made or when deemed
made, violation of covenants, cross payment-defaults, cross
acceleration, bankruptcy and insolvency events, certain
unsatisfied judgments and a change of control. If an event of
default with respect to a borrower occurs under the Credit
Facility Agreement, the lenders will be able to terminate the
commitments and accelerate the maturity of the loans of the
defaulting borrower under the Credit Facility Agreement and
exercise other rights and remedies.
F-68
WPX
Energy
Supplemental
Oil and Gas Disclosures
(Unaudited)
We have significant oil and gas producing activities primarily
in the Rocky Mountain, Northeast and Mid-continent areas of the
United States. Additionally, we have international oil and gas
producing activities, primarily in Argentina. This information
also excludes our gas management activities.
With the exception of the Results of Operations, the following
information includes our Arkoma Basin operations which have been
reported as discontinued operations in our combined financial
statements. These operations represent approximately one percent
or less of our total domestic and international proved reserves
for all periods presented.
Capitalized
Costs
| |
|
|
|
|
|
|
|
|
|
|
|
|
|
|
|
|
|
|
|
As of December 31, 2009
|
|
|
|
|
|
|
|
|
|
|
|
|
|
Entity’s share of
|
|
|
|
|
|
|
|
|
|
|
|
|
|
international
|
|
|
|
|
|
|
|
|
|
|
Consolidated
|
|
|
equity method
|
|
|
|
|
Domestic
|
|
|
International
|
|
|
Total
|
|
|
investee
|
|
|
|
|
Proved Properties
|
|
$
|
9,176
|
|
|
$
|
180
|
|
|
$
|
9,356
|
|
|
$
|
187
|
|
|
Unproved properties
|
|
|
945
|
|
|
|
3
|
|
|
|
948
|
|
|
|
—
|
|
|
|
|
|
|
|
|
|
|
|
|
|
|
|
|
|
|
|
|
|
|
|
10,121
|
|
|
|
183
|
|
|
|
10,304
|
|
|
|
187
|
|
|
Accumulated depreciation, depletion and amortization and
valuation provisions
|
|
|
(3,213
|
)
|
|
|
(94
|
)
|
|
|
(3,307
|
)
|
|
|
(109
|
)
|
|
|
|
|
|
|
|
|
|
|
|
|
|
|
|
|
|
|
|
Net capitalized costs
|
|
$
|
6,908
|
|
|
$
|
89
|
|
|
$
|
6,997
|
|
|
$
|
78
|
|
|
|
|
|
|
|
|
|
|
|
|
|
|
|
|
|
|
|
| |
|
|
|
|
|
|
|
|
|
|
|
|
|
|
|
|
|
|
|
As of December 31, 2010
|
|
|
|
|
|
|
|
|
|
|
|
|
|
Entity’s share of
|
|
|
|
|
|
|
|
|
|
|
|
|
|
international
|
|
|
|
|
|
|
|
|
|
|
Consolidated
|
|
|
equity method
|
|
|
|
|
Domestic
|
|
|
International
|
|
|
Total
|
|
|
investee
|
|
|
|
|
Proved Properties
|
|
$
|
9,854
|
|
|
$
|
213
|
|
|
$
|
10,067
|
|
|
$
|
220
|
|
|
Unproved properties
|
|
|
2,094
|
|
|
|
3
|
|
|
|
2,097
|
|
|
|
—
|
|
|
|
|
|
|
|
|
|
|
|
|
|
|
|
|
|
|
|
|
|
|
|
11,948
|
|
|
|
216
|
|
|
|
12,164
|
|
|
|
220
|
|
|
Accumulated depreciation, depletion and amortization and
valuation provisions
|
|
|
(3,867
|
)
|
|
|
(109
|
)
|
|
|
(3,976
|
)
|
|
|
(129
|
)
|
|
|
|
|
|
|
|
|
|
|
|
|
|
|
|
|
|
|
|
Net capitalized costs
|
|
$
|
8,081
|
|
|
|
107
|
|
|
$
|
8,188
|
|
|
$
|
91
|
|
|
|
|
|
|
|
|
|
|
|
|
|
|
|
|
|
|
|
|
|
|
| |
•
|
Excluded from capitalized costs are equipment and facilities in
support of oil and gas production of $312 million and
$727 million, net, for 2010 and 2009, respectively.
|
| |
| |
•
|
Proved properties include capitalized costs for oil and gas
leaseholds holding proved reserves, development wells including
uncompleted development well costs, and successful exploratory
wells.
|
| |
| |
•
|
Unproved properties consist primarily of unproved leasehold
costs and costs for acquired unproven reserves.
|
F-69
WPX
Energy
Supplemental
Oil and Gas Disclosures—(Continued)
(Unaudited)
Cost
Incurred
| |
|
|
|
|
|
|
|
|
|
|
|
|
|
|
|
|
|
|
|
|
|
Entity’s share of
|
|
|
|
|
|
|
|
|
|
|
international
|
|
|
|
|
|
|
|
|
|
|
equity method
|
|
|
|
|
Domestic
|
|
|
International
|
|
|
investee
|
|
|
|
|
(Millions)
|
|
|
|
|
For the Year Ended December 31, 2008
|
|
|
|
|
|
|
|
|
|
|
|
|
|
Acquisition
|
|
$
|
543
|
|
|
$
|
—
|
|
|
$
|
—
|
|
|
Exploration
|
|
|
38
|
|
|
|
9
|
|
|
|
7
|
|
|
Development
|
|
|
1,699
|
|
|
|
27
|
|
|
|
25
|
|
|
|
|
|
|
|
|
|
|
|
|
|
|
|
|
|
|
$
|
2,280
|
|
|
$
|
36
|
|
|
$
|
32
|
|
|
|
|
|
|
|
|
|
|
|
|
|
|
|
|
For the Year Ended December 31, 2009
|
|
|
|
|
|
|
|
|
|
|
|
|
|
Acquisition
|
|
$
|
305
|
|
|
$
|
3
|
|
|
$
|
—
|
|
|
Exploration
|
|
|
51
|
|
|
|
3
|
|
|
|
3
|
|
|
Development
|
|
|
878
|
|
|
|
19
|
|
|
|
21
|
|
|
|
|
|
|
|
|
|
|
|
|
|
|
|
|
|
|
$
|
1,234
|
|
|
$
|
25
|
|
|
$
|
24
|
|
|
|
|
|
|
|
|
|
|
|
|
|
|
|
|
For the Year Ended December 31, 2010
|
|
|
|
|
|
|
|
|
|
|
|
|
|
Acquisition
|
|
$
|
1,731
|
|
|
$
|
—
|
|
|
$
|
—
|
|
|
Exploration
|
|
|
22
|
|
|
|
13
|
|
|
|
3
|
|
|
Development
|
|
|
988
|
|
|
|
27
|
|
|
|
25
|
|
|
|
|
|
|
|
|
|
|
|
|
|
|
|
|
|
|
$
|
2,741
|
|
|
$
|
40
|
|
|
$
|
28
|
|
|
|
|
|
|
|
|
|
|
|
|
|
|
|
|
|
|
| |
•
|
Costs incurred include capitalized and expensed items.
|
|
|
|
| |
•
|
Acquisition costs are as follows: The 2010 costs are primarily
for additional leasehold in the Williston and Marcellus Basins
and include approximately $422 million of proved property
values. The 2009 costs are primarily for additional leasehold
and reserve acquisitions in the Piceance Basin, and include
$85 million of proved property values. The 2008 costs are
primarily for additional leasehold and reserve acquisitions in
the Piceance and Fort Worth Basins. Included in the 2008
acquisition amounts is $140 million of proved property
values and $71 million related to an interest in a portion
of acquired assets that a third party subsequently exercised its
contractual option to purchase from us, on the same terms and
conditions.
|
|
|
|
| |
•
|
Exploration costs include the costs incurred for geological and
geophysical activity, drilling and equipping exploratory wells,
including costs incurred during the year for wells determined to
be dry holes, exploratory lease acquisitions, and retaining
undeveloped leaseholds.
|
| |
| |
•
|
Development costs include costs incurred to gain access to and
prepare well locations for drilling and to drill and equip wells
in our development basins.
|
| |
| |
•
|
We have classified our step-out drilling and site preparation
costs in the Powder River Basin as development, although the
immediate offsets are frequently in the dewatering stages in as
much as it better reflects the low risk profile of the costs
incurred.
|
F-70
WPX
Energy
Supplemental
Oil and Gas Disclosures—(Continued)
(Unaudited)
Results
of Operations
| |
|
|
|
|
|
|
|
|
|
|
|
|
|
|
|
Domestic
|
|
|
International
|
|
|
Total
|
|
|
|
|
(Millions)
|
|
|
|
|
For the Year Ended December 31, 2008
|
|
|
|
|
|
|
|
|
|
|
|
|
|
Revenues:
|
|
|
|
|
|
|
|
|
|
|
|
|
|
Oil and gas revenues
|
|
$
|
2,810
|
|
|
$
|
72
|
|
|
$
|
2,882
|
|
|
Other revenues
|
|
|
32
|
|
|
|
—
|
|
|
|
32
|
|
|
|
|
|
|
|
|
|
|
|
|
|
|
|
|
Total revenues
|
|
|
2,842
|
|
|
|
72
|
|
|
|
2,914
|
|
|
|
|
|
|
|
|
|
|
|
|
|
|
|
|
Costs:
|
|
|
|
|
|
|
|
|
|
|
|
|
|
Lease and facility operating
|
|
|
255
|
|
|
|
17
|
|
|
|
272
|
|
|
Gathering, processing & transportation
|
|
|
229
|
|
|
|
—
|
|
|
|
229
|
|
|
Taxes other than income
|
|
|
242
|
|
|
|
12
|
|
|
|
254
|
|
|
Exploration expenses
|
|
|
31
|
|
|
|
6
|
|
|
|
37
|
|
|
Depreciation, depletion & amortization
|
|
|
724
|
|
|
|
14
|
|
|
|
738
|
|
|
General and administrative
|
|
|
217
|
|
|
|
7
|
|
|
|
224
|
|
|
Gain on sale of international production payment right
|
|
|
—
|
|
|
|
(148
|
)
|
|
|
(148
|
)
|
|
Other (income) expense
|
|
|
4
|
|
|
|
2
|
|
|
|
6
|
|
|
|
|
|
|
|
|
|
|
|
|
|
|
|
|
Total costs
|
|
|
1,702
|
|
|
|
(90
|
)
|
|
|
1,612
|
|
|
|
|
|
|
|
|
|
|
|
|
|
|
|
|
Results of operations
|
|
|
1,140
|
|
|
|
162
|
|
|
|
1,302
|
|
|
(Provision) benefit for income taxes
|
|
|
(416
|
)
|
|
|
(59
|
)
|
|
|
(475
|
)
|
|
|
|
|
|
|
|
|
|
|
|
|
|
|
|
Exploration and production net income (loss)
|
|
$
|
724
|
|
|
$
|
103
|
|
|
$
|
827
|
|
|
|
|
|
|
|
|
|
|
|
|
|
|
|
F-71
WPX
Energy
Supplemental
Oil and Gas Disclosures—(Continued)
(Unaudited)
| |
|
|
|
|
|
|
|
|
|
|
|
|
|
|
|
Domestic
|
|
|
International
|
|
|
Total
|
|
|
|
|
(Millions)
|
|
|
|
|
For the Year Ended December 31, 2009
|
|
|
|
|
|
|
|
|
|
|
|
|
|
Revenues:
|
|
|
|
|
|
|
|
|
|
|
|
|
|
Oil and gas revenues
|
|
$
|
2,090
|
|
|
$
|
78
|
|
|
$
|
2,168
|
|
|
Other revenues
|
|
|
39
|
|
|
|
—
|
|
|
|
39
|
|
|
|
|
|
|
|
|
|
|
|
|
|
|
|
|
Total revenues
|
|
|
2,129
|
|
|
|
78
|
|
|
|
2,207
|
|
|
|
|
|
|
|
|
|
|
|
|
|
|
|
|
Costs:
|
|
|
|
|
|
|
|
|
|
|
|
|
|
Lease and facility operating
|
|
|
247
|
|
|
|
16
|
|
|
|
263
|
|
|
Gathering, processing & transportation
|
|
|
273
|
|
|
|
—
|
|
|
|
273
|
|
|
Taxes other than income
|
|
|
80
|
|
|
|
13
|
|
|
|
93
|
|
|
Exploration expenses
|
|
|
52
|
|
|
|
2
|
|
|
|
54
|
|
|
Depreciation, depletion & amortization
|
|
|
870
|
|
|
|
17
|
|
|
|
887
|
|
|
Impairment of costs of acquired unproved reserves
|
|
|
15
|
|
|
|
—
|
|
|
|
15
|
|
|
General and administrative
|
|
|
221
|
|
|
|
9
|
|
|
|
230
|
|
|
Other (income) expense
|
|
|
33
|
|
|
|
—
|
|
|
|
33
|
|
|
|
|
|
|
|
|
|
|
|
|
|
|
|
|
Total costs
|
|
|
1,791
|
|
|
|
57
|
|
|
|
1,848
|
|
|
|
|
|
|
|
|
|
|
|
|
|
|
|
|
Results of operations
|
|
|
338
|
|
|
|
21
|
|
|
|
359
|
|
|
(Provision) benefit for income taxes
|
|
|
(123
|
)
|
|
|
(8
|
)
|
|
|
(131
|
)
|
|
|
|
|
|
|
|
|
|
|
|
|
|
|
|
Exploration and production net income (loss)
|
|
$
|
215
|
|
|
$
|
13
|
|
|
$
|
228
|
|
|
|
|
|
|
|
|
|
|
|
|
|
|
|
F-72
WPX
Energy
Supplemental
Oil and Gas Disclosures—(Continued)
(Unaudited)
| |
|
|
|
|
|
|
|
|
|
|
|
|
|
|
|
Domestic
|
|
|
International
|
|
|
Total
|
|
|
|
|
(Millions)
|
|
|
|
|
For the Year Ended December 31, 2010
|
|
|
|
|
|
|
|
|
|
|
|
|
|
Revenues:
|
|
|
|
|
|
|
|
|
|
|
|
|
|
Oil and gas revenues
|
|
$
|
2,136
|
|
|
$
|
89
|
|
|
$
|
2,225
|
|
|
Other revenues
|
|
|
40
|
|
|
|
—
|
|
|
|
40
|
|
|
|
|
|
|
|
|
|
|
|
|
|
|
|
|
Total revenues
|
|
|
2,176
|
|
|
|
89
|
|
|
|
2,265
|
|
|
|
|
|
|
|
|
|
|
|
|
|
|
|
|
Costs:
|
|
|
|
|
|
|
|
|
|
|
|
|
|
Lease and facility operating
|
|
|
267
|
|
|
|
19
|
|
|
|
286
|
|
|
Gathering, processing & transportation
|
|
|
326
|
|
|
|
—
|
|
|
|
326
|
|
|
Taxes other than income
|
|
|
109
|
|
|
|
16
|
|
|
|
125
|
|
|
Exploration expenses
|
|
|
67
|
|
|
|
6
|
|
|
|
73
|
|
|
Depreciation, depletion & amortization
|
|
|
858
|
|
|
|
17
|
|
|
|
875
|
|
|
Impairment of certain natural gas properties in the
Ft. Worth Basin
|
|
|
503
|
|
|
|
—
|
|
|
|
503
|
|
|
Impairment of costs of acquired unproved reserves
|
|
|
175
|
|
|
|
—
|
|
|
|
175
|
|
|
Goodwill impairment
|
|
|
1,003
|
|
|
|
—
|
|
|
|
1,003
|
|
|
General and administrative
|
|
|
225
|
|
|
|
9
|
|
|
|
234
|
|
|
Other (income) expense
|
|
|
(19
|
)
|
|
|
—
|
|
|
|
(19
|
)
|
|
|
|
|
|
|
|
|
|
|
|
|
|
|
|
Total costs
|
|
|
3,514
|
|
|
|
67
|
|
|
|
3,581
|
|
|
|
|
|
|
|
|
|
|
|
|
|
|
|
|
Results of operations
|
|
|
(1,338
|
)
|
|
|
22
|
|
|
|
(1,316
|
)
|
|
(Provision) benefit for income taxes
|
|
|
123
|
|
|
|
(8
|
)
|
|
|
115
|
|
|
|
|
|
|
|
|
|
|
|
|
|
|
|
|
Exploration and production net income (loss)
|
|
$
|
(1,215
|
)
|
|
$
|
14
|
|
|
$
|
(1,201
|
)
|
|
|
|
|
|
|
|
|
|
|
|
|
|
|
|
|
|
| |
•
|
Amount for all years exclude the equity earnings from the
international equity method investee. Equity earnings from this
investee were $16 million, $14 million and
$16 million in 2010, 2009 and 2008.
|
| |
| |
•
|
Oil and gas revenues consist primarily of natural gas production
sold and includes the impact of hedges.
|
| |
| |
•
|
Other revenues consist of activities that are an indirect part
of the producing activities. Other expenses in 2009 also include
$32 million of expense related to penalties from the early
release of drilling rigs.
|
| |
| |
•
|
Exploration expenses include the costs of geological and
geophysical activity, drilling and equipping exploratory wells
determined to be dry holes, and the cost of retaining
undeveloped leaseholds including lease amortization and
impairments.
|
| |
| |
•
|
Depreciation, depletion and amortization includes depreciation
of support equipment. Additionally, 2009 includes
$17 million additional depreciation, depletion and
amortization as a result of our recalculation of fourth quarter
depreciation, depletion and amortization utilizing our year-end
reserves which were lower than 2008. The lower reserves are
primarily a result of the application of new rules issued by the
SEC.
|
F-73
WPX
Energy
Supplemental
Oil and Gas Disclosures—(Continued)
(Unaudited)
Proved
Reserves
| |
|
|
|
|
|
|
|
|
|
|
|
|
|
|
|
|
|
|
|
|
|
|
|
|
|
Entity’s share of
|
|
|
|
|
|
|
|
|
|
|
|
|
|
international
|
|
|
|
|
|
|
|
|
|
|
|
|
|
equity method
|
|
|
|
|
|
|
|
Domestic
|
|
|
International(1)
|
|
|
investee(2)
|
|
|
Combined
|
|
|
|
|
(Bcfe)
|
|
|
(MMBoe)
|
|
|
(MMBoe)
|
|
|
(Bcfe)
|
|
|
|
|
For The Year Ended December 31, 2008
|
|
|
|
|
|
|
|
|
|
|
|
|
|
|
|
|
|
Proved reserves at the beginning of period
|
|
|
4,143
|
|
|
|
21
|
|
|
|
15
|
|
|
|
4,357
|
|
|
Revisions
|
|
|
(220
|
)
|
|
|
1
|
|
|
|
—
|
|
|
|
(208
|
)
|
|
Purchases
|
|
|
31
|
|
|
|
—
|
|
|
|
—
|
|
|
|
31
|
|
|
Extensions and discoveries
|
|
|
791
|
|
|
|
2
|
|
|
|
1
|
|
|
|
810
|
|
|
Wellhead production
|
|
|
(406
|
)
|
|
|
(2
|
)
|
|
|
(2
|
)
|
|
|
(434
|
)
|
|
|
|
|
|
|
|
|
|
|
|
|
|
|
|
|
|
|
|
Proved reserves at the end of period
|
|
|
4,339
|
|
|
|
22
|
|
|
|
14
|
|
|
|
4,556
|
|
|
|
|
|
|
|
|
|
|
|
|
|
|
|
|
|
|
|
|
Proved developed reserves at end of period
|
|
|
2,456
|
|
|
|
15
|
|
|
|
10
|
|
|
|
2,607
|
|
|
|
|
|
|
|
|
|
|
|
|
|
|
|
|
|
|
|
|
For the year ended December 31, 2009
|
|
|
|
|
|
|
|
|
|
|
|
|
|
|
|
|
|
Proved reserves at the beginning of period
|
|
|
4,339
|
|
|
|
22
|
|
|
|
14
|
|
|
|
4,556
|
|
|
Revisions
|
|
|
(859
|
)
|
|
|
2
|
|
|
|
1
|
|
|
|
(841
|
)
|
|
Purchases
|
|
|
159
|
|
|
|
—
|
|
|
|
—
|
|
|
|
159
|
|
|
Extensions and discoveries
|
|
|
1,051
|
|
|
|
5
|
|
|
|
7
|
|
|
|
1,123
|
|
|
Wellhead production
|
|
|
(435
|
)
|
|
|
(3
|
)
|
|
|
(2
|
)
|
|
|
(466
|
)
|
|
|
|
|
|
|
|
|
|
|
|
|
|
|
|
|
|
|
|
Proved reserves at the end of period
|
|
|
4,255
|
|
|
|
26
|
|
|
|
20
|
|
|
|
4,531
|
|
|
|
|
|
|
|
|
|
|
|
|
|
|
|
|
|
|
|
|
Proved developed reserves at end of period
|
|
|
2,387
|
|
|
|
17
|
|
|
|
12
|
|
|
|
2,562
|
|
|
|
|
|
|
|
|
|
|
|
|
|
|
|
|
|
|
|
|
For the year ended December 31, 2010
|
|
|
|
|
|
|
|
|
|
|
|
|
|
|
|
|
|
Proved reserves at the beginning of period
|
|
|
4,255
|
|
|
|
26
|
|
|
|
20
|
|
|
|
4,531
|
|
|
Revisions
|
|
|
(233
|
)
|
|
|
(2
|
)
|
|
|
1
|
|
|
|
(242
|
)
|
|
Purchases
|
|
|
162
|
|
|
|
—
|
|
|
|
—
|
|
|
|
162
|
|
|
Extensions and discoveries
|
|
|
508
|
|
|
|
4
|
|
|
|
4
|
|
|
|
557
|
|
|
Wellhead production
|
|
|
(420
|
)
|
|
|
(3
|
)
|
|
|
(2
|
)
|
|
|
(450
|
)
|
|
|
|
|
|
|
|
|
|
|
|
|
|
|
|
|
|
|
|
Proved reserves at the end of period
|
|
|
4,272
|
|
|
|
25
|
|
|
|
23
|
|
|
|
4,558
|
|
|
|
|
|
|
|
|
|
|
|
|
|
|
|
|
|
|
|
|
Proved developed reserves at end of period
|
|
|
2,498
|
|
|
|
15
|
|
|
|
14
|
|
|
|
2,671
|
|
|
|
|
|
|
|
|
|
|
|
|
|
|
|
|
|
|
|
|
|
|
|
(1) |
|
Reserves attributable to a consolidated subsidiary (Apco) in
which there is a 31 percent noncontrolling interest. |
| |
|
(2) |
|
Represents Apco’s 40.8% interest in reserves of Petrolera
Entre Lomas S.A. |
|
|
|
| |
•
|
The SEC defines proved oil and gas reserves
(Rule 4-10(a)
of
Regulation S-X)
as those quantities of oil and gas, which, by analysis of
geoscience and engineering data, can be estimated with
reasonable certainty to be economically producible—from a
given date forward, from known reservoirs, and under existing
economic conditions, operating methods, and government
regulations—prior to the time at which contracts providing
the right to operate expire, unless evidence indicates that
renewal is
|
F-74
WPX
Energy
Supplemental
Oil and Gas Disclosures—(Continued)
(Unaudited)
|
|
|
| |
|
reasonably certain, regardless of whether deterministic or
probabilistic methods are used for the estimation. The project
to extract the hydrocarbons must have commenced or the operator
must be reasonably certain that it will commence the project
within a reasonable time. Proved reserves consist of two
categories, proved developed reserves and proved undeveloped
reserves. Proved developed reserves are currently producing
wells and wells awaiting minor sales connection expenditure,
recompletion, additional perforations or borehole stimulation
treatments. Proved undeveloped reserves are those reserves which
are expected to be recovered from new wells on undrilled acreage
or from existing wells where a relatively major expenditure is
required for recompletion. Proved reserves on undrilled acreage
are generally limited to those that can be developed within five
years according to planned drilling activity. Proved reserves on
undrilled acreage also can include locations that are more than
one offset away from current producing wells where there is a
reasonable certainty of production when drilled or where it can
be demonstrated with reasonable certainty that there is
continuity of production from the existing productive formation.
|
|
|
|
| |
•
|
Purchases in 2008, 2009 and 2010 include proved developed
reserves of 17 Bcfe, 2.4 Bcfe and 42 Bcfe,
respectively.
|
| |
| |
•
|
Revisions in 2010 primarily relate to the reclassification of
reserves from proved to probable reserves attributable to
locations not expected to be developed within five years. A
significant portion of the revisions for 2009 are a result of
the impact of the new SEC rules. Proved reserves are lower
because of the lower
12-month
average,
first-of-the-month
price as compared to the 2008 year-end price, and the
revision of proved undeveloped reserve estimates based on new
guidance. Approximately one-half of the revisions for 2008
relate to the impact of lower average year-end natural gas
prices used in 2008 compared to the 2007.
|
| |
| |
•
|
Extensions and discoveries in 2009 are higher than other years
due in part to the expanded definition of oil and gas reserves
supported by reliable technology and reasonable certainty used
for reserves estimation.
|
| |
| |
•
|
Natural gas reserves are computed at 14.73 pounds per square
inch absolute and 60 degrees Fahrenheit. Domestic crude oil
reserves are insignificant and have been included in the
domestic proved reserves on a basis of billion cubic feet
equivalents (Bcfe).
|
Standardized
Measure of Discounted Future Net Cash Flows Relating to Proved
Oil and Gas Reserves
The following is based on the estimated quantities of proved
reserves. In 2009, we adopted prescribed accounting revisions
associated with oil and gas authoritative guidance. Those
revisions include using the
12-month
average price computed as an unweighted arithmetic average of
the price as of the first day of each month, unless prices are
defined by contractual arrangements. These revisions are
reflected in our 2010 and 2009 amounts. For the years ended
December 31, 2010 and 2009, the average domestic natural
gas equivalent price used in the estimates was $3.78 and $2.76
per MMcfe, respectively. For the year ended December 31,
2008, the average domestic year-end natural gas equivalent price
used in the estimates was $4.41 per MMcfe. Future income tax
expenses have been computed considering applicable taxable cash
flows and appropriate statutory tax rates. The discount rate of
10 percent is as prescribed by authoritative guidance.
Continuation of year-end economic conditions also is assumed.
The calculation is based on estimates of proved reserves, which
are revised over time as new data becomes available. Probable or
possible reserves, which may become proved in the future, are
not considered. The calculation also requires assumptions as to
the timing of future production of proved reserves, and the
timing and amount of future development and production costs.
Numerous uncertainties are inherent in estimating volumes and
the value of proved reserves and in projecting future production
rates and timing of development expenditures. Such reserve
estimates are subject
F-75
WPX
Energy
Supplemental
Oil and Gas Disclosures—(Continued)
(Unaudited)
to change as additional information becomes available. The
reserves actually recovered and the timing of production may be
substantially different from the reserve estimates.
Standardized
Measure of Discounted Future Net Cash Flows
| |
|
|
|
|
|
|
|
|
|
|
|
|
|
|
|
|
|
|
|
|
|
Entity’s share
|
|
|
|
|
|
|
|
|
|
|
of international
|
|
|
|
|
|
|
|
|
|
|
equity method
|
|
|
As of December 31, 2009
|
|
Domestic
|
|
|
International(1)
|
|
|
investee(2)
|
|
|
|
|
(Millions)
|
|
|
|
|
Future cash inflows
|
|
$
|
11,729
|
|
|
$
|
664
|
|
|
$
|
614
|
|
|
Less:
|
|
|
|
|
|
|
|
|
|
|
|
|
|
Future production costs
|
|
|
3,990
|
|
|
|
227
|
|
|
|
228
|
|
|
Future development costs
|
|
|
2,833
|
|
|
|
83
|
|
|
|
91
|
|
|
Future income tax provisions
|
|
|
1,404
|
|
|
|
67
|
|
|
|
73
|
|
|
|
|
|
|
|
|
|
|
|
|
|
|
|
|
Future net cash flows
|
|
|
3,502
|
|
|
|
287
|
|
|
|
222
|
|
|
Less 10 percent annual discount for estimated timing of
cash flows
|
|
|
(1,789
|
)
|
|
|
(112
|
)
|
|
|
(93
|
)
|
|
|
|
|
|
|
|
|
|
|
|
|
|
|
|
Standardized measure of discounted future net cash inflows
|
|
$
|
1,713
|
|
|
$
|
175
|
|
|
$
|
129
|
|
|
|
|
|
|
|
|
|
|
|
|
|
|
|
| |
|
|
|
|
|
|
|
|
|
|
|
|
|
|
|
|
|
|
|
|
|
Entity’s share
|
|
|
|
|
|
|
|
|
|
|
of international
|
|
|
|
|
|
|
|
|
|
|
equity method
|
|
|
As of December 31, 2010
|
|
Domestic
|
|
|
International(1)
|
|
|
investee(2)
|
|
|
|
|
Future cash inflows
|
|
$
|
16,151
|
|
|
$
|
779
|
|
|
$
|
787
|
|
|
Less:
|
|
|
|
|
|
|
|
|
|
|
|
|
|
Future production costs
|
|
|
4,927
|
|
|
|
273
|
|
|
|
278
|
|
|
Future development costs
|
|
|
2,960
|
|
|
|
89
|
|
|
|
92
|
|
|
Future income tax provisions
|
|
|
2,722
|
|
|
|
98
|
|
|
|
114
|
|
|
|
|
|
|
|
|
|
|
|
|
|
|
|
|
Future net cash flows
|
|
|
5,542
|
|
|
|
319
|
|
|
|
303
|
|
|
Less 10 percent annual discount for estimated timing of
cash flows
|
|
|
(2,728
|
)
|
|
|
(121
|
)
|
|
|
(117
|
)
|
|
|
|
|
|
|
|
|
|
|
|
|
|
|
|
Standardized measure of discounted future net cash inflows
|
|
$
|
2,814
|
|
|
$
|
198
|
|
|
$
|
186
|
|
|
|
|
|
|
|
|
|
|
|
|
|
|
|
|
|
|
|
(1) |
|
Amounts attributable to a consolidated subsidiary (Apco) in
which there is a 31 percent noncontrolling interest. |
| |
|
(2) |
|
Represents Apco’s 40.8% interest in Petrolera Entre Lomas
S.A. |
F-76
WPX
Energy
Supplemental
Oil and Gas Disclosures—(Continued)
(Unaudited)
Sources
of Change in Standardized Measure of Discounted Future Net Cash
Flows
| |
|
|
|
|
|
|
|
|
|
|
|
|
|
|
|
|
|
|
|
|
|
Entity’s share
|
|
|
|
|
|
|
|
|
|
|
of international
|
|
|
|
|
|
|
|
|
|
|
equity method
|
|
|
For the Year Ended December 31, 2008
|
|
Domestic
|
|
|
International(1)
|
|
|
investee(2)
|
|
|
|
|
(Millions)
|
|
|
|
|
Standardized measure of discounted future net cash flows
beginning of period
|
|
$
|
4,803
|
|
|
$
|
149
|
|
|
$
|
115
|
|
|
Changes during the year:
|
|
|
|
|
|
|
|
|
|
|
|
|
|
Sales of oil and gas produced, net of operating costs
|
|
|
(2,091
|
)
|
|
|
(55
|
)
|
|
|
(55
|
)
|
|
Net change in prices and production costs
|
|
|
(2,548
|
)
|
|
|
25
|
|
|
|
34
|
|
|
Extensions, discoveries and improved recovery, less estimated
future costs
|
|
|
1,423
|
|
|
|
—
|
|
|
|
—
|
|
|
Development costs incurred during year
|
|
|
817
|
|
|
|
33
|
|
|
|
25
|
|
|
Changes in estimated future development costs
|
|
|
(724
|
)
|
|
|
(36
|
)
|
|
|
(36
|
)
|
|
Purchase of reserves in place, less estimated future costs
|
|
|
55
|
|
|
|
—
|
|
|
|
—
|
|
|
Revisions of previous quantity estimates
|
|
|
(395
|
)
|
|
|
50
|
|
|
|
38
|
|
|
Accretion of discount
|
|
|
714
|
|
|
|
13
|
|
|
|
18
|
|
|
Net change in income taxes
|
|
|
1,108
|
|
|
|
3
|
|
|
|
—
|
|
|
Other
|
|
|
11
|
|
|
|
(7
|
)
|
|
|
(8
|
)
|
|
|
|
|
|
|
|
|
|
|
|
|
|
|
|
Net changes
|
|
|
(1,630
|
)
|
|
|
26
|
|
|
|
16
|
|
|
|
|
|
|
|
|
|
|
|
|
|
|
|
|
Standardized measure of discounted future net cash flows end of
period
|
|
$
|
3,173
|
|
|
$
|
175
|
|
|
$
|
131
|
|
|
|
|
|
|
|
|
|
|
|
|
|
|
|
F-77
WPX
Energy
Supplemental
Oil and Gas Disclosures—(Continued)
(Unaudited)
| |
|
|
|
|
|
|
|
|
|
|
|
|
|
|
|
|
|
|
|
|
|
Entity’s share
|
|
|
|
|
|
|
|
|
|
|
of international
|
|
|
|
|
|
|
|
|
|
|
equity method
|
|
|
For the Year Ended December 31, 2009
|
|
Domestic
|
|
|
International(1)
|
|
|
investee(2)
|
|
|
|
|
(Millions)
|
|
|
|
|
Standardized measure of discounted future net cash flows
beginning of period
|
|
$
|
3,173
|
|
|
$
|
175
|
|
|
$
|
131
|
|
|
Changes during the year:
|
|
|
|
|
|
|
|
|
|
|
|
|
|
Sales of oil and gas produced, net of operating costs
|
|
|
(1,006
|
)
|
|
|
(49
|
)
|
|
|
(45
|
)
|
|
Net change in prices and production costs
|
|
|
(3,310
|
)
|
|
|
(35
|
)
|
|
|
(49
|
)
|
|
Extensions, discoveries and improved recovery, less estimated
future costs
|
|
|
1,131
|
|
|
|
—
|
|
|
|
—
|
|
|
Development costs incurred during year
|
|
|
389
|
|
|
|
17
|
|
|
|
21
|
|
|
Changes in estimated future development costs
|
|
|
701
|
|
|
|
(1
|
)
|
|
|
(3
|
)
|
|
Purchase of reserves in place, less estimated future costs
|
|
|
171
|
|
|
|
—
|
|
|
|
—
|
|
|
Revisions of previous quantity estimates
|
|
|
(923
|
)
|
|
|
79
|
|
|
|
88
|
|
|
Accretion of discount
|
|
|
450
|
|
|
|
21
|
|
|
|
17
|
|
|
Net change in income taxes
|
|
|
932
|
|
|
|
(4
|
)
|
|
|
(2
|
)
|
|
Other
|
|
|
5
|
|
|
|
(28
|
)
|
|
|
(29
|
)
|
|
|
|
|
|
|
|
|
|
|
|
|
|
|
|
Net changes
|
|
|
(1,460
|
)
|
|
|
—
|
|
|
|
(2
|
)
|
|
|
|
|
|
|
|
|
|
|
|
|
|
|
|
Standardized measure of discounted future net cash flows end of
period
|
|
$
|
1,713
|
|
|
$
|
175
|
|
|
$
|
129
|
|
|
|
|
|
|
|
|
|
|
|
|
|
|
|
F-78
WPX
Energy
Supplemental
Oil and Gas Disclosures—(Continued)
(Unaudited)
| |
|
|
|
|
|
|
|
|
|
|
|
|
|
|
|
|
|
|
|
|
|
Entity’s share
|
|
|
|
|
|
|
|
|
|
|
of international
|
|
|
|
|
|
|
|
|
|
|
equity method
|
|
|
For the Year Ended December 31, 2010
|
|
Domestic
|
|
|
International(1)
|
|
|
investee(2)
|
|
|
|
|
(Millions)
|
|
|
|
|
Standardized measure of discounted future net cash flows
beginning of period
|
|
$
|
1,713
|
|
|
$
|
175
|
|
|
$
|
129
|
|
|
Changes during the year:
|
|
|
|
|
|
|
|
|
|
|
|
|
|
Sales of oil and gas produced, net of operating costs
|
|
|
(1,446
|
)
|
|
|
(59
|
)
|
|
|
(55
|
)
|
|
Net change in prices and production costs
|
|
|
1,921
|
|
|
|
34
|
|
|
|
43
|
|
|
Extensions, discoveries and improved recovery, less estimated
future costs
|
|
|
724
|
|
|
|
—
|
|
|
|
—
|
|
|
Development costs incurred during year
|
|
|
633
|
|
|
|
26
|
|
|
|
25
|
|
|
Changes in estimated future development costs
|
|
|
(292
|
)
|
|
|
(12
|
)
|
|
|
(15
|
)
|
|
Purchase of reserves in place, less estimated future costs
|
|
|
439
|
|
|
|
2
|
|
|
|
—
|
|
|
Revisions of previous quantity estimates
|
|
|
(332
|
)
|
|
|
26
|
|
|
|
63
|
|
|
Accretion of discount
|
|
|
220
|
|
|
|
22
|
|
|
|
17
|
|
|
Net change in income taxes
|
|
|
(758
|
)
|
|
|
(13
|
)
|
|
|
(20
|
)
|
|
Other
|
|
|
(8
|
)
|
|
|
(3
|
)
|
|
|
(1
|
)
|
|
|
|
|
|
|
|
|
|
|
|
|
|
|
|
Net changes
|
|
|
1,101
|
|
|
|
23
|
|
|
|
57
|
|
|
|
|
|
|
|
|
|
|
|
|
|
|
|
|
Standardized measure of discounted future net cash flows end of
period
|
|
$
|
2,814
|
|
|
$
|
198
|
|
|
$
|
186
|
|
|
|
|
|
|
|
|
|
|
|
|
|
|
|
|
|
|
|
(1) |
|
Amounts attributable to a consolidated subsidiary (Apco) in
which there is a 31 percent noncontrolling interest. |
| |
|
(2) |
|
Represents Apco’s 40.8% interest in Petrolera Entre Lomas
S.A. |
In relation to the SEC rules adopted in 2009, we estimated that
the domestic standardized measure of discounted future net cash
flows in 2009 declined approximately $840 million on a
before tax basis and excluding the overall price rule impact.
The significant components of this decline included an estimated
$640 million decrease included in revisions of previous
quantity estimates and a related $430 million decrease
included in the net change in prices and production costs,
partially offset by a $210 million increase included in
extensions, discoveries and improved recovery, less estimated
future costs. Additionally, we estimated that a significant
portion of the remaining net change in domestic price and
production costs is due to the application of the new pricing
rules which resulted in the use of lower prices at
December 31, 2009, than would have resulted under the
previous rules.
F-79
Shares
WPX
Energy, Inc.
Class A
Common Stock
Prospectus
,
2011
Barclays
Capital
Citi
J.P. Morgan
PART II
INFORMATION
NOT REQUIRED IN PROSPECTUS
|
|
|
Item 13.
|
Other
Expenses of Issuance and Distribution.
|
The following table sets forth the expenses (other than
underwriting compensation expected to be incurred) in connection
with this offering. All of such amounts (except the SEC
registration fee and FINRA filing fee) are estimated.
| |
|
|
|
|
|
|
|
|
|
SEC registration fee
|
|
$
|
87,075
|
|
|
|
|
|
|
FINRA filing fee
|
|
|
75,500
|
|
|
|
|
|
|
NYSE listing fee
|
|
|
*
|
|
|
|
|
|
|
Printing and engraving expenses
|
|
|
*
|
|
|
|
|
|
|
Legal fees and expenses
|
|
|
*
|
|
|
|
|
|
|
Accounting fees and expenses
|
|
|
*
|
|
|
|
|
|
|
Transfer agent and Registrar fees
|
|
|
*
|
|
|
|
|
|
|
Miscellaneous
|
|
|
*
|
|
|
|
|
|
|
|
|
|
|
|
|
|
|
|
|
Total
|
|
$
|
*
|
|
|
|
|
|
|
|
|
|
|
|
|
|
|
|
|
|
|
|
* |
|
To be provided by amendment |
|
|
|
Item 14.
|
Indemnification
of Officers and Directors.
|
Our certificate of incorporation provides that a director will
not be liable to the corporation or its stockholders for
monetary damages for breach of fiduciary duty as a director to
the fullest extent that the Delaware General Corporation Law
(“DGCL”) or any other law of the State of Delaware
permits. If the DGCL or any other law of the State of Delaware
is amended to authorize the further elimination or limitation of
the liability of directors, then the liability of a director
will be limited to the fullest extent permitted by the amended
DGCL or other law, as applicable.
We are empowered by Section 145 of the DGCL, subject to the
procedures and limitations stated therein, to indemnify any
person against expenses (including attorneys’ fees),
judgments, fines, and amounts paid in settlement actually and
reasonably incurred by them in connection with any threatened,
pending, or completed action, suit, or proceeding in which such
person is made party by reason of their being or having been a
director, officer, employee, or agent of the Company. The
statute provides that indemnification pursuant to its provisions
is not exclusive of other rights of indemnification to which a
person may be entitled under any bylaw, agreement, vote of
stockholders or disinterested directors, or otherwise. Our
bylaws provide for indemnification by us of our directors and
officers to the fullest extent permitted by the DGCL.
We maintain policies of insurance under which our directors and
officers are insured, within the limits and subject to the
limitations of the policies, against certain expenses in
connection with the defense of actions, suits, or proceedings,
and certain liabilities which might be imposed as a result of
such actions, suits or proceedings, to which they are parties by
reason of being or having been such directors or officers.
|
|
|
Item 15.
|
Recent
Sales of Unregistered Securities.
|
Except for the issuance of shares to Williams, we have not
issued any securities in unregistered transactions. The issuance
of shares to Williams was exempt from the registration
requirements of the Securities Act pursuant to Section 4(2)
thereof.
II-1
|
|
|
Item 16.
|
Exhibits
and Financial Statement Schedules.
|
A list of exhibits filed as part of this registration statement
is set forth in the Exhibit Index, which is incorporated
herein by reference.
|
|
|
| |
(b)
|
Financial Statement Schedules
|
Schedule II—Valuation and Qualifying Accounts for the
three years ended December 31, 2010, 2009 and 2008
SCHEDULE II—VALUATION
AND QUALIFYING ACCOUNTS
| |
|
|
|
|
|
|
|
|
|
|
|
|
|
|
|
|
|
|
|
|
|
|
|
|
|
|
Charged
|
|
|
|
|
|
|
|
|
|
|
|
|
|
|
|
|
(Credited)
|
|
|
|
|
|
|
|
|
|
|
|
|
|
Beginning
|
|
|
to Costs and
|
|
|
|
|
|
|
|
|
Ending
|
|
|
|
|
Balance
|
|
|
Expenses
|
|
|
Other
|
|
|
Deductions
|
|
|
Balance
|
|
|
|
|
(Millions)
|
|
|
|
|
2010:
|
|
|
|
|
|
|
|
|
|
|
|
|
|
|
|
|
|
|
|
|
|
Allowance for doubtful accounts—accounts and notes
receivable(a)
|
|
$
|
19
|
|
|
$
|
(3
|
)
|
|
$
|
—
|
|
|
$
|
—
|
|
|
$
|
16
|
|
|
Price-risk management credit
reserves—liabilities(b)
|
|
|
(3
|
)
|
|
|
3
|
(d)
|
|
|
—
|
|
|
|
—
|
|
|
|
—
|
|
|
2009:
|
|
|
|
|
|
|
|
|
|
|
|
|
|
|
|
|
|
|
|
|
|
Allowance for doubtful accounts—accounts and notes
receivable(a)
|
|
|
25
|
|
|
|
3
|
|
|
|
—
|
|
|
|
(9
|
)(c)
|
|
|
19
|
|
|
Price-risk management credit
reserves—assets(a)
|
|
|
6
|
|
|
|
(3
|
)(d)
|
|
|
(3
|
)(e)
|
|
|
—
|
|
|
|
—
|
|
|
Price-risk management credit
reserves—liabilities(b)
|
|
|
(15
|
)
|
|
|
12
|
(d)
|
|
|
—
|
|
|
|
—
|
|
|
|
(3
|
)
|
|
2008:
|
|
|
|
|
|
|
|
|
|
|
|
|
|
|
|
|
|
|
|
|
|
Allowance for doubtful accounts—accounts and notes
receivable(a)
|
|
|
14
|
|
|
|
12
|
|
|
|
—
|
|
|
|
(1
|
)(c)
|
|
|
25
|
|
|
Price-risk management credit
reserves—assets(a)
|
|
|
1
|
|
|
|
1
|
(d)
|
|
|
4
|
(e)
|
|
|
—
|
|
|
|
6
|
|
|
Price-risk management credit reserves—liabilities(b)
|
|
|
—
|
|
|
|
(16
|
)(d)
|
|
|
1
|
(e)
|
|
|
—
|
|
|
|
(15
|
)
|
|
|
|
|
(a) |
|
Deducted from related assets. |
| |
|
(b) |
|
Deducted from related liabilities. |
| |
|
(c) |
|
Represents recoveries of balances previously written off. |
| |
|
(d) |
|
Included in revenues. |
| |
|
(e) |
|
Included in accumulated other comprehensive income (loss). |
The undersigned registrant hereby undertakes that:
(1) The undersigned will provide to the underwriters at the
closing specified in the underwriting agreement certificates in
such denominations and registered in such names as required by
the underwriters to permit prompt delivery to each purchaser.
(2) For purposes of determining any liability under the
Securities Act of 1933, as amended, the information omitted from
the form of prospectus filed as part of this registration
statement in reliance upon Rule 430A and contained in a
form of prospectus filed by the registrant pursuant to
Rule 424(b)(1)
II-2
or (4) or 497(h) under the Securities Act of 1933, as
amended, shall be deemed to be part of this registration
statement as of the time it was declared effective.
(3) For the purpose of determining any liability under the
Securities Act of 1933, as amended, each post-effective
amendment that contains a form of prospectus shall be deemed to
be a new registration statement relating to the securities
offered therein, and the offering of such securities at that
time shall be deemed to be the initial bona fide offering
thereof.
Insofar as indemnification for liabilities arising under the
Securities Act of 1933, as amended, may be permitted to
directors, officers and controlling persons of the registrant
pursuant to the foregoing provisions, or otherwise, the
registrant has been advised that in the opinion of the
Securities and Exchange Commission such indemnification is
against public policy as expressed in the Securities Act of
1933, as amended, and is, therefore, unenforceable. In the event
that a claim for indemnification against such liabilities (other
than the payment by the registrant of expenses incurred or paid
by a director, officer or controlling person of the registrant
in the successful defense of any action, suit or proceeding) is
asserted by such director, officer or controlling person in
connection with the securities being registered, the registrant
will, unless in the opinion of its counsel the matter has been
settled by controlling precedent, submit to a court of
appropriate jurisdiction the question whether such
indemnification by it is against public policy as expressed in
the Securities Act of 1933, as amended, and will be governed by
the final adjudication of such issue.
II-3
Signatures
Pursuant to the requirements of the Securities Act of 1933, the
registrant has duly caused this Registration Statement to be
signed on its behalf by the undersigned, thereunto duly
authorized, in the City of Tulsa, State of Oklahoma, on
June 21, 2011.
WPX ENERGY, INC.
(Registrant)
Ralph A. Hill
Chief Executive Officer
Pursuant to the requirements of the Securities Act of 1933, this
registration statement has been signed below by the following
persons in the capacities and on the dates indicated:
| |
|
|
|
|
|
|
|
|
|
|
|
|
|
Date: June 21, 2011
|
|
By:
|
|
/s/ Ralph
A.
Hill Ralph
A. Hill, Chief Executive Officer(Principal Executive Officer)
|
|
|
|
|
|
|
|
Date: June 21, 2011
|
|
By:
|
|
/s/ Donald
R.
Chappel Donald
R. Chappel, Chief Financial Officer
(Principal Financial Officer)
|
|
|
|
|
|
|
|
Date: June 21, 2011
|
|
By:
|
|
/s/ Ted
T.
Timmermans Ted
T. Timmermans, Chief Accounting Officer
(Principal Accounting Officer)
|
|
|
|
|
|
|
|
Date: June 21, 2011
|
|
By:
|
|
/s/ Alan
S.
Armstrong Alan
S. Armstrong, Chairman of the Board
|
II-4
EXHIBIT INDEX
| |
|
|
|
|
|
Exhibit No.
|
|
Description
|
|
|
|
|
1
|
.1*
|
|
Form of Underwriting Agreement
|
|
|
3
|
.1*
|
|
Form of Amended and Restated Certificate of Incorporation of WPX
Energy, Inc.
|
|
|
3
|
.2*
|
|
Form of Amended and Restated Bylaws of WPX Energy, Inc.
|
|
|
4
|
.1*
|
|
Form of Specimen Class A Common Stock Certificate
|
|
|
4
|
.2*
|
|
Form of Specimen Class B Common Stock Certificate
|
|
|
5
|
.1*
|
|
Opinion of Gibson, Dunn & Crutcher LLP
|
|
|
10
|
.1*
|
|
Form of Separation and Distribution Agreement
|
|
|
10
|
.2*
|
|
Form of Administrative Services Agreement
|
|
|
10
|
.3*
|
|
Form of Transition Services Agreement
|
|
|
10
|
.4*
|
|
Form of Tax Sharing Agreement
|
|
|
10
|
.5*
|
|
Form of Registration Rights Agreement
|
|
|
10
|
.6†
|
|
Credit Agreement, dated as of June 3, 2011, by and among
WPX Energy, Inc., the lenders named therein, and Citibank,
N.A., as Administrative Agent and Swingline Lender (incorporated
by reference to Exhibit 10.3 to The Williams Companies,
Inc.’s current report on
Form 8-K
(File No.
001-04174)
filed with the SEC on June 9, 2011)
|
|
|
21
|
.1
|
|
List of Subsidiaries
|
|
|
23
|
.1*
|
|
Consent of Gibson, Dunn & Crutcher LLP (included in
Exhibit 5.1)
|
|
|
23
|
.2
|
|
Consent of Ernst & Young LLP
|
|
|
23
|
.3
|
|
Consent of Independent Petroleum Engineers and Geologists,
Netherland, Sewell & Associates, Inc.
|
|
|
23
|
.4
|
|
Consent of Independent Petroleum Engineers and Geologists,
Miller and Lents, Ltd.
|
|
|
23
|
.5
|
|
Consent of Independent Petroleum Engineers, Ralph E. Davis
Associates, Inc.
|
|
|
24
|
.1
|
|
Powers of Attorney (included on signature page of the initial
registration statement)
|
|
|
(99
|
.1)
|
|
Report of Independent Petroleum Engineers and Geologists,
Netherland, Sewell & Associates, Inc.
|
|
|
99
|
.2
|
|
Report of Independent Petroleum Engineers and Geologists, Miller
and Lents, Ltd.
|
|
|
99
|
.3
|
|
Report of Independent Petroleum Engineers, Ralph E. Davis
Associates, Inc.
|
|
|
|
|
( ) |
|
Previously filed with this registration statement |
|
|
|
|
* |
|
To be filed by amendment |