Attached files
 Investor
Presentation PNC Announces Agreement to Buy
RBC Bank (USA)
June 20, 2011
Exhibit 99.2
*
*
*
*
*
*
*
*
*
*
*
*
* |
 2
Cautionary Statement Regarding Forward-Looking
Information
This
presentation
contains
forward-looking
statements
regarding
our
outlook
or
expectations
with
respect
to
the
planned
acquisition
of
RBC
Bank
(USA),
the
expected
costs
to
be
incurred
in
connection
with
the
acquisition,
RBC
Bank
(USA)’s
future
performance
and
consequences
of
its
integration
into
PNC,
and
the
impact
of
the
transaction
on
PNC’s
future
performance.
Forward-looking
statements
are
subject
to
numerous
assumptions,
risks
and
uncertainties,
which
change
over
time.
The
forward-looking
statements
in
this
presentation
speak
only
as
of
the
date
of
the
presentation,
and
PNC
assumes
no
duty,
and
does
not
undertake,
to
update
them.
Actual
results
or
future
events
could
differ,
possibly
materially,
from
those
that
we
anticipated
in
these
forward-looking
statements.
These
forward-looking
statements
are
subject
to
the
principal
risks
and
uncertainties
applicable
to
PNC’s
businesses
generally
that
are
disclosed
in
PNC’s
2010
Form
10-K
and
2011
Form
10-Qs,
including
in
the
Risk
Factors
and
Risk
Management
sections
of
those
reports,
and
in
PNC’s
subsequent
SEC
filings
(accessible
on
the
SEC’s
website
at
www.sec.gov
and
on
PNC’s
corporate
website
at
www.pnc.com/secfilings).
We
have
included
these
web
addresses
as
inactive
textual
references
only.
Information
on
these
websites
is
not
part
of
this
document.
Any
annualized,
proforma,
estimated,
third
party
or
consensus
numbers
in
this
presentation
are
used
for
illustrative
or
comparative
purposes
only
and
may
not
reflect
actual
results.
Any
consensus
earnings
estimates
are
calculated
based
on
the
earnings
projections
made
by
analysts
who
cover
that
company.
The
analysts’
opinions,
estimates
or
forecasts
(and
therefore
the
consensus
earnings
estimates)
are
theirs
alone,
are
not
those
of
PNC
or
its
management,
and
may
not
reflect
PNC’s,
RBC
Bank
(USA)’s,
or
other
company’s
actual
or
anticipated
results.
In
addition,
forward-looking
statements
in
this
presentation
are
subject
to
the
following
risks
and
uncertainties
related
both
to
the
acquisition
transaction
itself
and
to
the
integration
of
the
acquired
business
into
PNC
after
closing:
•
Completion
of
the
transaction
is
dependent
on,
among
other
things,
receipt
of
regulatory
and
other
applicable
approvals,
the
timing
of
which
cannot
be
predicted
with
precision
at
this
point
and
which
may
not
be
received
at
all.
The
impact
of
the
completion
of
the
transaction
on
PNC’s
financial
statements
will
be
affected
by
the
timing
of
the
transaction.
•
The
transaction
may
be
substantially
more
expensive
to
complete
(including
the
integration
of
RBC
Bank
(USA)’s
businesses)
and
the
anticipated
benefits,
including
anticipated
cost
savings
and
strategic
gains,
may
be
significantly
harder
or
take
longer
to
achieve
than
expected
or
may
not
be
achieved
in
their
entirety
as
a
result
of
unexpected
factors
or
events.
•
Our
ability
to
achieve
anticipated
results
from
this
transaction
is
dependent
on
the
state
of
the
economic
and
financial
markets
going
forward,
which
have
been
under
significant
stress
recently.
Specifically,
we
may
incur
more
credit
losses
from
RBC
Bank
(USA)’s
loan
portfolio
than
expected.
Other
issues
related
to
achieving
anticipated
financial
results
include
the
possibility
that
deposit
attrition
may
be
greater
than
expected.
Litigation
and
governmental
investigations
that
may
be
filed
or
commenced,
as
a
result
of
this
transaction
or
otherwise,
could
impact
the
timing
or
realization
of
anticipated
benefits
to
PNC.
•
The
integration
of
RBC
Bank
(USA)’s
business
and
operations
into
PNC,
which
will
include
conversion
of
RBC
Bank
(USA)’s
different
systems
and
procedures,
may
take
longer
than
anticipated
or
be
more
costly
than
anticipated
or
have
unanticipated
adverse
results
relating
to
RBC
Bank
(USA)’s
or
PNC’s
existing
businesses.
PNC’s
ability
to
integrate
RBC
Bank
(USA)
successfully
may
be
adversely
affected
by
the
fact
that
this
transaction
will
result
in
PNC
entering
several
markets
where
PNC
does
not
currently
have
any
meaningful
retail
presence. |
 3
Strategic Rationale
Opportunity to deliver PNC’s products and services to
new commercial, wealth management and retail
customers
Fairly priced market expansion into demographically
attractive growth markets
Demonstrated ability to successfully integrate and grow
underperforming franchises
RBC Bank (USA) has quality branch network and
human capital to leverage PNC’s sales and service
model |
 4
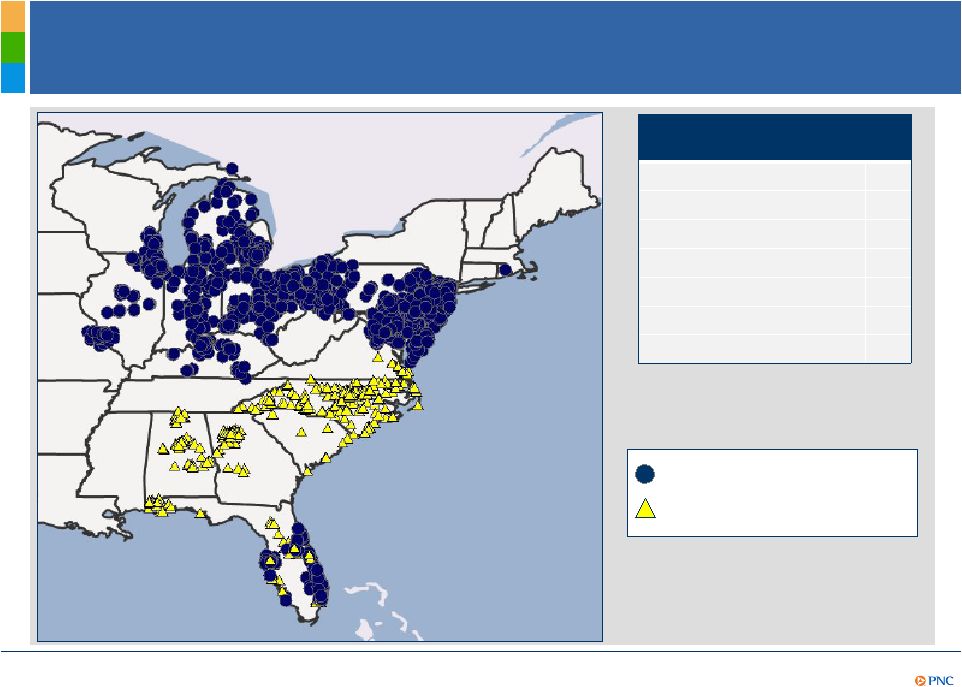
Extends East Coast Branch Network into Faster
Growing Markets
Source: SNL Financial, as of June 2010.
RBC Bank (USA) branches
by state
North Carolina
180
Florida
83
Alabama
78
Georgia
61
Virginia
13
South Carolina
9
Total
424
PNC branches
RBC Bank (USA) branches |
 5
Opportunity to Capture More Deposit Share in
Demographically Attractive Markets
(1) Source: SNL DataSource. (2) Top 20 states based on wealth holders with >$1.5 million
in net worth. Source: IRS Statistics of Income
Division, August 2008. (3) Deposit rank based on share of deposits in state. Source: SNL
DataSource as of June 30, 2010. …wealthy markets
Projected 5-year growth¹
Population
HH income
PNC
1.2%
13.3%
RBC Bank (USA)
6.5%
12.6%
Proforma PNC
1.7%
13.2%
U.S. average
3.9%
12.4%
PNC’s proforma retail footprint covers 11 of
the top 20 wealthiest states² PNC has
demonstrated the ability to grow and attract customers in all its markets
PNC continues to leverage its suite of
innovative products and services to deepen
customer relationships
Proforma
State²
Branches
Deposits( $bn)
Rank³
California
New York
Florida
216
$8.0
10
Illinois
198
$15.7
4
Texas
Pennsylvania
510
$58.2
1
Massachusetts
New Jersey
334
$19.0
5
Georgia
61
$2.8
8
Michigan
244
$15.3
3
Ohio
418
$25.6
2
North Carolina
180
$8.9
5
Virginia
96
$2.6
11
Maryland
230
$10.2
3
Connecticut
Washington
Wisconsin
25
$1.4
11
Colorado
Wyoming
Arizona
RBC Bank (USA) brings high growth and… |
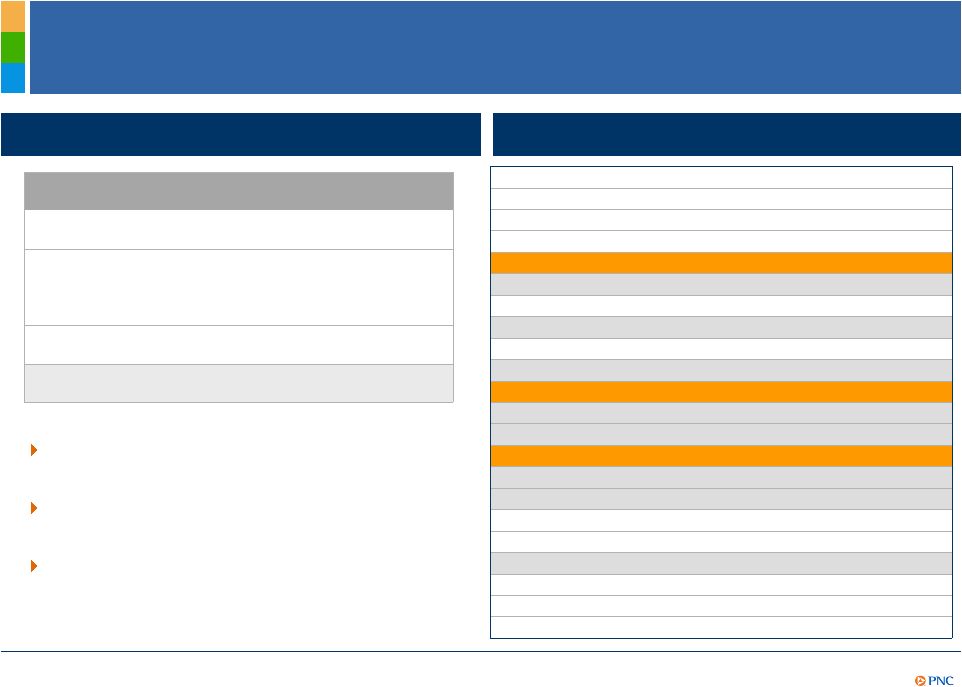
 6
PNC’s Proven Capabilities to Grow Retail Banking
Relationships in Acquired Markets
Greater Maryland/Washington, D.C. market
growth
Growth strategies
Increase brand awareness
Introduce innovative products-
Virtual
Wallet, University and Workplace
Banking
Increase share of wallet
Expand branch distribution network
and channels
Deliver exceptional customer service
(1)Total retail deposits adjusted to exclude CDs and IRAs. (2) 2011 reflects amounts as of
March 31, 2011. 497
483
430
382
2008
2009
2010
2011
Total DDA Households
2
Total Retail
Deposits¹
$10.6
$10.3
$9.6
$8.7
2008
2009
2010
2011
2 |
 7
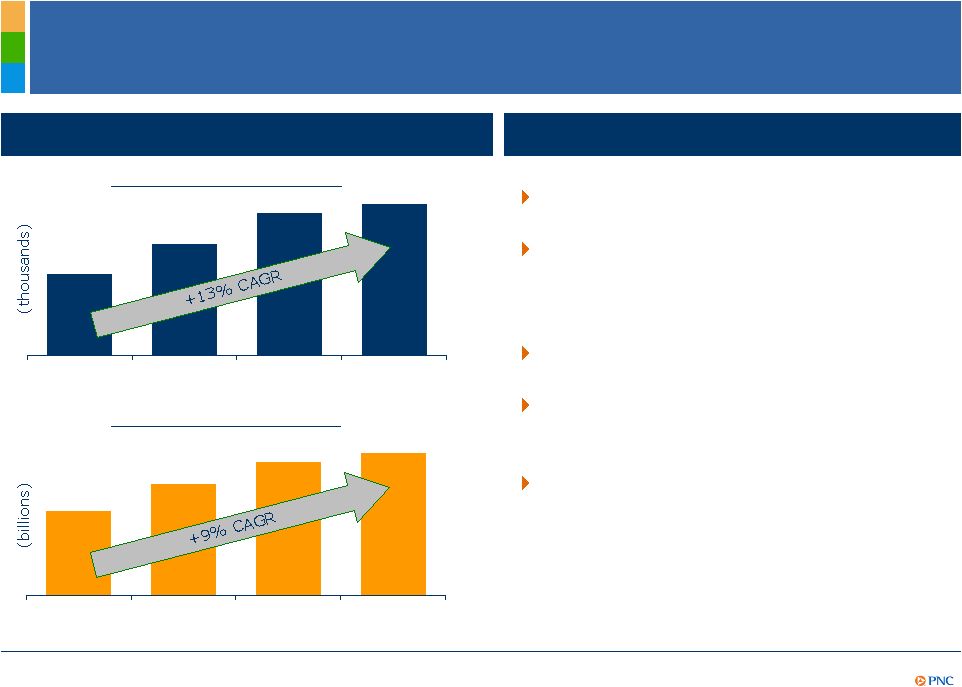
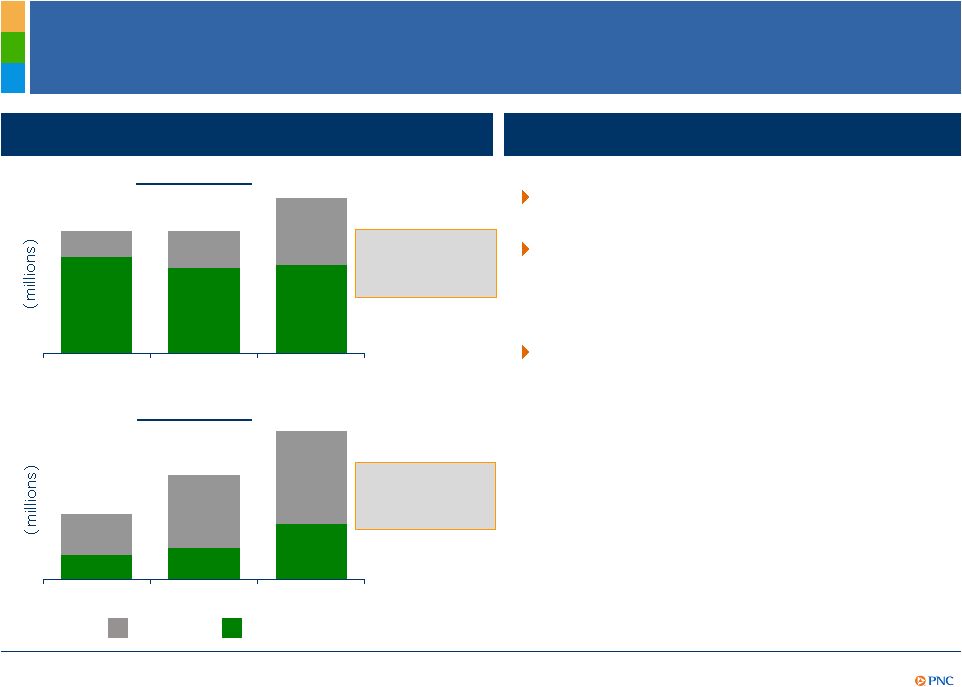
Demonstrated Ability to Grow C&IB and AMG in New
Markets and Cross-Sell Innovative Products
(1) Year over year market revenue growth. (2) Year over year total new primary client growth.
(3) 2011 represents revenue growth for
the five months ended May 31, 2011, annualized.
$14
$20
$35
$46
$44
$50
2009
2010
2011³
Total market revenue growth¹
for C&IB and AMG
Chicago
Fee
NII
$64
$64
$81
New clients up
48% over
YTD10²
$12
$21
$27
$16
$9
$7
2009
2010
2011
Florida
$19
$30
$43
New clients up
24% over
YTD10²
Growth strategies
Leverage cross-sell opportunities
Expand PNC’s loan syndication
capabilities as a differentiated leader
in middle market
Deliver innovative treasury
management and capital markets
products
3 |
 8
Significant New Commercial Market Opportunity
(1) Top 10 MSAs ranked by deposit size. Small businesses defined
as businesses with sale up to $20 million, Mid-market defined as
businesses with sale between $20 million and $50 million, and Corporate defined as businesses
with sale greater than $50 million. (2) Small Businesses total sales is unavailable.
Source: SNL Financial and OneSource. PNC’s Top 10
MSAs¹ RBC Bank (USA)’s Top 10
MSAs¹ # of
Businesses
Total Sales
($ billions)
# of
Businesses
% of PNC’s
Top 10
Total Sales
($ billions)
Small Businesses
1,373,556
NA²
506,749
37%
NA²
Mid-Market
14,013
$435
3,922
28%
$123
Corporate
6,687
$6,092
1,999
30%
$1,046
RBC Bank (USA) substantially increases target commercial clients
RBC Bank (USA) substantially increases target commercial clients
|
 9
Compelling Transaction
(1) The total consideration is comprised of a fixed dollar amount (subject to adjustment at
close for net tangible asset value delivered), including cash and, at PNC’s
option, common stock. The amount of PNC stock will not exceed $1 billion or cause Royal Bank of Canada’s
ownership of PNC common stock to exceed 4.9%. (2) As of April 30, 2011. (3) Gross of allowance
for loan losses of $755 million, therefore incremental mark of $1,488 million. As of
April 30, 2011. (4) Estimated. (5) As of April 2011. Excludes $150 million for goodwill expense.
Transaction Summary
Transaction total value
$3.45 billion
1
Internal rate of return
4
19%+
Accretion
4
End of year 2013 or sooner
Compelling Financial Terms:
–
Price to tangible book
2
Discount to tangible book of $112 million; currently 97%
–
Deposit premium
2
(0.6%)
Annual expense reduction
4
$230
million
(27%
of
RBC
Bank
(USA)’s
annualized
expense
base
5
)
Merger and integration costs
4
$322 million
Due diligence
Completed
Loan marks
3,4
Total loan marks: 12.5%, 48% of NPLs
Closing conditions
Regulatory approvals and customary conditions
Anticipated closing
March 2012 |
 10
Value-Added Acquisition Positions
PNC Well for the Future
PNC remains core funded with a proforma loan to deposit
ratio of 82%
Credit risk remains manageable given loan marks of 12.5%
and demonstrated distressed loan management capabilities
PNC remains well positioned regarding Basel III
implementation
Drawing upon our NCC branch conversion experience, all
conversions will occur simultaneously with closing
Expense savings achievable |
 11
Summary
PNC Continues to Build a Great Company.
PNC Continues to Build a Great Company.
Opportunity to deliver PNC’s products and services to
new commercial, wealth management and retail
customers
Fairly priced market expansion into demographically
attractive growth markets
Demonstrated ability to successfully integrate and grow
underperforming franchises
RBC Bank (USA) has quality branch network and
human capital to leverage PNC’s sales and service
model |
 12
Combined Balance Sheet
(1) Gives effect to excluded assets and liabilities and estimated purchase accounting
adjustments. Source: Royal Bank of Canada. (2) Assumes
$1.0 billon of PNC common stock issued to the Royal Bank of Canada and $1 billion preferred
stock issuance. (3) Includes loans held for sale. Appendix
1
2
3
($ billions)
PNC
RBC Bank (USA)
Proforma PNC
ASSETS
3/31/2011
4/30/2011
3/31/2011
Investments
66.8
4.7
71.5
Loans, net
147.6
15.7
163.3
Other Assets
35.9
3.4
39.3
Intangible Assets, excluding MSRs
9.0
1.0
10.0
Total Assets
259.4
24.8
284.1
LIABILITIES
Deposits
182.0
19.4
201.4
Funding
35.0
3.0
38.0
Other Liabilities
8.7
0.3
9.0
Total Liabilities
225.7
22.8
248.4
EQUITY
Equity
33.7
2.0
35.7
Total Liabilities & Equity
259.4
24.8
284.1 |
 13
RBC Bank (USA) Loan Portfolio Assessment
(1) Gross of allowance for loan losses of $755 million, therefore incremental mark of $1,488
million. (2) Source: Royal Bank of Canada. Appendix
1
2
Estimated
($ in millions)
Balance as of
Credit Mark
Rate Mark
Total Mark
Loan Category
4/30/2011
$
%
$
%
$
%
Performing:
Commercial:
C&I
3,477
125
3.6%
35
1.0%
159
4.6%
Owner Occupied
2,973
137
4.6%
1
0.0%
137
4.6%
CRE & Construction
3,202
167
5.2%
68
2.1%
235
7.4%
Consumer:
Mortgage
1,855
122
6.6%
0
0.0%
122
6.6%
Home Equity
3,670
496
13.5%
-9
-0.2%
487
13.3%
Other
806
171
21.2%
-30
-3.7%
141
17.5%
Total Performing
15,983
1,218
7.6%
64
0.4%
1,283
8.0%
Non Accrual:
Commercial:
C&I
165
66
40.0%
13
8.1%
79
48.1%
Owner Occupied
460
162
35.3%
40
8.7%
203
44.0%
CRE & Construction
1,101
402
36.5%
94
8.6%
496
45.0%
Consumer:
Mortgage
137
71
52.3%
9
6.4%
80
58.7%
Home Equity
68
48
71.0%
3
3.9%
51
74.9%
Other
69
48
69.2%
3
4.1%
51
73.3%
Total Non Accural
2,000
798
39.9%
162
8.1%
960
48.0%
Total Loan Mark
17,984
2,016
11.2%
226
1.3%
2,242
12.5% |
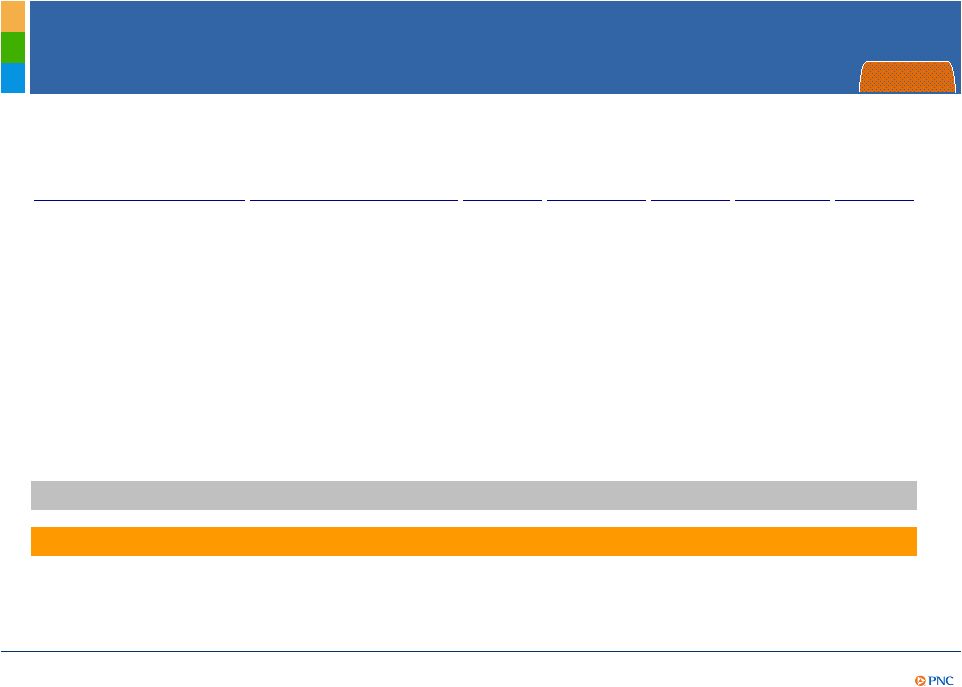 14
Valuation Comparables Based on Recent
Transactions
Appendix
(1) Includes repayment of target’s TARP outstanding where applicable. (2) TBV adjusted by
tax adjusted credit mark net of reserves (35% tax rate). (3) As reported by company
where available, otherwise core deposit amounts per SNL Financial. (4) Includes transaction expense.
(5) Assumes
midpoint mark. Source: SNL Financial and company filings.
Buyer
Target
Announce
Date
Announced
Deal Value
($M)
P/TBV
P/ Adj. TBV
Core
Deposit
Premium
Valley National Bancorp
State Bancorp Inc.
4/28/11
$259
216%
252%
11.7%
Brookline Bancorp Inc.
Bancorp Rhode Island Inc.
4/20/11
$234
201%
NA
11.8%
Susquehanna Bancshares, Inc.
Abington Bancorp, Inc.
1/26/11
$268
122%
133%
8.2%
People's United Financial Inc.
Danvers Bancorp Inc.
1/21/11
$493
186%
190%
13.9%
Comerica Inc.
Sterling Bancshares Inc.
1/18/11
$1,027
234%
374%
17.0%
Hancock Holding Co.
Whitney Holding Corp.
12/22/10
$1,796
200%
239%
11.6%
BMO Financial Group
Marshall & Ilsley Corp.
12/17/10
$5,803
138%
285%
4.9%
M&T Bank Corp.
Wilmington Trust Corp.
11/1/10
$681
192%
2,613%
4.7%
First Niagara Financial Group
NewAlliance Bancshares Inc.
8/19/10
$1,500
163%
176%
14.0%
Median
192%
245%
11.7%
PNC
RBC Bank (USA)
6/20/11
$3,450
97%
126%
(0.6%)
2
3
1
5
4 |