Attached files
| file | filename |
|---|---|
| 8-K - FORM 8-K - CAPITAL ONE FINANCIAL CORP | d8k.htm |
| EX-99.2 - PRESS RELEASE - CAPITAL ONE FINANCIAL CORP | dex992.htm |
 June
16, 2011 Investor Presentation
Investor Presentation
Exhibit 99.1 |
| 2
Forward Looking Statements
Forward Looking Statements
This presentation contains forward-looking statements within the meaning of the Private Securities
Litigation Reform Act giving Capital One’s expectations or predictions of future financial
or business performance or conditions. Such forward- looking statements include, but
are not limited to, statements about the projected impact and benefits of the transaction
involving Capital One and ING Direct, including future financial and operating results, the
company’s plans, objectives, expectations and intentions and other statements that are not
historical facts. These forward-looking statements are subject to numerous assumptions,
risks and uncertainties which change over time. Forward-looking statements speak only as of
the date they are made, and Capital One assumes no duty to update forward-looking statements.
In addition to factors previously disclosed in our filings with the U.S. Securities and Exchange
Commission and those identified elsewhere in this presentation, the following factors, among
others, could cause actual results to differ materially from forward-looking statements or
historical performance: the possibility that regulatory and other approvals and conditions to
the transaction are not received or satisfied on a timely basis or at all; the possibility that modifications to the
terms of the transactions may be required in order to obtain or satisfy such approvals or conditions;
changes in the anticipated timing for closing the transaction; difficulties and delays in
integrating Capital One’s and ING Direct’s businesses or fully realizing projected
cost savings and other projected benefits of the transaction; business disruption during the
pendency of or following the transaction; the inability to sustain revenue and earnings growth; changes in
interest rates and capital markets; diversion of management time on transaction-related issues;
reputational risks and the reaction of customers and counterparties to the transaction; and
changes in asset quality and credit risk as a result of the transaction.
Annualized, pro forma, projected and estimated numbers are used for illustrative purposes only, are
not forecasts and may not reflect actual results. |
 3
•
Transaction summary and strategic rationale
•
Financial overview |
| 4
Transaction Summary
Transaction Summary
Transaction Value
Form of Consideration to
Approvals
Expected Closing
$9.0 Billion
1
Fixed Number of Capital One shares of approximately 55.9 million
(9.9% COF pro forma ownership)
Approved by both Boards
No Capital One or ING shareholder approval necessary
Federal Reserve Board and Dutch Central Bank and certain other
regulatory approvals will be necessary
Late Q4 2011 / Early Q1 2012
Source of Funds
Planned market equity raise prior to closing of approximately $2.0
billion to fund a portion of the cash payment to ING Group
Shareholder Agreement
One ING Group representative added to Capital One Board
ING Group not permitted to sell Capital One shares before the later of
180 days after market equity raise and 90 days after closing
Footnotes:
1)
Share consideration valued at COF 10-day average closing price of $50.07 for the period ending
June 15, 2011. 2)
If ING’s stock ownership would exceed 9.9% at closing, the excess will be paid in cash
Additional sources of cash consideration:
$0.5B financed through cash
$3.7B financed through planned issuance of Capital One senior debt
ING
1
Fixed
cash
amount
of
approximately
$6.2
billion
2 |
 5
The ING Direct acquisition delivers attractive
The ING Direct acquisition delivers attractive
financial results and long-term strategic value
financial results and long-term strategic value
•
Accretive to EPS in 2012
•
Mid-single digit EPS
accretion in 2013
•
Accretive to tangible book
value per share
•
ROIC > cost of capital in 2013
•
IRR > 20%
•
Buying without significant
premium reduces risks
Compelling Strategic
Value
Attractive Deal
Economics
•
Industry-leading direct
banking franchise with
national reach
•
7 million young, high-
income, loyal customers
•
$80 billion of low cost,
stable deposits
•
Accretive to long-term
growth, returns, and capital
generation
Note: see “Financial Assumptions”
in this presentation for underlying assumptions |
 6
$0
$10
$20
$30
$40
$50
$60
$70
$80
$90
2000
2001
2002
2003
2004
2005
2006
2007
2008
2009
2010
Savings/
MMDA
ING Direct Deposits
B
Source: SNL Financial (FDIC), Company reports
Electric
Orange
Checking
Time
ING
ING
Direct
Direct
has
has
grown
grown
rapidly
rapidly
to
to
become
become
the
the
nation’s
nation’s
15
th
largest bank, and by far the largest direct banking franchise
largest bank, and by far the largest direct banking franchise
16.2
71.8
60.6
47.2
77.7
75.0
40.0
28.8
9.3
2.9
.7 |
 7
Mortgages and investment securities are ING Direct’s
Mortgages and investment securities are ING Direct’s
predominant assets
predominant assets
•
$29.6B outstanding as of 3/31/11
–
$28.7B Fair Value
–
$0.9B HFI
•
Majority are mortgage related
–
$15.0B US Agency backed MBS
–
$3.7B US Non-Agency MBS
–
$8.4B US Treasuries and TLGP-backed
debt
–
$1.3B ABS/CMBS
–
$1.2B European government-backed
and supranationals
•
~88% rated AAA
•
$40.7B outstanding as of 3/31/2011
•
62% of portfolio is 2008 or newer
vintages
•
Average original LTV 66%
•
30-179 day delinquency rate of 1.2%
•
Mostly 5 and 7 year ARMs
•
Weighted average FICO
–
Original = 755
–
Current = 746
•
Gross estimated credit mark of $1.7B
(~4% of loans)
Investment Securities
Mortgage Loans |
 8
Capital synergy
Deposit synergies
Opportunity to
swap higher-yield
Capital One loans
for ING assets
Achievable cost
synergies
Capital One can build on ING Direct’s franchise to realize
Capital One can build on ING Direct’s franchise to realize
greater value for customers, associates and shareholders
greater value for customers, associates and shareholders
Opportunity to
expand and
deepen
relationships with
large and loyal
customer base |
 9
Capital One has been a successful player in
Capital One has been a successful player in
direct banking for over a decade
direct banking for over a decade
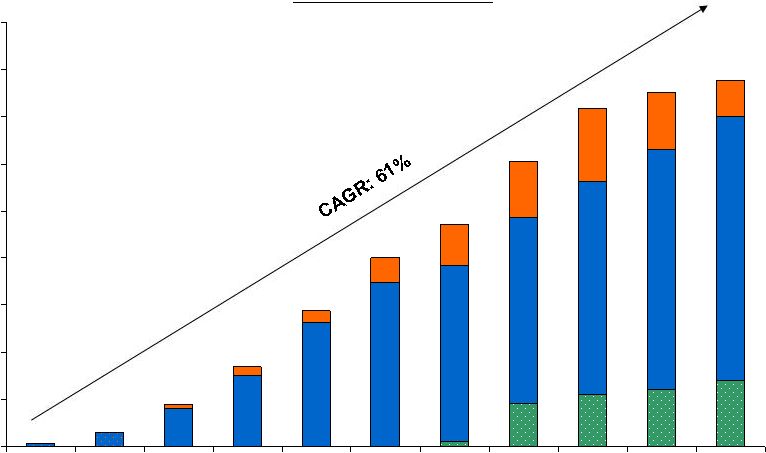
$6
$8
$9
$12
$14
$14
$14
$15
$21
$22
$27
$29
$0
$5
$10
$15
$20
$25
$30
$35
Capital
One
Direct
Bank
Deposit
Balances
$B |
 10
ING Direct’s all-in cost of deposits is competitive due
ING Direct’s all-in cost of deposits is competitive due
in large part to much lower non-interest expense
in large part to much lower non-interest expense
Interest Expense for Liquid
Deposits* (2010)
0.12%
1.11%
0.70%
0.21%
0.23%
0.23%
0.0%
0.5%
1.0%
1.5%
2.0%
2.5%
3.0%
ING DirectCapital
One
PNC
USBank
BofA
JPMChase
0.51%
2.45%
1.75%
1.55%
0.0%
0.5%
1.0%
1.5%
2.0%
2.5%
3.0%
ING Direct
Typical
Large Bank
Average
Typical
Large Bank
net of fees
Typical
Large Bank
net of fees
and Durbin
Non Interest Expense for
Liquid Deposits*
1
2
2
2
Source: Company Reports; *Liquid deposits includes non-interest deposits, NOW
deposits, money market and savings 1 –
Includes operating expenses and marketing for ING Direct, excludes mortgage and
ShareBuilder. Data as of YE 2010. 2 -
Based on BCG analysis |
 11
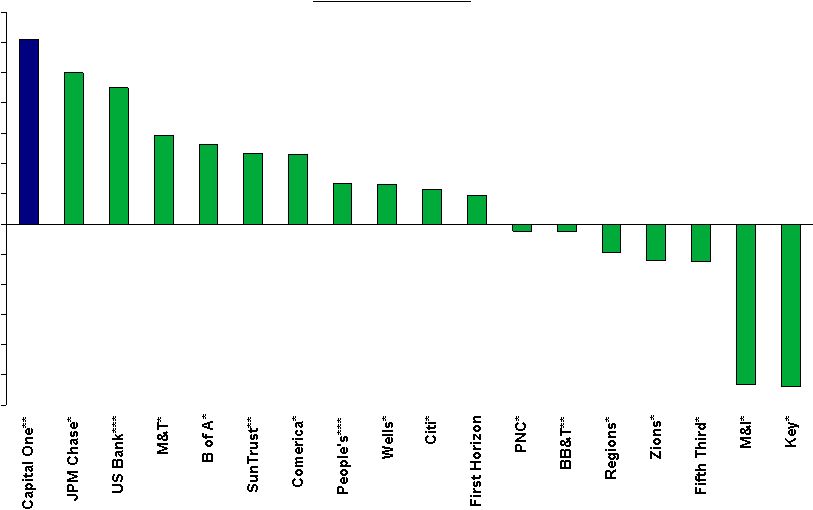
We are a leader in deposit growth
We are a leader in deposit growth
Deposit Growth
Q1 2010 –
Q1 2011
* Excludes foreign deposits
** Excludes brokered deposits.
*** Excludes impact from acquisitions.
Additional
notes:
B
of
A
also
excludes
“negotiable
CDs,
public
funds,
and
other
time
deposits”
category.
SunTrust
excludes
both
foreign
and
brokered
deposits.
Source: Company reports.
10.0%
9.0%
5.9%
5.3%
4.7%
4.6%
2.7%
2.6%
2.3%
1.9%
(0.5%)(0.5%)
(1.9%)
(2.4%)
(10.8%)
(2.5%)
(10.7%)
12.2%
-12%
-10%
-8%
-6%
-4%
-2%
0%
2%
4%
6%
8%
10%
12%
14% |
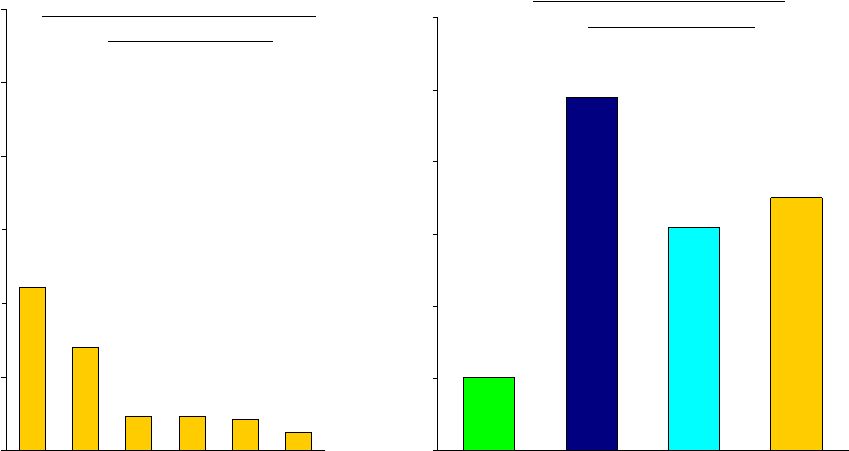
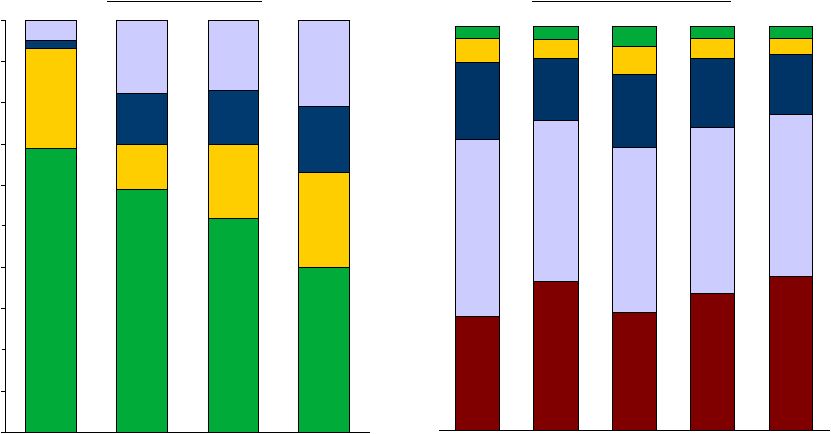
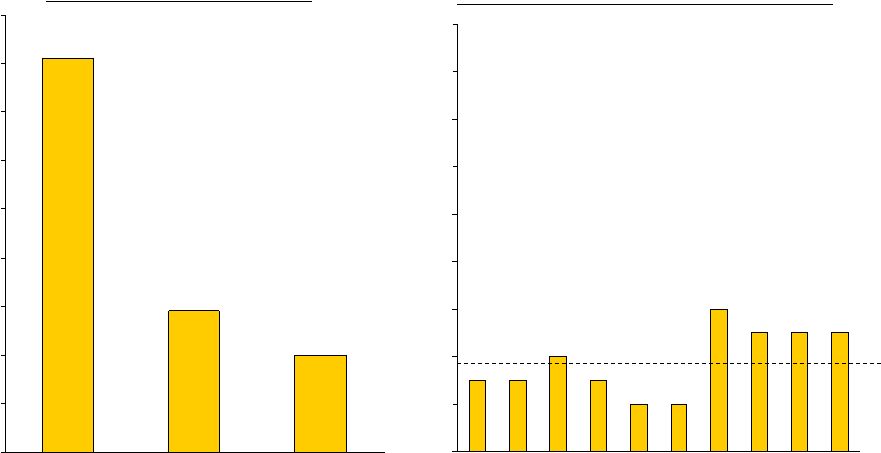 12
ING Direct deposit customers are exceptionally
ING Direct deposit customers are exceptionally
loyal
loyal
ING Direct Annual Customer Attrition
3%
3%
4%
3%
2%
2%
6%
5%
5%
5%
0%
2%
4%
6%
8%
10%
12%
14%
16%
18%
2001
2002
2003
2004
2005
2006
2007
2008
2009
2010
5.8%
4.0%
16.2%
0%
2%
4%
6%
8%
10%
12%
14%
16%
18%
National average
(savings/MMA)
ING Direct
Capital One
National Direct
Bank
Source: ING Direct; BAI Deposit Performance Benchmarking (May 2010)
Annual Customer Attrition
2007-2009 Average
average |
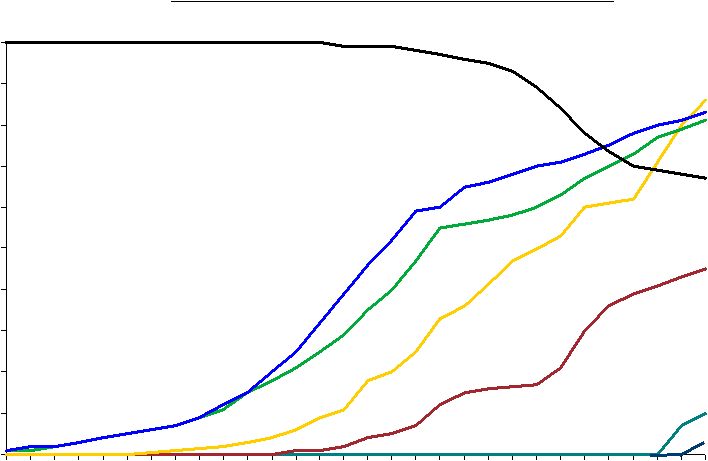
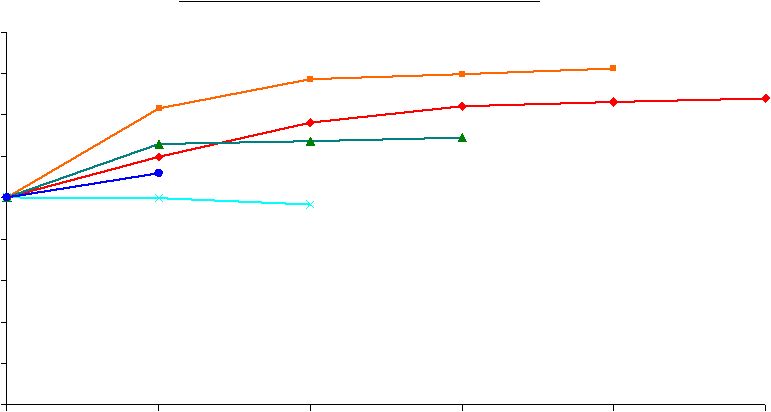 13
50%
60%
70%
80%
90%
100%
110%
120%
130%
140%
1
2
3
4
5
6
ING Direct customers maintain and grow
ING Direct customers maintain and grow
balances over time
balances over time
*Includes certificate of deposit bookings
Source: ING Direct; BAI Deposit Performance Benchmarking (May 2010)
2005
2006
2007
2008
2009
ING Direct Balance View by Cohort* |
 14
A handful of banks are breaking away from the pack
A handful of banks are breaking away from the pack
to build very large customer bases
to build very large customer bases
3
3
3
5
6
7
7
7
8
8
9
9
17
33
37
47
70
76
88
106
0
20
40
60
80
100
120
M
Number of Customer Accounts
12/31/2010
Data
is
U.S.
Only
for
firms
with
large
International
presence
(Citi,
ING,
TD
Bank);
May
include
account
overlap
both
between
segmented
silos
and
within
silos
due
to
multiproduct
relationships
Source: Company reports, Nilson |
 15
ING Direct’s customers are young and have
ING Direct’s customers are young and have
attractive income and potential
attractive income and potential
Notes:
US
households
segmented
by
year
of
birth
of
primary
head;
Age
breakdown
is
based
on those responding each institution was his or her “Primary Bank or Credit
Union” Source: MacroMonitor
69%
59%
52%
40%
24%
11%
18%
23%
2%
12%
13%
16%
5%
18%
17%
21%
0%
10%
20%
30%
40%
50%
60%
70%
80%
90%
100%
ING Direct
Capital
One Bank
Chase
BofA
<47
48-56
57-64
65+
Household Age
28%
36%
29%
34%
38%
44%
39%
41%
41%
40%
19%
15%
18%
17%
15%
6%
5%
7%
5%
4%
3%
3%
5%
3%
3%
ING
Direct
BofA
Savings
Capital
One
Savings
Chase
Savings
Wells
Fargo
Savings
Income Distribution
<$50k
$50k-$99k
$150-$199k
$200k+
$100-$149k
Source: Lightspeed (Panel size 174,925) |
 16
ING Direct customers are avid supporters of the
ING Direct customers are avid supporters of the
franchise
franchise
58%
35%
34%
31%
30%
0%
10%
20%
30%
40%
50%
60%
70%
ING Direct
Wells
Chase
BofA
Citi
1
When asked if the customer would recommend their bank, NPS is defined as % scored 9
or 10 less % 1 to 6, scores out of 10 Source:
NPS Benchmarking Study Results: Consumer Insights and Analytics (October
2010) Net Promoter Score (“NPS”)
1
2010 Q3 |
 17
Banking is increasingly moving to digital
Banking is increasingly moving to digital
channels
channels
0%
10%
20%
30%
40%
50%
60%
70%
80%
90%
100%
1980
1982
1984
1986
1988
1990
1992
1994
1996
1998
2000
2002
2004
2006
2008
Branch Banking
(at least once in
last 12 months)
Mobile Banking
ATM
Direct Deposit
Debit Cards
Remote Deposit
Capture
Source: Federal Reserve, FRB Boston, FRB Philadelphia, SRI Consulting,
University of Michigan, Mintel, Celent,
Bank
of
America,
comScore,
Nielsen
Mobile,
Wall
Street
Journal,
Mercatus
Analytics
Online Banking
(% of U.S.
banking
households)
Consumer Distribution Channel Penetration
Percent of U.S. Households, 1980-2009 |
 18
ING Direct complements our advantaged access
ING Direct complements our advantaged access
to assets and local-scale banking with national
to assets and local-scale banking with national
reach
reach
•
Commercial
•
Small Business
•
Consumer
National banking
reach
Local-scale banking
in attractive markets
•
Industry-leading direct
banking franchise
•
Direct brokerage
Advantaged
access to
assets
•
Credit Card
•
Auto Finance
•
Other Consumer
Lending
Powerful national brand
Very large national customer base |
 19
$0
$100
$200
$300
$400
$500
$600
$700
$800
$900
$1,000
Total U.S. Domestic Deposits
As of 12/31/2010
Source: SNL Financial
$B
With ING Direct we become the
With ING Direct we become the 5
th
largest U.S.
largest U.S.
bank
bank |
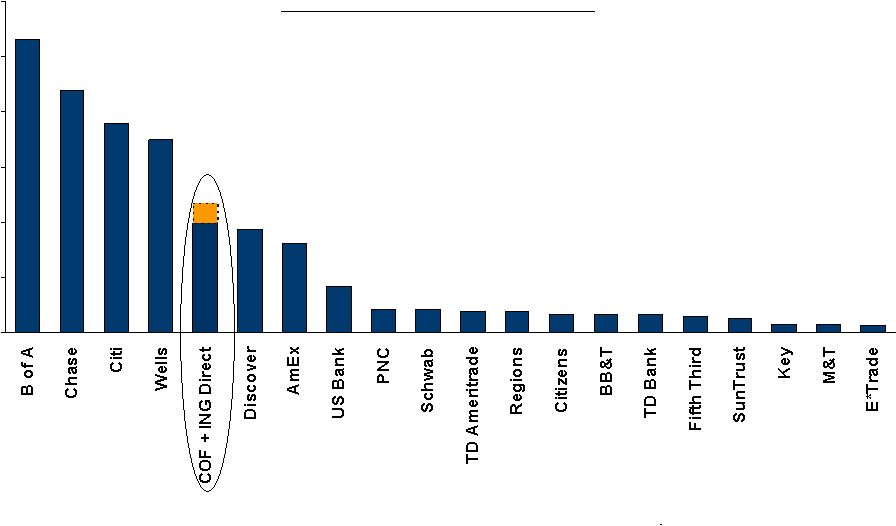
 20
$93
$7
$7
$9
$9
$10
$20
$22
$28
$0
$10
$20
$30
$40
$50
$60
$70
$80
$90
$100
With ING Direct we become the largest direct
With ING Direct we become the largest direct
bank
bank
Direct U.S. Banks: Liquid Domestic Deposits
As of 12/31/2010
Source: SNL Financial, Company reports
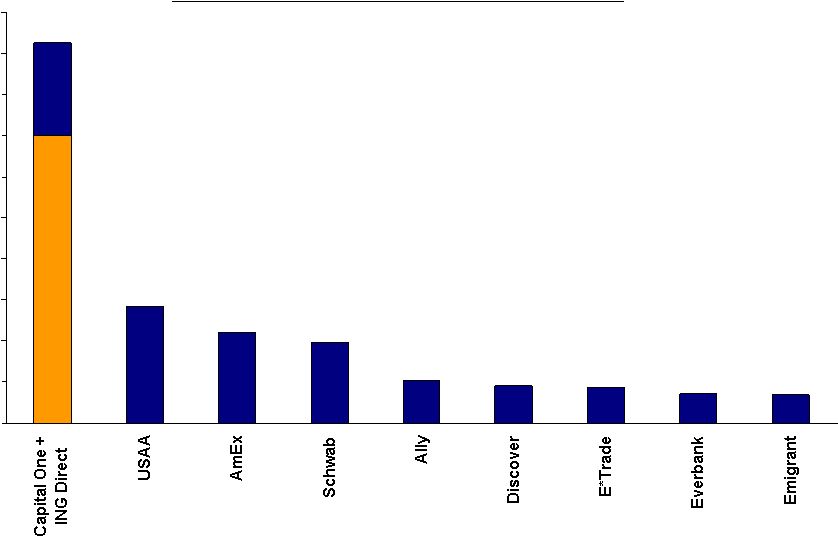
$B |
 21
Acquiring fully
marked balance
sheet without
paying significant
premium
Demonstrated
capability to
effectively mark
and manage
mortgage loans
Modest cost
reduction targets
Transaction risks are low
Transaction risks are low
Strong cultural
alignment |
 22
•
Transaction summary and strategic rationale
•
Financial overview |
 23
Transaction Summary
Transaction Summary
Transaction Value
Form of Consideration to
ING
1
Approvals
Expected Closing
$9.0 Billion
1
Fixed Number of Capital One shares of approximately 55.9 million
(9.9% COF pro forma ownership)
Fixed
cash
amount
of
approximately
$6.2
billion
2
Approved by both Boards
No Capital One or ING shareholder approval necessary
Federal Reserve and Dutch Central Bank regulatory and certain other
approvals will be necessary
Late Q4 2011 / Early Q1 2012
Source of Funds
Planned market equity raise prior to closing of approximately $2.0
billion to fund a portion of the cash payment to ING Group
Shareholder Agreement
One ING Group representative added to Capital One Board
ING Group not permitted to sell Capital One shares before the later of
180 days after market equity raise and 90 days after closing
Footnotes:
Additional sources of cash consideration:
$0.5B financed through cash
$3.7B financed through planned issuance of Capital One senior debt
1) Share consideration valued at COF 10-day
average closing price of $50.07 for the period ending June 15, 2011.
2) If ING’s stock ownership would exceed
9.9% at closing, the excess will be paid in cash |
 24
Financial Assumptions
Financial Assumptions
Earnings
1
Intangibles
+
Goodwill
3
Restructuring charges
and transaction costs
Dividends
COF: IBES EPS estimates through 2013
ING
Direct:
Baseline
annual
earnings
of
$630MM
1
Goodwill of $975MM
Core deposit intangibles of $455MM
Other identifiable intangibles of $240MM
$210MM
Capital One current dividend level maintained, subject to Capital One
board review
Synergies
Base case includes cost and modest funding synergies
Upside potential from balance sheet repositioning, cross-sell, and
additional funding synergies
See next
page
Gross
Credit
Mark
2
Gross credit mark of $1.7B (~4.2% of loans)
Footnotes:
1)
Estimated
$630MM
adjusted
pre-provision
NIAT
for
the
12
months
ended
March
31,
2011
excludes
loss on debt
extinguishment,
AFS
securities
sales,
OTTI,
and
incorporates Capital One’s tax rate.
2)
At 3/31/11.
3)
Estimated at 12/31/11 transaction close.
Equity
Planned market equity raise prior to closing of approximately $2.0B |
 25
We believe there is upside potential from our modeled
We believe there is upside potential from our modeled
synergies
synergies
Cost Savings
Cross-Sell
Deposit / Funding
Optimization
Balance Sheet
Repositioning
•
Consolidation of direct banking and
mortgage platform
•
Infrastructure / data center savings
•
Corporate systems rationalization
•
Staff function consolidation
•
ShareBuilder online brokerage
•
Capital One Venture card
•
Volume / deposit mix opportunities
in combined portfolio
•
Replace planned ING Direct
assets with additional card, auto,
and commercial assets
2013 Modeled Impact
Long-Term Potential
Run-Rate
$90MM
(~12% of ING Direct’s
costs)
$90MM
None Included
$50-70MM
10 bps
$200MM
15-25 bps
$300MM to $450MM
None Included
$75-140MM
Pre-Tax Annual Synergies |
| 26
Attractive Financial Transaction
Attractive Financial Transaction
Strong Pro Forma Capital
Generation
Accretive Transaction
Attractive Shareholder
Returns
1
EPS accretive
in 2012
Mid-single digit EPS accretion in 2013
Accretive to tangible book value per share at closing
IRR in excess of 20%
Return on Invested Capital exceeds cost of capital by 2013
Pro forma Tier 1 Common ratio of approximately 9% at estimated
closing of 12/31/2011
Accretive to Tier 1 Common capital generation in 2013
Positive ROE Impact
Accretive to ROE in 2012
Attractive Valuation
Price to tangible book multiple of 1.0x
Premium to core deposits of 0.4%
Note: See “Financial Assumptions” in this presentation
for underlying assumptions; IRR and ROIC calculations based on 6% TCE. |
 27
Combines valuable
ING Direct deposit
franchise with
Capital One’s
advantaged access
to assets
Accelerates winning
banking strategy
positioned where
the markets are
going
Strengthens our
customer franchise
and brand
Provides significant
financial and
strategic upside
with low risk
ING Direct is a game-changing acquisition that delivers
ING Direct is a game-changing acquisition that delivers
compelling financial results immediately and over the
compelling financial results immediately and over the
long-term
long-term
Compelling deal economics
and long-term value creation |