Attached files
| file | filename |
|---|---|
| 8-K - TRUSTCO BANK CORP NY 8-K 6-15-2011 - TRUSTCO BANK CORP N Y | form8k.htm |
Exhibit 99(a)
1
TrustCo Bank Corp NY
NASDAQ: TRST
June 2011

2
Forward Looking Statements
Safe Harbor Regarding Forward-Looking Statements
This presentation may contain forward-looking information about TrustCo Bank Corp NY (“the Company”) that is intended to be covered by the safe harbor for
forward-looking statements provided by the Private Securities Litigation Reform Act of 1995. Actual results and trends could differ materially from those set
forth in such statements due to various risks, uncertainties and other factors. Such risks, uncertainties and other factors that could cause actual results and
experience to differ from those projected include, but are not limited to, the following: credit risk, the effects of and changes in, trade, monetary and fiscal
policies and laws, inflation, interest rates, market and monetary fluctuations, competition, the effect of changes in financial services laws and regulations, real
estate and collateral values, changes in accounting policies and practices, changes in local market areas and general business and economic trends and the matters
described under the heading “Risk Factors” in the prospectus supplement and prospectus for the offering to which this communication relates, our most recent
annual report on Form 10-K and our other securities filings. The statements are valid only as of the date hereof and the Company disclaims any obligation to
update this information except as may be required by applicable law.
The Company has filed a registration statement (including a prospectus and a related prospectus supplement) with the SEC (File No. 333-174331) for the offering
to which this communication relates. Before you invest, you should read the prospectus and the prospectus supplement in that registration statement, the
preliminary prospectus supplement and other documents that the Company has filed with the SEC for more complete information about the Company and the
offering. You may obtain these documents without charge by visiting EDGAR on the SEC website at www.sec.gov. Alternatively, copies of the preliminary
prospectus supplement and the prospectus relating to the offering may be obtained from Sandler O'Neill + Partners, L.P., 919 Third Avenue, 6th Floor, New
York, NY 10022, (866) 805-4128 or and Stifel, Nicolaus & Company, Incorporated at (443) 224-1988.

3
Issuer: TrustCo Bank Corp NY (the "Company“ or “TRST”)
Ticker/Exchange: TRST / NASDAQ Global Select Market
Offering: Follow-on Public Offering
Type of Security: Common Stock
Transaction Size: 13,600,000 shares, or approximately $75 million¹
Over-Allotment Option: 15%
Use of Proceeds: General corporate purposes, to fund organic growth
Sole Book-Running Manager: Sandler O’Neill + Partners, L.P.
Co-Manager: Stifel Nicolaus Weisel
(1) Based on TRST closing stock price of $5.52 on June 7, 2011
Offering Terms
4
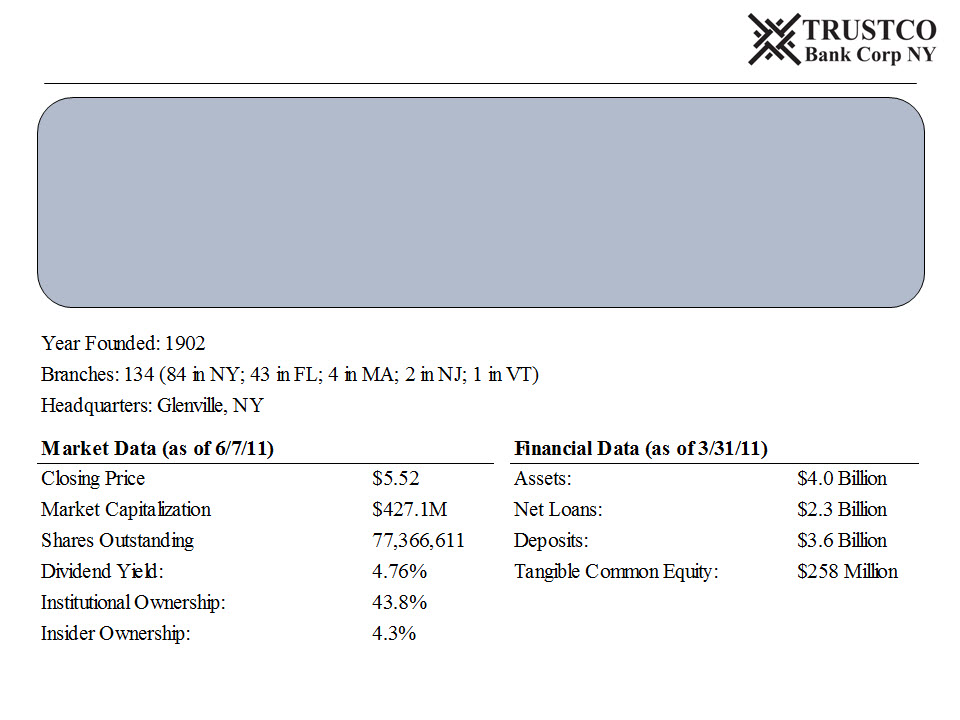
ü New York community-focused financial services company with market presence in
Florida, Massachusetts, New Jersey and Vermont
Florida, Massachusetts, New Jersey and Vermont
ü Provides core banking products and services to retail customers and local
businesses
businesses
ü Strategy of building solid deposit franchise with low cost, core deposit base has led
to strong, consistent balance sheet growth
to strong, consistent balance sheet growth
Market data based on TRST closing stock price of $5.52 on June 7, 2011
Source: SNL Financial
TrustCo Bank Corp NY
5
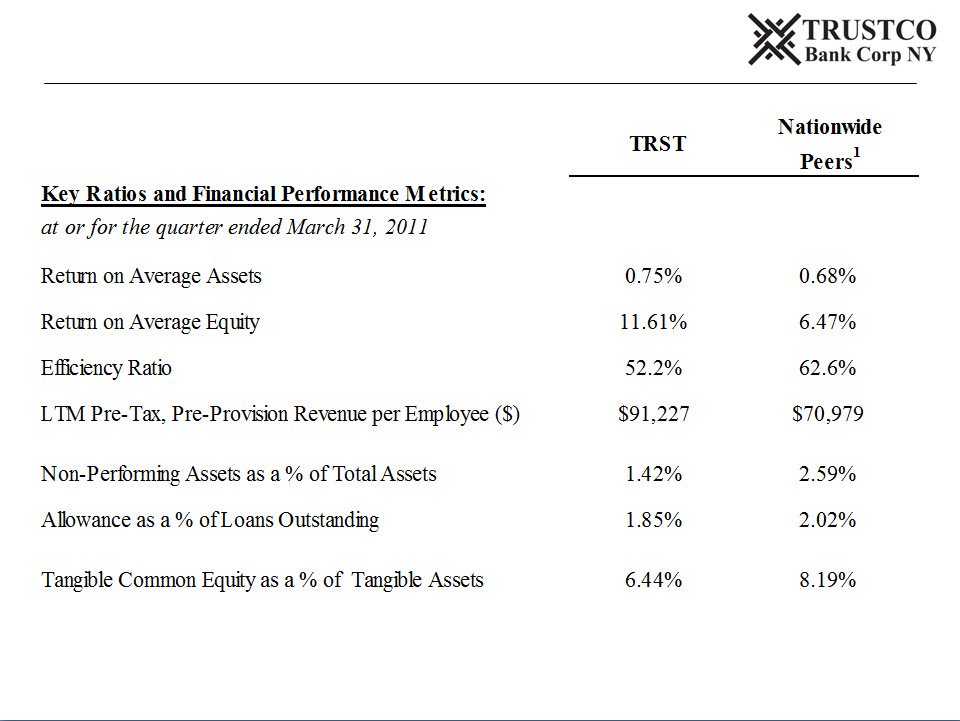
(1) Nationwide peers include publicly-traded banks and thrifts with assets between $2 billion and $10 billion (excludes mutuals and pending acquisition targets) as of March 31, 2011
Note: Nationwide Peers reflects median value of group
Source: SNL Financial, SEC Filings
Key Financial Attributes

6
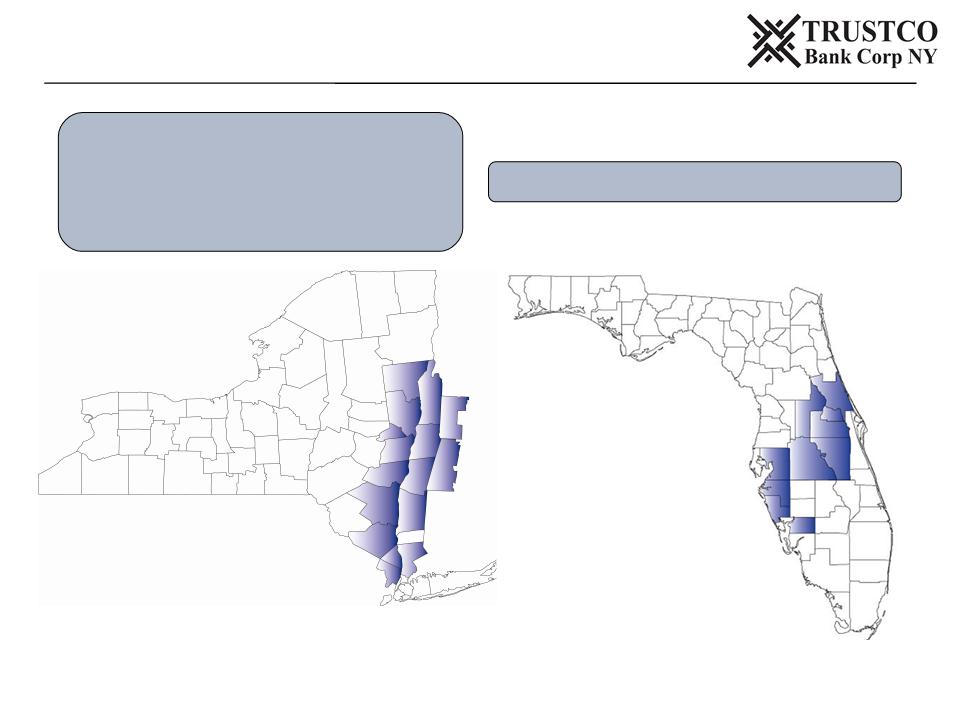
4 De novo expansion has driven the growth of TrustCo over the last decade
4 Over $4.0 billion in assets focused in three major geographic regions:
o Upstate New York: TrustCo’s historical market area, centered around New York’s Capital Region
o Downstate New York: Covers the lower and mid-Hudson River Valley and includes two branches in New
Jersey
Jersey
o Florida Market: Focus primarily around the greater Orlando area, with a second cluster of branches in
Florida’s West Coast communities to the south of Tampa
Florida’s West Coast communities to the south of Tampa
4 Leader in deposit market share for any New York-headquartered bank in the Albany-Schenectady-
Troy, NY MSA with $2.4 billion in deposits1
Troy, NY MSA with $2.4 billion in deposits1
4 From 2003 to 2010, one of the fastest growing community banks in central Florida with 43 new
branches and 71.8% deposit compound annual growth rate²
branches and 71.8% deposit compound annual growth rate²
4 TrustCo Bank Corp NY, organized in 1981 to acquire all of the outstanding stock of Trustco Bank,
N.A., formerly known as Trustco Bank New York, and prior to that, The Schenectady Trust
Company
N.A., formerly known as Trustco Bank New York, and prior to that, The Schenectady Trust
Company
o Schenectady Trust was chartered in 1902
(1) As of June 30, 2010
(2) Measured from June 30, 2003 to June 30, 2010. Includes deposit market share in the following counties in Florida where TrustCo has a branch presence: Charlotte, Hillsborough, Lake, Manatee,
Orange, Osceola, Polk, Sarasota, Seminole and Volusia
Orange, Osceola, Polk, Sarasota, Seminole and Volusia
Source: FDIC, SNL Financial
Company Overview
7
Source: Company Documents
New York - 14 Counties, 84 Branches
Massachusetts - 1 County, 4 Branches
New Jersey - 1 County, 2 Branches
Vermont - 1 County, 1 Branch
Florida - 10 Counties, 43 Branches
Branch Franchise Overview
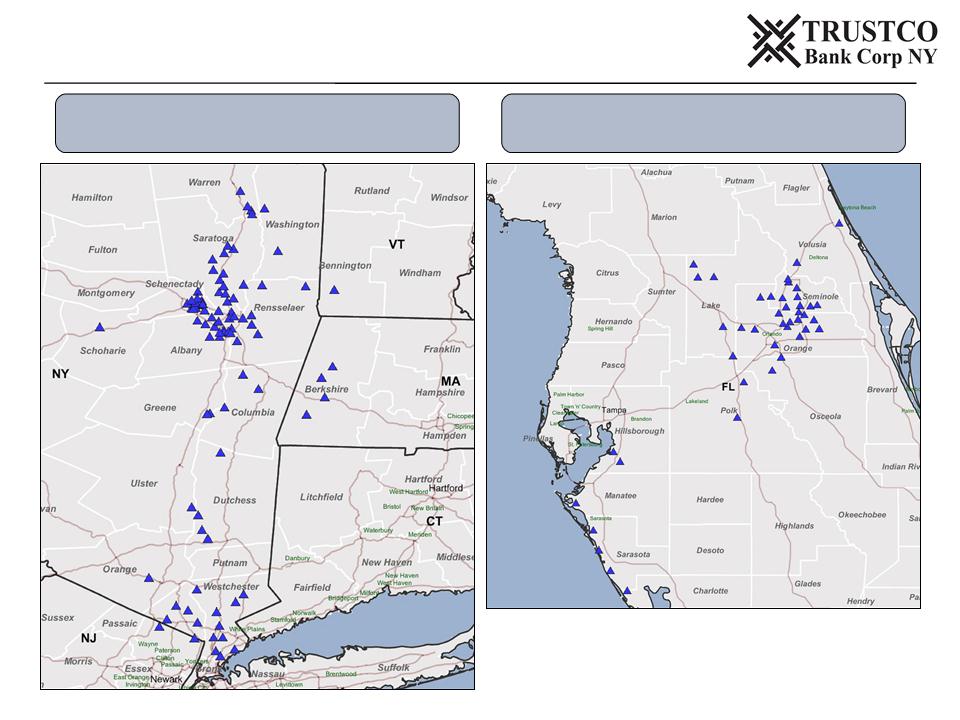
8
Source: SNL Financial
Upstate and Downstate
New York Market Branches
New York Market Branches
Florida Market Branches
Branch Franchise Details
9
ü Deposit and Loan Portfolio Growth
ü Superior Asset Quality
ü Increasing Market Share in Newer
Markets
Markets
4 Generated through our expanded branch network
4 Intense customer service focus
4 Simple, low cost products
4 Centralized portfolio lending process
4 Conservative lending criteria
4 History of strong portfolio management
4 43 new branches and 71.8% deposit compound
annual growth rate in central Florida from 2003
to 2010¹
annual growth rate in central Florida from 2003
to 2010¹
ü Improving Efficiency Ratio
4 Effective cost controls producing superior
results, compared with peers
results, compared with peers
(1) Measured from June 30, 2003 to June 30, 2010. Includes deposit market share in the following counties in Florida where TrustCo has a branch presence: Charlotte, Hillsborough, Lake,
Manatee, Orange, Osceola, Polk, Sarasota, Seminole and Volusia
Manatee, Orange, Osceola, Polk, Sarasota, Seminole and Volusia
Source: FDIC, SNL Financial
Strategy and Philosophy for Continued Growth
10
|
Name
|
Title/Function
|
Years in
Banking |
Years with
TRST |
|
Robert J. McCormick
|
President & Chief Executive Officer
|
26
|
16
|
|
Robert T. Cushing
|
Executive VP & Chief Financial Officer
|
34
|
17
|
|
Scot R. Salvador
|
Executive VP & Chief Banking Officer
|
21
|
16
|
|
Robert M. Leonard
|
Senior Vice President & Corporate Secretary
|
25
|
25
|
|
Eric W. Schreck
|
Senior Vice President & Florida Regional President
|
22
|
22
|
|
Kevin Timmons
|
Vice President - Finance
|
32
|
4
|
|
Average
|
|
27
|
17
|
Experienced Senior Management

11
(1) Nationwide peers include publicly-traded banks and thrifts with assets between $2 billion and $10 billion (excludes mutuals and pending acquisition targets) as of March 31, 2011
(2) Includes all publicly traded banks and thrifts nationwide as of March 31, 2011
Source: FDIC, SNL Financial, Bureau of Labor Statistics
4 Albany-Schenectady-Troy Metropolitan Statistical Area (“MSA”) accounts for about 70% of the
total population of the Upstate market
total population of the Upstate market
o Government jobs constitute approximately 24% of nonfarm employment in the Albany-Schenectady-Troy
MSA
MSA
o In recent years, public and private universities in the area (including Rensselaer Polytechnic Institute and the
University at Albany (State University of New York)) have made significant strides in building the area’s
industry base in advanced technology fields
University at Albany (State University of New York)) have made significant strides in building the area’s
industry base in advanced technology fields
4GlobalFoundries Inc., the world’s third largest independent semiconductor manufacturer, is currently building a new $4.6
billion chip fabrication plant in Saratoga County that is expected to begin initial production in 2012
billion chip fabrication plant in Saratoga County that is expected to begin initial production in 2012
4 Low Unemployment Rate in Primary Markets
o April 2011 unemployment rate in Albany-Schenectady-Troy MSA was 6.8% compared to the national average
of 9.0%
of 9.0%
4 Non-performing loan data for TrustCo is very favorable to peer and national averages
o As of March 31, 2011, TrustCo had nonperforming loans as a % of total loans of 2.14% versus the peer
median of 3.33%¹ and 3.50% for all publicly traded banks and thrifts²
median of 3.33%¹ and 3.50% for all publicly traded banks and thrifts²
Upstate and Downstate New York Economies

12
4 TrustCo’s Florida market covers the greater Orlando area in the eastern/central part of the state,
with a second cluster of branches in Florida’s West Coast communities to the south of Tampa¹
with a second cluster of branches in Florida’s West Coast communities to the south of Tampa¹
4 Economically Diverse Region
o Medical City is a new 650 acre medical campus occupied by The University of Central Florida College of
Medicine, The Sanford Burnham Medical Research Institute, M D Anderson Cancer Research Institute and
The Nemours Childrens Hospital estimated to bring 30,000 jobs and a $7.6 billion economic impact
Medicine, The Sanford Burnham Medical Research Institute, M D Anderson Cancer Research Institute and
The Nemours Childrens Hospital estimated to bring 30,000 jobs and a $7.6 billion economic impact
o The University of Central Florida is a stable major employer as the 2nd largest university in the US
o Central Florida recently surpassed New York City as the #1 tourist destination in America²
o Central Florida and the West Coast of Florida are known as popular retirement destinations
4 Counties included in the Florida market have a total population of approximately 5.33 million, up
24.5% from the population in 2000
24.5% from the population in 2000
4 Overall, the median annual household income in these counties was $53,847 in 2010, which
represents an increase of 28.7% from 2000 data
represents an increase of 28.7% from 2000 data
(1) Florida market consists of the counties of Charlotte, Hillsborough, Lake, Manatee, Orange, Osceola, Polk, Sarasota, Seminole and Volusia
(2) The Orlando Sentinel, May 24, 2011
Source: FDIC, SNL Financial
Florida Economy
13
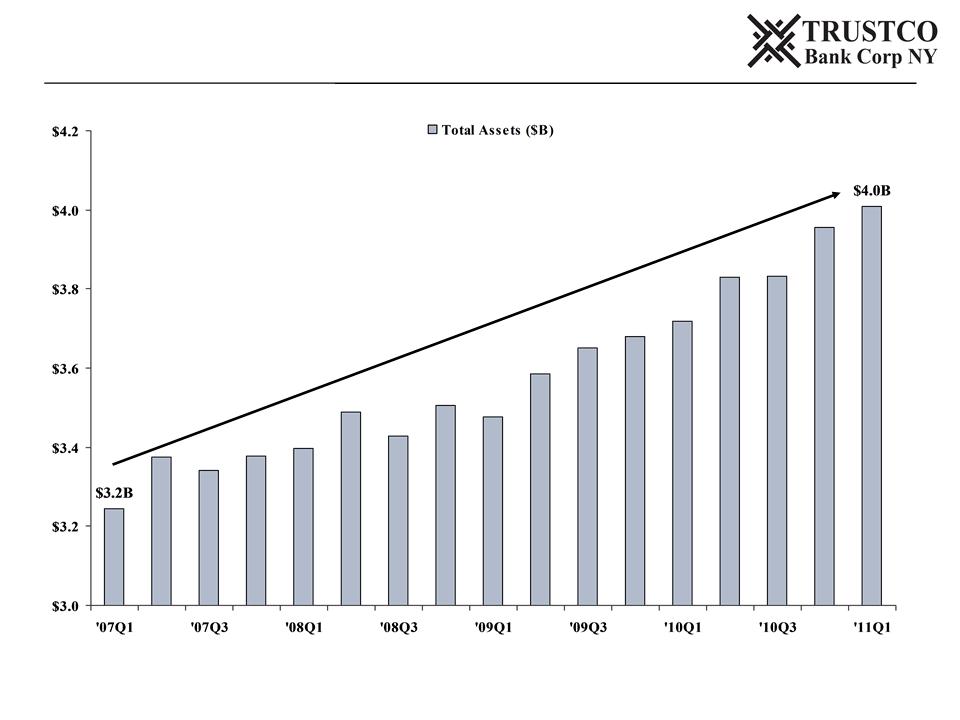
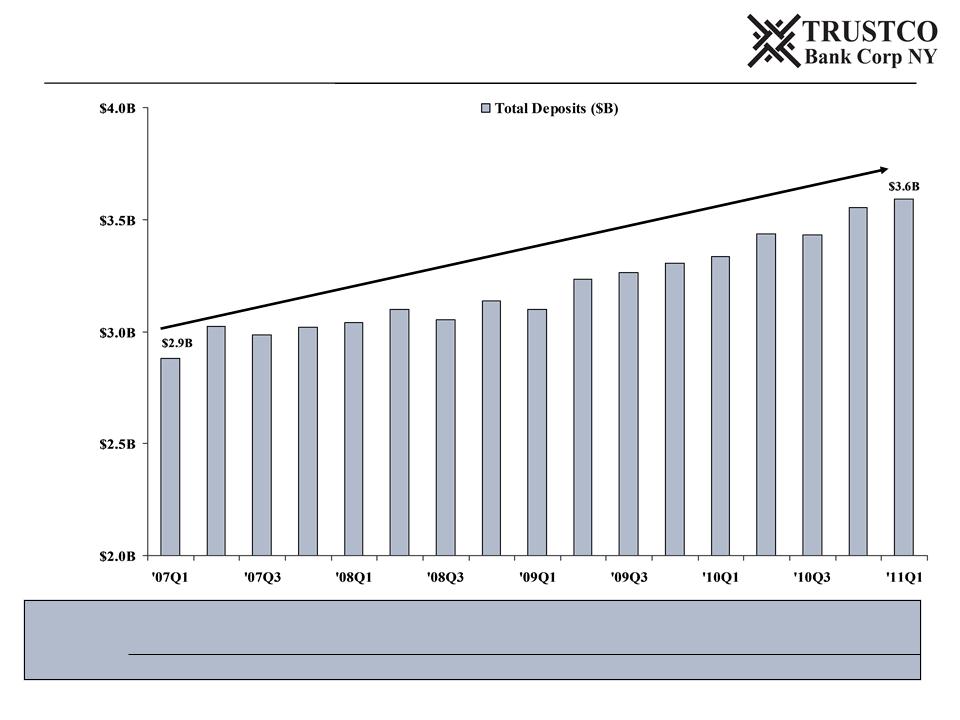
Note: For source data, see page 35 in the Appendix
Dollars in billions
Source: SEC Filings
CAGR: 5.4%
Consistent Balance Sheet Growth
14
Note: For source data, see page 35 in the Appendix
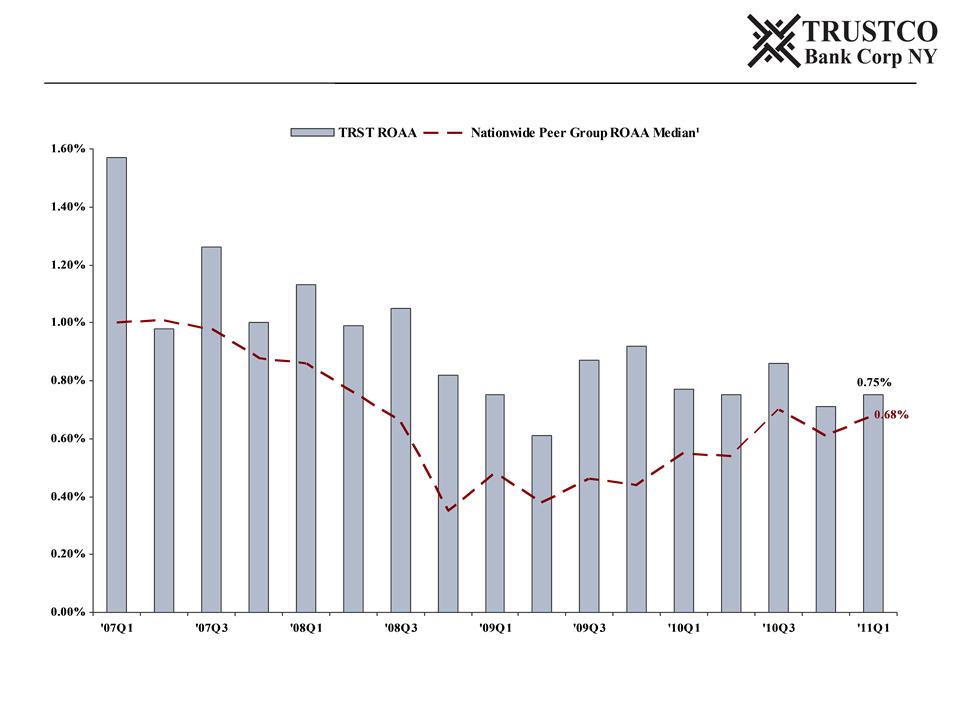
(1) Nationwide peers include publicly-traded banks and thrifts with assets between $2 billion and $10 billion (excludes mutuals and pending acquisition targets) as of March 31, 2011
Source: SEC Filings; SNL Financial
Superior ROAA Compared to Peers
15
Note: For source data, see page 35 in the Appendix
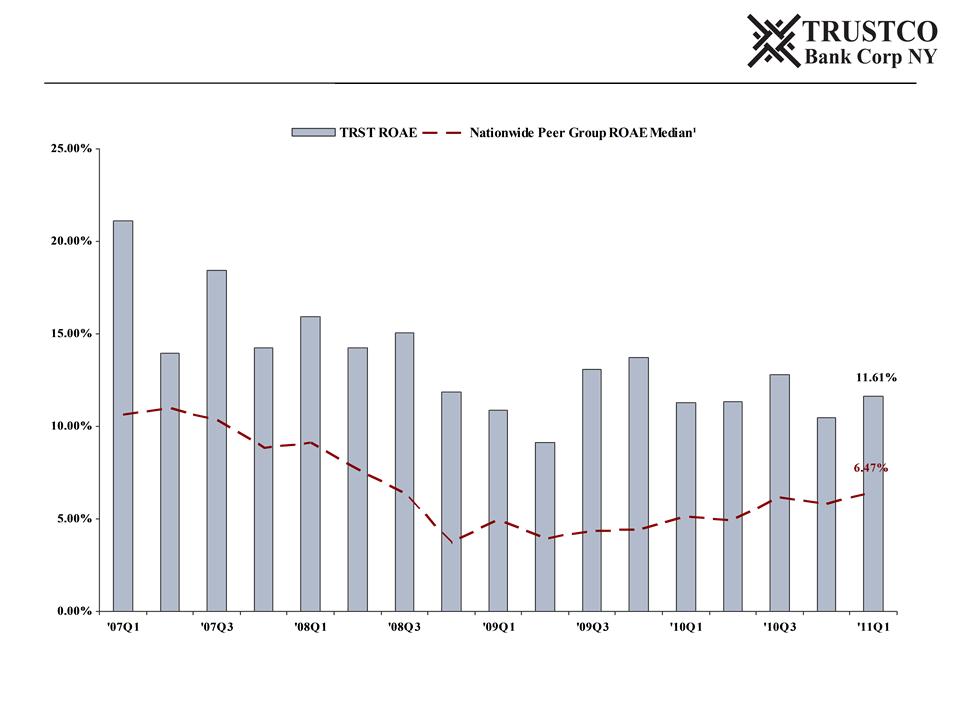
(1) Nationwide peers include publicly-traded banks and thrifts with assets between $2 billion and $10 billion (excludes mutuals and pending acquisition targets) as of March 31, 2011
Source: SEC Filings; SNL Financial
Superior ROAE Compared to Peers
16
Note: For source data, see page 35 in the Appendix
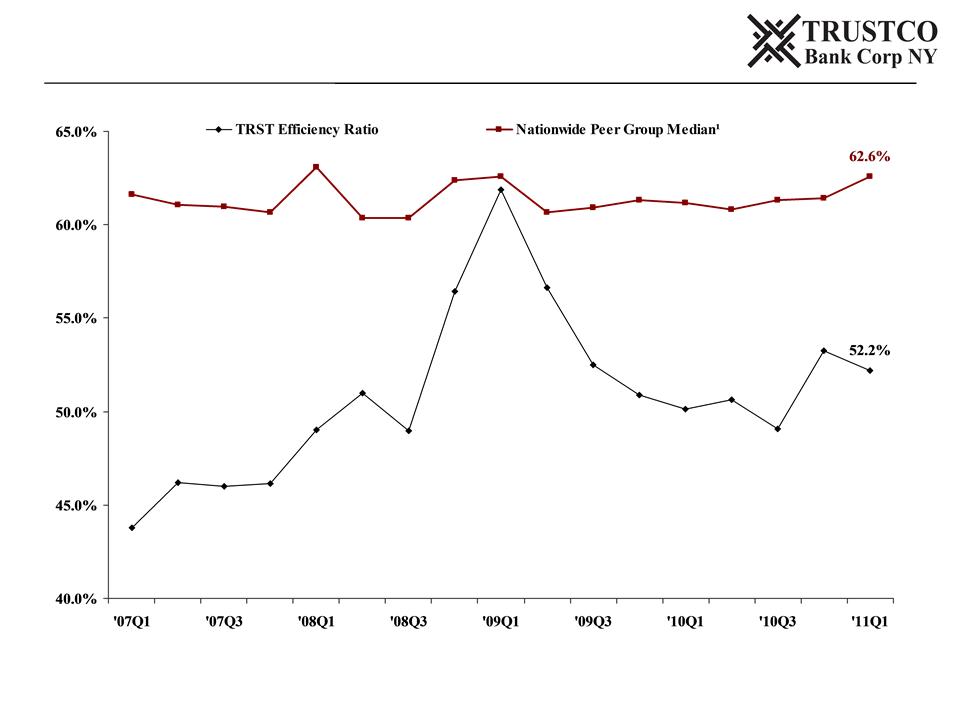
(1) Nationwide peers include publicly-traded banks and thrifts with assets between $2 billion and $10 billion (excludes mutuals and pending acquisition targets) as of March 31, 2011
Source: SEC Filings; SNL Financial
Superior Efficiency Ratio Compared to Peers

17
4 Since 2000, the Company has increased its network by 80 branches, bringing the total to
134
134
4 All new branches opened on a de novo basis with no stock or debt issuances
4 Expansion included growth in or into five states, with a focus on Florida and Downstate
New York
New York
4 We have built a platform for steady and conservative growth
o Year over year deposits per branch increased $1.8 million or 7.0%¹
4 Our company now has a footprint with economic and geographic diversification
(1) Comparison from 3/31/2011 to 3/31/2010
Source: SEC Filings; Company Documents
Branch Growth Strategy
18
Note: For source data, see page 35 in the Appendix
Source: SEC Filing; Company Documents
Total Branches
107
124
132
133
134
NY Branches
83
86
90
90
91
FL Branches
24
38
42
43
43
CAGR: 5.7%
Deposit Growth and Branch Expansion
19
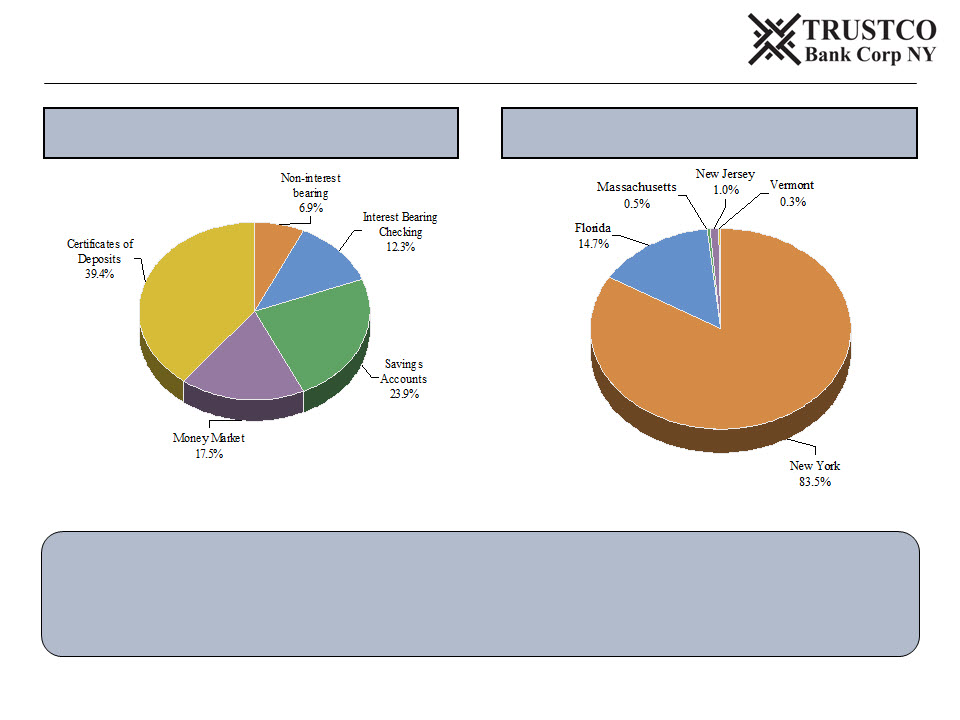
March 31, 2011
Deposit Composition by Geography
ü All deposits are gathered through branch network
ü No brokered deposits
ü No special pricing for jumbo CDs
Total Deposits: $3.6 billion
Avg. Cost of Int. Bearing Deposits: 0.82%
Note: Data as of March 31, 2011
Source: Company Documents, SEC Filings
Deposit Composition
20
Note: For source data, see page 35 in the Appendix
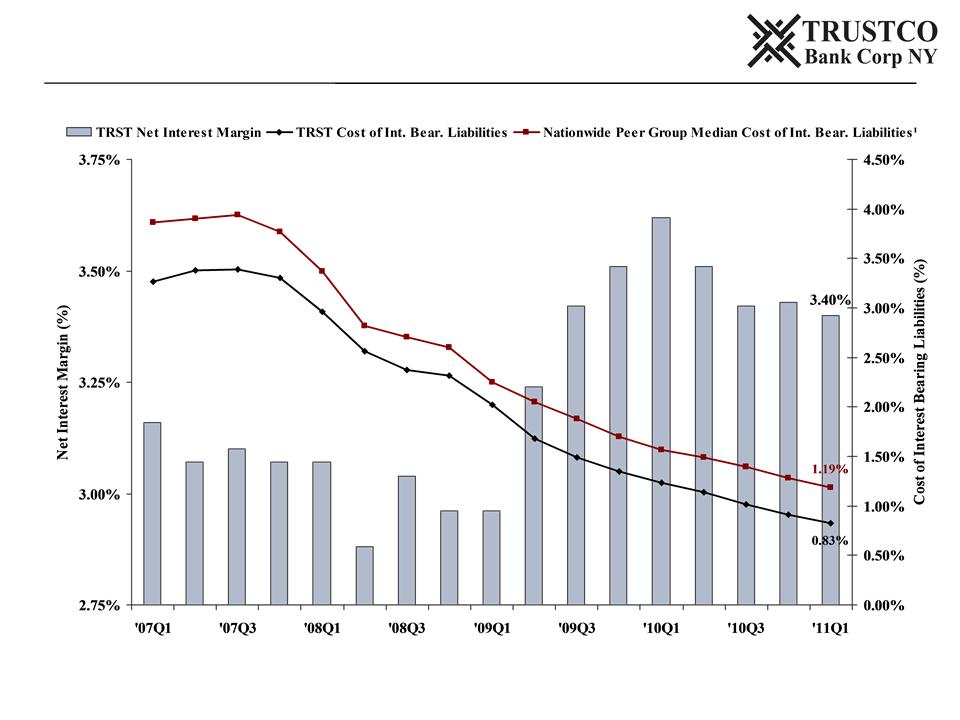
(1) Nationwide peers include publicly-traded banks and thrifts with assets between $2 billion and $10 billion (excludes mutuals and pending acquisition targets) as of March 31, 2011
Source: Company Documents, SEC Filings, SNL Financial
Net Interest Margin &
Cost of Interest Bearing Liabilities
Cost of Interest Bearing Liabilities
21
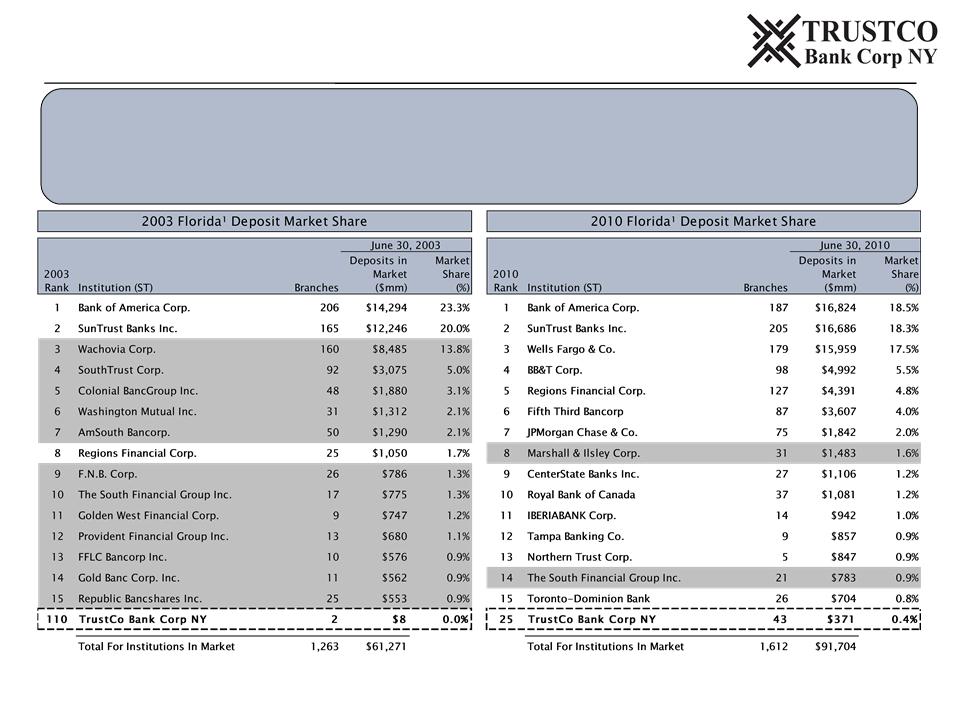
*Note: Shaded institutions represent those institutions that have either failed or been acquired
(1) As of June 30, 2010; Note: Includes deposit market share for banks and thrifts in the following counties in Florida where TrustCo has a branch presence: Charlotte, Hillsborough, Lake,
Manatee, Orange, Osceola, Polk, Sarasota, Seminole and Volusia
Manatee, Orange, Osceola, Polk, Sarasota, Seminole and Volusia
Source: SNL Financial, FDIC
ü Since 2003, TrustCo and the Florida marketplace has seen a significant number of its deposit competitors
either be acquired or fail*
either be acquired or fail*
ü During that same time, TrustCo has grown its Florida deposits at a CAGR of 71.8%
ü In 2010, TrustCo had the 8th largest branch network in its market with 43 locations¹
Deposit Market Share - Florida
22
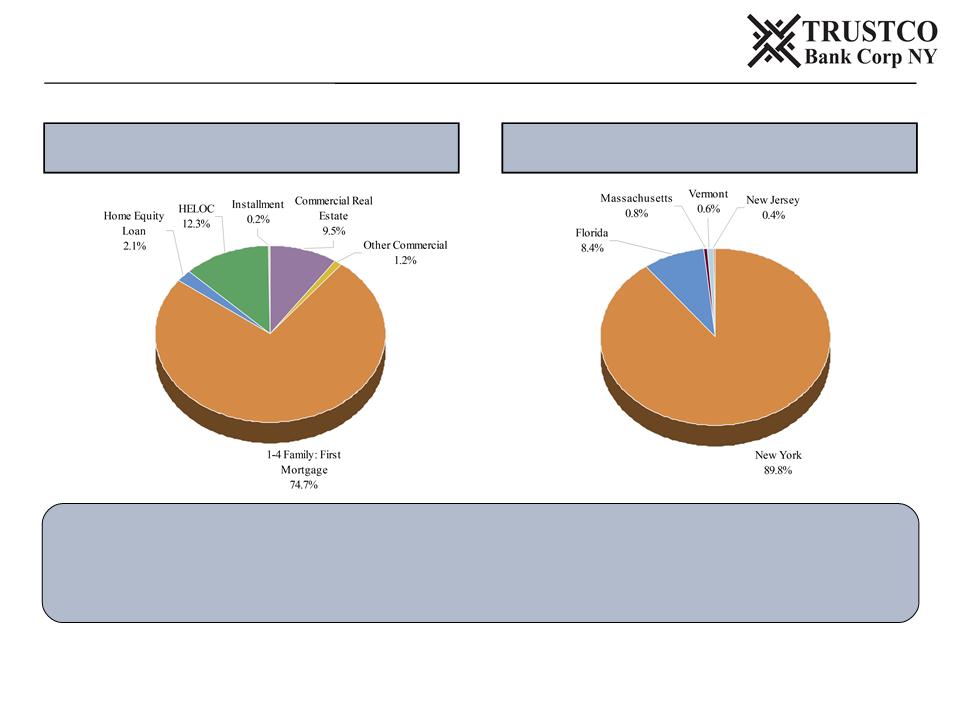
Loan Portfolio by Type
Loan Portfolio by Location
ü Portfolio centered on owner-occupied, single family loans
ü Limited owner-occupied condominium lending (less than $10 million in total)
ü No sub-prime lending
Note: Data as of March 31, 2011
Source: Company Documents, SEC Filings
Loan Portfolio Composition
23
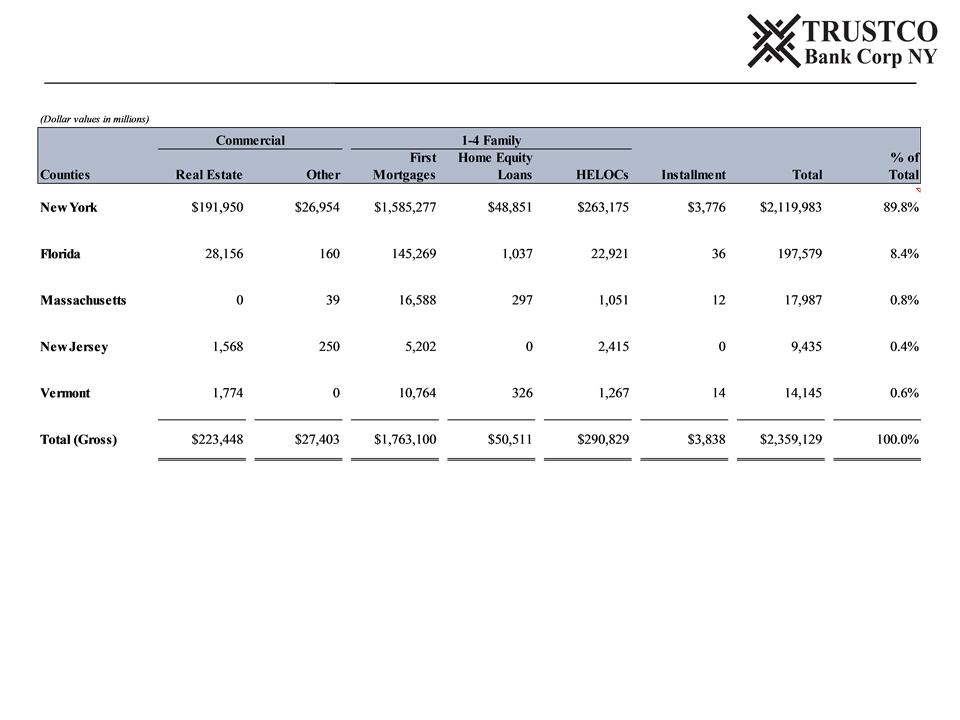
Note: Data as of March 31, 2011
Source: Company Documents, SEC Filings
Geographic Detail of Loan Portfolio
24
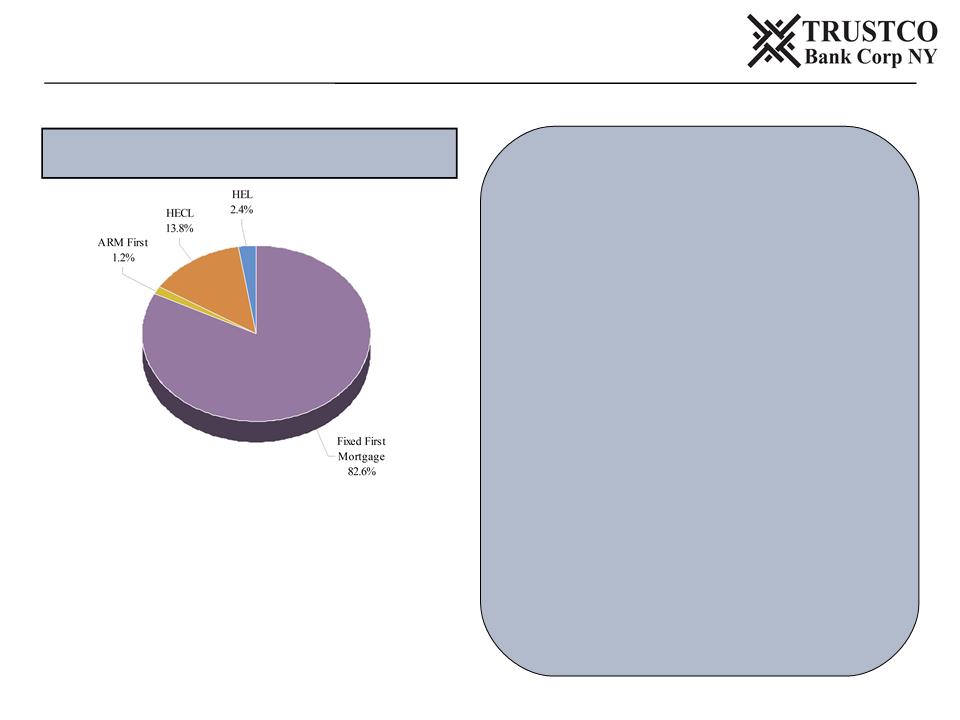
1-4 Family Composition
ü The portfolio is comprised of loans that
are fully-documented using
comprehensive underwriting criteria
without sole reliance on credit scores
are fully-documented using
comprehensive underwriting criteria
without sole reliance on credit scores
ü All applications are taken at branch
locations by company employees
locations by company employees
ü Residential portfolio increased 4.5%
year over year from March 31, 2010 to
March 31, 2011
year over year from March 31, 2010 to
March 31, 2011
ü Average loan size is approximately
$87,000
$87,000
ü Company chose not to compete against
“exotic” offerings that were commonly
offered between 2005 to 2007, e.g. no
Alt-A or Subprime products or
programs
“exotic” offerings that were commonly
offered between 2005 to 2007, e.g. no
Alt-A or Subprime products or
programs
Aggregate: $2.1 Billion
Note: Data as of March 31, 2011
Source: Company Documents, SEC Filings
Detail of Loan Portfolio
25
Note: For source data, see page 35 in the Appendix
(1) Nationwide peers include publicly-traded banks and thrifts with assets between $2 billion and $10 billion (excludes mutuals and pending acquisition targets) as of March 31, 2011
Source: SEC Filings; SNL Financial
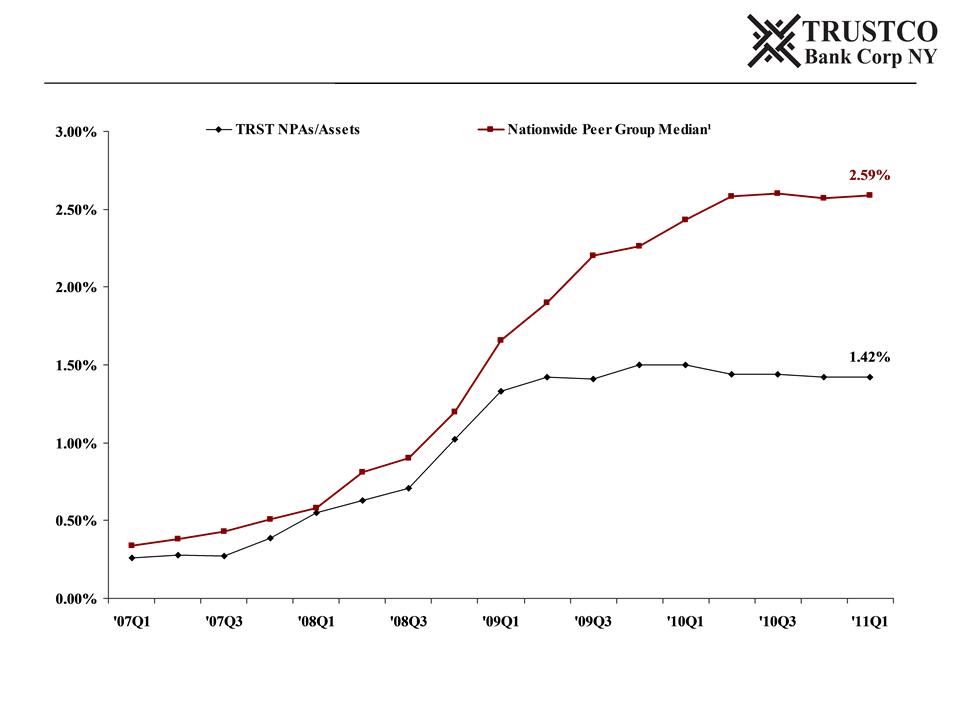
Superior Credit Quality Compared to Peers
26
ü TrustCo’s underwriting and lending practices have resulted in relatively low levels of non-
performing assets and net charge-offs, as well as healthy reserve coverage, compared to peers
performing assets and net charge-offs, as well as healthy reserve coverage, compared to peers
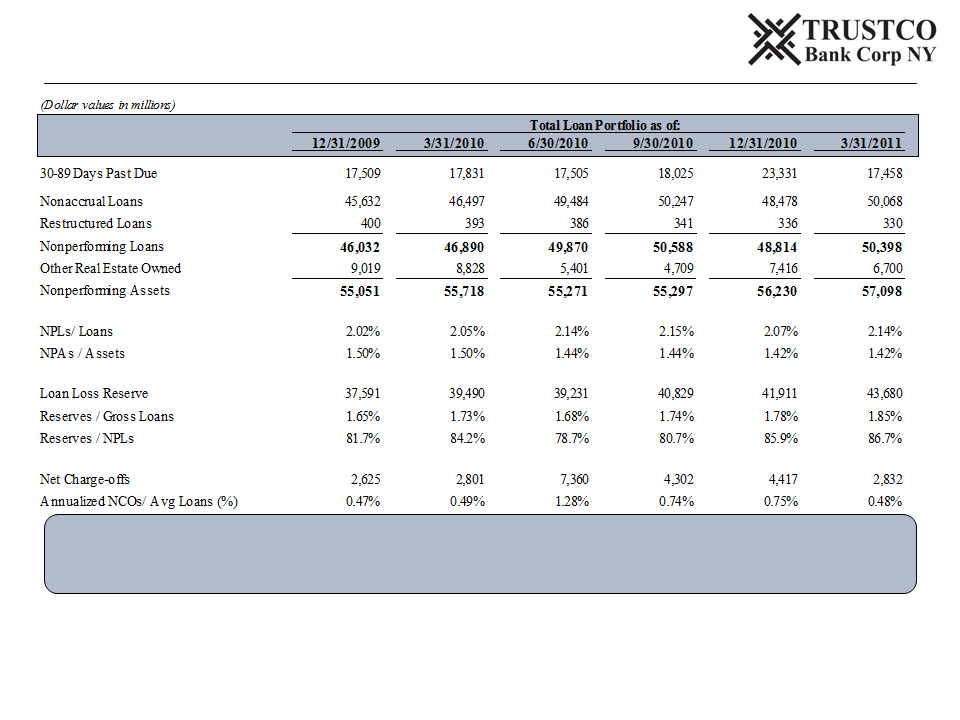
Source: Company Documents, SEC Filings
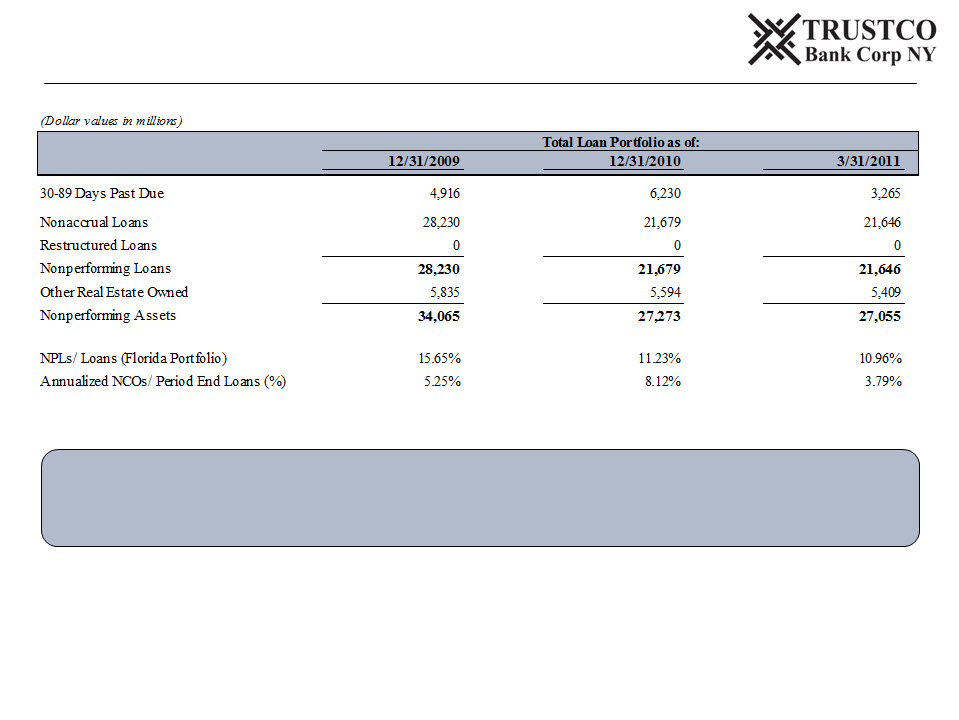
Credit Quality
27
(1) Includes Florida publicly traded banks and thrifts with assets between $2 billion and $10 billion; excludes TIBB as an outlier due to its recent recapitalization and write-down of loan portfolio
Source: Company Documents, SEC Filings
ü Recent trends in Florida delinquencies are encouraging
ü Superior credit quality improvement to Florida peers¹: TrustCo’s Florida NPLs have decreased
23%, while Florida peers’ NPLs have grown on average 7%, since 12/31/09
23%, while Florida peers’ NPLs have grown on average 7%, since 12/31/09
Historical Credit Quality in Florida

28
As of March 31, 2011
Source: Company Documents, SEC Filings
4 Target a 60/40 split on loans to investments
4 Investment Securities
o High level of liquidity in excess of $1 billion
o Vast majority (86%) of securities are available for sale
o High credit quality portfolio
o No derivatives, trust preferred or “exotic” instruments
4 Interest Rate Risk
o Loans are funded through core deposits
o No borrowings
o Effective deposit lives balance with asset lives
Investment Portfolio and Rate Risk Management
29
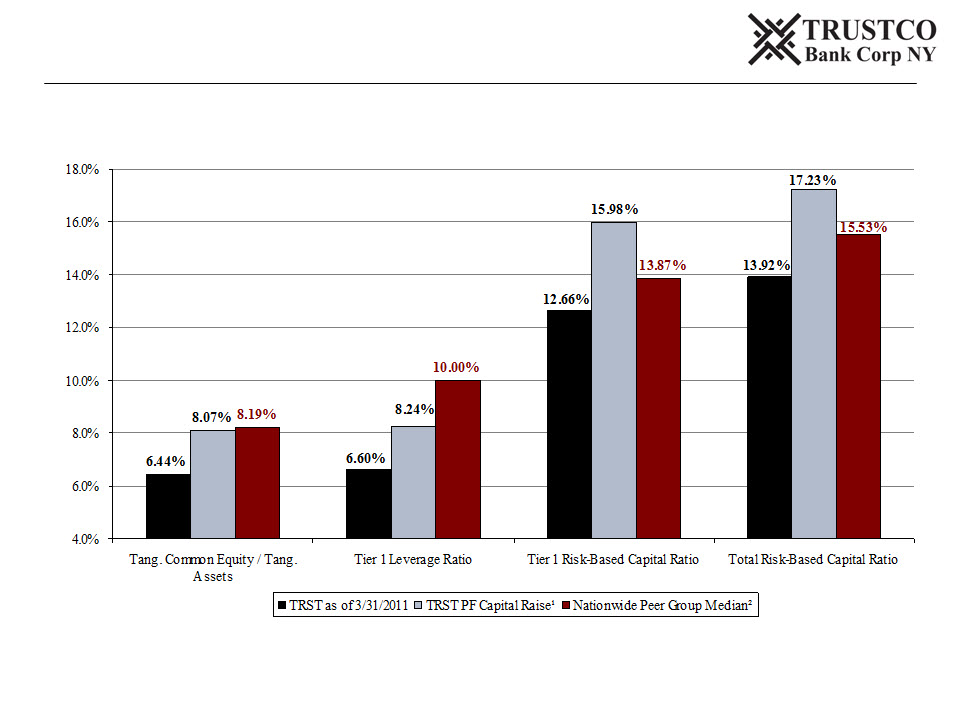
(1) Assumes $75 million in gross proceeds with a 5.00% underwriting spread and 20% risk weighting for use of new capital
(2) Nationwide peers include publicly-traded banks and thrifts with assets between $2 billion and $10 billion (excludes mutuals and pending acquisition targets) as of March 31, 2011
Source: Company Documents, SNL Financial
Pro Forma Capital Ratios

30
Why Invest in TrustCo Bank Corp NY?
4TrustCo has a 100 year history of profitability and dividend payouts
4TrustCo has a geographically diverse branch network in many growth areas
4Experienced management team with a history of strong operating results
4Solid program of interest rate risk management
4With major expansion plan completed and paid for, TrustCo will now be able
to be opportunistic in its continued growth
to be opportunistic in its continued growth

31
TrustCo Awards
4 “Banking’s Top Performers” - ABA Banking Journal
o 12th out of 129 banks with over $3 billion of assets for 2010
4 #1 Home Lender in Capital Region 2010 - Capital District Business Review
4 Top 30 of “Top 150 Performers” - Bank Director Magazine, 2008-2010
4 Top 20 of “Top 100 Thrifts” - SNL Thrift Investor, 2005-2010 .
4 Top 10 of “Top 200 Mid Tier Banks” - US Banker Magazine, 2007-2009

Appendix
33
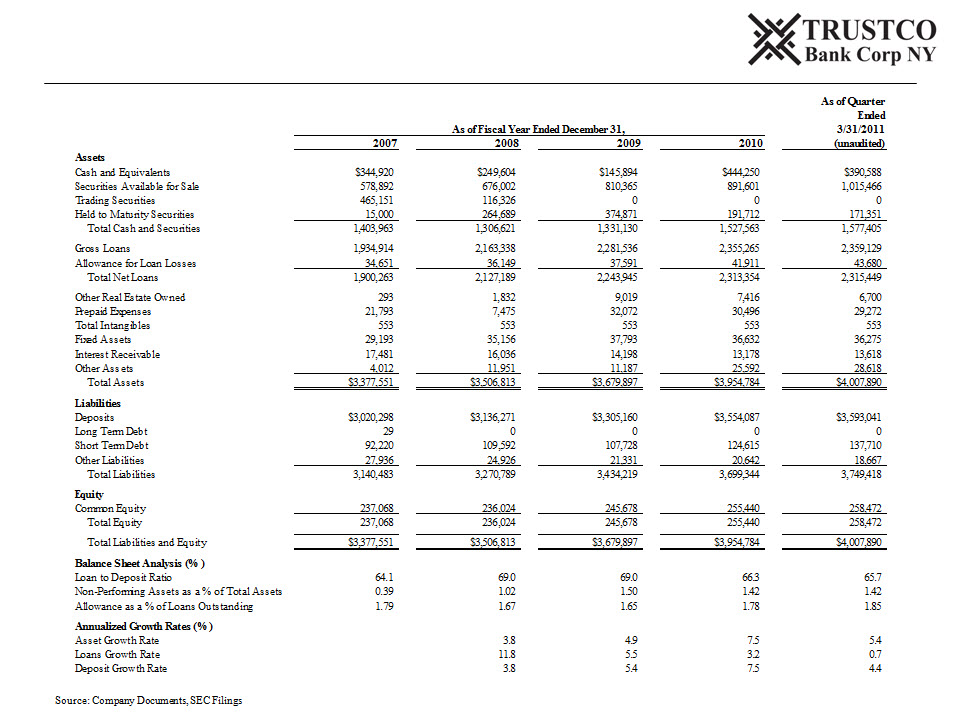
Historical Balance Sheet
34
Source: Company Documents, SEC Filings
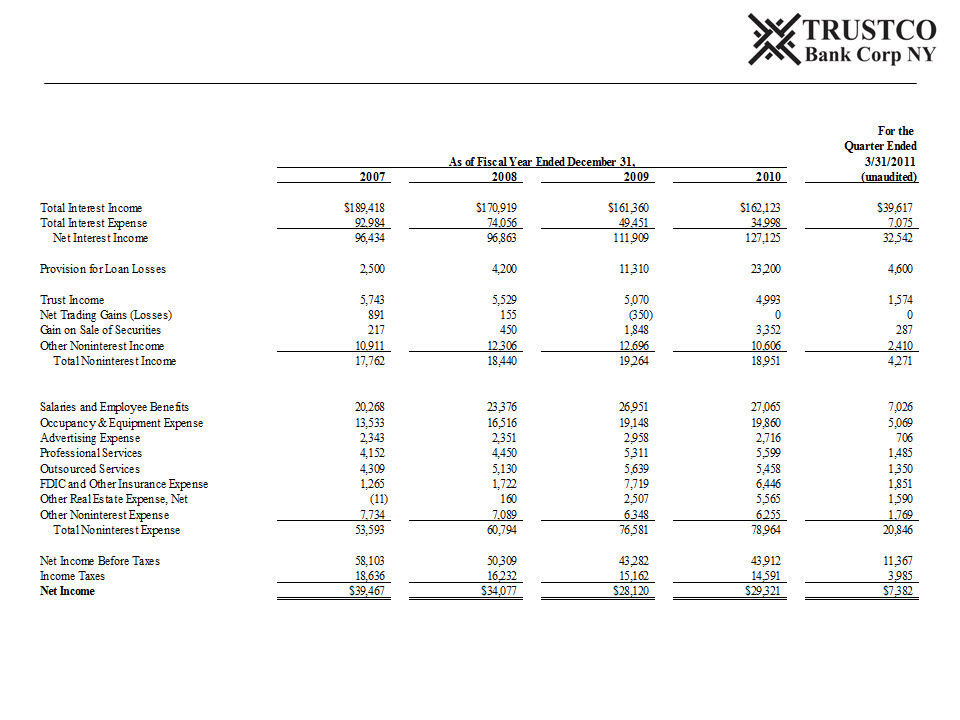
Historical Income Statement
35
Source: Company Documents, SEC Filings
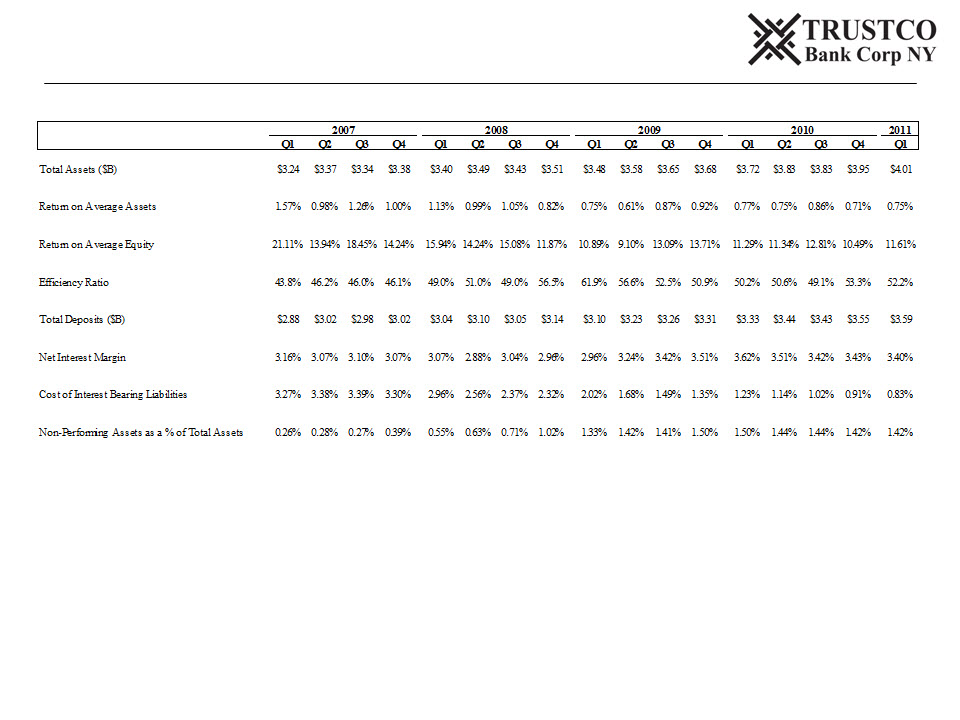
Quarterly Data
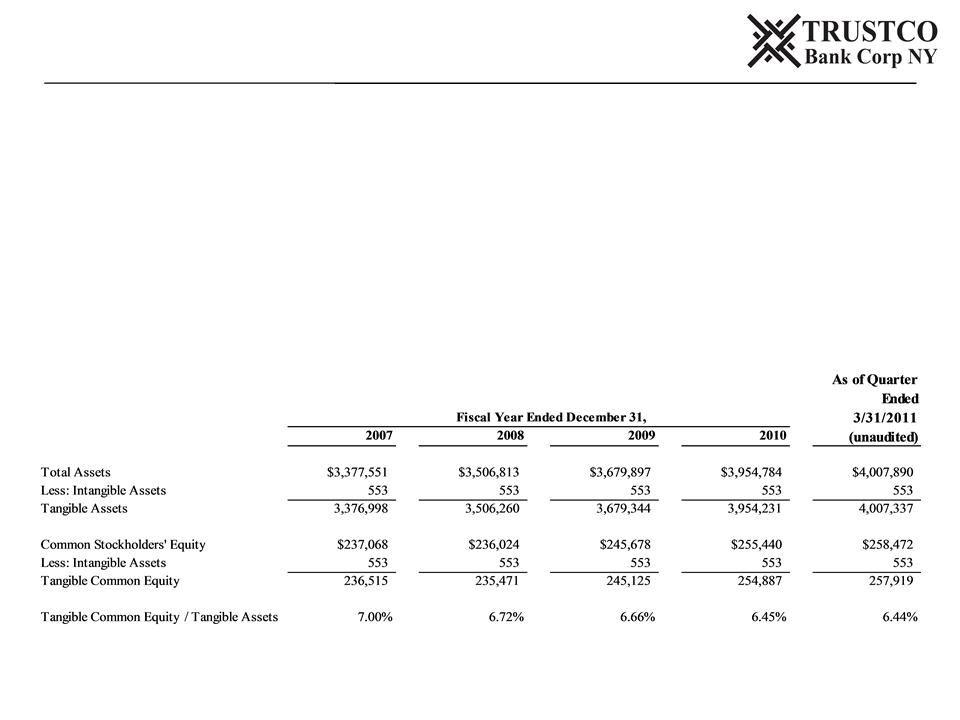
36
Tangible common equity and tangible common equity to tangible assets are non-GAAP financial measures derived from GAAP-
based amounts. We calculate tangible common equity by excluding the balance of intangible assets from common stockholders’
equity. We calculate tangible common equity to tangible assets by dividing tangible common equity by tangible assets. We believe
that this is consistent with the treatment by bank regulatory agencies, which exclude intangible assets from the calculation of risk-
based capital ratios. Accordingly, we believe that these non-GAAP financial measures provide information that is important to
investors and that is useful in understanding our capital position and ratios. However, these non-GAAP financial measures are
supplemental and are not a substitute for an analysis based on GAAP measures. As other companies may use different calculations
for these measures, this presentation may not be comparable to other similarly titled measures reported by other companies. A
reconciliation of the non-GAAP measures of tangible common equity to the GAAP measures of common stockholder’s equity and is
set forth below.
Source: Company Documents, SEC Filings
Non-GAAP Financial Measures