Attached files
| file | filename |
|---|---|
| 8-K - FORM 8-K - ARCH RESOURCES, INC. | c65139e8vk.htm |
Exhibit 99.1

| Deutsche Bank Global Industrials and Basic Materials Conference DECK SLONE VP — Government, Investor and Public Affairs Arch Coal, Inc. Chicago | 06.15.2011 |
| Slide 2 This presentation contains “forward-looking statements” — that is, statements related to future, not past, events. In this context, forward-looking statements often address our expected future business and financial performance, and often contain words such as “expects,” “anticipates,” “intends,” “plans,” “believes,” “seeks,” or “will.” Forwardlooking statements by their nature address matters that are, to different degrees, uncertain. For us, particular uncertainties arise from changes in the demand for our coal by the domestic electric generation industry; from legislation and regulations relating to the Clean Air Act and other environmental initiatives; from operational, geological, permit, labor and weather-related factors; from fluctuations in the amount of cash we generate from operations; from future integration of acquired businesses (including the ICG business); and from numerous other matters of national, regional and global scale, including those of a political, economic, business, competitive or regulatory nature. These uncertainties may cause our actual future results to be materially different than those expressed in our forward-looking statements. We do not undertake to update our forward-looking statements, whether as a result of new information, future events or otherwise, except as may be required by law. For a description of some of the risks and uncertainties that may affect our future results, you should see the risk factors described from time to time in the reports we file with the Securities and Exchange Commission. This presentation includes certain non-GAAP financial measures, including Adjusted EBITDA. These non-GAAP financial measures are not measures of financial performance in accordance with generally accepted accounting principles and may exclude items that are significant in understanding and assessing our financial results. Therefore, these measures should not be considered in isolation or as an alternative to net income from operations, cash flows from operations, earnings per fully-diluted share or other measures of profitability, liquidity or performance under generally accepted accounting principles. You should be aware that our presentation of these measures may not be comparable to similarly-titled measures used by other companies. Please see the reconciliation included at the end of this presentation. Forward-Looking Information |
| Outlook for Coal Markets |
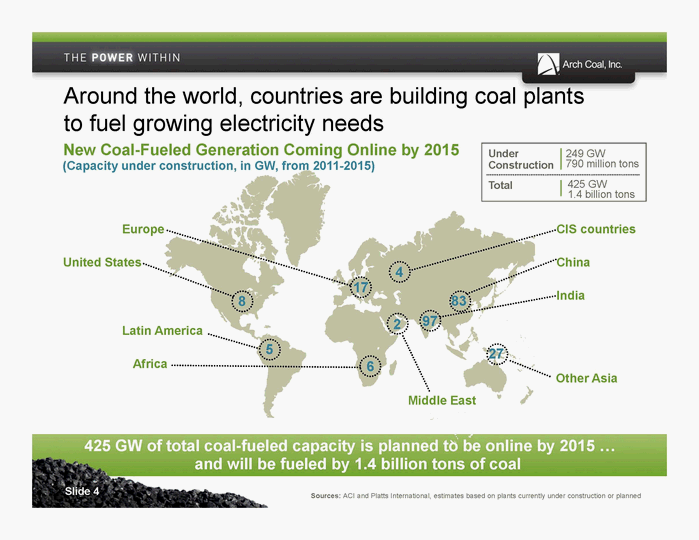
| Slide 4 425 GW 1.4 billion tons Africa Europe Around the world, countries are building coal plants to fuel growing electricity needs 425 GW of total coal-fueled capacity is planned to be online by 2015 ... and will be fueled by 1.4 billion tons of coal New Coal-Fueled Generation Coming Online by 2015 United States Middle East Latin America CIS countries China Other Asia 17 India 6 2 8 5 97 27 83 4 (Capacity under construction, in GW, from 2011-2015) Sources: ACI and Platts International, estimates based on plants currently under construction or planned Under Construction 249 GW 790 million tons Total |
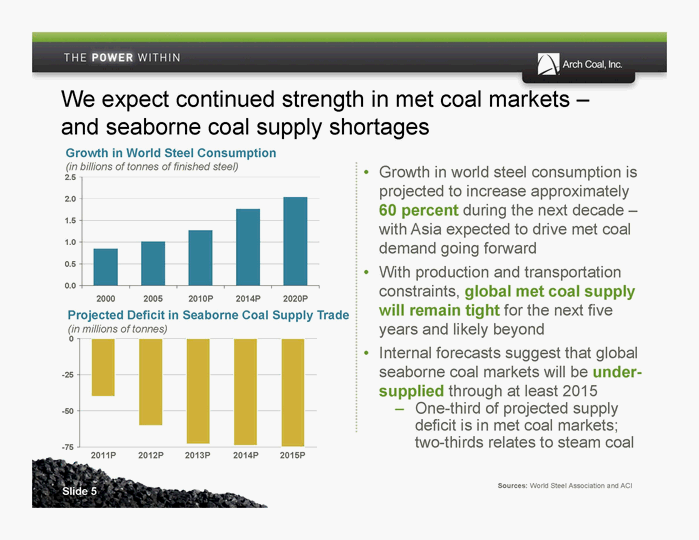
| -75 -50 -25 0 We expect continued strength in met coal markets — and seaborne coal supply shortages Growth in World Steel Consumption (in billions of tonnes of finished steel) 0.0 0.5 1.0 1.5 2.0 2.5 2000 2005 2010P 2014P 2020P Sources: World Steel Association and ACI Projected Deficit in Seaborne Coal Supply Trade (in millions of tonnes) 2011P 2012P 2013P 2014P 2015P Slide 5 • Growth in world steel consumption is projected to increase approximately 60 percent during the next decade — with Asia expected to drive met coal demand going forward • With production and transportation constraints, global met coal supply will remain tight for the next five years and likely beyond • Internal forecasts suggest that global seaborne coal markets will be undersupplied through at least 2015 — One-third of projected supply deficit is in met coal markets; two-thirds relates to steam coal |
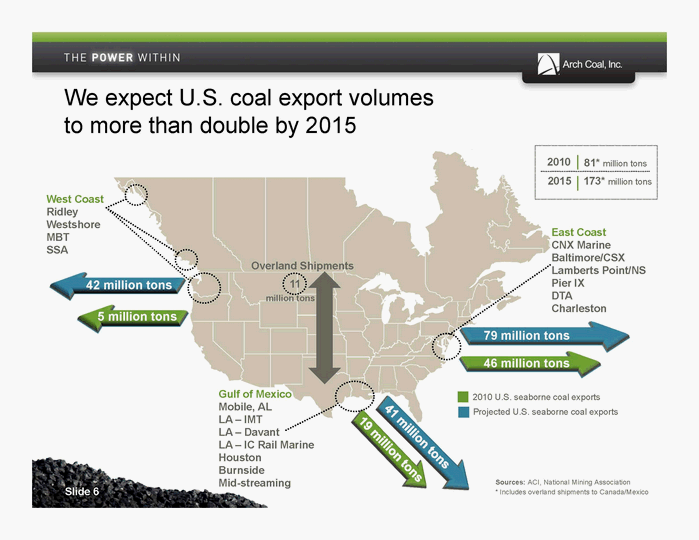
| We expect U.S. coal export volumes to more than double by 2015 20 mt 73 mt 79 million tons 46 million tons 5 million tons 42 million tons Gulf of Mexico Mobile, AL LA — IMT LA — Davant LA — IC Rail Marine Houston Burnside Mid-streaming East Coast CNX Marine Baltimore/CSX Lamberts Point/NS Pier IX DTA Charleston 2010 U.S. seaborne coal exports Projected U.S. seaborne coal exports West Coast Ridley Westshore MBT SSA Sources: ACI, National Mining Association Overland Shipments 2010 2015 81* million tons 173* million tons Slide 6 11 million tons * Includes overland shipments to Canada/Mexico |
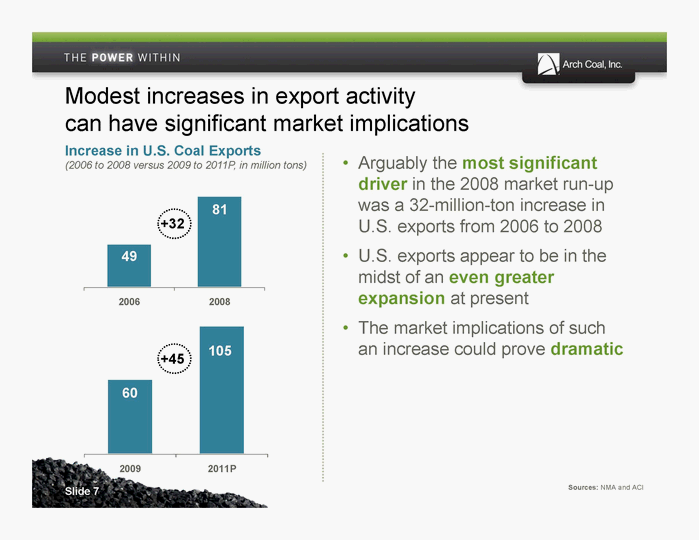
| 2006 2008 Modest increases in export activity can have significant market implications Increase in U.S. Coal Exports (2006 to 2008 versus 2009 to 2011P, in million tons) Sources: NMA and ACI • Arguably the most significant driver in the 2008 market run-up was a 32-million-ton increase in U.S. exports from 2006 to 2008 • U.S. exports appear to be in the midst of an even greater expansion at present • The market implications of such an increase could prove dramatic Slide 7 2009 2011P 49 81 +32 60 +45 105 |
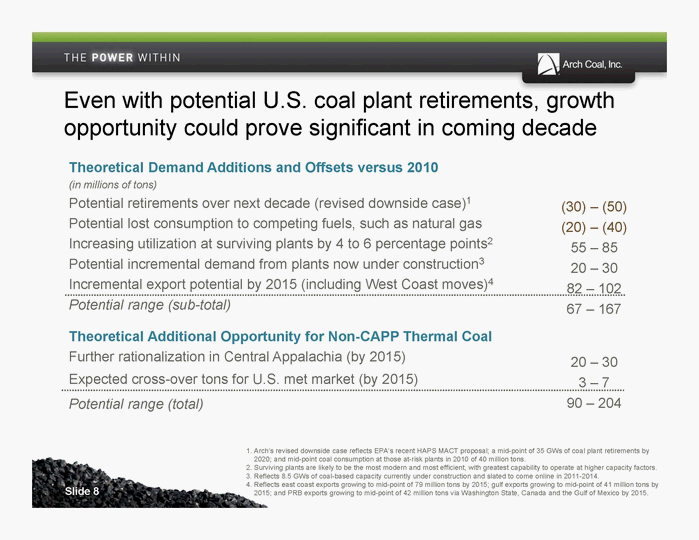
| Slide 8 Even with potential U.S. coal plant retirements, growth opportunity could prove significant in coming decade Theoretical Demand Additions and Offsets versus 2010 (in millions of tons) Potential retirements over next decade (revised downside case)1 Potential lost consumption to competing fuels, such as natural gas Increasing utilization at surviving plants by 4 to 6 percentage points2 Potential incremental demand from plants now under construction3 Incremental export potential by 2015 (including West Coast moves)4 Potential range (sub-total) Theoretical Additional Opportunity for Non-CAPP Thermal Coal Further rationalization in Central Appalachia (by 2015) Expected cross-over tons for U.S. met market (by 2015) Potential range (total) 1. Arch’s revised downside case reflects EPA’s recent HAPS MACT proposal; a mid-point of 35 GWs of coal plant retirements by 2020; and mid-point coal consumption at those at-risk plants in 2010 of 40 million tons. 2. Surviving plants are likely to be the most modern and most efficient, with greatest capability to operate at higher capacity factors. 3. Reflects 8.5 GWs of coal-based capacity currently under construction and slated to come online in 2011-2014. 4. Reflects east coast exports growing to mid-point of 79 million tons by 2015; gulf exports growing to mid-point of 41 million tons by 2015; and PRB exports growing to mid-point of 42 million tons via Washington State, Canada and the Gulf of Mexico by 2015. (30) — (50) (20) — (40) 55 — 85 20 — 30 82 — 102 67 — 167 20 — 30 3 — 7 90 — 204 |
| Slide 9 The New Arch Coal |
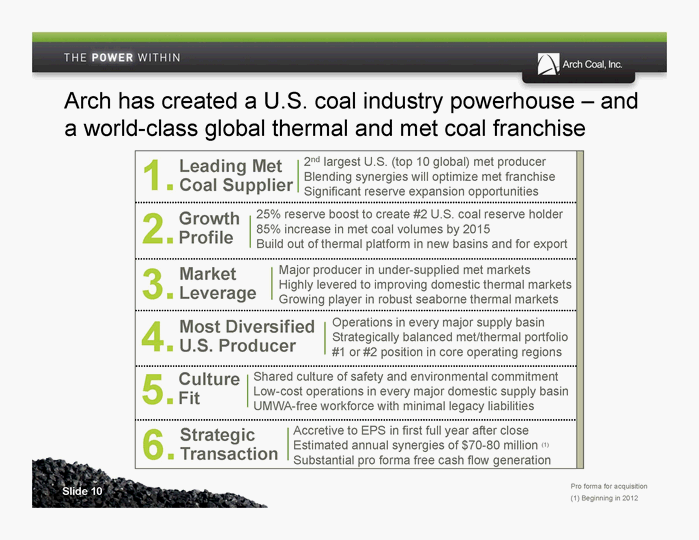
| Leading Met 1.Coal Supplier 2nd largest U.S. (top 10 global) met producer Blending synergies will optimize met franchise Significant reserve expansion opportunities Growth 2.Profile 25% reserve boost to create #2 U.S. coal reserve holder 85% increase in met coal volumes by 2015 Build out of thermal platform in new basins and for export Market 3.Leverage Major producer in under-supplied met markets Highly levered to improving domestic thermal markets Growing player in robust seaborne thermal markets Most Diversified 4.U.S. Producer Operations in every major supply basin Strategically balanced met/thermal portfolio #1 or #2 position in core operating regions Culture 5.Fit Shared culture of safety and environmental commitment Low-cost operations in every major domestic supply basin UMWA-free workforce with minimal legacy liabilities Arch has created a U.S. coal industry powerhouse — and a world-class global thermal and met coal franchise Strategic 6.Transaction Accretive to EPS in first full year after close Estimated annual synergies of $70-80 million (1) Substantial pro forma free cash flow generation Slide 10 Pro forma for acquisition (1) Beginning in 2012 |
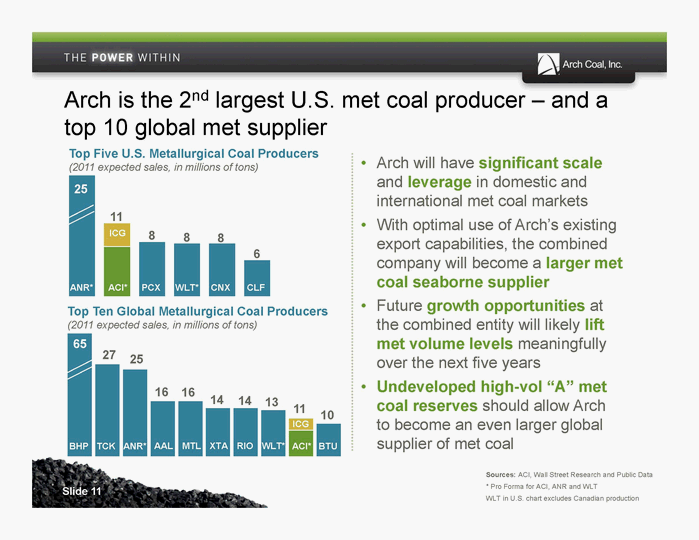
| • Arch will have significant scale and leverage in domestic and international met coal markets • With optimal use of Arch’s existing export capabilities, the combined company will become a larger met coal seaborne supplier • Future growth opportunities at the combined entity will likely lift met volume levels meaningfully over the next five years • Undeveloped high-vol “A” met coal reserves should allow Arch to become an even larger global supplier of met coal Top Five U.S. Metallurgical Coal Producers (2011 expected sales, in millions of tons) ANR* ACI* PCX WLT* CNX CLF Sources: ACI, Wall Street Research and Public Data * Pro Forma for ACI, ANR and WLT WLT in U.S. chart excludes Canadian production Arch is the 2nd largest U.S. met coal producer — and a top 10 global met supplier Top Ten Global Metallurgical Coal Producers (2011 expected sales, in millions of tons) 6 8 8 8 11 25 BHP 65 TCK 27 ANR* 25 WLT* 13 AAL 16 MTL 16 XTA 14 RIO 14 ACI* 11 BTU 10 ICG ICG Slide 11 |
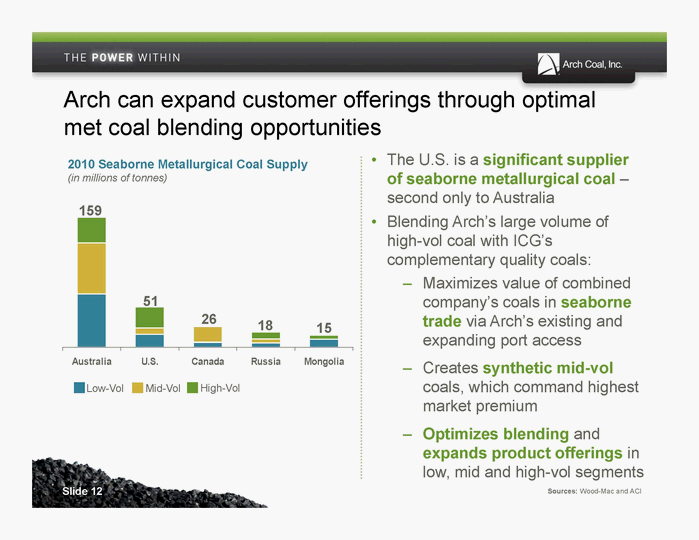
| Australia U.S. Canada Russia Mongolia • The U.S. is a significant supplier of seaborne metallurgical coal — second only to Australia • Blending Arch’s large volume of high-vol coal with ICG’s complementary quality coals: — Maximizes value of combined company’s coals in seaborne trade via Arch’s existing and expanding port access — Creates synthetic mid-vol coals, which command highest market premium — Optimizes blending and expands product offerings in low, mid and high-vol segments Sources: Wood-Mac and ACI Arch can expand customer offerings through optimal met coal blending opportunities 2010 Seaborne Metallurgical Coal Supply (in millions of tonnes) 159 51 26 18 15 Low-Vol Mid-Vol High-Vol Slide 12 |
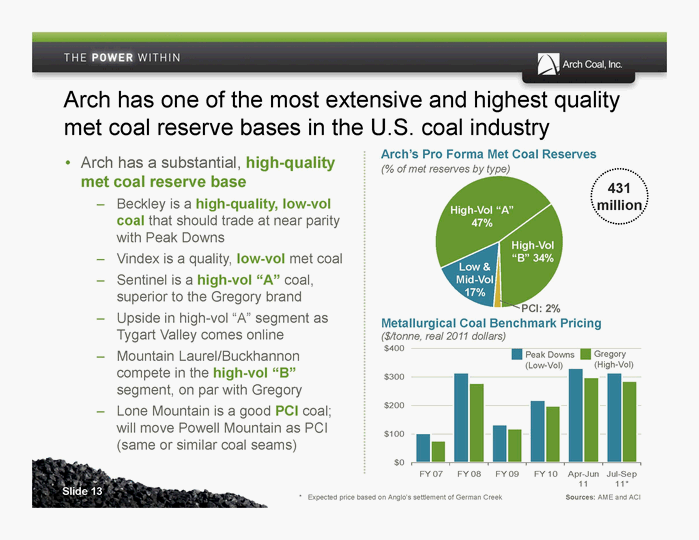
| $0 $100 $200 $300 $400 FY 07 FY 08 FY 09 FY 10 Apr-Jun 11 Jul-Sep 11* Sources: AME and ACI Arch has one of the most extensive and highest quality met coal reserve bases in the U.S. coal industry Arch’s Pro Forma Met Coal Reserves Slide 13 Metallurgical Coal Benchmark Pricing ($/tonne, real 2011 dollars) Peak Downs (Low-Vol) Gregory (High-Vol) • Arch has a substantial, high-quality (% of met reserves by type) met coal reserve base — Beckley is a high-quality, low-vol coal that should trade at near parity with Peak Downs — Vindex is a quality, low-vol met coal — Sentinel is a high-vol “A” coal, superior to the Gregory brand — Upside in high-vol “A” segment as Tygart Valley comes online — Mountain Laurel/Buckhannon compete in the high-vol “B” segment, on par with Gregory — Lone Mountain is a good PCI coal; will move Powell Mountain as PCI (same or similar coal seams) High-Vol “A” 47% Low & Mid-Vol 17% High-Vol “B” 34% PCI: 2% 431 million * Expected price based on Anglo’s settlement of German Creek |

| 0.0 3.0 6.0 9.0 12.0 15.0 2010 2011E By 2014 By 2015 Metallurgical Coal Volumes (in millions of tons) Tygart Valley provides an attractive growth opportunity to nearly double Arch’s met coal volumes by 2014 Baltimore Ports Norfolk Ports Tygart Valley #1 Arch ICG Expanded Platform Tygart Valley #2, #3 Slide 14 • Tygart Valley No. 1 mine will boost future metallurgical coal volumes by 2014 • Portfolio of Mountain Laurel and Tygart coal mines will create world-class metallurgical coal asset base • Undeveloped high-vol “A” reserves (115 million tons) create opportunities for further volume growth over next five years — Will begin permitting immediately |
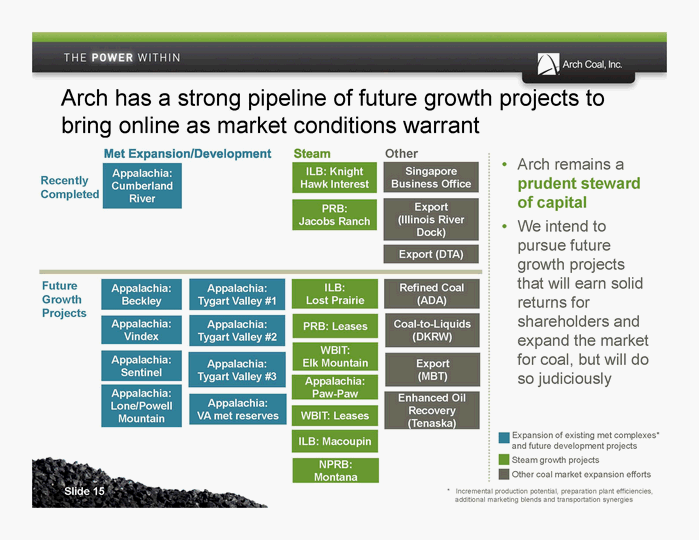
| Slide 15 Arch has a strong pipeline of future growth projects to bring online as market conditions warrant Recently Completed Future Growth Projects Other Singapore Business Office Export (Illinois River Dock) Export (DTA) ILB: Knight Hawk Interest PRB: Jacobs Ranch Appalachia: Lone/Powell Mountain WBIT: Elk Mountain PRB: Leases ILB: Lost Prairie ILB: Macoupin NPRB: Montana Appalachia: Paw-Paw WBIT: Leases Enhanced Oil Recovery (Tenaska) Refined Coal (ADA) Coal-to-Liquids (DKRW) Export (MBT) • Arch remains a prudent steward of capital • We intend to pursue future growth projects that will earn solid returns for shareholders and expand the market for coal, but will do so judiciously Steam growth projects Other coal market expansion efforts * Incremental production potential, preparation plant efficiencies, additional marketing blends and transportation synergies Expansion of existing met complexes* and future development projects Appalachia: Cumberland River Appalachia: Sentinel Appalachia: Beckley Appalachia: Vindex Appalachia: Tygart Valley #2 Appalachia: Tygart Valley #1 Appalachia: Tygart Valley #3 Appalachia: VA met reserves |
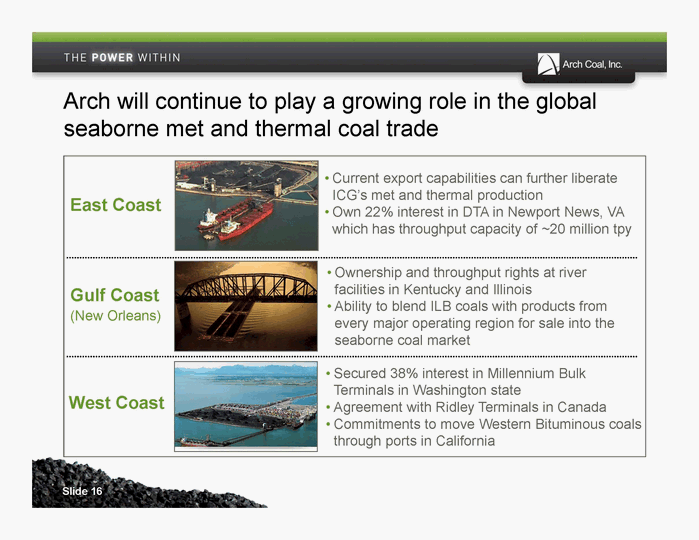
| East Coast Gulf Coast (New Orleans) West Coast • Current export capabilities can further liberate ICG’s met and thermal production • Own 22% interest in DTA in Newport News, VA which has throughput capacity of ~20 million tpy • Ownership and throughput rights at river facilities in Kentucky and Illinois • Ability to blend ILB coals with products from every major operating region for sale into the seaborne coal market • Secured 38% interest in Millennium Bulk Terminals in Washington state • Agreement with Ridley Terminals in Canada • Commitments to move Western Bituminous coals through ports in California Arch will continue to play a growing role in the global seaborne met and thermal coal trade Slide 16 |
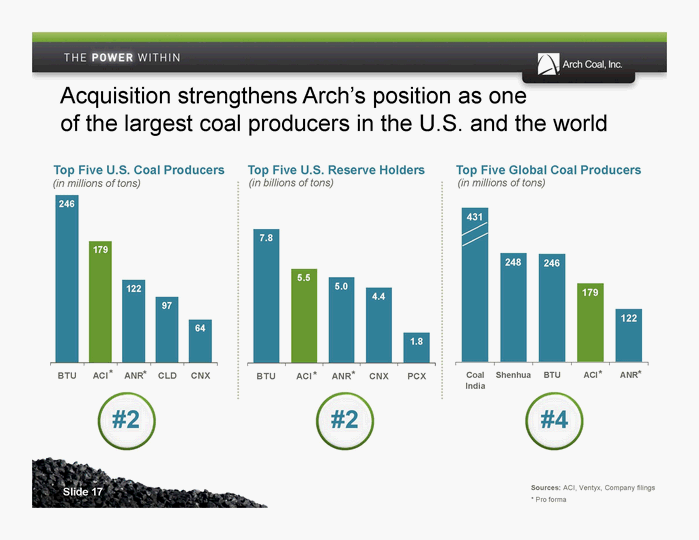
| 246 122 97 64 179 BTU ACI ANR CLD CNX 248 246 179 122 431 Coal India Shenhua BTU ACI ANR 4.4 1.8 5.0 5.5 7.8 BTU ACI ANR CNX PCX Sources: ACI, Ventyx, Company filings * Pro forma Top Five U.S. Coal Producers (in millions of tons) Top Five Global Coal Producers (in millions of tons) Top Five U.S. Reserve Holders (in billions of tons) * * * * * * #2 #2 #4 Slide 17 Acquisition strengthens Arch’s position as one of the largest coal producers in the U.S. and the world |
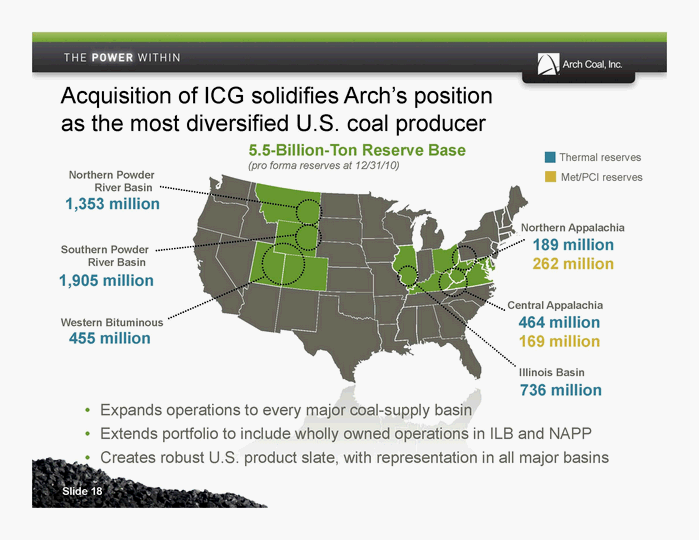
| Western Bituminous Southern Powder River Basin Illinois Basin Central Appalachia Northern Appalachia 1,353 million 1,905 million 455 million 464 million 169 million 189 million 262 million 736 million 5.5-Billion-Ton Reserve Base (pro forma reserves at 12/31/10) • Expands operations to every major coal-supply basin • Extends portfolio to include wholly owned operations in ILB and NAPP • Creates robust U.S. product slate, with representation in all major basins Thermal reserves Northern Powder Met/PCI reserves River Basin Slide 18 Acquisition of ICG solidifies Arch’s position as the most diversified U.S. coal producer |
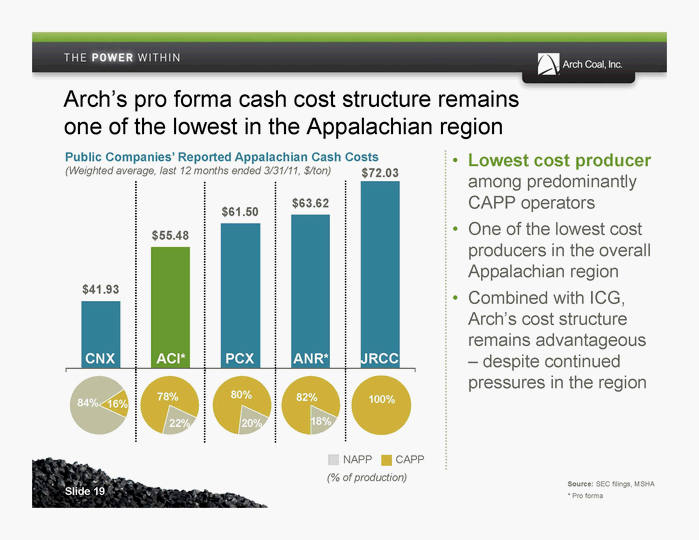
| Slide 19 Arch’s pro forma cash cost structure remains one of the lowest in the Appalachian region $41.93 $55.48 $61.50 $63.62 $72.03 CNX ACI* PCX ANR* JRCC Public Companies’ Reported Appalachian Cash Costs (Weighted average, last 12 months ended 3/31/11, $/ton) • Lowest cost producer among predominantly CAPP operators • One of the lowest cost producers in the overall Appalachian region • Combined with ICG, Arch’s cost structure remains advantageous — despite continued pressures in the region Source: SEC filings, MSHA * Pro forma 82% 100% 18% 80% 20% 78% 22% 84% 16% NAPP CAPP (% of production) CNX ACI* PCX ANR* JRCC |
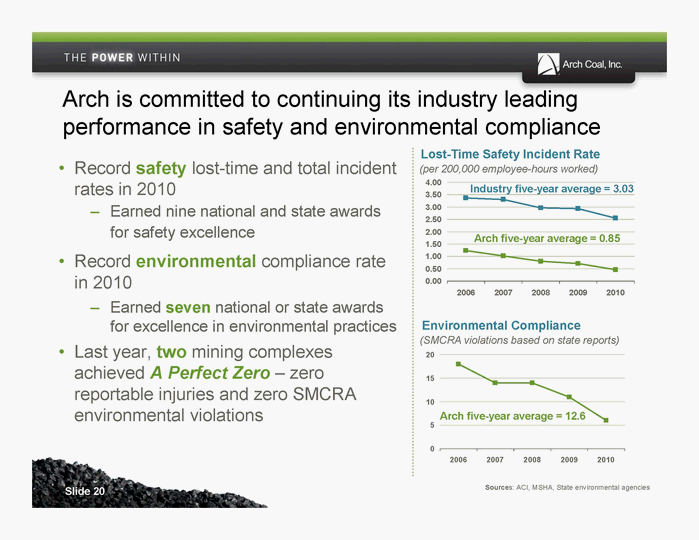
| Arch is committed to continuing its industry leading performance in safety and environmental compliance • Record safety lost-time and total incident rates in 2010 — Earned nine national and state awards for safety excellence • Record environmental compliance rate in 2010 — Earned seven national or state awards for excellence in environmental practices • Last year, two mining complexes achieved A Perfect Zero — zero reportable injuries and zero SMCRA environmental violations 0.00 0.50 1.00 1.50 2.00 2.50 3.00 3.50 4.00 2006 2007 2008 2009 2010 Lost-Time Safety Incident Rate (per 200,000 employee-hours worked) Arch five-year average = 0.85 0 5 10 15 20 2006 2007 2008 2009 2010 Environmental Compliance (SMCRA violations based on state reports) Arch five-year average = 12.6 Sources: ACI, MSHA, State environmental agencies Industry five-year average = 3.03 Slide 20 |
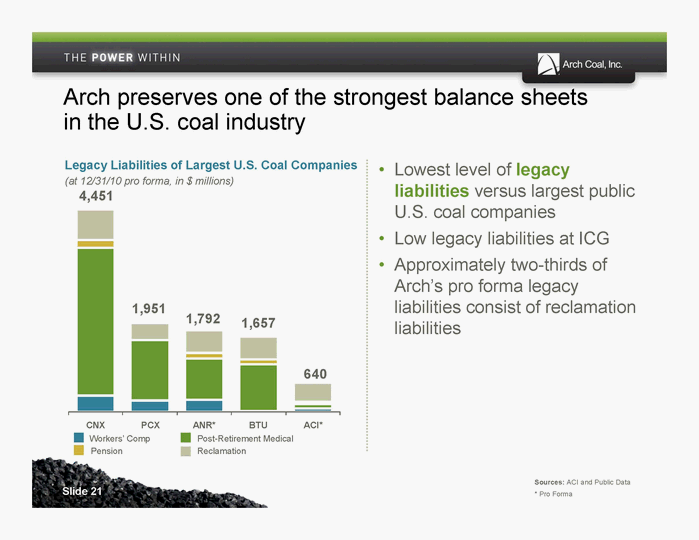
| Arch preserves one of the strongest balance sheets in the U.S. coal industry • Lowest level of legacy liabilities versus largest public U.S. coal companies • Low legacy liabilities at ICG • Approximately two-thirds of Arch’s pro forma legacy liabilities consist of reclamation 1,792 liabilities 4,451 1,951 1,657 640 CNX PCX ANR* BTU ACI* Legacy Liabilities of Largest U.S. Coal Companies (at 12/31/10 pro forma, in $ millions) Workers’ Comp Post-Retirement Medical Pension Reclamation Sources: ACI and Public Data Slide 21 * Pro Forma |
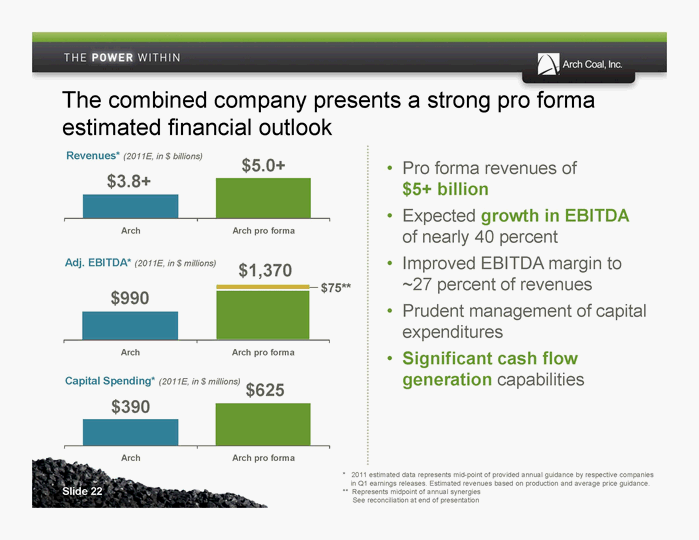
| • Pro forma revenues of $5+ billion • Expected growth in EBITDA of nearly 40 percent • Improved EBITDA margin to ~27 percent of revenues • Prudent management of capital expenditures • Significant cash flow generation capabilities Arch Arch pro forma Revenues* (2011E, in $ billions) Adj. EBITDA* (2011E, in $ millions) Capital Spending* (2011E, in $ millions) Arch Arch pro forma Arch Arch pro forma The combined company presents a strong pro forma estimated financial outlook $75** * 2011 estimated data represents mid-point of provided annual guidance by respective companies in Q1 earnings releases. Estimated revenues based on production and average price guidance. ** Represents midpoint of annual synergies See reconciliation at end of presentation $3.8+ $5.0+ $990 $1,370 $390 $625 Slide 22 |
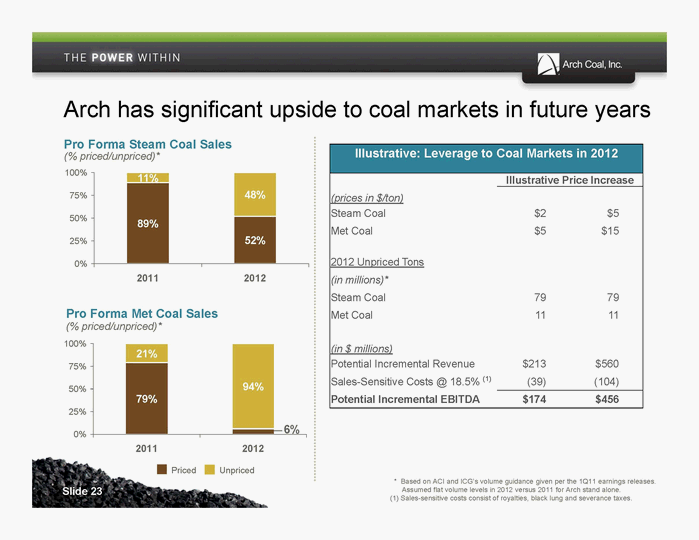
| 79% 21% 94% 0% 25% 50% 75% 100% 2011 2012 89% 52% 11% 48% 0% 25% 50% 75% 100% 2011 2012 Arch has significant upside to coal markets in future years Pro Forma Steam Coal Sales (% priced/unpriced)* * Based on ACI and ICG’s volume guidance given per the 1Q11 earnings releases. Assumed flat volume levels in 2012 versus 2011 for Arch stand alone. (1) Sales-sensitive costs consist of royalties, black lung and severance taxes. Pro Forma Met Coal Sales (% priced/unpriced)* Priced Unpriced Slide 23 6% Illustrative: Leverage to Coal Markets in 2012 Illustrative Price Increase (prices in $/ton) Steam Coal $2 $5 Met Coal $5 $15 2012 Unpriced Tons (in millions)* Steam Coal 79 79 Met Coal 11 11 (in $ millions) Potential Incremental Revenue $213 $560 Sales-Sensitive Costs @ 18.5% (1) (39) (104) Potential Incremental EBITDA $174 $456 |
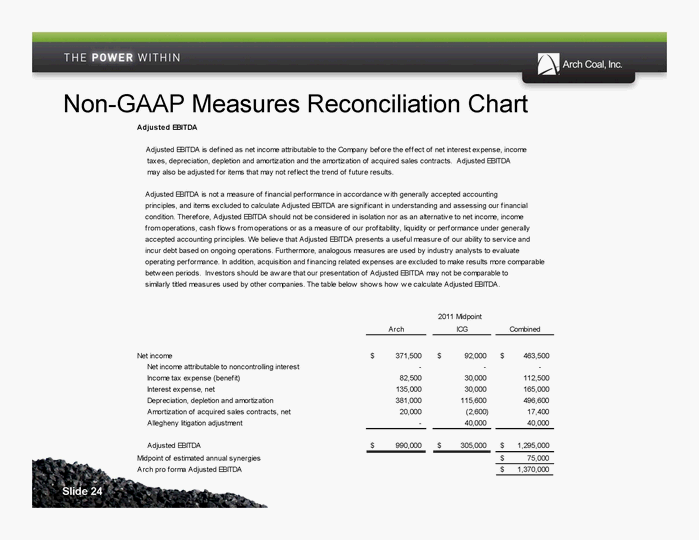
| Slide 24 Non-GAAP Measures Reconciliation Chart Adjusted EBITDA Adjusted EBITDA is defined as net income attributable to the Company before the effect of net interest expense, income taxes, depreciation, depletion and amortization and the amortization of acquired sales contracts. Adjusted EBITDA may also be adjusted for items that may not reflect the trend of future results. Adjusted EBITDA is not a measure of financial performance in accordance w ith generally accepted accounting principles, and items excluded to calculate Adjusted EBITDA are significant in understanding and assessing our financial condition. Therefore, Adjusted EBITDA should not be considered in isolation nor as an alternative to net income, income from operations, cash flow s from operations or as a measure of our profitability, liquidity or performance under generally accepted accounting principles. We believe that Adjusted EBITDA presents a useful measure of our ability to service and incur debt based on ongoing operations. Furthermore, analogous measures are used by industry analysts to evaluate operating performance. In addition, acquisition and financing related expenses are excluded to make results more comparable betw een periods. Investors should be aw are that our presentation of Adjusted EBITDA may not be comparable to similarly titled measures used by other companies. The table below show s how w e calculate Adjusted EBITDA. Arch ICG Combined Net income $371,500 $92,000 $463,500 Net income attributable to noncontrolling interest — - - Income tax expense (benefit) 82,500 30,000 112,500 Interest expense, net 135,000 30,000 165,000 Depreciation, depletion and amortization 381,000 115,600 496,600 Amortization of acquired sales contracts, net 20,000 (2,600) 17,400 Allegheny litigation adjustment — 40,000 40,000 Adjusted EBITDA $990,000 $305,000 $1,295,000 Midpoint of estimated annual synergies $75,000 Arch pro forma Adjusted EBITDA $1,370,000 2011 Midpoint |